
Effect of Supplementation of Dried Bioflocs Produced by Freeze-Drying and Oven-Drying Methods on Water Quality, Growth Performance and Proximate Composition of Red Hybrid Tilapia


Abstract
:1. Introduction
2. Materials and Methods
2.1. Raw Materials
2.1.1. Bioflocs Sampling
2.1.2. Red Hybrid Tilapia Fingerlings
2.2. Experimental Diets
2.3. Experimental Design and Feeding Trail
2.4. Growth Performance
2.5. Water Quality Parameters
2.6. Proximate Composition
2.7. Data Analysis
3. Results
4. Discussion
5. Conclusions
Author Contributions
Funding
Institutional Review Board Statement
Informed Consent Statement
Data Availability Statement
Acknowledgments
Conflicts of Interest
References
- Kuhn, D.D.; Boardman, G.D.; Lawrence, A.L.; Marsh, L.; Flick, G. Microbial floc meal as a replacement ingredient for fish meal and soybean protein in shrimp feed. Aquaculture 2009, 296, 51–57. [Google Scholar] [CrossRef]
- Merican, Z.; Sanchez, D. 2016 Overview of the aquaculture feed industry. In Aquafeed Formulation; Nates, S.F., Ed.; Academic Press, Elsevier Inc.: London, UK, 2015; pp. 1–19. [Google Scholar] [CrossRef]
- Yun, H.; Shahkar, E.; Hamidoghli, A.; Lee, S.; Won, S.; Bai, S.C. Evaluation of dietary soybean meal as fish meal replacer for juvenile whiteleg shrimp, Litopenaeus vannamei reared in biofloc system. Int. Aquat. Res. 2017, 9, 11–24. [Google Scholar] [CrossRef]
- Himaja, P.H.; Rajagopalasamy, C.B.T. Review on biofloc meal as an alternative ingredient in aquaculture feeds. J. Aquac. Trop. 2016, 31, 199–220. [Google Scholar]
- Neto, J.R.S.; Ribeiro, F.A.S.; Gonçalves, A.A.; Emerenciano, M.G.C. Tilapia processing waste silage (TPWS): An alternative ingredient for Litopenaeus vannamei (Boone, 1931) diets in biofloc and clear-water systems. Aquac. Fish. 2019, 4, 214–218. [Google Scholar] [CrossRef]
- Hende, S.F.D.; Claessens, L.; Muylder, E.D.; Boom, N.; Vervaeren, H. Microbial bacterial flocs originating from aquaculture wastewater treatment as diet ingredient for Litopenaeus vannamei (Boone). Aquac. Res. 2014, 47, 1075–1089. [Google Scholar] [CrossRef]
- Martínez-Córdova, L.R.; Martínez-Porchas, M.; Emerenciano, M.G.C.; Miranda-Baeza, A.; Gollas-Galva’n, T. From microbes to fish the next revolution in food production. Crit. Rev. Biotechnol. 2016, 37, 287–295. [Google Scholar] [CrossRef] [PubMed]
- Martinez-Porchas, M.; Vargas-Albores, F. Microbial metagenomics in aquaculture: A potential tool for a deeper insight into the activity. Rev. Aquac. 2017, 9, 42–56. [Google Scholar] [CrossRef]
- Pikaar, I.; Matassa, S.; Rabaey, K.; Bodirsk, B.L.; Popp, A.; Herrero, M.; Verstraete, W. Microbes and the Next Nitrogen Revolution. Environ. Sci. Technol. 2017, 51, 7297–7303. [Google Scholar] [CrossRef] [Green Version]
- D’Abramo, L.R.; Silva, J.L.; Kim, T. Optimization of crustacean quality through husbandry and adherence to post-harvest standards for processing. In Shellfish Safety and Quality; Shumway, S.E., Rodrick, G.E., Eds.; Woodhead Publishing: Cambridge, UK, 2009; Volume 167, pp. 339–358. [Google Scholar] [CrossRef]
- Azim, M.E.; Little, D.C.; Bron, J.E. Microbial protein production in activated suspension tanks manipulating the C:N ratio in feed and the implications for fish culture. Bioresour. Technol. 2008, 99, 3590–3599. [Google Scholar] [CrossRef] [PubMed]
- Emerenciano, M.; Ballester, E.L.C.; Cavalli, R.O.; Wasielesky, W. Biofloc technology application as a food source in a limited water exchange nursery system for pink shrimp Farfantepenaeus brasiliensis (Latreille, 1817). Aquac. Res. 2012, 43, 447–457. [Google Scholar] [CrossRef]
- Shyne Anand, P.S.; Kohli, M.P.S.; Kumar, S.; Sundaray, J.K.; Roy, S.D.; Venkateshwarlu, G.; Sinha, A.; Pailan, G.H. Effect of dietary supplementation of biofloc on growth performance and digestive enzyme activities in Penaeus monodon. Aquaculture 2014, 418–419, 108–115. [Google Scholar] [CrossRef]
- Khatoon, H.; Banerjee, S.; Yuan, G.T.G.; Haris, N.; Ikhwanuddin, M.; Ambak, M.A.; Endut, A. Biofloc as a potential natural feed for shrimp postlarvae. Int. Biodeterior. Biodegrad. 2016, 113, 304–309. [Google Scholar] [CrossRef]
- Lee, C.; Kim, S.; Lim, S.; Lee, K. Supplemental effects of biofloc powder on growth performance, innate immunity, and disease resistance of Pacific white shrimp Litopenaeus vannamei. Fish. Aquat. Sci. 2017, 20, 15.1–15.7. [Google Scholar] [CrossRef] [Green Version]
- Mahanand, S.S.; Pandey, P.K. Application of biofloc technology for sustainable aquaculture development. In Advances in Fish Research; Mohanty, B.P., Ed.; Narendra Publishing House: Delhi, India, 2019; Volume VII, pp. 263–274. [Google Scholar]
- Dauda, A.B. Biofloc technology: A review on the microbial interactions, operational parameters and implications to disease and health management of cultured aquatic animals. Rev. Aquac. 2020, 12, 1193–1210. [Google Scholar] [CrossRef]
- Kasan, N.A.; Ghazali, N.A.; Ikhwanuddin, M.; Ibrahim, Z. Isolation of potential bacteria as inoculum for biofloc formation in pacific whiteleg shrimp litopenaeus vannamei culture ponds. Pak. J. Biol. Sci. 2017, 20, 306–313. [Google Scholar] [CrossRef] [Green Version]
- De Schryver, P.; Crab, R.; Defoirdt, T.; Boon, N.; Verstraete, W. The basics of bio-flocs technology: The added value for aquaculture. Aquaculture 2008, 277, 125–137. [Google Scholar] [CrossRef]
- Walker, D.A.U.; Suazo, M.C.M.; Emerenciano, M.G.C. Biofloc technology: Principles focused on potential species and the case study of Chilean river shrimp Cryphiops caementarius. Rev. Aquac. 2020, 12, 1759–1782. [Google Scholar] [CrossRef]
- Crab, R.; Defoirdt, T.; Bossier, P.; Verstraete, W. Biofloc technology in aquaculture: Beneficial and future challenges. Aquaculture 2012, 356–357, 351–356. [Google Scholar] [CrossRef]
- Caldini, N.N.; Cavalcante, D.H.; Filho, P.R.N.R.; Sá, M.V.C. Feeding Nile tilapia with artificial diets and dried bioflocs biomass. Anim. Sci. Mar. 2015, 37, 335–341. [Google Scholar] [CrossRef]
- Yue, G.H.; Lin, H.R.; Li, J.L. Tilapia is the fish for next-generation aquaculture. Int. J. Mar. Sci. Ocean Technol. 2016, 3, 11–13. [Google Scholar] [CrossRef]
- El-Sayed, A.M. Tilapia Culture, 2nd ed.; Academic Press, Elsevier Inc.: London, UK, 2020; 348p. [Google Scholar] [CrossRef]
- Putra, I.; Effendi, I.; Lukistyowati, I.; Tang, U. Growth and survival rate of red tilapia (Oreochromis sp.) cultivated in the brackish water tank under biofloc system. Adv. Eng. Res. 2019, 190, 96–99. [Google Scholar] [CrossRef] [Green Version]
- FAO. The State of World Fisheries and Aquaculture 2020. Sustainability in Action; Food and Agriculture Organization: Rome, Italy, 2020; p. 244. [Google Scholar] [CrossRef]
- Thorarensen, H.; Kubiriza, G.K.; Imsland, A.K. Experimental design and statistical analyses of fish growth studies. Aquaculture 2015, 448, 483–490. [Google Scholar] [CrossRef]
- Ariffin, F.D.; Halim, A.A.; Hanafiah, M.M.; Awang, N.; Othman, M.S.; Azman, S.A.A.; Bakri, N.S.M. The effects of African catfish, Clarias gariepinus pond farm’s effluent on water quality of Kesang river in Malacca, Malaysia. Appl. Ecol. Environ. Res. 2019, 17, 1531–1545. [Google Scholar] [CrossRef]
- Hanafiah, M.M.; Leuven, R.S.E.W.; Sommerwerk, N.; Tockner, K.; Huijbregts, M.A.J. Including the Introduction of Exotic Species in Life Cycle Impact Assessment: The Case of Inland Shipping. Environ. Sci. Technol. 2013, 47, 13934–13940. [Google Scholar] [CrossRef]
- Kuhn, D.D.; Lawrence, A.L.; Crockett, J.; Marsh, L.; Taylor, D. Evaluation of biflocs derived from confectionary food effluent water as a replacement feed ingredient for fishmeal or soy meal for shrimp. Aquaculture 2016, 454, 66–71. [Google Scholar] [CrossRef]
- Chowdhury, M.A.K.; Bureau, D.P. Predicting body composition of Nile tilapia (Oreochromis niloticus). Asian Fish. Sci. 2009, 22, 597–605. [Google Scholar] [CrossRef]
- Takeuchi, T.; Lu, J.; Yoshizaki, G.; Satoh, S. Effect on the growth and body composition of juvenile tilapia Oreochromis niloticus fed raw Spirulina. Fish. Sci. 2002, 68, 34–40. [Google Scholar] [CrossRef] [Green Version]
- Buyukcapar, H.M.; Atalay, A.I.; Kamalak, A. Growth performance of Nile tilapia (Oreochromis niloticus) fed with diets containing different level of hydrolysable and condensed tannin. J. Agric. Sci. Technol. 2011, 13, 1045–1051. [Google Scholar]
- Silva, T.S.; Piana, P.A. Production of tilapia in biofloc with different salt condictions: An evaluation of body composition and organoleptic properties. Bol. Inst. Pesca 2020, 46, 605–615. [Google Scholar] [CrossRef]
- Durigon, E.G.; Lazzari, R.; Uczay, J.; Lopes, D.L.A.; Jeronimo, G.T.; Sgnaulin, T.; Emerenciano, M.G.C. Biofloc technology (BFT): Adjusting the levels of digestible protein and digestible energy in diets of Nile tilapia juveniles raised in brackish water. Aquac. Fish. 2020, 5, 42–51. [Google Scholar] [CrossRef]
- Lopez-Betancur, D.; Moreno, I.; Guerrero-Mendez, C.; Gomez-Melendez, D.; Macias, M.J.; Olvera-Olvera, C. Effects of colored light on growth and nutritional composition of tilapia, and biofloc as a food source. Appl. Sci. 2020, 10, 362. [Google Scholar] [CrossRef] [Green Version]
- Emerenciano, M.; Gaxiola, G.; Cuzon, G. Biofloc technology (BFT): A review for aquaculture application and animal food industry. In Biomass Now-Cultivation and Utilization; Matovic, M.D., Ed.; IntechOpen: London, UK, 2013; pp. 301–328. [Google Scholar] [CrossRef] [Green Version]
- Bossier, P.; Ekasari, J. Biofloc technology application in aquaculture to support sustainable development goals. Microb. Biotechnol. 2017, 10, 1012–1016. [Google Scholar] [CrossRef]
- Correa, A.S.; Pinho, S.M.; Molinari, D.; Pereira, K.R.; Gutierrez, S.M.; Monroy-Dosta, M.; Emerenciano, M. Rearing of tilapia (Oreochromis niloticus) juveniles in a biofloc system employing periods of feed deprivation. J. Appl. Aquac. 2020, 32, 139–156. [Google Scholar] [CrossRef]
- Pradeep, P.J.; Srijaya, T.C.; Hassan, A.; Chatterji, A.K.; Raghavan, R.; Withyachumnarnkul, B.; Jeffs, A. Growth performance of triploid red tilapia reared under laboratory conditions. J. Appl. Aquac. 2013, 25, 176–189. [Google Scholar] [CrossRef]
- De Alvarenga, E.R.; Alves, G.F.O.; Fernandes, A.F.A.; Costa, G.R.; da Silva, M.A.; Teixeira, E.A.; Turra, E.M. Moderate salinities enhance growth performance of Nile tilapia (Oreochromis niloticus) fingerlings in the biofloc system. Aquac. Res. 2018, 49, 2919–2926. [Google Scholar] [CrossRef]
- APHA. Standard Methods for the Examination of the Water and Wastewater, 21st ed.; American Public Health Association: Washington, DC, USA, 2005; 1220p. [Google Scholar]
- Nizam, N.U.M.; Hanafiah, M.M.; Noor, I.M.; Karim, H.I.A. Efficiency of five selected aquatic plants in phytoremediation of aquaculture wastewater. Appl. Sci. 2020, 10, 2712. [Google Scholar] [CrossRef] [Green Version]
- AOAC. Official Methods of Analysis, 16th ed.; Association of Official Analytical Chemists: Washington, DC, USA, 2016; p. 3172. [Google Scholar]
- Prangnell, D.I.; Lupatsch, I.; Treece, G.D.; Samocha, T.M. 2019 Water Quality Management. In Sustainable Biofloc Systems for Marine Shrimp; Samocha, T.M., Ed.; Academic Press, Elsevier Inc.: London, UK, 2019; pp. 19–27. [Google Scholar] [CrossRef]
- Helland, S.J.; Grisdale-Helland, B.; Nerland, S. A simple method for the measurement of daily feed intake of groups of fish in tanks. Aquaculture 1996, 139, 157–163. [Google Scholar] [CrossRef]
- Summerfelt, R.C. Water quality considerations for aquaculture. Aquac. Netw. Inf. Cent. 1998, 50, 11–21. [Google Scholar]
- Hargreaves, J.A.; Tucker, C.S. Managing ammonia in fish ponds. South. Reg. Aquac. Cent. 2004, 4603. [Google Scholar]
- Hayashi, M. Temperature-electrical conductivity relation of water for environmental monitoring and geophysical data inversion. Environ. Monit. Assess. 2004, 96, 119–128. [Google Scholar] [CrossRef]
- Manikam, M.K.; Halim, A.A.; Hanafiah, M.M.; Krishnamoorthy, R.R. Removal of ammonia nitrogen, nitrate, phosphorus and COD from sewage wastewater using palm oil boiler ash composite adsorbent. Desalination Water Treat. 2019, 149, 23–30. [Google Scholar] [CrossRef] [Green Version]
- Robles-Porchas, G.R.; Gollas-Galvan, T.; Martinez-Porchas, M.; Martinez-Cordova, L.R.; Miranda-Baeza, A.; Vargas-Albores, F. The nitrification process for nitrogen removal in biofloc system aquaculture. Rev. Aquac. 2020, 12, 2228–2249. [Google Scholar] [CrossRef]
- Soler-Jofra, A.; Pérez, J.; van Loosdrecht, M.C.M. Hydroxylamine and the nitrogen cycle: A review. Water Res. 2021, 190, 116723. [Google Scholar] [CrossRef]
- Long, L.; Yang, J.; Li, Y.; Guan, C.; Wu, F. Effect of biofloc technology on growth, digestive enzyme activity, hematology, and immune response of genetically improved farmed tilapia (Oreochromis niloticus). Aquaculture 2015, 448, 135–141. [Google Scholar] [CrossRef]
- Araújo-Silva, S.L.; Moraes, M.A.B.; Carmo, C.F.; Osti, J.A.S.; Vaz-dos-Santos, A.M.; Mercante, C.T.J. Effluent of a polyculture system (tilapias and shrimps): Assessment by mass balance of nitrogen and phosphorus. J. Environ. Prot. 2014, 5, 799–804. [Google Scholar] [CrossRef] [Green Version]
- Amirkolaie, A.K. Reduction in the environmental impact of waste discharged by fish farms through feed and feeding. Rev. Aquac. 2011, 3, 19–26. [Google Scholar] [CrossRef]
- Abdul Aziz, N.I.H.; Hanafiah, M.M.; Halim, N.H.; Fidri, P.A.S. Phytoremediation of TSS, NH3-N and COD from sewage wastewater by Lemna minor L., Salvinia minima, Ipomea aquatica and Centella asiatica. Appl. Sci. 2020, 10, 5397. [Google Scholar] [CrossRef]
- Menaga, M.; Felix, S.; Charulatha, M.; Gopalakannan, A.; Panigrahi, A. Effect of in-situ and ex-situ biofloc on immune response of Genetically Improved Farmed Tilapia. Fish Shellfish. Immunol. 2019, 92, 698–705. [Google Scholar] [CrossRef] [PubMed]
- Zakia, M.A.A.; Alabssawy, A.N.; Nour, A.M.; Basuini, M.F.; Dawood, M.A.O.; Alkahtani, S.; Abdel-Daim, M.M. The impact of stocking density and dietary carbon sources on the growth, oxidative status and stress markers of Nile tilapia (Oreochromis niloticus) reared under biofloc conditions. Aquac. Rep. 2020, 16, 100282. [Google Scholar] [CrossRef]
- Gamboa-Delgado, J.; de Oca, G.A.R.M.; Reyes, J.C.R.; Villarreal-Cavazos, D.A.; Nieto-Lopez, M.; Cruz-Suarez, L.E. Assessment of the relative contribution of dietary nitrogen from fish meal and biofloc meal to the growth of Pacific white shrimp (Litopenaeus vannamei). Aquac. Res. 2017, 48, 2963–2972. [Google Scholar] [CrossRef]
- Craig, S.; Helfrich, L.A.; Kuhn, D.D.; Schwarz, M.H. Understanding Fish Nutrition, Feeds, and Feeding; Publication Number 420–256; Virginia Cooperative Extension: Roanoke, VA, USA, 2017; Available online: https://vtechworks.lib.vt.edu/handle/10919/80712 (accessed on 24 February 2021).
- Binalshikh-Abubkr, T.; Hanafiah, M.M.; Das, S.K. Proximate chemical composition of dried shrimp and tilapia waste bioflocs produced by two drying methods. J. Mar. Sci. Eng. 2021, 9, 193. [Google Scholar] [CrossRef]
- FAO. The Nutrition and Feeding of Farmed Fish and Shrimp—A Training Manual; 1. The Essential Nutrients. Government Cooperative Programme; Tacon, A.G.J., Ed.; FAO/UNDP: Roma, Italy, 1987; Available online: http://www.fao.org/3/ab470e/AB470E00.htm#TOC (accessed on 24 July 2021).
- Avnimelech, Y. Feeding with microbial flocs by tilapia in minimal discharge bio-flocs technology ponds. Aquaculture 2007, 264, 140–147. [Google Scholar] [CrossRef]
- Azim, M.E.; Little, D.C. The biofloc technology (BFT) in indoor tanks: Water quality, biofloc composition, and growth and welfare of Nile tilapia (Oreochromis niloticus). Aquaculture 2008, 283, 29–35. [Google Scholar] [CrossRef]
- Berk, Z. Freeze drying (lyophilization) and freeze concentration. In Food Process Engineering and Technology, 3rd ed.; Berk, Z., Ed.; Academic Press, Elsevier Inc.: London, UK, 2018; pp. 567–581. [Google Scholar] [CrossRef]
- Bauer, W.; Prentice-Hernandez, C.; Tesser, M.B.; Wasielesky, W., Jr.; Poersch, L.H.S. Substitution of fishmeal with microbial floc meal and soy protein concentrate in diets for the pacific white shrimp Litopenaeus vannamei. Aquaculture 2012, 342–343, 112–116. [Google Scholar] [CrossRef]
- Avnimelech, Y. Biofloc Technology—A Practical Guide Book, 2nd ed.; The World Aquaculture Society: Baton Rouge, LA, USA, 2015; 268p. [Google Scholar]
- Lall, S.P.; Dumas, A. Nutritional requirements of cultured fish: Formulating nutritionally adequate feeds. In Feed and Feeding Practices in Aquaculture; Davis, D.A., Ed.; Woodhead Publishing Series in Food Science; Technology and Nutrition: Cambridge, UK, 2015; pp. 53–109. [Google Scholar] [CrossRef]
- Younis, E.M.; Al-Quffail, A.S.; Al-Asgah, N.A.; Abdel-Warith, A.A.; Al-Hafedh, Y.S. Effect of dietary fish meal replacement by red algae, Gracilaria arcuata, on growth performance and body composition of Nile tilapia Oreochromis niloticus. Saudi J. Biol. Sci. 2018, 25, 198–203. [Google Scholar] [CrossRef] [PubMed]
- Gallardo-Collı’, A.; Pe’rez-Rostro, C.I.; Herna´ndez-Vergara, M.P. Reuse of water from biofloc technology for intensive culture of Nile tilapia (Oreochromis niloticus): Effects on productive performance, organosomatic indices and body composition. Int. Aquat. Res. 2019, 11, 43–55. [Google Scholar] [CrossRef] [Green Version]
- Mabroke, R.S.; El-Husseiny, O.M.; Zidan, A.F.A.; Tahoun, A.; Suloma, A. Floc meal as potential substitute for soybean meal in tilapia diets under biofloc system conditions. J. Oceanol. Limnol. 2019, 37, 313–320. [Google Scholar] [CrossRef]
- Da Silva, M.A.; de Alvarenga, E.R.; da Costa, F.F.B.; Turra, E.M.; Alves, G.F.O.; Manduca, L.G.; Sales, S.C.M.; Leite, N.R.; Bezerra, V.M.; Moraes, S.G.S.; et al. Feeding management strategies to optimize the use of suspended feed for Nile tilapia (Oreochromis niloticus) cultivated in bioflocs. Aquac. Res. 2020, 51, 605–615. [Google Scholar] [CrossRef]


| Growth Indicators | Treatments | ||||
|---|---|---|---|---|---|
| T1 | T2 | T3 | T4 | T5 | |
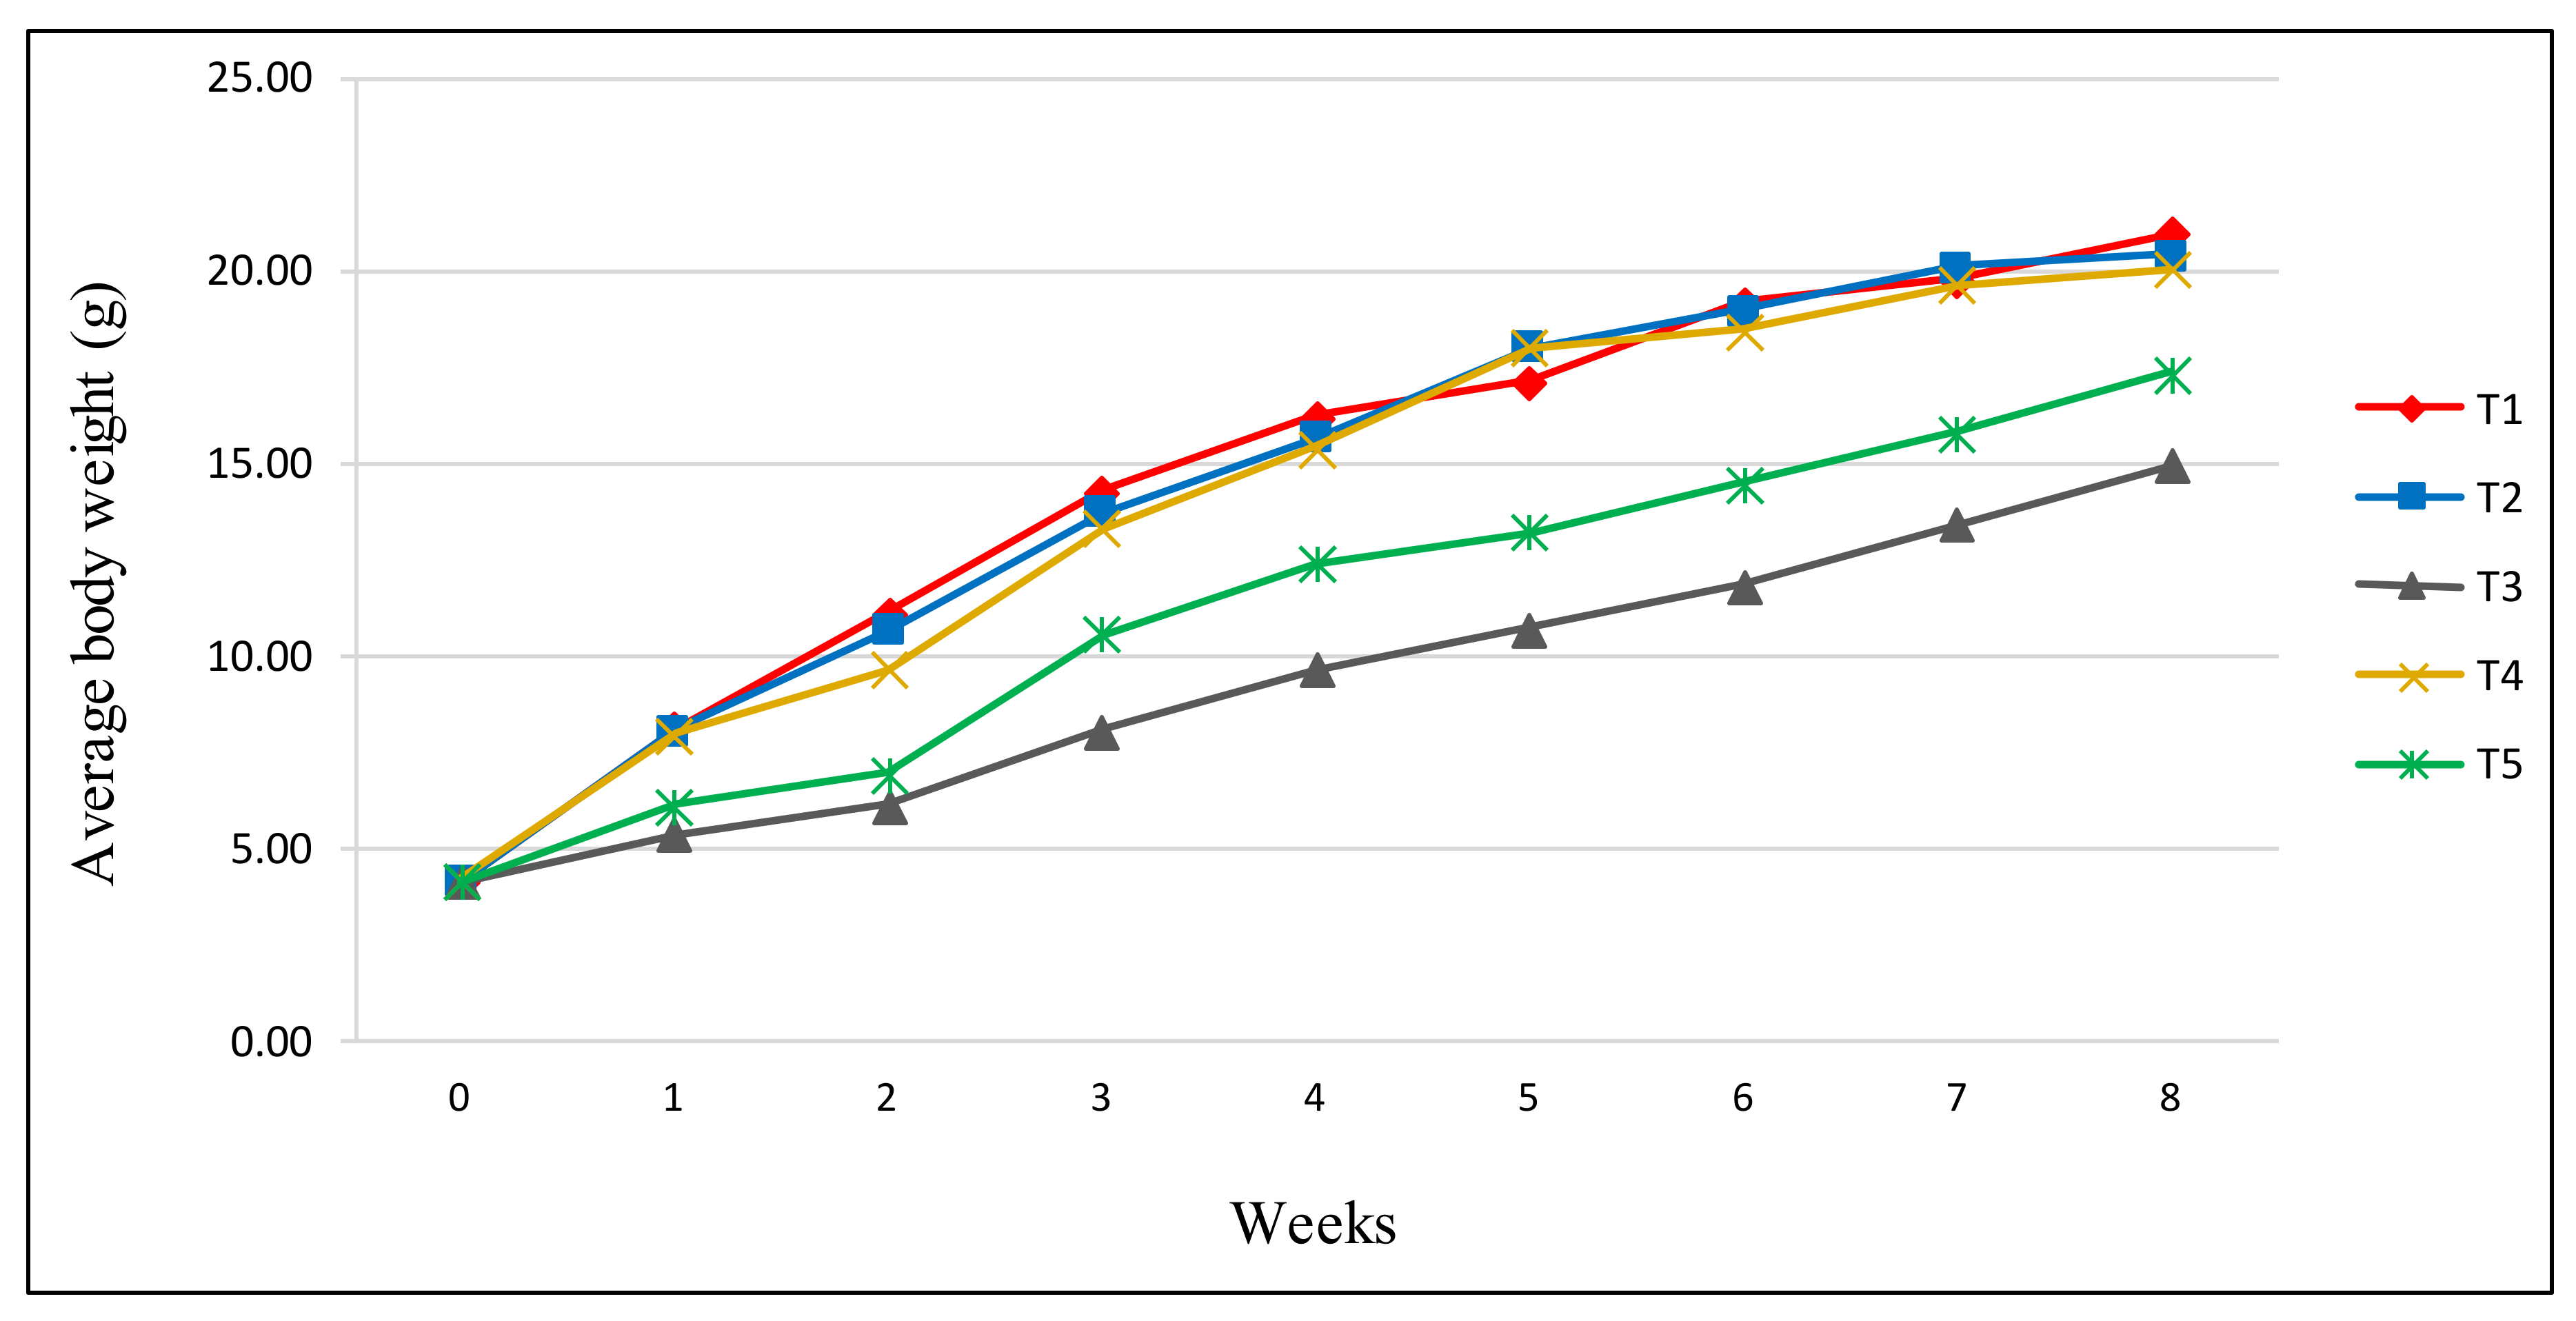
| Initial weight (g) | 4.13 ± 0.01 a | 4.11 ± 0.03 a | 4.10 ± 0.01 a | 4.15 ± 0.04 a | 4.11 ± 0.03 a |
| Final weight (g) | 20.98 ± 0.24 a | 20.42 ± 0.43 a | 14.95 ± 0.25 b | 20.05 ± 0.77 a | 17.31 ± 0.92 c |
| Weight gain (g) | 16.85 ± 0.25 a | 16.30 ± 0.46 a | 10.84 ± 0.24 b | 15.85 ± 0.78 a | 13.20 ± 0.89 c |
| Initial biomass weight (g) | 61.91 ± 0.14 a | 61.70 ± 0.43 a | 61.57 ± 0.14 a | 62.27 ± 0.57 a | 61.70 ± 0.43 a |
| Final biomass weight (g) | 286.82 ± 14.95 a | 272.20 ± 13.03 ab | 135.00 ± 1.75 c | 251.18 ± 2.73 b | 177.15 ± 12.78 d |
| Total biomass gain (g) | 224.91 ± 15.07 a | 210.50 ± 13.22 ab | 73.43 ± 1.61 c | 188.90 ± 2.75 b | 115.44 ± 12.36 d |
| SGR (%) | 2.69 ± 0.10 a | 2.60 ± 0.09 ab | 1.38 ± 0.02 c | 2.45 ± 0.02 b | 1.85 ± 0.12 d |
| FI per fish (g) | 42.04 ± 0.58 a | 40.53 ± 0.64 ab | 20.43 ± 0.70 c | 38.71 ± 1.46 b | 28.73 ± 0.77 d |
| FCR | 2.61 ± 0.22 a | 3.04 ± 0.10 ab | 5.50 ± 0.28 c | 3.20 ± 0.04 b | 3.99 ± 0.19 d |
| FER | 0.38 ± 0.03 a | 0.33 ± 0.01 b | 0.18 ± 0.01 c | 0.31 ± 0.00 b | 0.25 ± 0.01 d |
| PER | 1.18 ± 0.01 a | 1.18 ± 0.04 a | 1.57 ± 0.06 b | 1.19 ± 0.02 a | 1.33 ± 0.04 c |
| Final number (fish/tank) | 13.67 ± 0.58 a | 13.33 ± 0.58 a | 9.00 ± 0.00 b | 12.67 ± 0.58 a | 10.33 ± 0.58 b |
| Survival (%) | 91.11 ± 3.85 a | 88.89 ± 3.85 a | 60.00 ± 0.00 b | 84.45 ± 3.85 a | 68.89 ± 3.85 b |
| Parameters | Treatments | ||||
|---|---|---|---|---|---|
| T1 | T2 | T3 | T4 | T5 | |
| T ° (C °) | 26.22 ± 0.03 a (25.6–28.1) | 26.27 ± 0.02 b (25.7–28.1) | 26.39 ± 0.03 c (25.7–28.3) | 26.28 ± 0.02 b (25.4–28.1) | 26.33 ± 0.01 d (25.5–28.2) |
| DO (ppm) | 9.16 ± 0.09 a (7.71–10.87) | 9.07 ± 0.05 a (7.74–10.82) | 7.98 ± 0.01 b (7.08–8.62) | 9.08 ± 0.01 a (7.63–10.54) | 8.09 ± 0.03 b (7.49–8.88) |
| pH | 7.90 ± 0.02 a (7.60–8.37) | 7.87 ± 0.02 ab (7.51–8.30) | 7.68 ± 0.01 c (7.44–7.98) | 7.84 ± 0.01 b (7.53–8.24) | 7.74 ± 0.01 d (7.50–8.05) |
| Salinity (ppt) | 10.04 ± 0.04 a (9.00–10.36) | 10.01 ± 0.02 a (9.00–10.50) | 10.07 ± 0.01 a (9.30–10.53) | 9.98 ± 0.05 a (8.80–10.85) | 10.04 ± 0.06 a (9.10–10.40) |
| EC (mS/cm) | 15.85 ± 0.03 a (12.62–17.61) | 16.08 ± 0.03 b (12.22–17.54) | 16.65 ± 0.13 c (12.86–18.35) | 16.09 ± 0.03 b (12.64–17.80) | 16.59 ± 0.06 c (12.22–18.03) |
| TDS (ppt) | 10.52 ± 0.05 ab (10.09–10.75) | 10.62 ± 0.03 a (10.38–11.30) | 11.69 ± 0.08 c (10.25–11.97) | 10.48 ± 0.001 b (10.38–10.60) | 11.35 ± 0.05 d (10.69–11.92) |
| TSS (ppm) | 13.39 ± 0.14 a (7.50–18.00) | 16.48 ± 0.29 b (11.00–20.80) | 20.19 ± 0.59 c (16.00–29.00) | 14.18 ± 0.02 a (9.40–19.40) | 18.28 ± 0.17 d (12.00–27.00) |
| TAN (ppm) | 1.21 ± 0.02 a (0.08–1.95) | 1.26 ± 0.06 b (0.09–1.92) | 1.59 ± 0.02 c (0.10–2.29) | 1.23 ± 0.02 ab (0.09–1.94) | 1.36 ± 0.02 d (0.10–2.25) |
| NO3-N (ppm) | 1.58 ± 0.01 a (0.83–2.20) | 1.70 ± 0.01 b (0.90–2.40) | 2.36 ± 0.08 c (1.06–3.63) | 1.58 ± 0.03 a (0.80–2.20) | 2.23 ± 0.03 d (0.95–3.33) |
| PO4− (ppm) | 3.45 ± 0.64 a (1.80–10.00) | 3.83 ± 0.14 a (2.20–11.00) | 10.57 ± 0.99 b (3.10–12.90) | 3.62 ± 1.02 a (1.90–9.30) | 7.76 ± 0.03 c (2.40–11.10) |
| BOD (ppm) | 1.96 ± 0.18 a (1.10–4.19) | 2.28 ± 0.05 ac (1.45–4.20) | 5.22 ± 0.97 b (2.10–9.47) | 2.14 ± 0.44 a (1.17–3.51) | 3.56 ± 0.04 c (1.52–5.35) |
| COD (ppm) | 204.10 ± 3.82 a (110–308) | 233.90 ± 3.94 b (110–348) | 373.65 ± 5.48 c (160–499) | 201.17 ± 12.67 a (90–358) | 317.15 ± 6.40 d (170–455) |
| Treatments | Proximate Composition (%) | |||||||
|---|---|---|---|---|---|---|---|---|
| OM | Moisture | Crude Protein | Crude Lipid | Crude Fiber | Total NFE | Total Ash | Gross Energy | |
| Bioflocs 1 (in dry weight) | ||||||||
| FDBF | 58.45 ± 1.14 a | 8.37 ± 0.19 ab | 30.55 ± 0.39 a | 0.78 ± 0.02 a | 15.84 ± 0.17 a | 2.92 ± 1.04 a | 41.55 ± 1.14 a | 255.34 ± 4.63 a |
| ODBF | 60.12 ± 1.11 a | 6.92 ± 0.39 a | 26.18 ± 1.23 b | 0.96 ± 0.05 b | 16.58 ± 0.22 a | 9.48 ± 0.34 b | 39.88 ± 1.11 a | 262.49 ± 6.82 a |
| Experimental diets 2 (in dry weight) | ||||||||
| T1 | 85.06 ± 0.05 b | 9.95 ± 0.01 b | 33.34 ± 1.29 c | 5.55 ± 0.07 c | 7.51 ± 0.40 b | 28.72 ± 1.57 c | 14.94 ± 0.05 b | 387.59 ± 1.79 b |
| T2 | 88.79 ± 0.41 c | 4.80 ± 0.39 c | 32.25 ± 0.37 ac | 4.88 ± 0.04 d | 8.12 ± 0.31 b | 38.75 ± 0.85 d | 11.21 ± 0.41 c | 418.79 ± 2.92 c |
| T3 | 88.72 ± 0.02 c | 4.63 ± 0.51 c | 27.05 ± 0.96 b | 4.59 ± 0.03 e | 10.38 ± 0.30 c | 42.07 ± 0.65 de | 11.28 ± 0.02 c | 409.86 ± 3.18 c |
| T4 | 88.26 ± 3.24 c | 4.29 ± 0.05 c | 31.15 ± 0.43 ac | 5.15 ± 0.10 f | 8.27 ± 0.56 b | 39.40 ± 3.88 de | 11.74 ± 3.24 c | 418.49 ± 13.34 c |
| T5 | 88.79 ± 0.41 c | 4.22 ± 0.54 c | 25.75 ± 0.92 b | 4.70 ± 0.01 e | 9.86 ± 0.76 c | 44.25 ± 1.47 e | 11.22 ± 0.41 c | 410.48 ± 2.23 c |
| Fish body composition (in wet weight) | ||||||||
| Initial | 96.81 ± 0.12 A | 84.59 ± 0.31 A | 09.04 ± 0.25 A | 1.59 ± 0.04 A | 0.65 ± 0.06 A | 0.95 ± 0.13 AC | 3.19 ± 0.12 A | 72.18 ± 1.37 A |
| T1 | 96.55 ± 0.23 AB | 73.60 ± 1.13 BD | 13.72 ± 0.40 B | 4.67 ± 0.20 B | 3.62 ± 0.10 B | 0.94 ± 0.46 AC | 3.45 ± 0.23 AB | 139.58 ± 5.27 B |
| T2 | 96.66 ± 0.09 A | 74.08 ± 1.07 BD | 13.51 ± 0.52 B | 4.52 ± 0.15 B | 3.74 ± 0.16 B | 0.82 ± 0.18 ABC | 3.34 ± 0.09 A | 137.02 ± 5.66 BD |
| T3 | 96.23 ± 0.02 B | 76.02 ± 0.52 C | 12.08 ± 0.24 C | 4.32 ± 0.15 B | 3.65 ± 0.11 B | 0.17 ± 0.06 B | 3.77 ± 0.02 B | 124.00 ± 3.03 C |
| T4 | 96.59 ± 0.10 AB | 72.86 ± 0.03 D | 14.05 ± 0.15 B | 4.66 ± 0.02 B | 3.68 ± 0.03 B | 1.33 ± 0.19 C | 3.41 ± 0.10 AB | 143.27 ± 0.49 B |
| T5 | 96.45 ± 0.19 AB | 75.27 ± 0.29 BC | 12.52 ± 0.29 C | 4.43 ± 0.14 B | 3.88 ± 0.10 B | 0.76 ± 0.45 AB | 3.55 ± 0.19 AB | 129.27 ± 2.00 CD |
Publisher’s Note: MDPI stays neutral with regard to jurisdictional claims in published maps and institutional affiliations. |
© 2022 by the authors. Licensee MDPI, Basel, Switzerland. This article is an open access article distributed under the terms and conditions of the Creative Commons Attribution (CC BY) license (https://creativecommons.org/licenses/by/4.0/).
Share and Cite
Binalshikh-Abubkr, T.; Mohd Hanafiah, M. Effect of Supplementation of Dried Bioflocs Produced by Freeze-Drying and Oven-Drying Methods on Water Quality, Growth Performance and Proximate Composition of Red Hybrid Tilapia. J. Mar. Sci. Eng. 2022, 10, 61. https://doi.org/10.3390/jmse10010061
Binalshikh-Abubkr T, Mohd Hanafiah M. Effect of Supplementation of Dried Bioflocs Produced by Freeze-Drying and Oven-Drying Methods on Water Quality, Growth Performance and Proximate Composition of Red Hybrid Tilapia. Journal of Marine Science and Engineering. 2022; 10(1):61. https://doi.org/10.3390/jmse10010061
Chicago/Turabian StyleBinalshikh-Abubkr, Tarq, and Marlia Mohd Hanafiah. 2022. "Effect of Supplementation of Dried Bioflocs Produced by Freeze-Drying and Oven-Drying Methods on Water Quality, Growth Performance and Proximate Composition of Red Hybrid Tilapia" Journal of Marine Science and Engineering 10, no. 1: 61. https://doi.org/10.3390/jmse10010061
APA StyleBinalshikh-Abubkr, T., & Mohd Hanafiah, M. (2022). Effect of Supplementation of Dried Bioflocs Produced by Freeze-Drying and Oven-Drying Methods on Water Quality, Growth Performance and Proximate Composition of Red Hybrid Tilapia. Journal of Marine Science and Engineering, 10(1), 61. https://doi.org/10.3390/jmse10010061