
Sea Surface Temperature Variability and Marine Heat Waves over the Aegean, Ionian, and Cretan Seas from 2008–2021


Abstract
1. Introduction
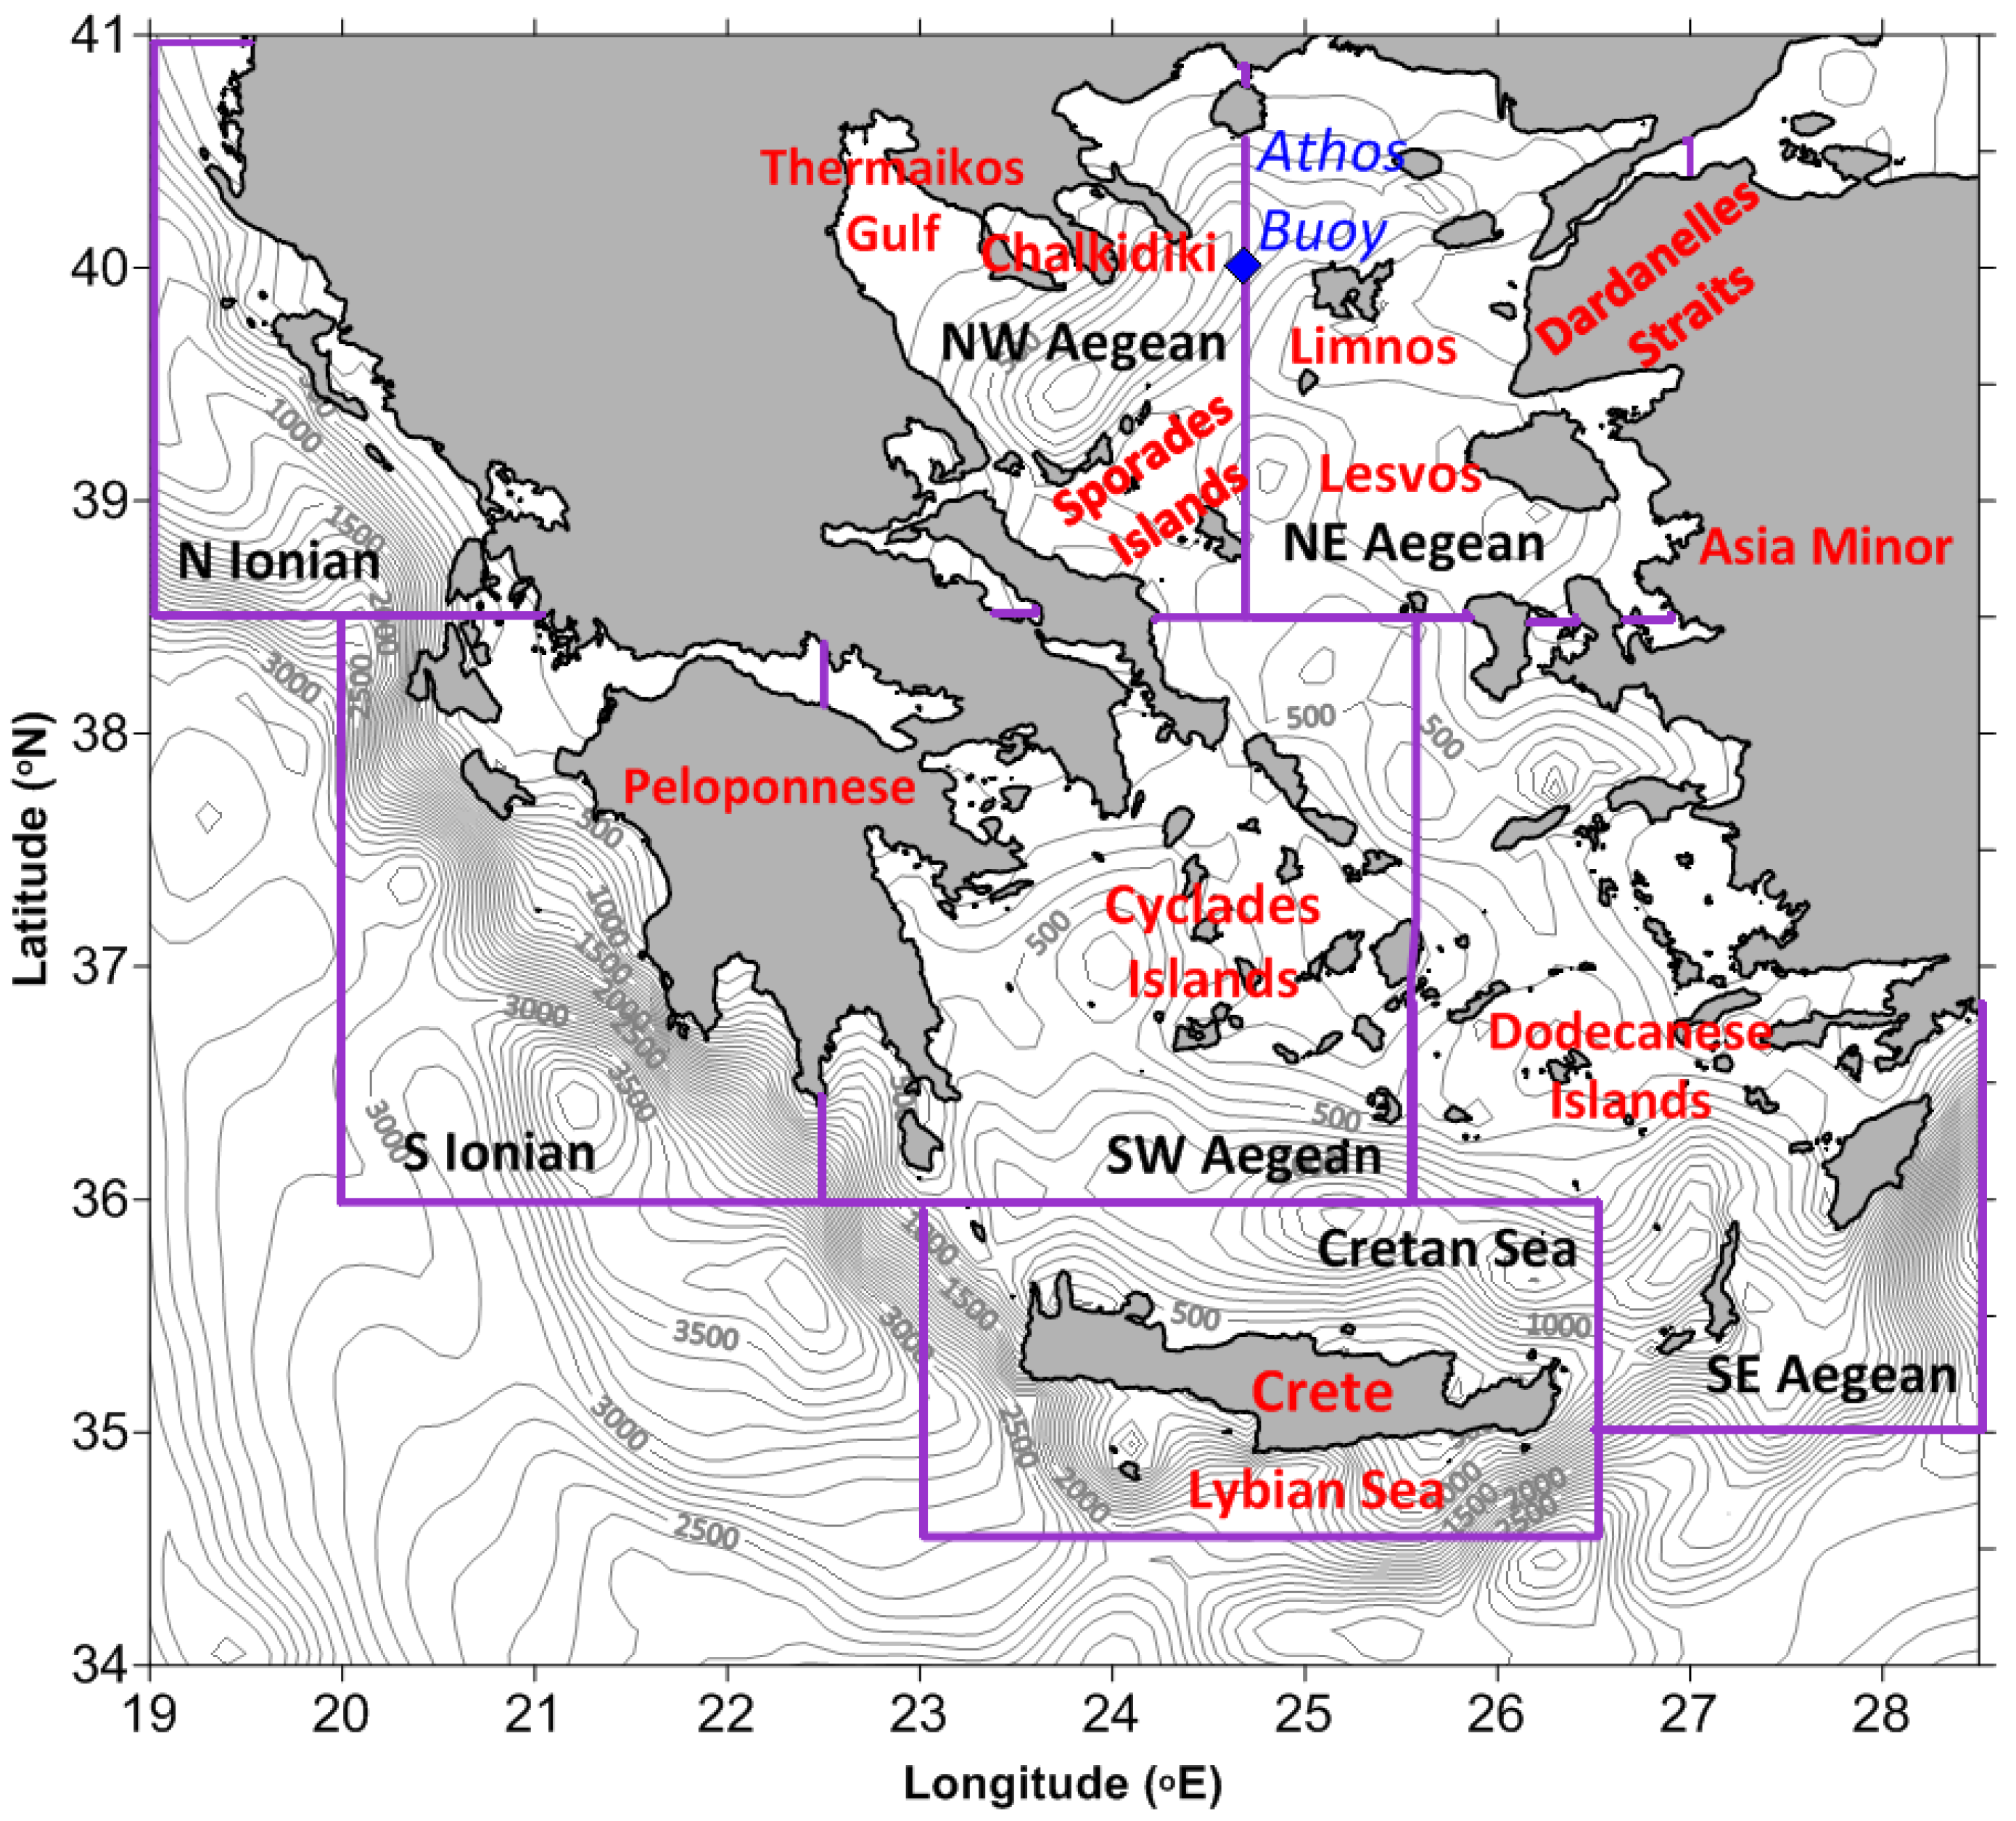
2. Data and Methods
2.1. Satellite Observations
2.2. Atmoshperic Data
2.3. Field Observations
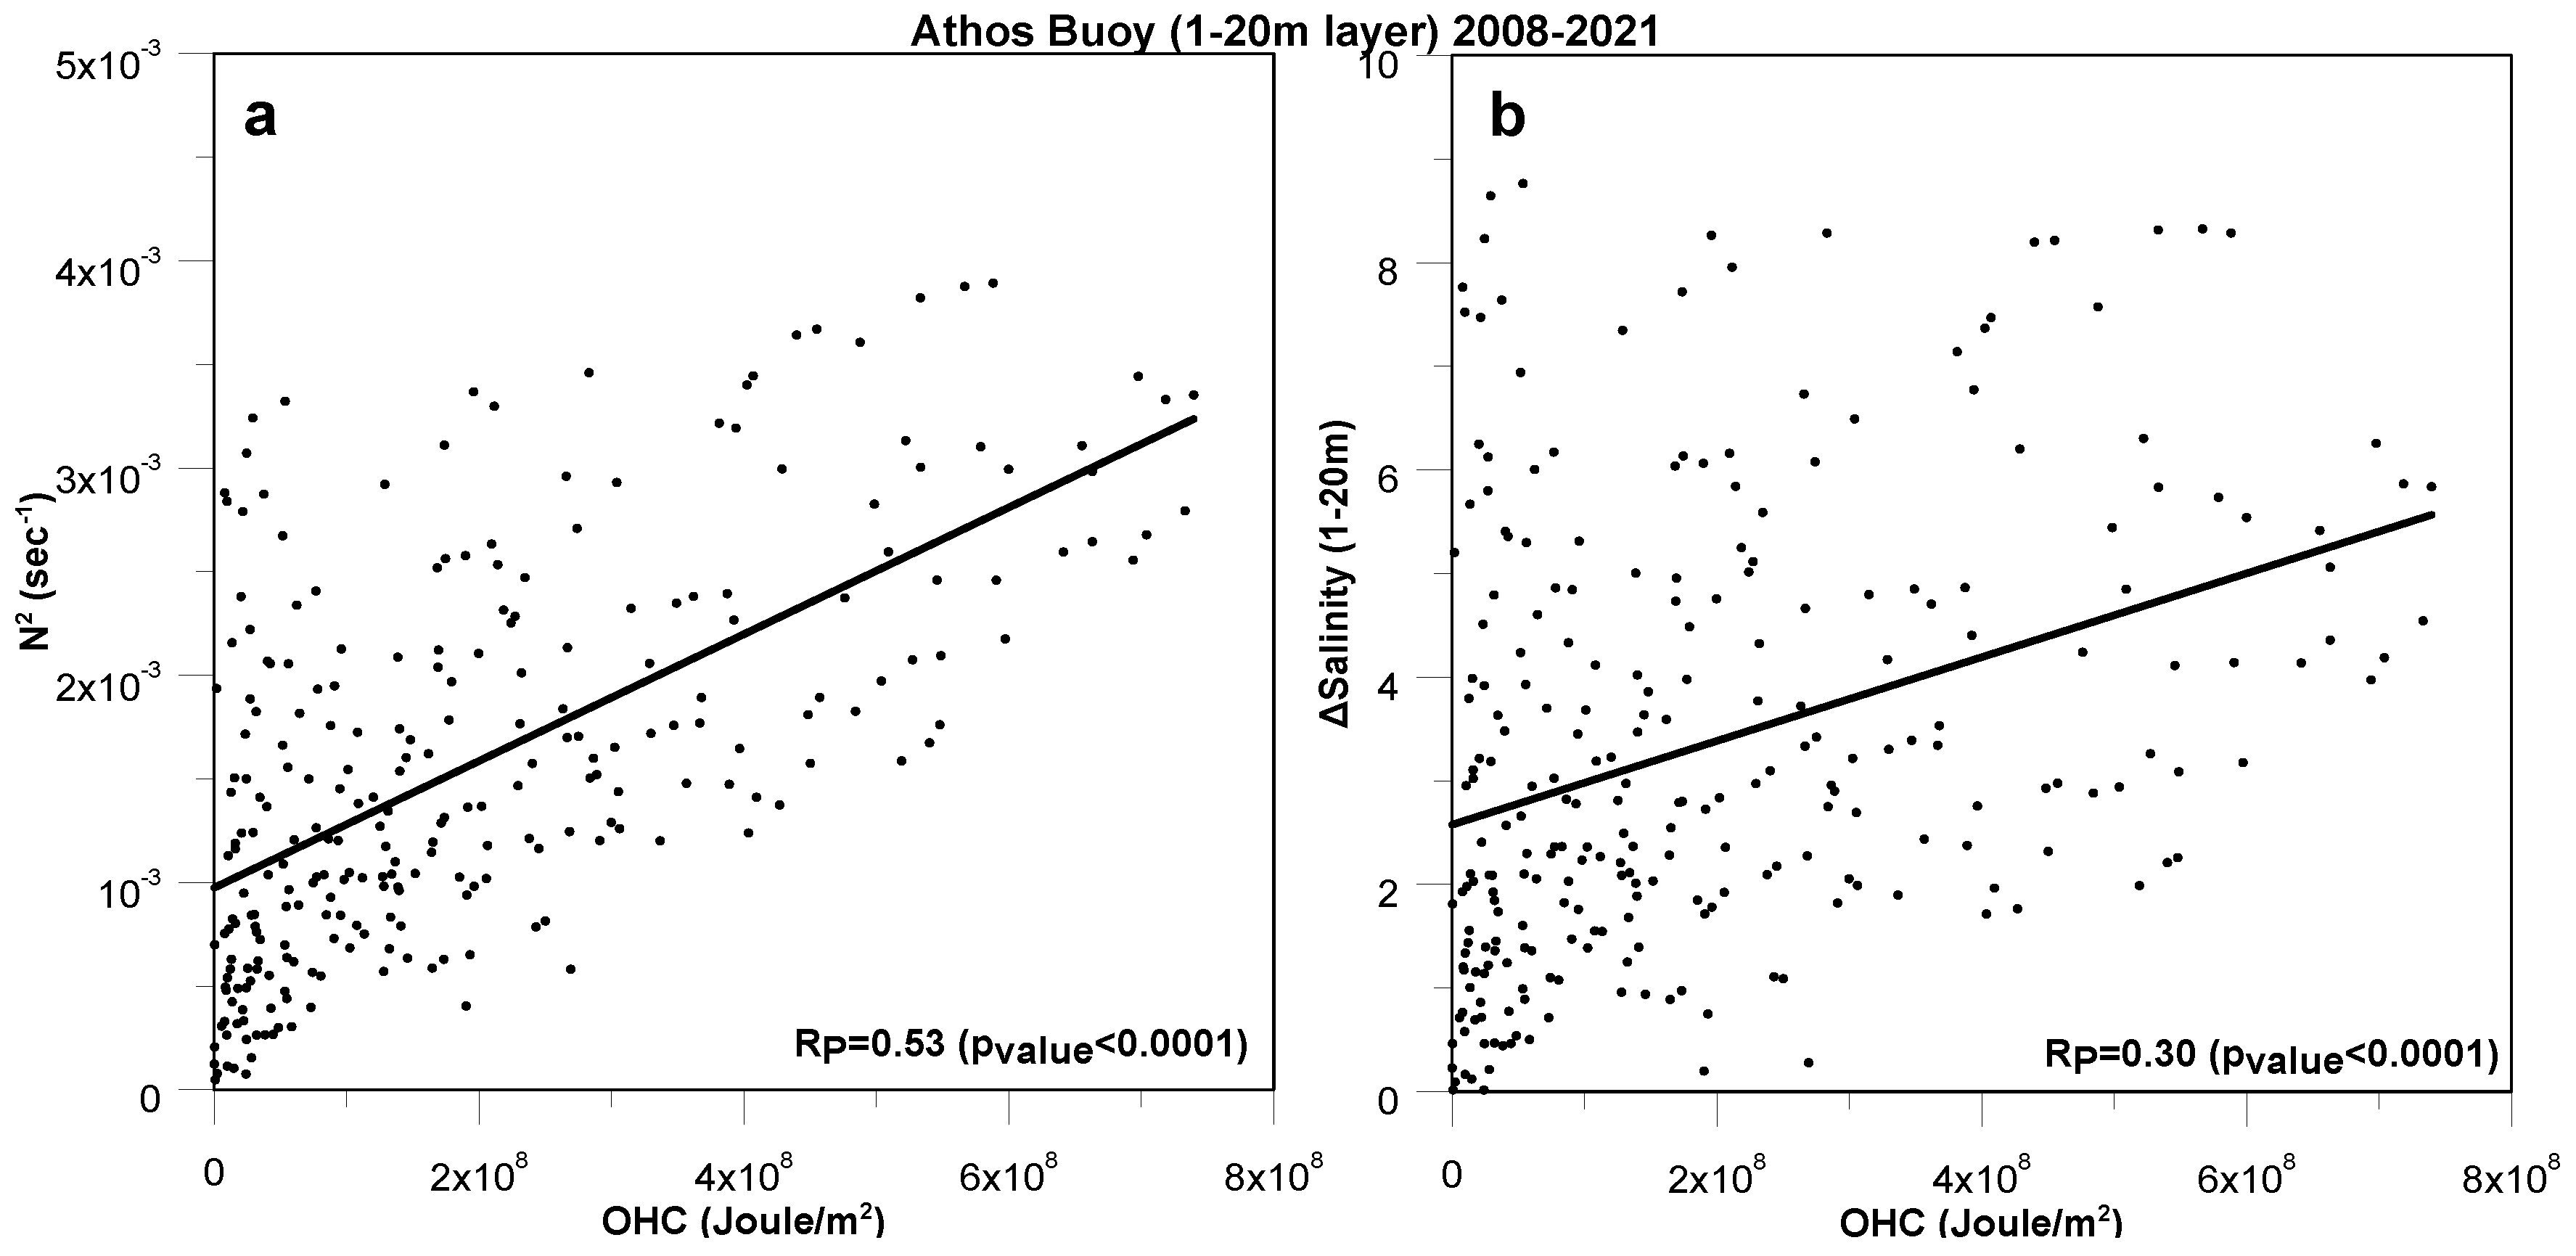
3. Results
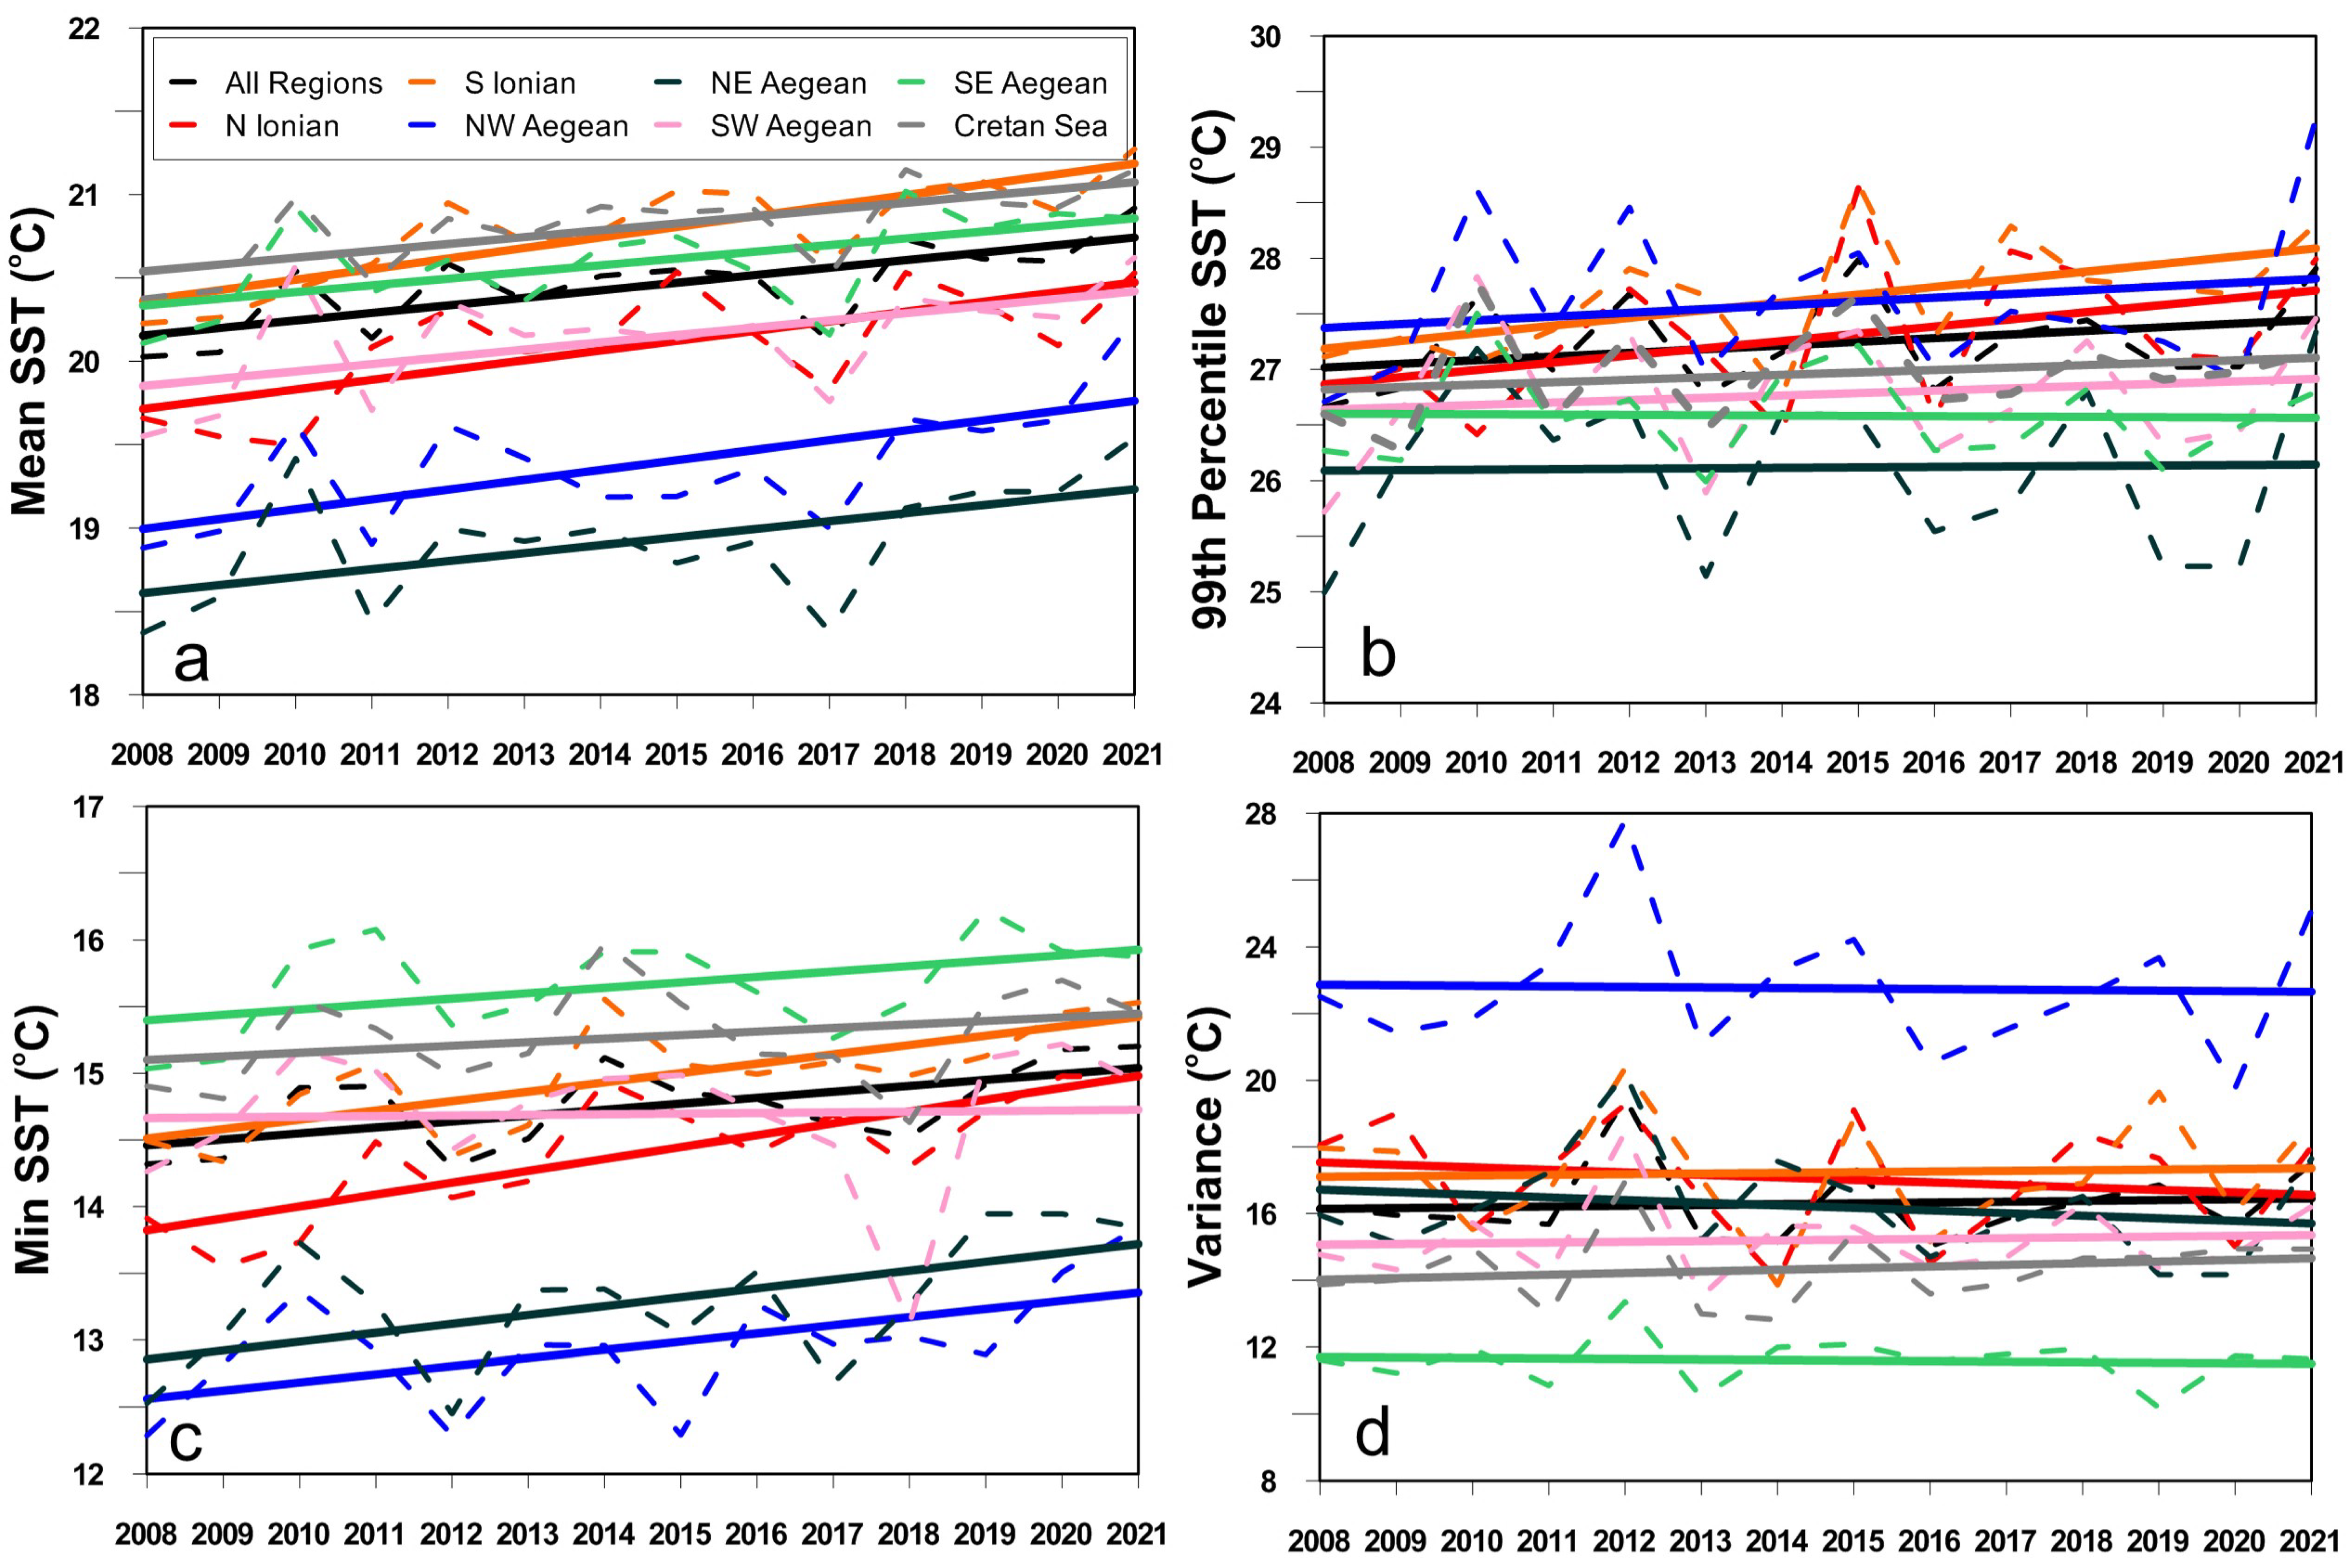
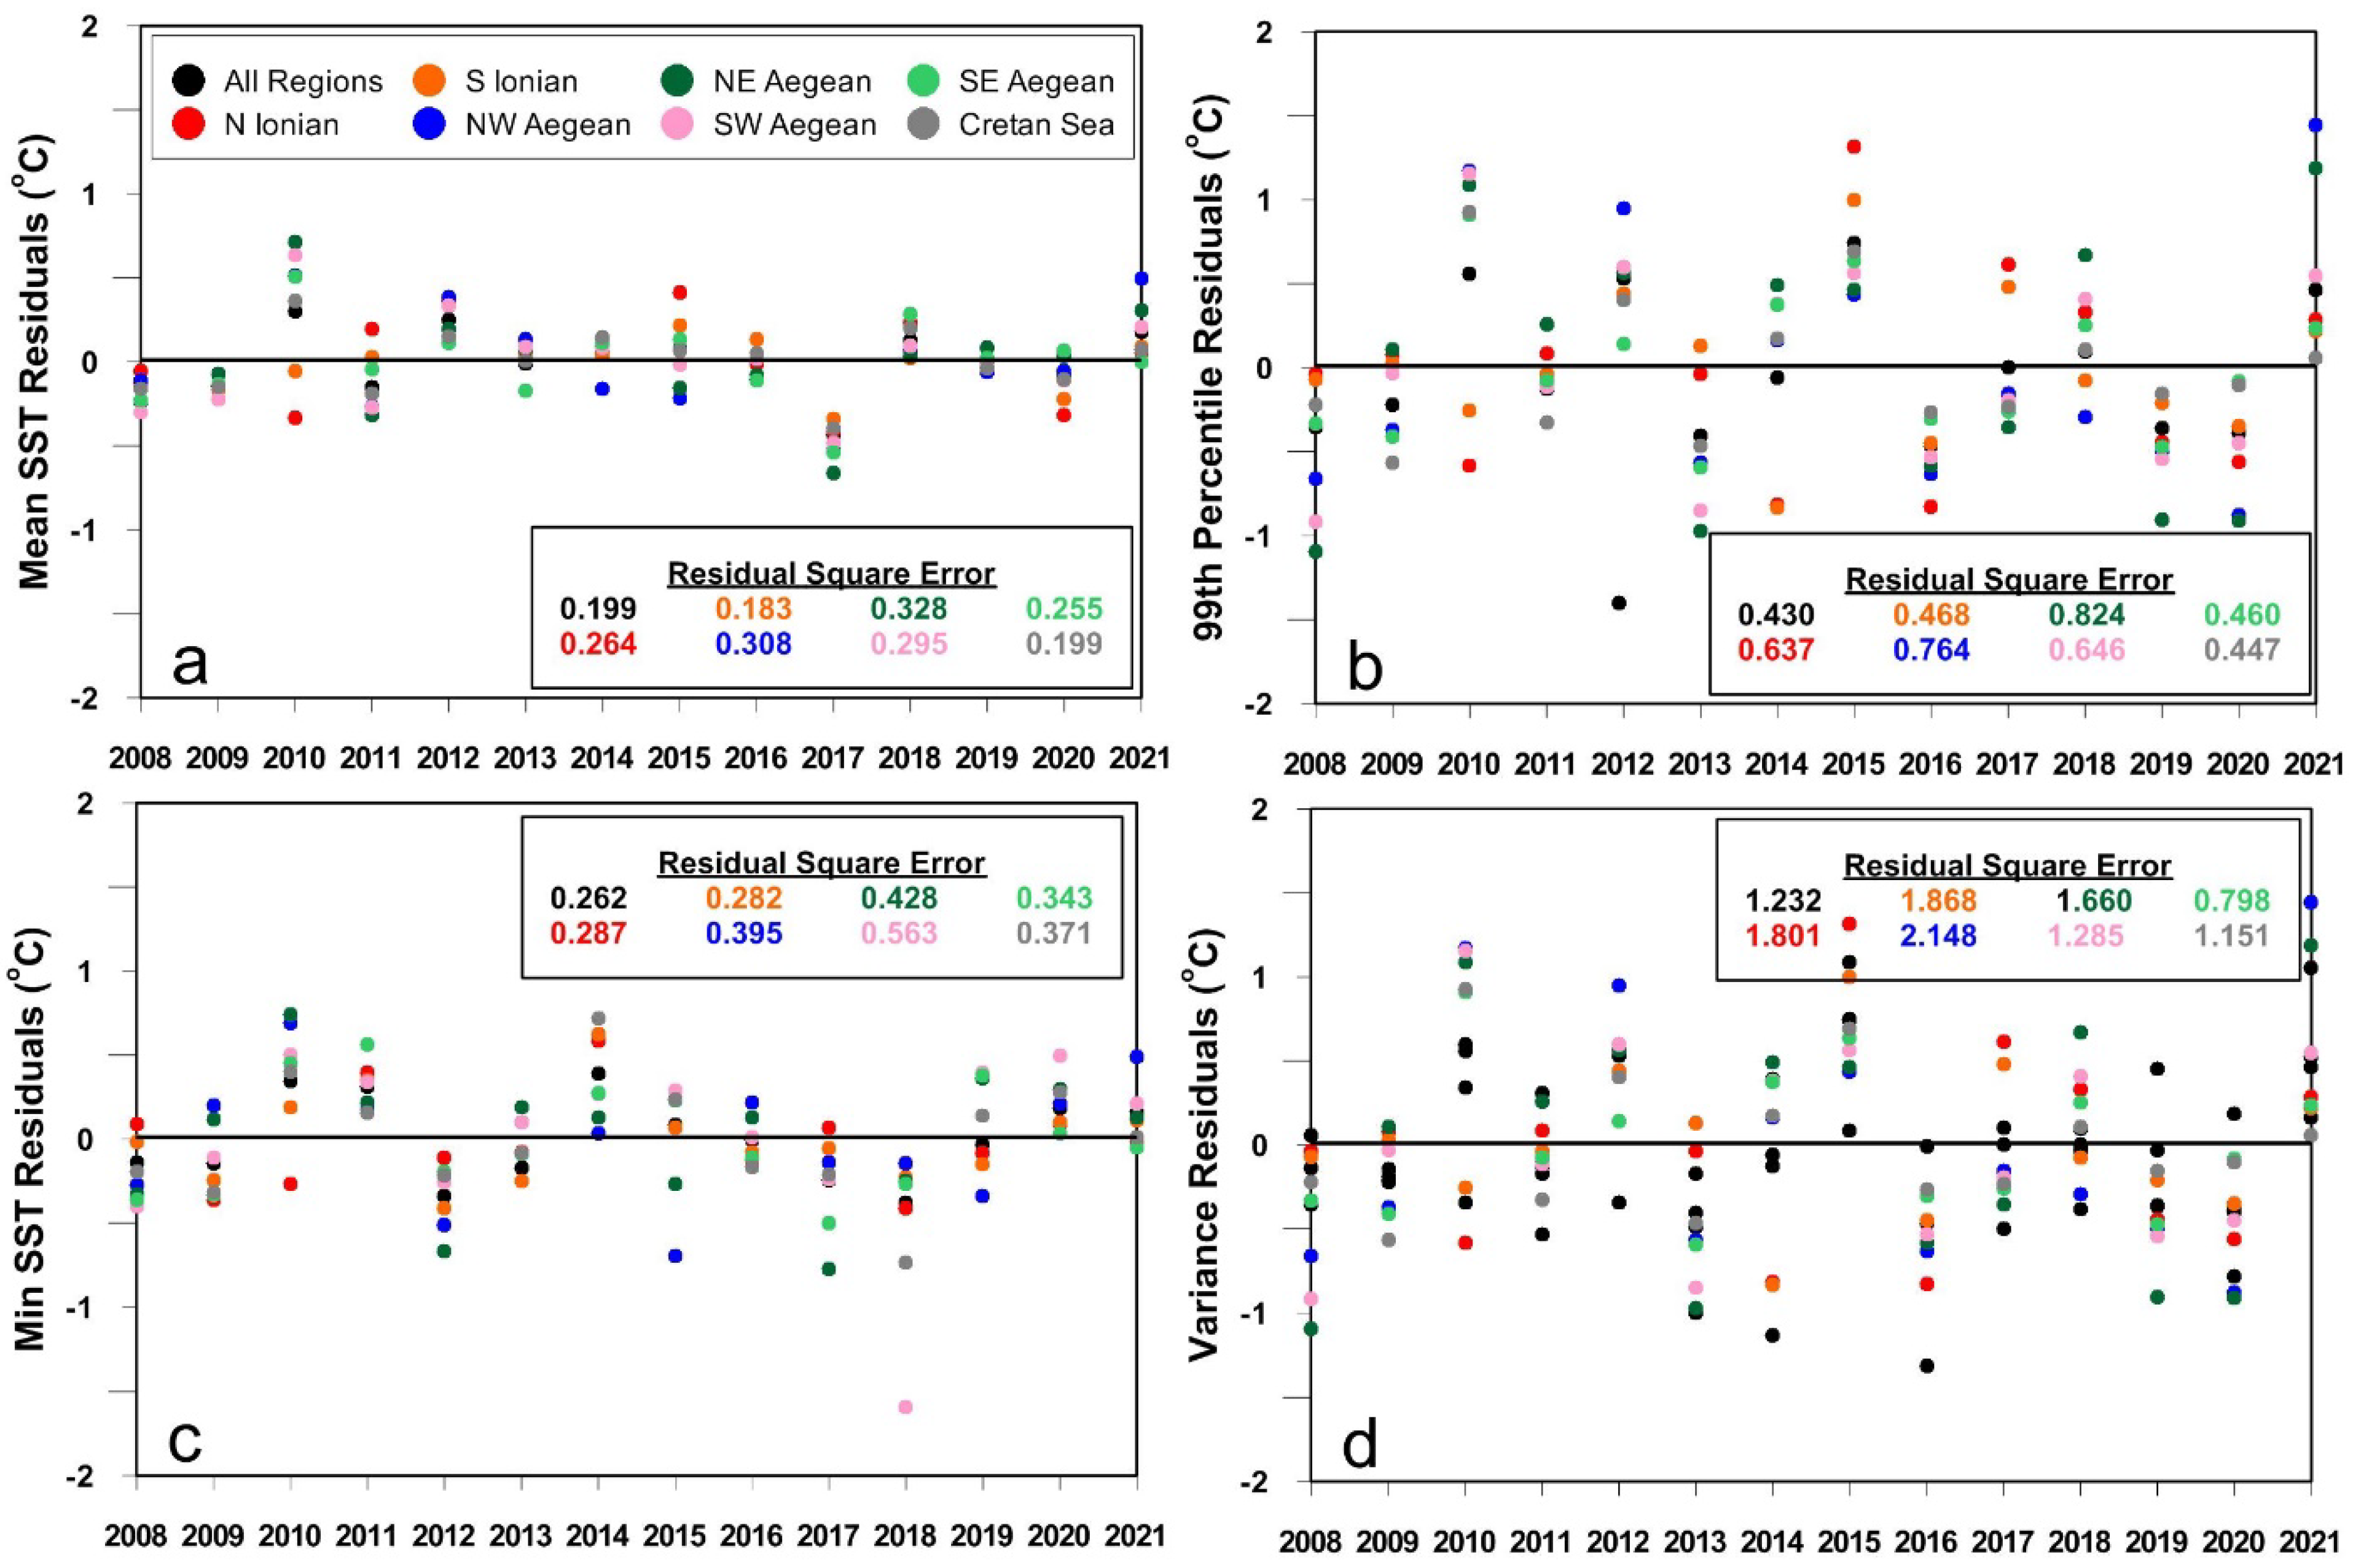
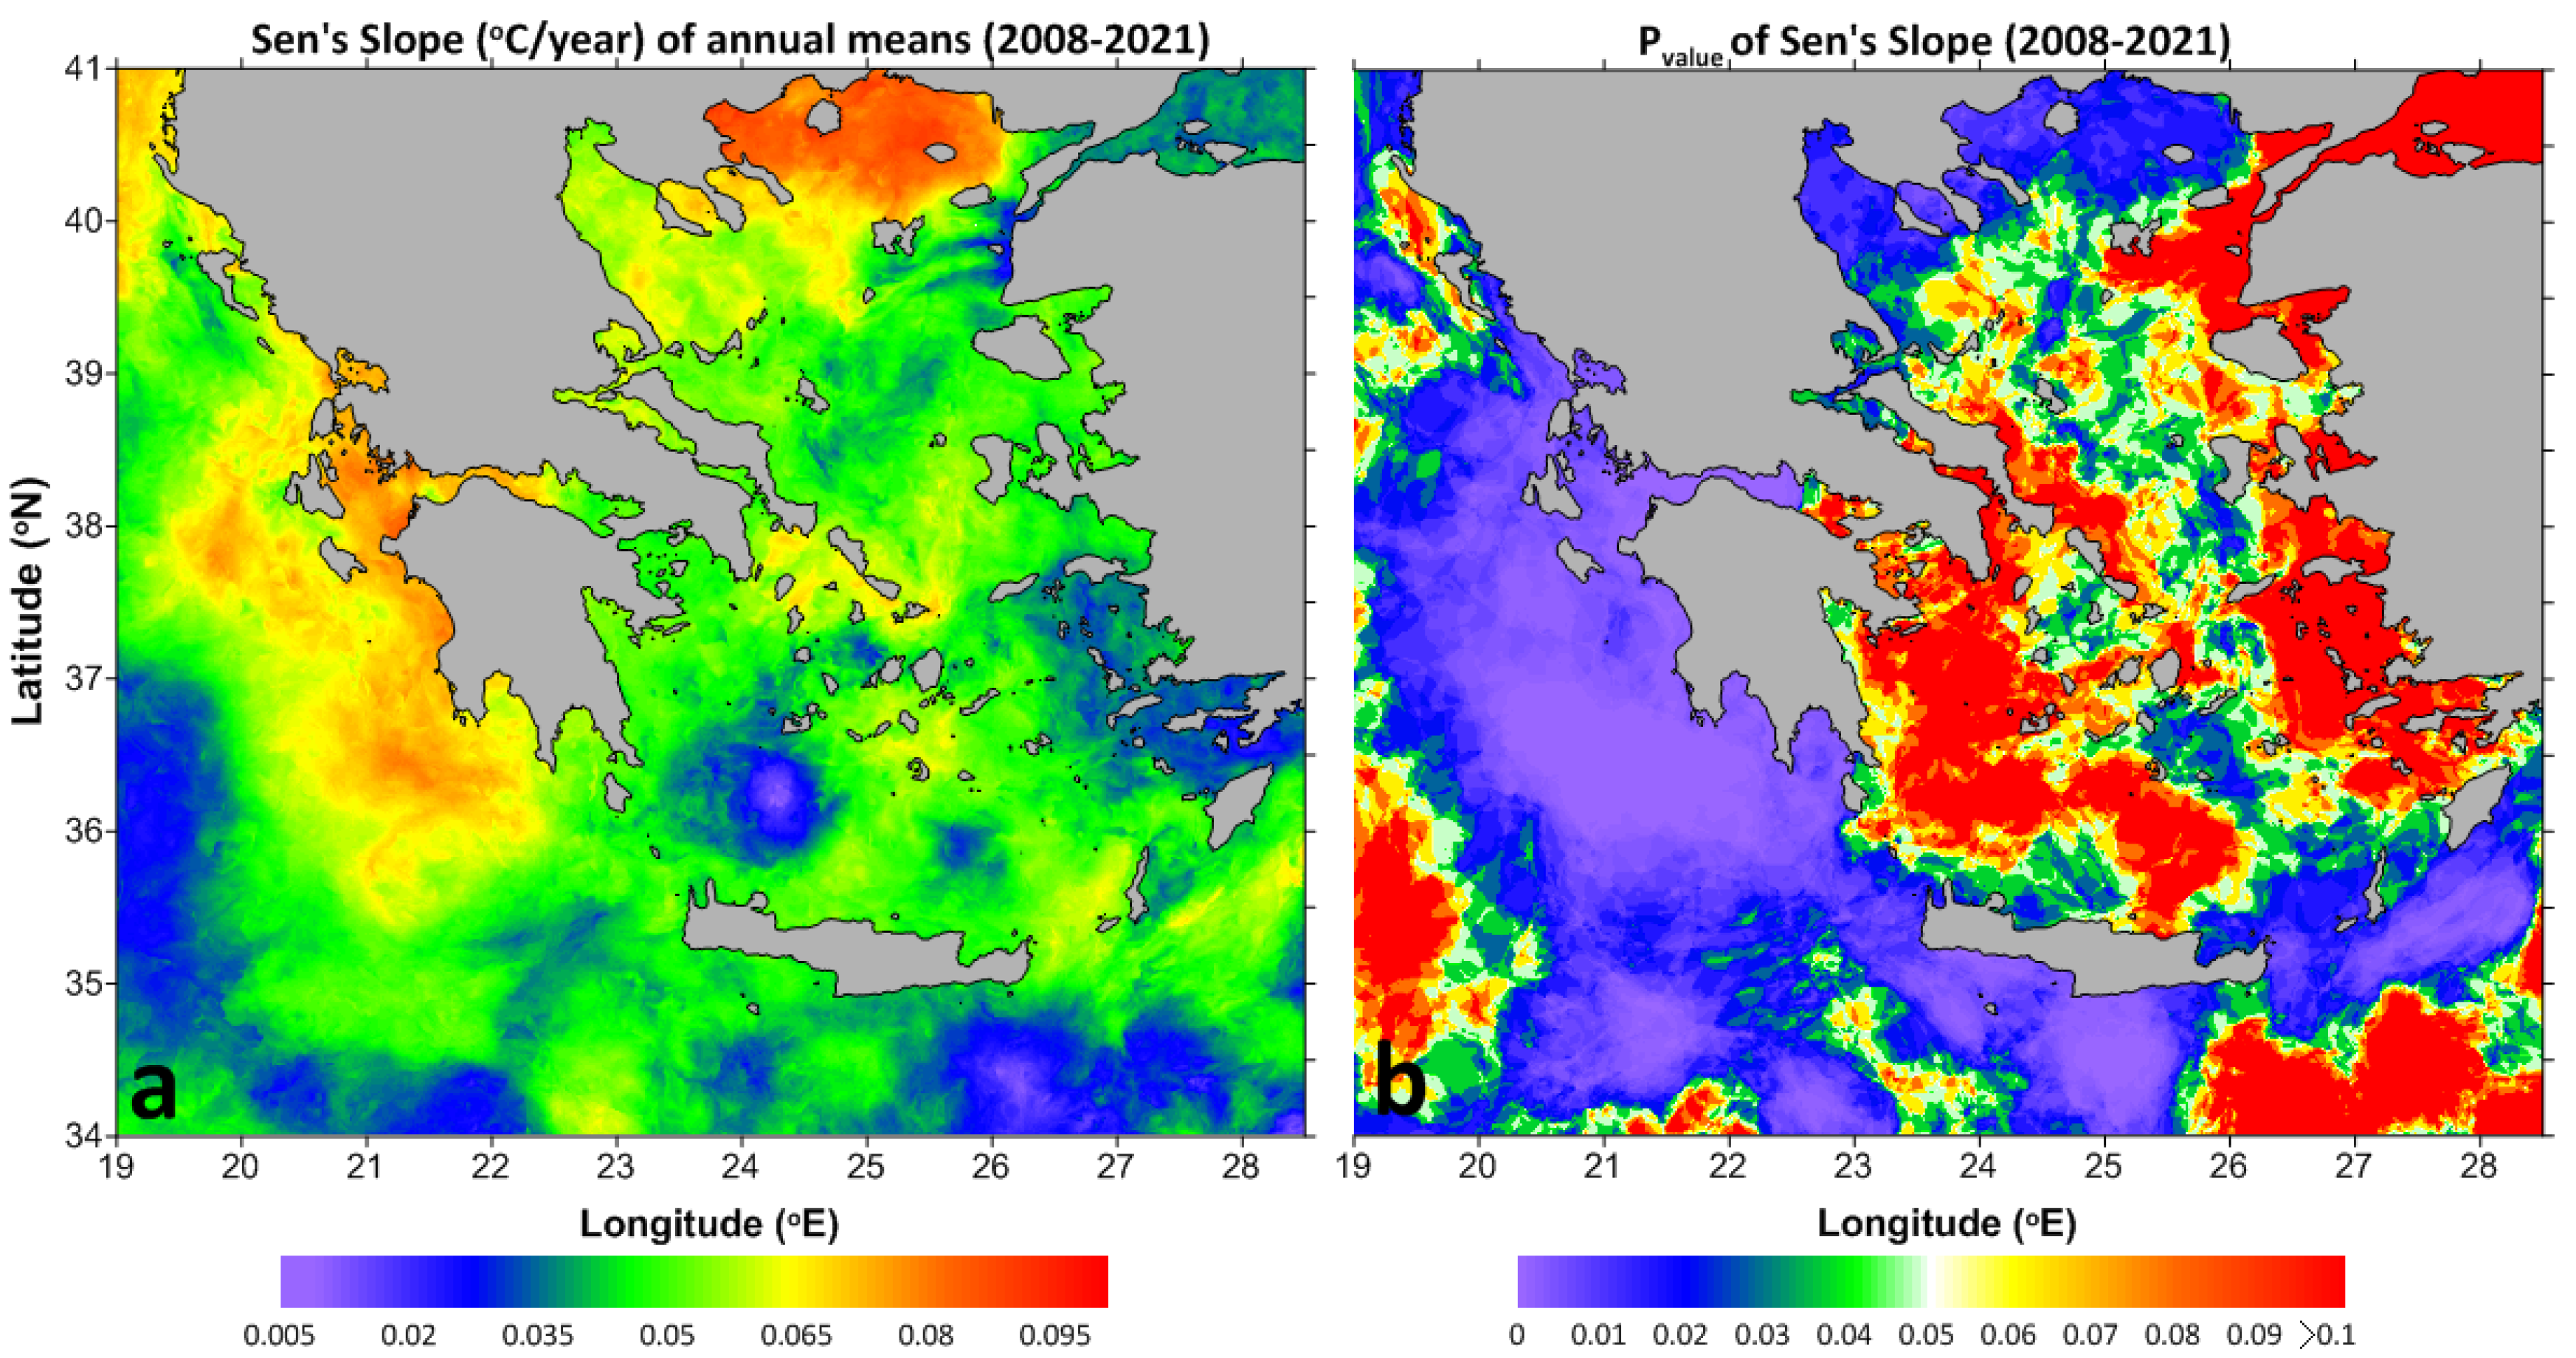
3.1. Interannual Variability of SST
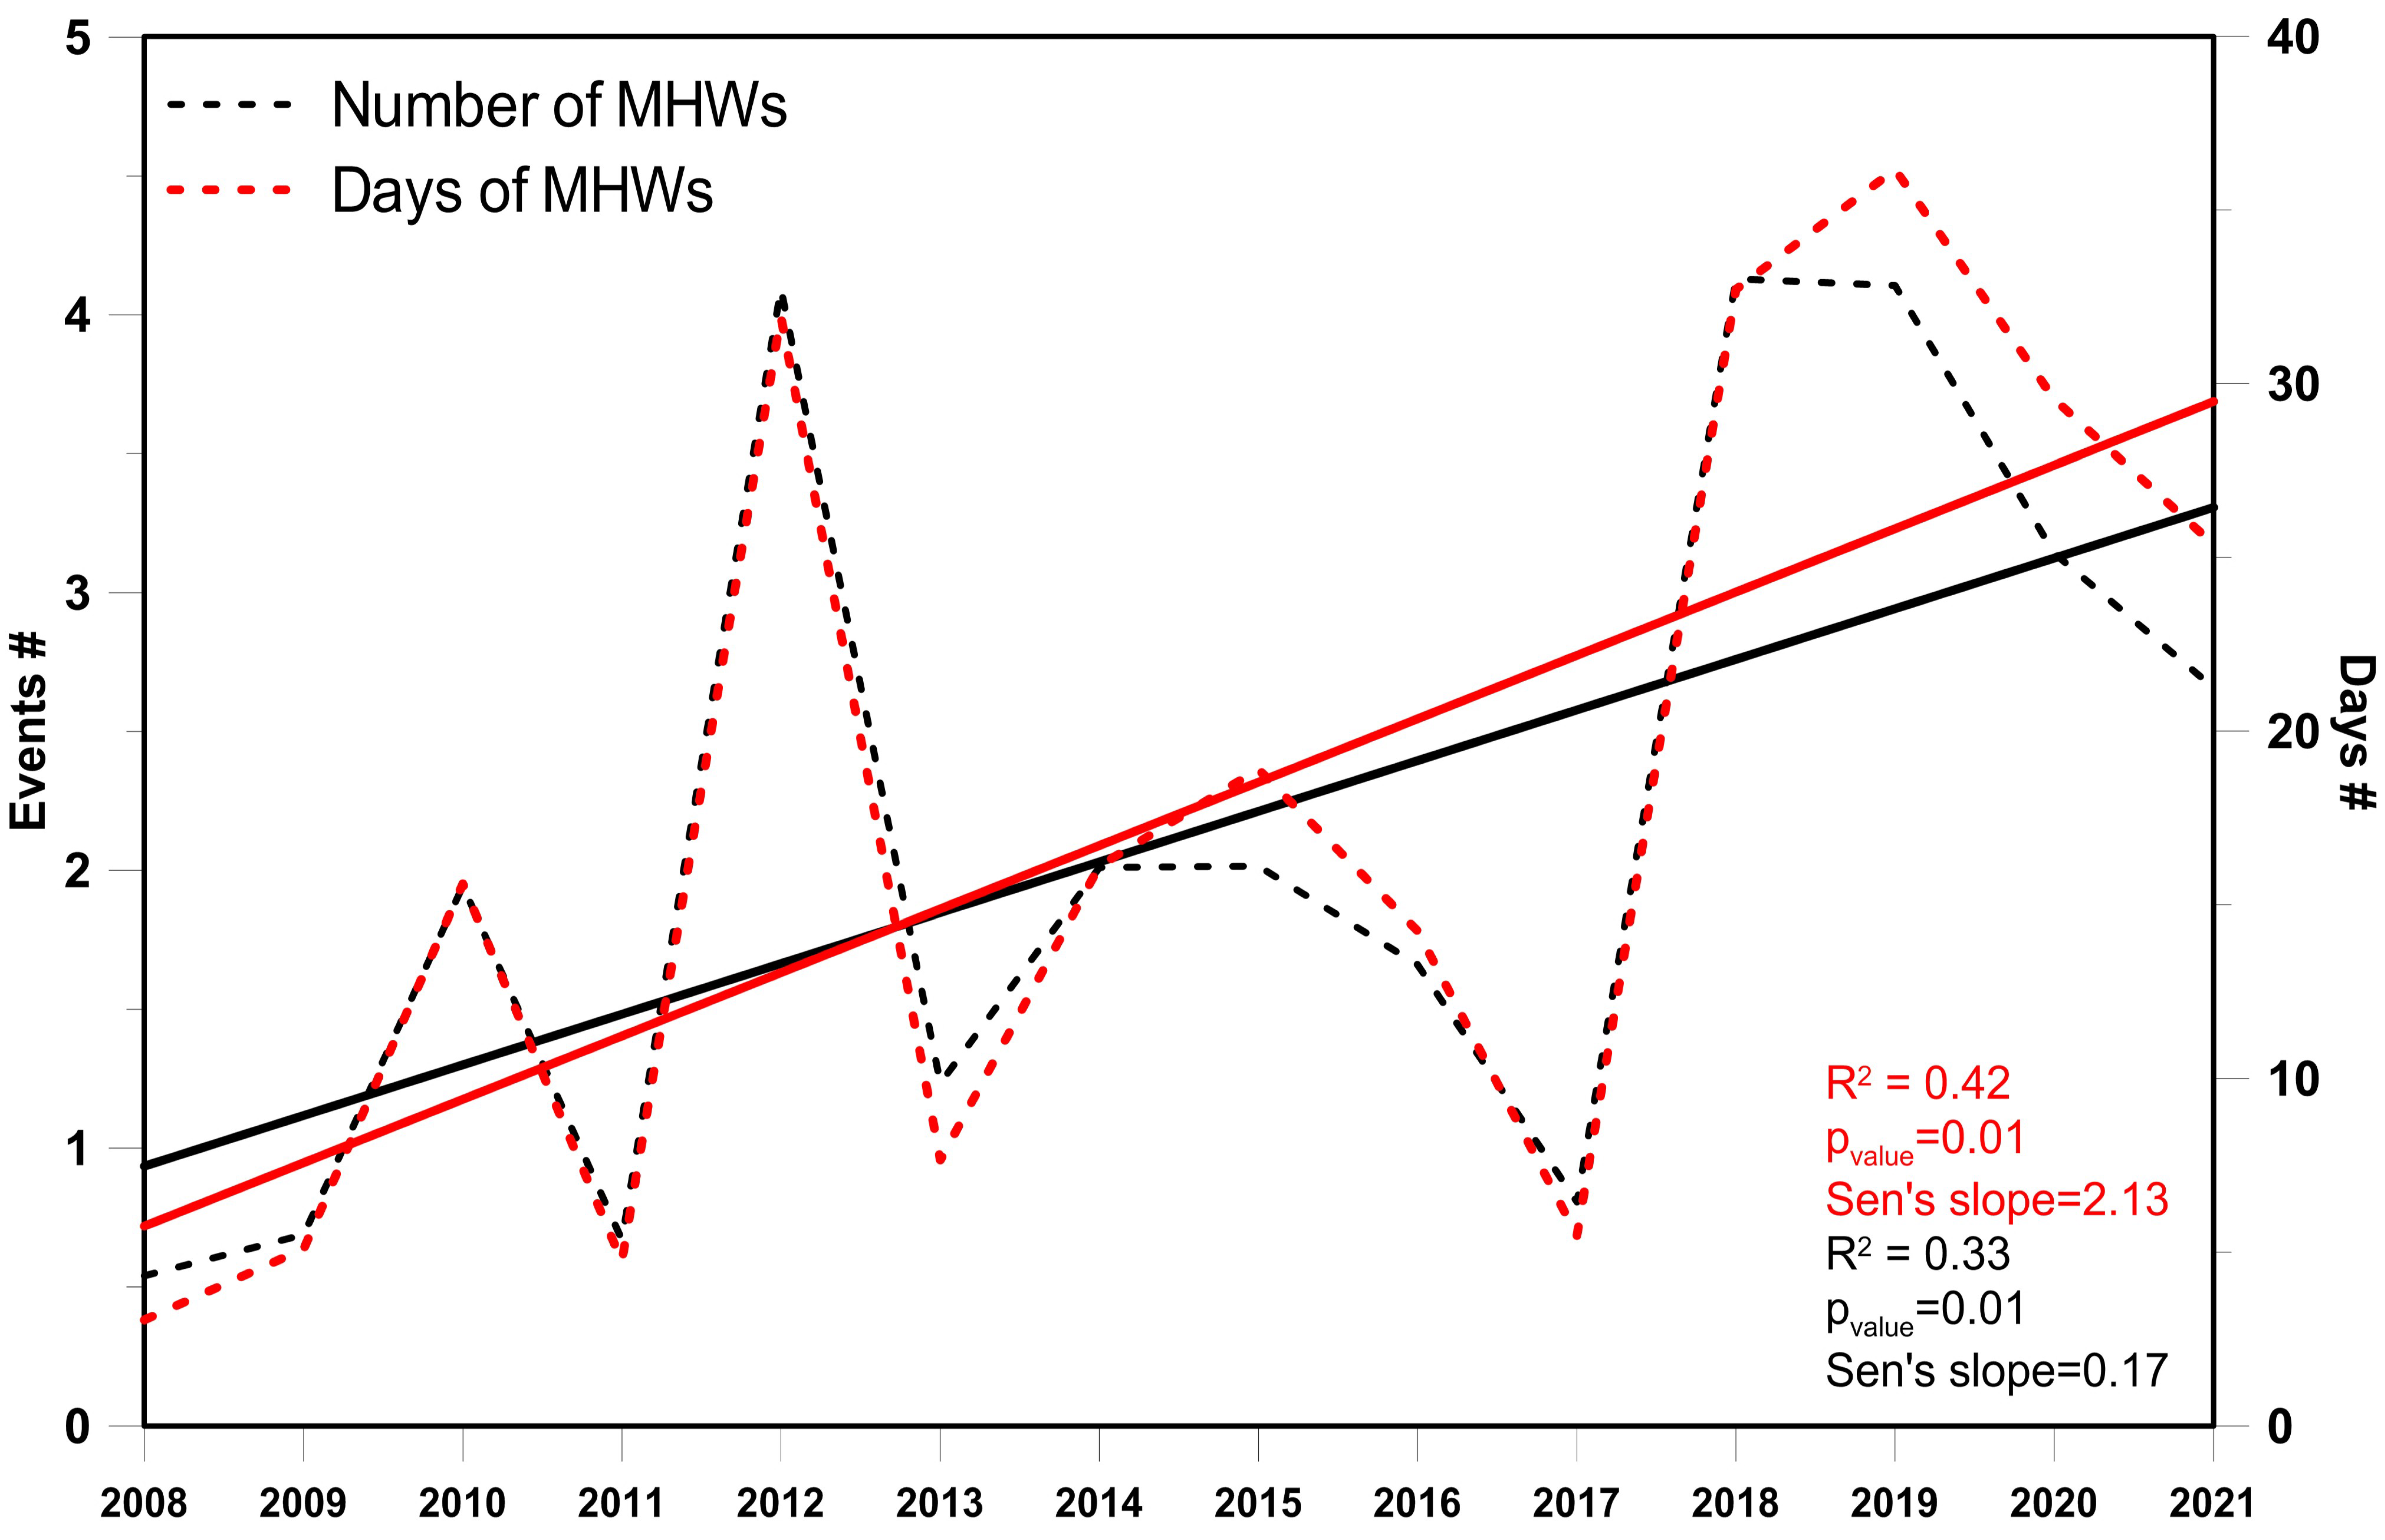
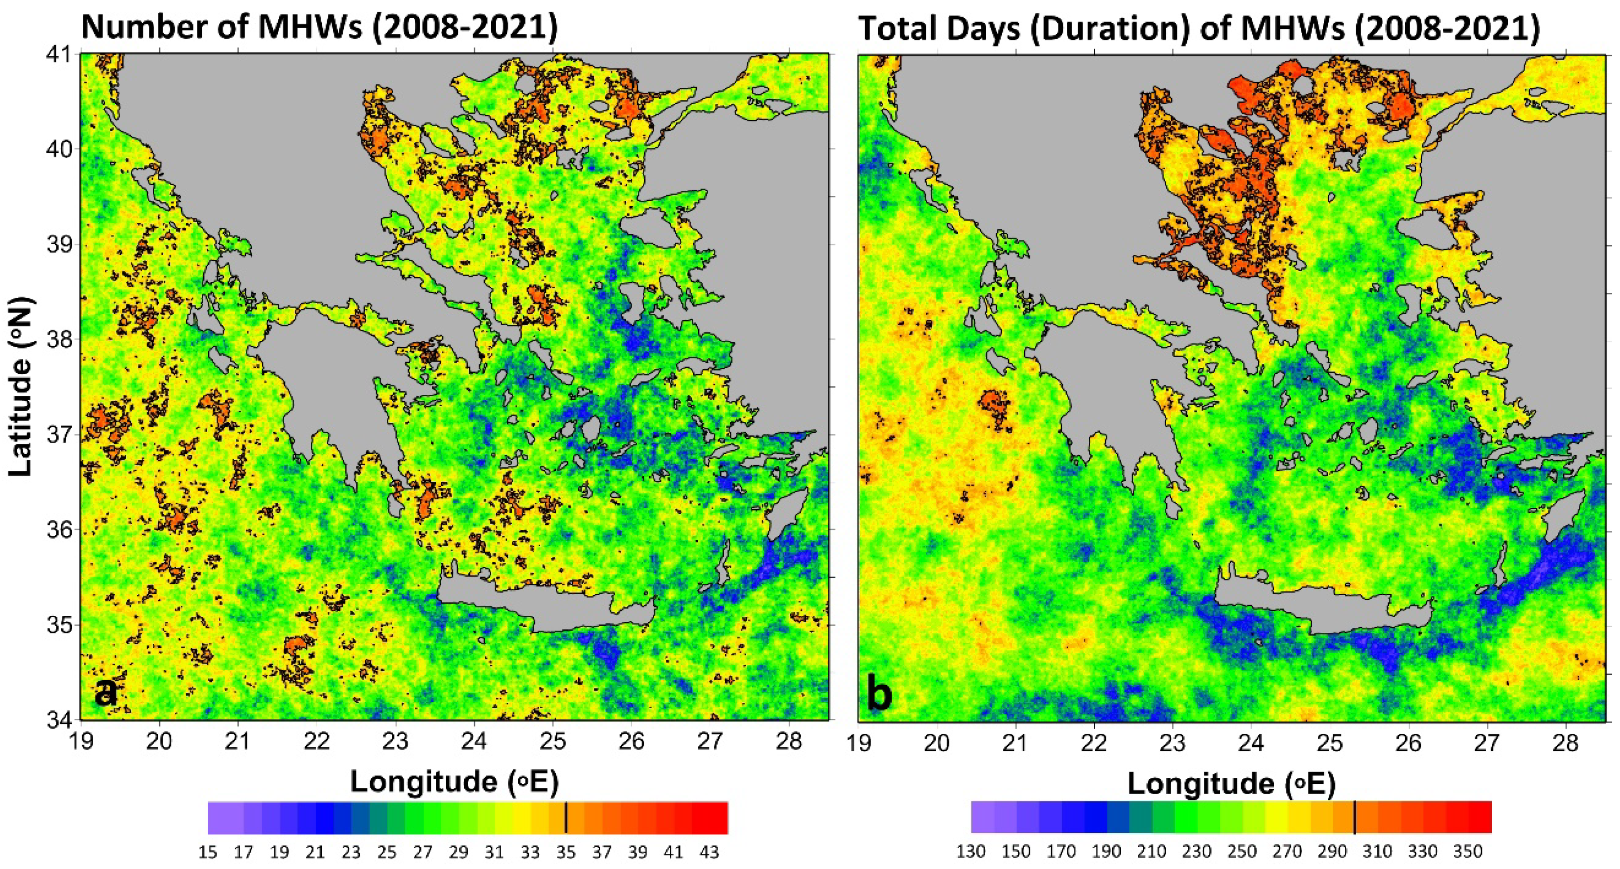
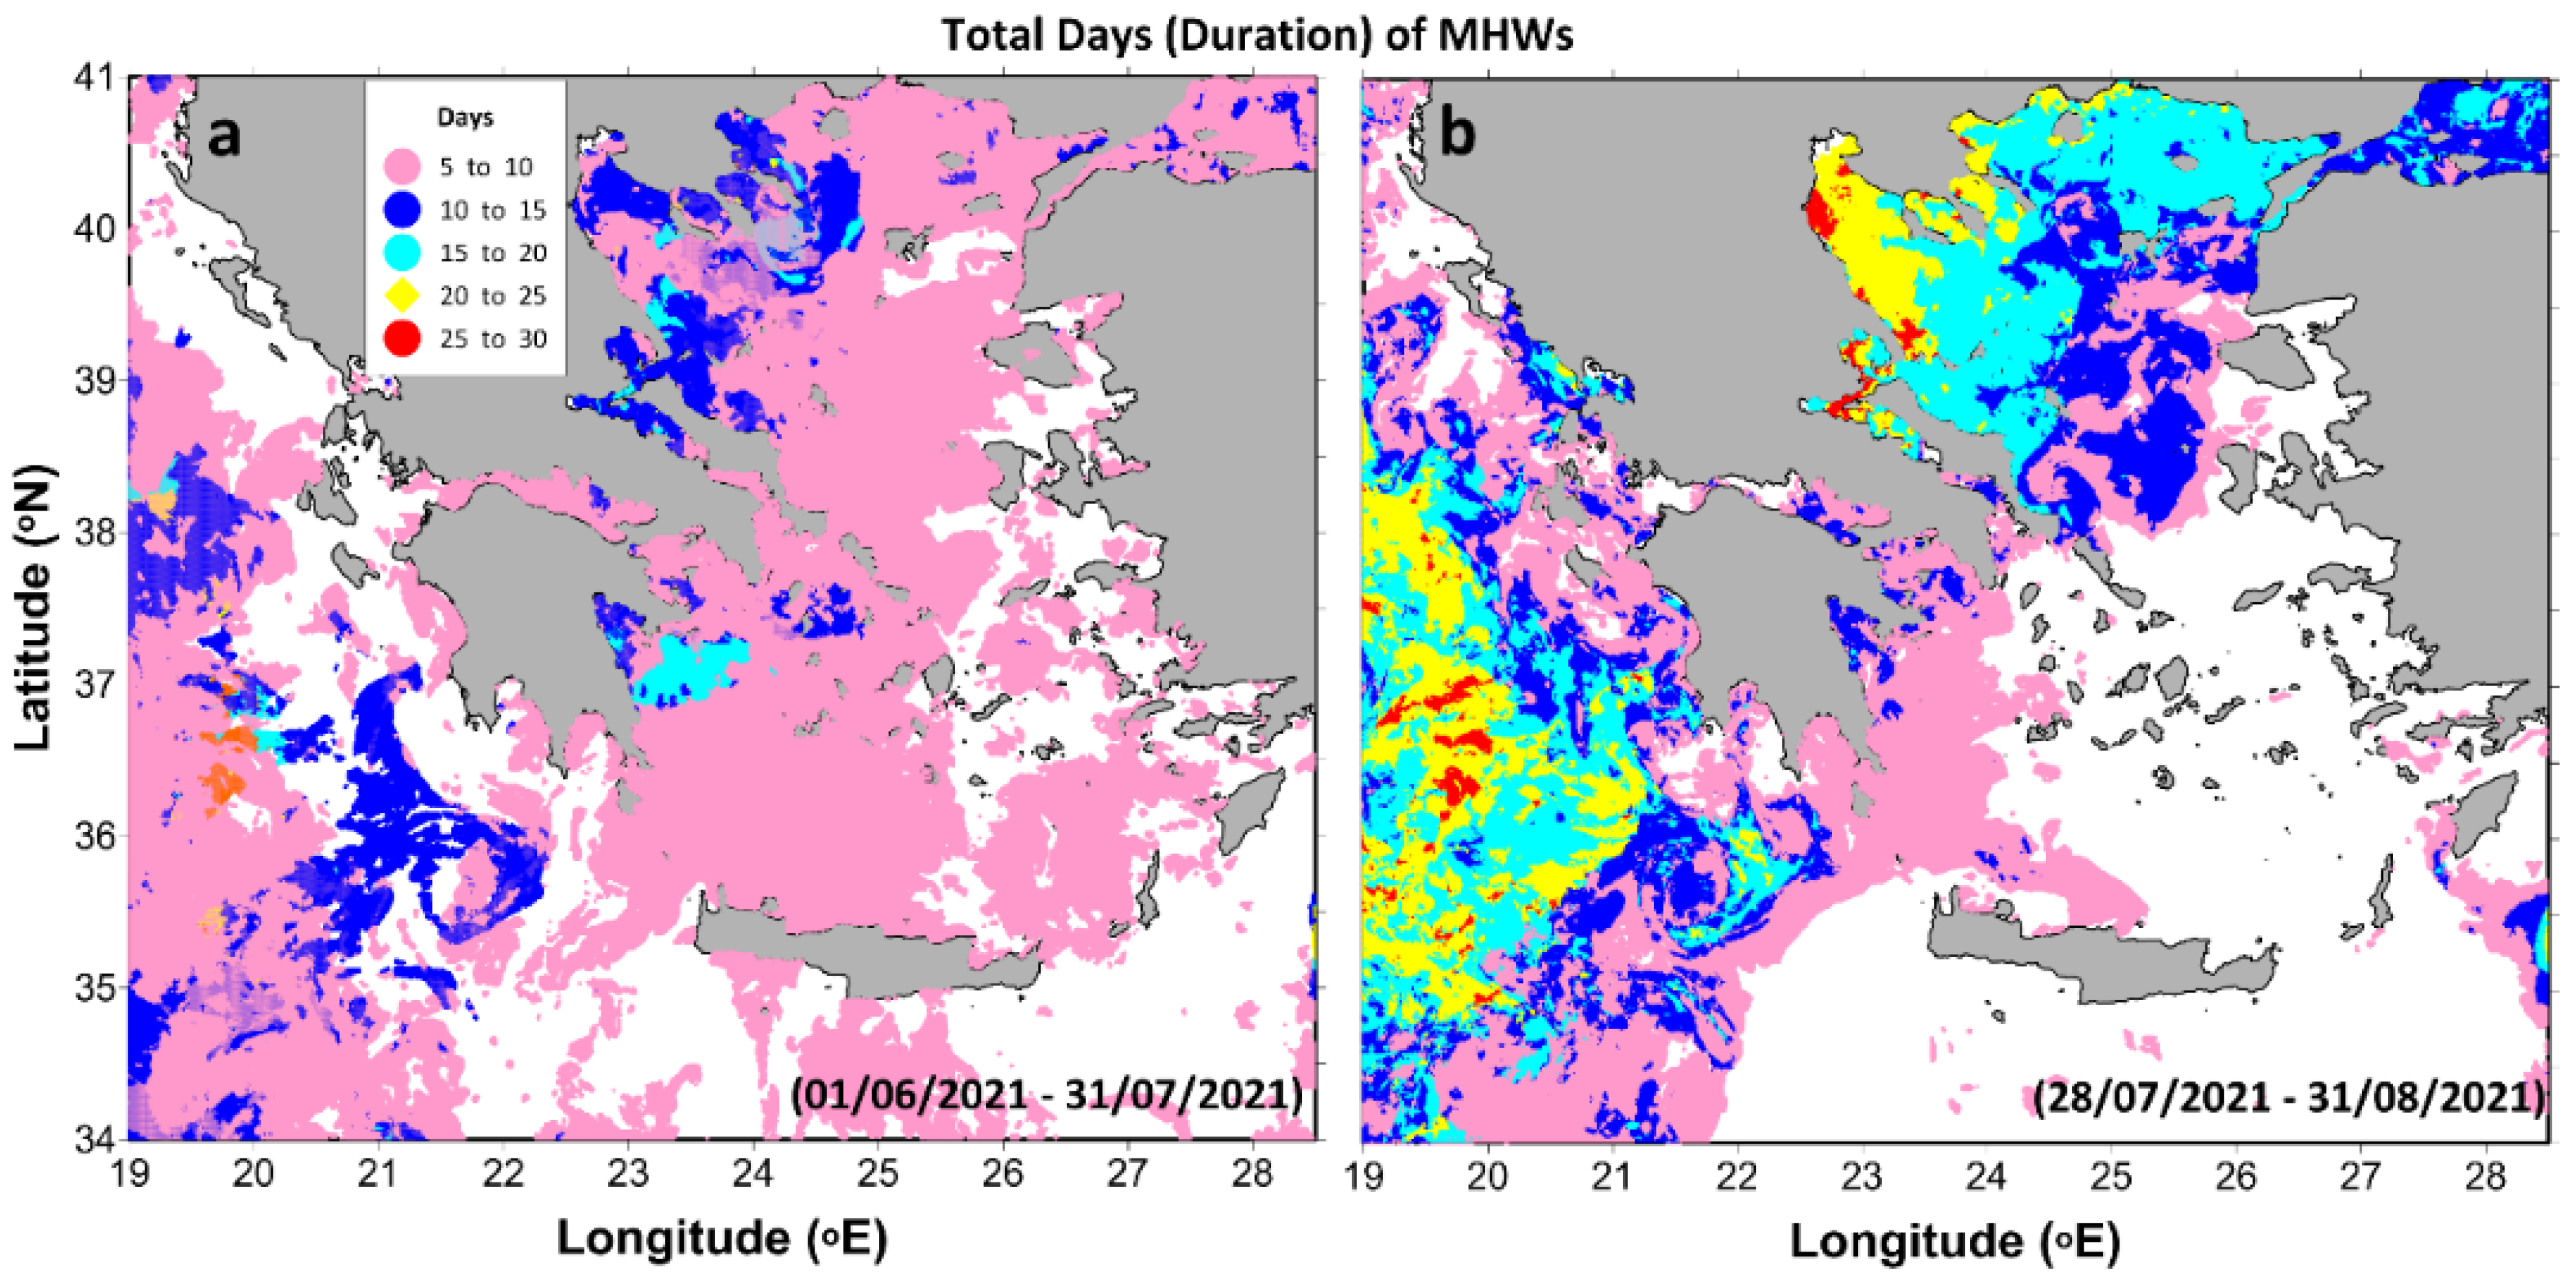
3.2. Formation of Marine Heat Waves
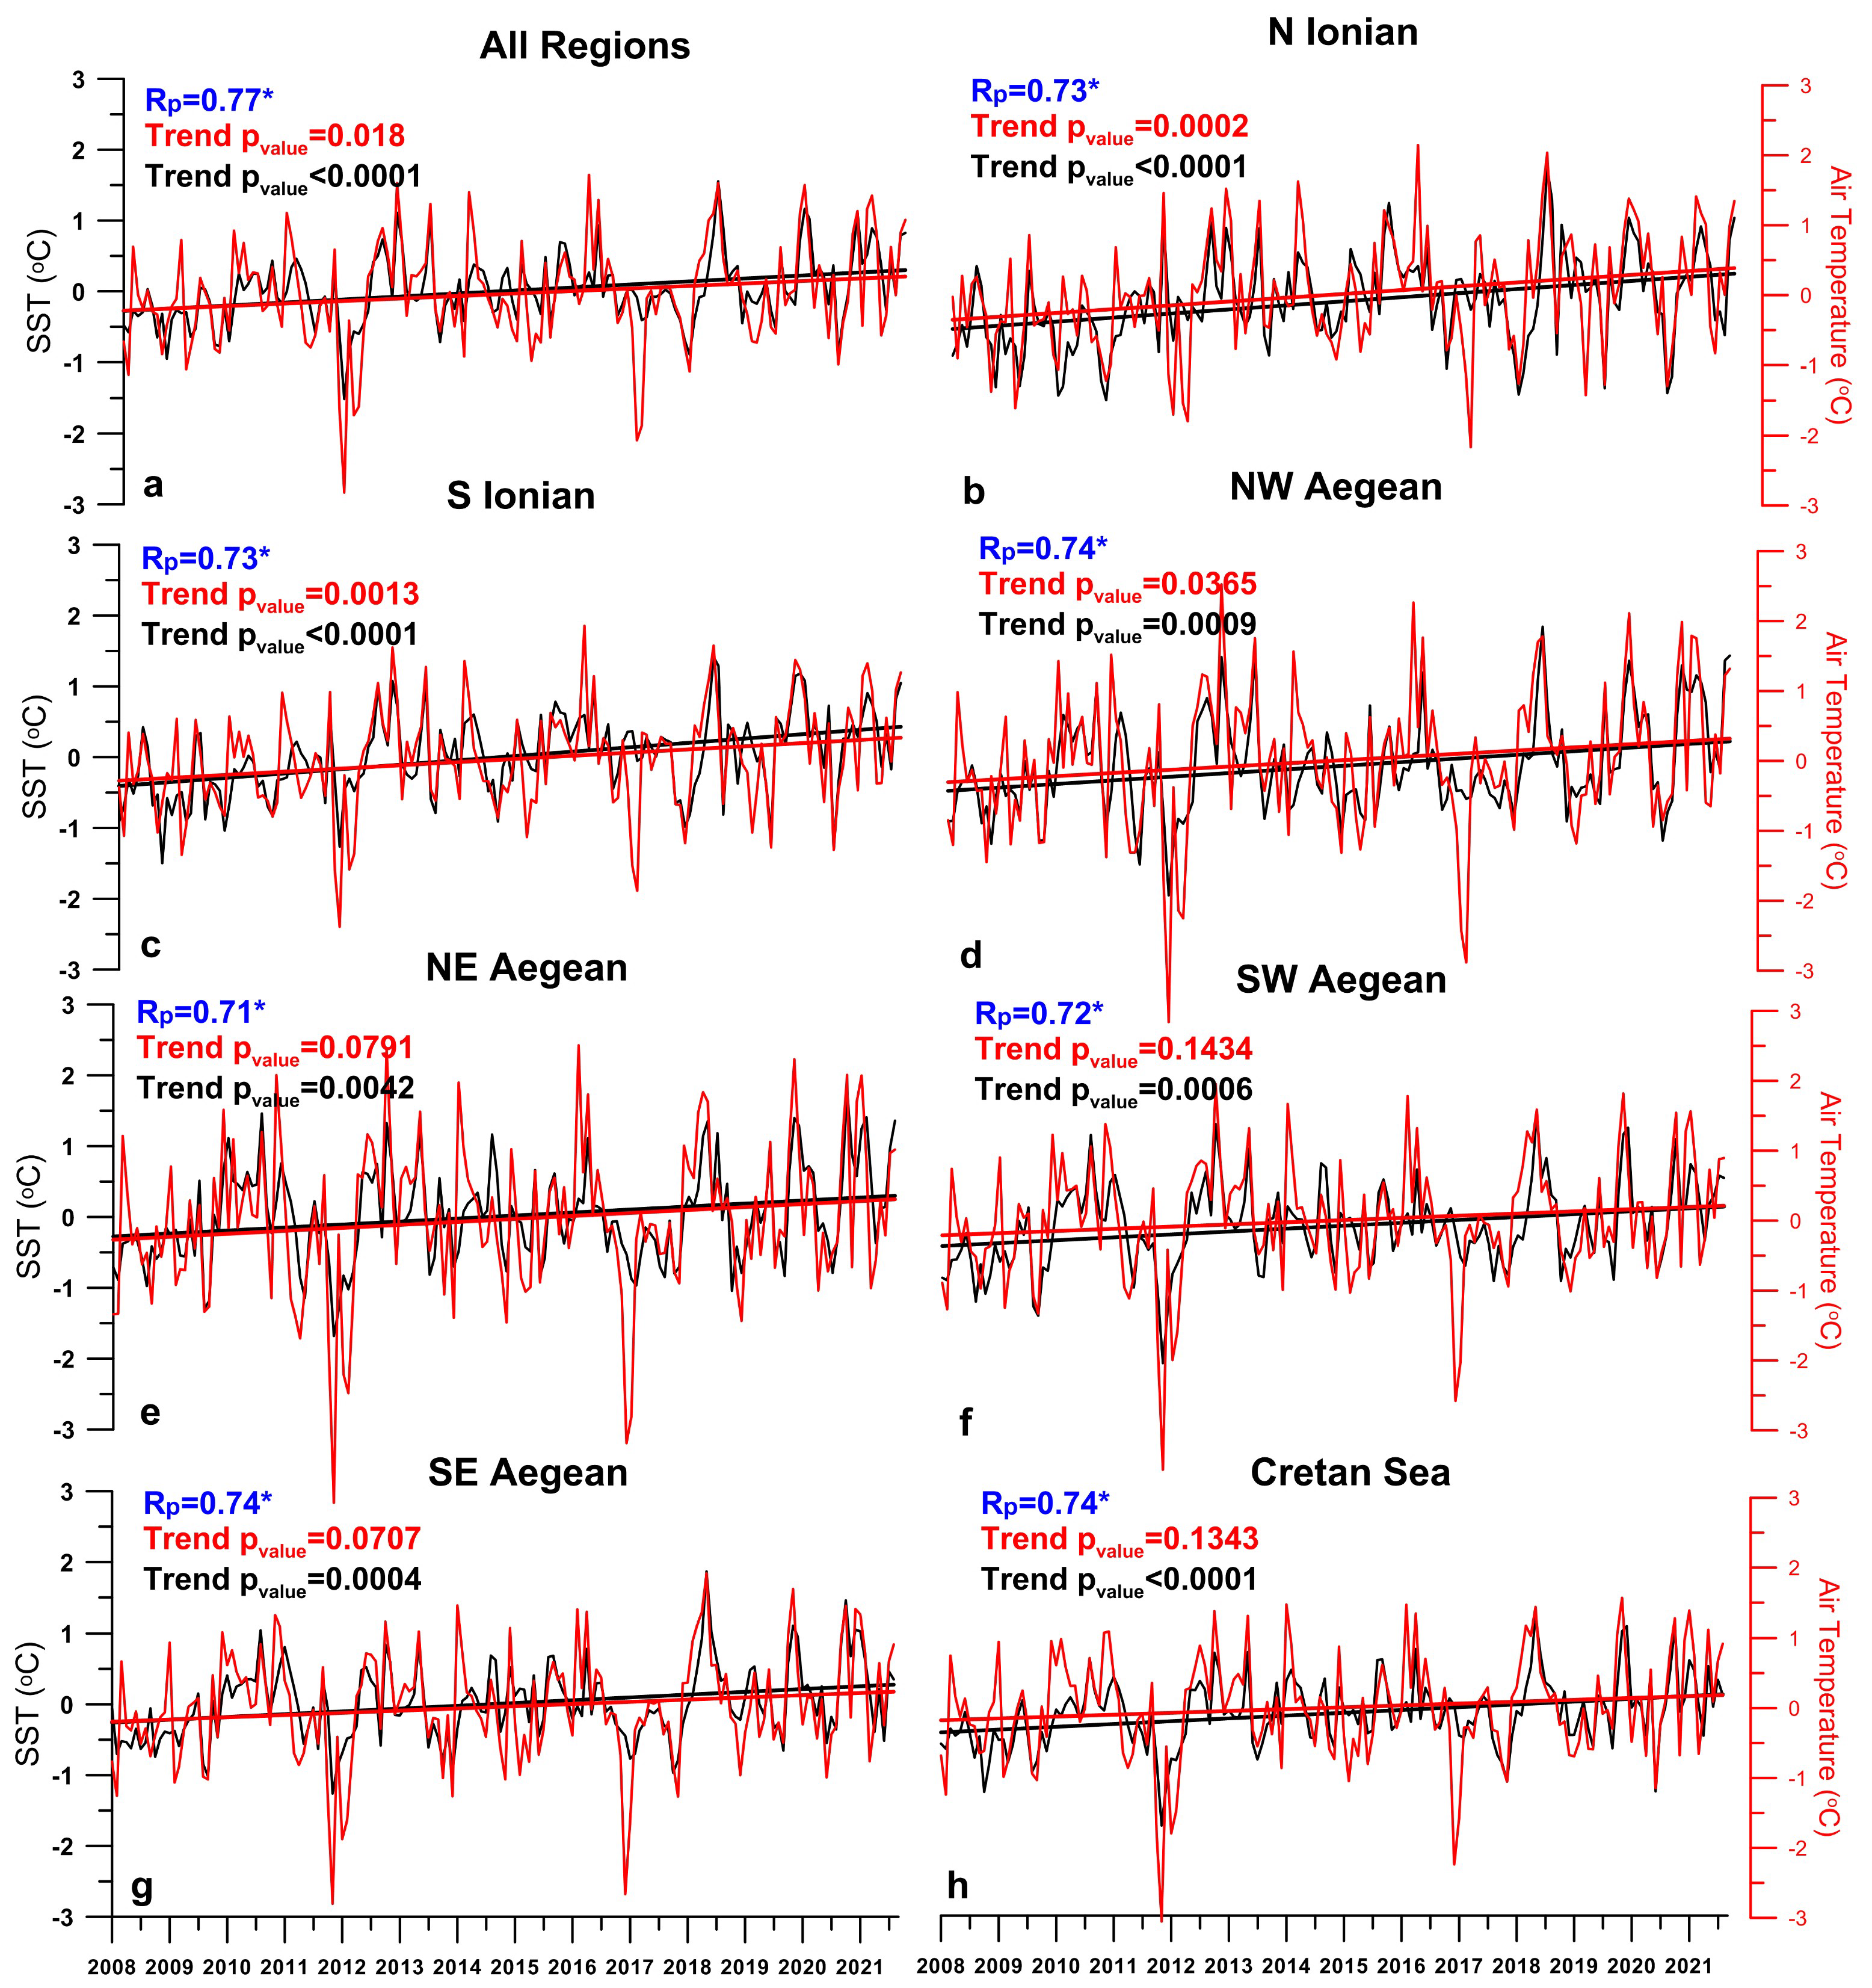
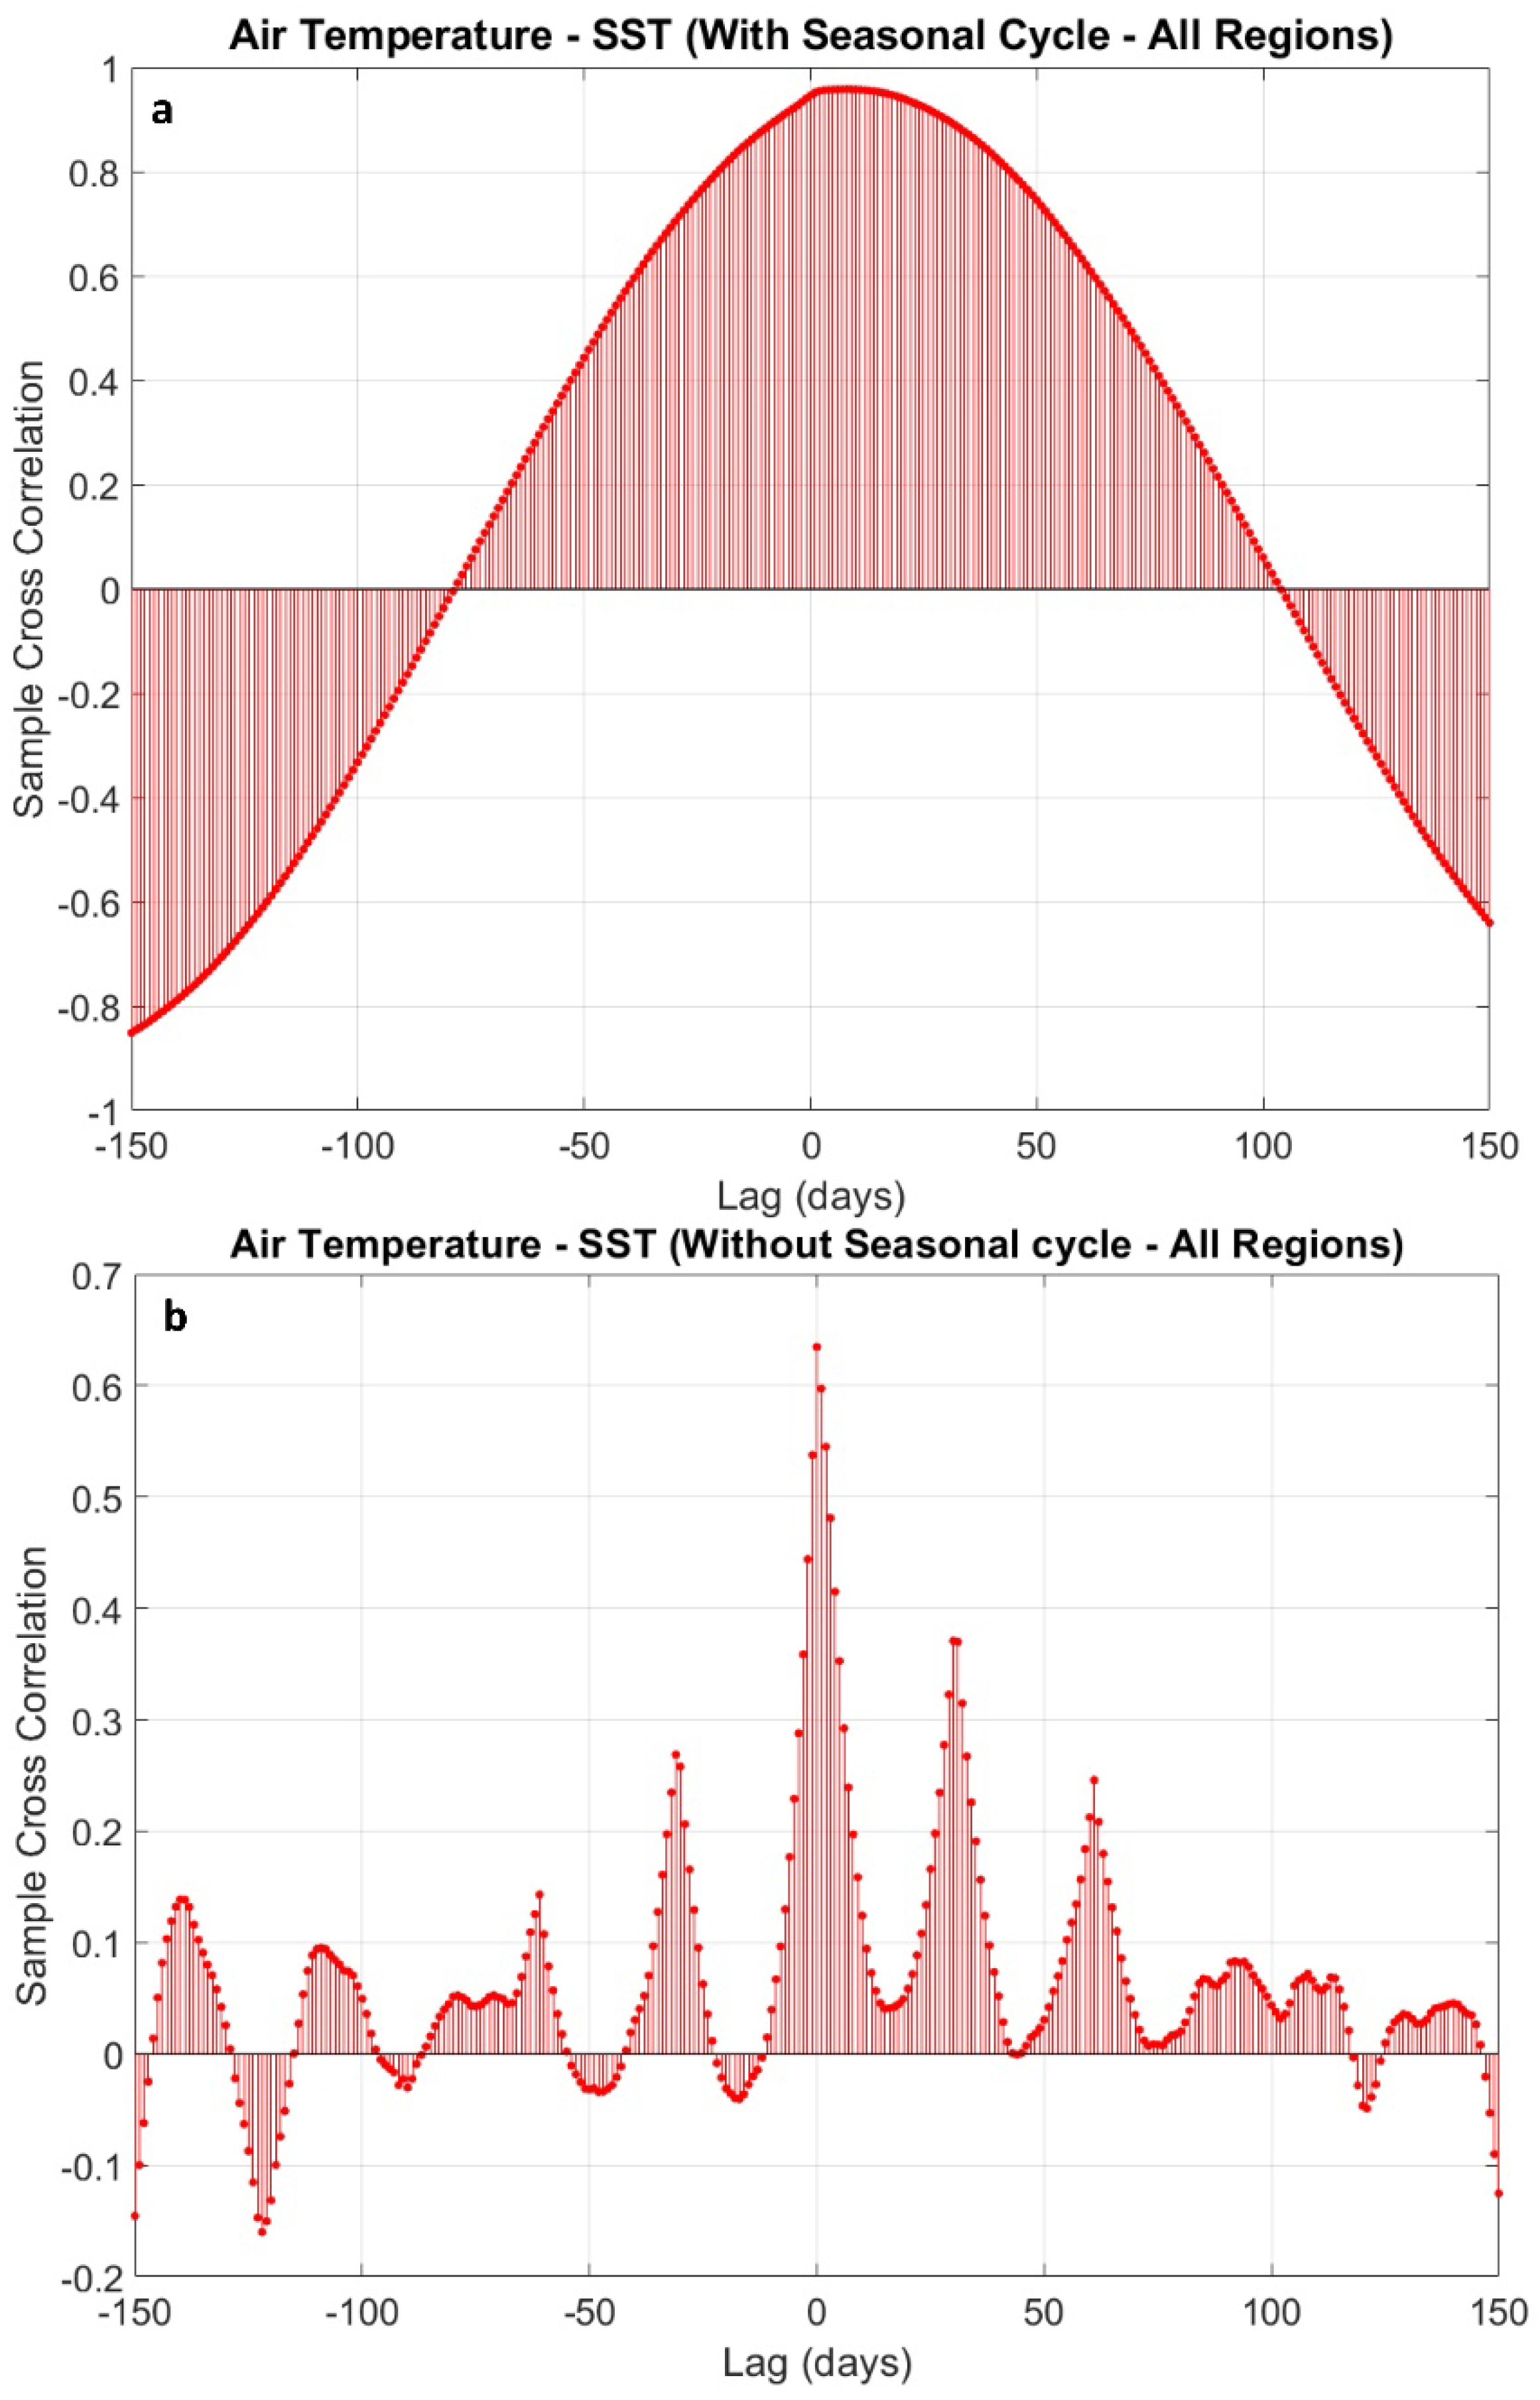
3.3. Effects of Atmospheric Conditions on SST Variability
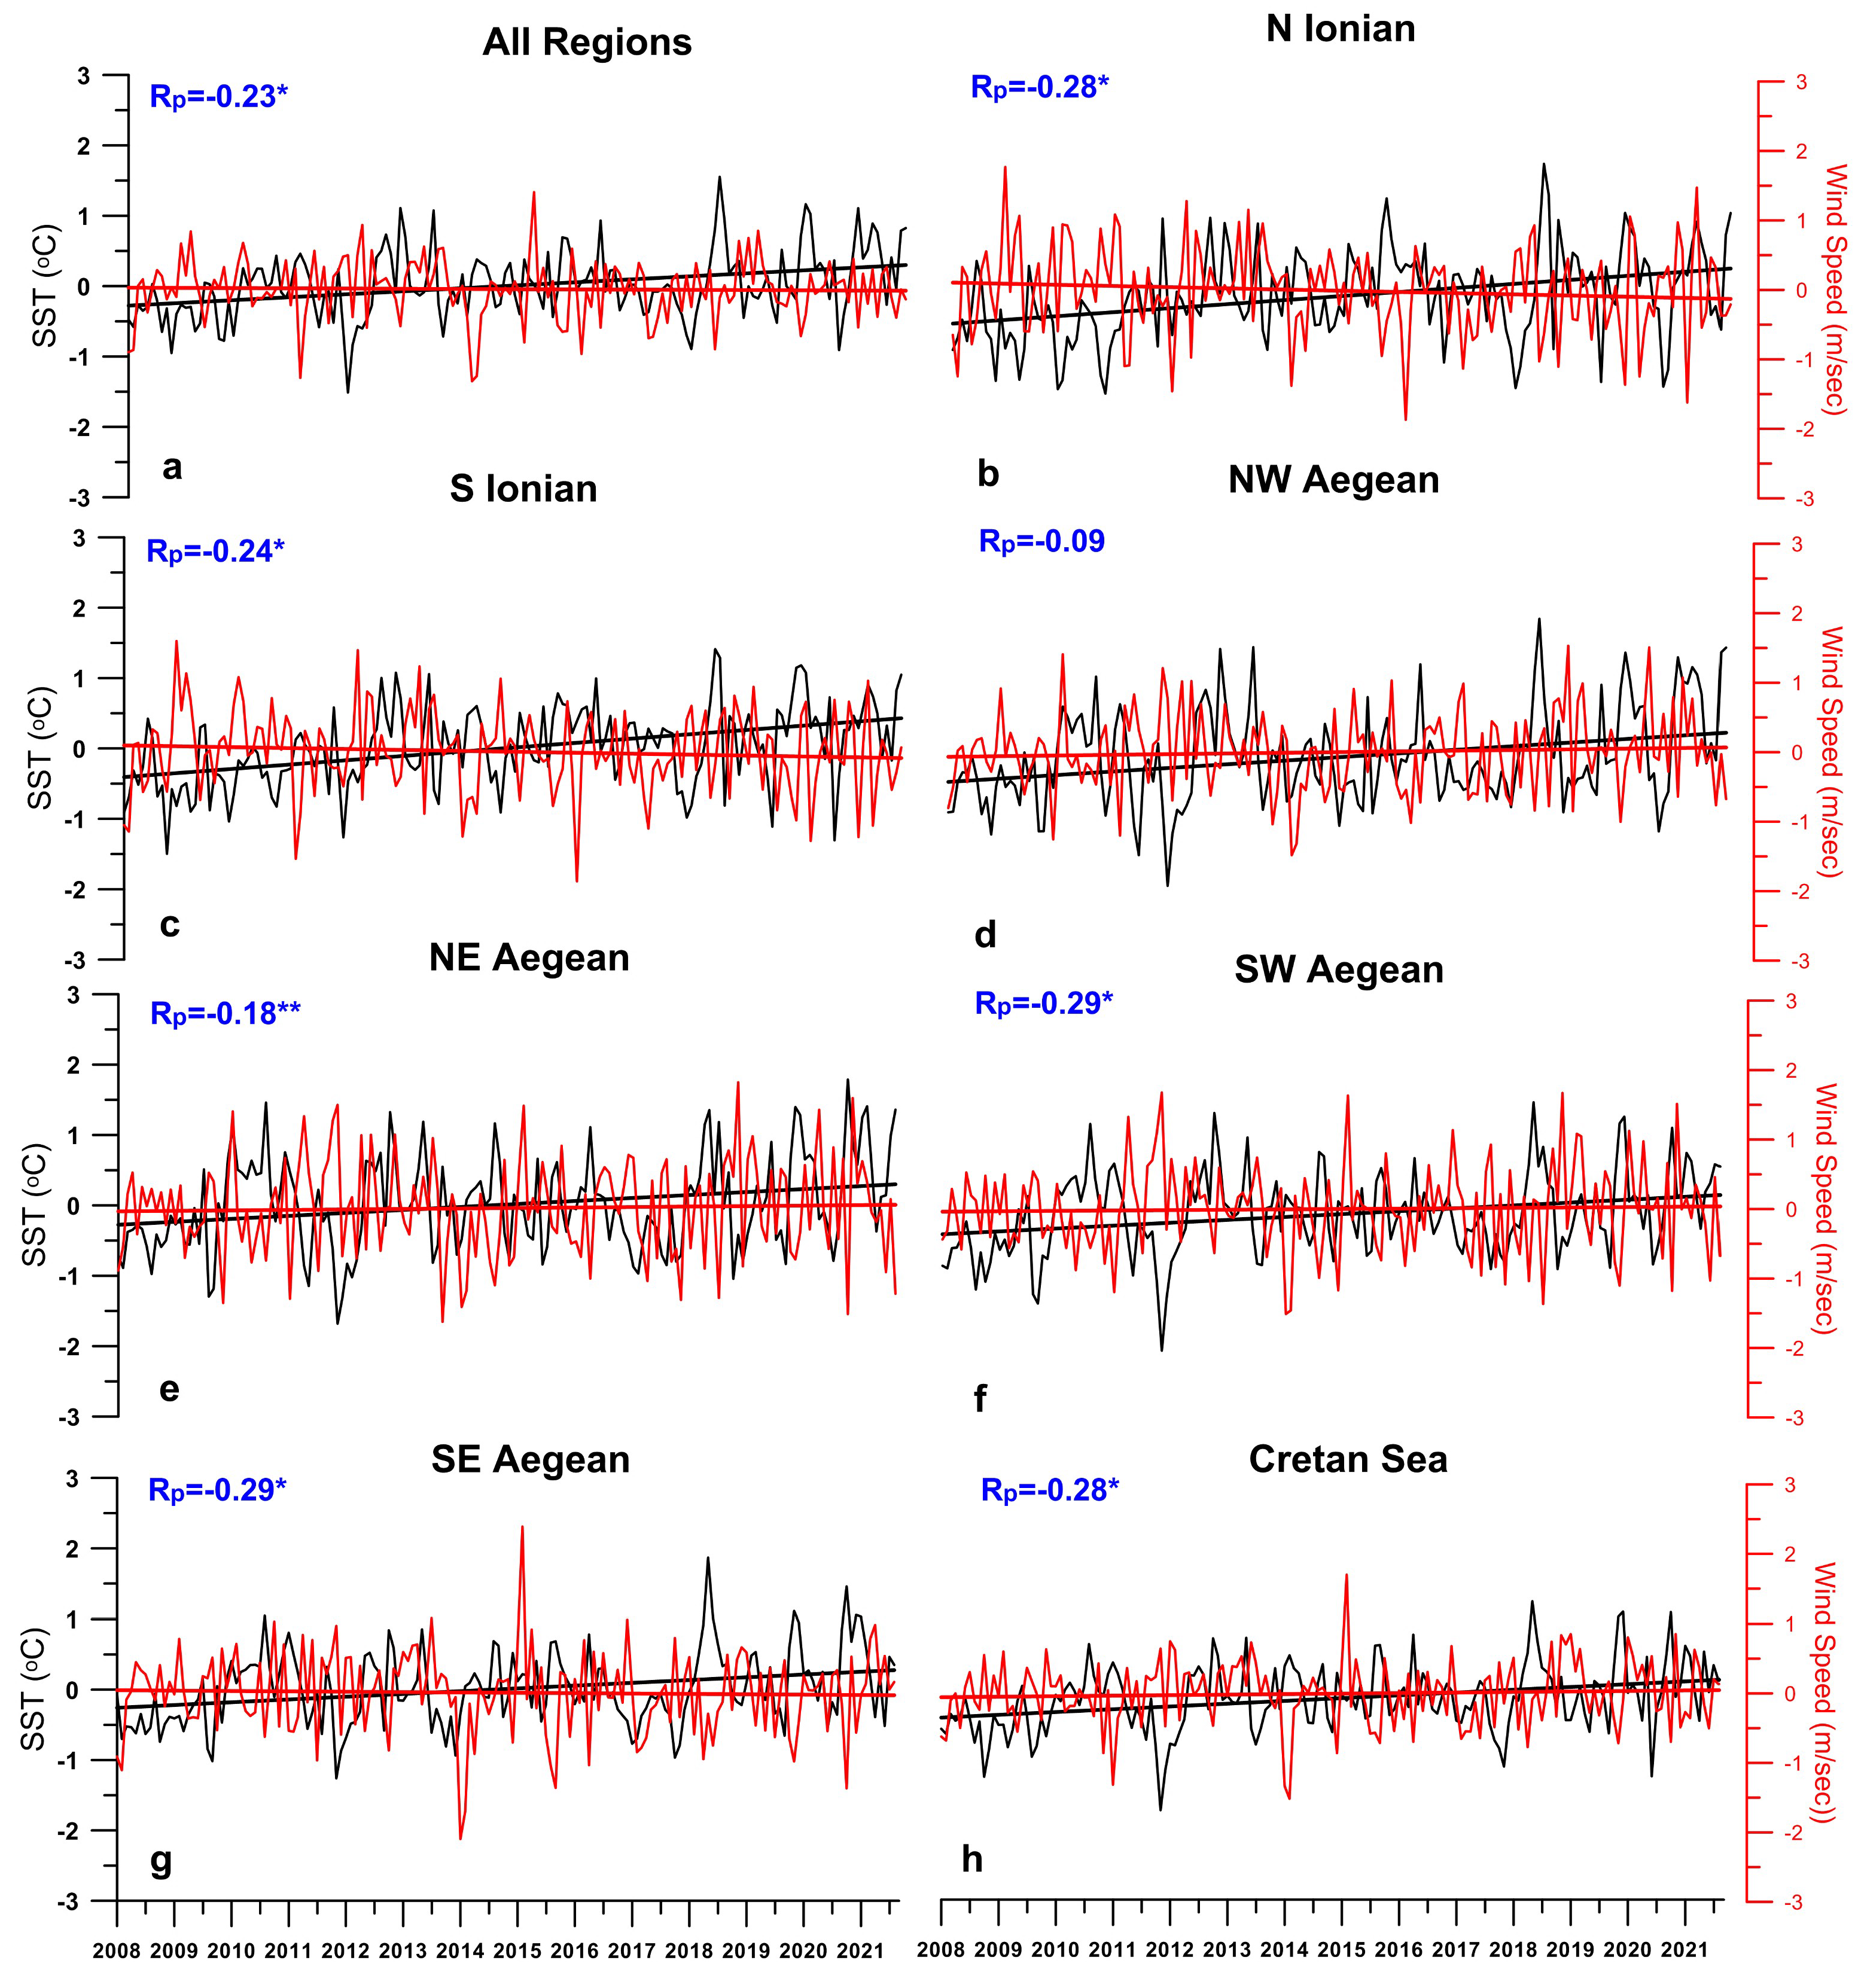
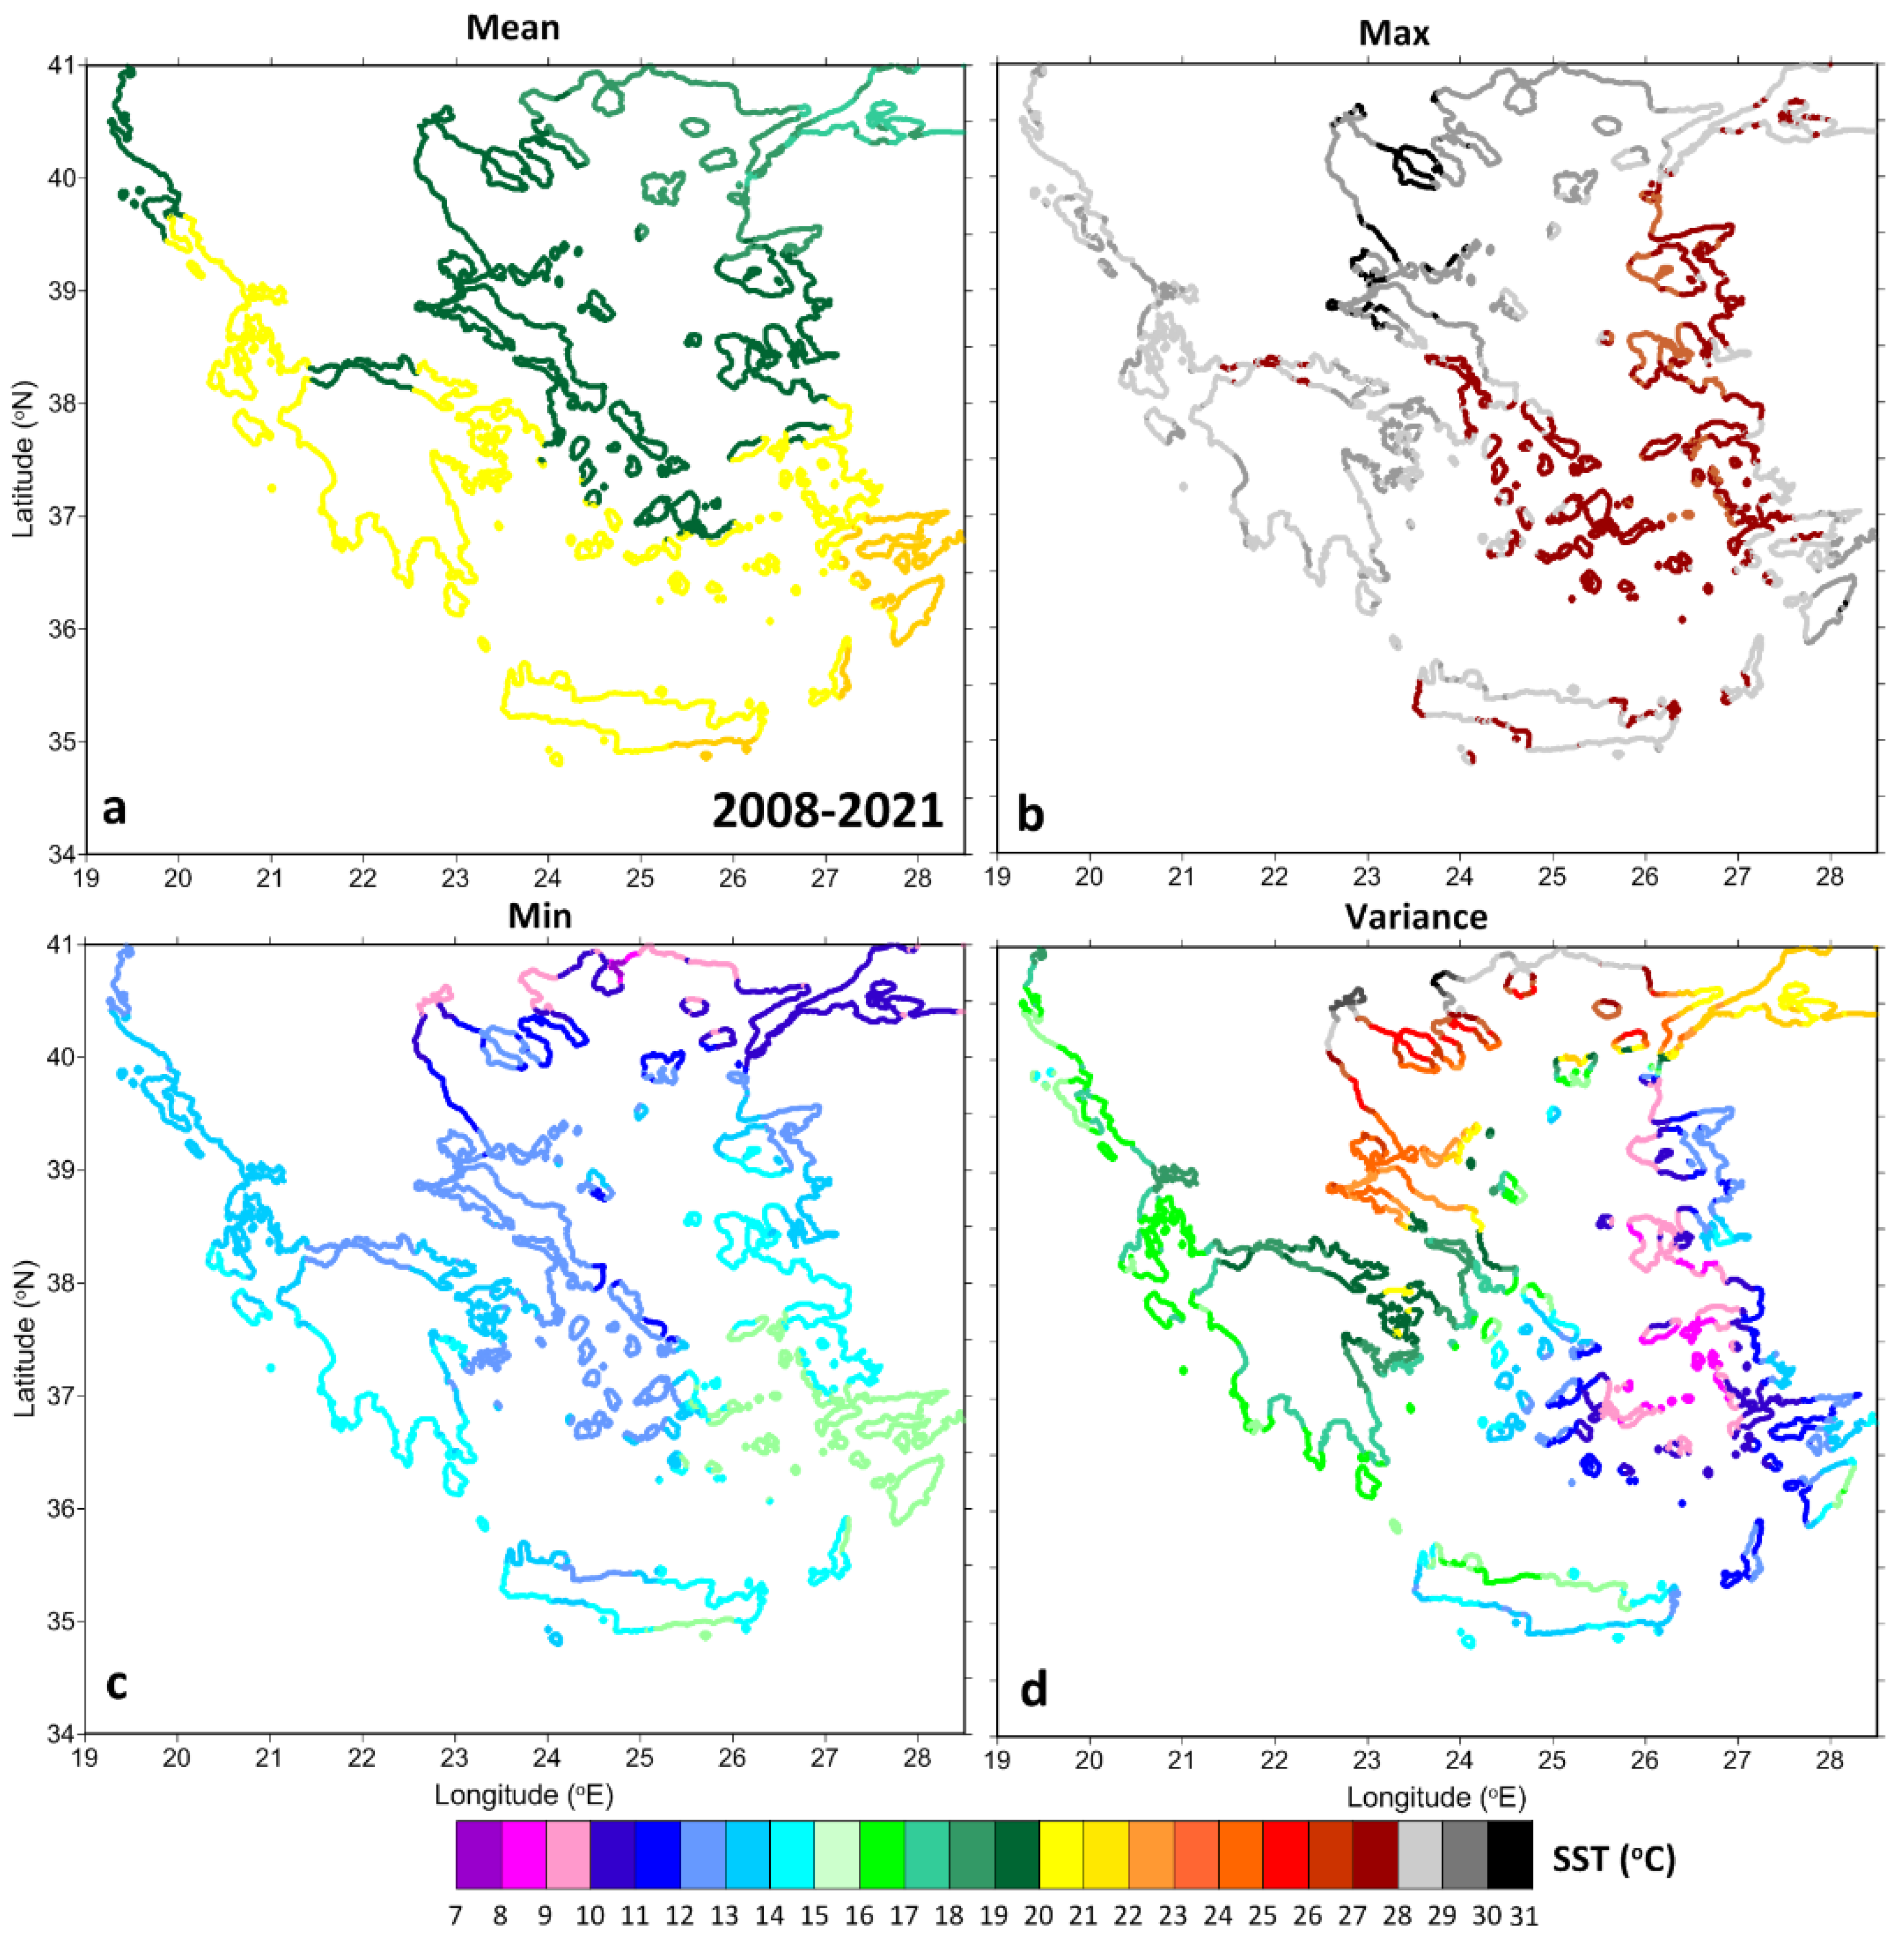
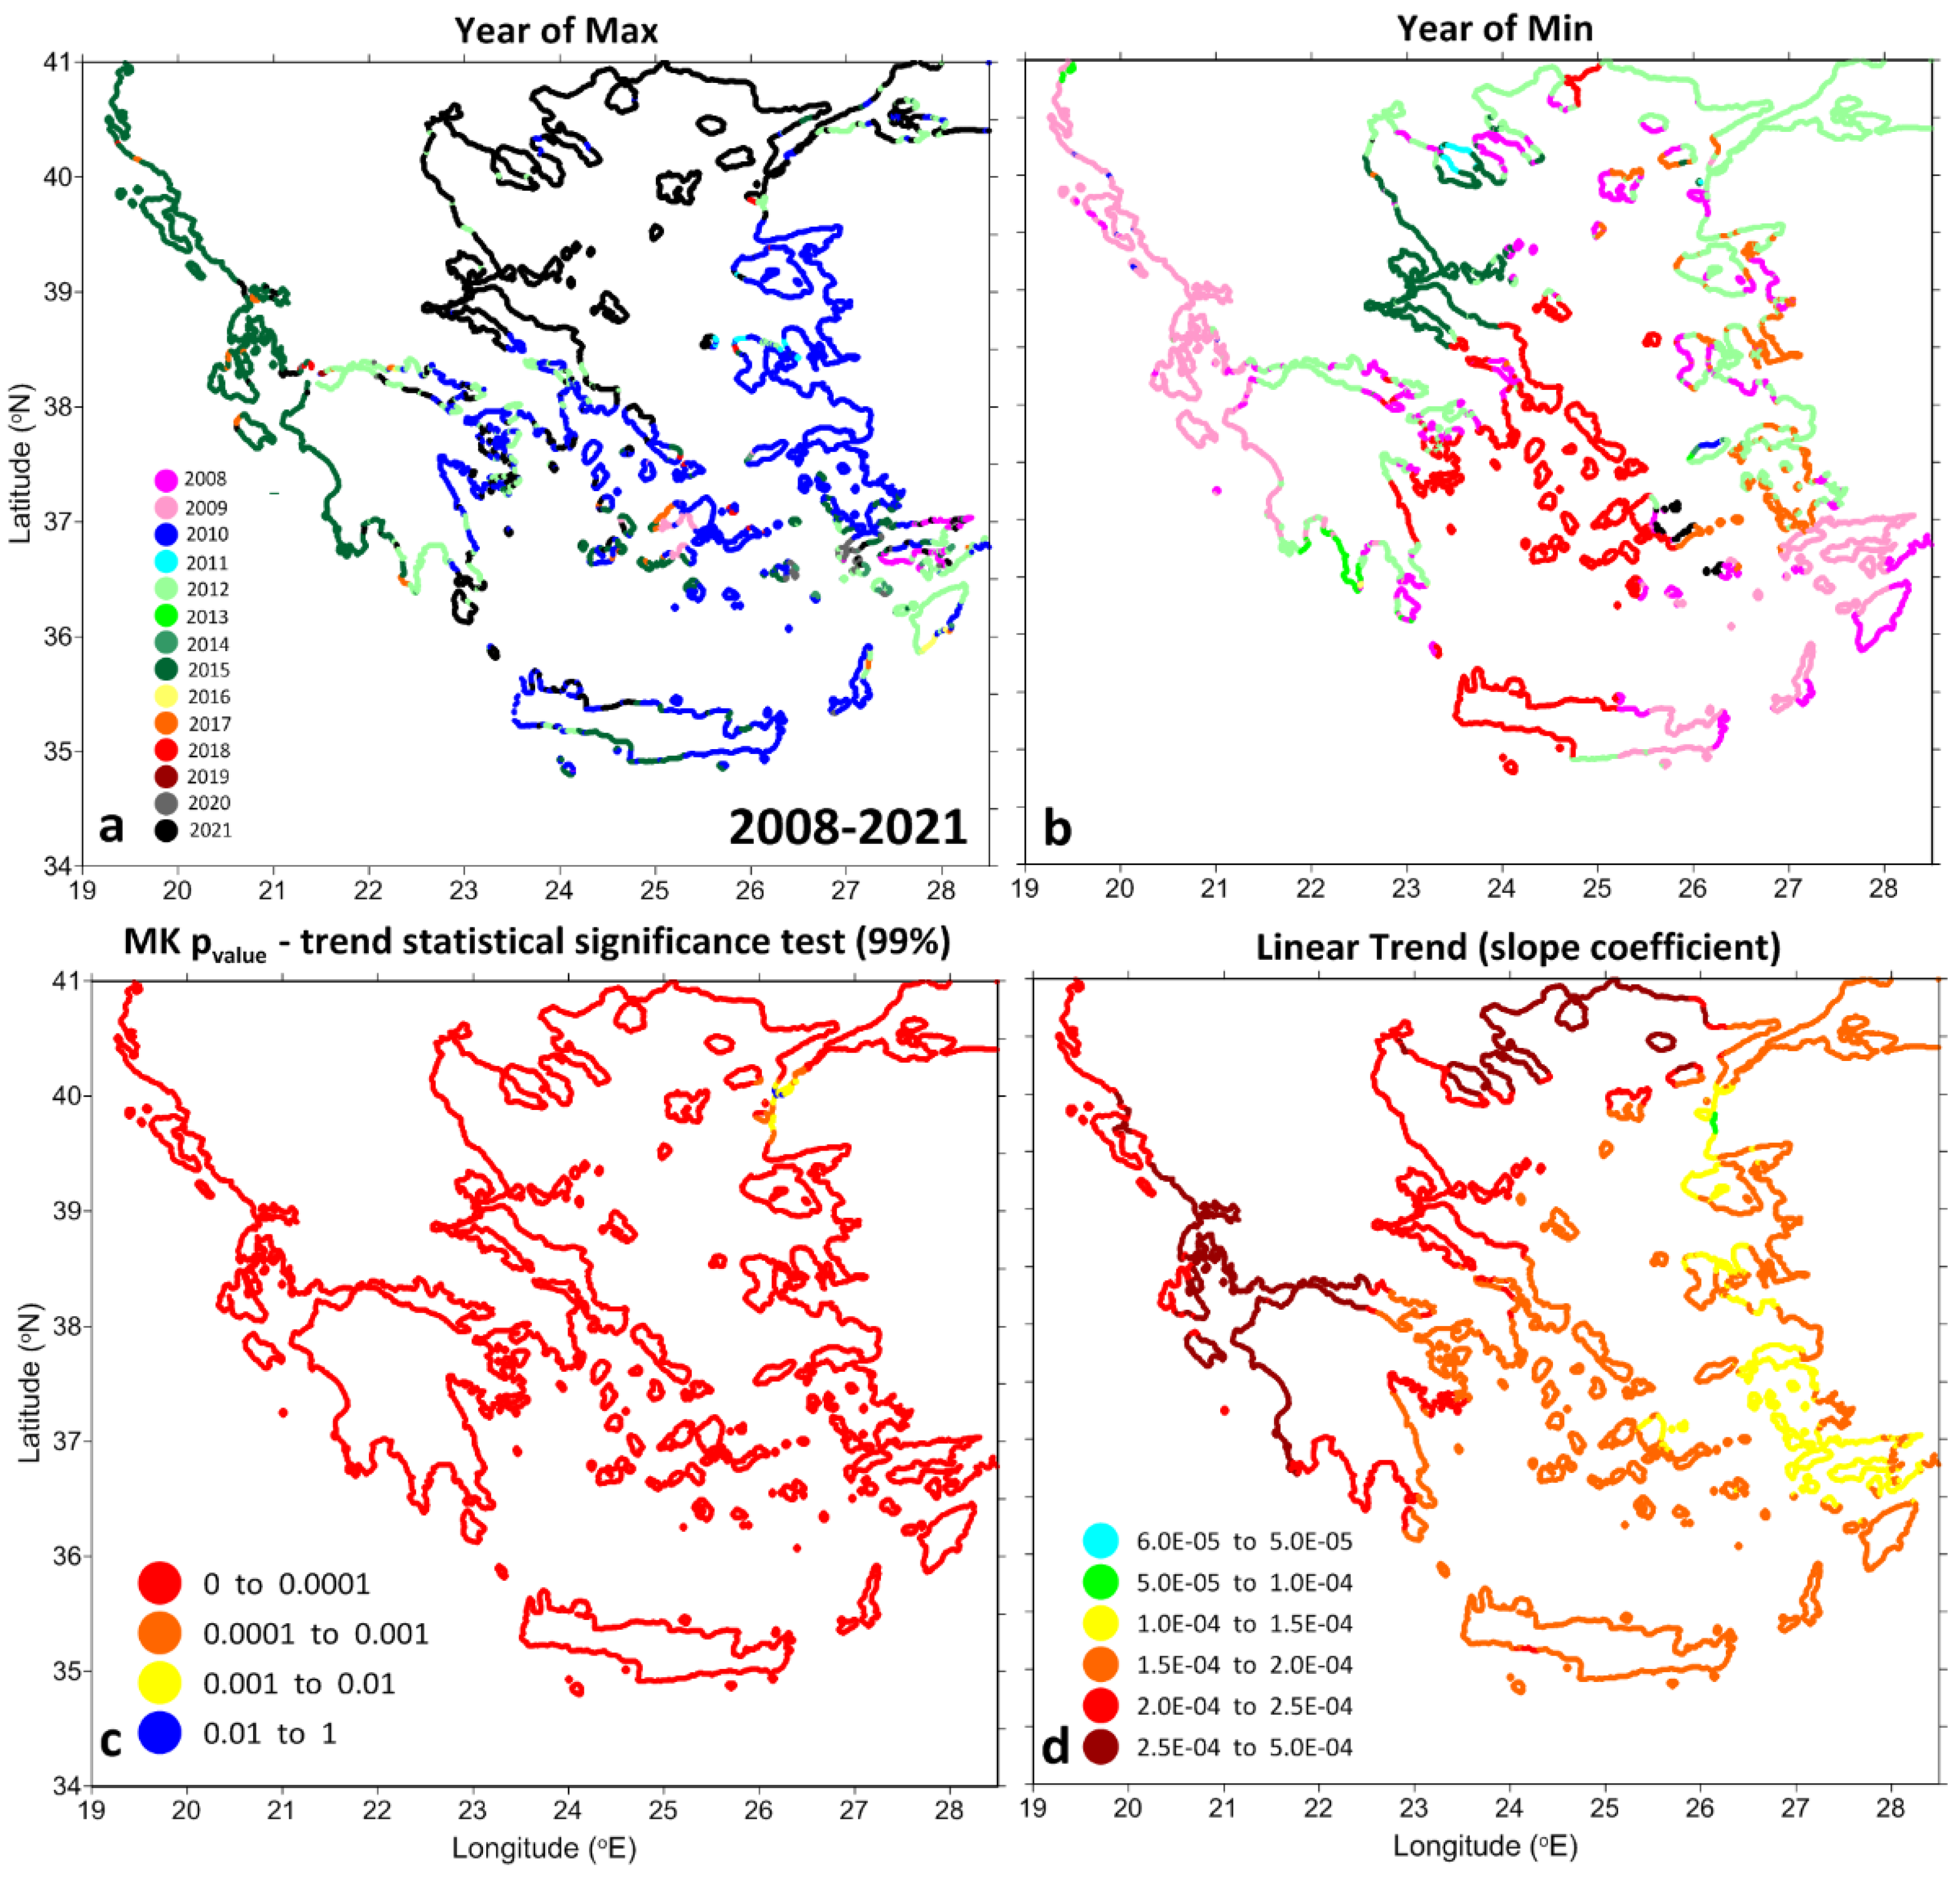
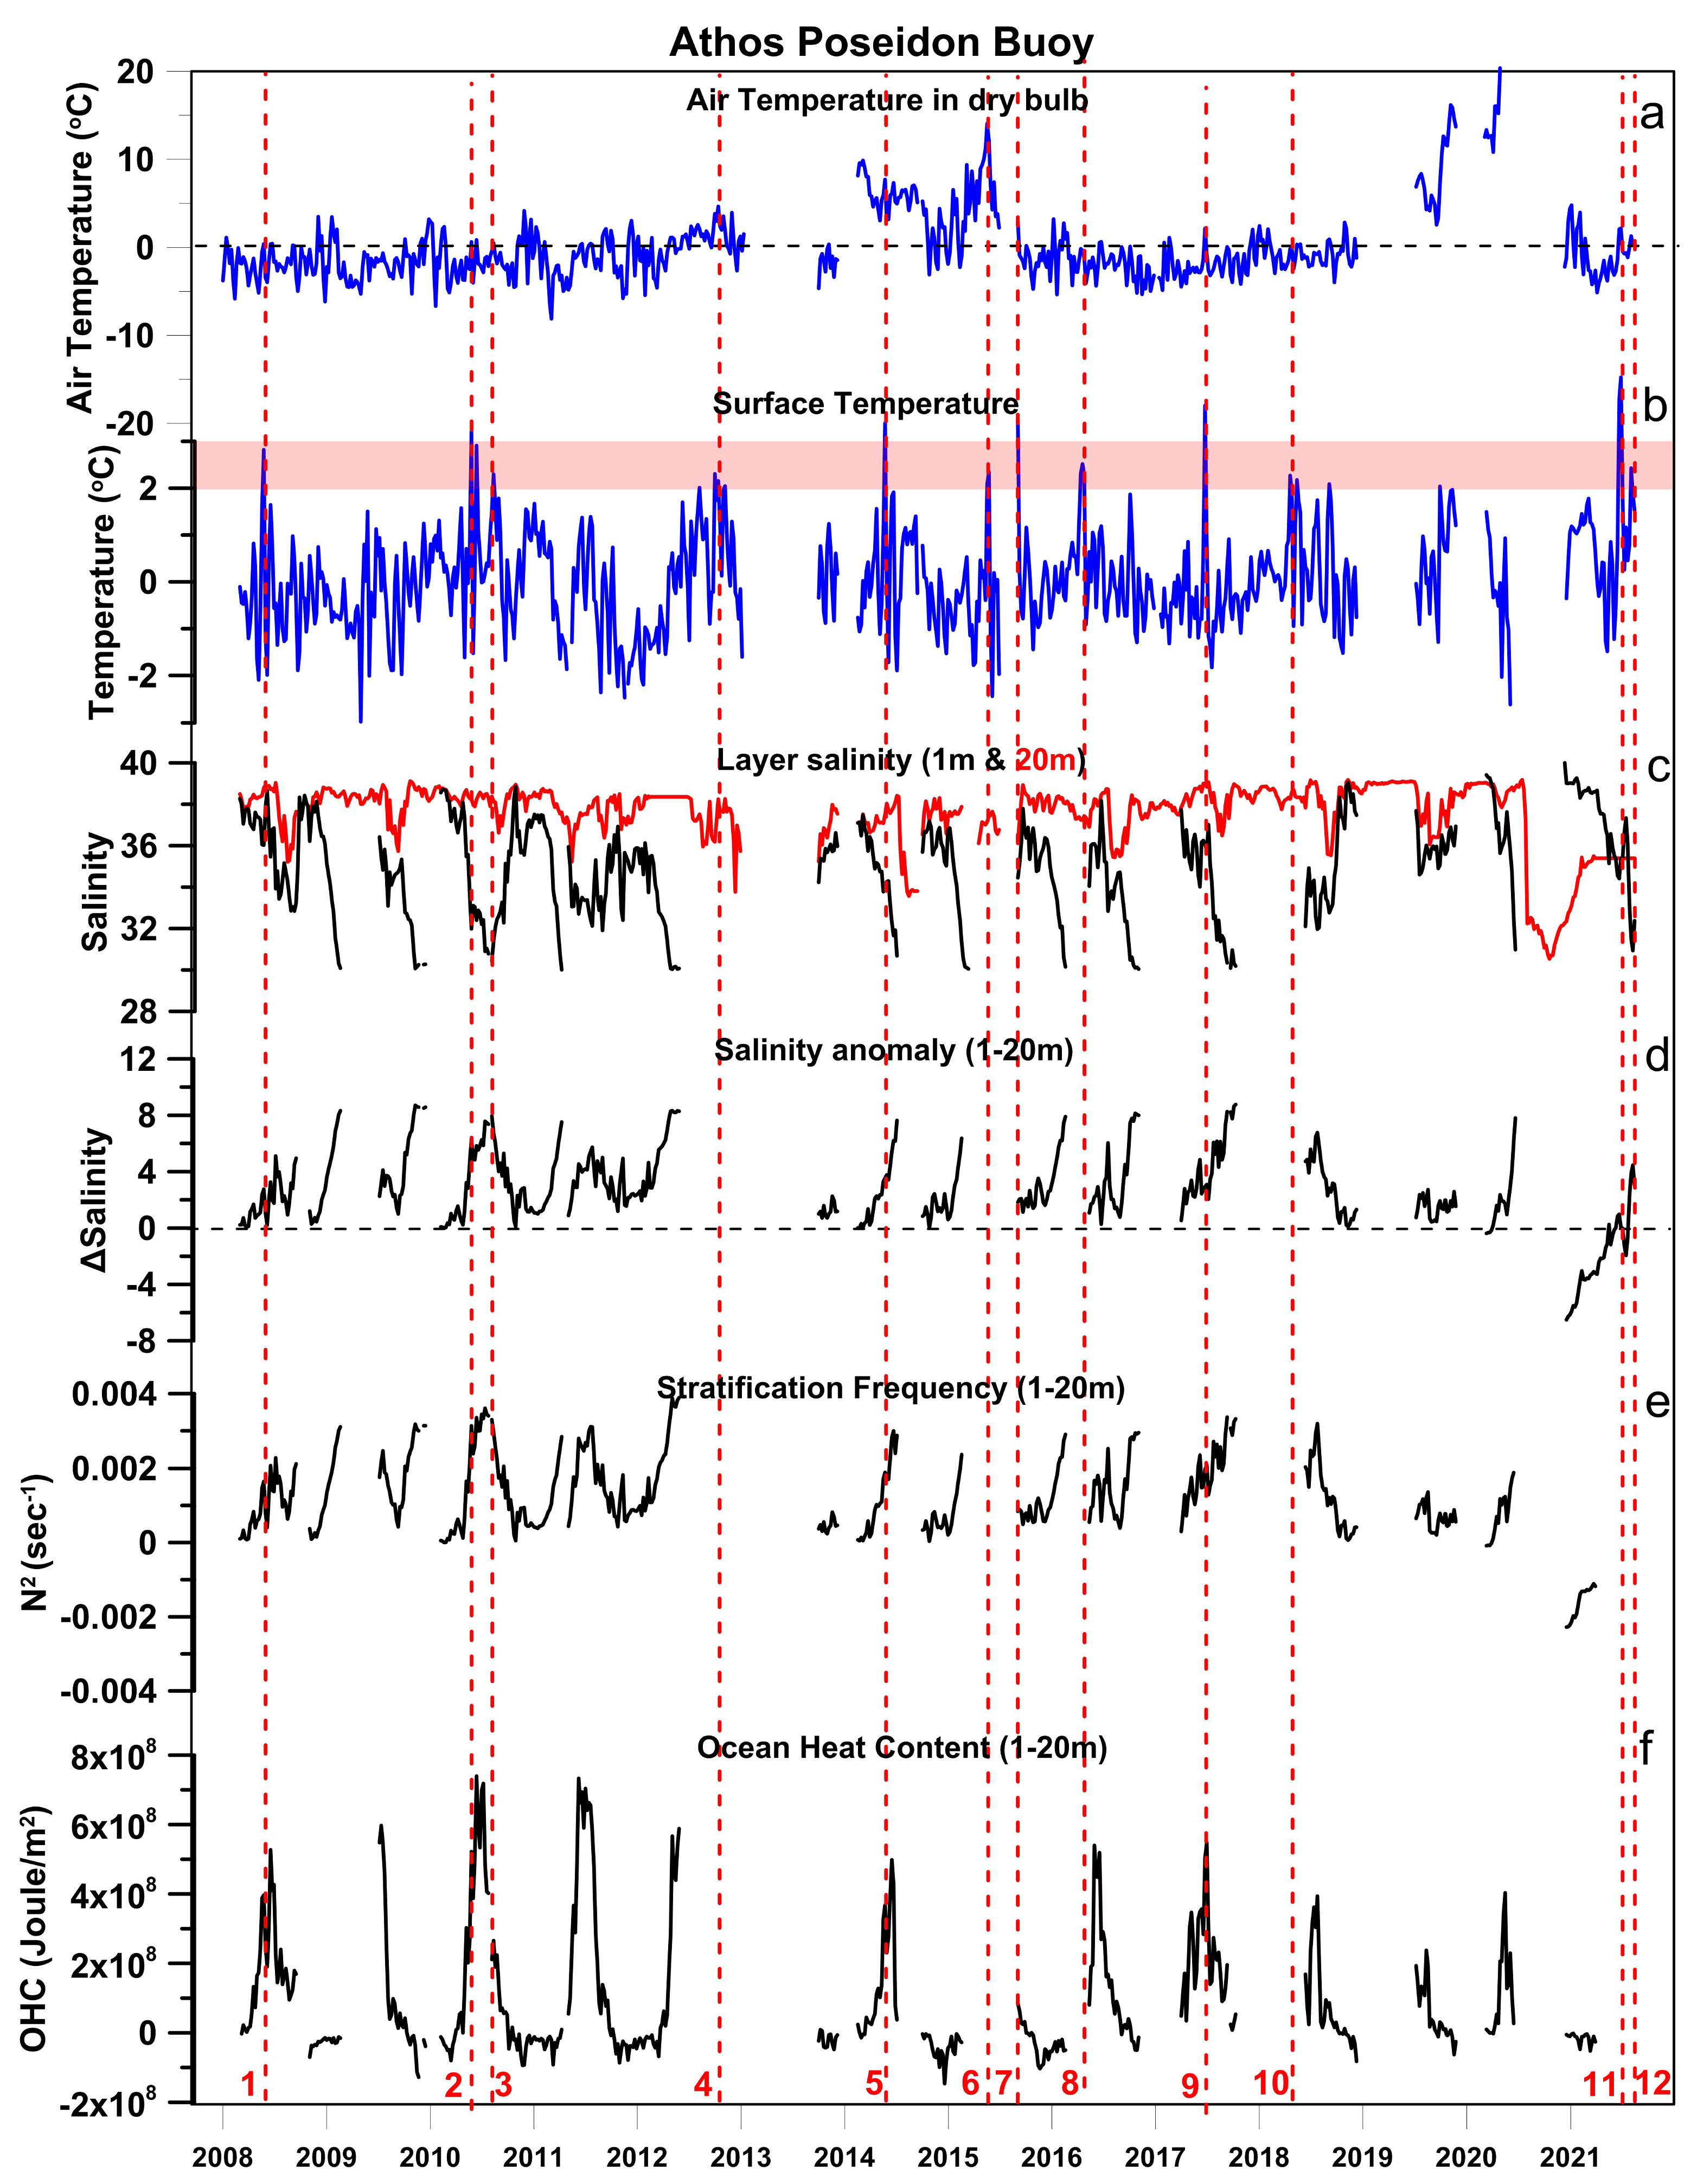
3.4. Variability and Trends in the Coastal Waters
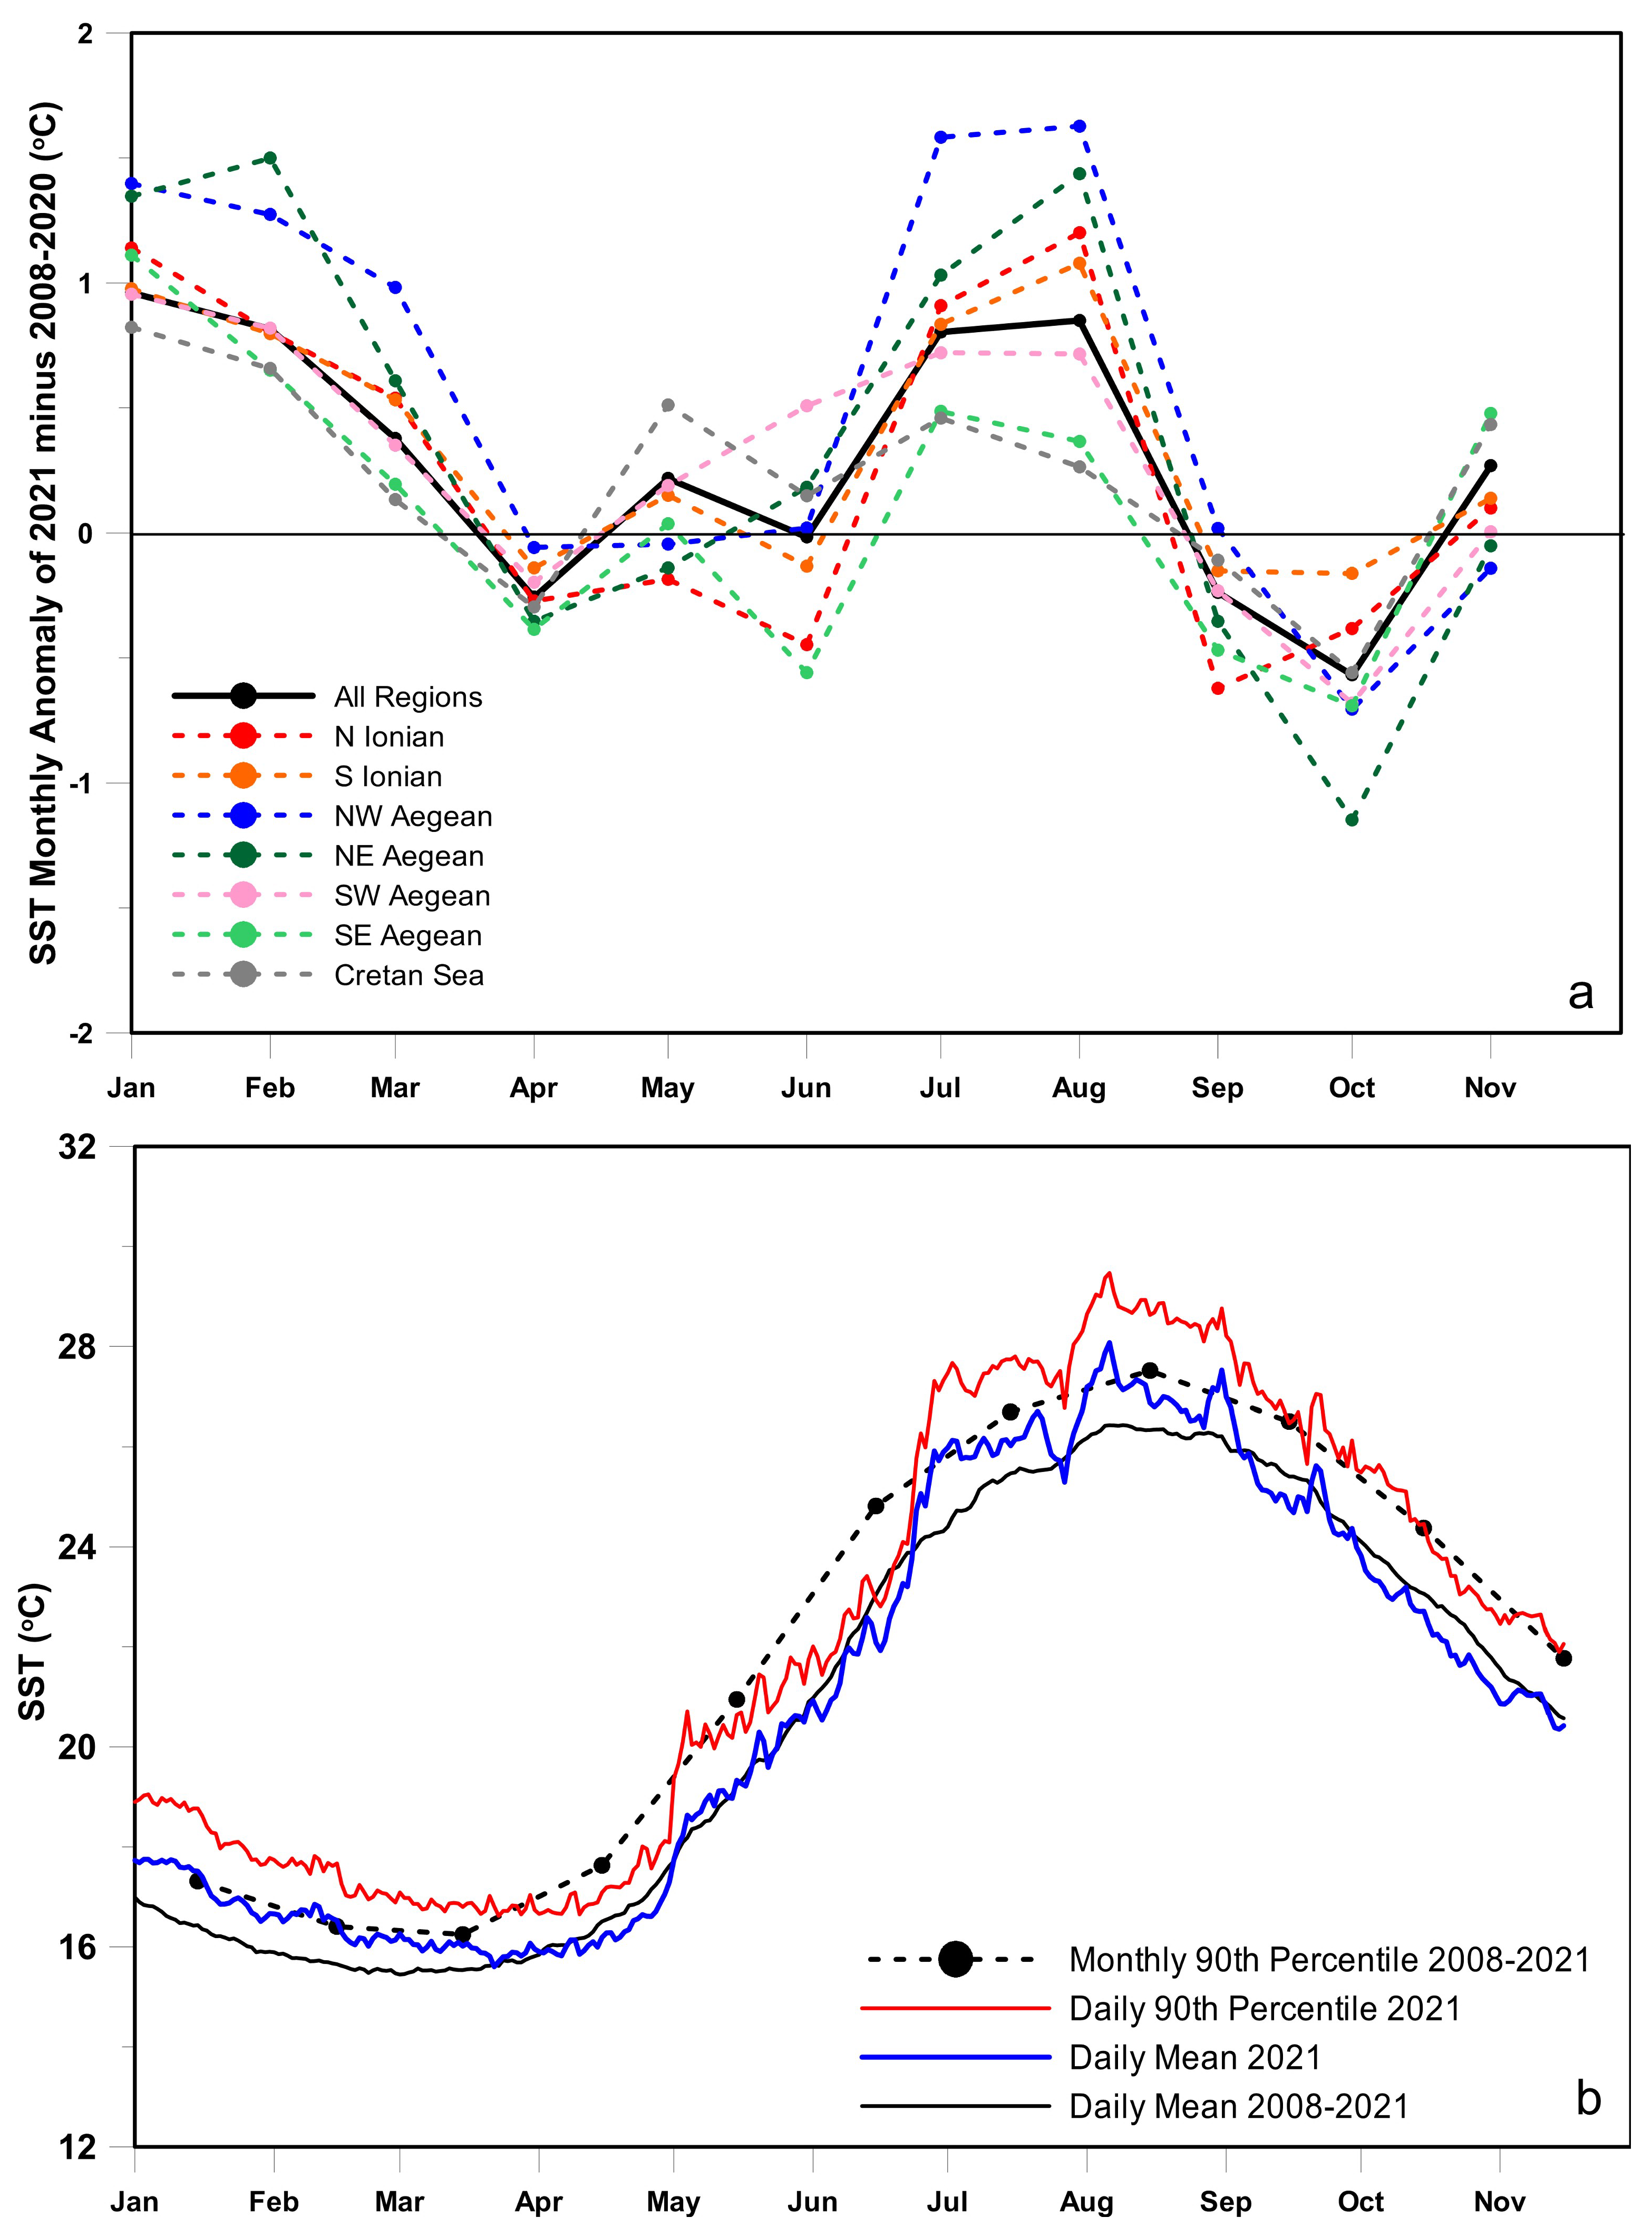
3.5. The Warm Year of 2021
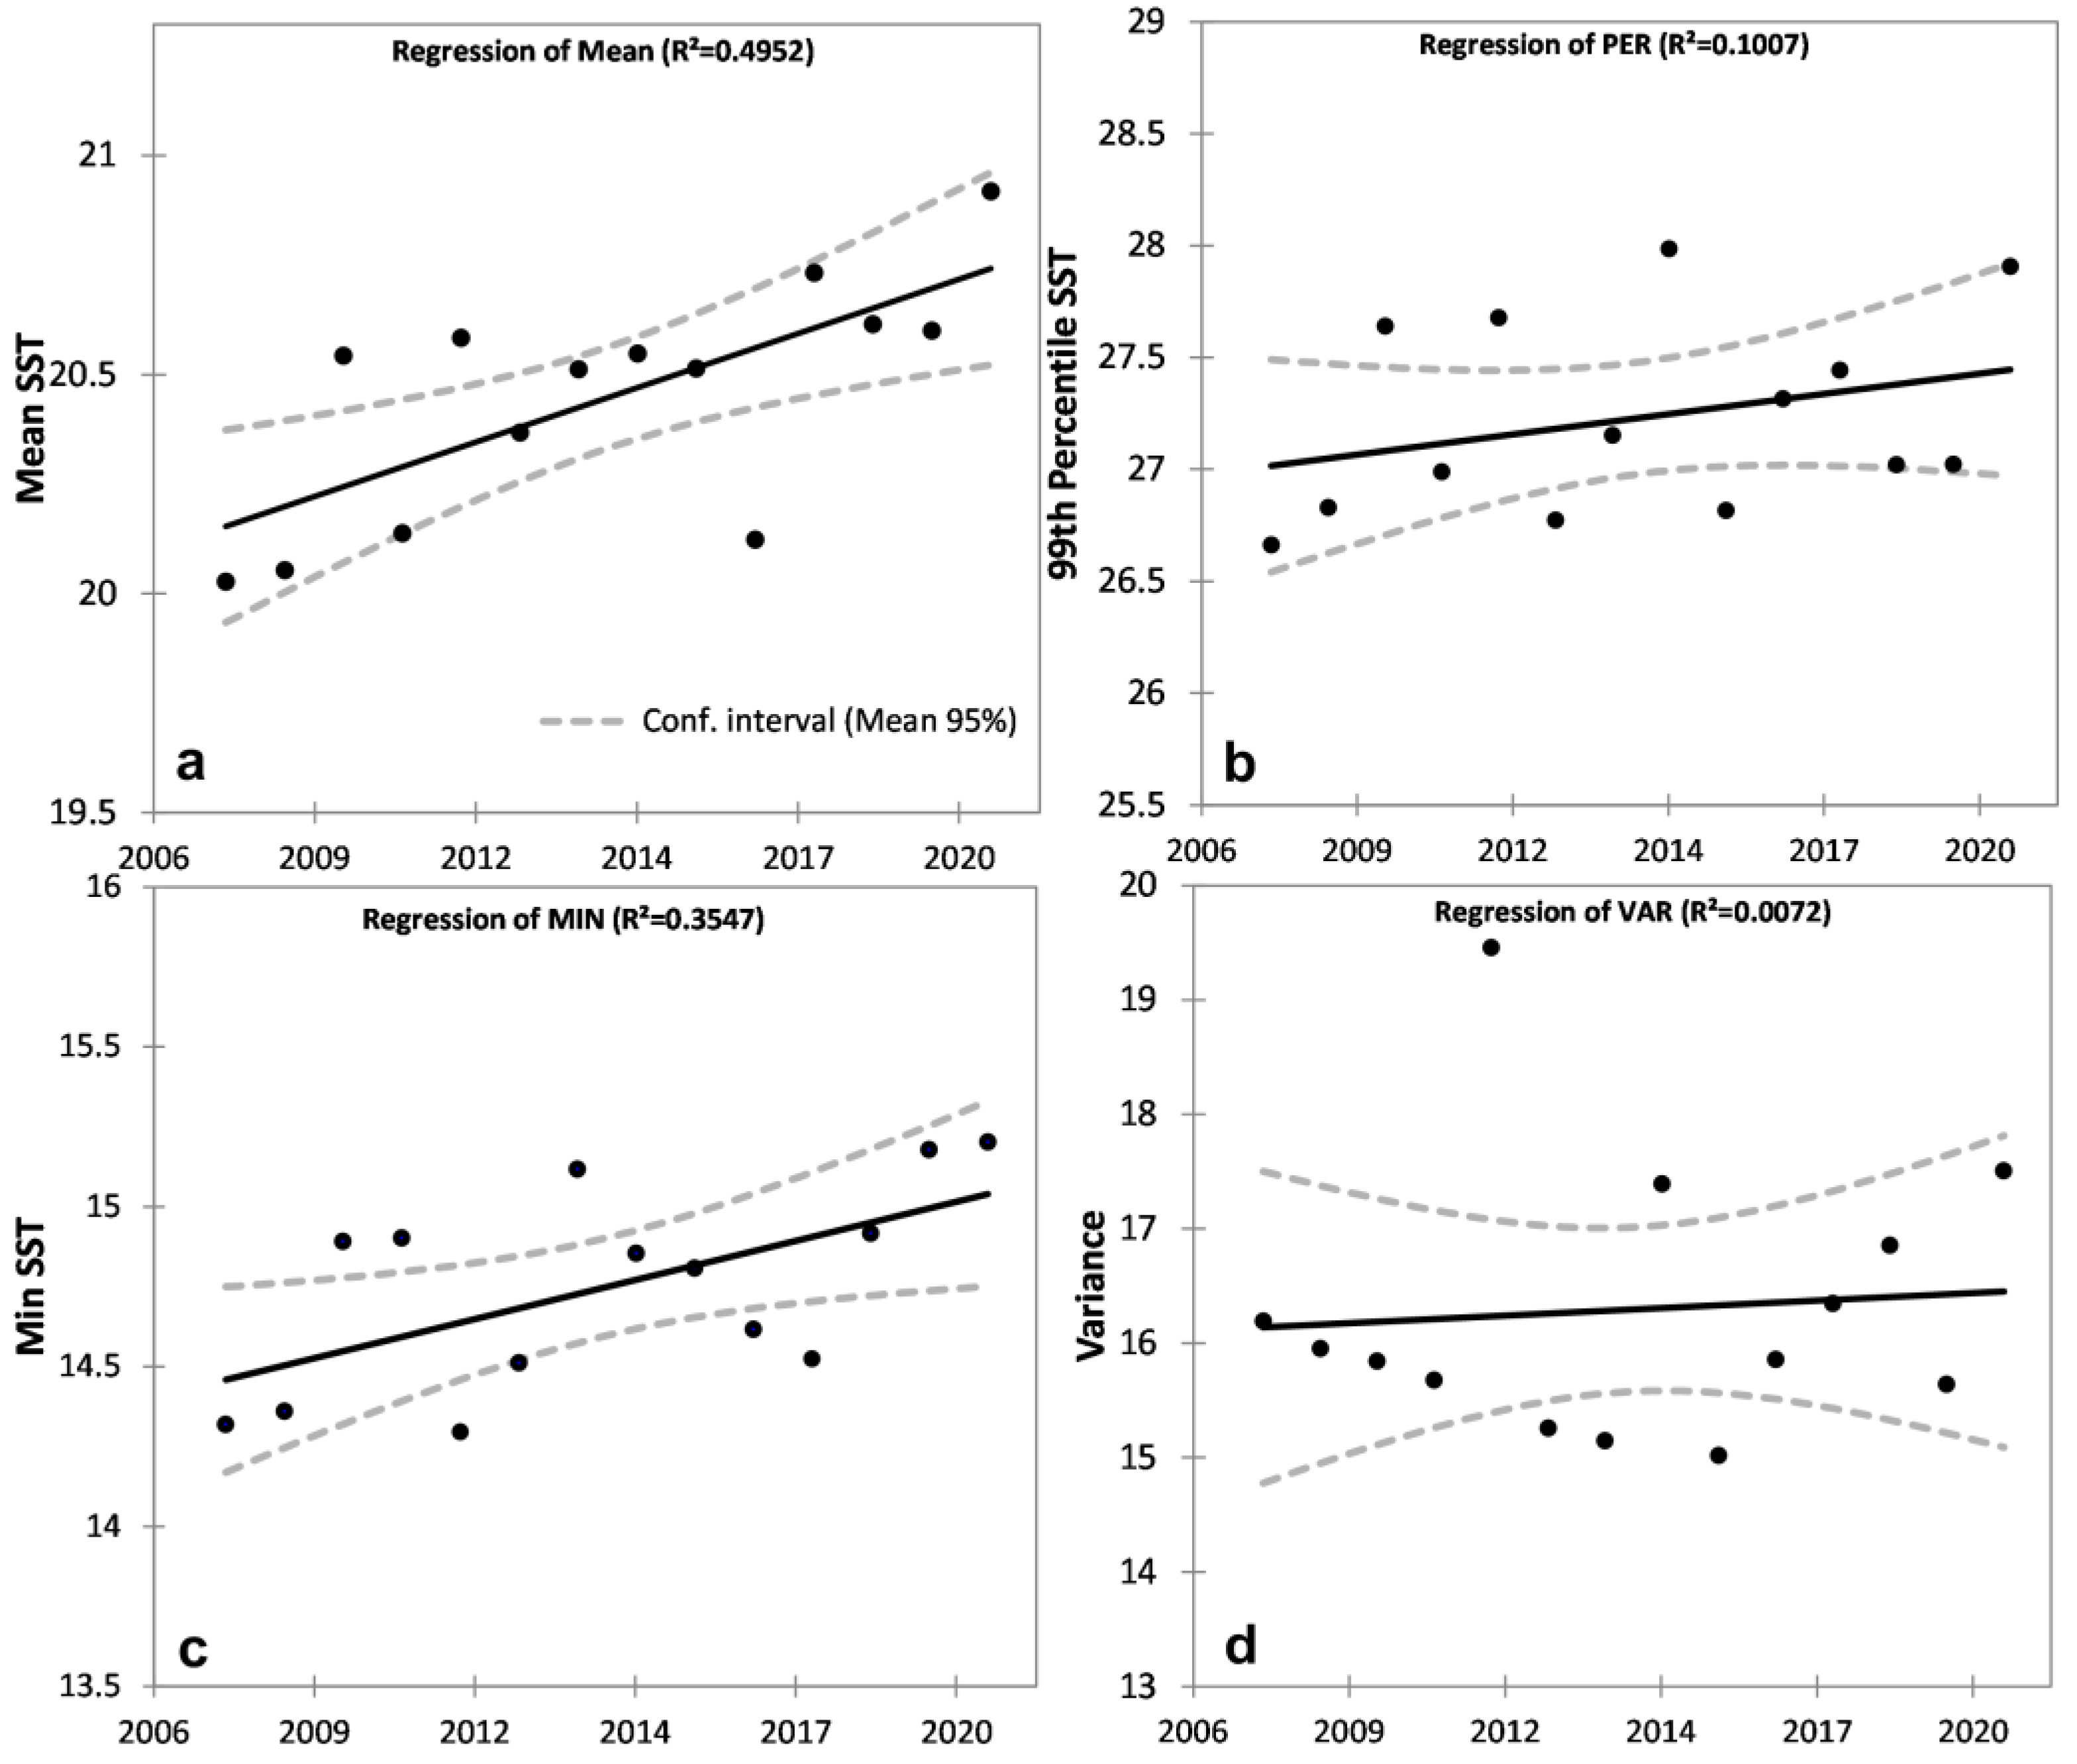
3.5.1. Temperature Variability and MHWs
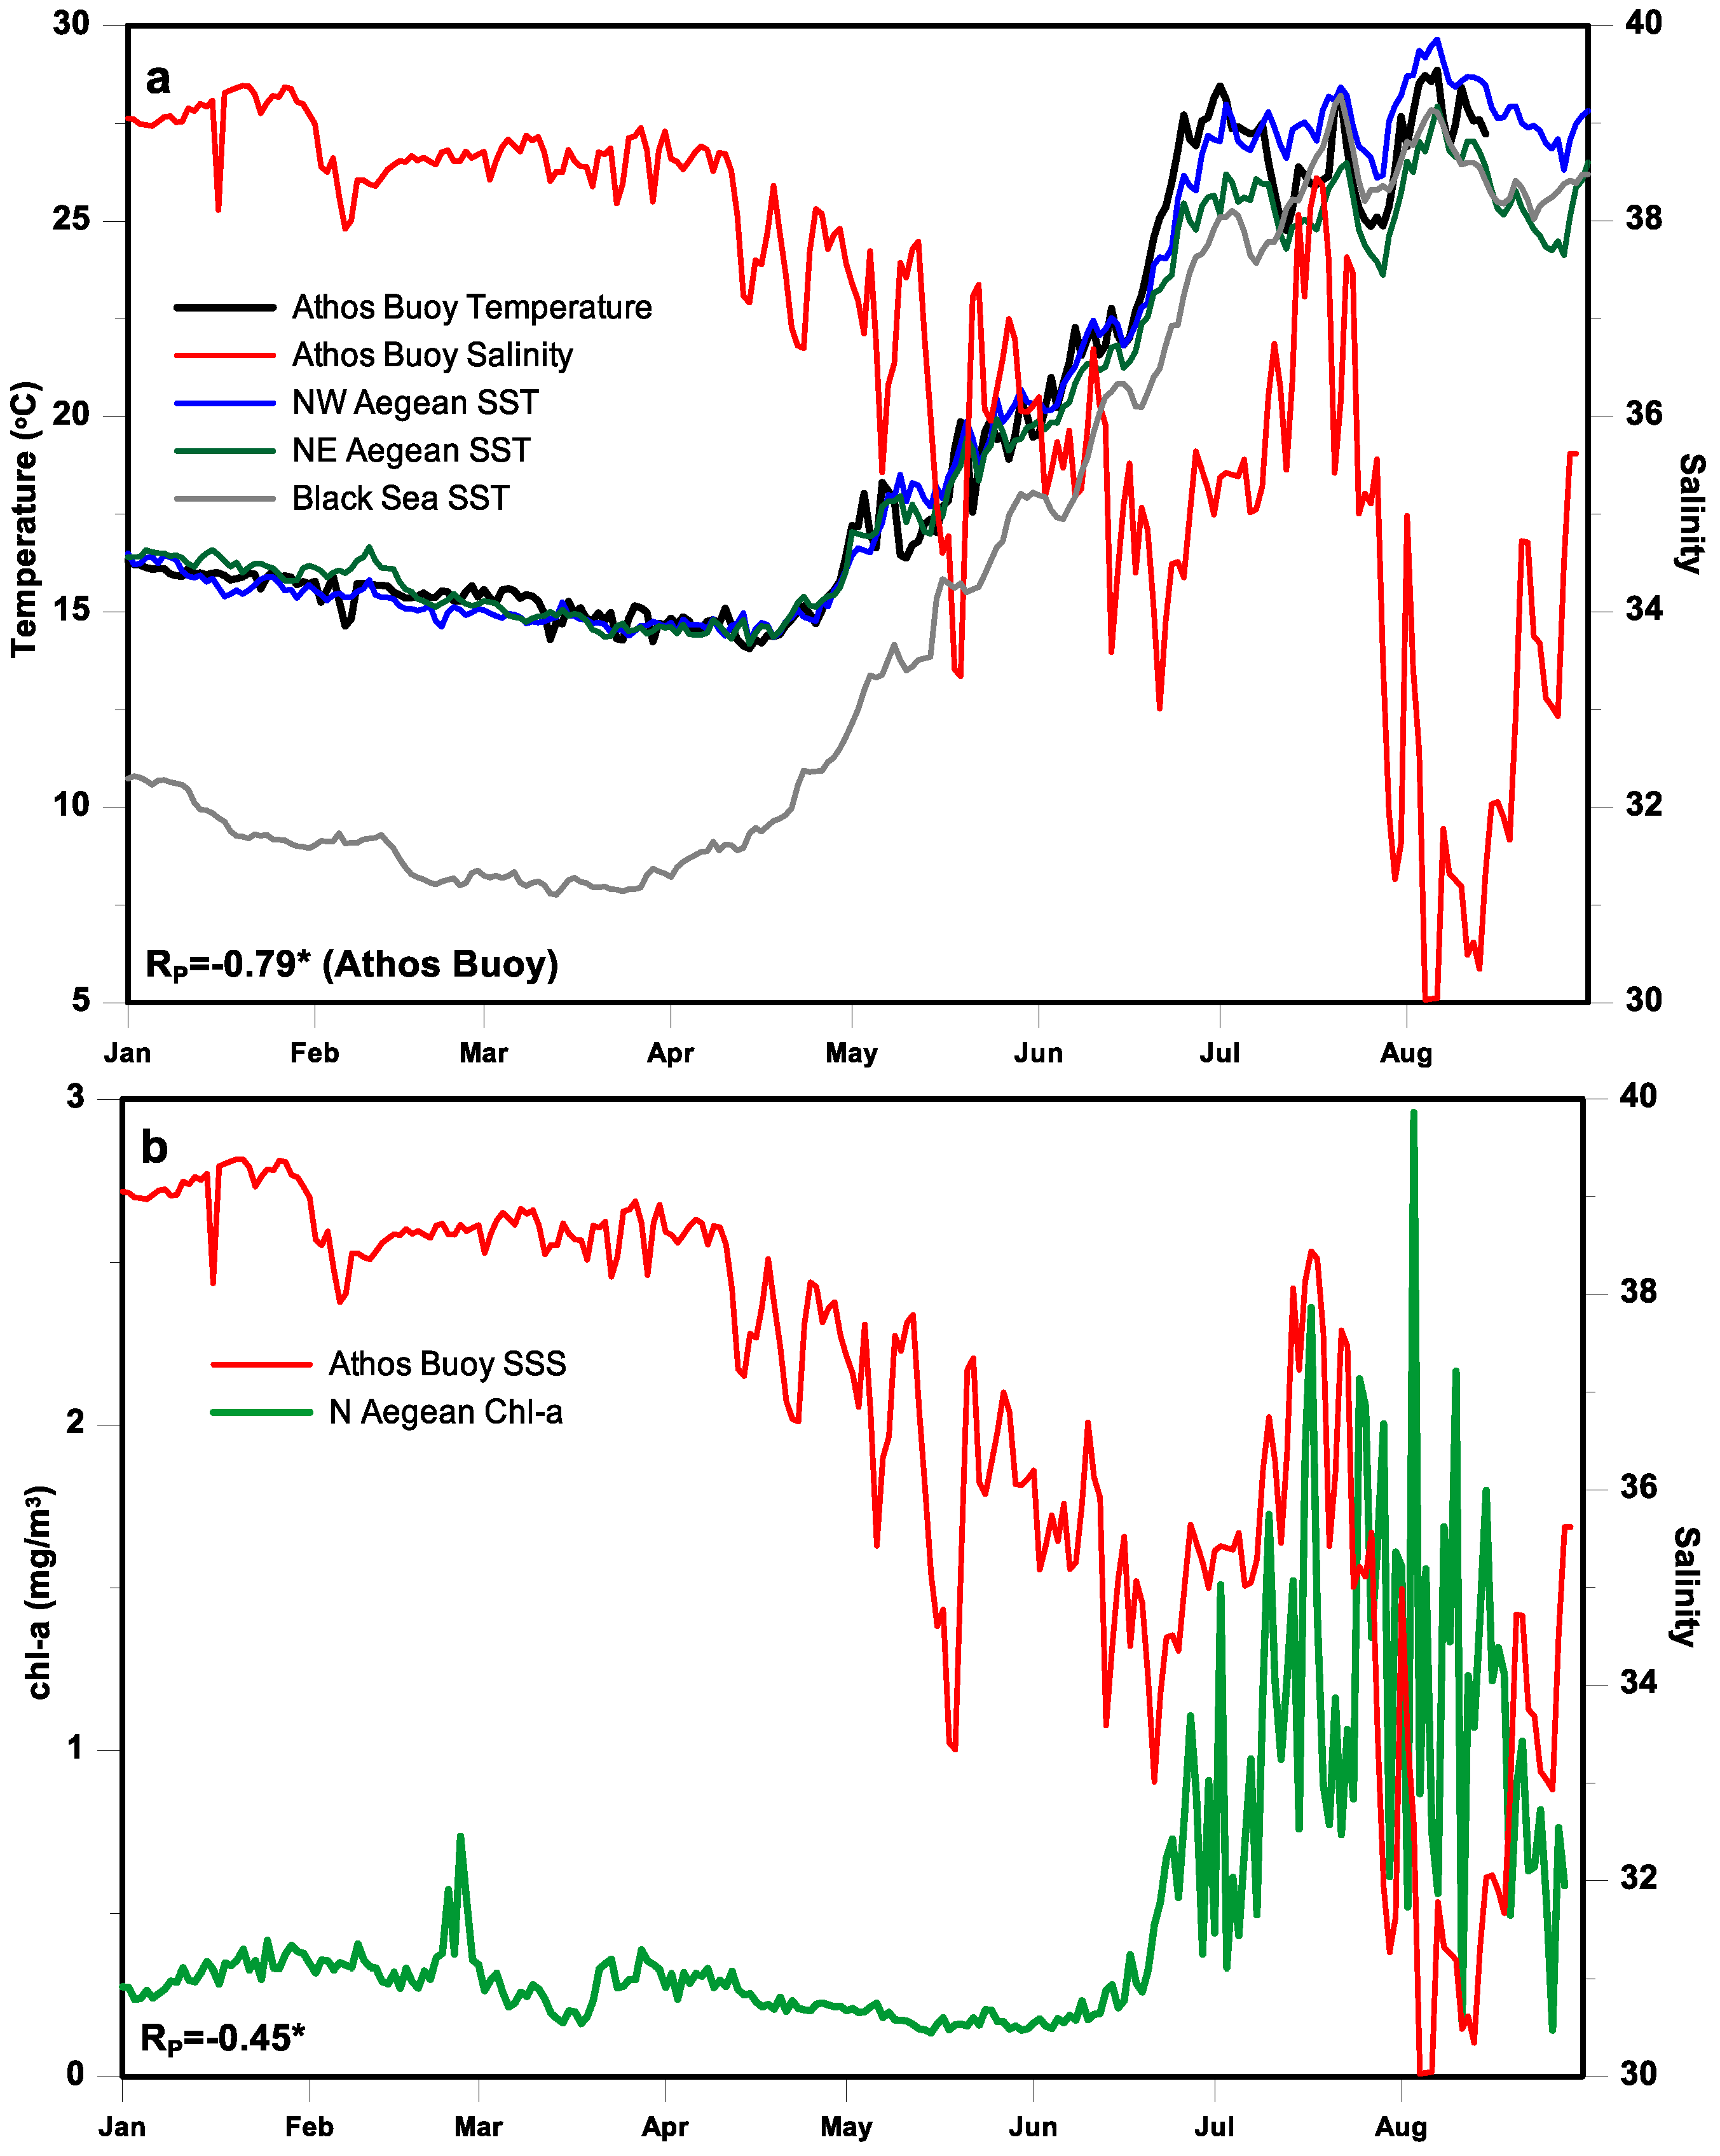
3.5.2. Environmental Conditions over the N Aegean
4. Summary and Discussion
5. Concluding Remarks
Author Contributions
Funding
Institutional Review Board Statement
Informed Consent Statement
Data Availability Statement
Acknowledgments
Conflicts of Interest
References
- Karagali, I.; Høyer, J.; Hasager, C. SST diurnal variability in the North Sea and the Baltic Sea. Remote Sens. Environ. 2012, 121, 159–170. [Google Scholar] [CrossRef]
- Rayner, N.A.A.; Parker, D.E.; Horton, E.B.; Folland, C.K.; Alexander, L.V.; Rowell, D.P.; Kent, E.C.; Kaplan, A. Global analyses of sea surface temperature, sea ice, and night marine air temperature since the late nineteenth century. J. Geophys. Res. Atmos. 2003, 108, 4407. [Google Scholar] [CrossRef]
- Marino, G.; Rohling, E.; Rijpstra, W.I.C.; Sangiorgi, F.; Schouten, S.; Damste, J.S. Aegean Sea as driver of hydrographic and ecological changes in the eastern Mediterranean. Geology 2007, 35, 675. [Google Scholar] [CrossRef]
- Carapiperis, L.N. On the surface temperature of Greek waters. Pure Appl. Geophys. 1952, 23, 153–161. [Google Scholar] [CrossRef]
- Poulos, S.; Drakopoulos, P.; Collins, M. Seasonal variability in sea surface oceanographic conditions in the Aegean Sea (Eastern Mediterranean): An overview. J. Mar. Syst. 1997, 13, 225–244. [Google Scholar] [CrossRef]
- Poupkou, A.; Zanis, P.; Nastos, P.; Papanastasiou, D.; Melas, D.; Tourpali, K.; Zerefos, C. Present climate trend analysis of the Etesian winds in the Aegean Sea. Theor. Appl. Clim. 2011, 106, 459–472. [Google Scholar] [CrossRef]
- Anagnostopoulou, C.; Zanis, P.; Katragkou, E.; Tegoulias, I.; Tolika, K. Recent past and future patterns of the Etesian winds based on regional scale climate model simulations. Clim. Dyn. 2013, 42, 1819–1836. [Google Scholar] [CrossRef]
- Skliris, N.; Mantziafou, A.; Sofianos, S.; Gkanasos, A. Satellite-derived variability of the Aegean Sea ecohydrodynamics. Cont. Shelf Res. 2010, 30, 403–418. [Google Scholar] [CrossRef]
- Androulidakis, Y.S.; Krestenitis, Y.N.; Psarra, S. Coastal upwelling over the North Aegean Sea: Observations and simulations. Cont. Shelf Res. 2016, 149, 32–51. [Google Scholar] [CrossRef]
- Mamoutos, I.; Zervakis, V.; Tragou, E.; Karydis, M.; Frangoulis, C.; Kolovoyiannis, V.; Georgopoulos, D.; Psarra, S. The role of wind-forced coastal upwelling on the thermohaline functioning of the North Aegean Sea. Cont. Shelf Res. 2017, 149, 52–68. [Google Scholar] [CrossRef]
- Ciappa, A.C. The summer upwelling of the Eastern Aegean Sea detected from MODIS SST scenes from 2003 to 2015. Int. J. Remote Sens. 2018, 40, 3105–3117. [Google Scholar] [CrossRef]
- Pisano, A.; Marullo, S.; Artale, V.; Falcini, F.; Yang, C.; Leonelli, F.E.; Santoleri, R.; Buongiorno Nardelli, B. New evidence of mediterranean climate change and variability from sea surface temperature observations. Remote Sens. 2020, 12, 132. [Google Scholar] [CrossRef]
- Skliris, N.; Sofianos, S.S.; Gkanasos, A.; Axaopoulos, P.; Mantziafou, A.; Vervatis, V. Long-term sea surface temperature variability in the Aegean Sea. Adv. Oceanogr. Limnol. 2011, 2, 125–139. [Google Scholar] [CrossRef]
- Gönülal, O. Sea water temperature in the North Aegean Sea (Gökçeada Island) between 1972 and 2018: An implication of global warming. J. Black Sea Mediterr. Environ. 2021, 27, 24–33. [Google Scholar]
- Mavrakis, A.F.; Tsiros, I.X. The abrupt increase in the Aegean sea surface temperature during June 2007—A marine heatwave event? Weather 2018, 74, 201–207. [Google Scholar] [CrossRef]
- Topouzelis, K.; Varnava, S.; Georgiou, A. Seasonal and Spatial Variability of SST Using MODIS Data: The Case Study of Aegean Sea. Int. J. Remote Sens. Appl. 2015, 5, 25. [Google Scholar] [CrossRef]
- Shaltout, M.; Omstedt, A. Recent sea surface temperature trends and future scenarios for the Mediterranean Sea. Oceanologia 2014, 56, 411–443. [Google Scholar] [CrossRef]
- Ibrahim, O.; Mohamed, B.; Nagy, H. Spatial Variability and Trends of Marine Heat Waves in the Eastern Mediterranean Sea over 39 Years. J. Mar. Sci. Eng. 2021, 9, 643. [Google Scholar] [CrossRef]
- Darmaraki, S.; Somot, S.; Sevault, F.; Nabat, P. Past Variability of Mediterranean Sea Marine Heatwaves. Geophys. Res. Lett. 2019, 46, 9813–9823. [Google Scholar] [CrossRef]
- Darmaraki, S.; Somot, S.; Sevault, F.; Nabat, P.; Narvaez, W.D.C.; Cavicchia, L.; Djurdjevic, V.; Li, L.; Sannino, G.; Sein, D. Future evolution of Marine Heatwaves in the Mediterranean Sea. Clim. Dyn. 2019, 53, 1371–1392. [Google Scholar] [CrossRef]
- Nardelli, B.B.; Tronconi, C.; Pisano, A.; Santoleri, R. High and Ultra-High resolution processing of satellite Sea Surface Temperature data over Southern European Seas in the framework of MyOcean project. Remote Sens. Environ. 2013, 129, 1–16. [Google Scholar] [CrossRef]
- Nardelli, C.; Pisano, A.; Tronconi, B.B. Mediterranean Sea and Black Sea Surface Temperature NRT Data, Quality Information Document; Copernicus Marine Environment Monitoring Service: Luxembourg, 2019; p. 18. [Google Scholar]
- Volpe, G.; Buongiorno Nardelli, B.; Colella, S.; Pisano, A.; Santoleri, R. An Operational Interpolated Ocean Colour Product in the Mediterranean Sea. In New Frontiers in Operational Oceanography; Chassignet, E.P., Pascual, A., Tintorè, J., Verron, J., Eds.; CreateSpace: Scotts Valley, CA, USA, 2018; pp. 227–244. [Google Scholar]
- Hobday, A.J.; Alexander, L.V.; Perkins, S.E.; Smale, D.A.; Straub, S.C.; Oliver, E.C.J.; Benthuysen, J.A.; Burrows, M.T.; Donat, M.G.; Feng, M.; et al. A hierarchical approach to defining marine heatwaves. Prog. Oceanogr. 2016, 141, 227–238. [Google Scholar] [CrossRef]
- Mann, H.B. Nonparametric tests against trend. Econom. J. Econom. Soc. 1945, 13, 245–259. [Google Scholar] [CrossRef]
- Kendall, M. Rank Correlation Measures; Charles Griffin: London, UK, 1975. [Google Scholar]
- García-Monteiro, S.; Sobrino, J.; Julien, Y.; Sòria, G.; Skokovic, D. Surface Temperature trends in the Mediterranean Sea from MODIS data during years 2003–2019. Reg. Stud. Mar. Sci. 2022, 49, 102086. [Google Scholar] [CrossRef]
- Androulidakis, Y.S.; Kourafalou, V. Evolution of a buoyant outflow in the presence of complex topography: The Dardanelles plume (North Aegean Sea). J. Geophys. Res. Space Phys. 2011, 116, C04019. [Google Scholar] [CrossRef]
- Polat, C.; Tugrul, S. Chemical Exchange between the Mediterranean and the Black Sea via the Turkish Straits; Bulletin de l’Institut océanographique: Monaco, 1996; pp. 167–186. [Google Scholar]
- Androulidakis, Y.S.; Krestenitis, Y.N.; Kourafalou, V.H. Connectivity of North Aegean circulation to the Black Sea water budget. Cont. Shelf Res. 2012, 48, 8–26. [Google Scholar] [CrossRef]
- Zervakis, V.; Drakopoulos, P.G.; Georgopoulos, D. The role of the North Aegean in triggering the recent Eastern Mediterranean climatic changes. J. Geophys. Res. Earth Surf. 2000, 105, 26103–26116. [Google Scholar] [CrossRef]
- Androulidakis, Y.S.; Kourafalou, V.; Krestenitis, Y.N.; Zervakis, V. Variability of deep water mass characteristics in the North Aegean Sea: The role of lateral inputs and atmospheric conditions. Deep. Sea Res. Part I Oceanogr. Res. Pap. 2012, 67, 55–72. [Google Scholar] [CrossRef]
- Siokou-Frangou, I.; Zervoudaki, S.; Christou, E.D.; Zervakis, V.; Georgopoulos, D. Variability of mesozooplankton spatial distribution in the North Aegean Sea, as influenced by the Black Sea waters outflow. J. Mar. Syst. 2009, 78, 557–575. [Google Scholar] [CrossRef]
- Petihakis, G.; Tsiaras, K.; Triantafyllou, G.; Kalaroni, S.; Pollani, A. Sensitivity of the N. AEGEAN SEA ecosystem to Black Sea Water inputs. Mediterr. Mar. Sci. 2014, 15, 790. [Google Scholar] [CrossRef][Green Version]
- Karatsolis, B.-T.; Triantaphyllou, M.; Dimiza, M.; Malinverno, E.; Lagaria, A.; Mara, P.; Archontikis, O.; Psarra, S. Coccolithophore assemblage response to Black Sea Water inflow into the North Aegean Sea (NE Mediterranean). Cont. Shelf Res. 2017, 149, 138–150. [Google Scholar] [CrossRef]
- Ünlüata, Ü.; Oğuz, T.; Latif, M.A.; Özsoy, E. On the physical oceanography of the Turkish Straits. In The Physical Oceanography of Sea Straits; Springer: Dordrecht, The Netherlands, 1990; pp. 25–60. [Google Scholar]
- Kourafalou, V.; Barbopoulos, K. High resolution simulations on the North Aegean Sea seasonal circulation. Ann. Geophys. 2003, 21, 251–265. [Google Scholar] [CrossRef]
- Amaya, D.J.; Alexander, M.A.; Capotondi, A.; Deser, C.; Karnauskas, K.B.; Miller, A.J.; Mantua, N.J. Are Long-Term Changes in Mixed Layer Depth Influencing North Pacific Marine Heatwaves? Bull. Am. Meteorol. Soc. 2021, 102, S59–S66. [Google Scholar] [CrossRef]
- Hellwege, K.H.; Madelung, O.; Fuchs, K.; Soffel, H.; Wänke, H.; Groten, E.; Schneider, G.; Müller, G.; Zürn, W.; Dziewonski, A.M.; et al. Landolt-Börnstein. Numerical Data and Functional Relationships Inscience and Technology. New Series. Group V: Geophysics and Space Re-Search. Volume 2: Geophysics of the Solid Earth, the Moon and the Planets. Subvolume A. Landolt-Börnstein. Numerical Data and Functional Relationships Inscience and Technology. New Series. Group V: Geophysics and Space Research. Volume 2: Geophysics of the Solid Earth; Springer: Berlin/Heidelberg, Germany, 1984. [Google Scholar]
- Mohamed, B.; Abdallah, A.M.; El-Din, K.A.; Nagy, H.; Shaltout, M. Inter-annual variability and trends of sea level and sea surface temperature in the mediterranean sea over the last 25 years. Pure Appl. Geophys. 2019, 176, 3787–3810. [Google Scholar] [CrossRef]
- Mohamed, B.; Skliris, N. Steric and atmospheric contributions to interannual sea level variability in the eastern mediterranean sea over 1993–2019. Oceanologia 2021, 63, 1–13. [Google Scholar] [CrossRef]


| Parameter | Type | Res. | Step | Period | Area | Dataset Source |
|---|---|---|---|---|---|---|
| SST | Satellite | 0.01° | Daily | 01/01/08–15/11/21 | AIC and Black Sea | Copernicus System |
| Chlorophyll-a concentrations | Satellite | 0.01° | Daily | 01/01/21–15/11/21 | AIC | Copernicus System |
| Air temperature (2 m) | ECMWF Reanalysis (ERA5) | 0.25° | Hourly | 01/01/08–15/11/21 | AIC | Copernicus System |
| Wind components (10 m) | ECMWF Reanalysis (ERA5) | 0.25° | Hourly | 01/01/08–15/11/21 | AIC | Copernicus System |
| Temperature and salinity (1 and 20 m) | In situ | Buoy | Hourly | 01/01/08–31/08/21 | Athos (N Aegean) | Poseidon System |
| Air temperature (dry bulb) | In situ | Buoy | Hourly | 01/01/08–31/08/21 | Athos (N Aegean) | Poseidon System |
| All Regions | N Ionian | S Ionian | NW Aegean | NE Aegean | SW Aegean | SE Aegean | Cretan Sea | ||
|---|---|---|---|---|---|---|---|---|---|
| Mean | Sen’s Slope | 0.049 * | 0.060 ** | 0.069 * | 0.063 ** | 0.060 ** | 0.047 ** | 0.051 ** | 0.045 * |
| p value | 0.003 | 0.026 | 0.0003 | 0.019 | 0.042 | 0.036 | 0.036 | 0.010 | |
| UpConf | 0.251 | 0.337 | 0.244 | 0.354 | 0.368 | 0.315 | 0.281 | 0.220 | |
| LowConf | −0.123 | −0.234 | −0.078 | −0.166 | −0.203 | −0.142 | −0.211 | −0.124 | |
| Perc 99 | Sen’s Slope | 0.035 | 0.067 | 0.069 ** | 0.016 | 0.015 | 0.019 | 0.008 | 0.044 |
| p value | 0.157 | 0.157 | 0.047 | 0.830 | 0.784 | 0.591 | 0.830 | 0.279 | |
| UpConf | 0.552 | 0.692 | 0.505 | 0.856 | 1.038 | 0.818 | 0.452 | 0.567 | |
| LowConf | −0.312 | −0.582 | −0.282 | −0.361 | −0.733 | −0.541 | −0.477 | −0.381 | |
| Min | Sen’s Slope | 0.038 ** | 0.096 * | 0.077 * | 0.060 ** | 0.068 * | 0.023 | 0.050 | 0.035 |
| p value | 0.026 | 0.001 | 0.005 | 0.019 | 0.042 | 0.518 | 0.233 | 0.388 | |
| UpConf | 0.306 | 0.376 | 0.283 | 0.538 | 0.594 | 0.407 | 0.424 | 0.408 | |
| LowConf | −0.178 | −0.261 | −0.193 | −0.316 | −0.282 | −0.416 | −0.292 | −0.341 | |
| Var | Sen’s Slope | 0.015 | -0.067 | -0.005 | 0.027 | -0.086 | 0.039 | -0.011 | 0.084 |
| p value | 0.914 | 0.591 | 1.000 | 0.914 | 0.622 | 0.591 | 0.830 | 0.331 | |
| UpConf | 1.118 | 1.876 | 1.954 | 1.858 | 1.720 | 1.388 | 0.726 | 0.968 | |
| LowConf | −0.939 | −2.552 | −2.759 | −1.602 | −1.351 | −1.105 | −0.596 | −0.802 |
| All Regions | N Ionian | S Ionian | NW Aegean | NE Aegean | SW Aegean | SE Aegean | Cretan Sea | ||
|---|---|---|---|---|---|---|---|---|---|
| Winter | Sen’s Slope | 0.076 ** | 0.125 * | 0.104 * | 0.094 | 0.061 | 0.070 | 0.086 | 0.064 |
| p value | 0.047 | 0.001 | 0.002 | 0.157 | 0.127 | 0.193 | 0.062 | 0.101 | |
| UpConf | 0.478 | 0.512 | 0.506 | 0.775 | 0.965 | 0.603 | 0.559 | 0.547 | |
| LowConf | −0.191 | −0.255 | −0.208 | −0.346 | −0.362 | −0.208 | −0.356 | −0.172 | |
| Spring | Sen’s Slope | 0.034 | 0.041 | 0.043 | 0.031 | 0.037 | 0.028 | 0.032 | 0.030 |
| p value | 0.157 | 0.101 | 0.127 | 0.331 | 0.279 | 0.127 | 0.331 | 0.279 | |
| UpConf | 0.314 | 0.254 | 0.313 | 0.668 | 0.564 | 0.377 | 0.374 | 0.267 | |
| LowConf | −0.231 | −0.177 | −0.220 | −0.497 | −0.344 | −0.314 | −0.284 | −0.242 | |
| Summer | Sen’s Slope | 0.034 | 0.027 | 0.051 | 0.027 | 0.016 | 0.024 | 0.018 | 0.034 |
| p value | 0.331 | 0.591 | 0.193 | 0.667 | 0.591 | 0.451 | 0.518 | 0.331 | |
| UpConf | 0.277 | 0.503 | 0.321 | 0.429 | 0.694 | 0.594 | 0.400 | 0.317 | |
| LowConf | −0.331 | −0.472 | −0.262 | −0.406 | −0.478 | −0.414 | −0.298 | −0.334 | |
| Autumn | Sen’s Slope | 0.057 | 0.064 | 0.083 | 0.051 | 0.039 | 0.041 | 0.047 | 0.060 |
| p value | 0.127 | 0.193 | 0.062 | 0.036 | 0.388 | 0.451 | 0.193 | 0.193 | |
| UpConf | 0.461 | 0.609 | 0.597 | 0.560 | 0.519 | 0.516 | 0.582 | 0.447 | |
| LowConf | −0.440 | −0.554 | −0.445 | −0.399 | −0.370 | −0.394 | −0.474 | −0.335 | |
Publisher’s Note: MDPI stays neutral with regard to jurisdictional claims in published maps and institutional affiliations. |
© 2022 by the authors. Licensee MDPI, Basel, Switzerland. This article is an open access article distributed under the terms and conditions of the Creative Commons Attribution (CC BY) license (https://creativecommons.org/licenses/by/4.0/).
Share and Cite
Androulidakis, Y.S.; Krestenitis, Y.N. Sea Surface Temperature Variability and Marine Heat Waves over the Aegean, Ionian, and Cretan Seas from 2008–2021. J. Mar. Sci. Eng. 2022, 10, 42. https://doi.org/10.3390/jmse10010042
Androulidakis YS, Krestenitis YN. Sea Surface Temperature Variability and Marine Heat Waves over the Aegean, Ionian, and Cretan Seas from 2008–2021. Journal of Marine Science and Engineering. 2022; 10(1):42. https://doi.org/10.3390/jmse10010042
Chicago/Turabian StyleAndroulidakis, Yannis S., and Yannis N. Krestenitis. 2022. "Sea Surface Temperature Variability and Marine Heat Waves over the Aegean, Ionian, and Cretan Seas from 2008–2021" Journal of Marine Science and Engineering 10, no. 1: 42. https://doi.org/10.3390/jmse10010042
APA StyleAndroulidakis, Y. S., & Krestenitis, Y. N. (2022). Sea Surface Temperature Variability and Marine Heat Waves over the Aegean, Ionian, and Cretan Seas from 2008–2021. Journal of Marine Science and Engineering, 10(1), 42. https://doi.org/10.3390/jmse10010042