Article

Research on the Water Ridge and Slamming Characteristics of a Semisubmersible Platform under Towing Conditions

School of Naval Architecture and Ocean Engineering, Jiangsu University of Science and Technology, Zhenjiang 212028, China
*
Author to whom correspondence should be addressed.
J. Mar. Sci. Eng. 2022, 10(1), 116; https://doi.org/10.3390/jmse10010116
Submission received: 2 December 2021 / Revised: 30 December 2021 / Accepted: 6 January 2022 / Published: 15 January 2022
(This article belongs to the Special Issue Ship Motions and Wave Loads)

Abstract

:
During the towing of semisubmersible platforms, waves impact and superpose in front of the platform to form a ridge shaped “water ridge”, which protrudes near the platform and produces a large slamming pressure. The water ridges occur frequently in the towing conditions of semisubmersible platforms. The wave–slamming on the braces and columns of platform is aggravated due to the water ridges, particularly in rough sea conditions. The effect of water ridges is usually ignored in slamming pressure analysis, which is used to check the structural strengths of the braces and columns. In this paper, the characteristics of the water ridge at the braces of a semisubmersible platform are studied by experimental tests and numerical simulations. In addition, the sensitivity of the water ridge to the wave height and period is studied. The numerical simulations are conducted by a Computational Fluid Dynamics (CFD) method, and their accuracy is validated based on experimental tests. The characteristics of the water ridge and slamming pressure on the braces and columns are studied in different wave conditions based on the validated numerical model. It is found that the wave extrusion is the main reason of water ridge. The wave–slamming pressure caused by the water ridge has an approximately linear increase with the wave height and is sensitive to the wave period. With the increase of the wave period, the wave–slamming pressure on the brace and column of the platform increases first and then decreases. The maximum wave–slamming pressure is found when the wave period is 10 s and the slamming pressure reduces rapidly with an increase of wave period.

1. Introduction

With the rapid exploitation of marine resources, semisubmersible platforms have attracted more and more attention in the past decades. Semisubmersible platforms are vulnerable to damage under extreme ocean conditions during the towing process, especially when the platform is towed in the deep sea. The waves run–up to the braces and columns, and these structures collide violently with the wave surface instantly, which give rise to a very large wave–slamming pressure. Wave–slamming has extremely significant nonlinear characteristics. Therefore, it is very important to analyze wave–slamming created by wave climbing under the towing condition of semisubmersible platforms in order to improve the safety and stability of the platforms.
With the development of a numerical computation methods and computer technology, many scholars have used numerical methods to study the wave run–up and wave–slamming load suffered by marine structures. Based on the finite volume method, Pakozdi et al. [1] used the commercial CFD tool Star–CCM+ to simulate a long crested breaking wave and its impact on an idealised model test setup of a rectangular cylinder and deck structure in order to test the feasibility of a numerical reconstruction of such events. Spatially averaged slamming pressures were similar to the model test observations, but further work is needed for a more detailed comparison. Xiang et al. [2] used an arbitrary Lagrangian–Eulerian (ALE) numerical method with a multiphase compressible formulation to study the assessment of solitary wave impact on open–girder decks that allow the air to escape from the sides. A new equation, Ng function and finite wavelength ratio deck width, provided more accurate predictions than existing empirical methods, and is expected to help engineers and researchers in the development of elastic coastal infrastructure. Pan et al. [3] investigated the interaction between large waves and floating offshore structures, the fluid–structure interaction is considered using the weakly compressible smoothed particle hydrodynamics (SPH) method. Result show that the platform may be pulled into the water by stretched tension legs, and the extension of the tension legs also governs the rotational behavior of the platform. A tension–leg platform is very unlikely to topple over during the arrival of an extreme wave. Based on SPH and Discrete Element Method (DEM) studies, Canelas et al. [4] resolved solid–solid and solid–fluid interactions in a broad range of scales. The results show that the model was accurate and capable of treating highly complex interactions, such as the transport of debris or hydrodynamic actions on structures. Hasanpour et al. [5] presented a coupled SPH FEM modeling approach that simulates fluid with particles, a flume, debris and a structure with mesh–based finite elements. While the exact level of debris pitching is highly dependent on tsunami characteristics and initial water depth, these could potentially result in a nonlinear force velocity trend that has not been considered to date, highlighting the need for further investigations, preferably with three–dimensional models. The aforementioned studies are among the most popular and promising numerical methods in marine engineering. Moreover, other studies, e.g., Tang et al. [6], investigated the influence of wave steepness parameters on the wave run–up effect around the column and wave loads. The results showed that a numerical wave flume could be used to analyze wave run–up on a vertical column. Gao et al. [7] analyzed wave run–up on vertical columns under freak wave conditions with different directions. Zhang [8] used the CFD method to simulate wave run–up and wave interaction between multiple columns. The results showed that wave steepness parameters have significant effects on wave run–up on the front surface of the column. Wan [9] proposed an approach to dissipate and obstruct uprush and improve air gap performance by installing a multi–layer porous barrier on the column surface. Zhao et al. [10] predicted the wave surface magnitude, horizontal and vertical wave forces in the process of wave run–up by applying a potential and viscous flow single–direction coupling technique. The results showed that the maximum amplitude of wave surface can reach 2 times under strong off-line condition with wave steepness of 1/10. Under short waves, a second–order effect of the wave elevation around the cylinder was obvious, while the second–order quantity was close to zero under long waves. Liu [11] carried out numerical simulations to predict wave run–up, near–field interference and column slamming on semisubmersible platforms in two modes (fixed mode and mooring mode) using the CFD software FINE/Marine. The results showed that the shape of the column shows significant influenced the wave–front surface of the column and the wave–climbing in one period, and the spacing between the columns affected the wave distribution between two columns dramatically. The shape and spacing of the column had a great influence on the peak value of the wave surface and the variation of the wave surface in the internal field. Wang et al. [12] studied wave run–up phenomena on different columns by applying numerical simulations, and the influence of column cross–section shape on column wave run–up was investigated. The results showed that the cross–section shape of the column has a significant influence on the wave run–up of the column, and the shielding effect of a square column is more obvious than that of the chamfered and circular column. Abdussamie et al. [13,14,15] investigated the effect of wave loads on the inner deck on the motion response of the platform and slamming pressure, and found that these parameters are highly correlated. It was seen that the global load on the deck of the platform increased significantly with decrease of the magnitude of the hydrostatic air gap; however, this rule does not apply for wave loads on the deck.
Yang et al. [16] investigated wave run–up on a fixed semisubmersible platform under regular waves. The wave run–up caused by the interaction between the incident wave and the platform, and the nonlinear disturbance characteristics of the wave surface caused by the superposition of the incident wave and the reflected wave, were studied, as well as the effect of the distance between the platform columns and the wave direction on the wave run–up. When the wave direction is 90°, the wave run–up on the front column of the platform is weaker than that when the wave direction is 0°, whereas when the wave direction is 90°, the wave climb on the rear column of the platform is weaker than that when the wave direction is 0°. Van der Meer et al. [17] analyzed the reflection of a Low–Crested Structures (LCS)–derived formula, which take into account the fact that wave overtopping or transmission reduces reflection, and is dependent on the crest height of the structure. Istrati et al. [18] presented the results of a numerical investigation into tsunami–induced loads on bridges. They found that when a bore impacts a straight bridge, large impulsive horizontal (Fx) and uplift (Fy) loads, together with an overturning moment about the longitudinal axis of the bridge (Mz), are simultaneously applied to the bridge, increasing the likelihood for severe damage. As the angle of skew increases, the magnitude of the impulsive component of these loads decreases, leading to a decreasing trend in Fx, Fy and Mz. These studies show the importance of studying the relative angle between the structure and the wave.
Based on the volume of fluid method (VOF), Bozorgnia et al. [19] investigated the role of entrapped air and hydrodynamic forces exerted on a bridge superstructure. The results indicated that air entrapment can significantly amplify uplift forces applied to the bridge superstructure. To mitigate hydrodynamic forces, effectiveness of air vents was investigated. Anagnostopoulos. [20] demonstrated that the effect of the air is dependent on the wave type, but with major differences between unbroken waves and bores. Istrati et al. [21] constructed and tested large–scale (1:5) physical models with realistic structural members and elastomeric bearings under a range of unbroken solitary waves and more realistic tsunami–like transient bores. The results showed that the air has a complex effect on the uplift demand in offshore bearings and columns, which can decrease or increase even more than the total deck uplift, and an inconsistent effect on the uplift force of different structural components introduced by the same wave. Iwanowski et al. [22] used Com Flow software to analyze the air gap of a platform and compared numerical results with experimental ones. Bredmose et al. [23] and Ma et al. [24] found that the slamming load significantly increased when air–entrained breaking waves slam the structure, but did not mention the aleatory uncertainty associated with such phenomena. Peregrine et al. [25] showed that wave height and air bubbles entrained inside in a breaker, which is a random process, significantly affect the variability of forces. Ghosh et al. [26] demonstrated that after a plunging type of breaking wave, multiple chaotic splash–ups occur creating turbulence and vorticity. Istrati [27] showed large aleatory variability in bore–induced horizontal force and pressures on an elevated deck with the variability being 30%, attributed to the variability of the slamming component. Simos et al. [28] carried out model tests to study hydrodynamic responses of a semisubmersible platform and found that previous studies often neglected the problem of wave run–up near the column. Fan et al. [29] investigated steep regular wave run–up on a single vertical cylinder by solving the Navier–Stokes equations and established a numerical wave tank to simulate wave scattering induced by a vertical cylinder. It was found that the relative run–ups on the front face and the back face of the cylinder depend mainly on the wave steepness and the relative diameter of the cylinder, while dependence on the relative water depth is weak. An empirical formula was proposed to calculate the relative run–ups in terms of the wave steepness of incident regular waves and the relative diameter of a cylinder. Lu et al. [30,31] conducted experimental tests to investigate the hydrodynamic responses of a three–column semisubmersible platform, including 6–DOF motion, wave run–up and the air–gap. It was found that large slow drift surge motions occur under irregular waves, while the low–frequency pitch motion is relatively small. Istrati et al. [32] conducted Equivalent 2–D analyses with LS–DYNA, considering the flexibility of both the superstructure and the connections. Both superstructure and substructure flexibility were found to significantly influence the external tsunami loads on a bridge and connection forces. In addition, these affected the distribution of the forces in the connections. Choi et al. [33], used the Duhamel integral to reproduce dynamic breaking wave forces based on the breaking wave forces calculated by the CFD model. The reproduced results were compared with unfiltered experimental data for the verification of the method.
Chen et al. [34] investigated the influence of spacing ratio and wave steepness on wave forces on four columns of a semisubmersible. The results showed that the spacing ratio has a significant effect on the horizontal wave force of columns. However, there was no significant relationship between the position of maximum wave force and the position of maximum run–up ratio. Cong et al. [35] established a numerical model based on the high–order boundary element method to simulate wave diffraction caused by arbitrary shape structure in the presence of bidirectional incident waves. The numerical results showed that the presence of vertical walls interfered with the diffraction process of cylindrical waves and magnified the elevation of second–order waves between the cylindrical wave and wall wave. Most of the above studies on wave–slamming and wave run–up of offshore platforms are based on self-survival conditions. However, the effect of water ridges is usually ignored in slamming pressure analysis under the towing condition.
In this study, a three–dimensional viscous numerical wave tank was built based on the CFD method. The accuracy of numerical simulations was checked by experimental tests. The water ridge phenomenon and wave–slamming pressure distribution characteristics of a semisubmersible offshore platform under towing conditions were studied by combining numerical simulation with experimental tests. This study is organized as followings: theoretical study on numerical wave tanks in Section 2; establishment and verification of the numerical model in Section 3; study of load distribution of the platform under towing conditions in numerical simulations and experimental tests in Section 4 and Section 5.

2. Numerical Wave Pool

2.1. Governing Equations and Turbulence Model

Our numerical simulation used the CFD software STARCCM+ to study wave–slamming between a Stokes fifth order wave and a semisubmersible platform. This model uses a mathematical model that consists of the Navier–Stokes equations and the continuity equation. This section mainly introduces theoretical knowledge and numerical calculation principles.
The mathematical model of numerical wave tank consists of a continuity equation and N–S equation:
U i x i = 0
ρ [ U i t + ( U i U j ) x i ] = P x i + ρ x j [ ν ( U i x j + U j x i ) -   u i u j ¯ ] + ρ g i ,
where, ρ is the density of the fluid, the velocity component is U i in the x i direction, P is the pressure of the fluid, g i is the mass force, and ν is the coefficient of dynamic viscosity. Equation (2) uses the Reynolds average method to obtain the N–S equation in the relative average time, and   u i u j ¯ presents the Reynolds stress. The Reynolds stress equation in the Reynolds–Averaged Navier–Stokes (RANS) equation is not closed. The time–homogenization process results in the loss of partial flow details. Therefore, the turbulence model must be added to close the RANS equation.
The SST model has the advantages of the k ε model’s turbulence simulation in the far field and the k ω model’s turbulence simulation in the near wall [36]. Therefore, it is more applicable for a wide range of flow fields and provides more accurate and reliable results.
The transport equations k and the specific dissipation rate ω from the SST turbulence model can be expressed as:
( ρ k ) t + · ( ρ k ν ¯ ) = · [ ( μ + σ k μ t ) k ] + P k ρ β f β ( ω k ω 0 k 0 ) + S k
( ρ ω ) t + · ( ρ ω ν ¯ ) = · [ ( μ + σ ω μ t ) ω ] + P ω ρ β f β ( ω 2 ω 0 2 ) + S ω
where, ν ¯ is the mean velocity. μ is the dynamic viscosity. σ K , σ ω , C ε 1 and C ε 2 are the model coefficients. P k and P ω are the final term. k 0 and ω 0 are the environmental turbulence values proposed by Spalart et al. [37] to prevent turbulence attenuation. f β is the vortex–stretching modification factor. f β is the free–shear modification factor, as shown in Equation (5). The high turbulence of the fluid is corrected by f β to ensure the correctness of ω .
f β = { 1 f o r k · ω ω 3 0 1 + 680 ( k · ω ω 3 ) 2 1 + 400 ( k · ω ω 3 ) 2 f o r k · ω ω 3 > 0

2.2. Free Surface Tracking Method

The basic principle of the VOF method is to define a function in the whole flow field whose value is equal to the ratio of the fluid volume to the element volume and satisfies the fluid volume function. At any time, the distribution of the fluid volume function can be obtained by solving the transport equation. Then, the moving interface is constructed. The α q is defined as the volume fraction of the fluid, where q denotes the grid unit:
  • When there is no q th fluid in the grid unit, α q = 0.
  • When the grid cell contains the q th fluid and other fluid, 0 < a q < 1.0 .
  • When the grid cell only contains the q th fluid, α q = 1.
The volume fraction of each fluid satisfies Equation (6):
q = 1 n a q = 1
For the interface of various fluids, the continuity equation of volume fraction can be solved. The continuity equation is:
a q t + ( a q u i ) x i = 0

3. Establishment of Numerical Models

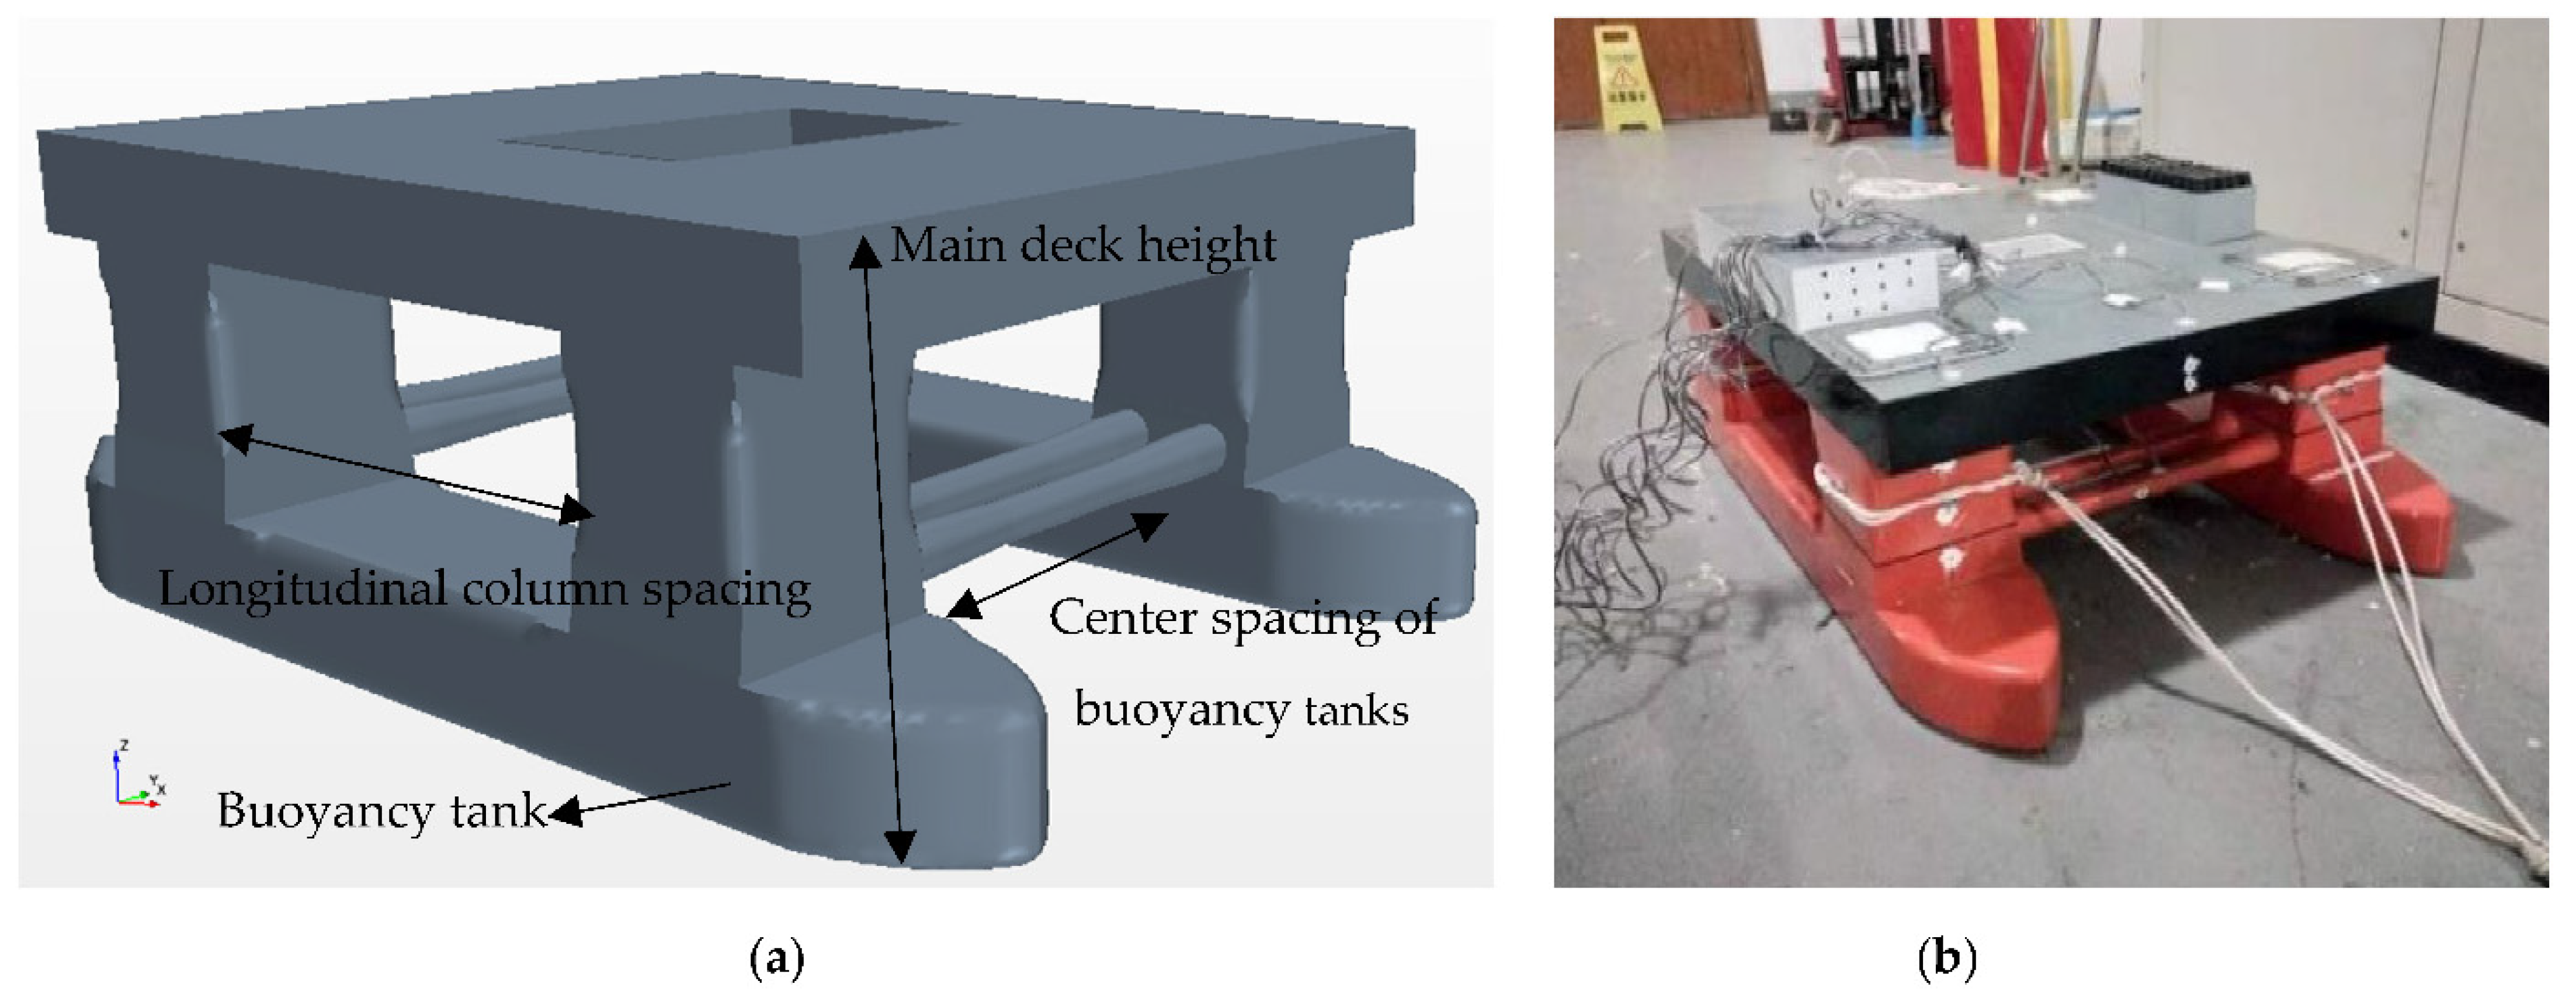
3.1. Description of the Platform Model

Experimental tests were conducted in a towing tank at Jiangsu University of Science and Technology (100 m long, 6 m wide and 2 m deep). The maximum speed of the trailer is 6 m/s and the minimum speed is 0.01 m/s. The wave generator is able to make waves with frequency between 0.2 and 2.0 Hz, and the maximum wave height is 0.3 m. The duration of each test is about 150 s. A rope holds the platform attached to the bottom trailer. In the numerical simulation, towing speed was replaced by setting flow velocity, since this is a major assumption of the current study. The numerical and experimental semisubmersible platform models are shown in Figure 1. The origin of the coordinate system was defined at the center of the platform model. The main dimensions and hydrostatic parameters of the platform are shown in Table 1 and Table 2, respectively. The main instruments of the experimental tests and their range and error range are shown in Table 3.
In the numerical simulation, the smaller primary mesh size presents more accurate estimations of the flow field and the motion responses of the floating body. A large–scale ratio affects the size of grid, which gives rise to wave attenuation, motion distortion, and so on. However, the number of grids increases significantly with decrease of the scale ratio, which results in redundant computing costs. Considering the conditions of the numerical simulation, a ratio of 1:20 is used in the numerical simulation.
It is necessary to determine the size of the model structure before model tests. To simulate the physical mechanisms and hydrodynamic properties of fluids, the model test and the prototype must follow three principles, including geometric similarity, kinematic similarity and dynamic similarity. Considering the cost of computation time, the capacity of the wave maker, and the size of towing tank, the model scale of the experimental tests was determined as 1:100 in this study.

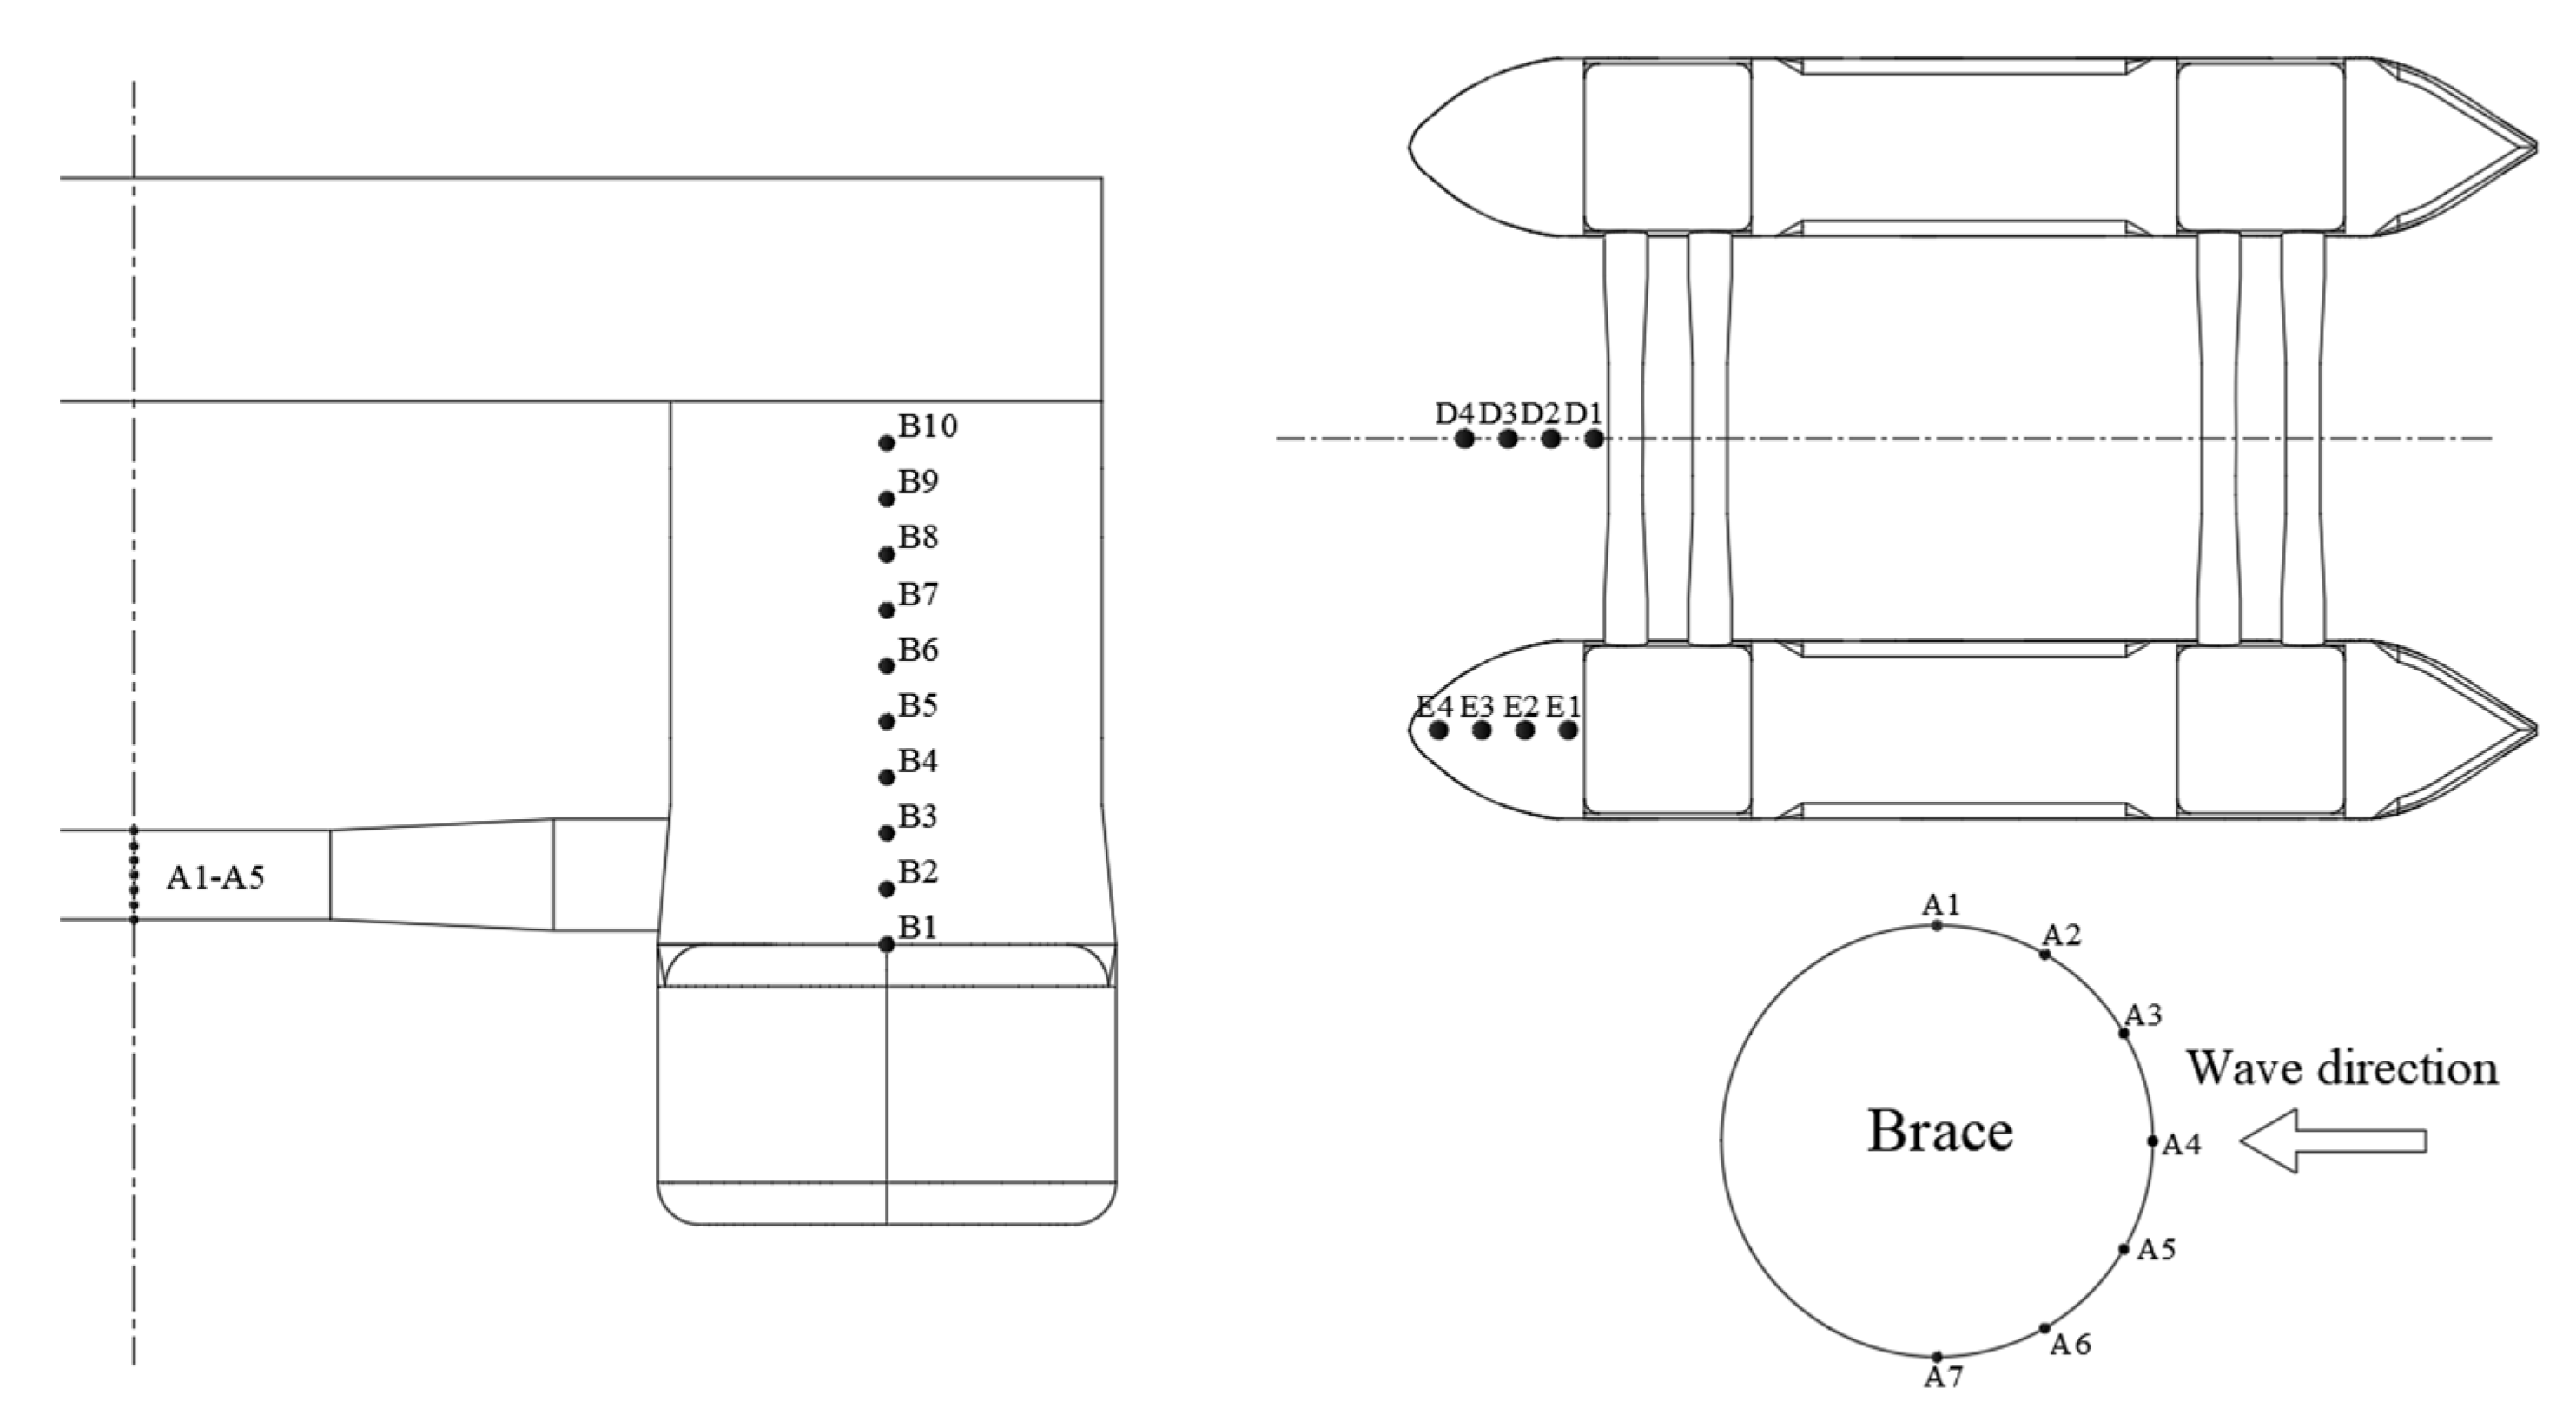
3.2. Platform Monitoring Point Location

Under towing conditions, the front surface of the platform is vulnerable to wave–slamming. Figure 2 shows the distribution of monitoring points and wave height gauges on the semisubmersible platform. The wave pressure monitoring points on the brace and column of the semisubmersible platform are marked as A1–A5 and B1–B10, in order to measure the wave climbing height under the cross brace and in front of the column. To measure run–up height of the wave under the brace and in front of the column, four wave height, D1–D4, were set under the brace and four wave height meters, E1–E4, were set in front of the column at the computational domain in numerical simulation.

3.3. Design Calculation Working Conditions

The wave pressure and water ridge on the platform under different wave conditions was studied. The wave period, wave height and towing speed of these 20 cases are shown in Table 4, where H is the wave height, T denotes the wave period and V is the towing speed. The wave height, wave period and towing speed are full–scale dimensions/velocities. For each wave, about 100–150 wavelengths were run in the experiment, and about 20–30 wavelengths were run in the numerical simulation. Regular wave pressure curves could be obtained. According to the Marine Towing Guide published by China Classification Society, the towing speed of the tug in still water must not be less than 5 kn/s, considering the towing safety under wave conditions, a towing speed of 2 m/s was selected. Future studies should investigate more towing speeds.

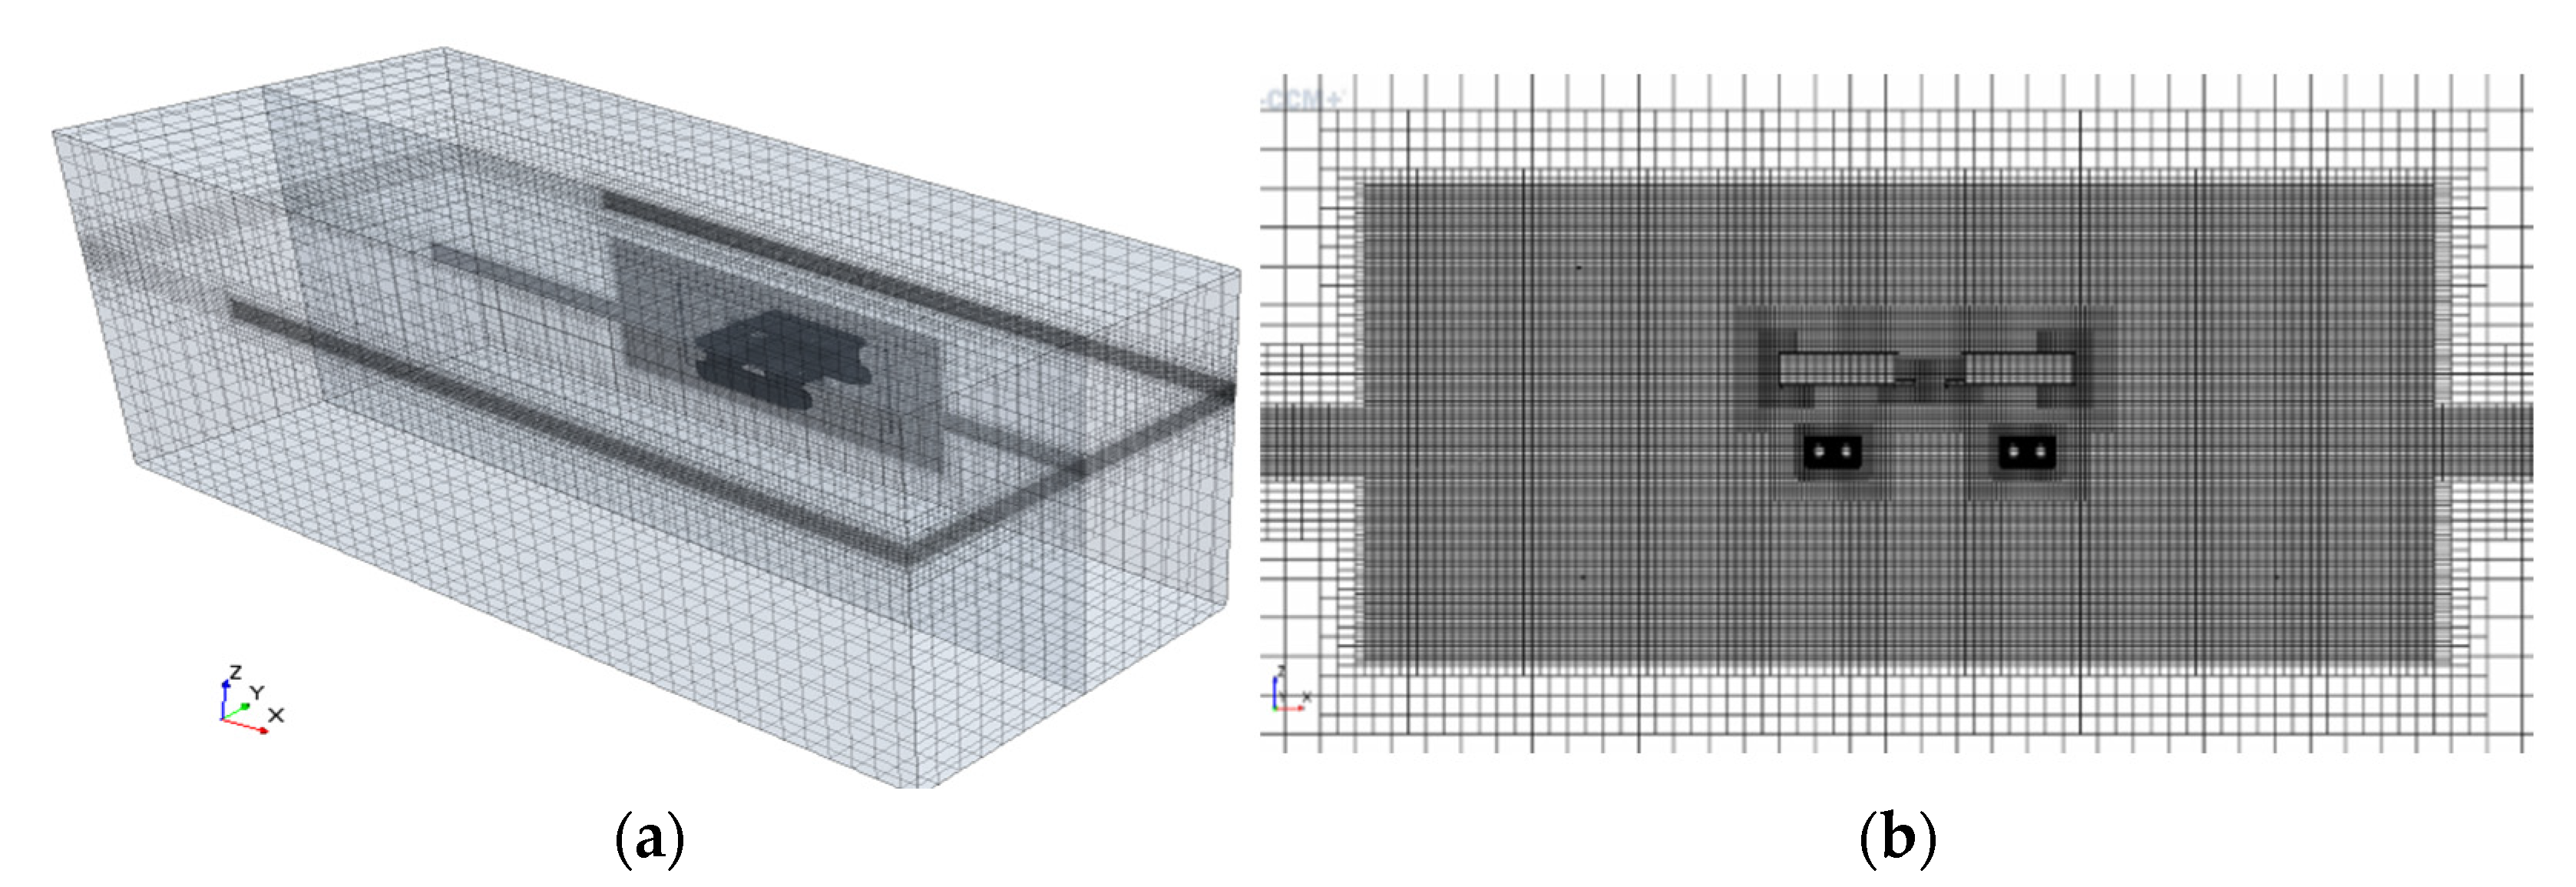
3.4. Computational Domain and Grid Generation

In this study, a rectangular parallelepiped calculation domain of 39.75 m × 22.00 m × 12.00 m was adopted. The free liquid surface acted as the dividing line in the numerical wave tank with gas on the top and liquid on the bottom. The distance of the entrance and exit of the calculation domain to the center of mass of the platform was 13.1 m (about 1.0λ–1.5λ) and 26.5 (about 2λ–3λ) m, respectively, where λ is the wavelength. Figure 3 shows the 3–D numerical wave tank.
The overlapping grid technology in CFD software STARCCM+ was used to mesh the semisubmersible platform. The free surface part adopted a prismatic grid, and the cut volume grid was used for the rest part. The computational domain grid and the overlapping area grid are shown in Figure 4. The basic size of the overlapping grid was about 1/50 of the total length of the platform, i.e., 1 m. The minimum relative size of the platform surface grid was 0.1 m. The basic size of the overlapping grid is consistent with the basic size of the computational domain. The mesh sizes of focused areas, including free surface, brace, column and buoyancy tank surface were refined. Since the exit of the computational domain is the dissipation region, the grid of the water surface in the dissipation region was not encrypted to minimize the number of grids and reduce the computation time. To accurately capture the nonlinear characteristics of waves and verify the accuracy of the numerical tank, a fifth–order Stokes regular wave was adopted. There were 10–20 grids in a wave height range and 60–100 grids in a wavelength range.

4. Validation of Numerical Models

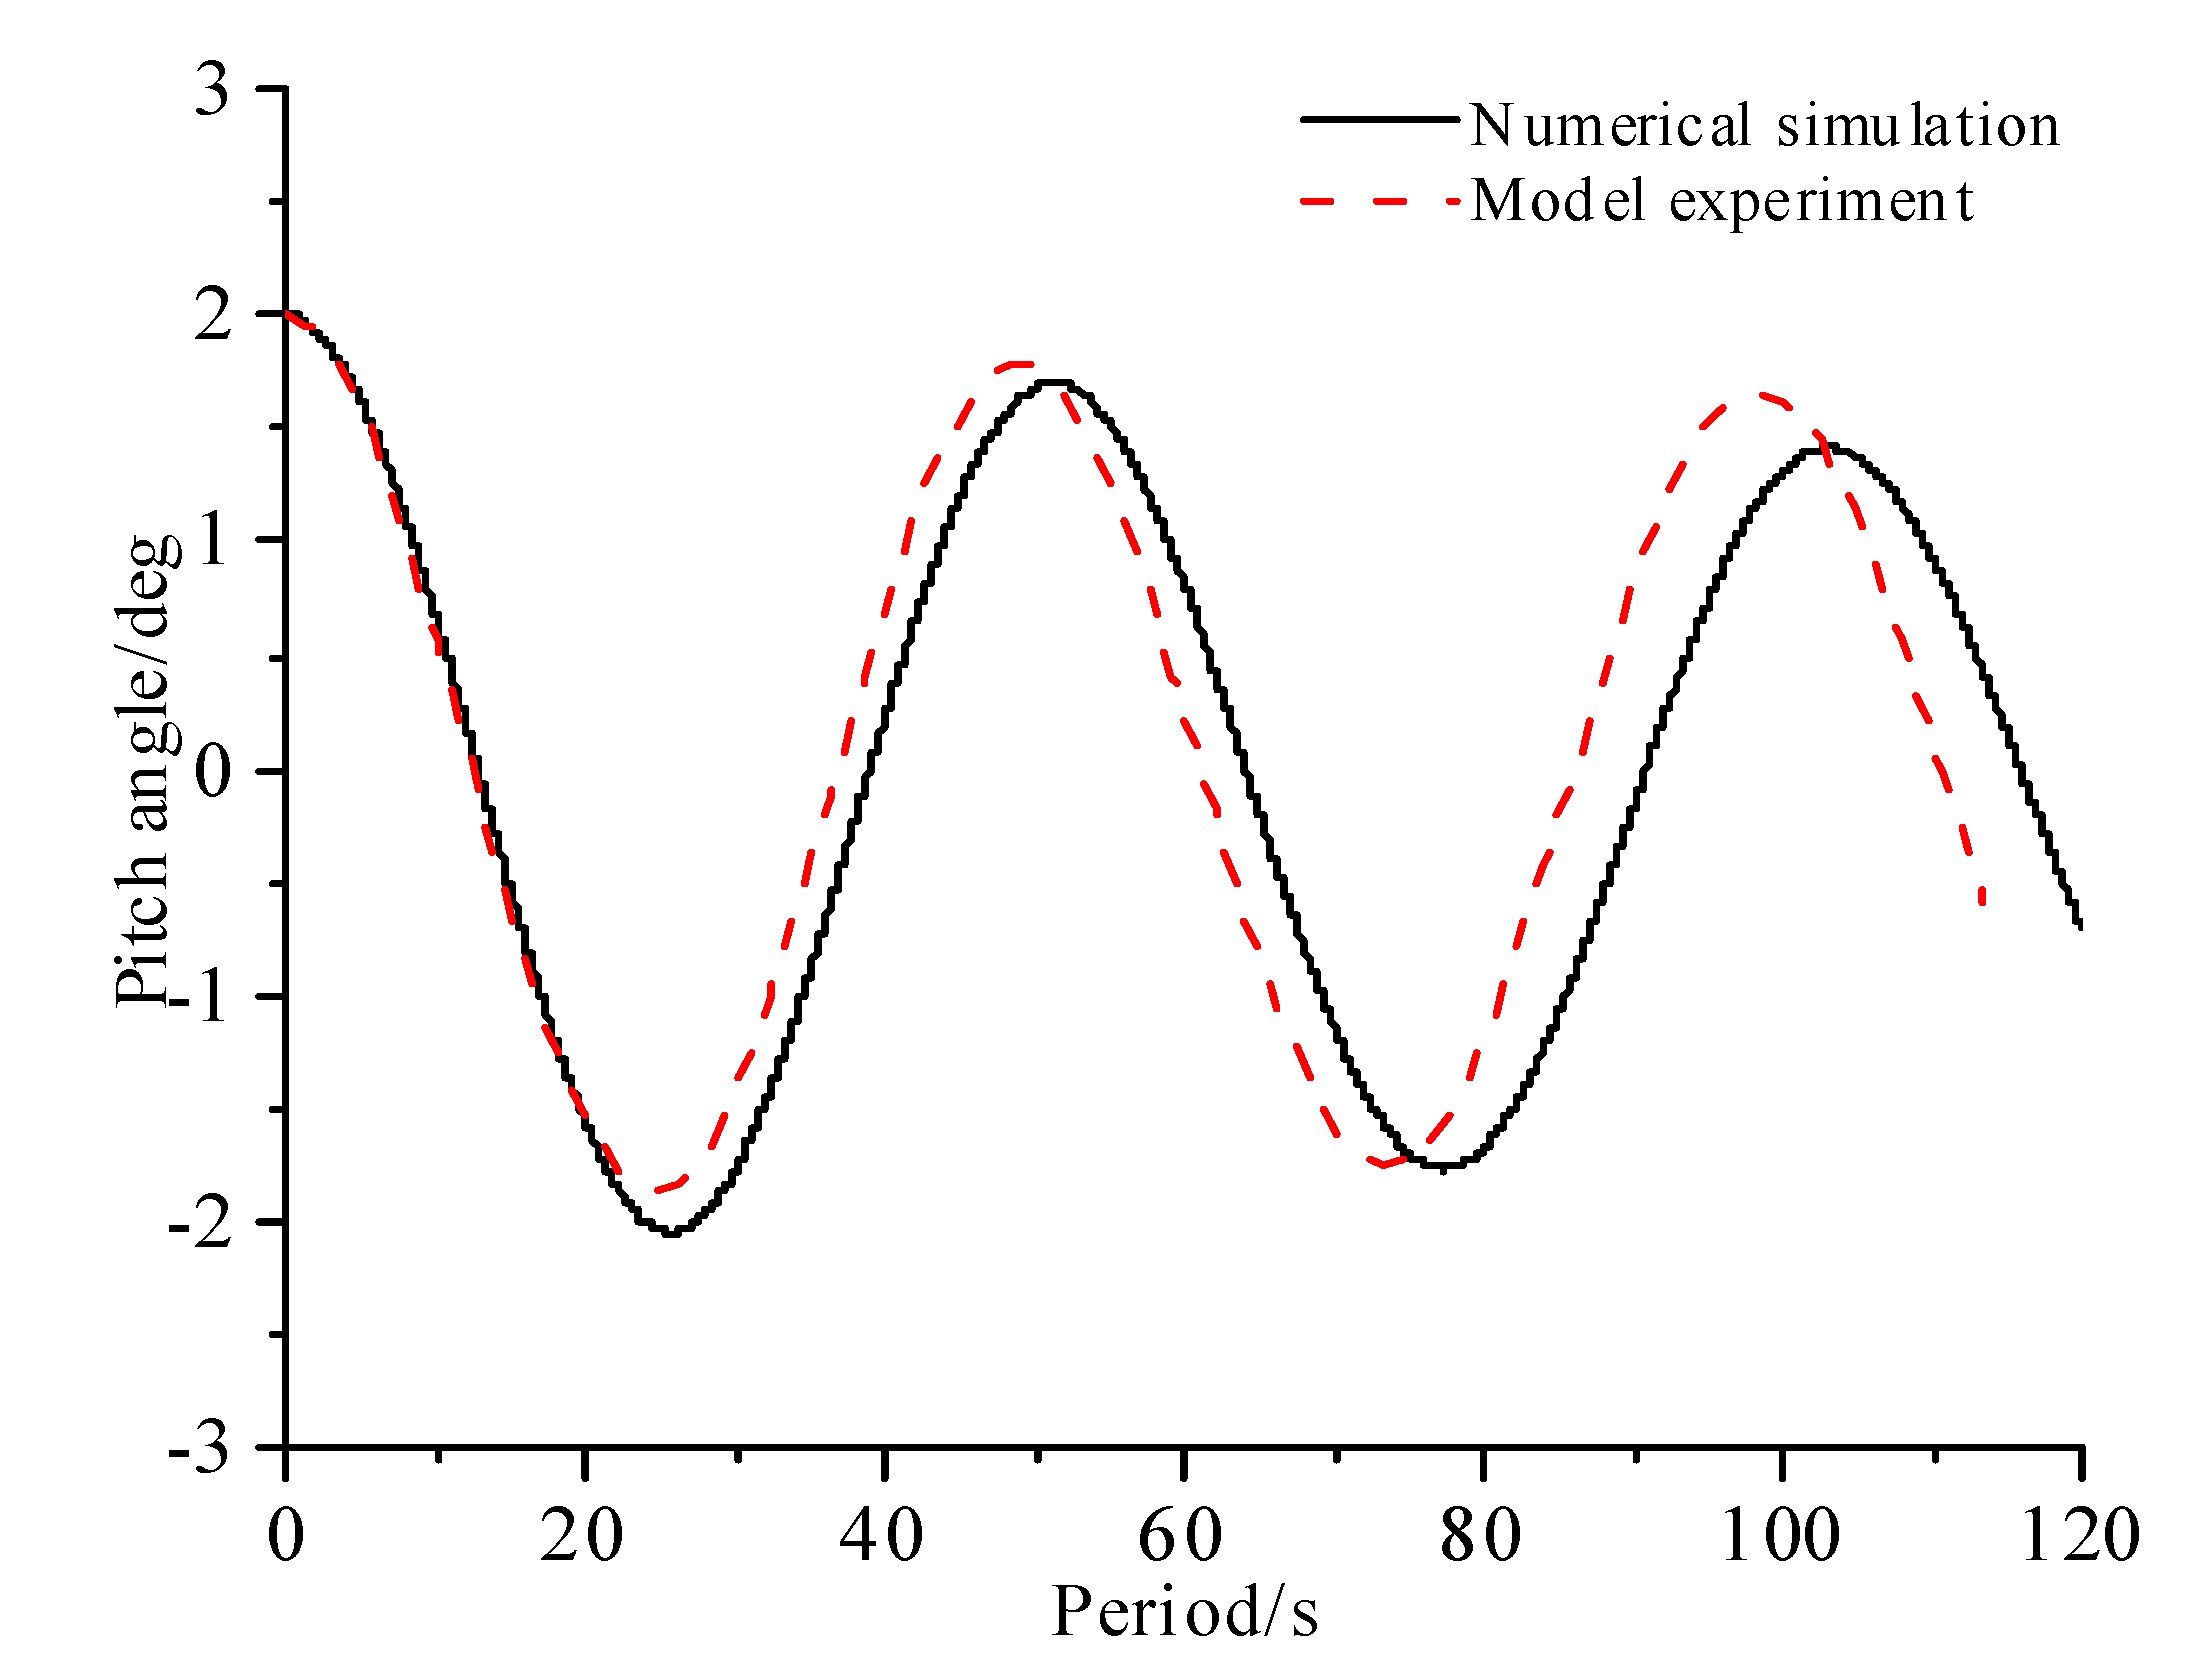
4.1. Attenuation Test with Experimental Results

In the experimental tests, when the platform model is in the static floating state, a certain torque is applied by external force, and then the force is released to make the platform move freely. The pitch, roll and heave motions of the platform are measured by the six degrees of freedom motion measurement system, which can obtain the natural period and other parameters of the model under this draft condition. The specific measurement method is a coordinate system determined by a calibration rod. A measurement plane is determined by three fluorescent balls on the surface of the platform. The motion data of the fluorescent ball in the determined coordinate system is captured through a high–speed camera when the platform moves, and the data is processed after measurement. One of the fluorescent balls is used as the base point, and the relative coordinates of the base point ball with respect to the platform center of gravity are input. Finally, the six degree of freedom motion responses of the platform are calculated and output.
In the numerical simulations, the numerical model at rest (zero displacements) is generated and then the numerical simulation is initialized by assigning a load. The numerical model is rotated to a certain level and then it is released so that it decays freely.
Free–decay tests in heave, roll and pitch were conducted to get natural periods of the semisubmersible; the pitch decay curves are compared in Figure 5. The numerical and experimental natural periods are shown in Table 5, where the differences between the experimental and numerical heave, roll and pitch natural periods are 2.6%, 0.32% and 3.2%, respectively. The results are relatively close, and the difference is under 5%, which verifies that the numerical model is accurate enough.

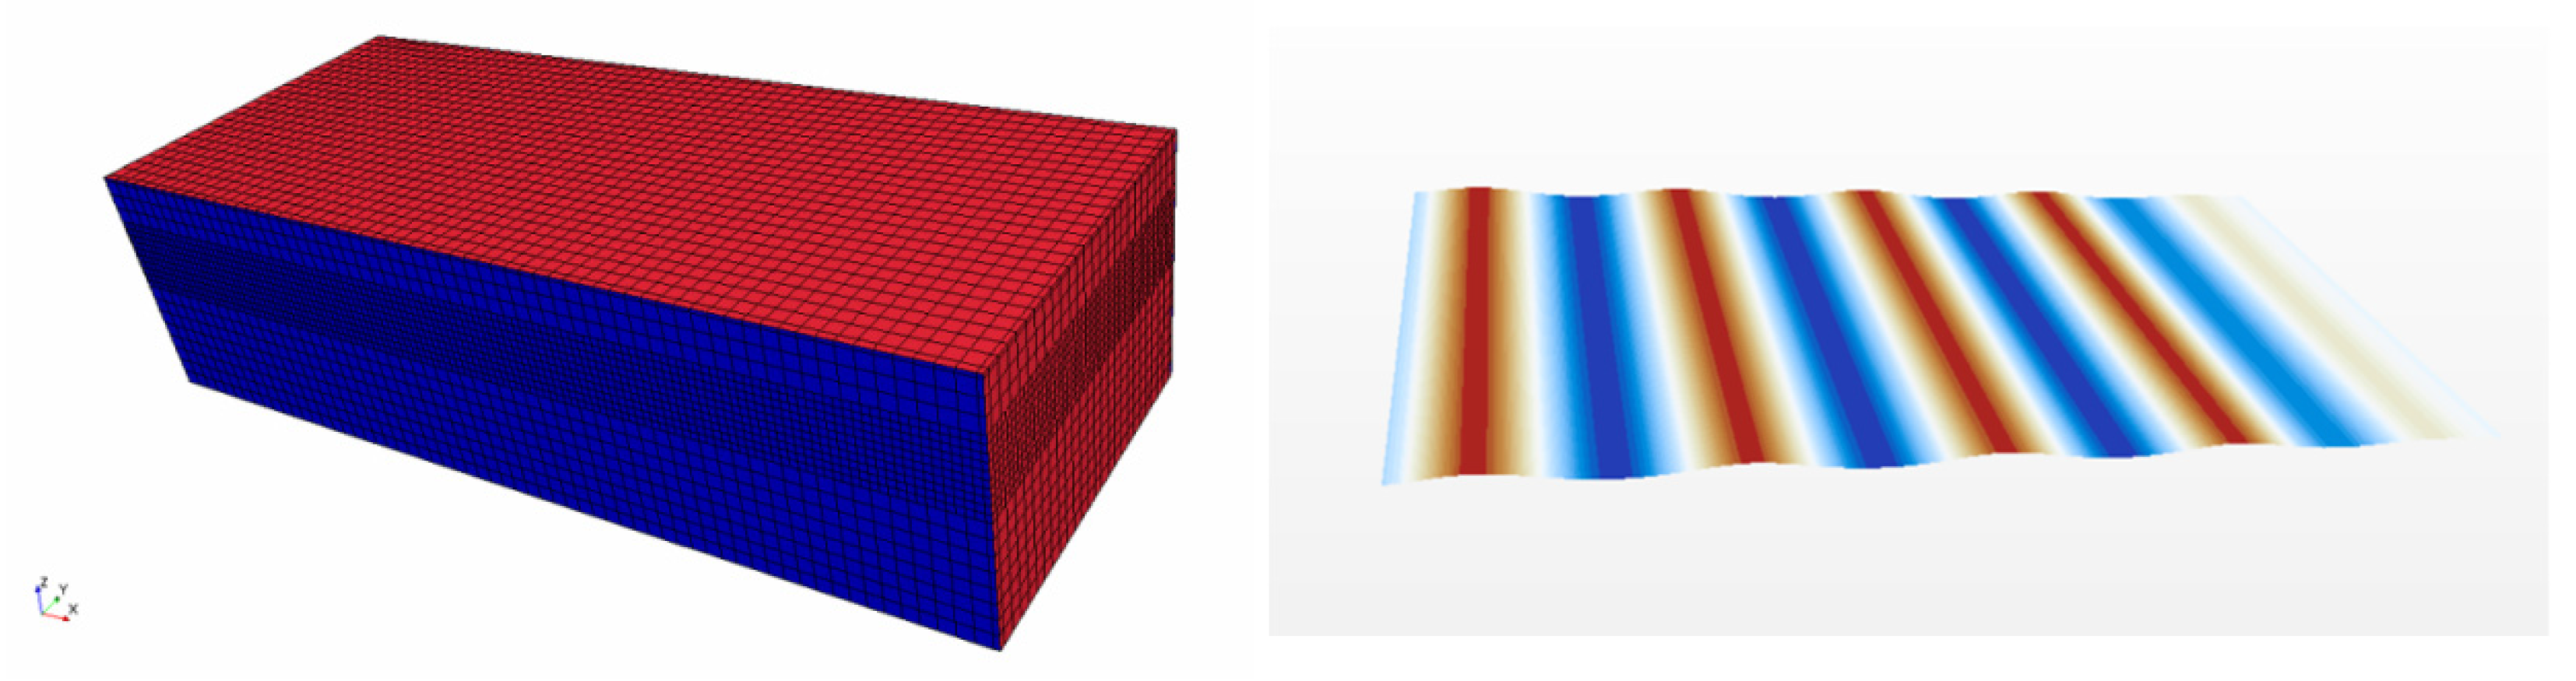
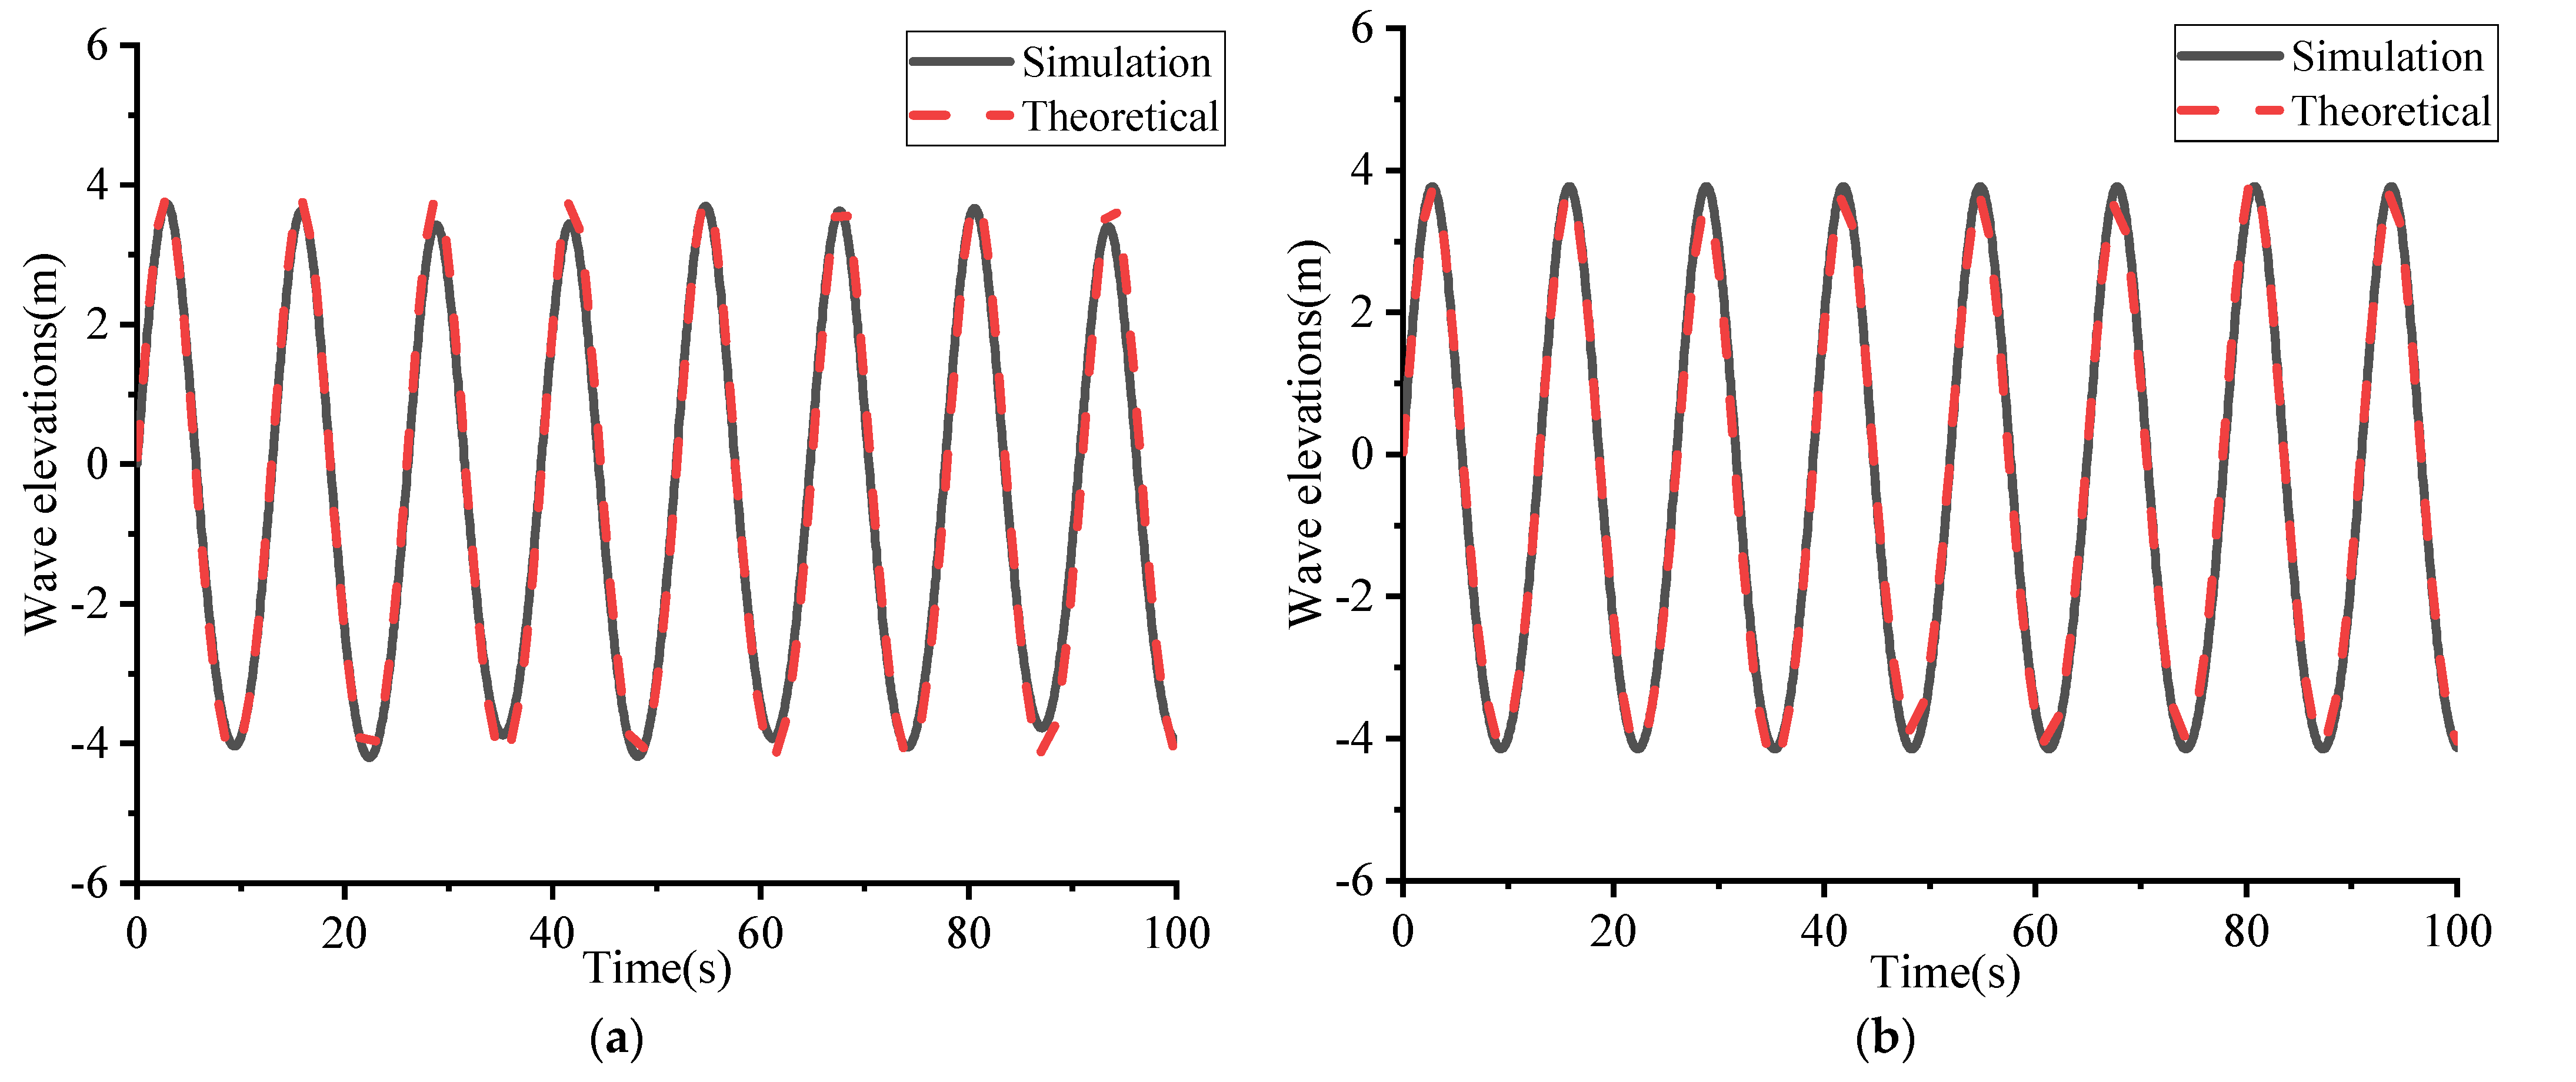
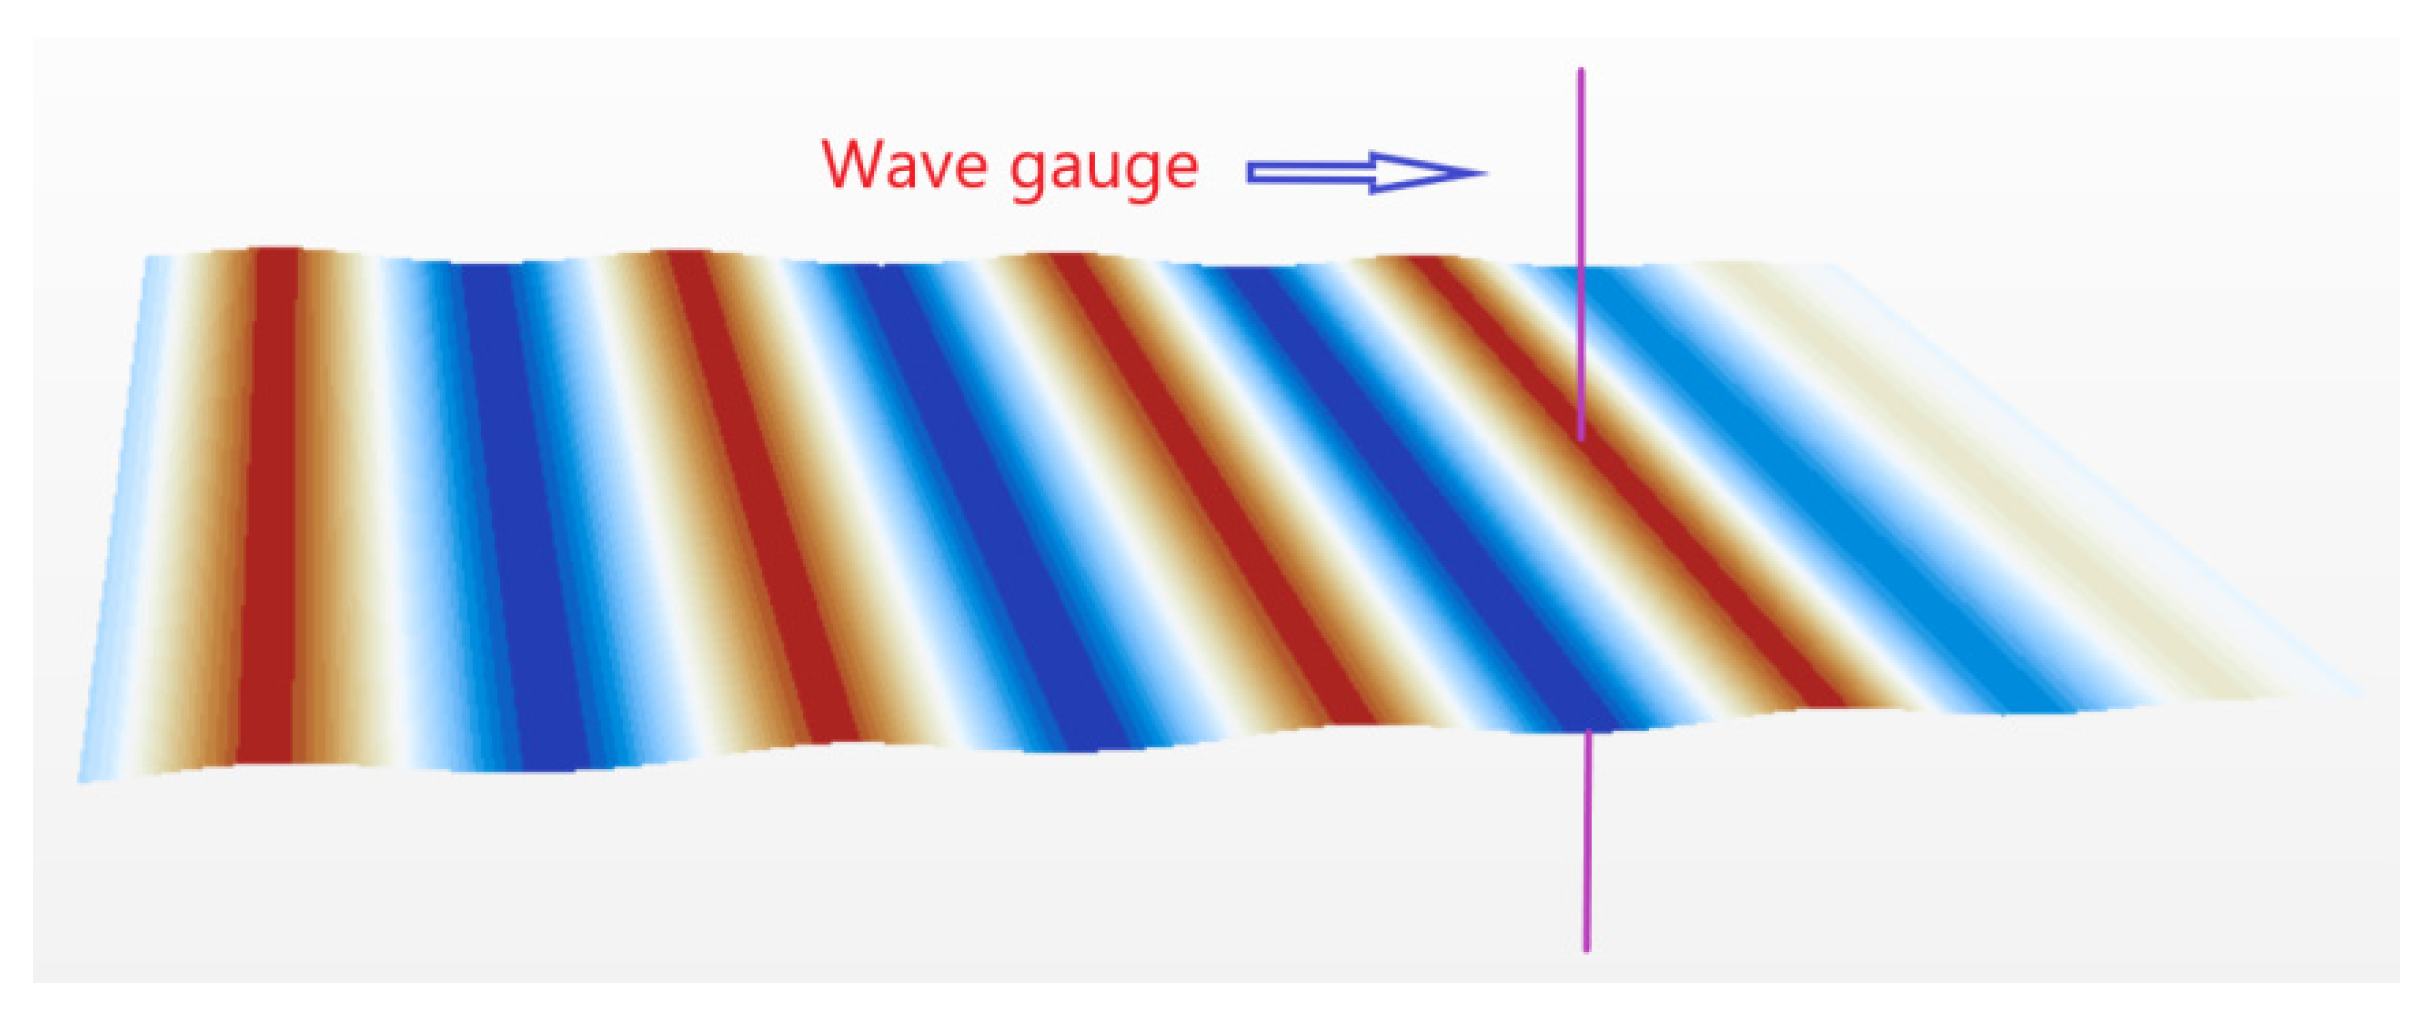
4.2. Simulation and Theoretical Comparison of Numerical Wave Generation

The CFD software STARCCM+ was used in this study, the monitoring points were set in the numerical wave tank to obtain the wave elevation time series. Two monitoring points were placed at the inlet (4 m) and middle (12 m) to track wave elevations, and the numerical results were compared with the analytical tests, as seen in Figure 6, where good agreements between them can be found. This shows the accuracy of the numerical wave tank in simulating a fifth–order regular wave.

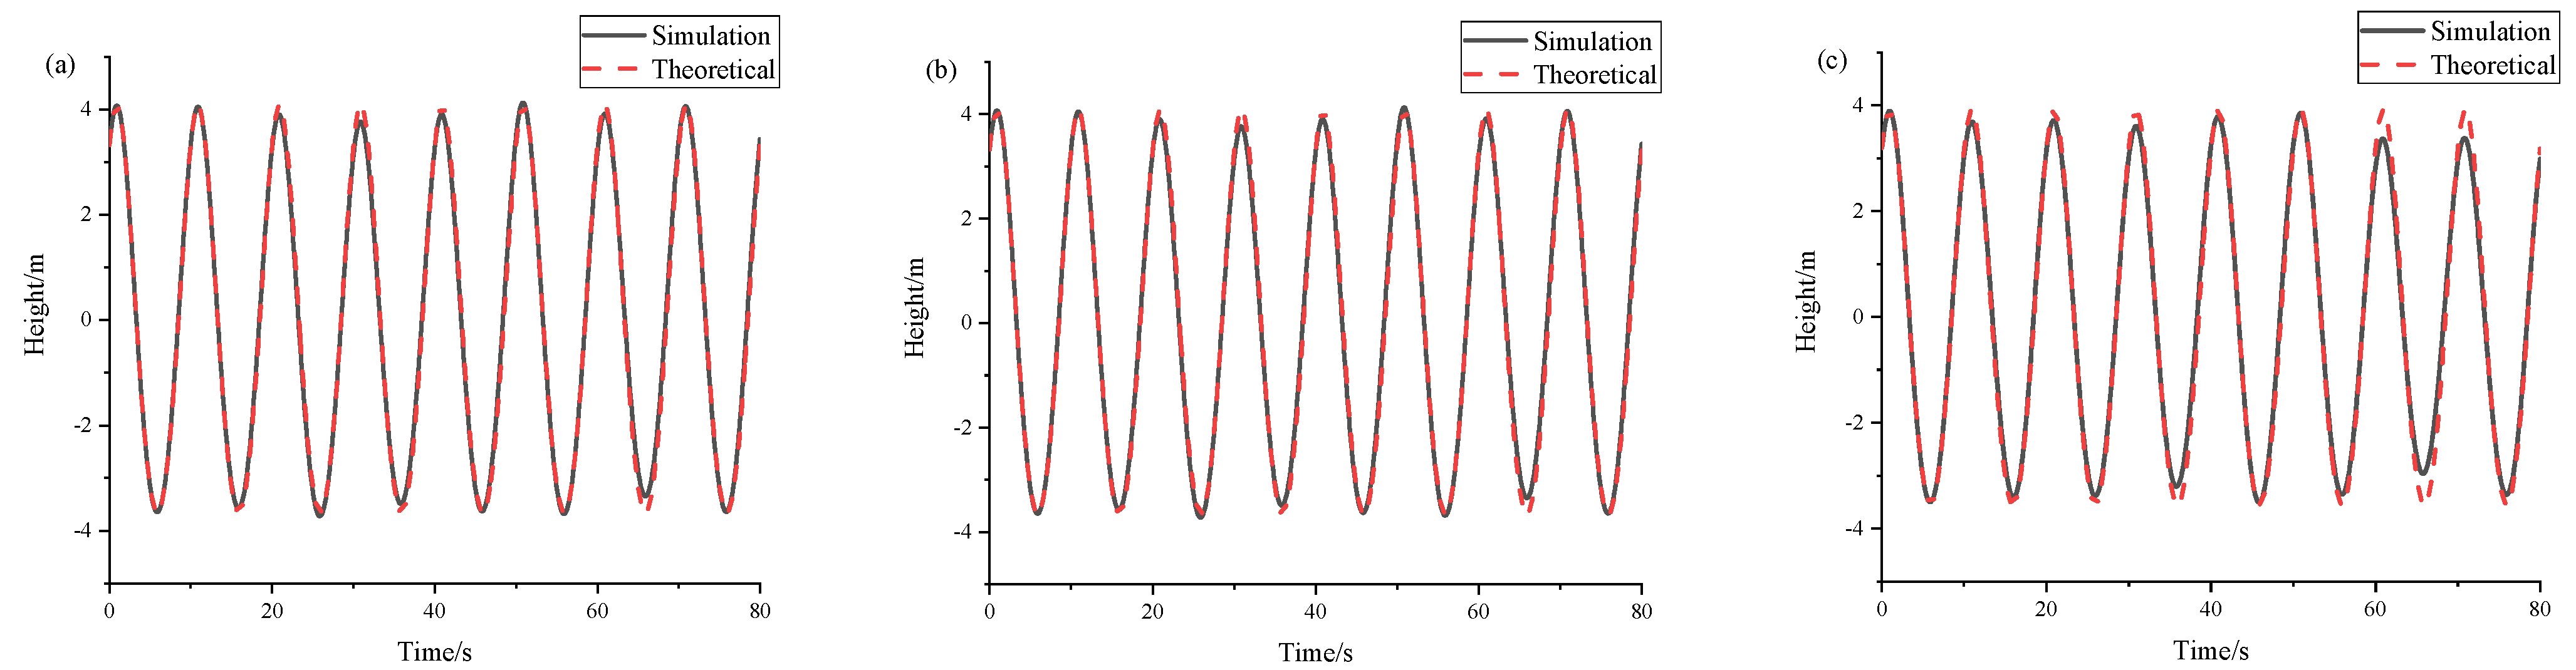
4.3. Verification of Convergence of the Numerical Tank Grid

A change of mesh size has a significant influence on the attenuation of waves. Among them, the foundation size has the greatest influence on the accuracy of wave simulation. In the numerical simulation, the mesh size of the overlapping area was closely associated with the foundation size. The arrangement of the wave gauge in the numerical wave tank is shown in Figure 7. This was used to calculate the influence of the following different mesh sizes on the results.
In this study, a typical case (T = 10 s and H = 8 m) was chosen to verify the grid setup of the numerical simulation. As shown in Figure 8, for the wave parameters after reduced transformation in the numerical simulation process (T ≈ 2.23 s, H = 0.4 m), the calculated wavelength was obtained as 7.76 m according to the wavelength λ (=1.56 T2). Three foundation sizes—1, 2, and 3 m—were used to study the influence of mesh size on the generated waves. As shown in Figure 8a,b, good agreement between the numerical solutions and theoretical ones for various mesh size values over the overall tested region are shown. With the increase of foundation sizes, a sizeable discrepancy between the numerical and theoretical results was seen. As shown in Figure 8c, there is apparent wave attenuation after the calculation time exceeds 15 s. By considering the accuracy of wave simulation and wave attenuation, a more stable mesh size setting with a foundation size of 1 m was used.

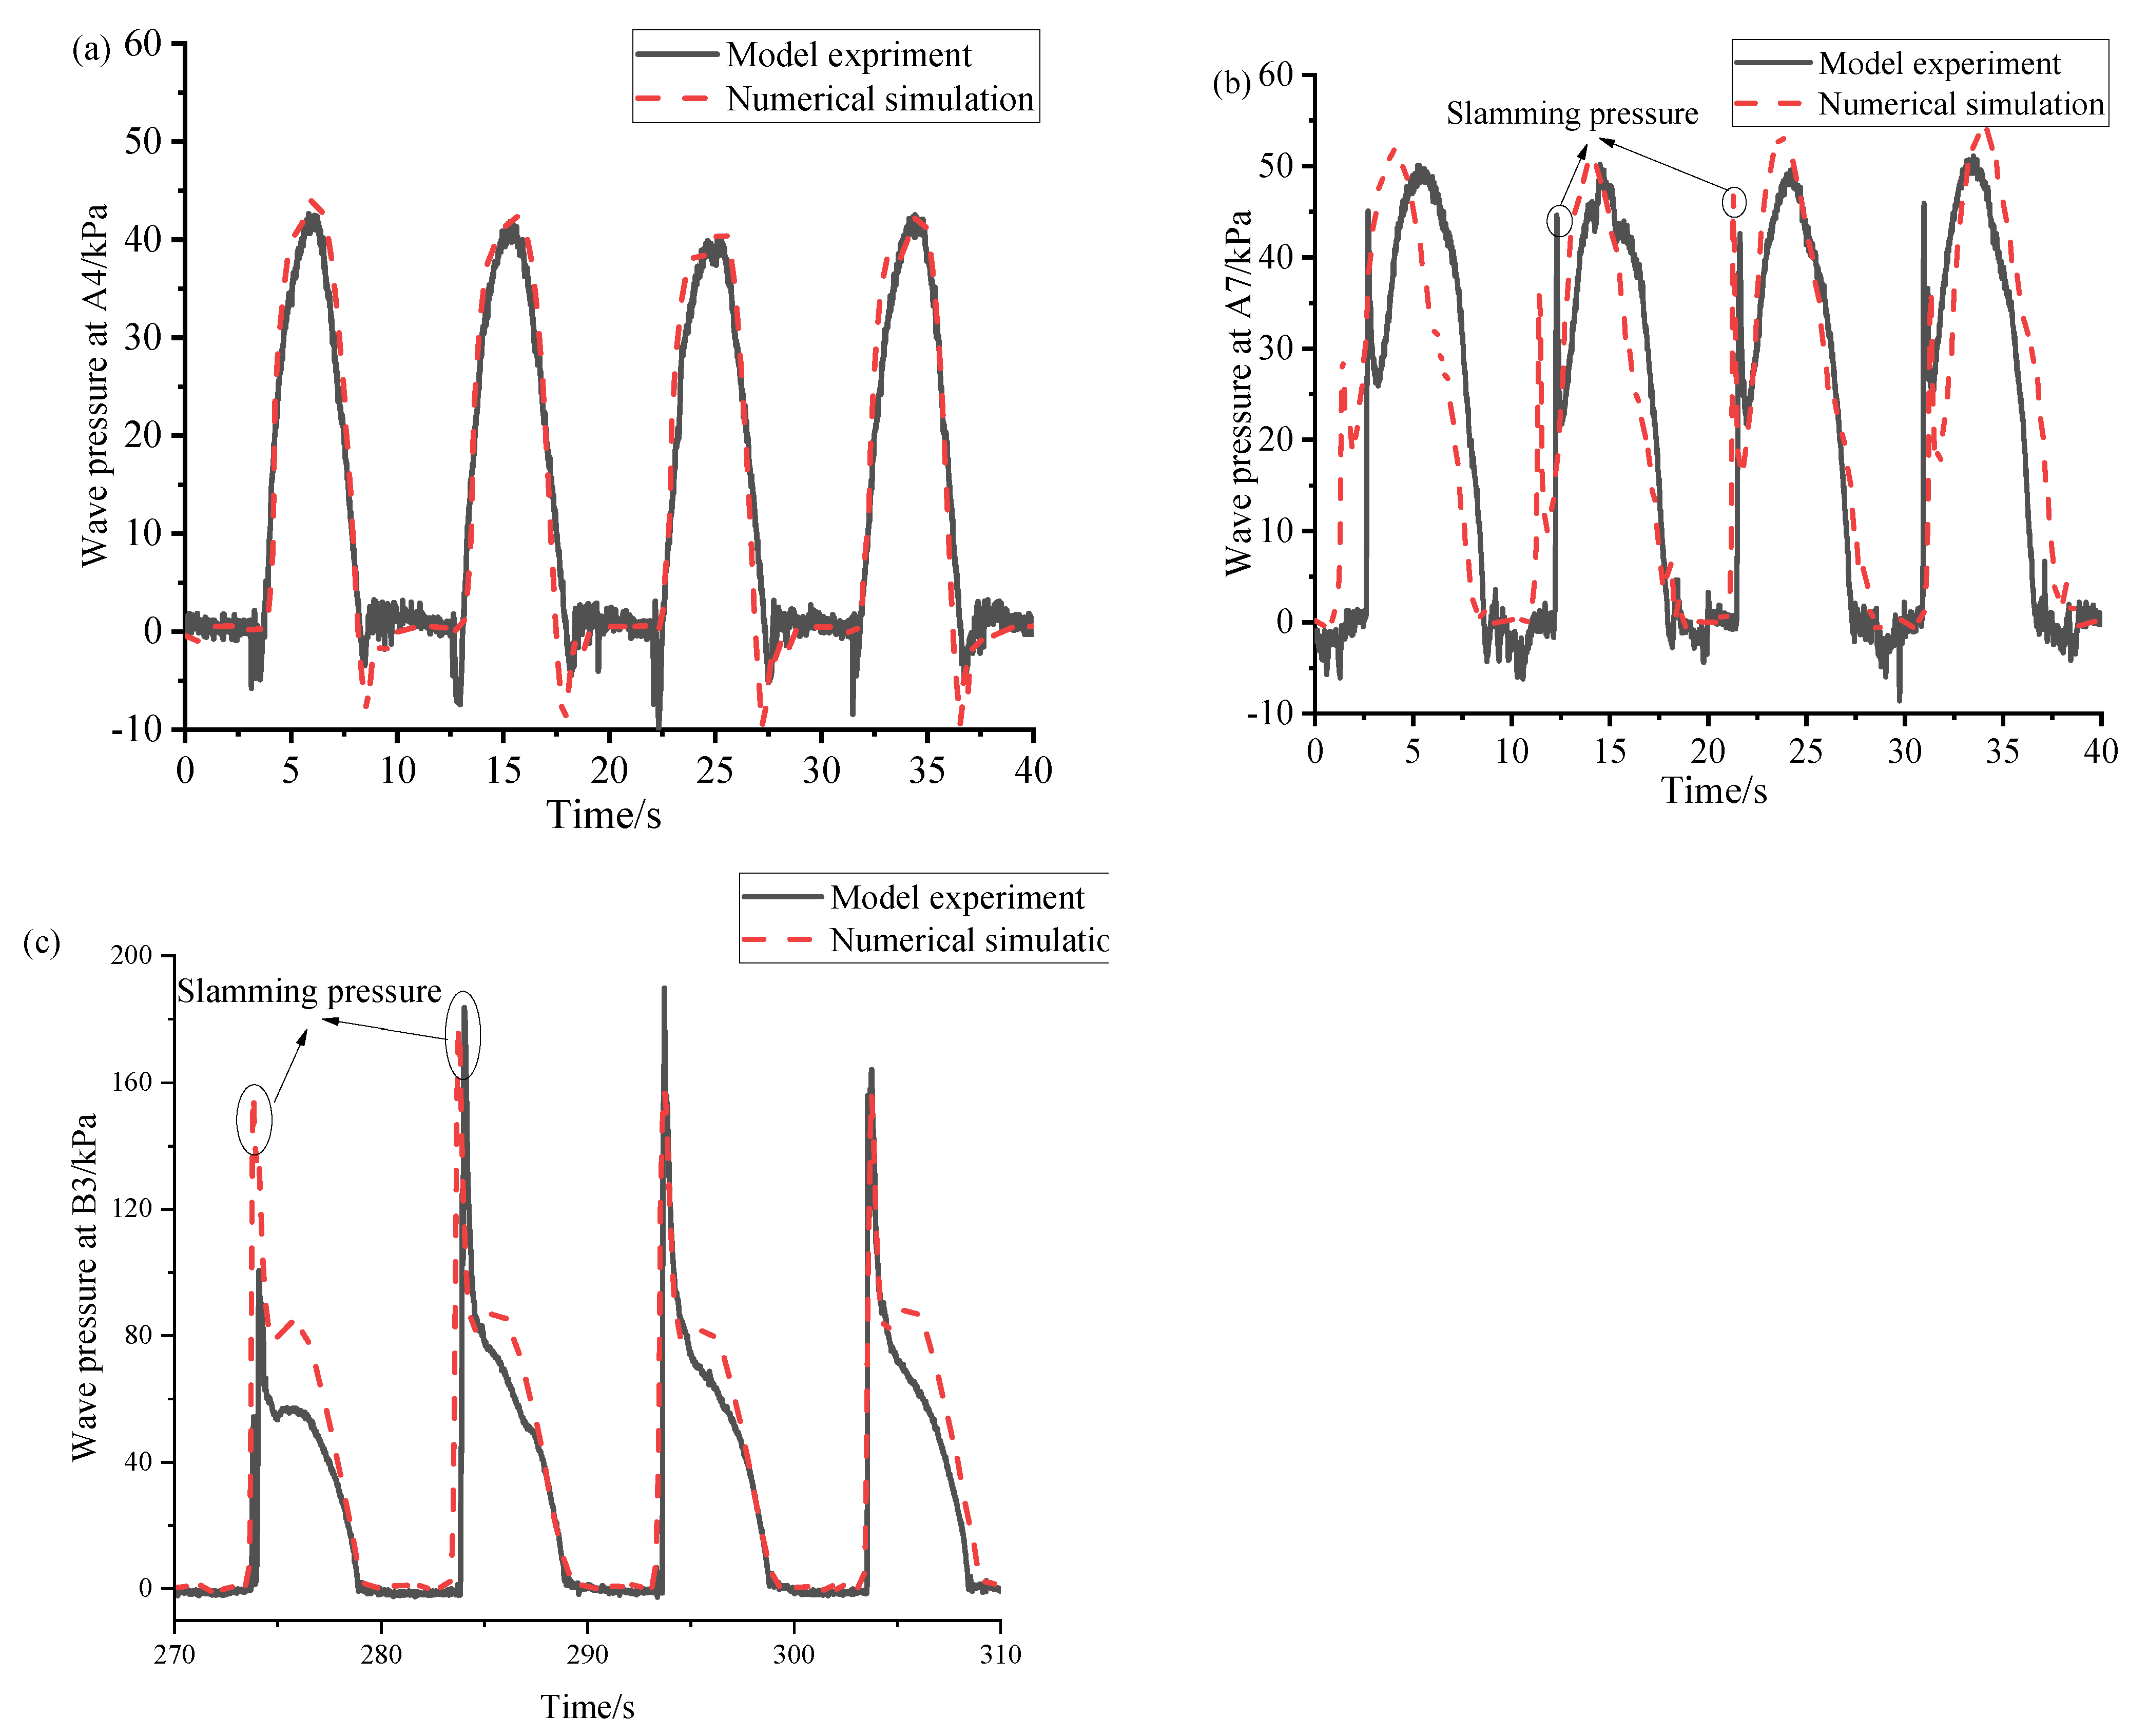
4.4. Comparison of Wave Pressure

Two typical working conditions were tested, and the experimental results were used to validate the accuracy and feasibility of the numerical model. The measured and simulated wave pressure time series were compared and the occurrence time, peak value and error range of slamming were investigated extensively. Generally, the calculated iteration time step in STARCCM+ was between 1/500 and 1/300 of the wave period, so the iteration time step was defined as 0.005 s.
A head sea wave condition with H (wave height) of 8 m, T (wave period) of 10 s and V (towing speed) of 2 m/s was studied, which correspond to H of 0.08 m, T of 1.0 s and V of 2 m/s in model tests. The working conditions selected to verify the wave pressure on the brace were H = 8 m, T = 10 s and V = 2 m/s.
The numerical and experimental wave pressure time series at the points A4 A7 and B3 (as shown in Figure 2) are shown in Figure 9, where four stable periods are used for comparison. The error analysis is shown in Table 5. In Figure 9 and Table 6, both the numerical and experimental results show that the wave pressure period is about 10 s, and the simulated wave pressure time series are similar to experimental ones. The difference between test and numerical simulation is greatest at monitoring point A7, where the average maximum wave pressure error is 4.9% and the average period error is 6%. This indicates that the numerical simulations are accurate enough and the model tests were well conducted.

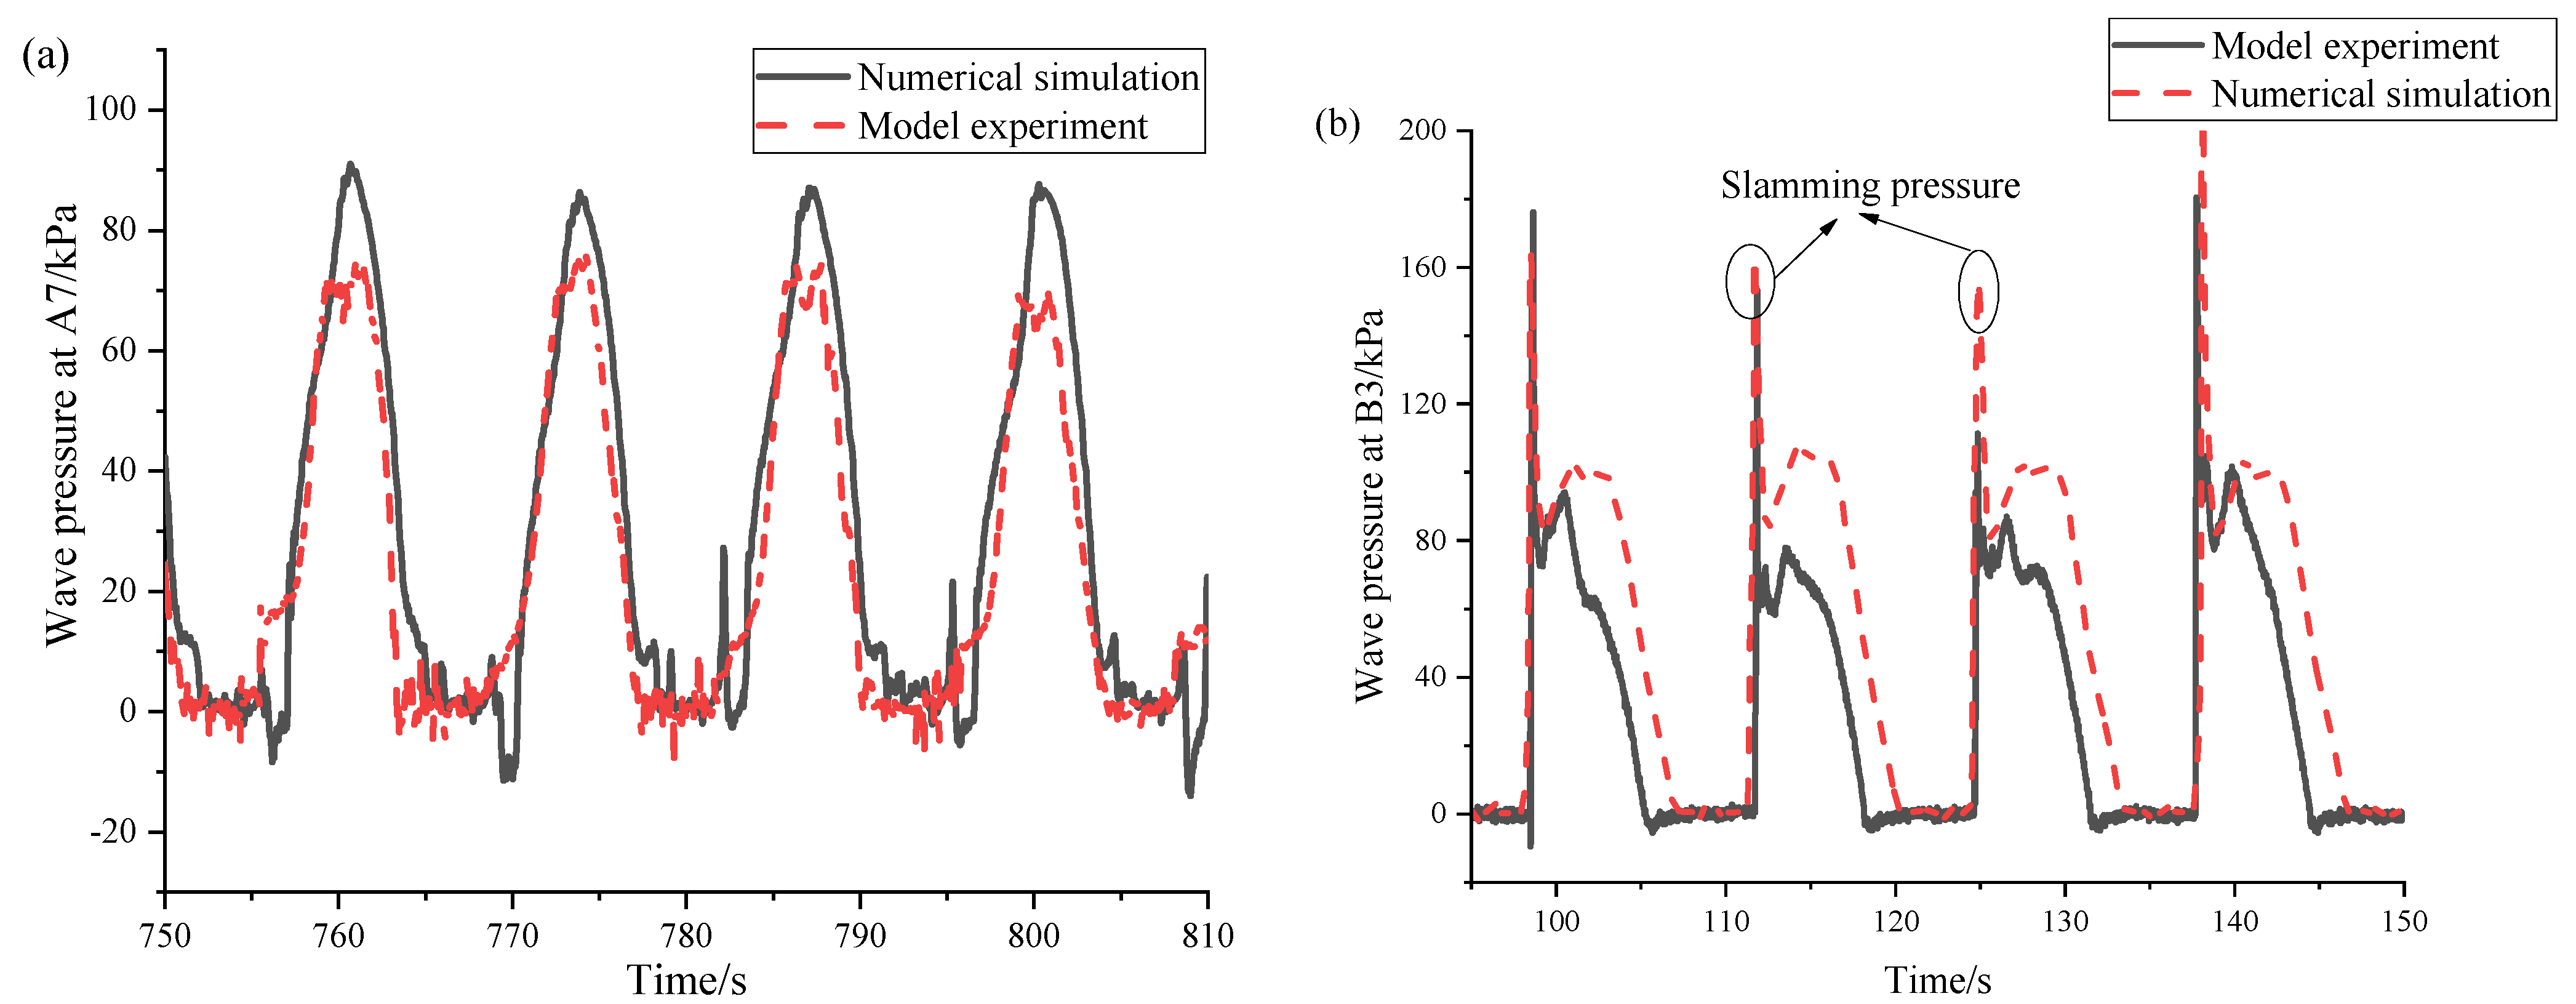
4.5. Comparison of Wave Pressure Caused by the Water Ridge

To verify the accuracy of the simulated wave pressure caused by the water ridge, the results of wave pressure on the brace under the C12 working condition (H = 20 m, T = 13 s and V = 2 m/s) were selected for comparative analysis. Figure 10 shows the comparison of wave pressure between the numerical simulation and the model test at monitoring point A7 and B3 of the brace under the C12 working condition. The error analysis is shown in Table 6. Figure 10 and Table 7 show that:
(1)
The period and time series of the numerical and experimental wave pressure load are in good agreement, and the average period maximum error is 1.6% at point B3.
(2)
The difference between the results of numerical simulation and the model test is mainly on the wave pressure value, and the average maximum wave pressure error is about 14.7% at A7 point. Double peaks can be found in the measured wave pressures during each period, while only a single peak is seen for the numerical data. During the model test, the rope used to tow the platform is flexible, and the platform moves under the action of waves during the towing test, resulting in uneven rope tension, which makes the platform sway back and forth and affecting the peak pressure.
The above analysis indicates that the numerical simulations are accurate and model tests were well conducted.

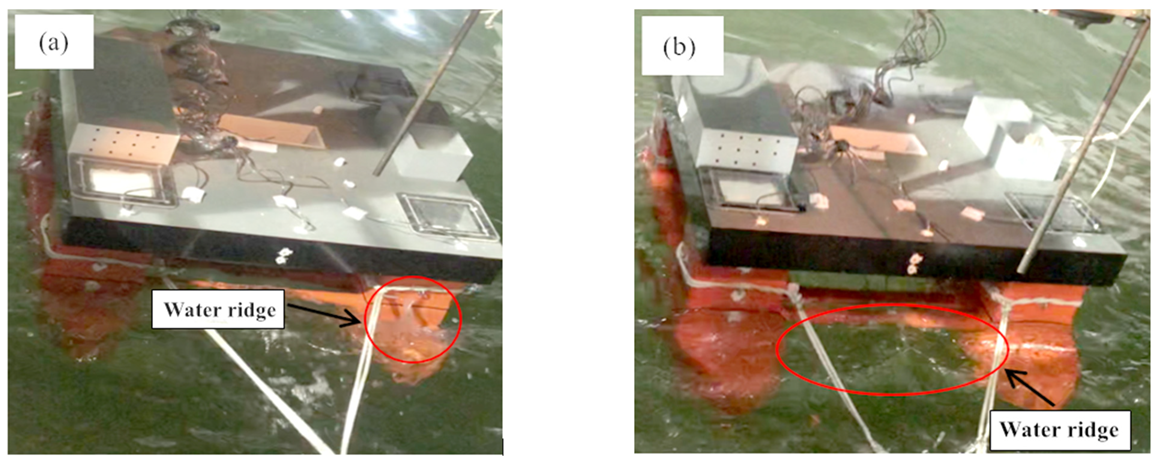
4.6. Water Ridge Phenomenon during the Towing Test

An obvious water ridge phenomenon was found during the towing test. Figure 11a shows the water ridge phenomenon when the platform enters the water, and Figure 11b shows the water ridge phenomenon when the platform exits the water. Figure 11 shows that the brace generates a strong water ridge when it exits the water. As shown in Figure 12 and Figure 13 in Section 5.1, this phenomenon is found in the numerical simulation, which shows that the results of the numerical simulation are accurate.

5. Study of Wave Pressure Characteristics and the Water Ridge on a Platform under Towing Conditions in a Numerical Simulation

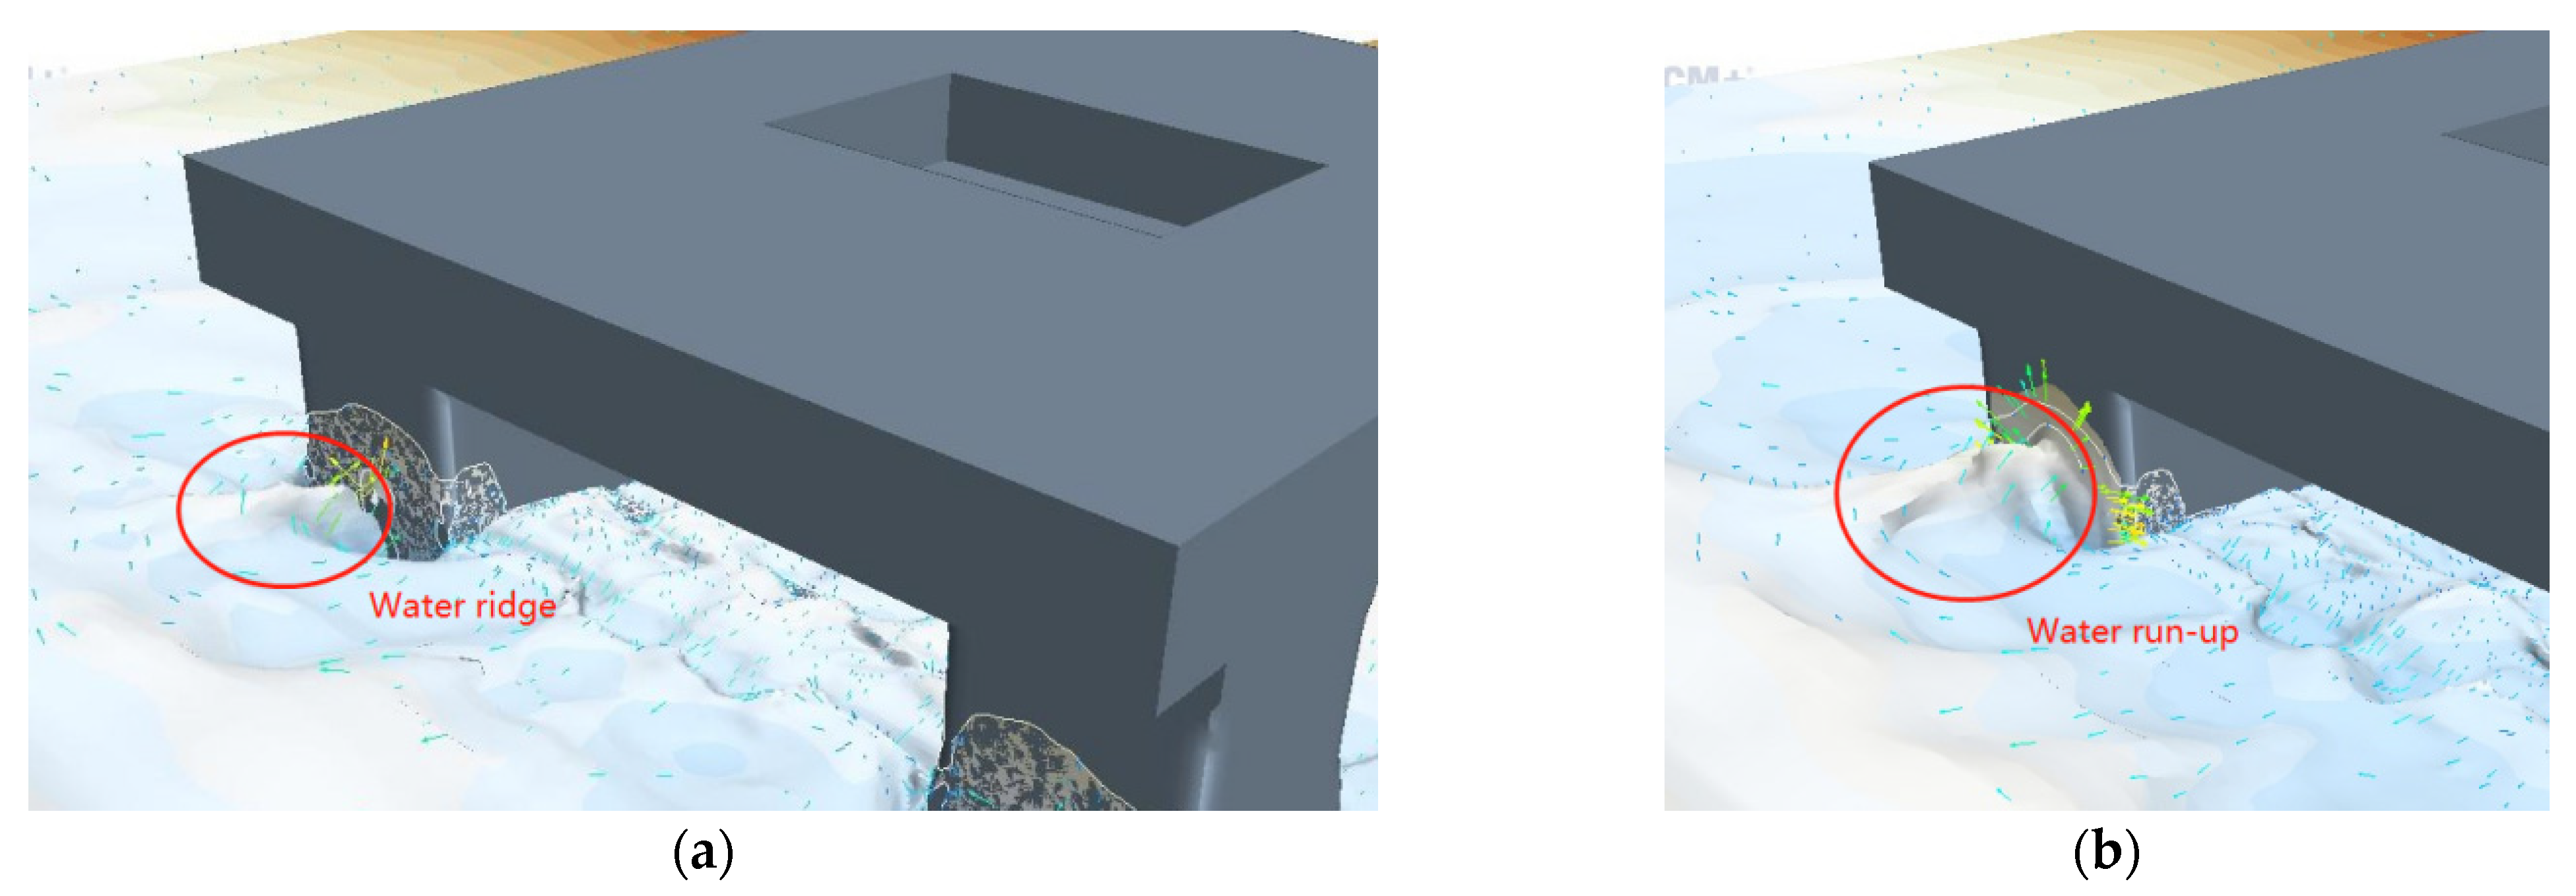
5.1. Study on Formation Mechanism of Water Ridge Phenomenon

5.1.1. Analysis of Water Ridge in front of the Column

When a water ridge in front of the column occurs, the instantaneous motion of the water particles is as shown in Figure 12, which shows that when the buoyancy tanks of the platform enter the water, the water on both sides of the buoyancy tanks crash into each other forming a water ridge. The waves gather when they form a ridge, and the wave–slamming pressure reaches a peak value when it impacts the column. Then a part of the water flows away from both sides of the column, a part of the water continues to run–up on the surface of the column, and the kinetic energy of the water is transformed into potential energy, which reduces the wave–slamming pressure on the column and rapidly increases the wave run–up height.

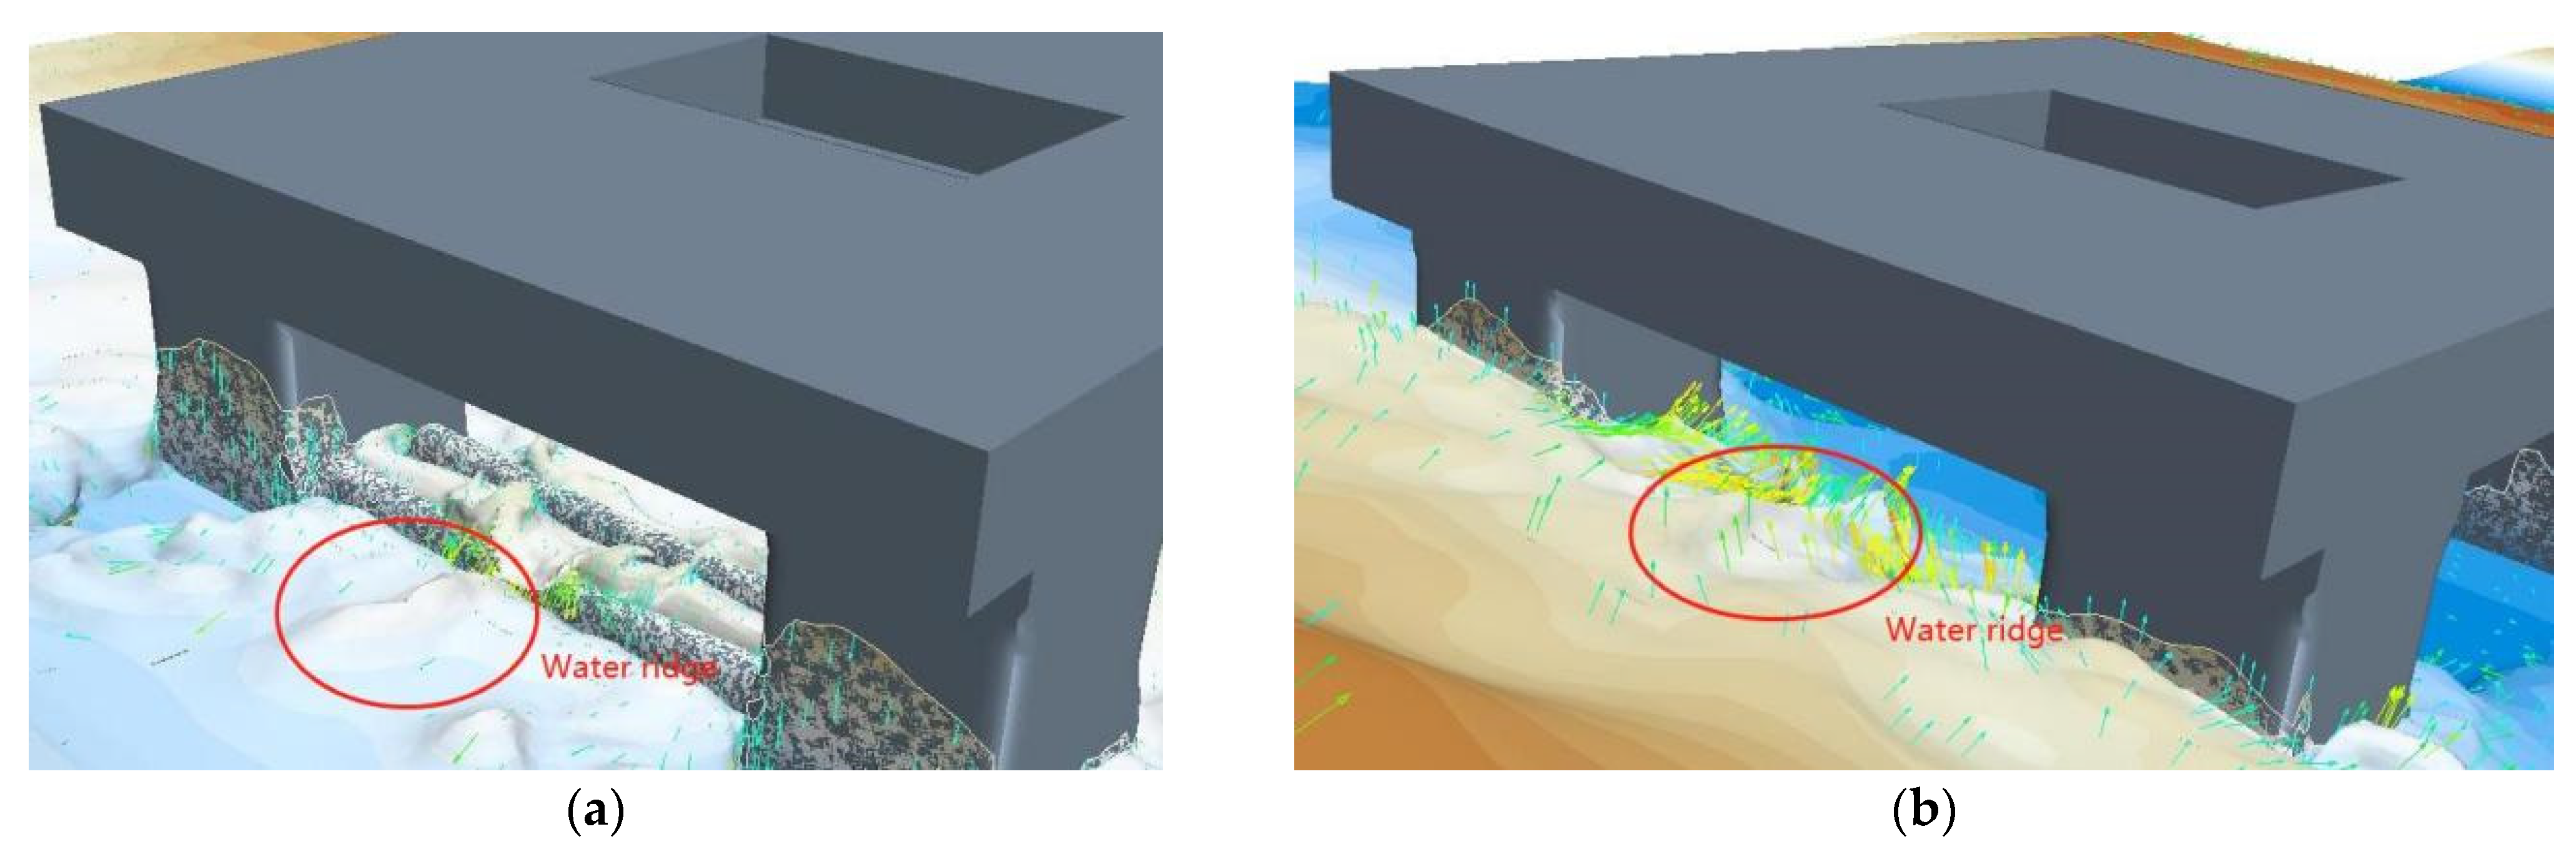
5.1.2. Analysis of Water Ridge under the Brace

The movement of water particles under the brace is shown in Figure 13, where Figure 13a shows the first water ridge and Figure 13b shows the second water ridge. In Figure 13, the water on both sides of the platform brace is squeezed due to the buoyancy tanks entering the water during towing. The waves gather under the brace and slam the lower surface of the brace, which generates the first water ridge.
Under the brace, the columns on both sides are slammed by the waves from the water ridge, part of the water flows away from the sides of the column, and part of water gathers in the middle. Water on both sides squeezes against each other, which causes a second water ridge, which is more severe than the first water ridge.

5.2. Study on Water Ridge Phenomenon under Different Wave Heights

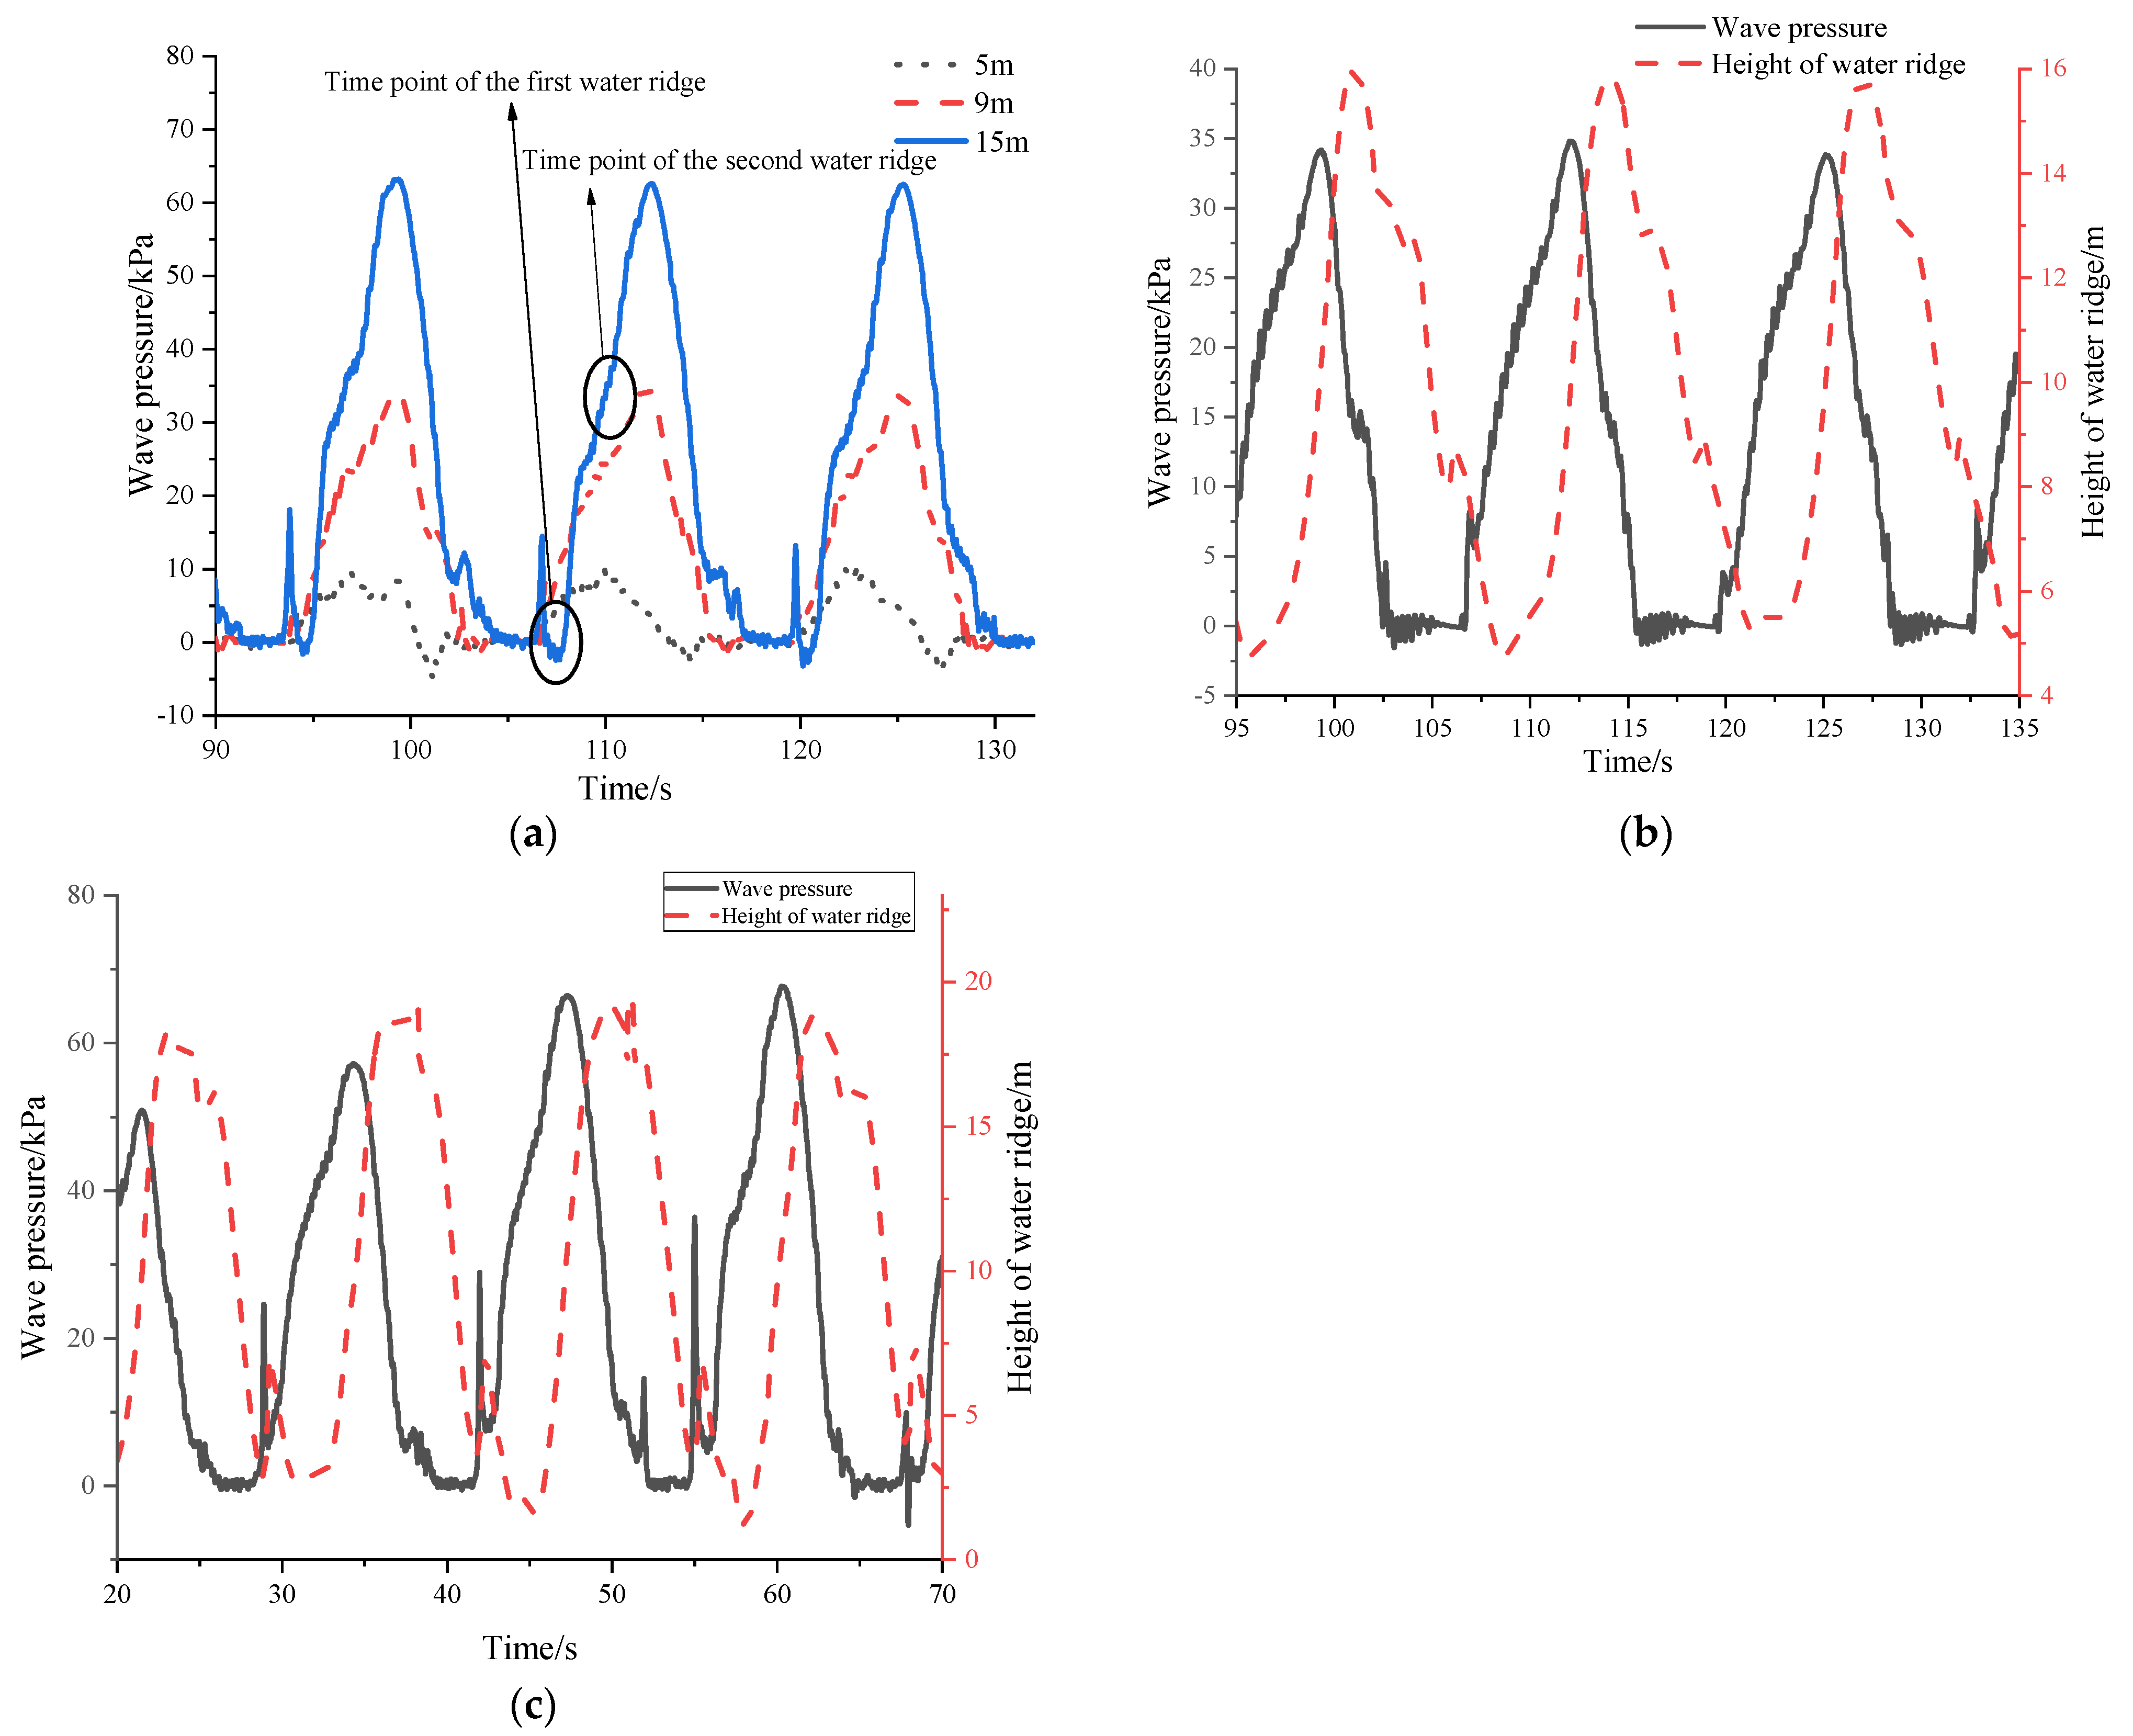
5.2.1. Analysis of Water Ridge on the Brace under Different Wave Heights

There was no water ridge under the brace in the C1 case, but it appeared once in the C2–C6 cases and twice in C7–C11 cases. Figure 14a shows wave pressure time histories of point A7 under different wave heights. Figure 14b shows the time history curves of the wave pressure of point A7 and the height of the wave run–up in the C5 case (H = 9 m, T = 13 s and V = 2 m/s). Figure 14c shows the time history curves of the wave pressure of point A7 and the height of wave run–up in the C11 case (H = 15 m, T = 13 s and V = 2 m/s). Figure 14 shows that:
(1)
When the wave height is 9 m, a relatively small wave pressure occurs near the time when the water ridge appears, and there are two water ridges when the wave height is greater than 10 m; Obvious wave pressure occurs under wave conditions with a wave height equal to 15 m, and the wave pressure is about 27% of the maximum water pressure.
(2)
A small wave pressure is generated when the first water ridge phenomenon appears, and the second water ridge mainly produces a large wave pressure.
(3)
The wave run–up and wave pressure under the brace are periodic, and the periods are roughly equal, with a phase difference. With a water ridge at a wave height of 9 m, the maximum value of wave pressure occurs near the time when the wave runs up to the top.

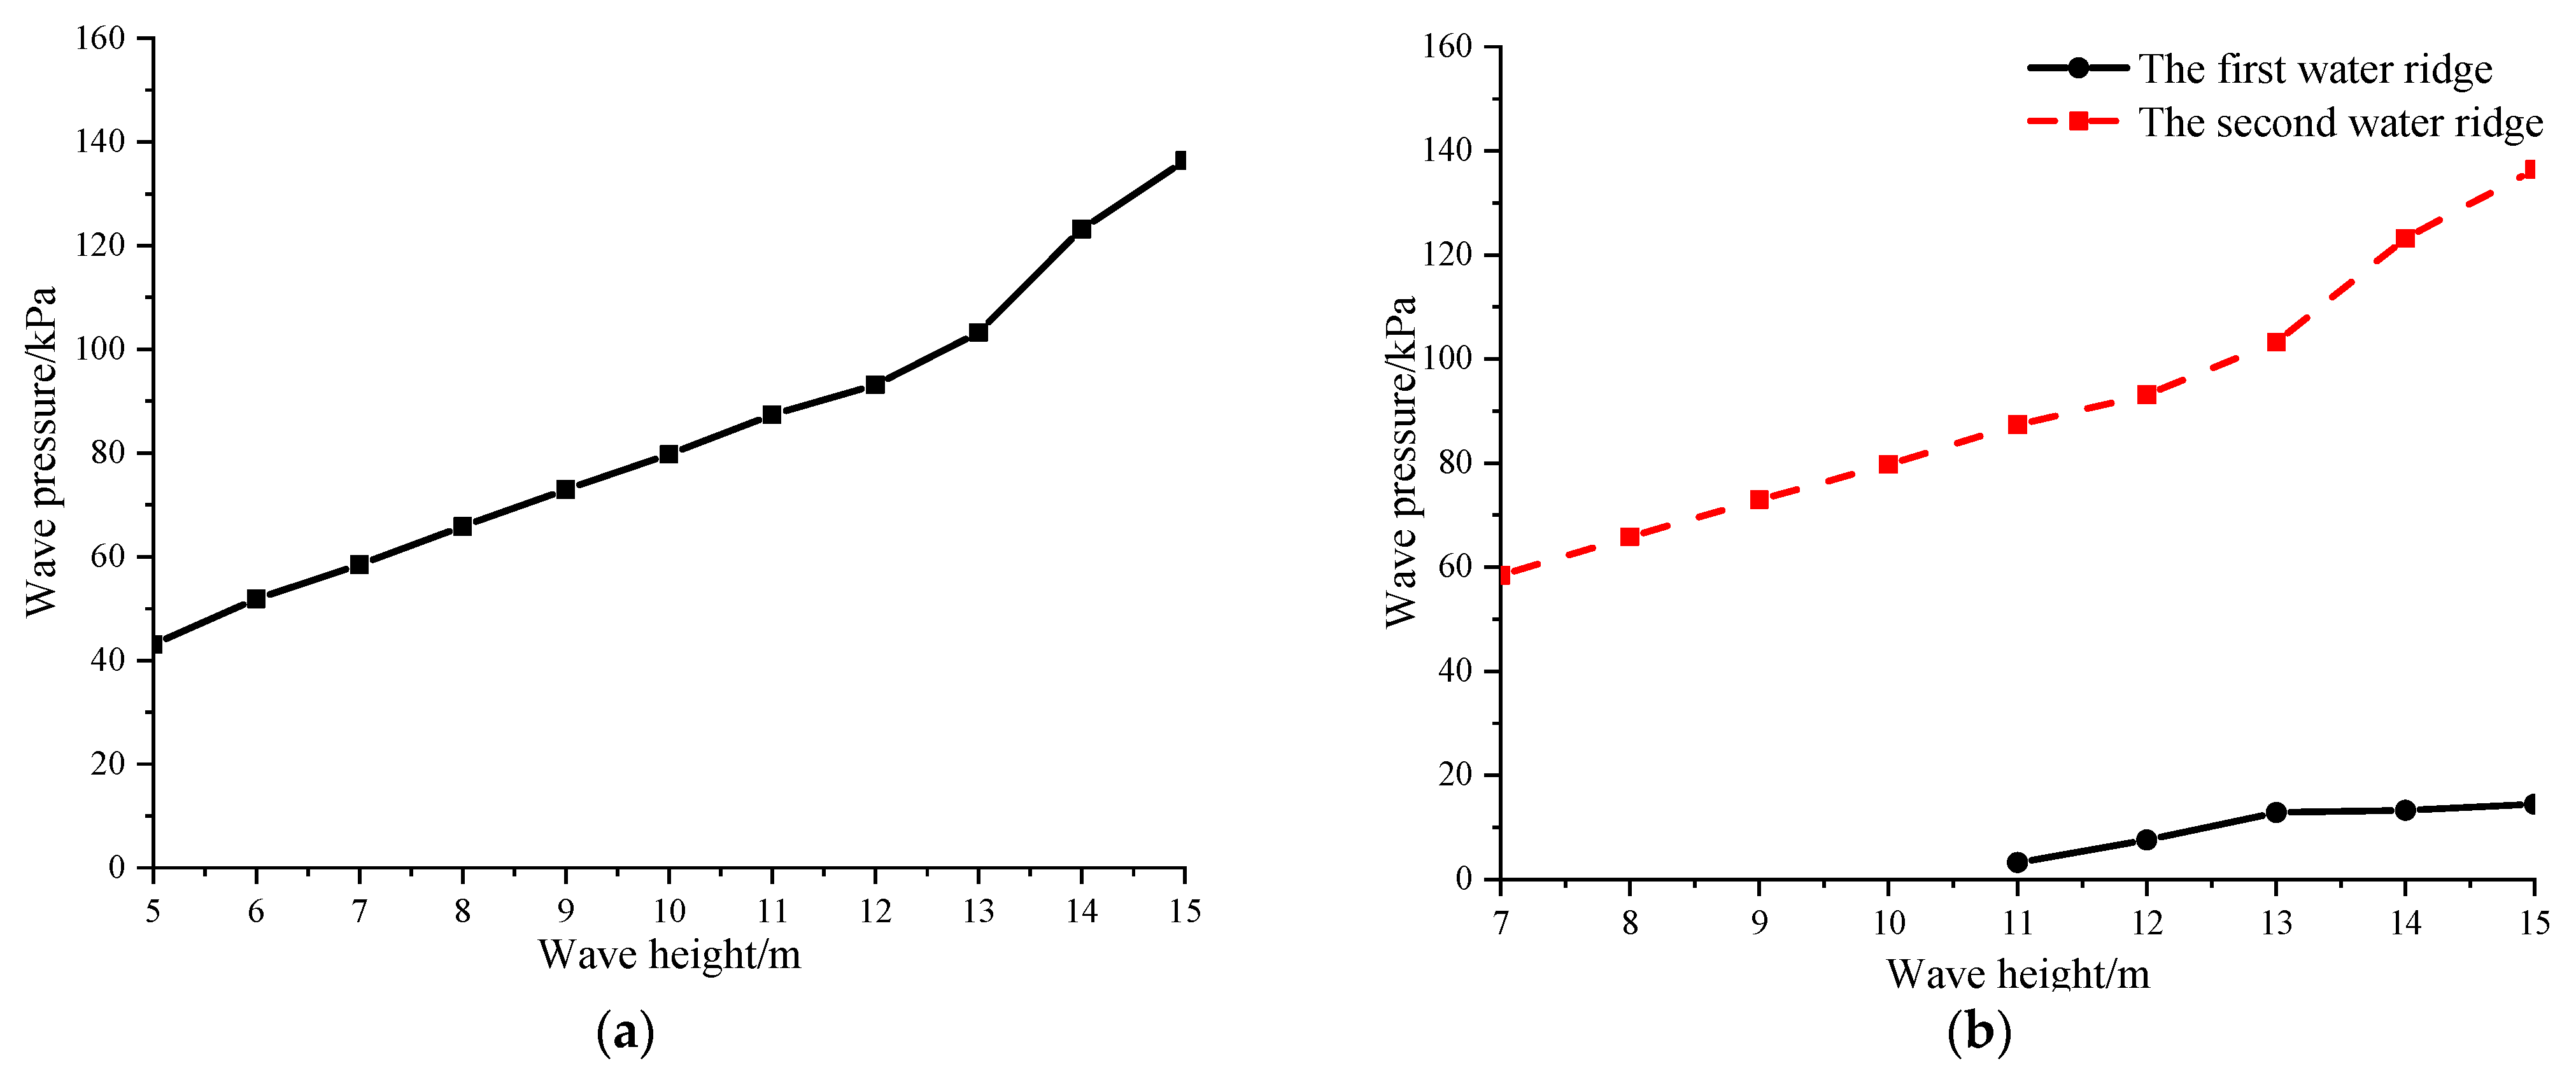
5.2.2. Analysis of Wave Pressure on the Brace and Column under Different Wave Heights

Through studying the numerical simulation, point B1 on the column always suffers the maximum wave pressure, and point A7 on the brace always suffers the maximum pressure. Therefore, this section studies the wave pressure at points B1 and A7. The wave pressure on B1 and on A7 varies with the wave height as shown in Figure 15a,b respectively, where it can be found that:
(1)
The maximum wave pressure on the column almost linearly increases with the increase of wave height when H < 13 m, and wave pressure increases dramatically with increasing of wave height when H > 13 m.
(2)
Maximum wave pressure of the first water ridge under the brace occurs if the wave height is greater than 11 m and increases with increasing of wave height. After the wave height increases to 13 m, the speed of the wave pressure slows down. The water pressure caused by the second water ridge increases with the increasing wave height, and the increasing speed of water pressure increases when the wave height exceeds 13 m.

5.3. Study of the Water Ridge Phenomenon under Different Wave Periods

5.3.1. Analysis of the Water Ridge on the Brace under Different Wave Periods
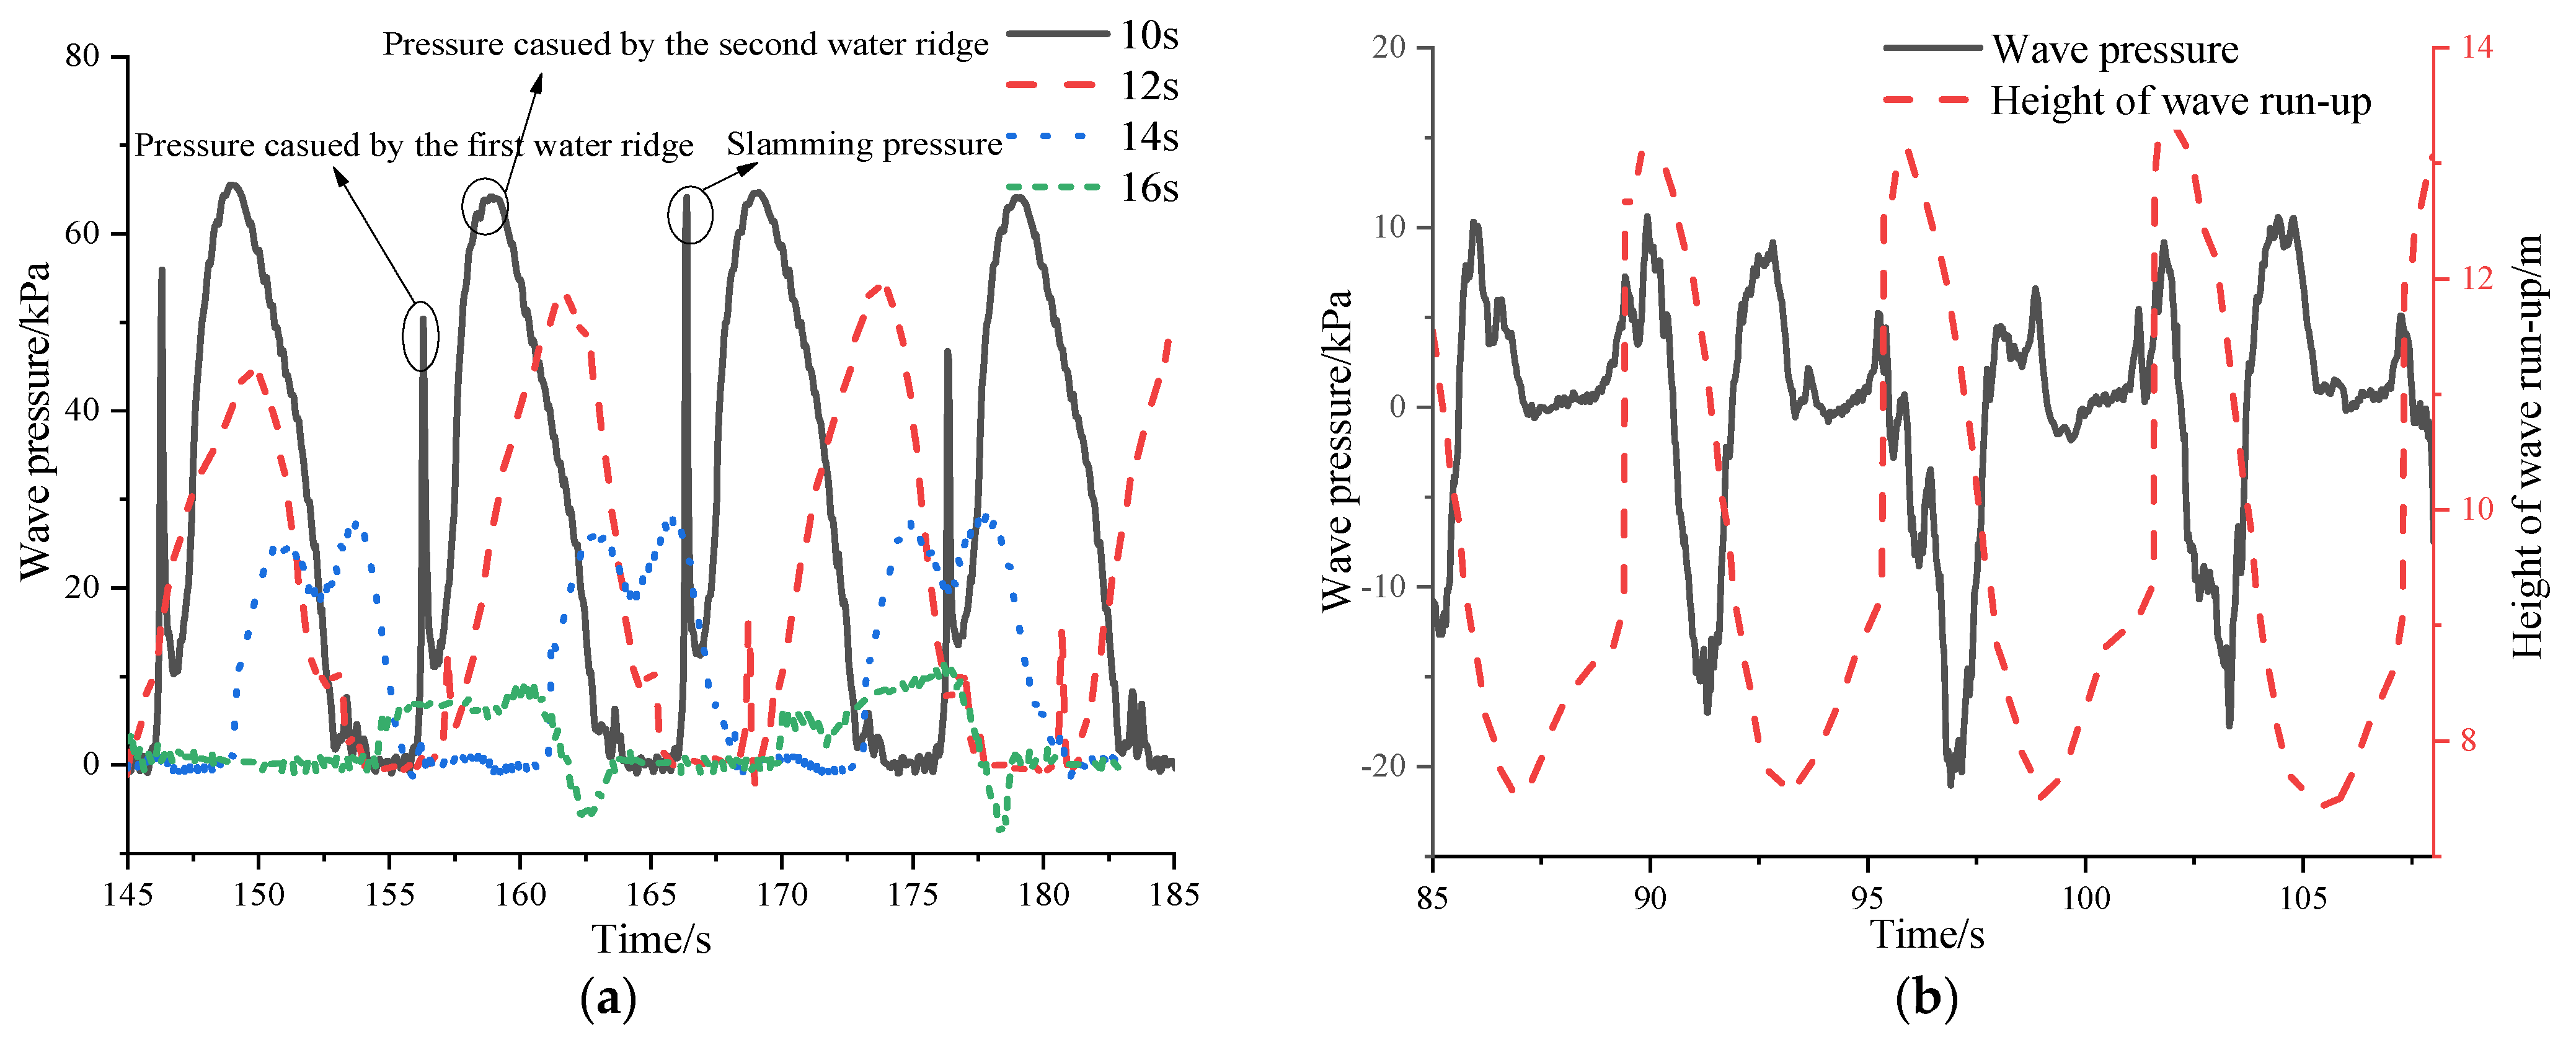
No water ridge appeared under case C13 and C14, while it appeared once under cases C19–C20 and twice under C15–C18. Figure 16a shows the time history curves of the wave pressure at different wave periods. Figure 16b shows the time history curves of the wave pressure and the height of wave run–up under the C13 case (H = 10 m, T = 6 s and V = 2 m/s). Figure 16 shows that:
(1)
The wave pressure caused by the water ridge under the brace is very sensitive to the wave period. The wave–slamming pressure caused by the first water ridge under the brace occurs under wave conditions with wave periods of 10 s and 12 s. At a wave period of 10 s, the wave–slamming pressure caused by the first water ridge is 80% to 100% of the wave pressure caused by the second water ridge. With a wave period of 12 s, the wave–slamming pressure caused by the first water ridge is 25% of the water pressure caused by the second water ridge. The first water ridge does not cause the slamming pressure when the wave period is14 s. However, a double peak value of water pressure is generated. The variation of water pressure caused by the water ridge is very small, and a negative pressure phenomenon occurs when T = 16 s.
(2)
At a wave period of 6 s, the wave pressure in front of the brace is negative, with a value around −20 kPa. The time when the negative pressure occurs follows the wave run–up peak, mainly because that the wave period is too small, and the waves quickly slam on the brace and separate from it, and the surrounding air has no time to enter, forming a local vacuum state and a reverse tension on the surface of the brace.

5.3.2. Analysis of Wave Pressure on the Brace and the Column under Different Wave Periods
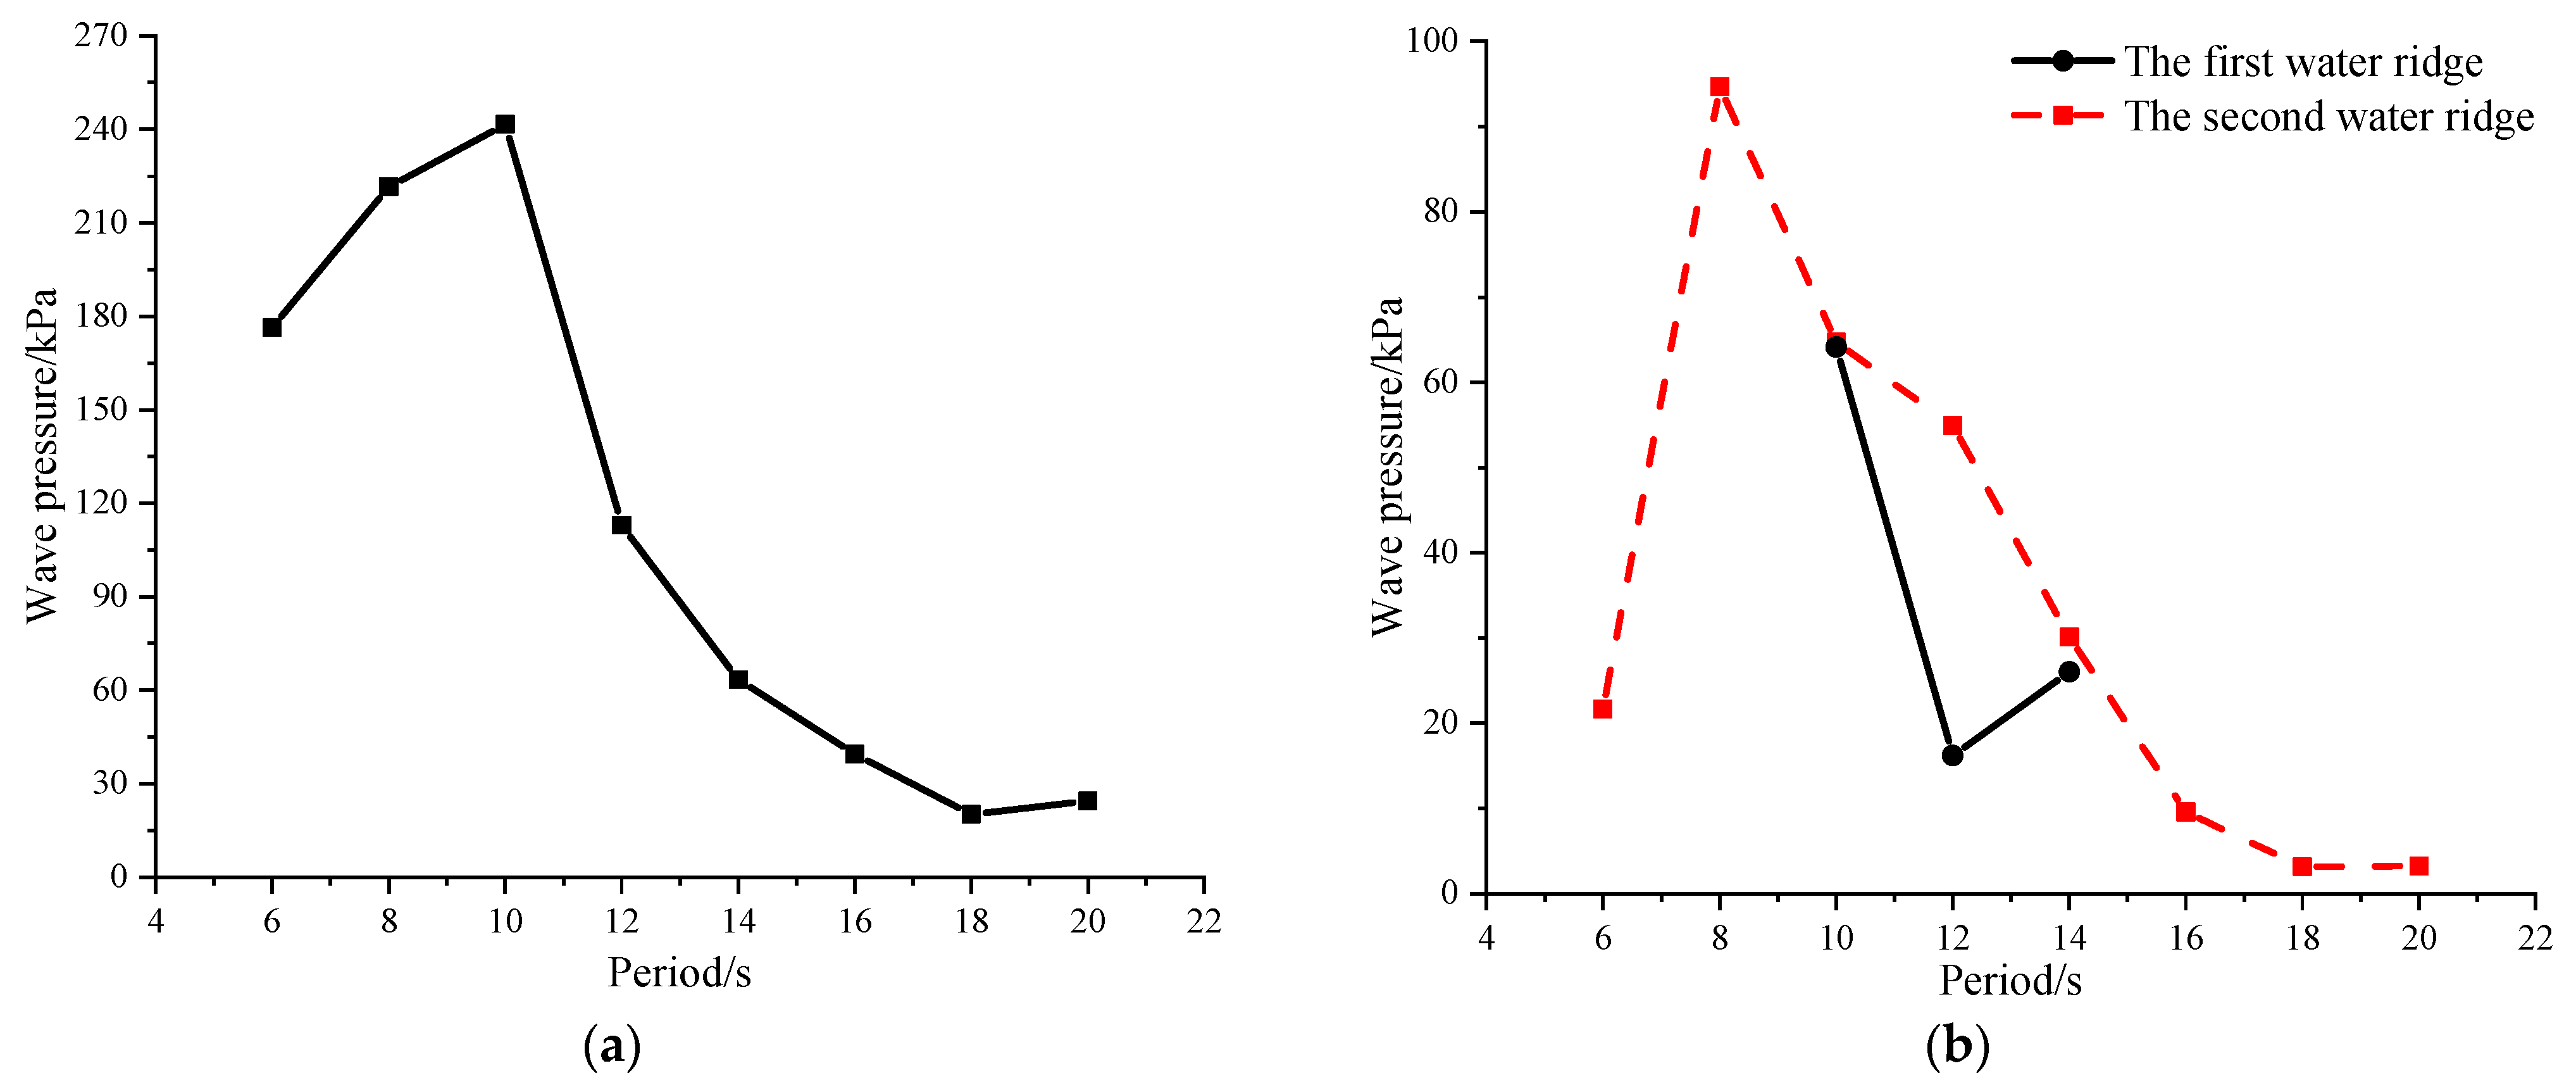
The periodic variation of wave pressure in front of the column is shown in Figure 17a, and the periodic variation of water pressure caused by the water ridge phenomenon in front of the brace is shown in Figure 17b. Figure 17 shows that:
(1)
The wave pressure in front of the column is very sensitive to the wave period. The maximum wave pressure occurs when the wave period is 10 s and the wave pressure reduces rapidly with increasing wave period up to 18 s. After that, the wave pressure is stable at about 30 kPa.
(2)
The peak value of wave pressure on the brace occurs at a wave period of 8 s, but there is no water ridge in this condition due to the negative pressure caused by the short wave period. The influence of wave period on wave pressure is limited once the wave period is greater than 16 s, and the wave pressure is close to zero under these wave conditions. This may be because the platform moves smoothly under the large period wave conditions, and the motions of the brace in the water is not as serious as under other conditions.

6. Conclusions

In this study the water ridge phenomenon and wave–slamming characteristics of an offshore platform under towing working conditions were studied numerically and experimentally. The difference between experimental and the numerical natural periods of the platform was less than 5%.
The characteristics of the water ridge phenomenon and its influence on wave–slamming pressure of the platform at different wave heights and wave periods were studied, and the main conclusions are as follows:
(1)
Under working towing conditions, the phenomenon of a water ridge appears in front of the column and the brace of the platform. The reason for the water ridge is the accumulation and superposition of seawater caused by the heaving motion of the platform during towing conditions. The energy of the superimposed wave is much greater than that of a normal wave. As a result, the column and brace of the platform are subjected to large wave–slamming pressures. The water ridge is a common phenomenon when towing the platform and results in a threat to the structural safety of the platform.
(2)
When the wave height is small, there is no water ridge on the brace. With increasing wave height, the water ridge becomes more and more obvious, and the height of wave run–up becomes greater and greater. Two water ridges occur when the wave height is greater than 10 m. The wave–slamming pressure on the column and brace increases almost linearly with increasing wave height. The results indicate that the more obvious the ridge phenomenon, the more intense the wave–slamming pressure.
(3)
Different to the obvious linear water ridge phenomenon under different wave heights, the water ridge under different wave periods has special characteristics. There is no water ridge on the brace when the wave period is 6 s. However, when the wave period is 8 s, the water pressure under the brace reaches a peak value, but there is also no water ridge in this condition. This indicates that the water ridge is not necessarily the key phenomenon to determine water pressure on the brace under short wave periods. Under relatively large and small wave periods, a negative pressure occurs on the brace. When the wave period increases to 10 s, the water ridge on the brace appears twice and forms a large wave–slamming pressure. This generates a major threat to the structure of the brace. The wave–slamming pressure on the column reaches a peak value when the wave period is 10 s and drops rapidly when the wave period is 12 s, which further shows the sensitivity of wave pressure caused by the water ridge. In general, the wave–slamming pressure on the column and brace of the platform first increases and then decreases with increasing wave period.
It can be seen from the above conclusions that the influence of the water ridge and wave–slamming under different wave periods and wave heights should be considered when designing the platform. The lower middle part of the front column and the lower middle part of the brace of the platform are vulnerable to slamming by the water ridge. This study provides a reference for structural areas that need to be strengthened in the design of a semisubmersible platform. This study does not calculate the forces applied on the platform by the towing system, so future studies should investigate total load to properly design the towing system and identify critical load cases, as done in different applications in marine engineering [38].

Author Contributions

Conceptualization, F.H. and C.W.; methodology, F.H., C.W. and S.X.; software, C.W., C.Z. and Z.Y.; validation, F.H., C.W. and S.X.; formal analysis, C.W., C.Z. and Z.Y.; investigation, F.H.; resources, F.H.; data curation, C.W.; writing—original draft preparation, F.H., C.W. and S.X.; writing—review and editing, F.H. and S.X.; visualization, C.W.; supervision, F.H. and S.X.; project administration, F.H.; funding acquisition, F.H. All authors have read and agreed to the published version of the manuscript.

Funding

This research was funded by the National Natural Science Foundation of China, grantnumber 52071161.

Institutional Review Board Statement

Not applicable.

Informed Consent Statement

Not applicable.

Data Availability Statement

Not applicable.

Acknowledgments

This work was financially supported by the National Natural Science Foundation of China (Grant No. 52071161). The support is gratefully acknowledged by the authors.

Conflicts of Interest

The authors declare no conflict of interest.

References

  1. Pakozdi, C.; Kendon, T.E.; Stansberg, C.T. Breaking wave impact on a platform column: An introductory CFD study. In International Conference on Ocean, Offshore, and Arctic Engineering, Proceedings of the ASME 2011 30th International Conference on Ocean, Offshore and Arctic Engineering, Rotterdam, The Netherlands,19–24 June 2011; The American Society of Mechanical Engineers: New York, NY, USA, 2011; Volume 44335, pp. 645–654. [Google Scholar]
  2. Xiang, T.; Istrati, D. Assessment of Extreme Wave Impact on Coastal Decks with Different Geometries via the Arbitrary Lagrangian–Eulerian Method. J. Mar. Sci. Eng. 2021, 9, 1342. [Google Scholar] [CrossRef]
  3. Pan, K.; IJzermans, R.H.A.; Jones, B.D.; Thyagarajan, A.; van Beest, B.W.H.; Williams, J.R. Application of the SPH method to solitary wave impact on an offshore platform. Comput. Part. Mech. 2016, 3, 155–166. [Google Scholar] [CrossRef] [Green Version]
  4. Canelas, R.; Ferreira, R.M.; Crespo, A.; Domínguez, J.M. A generalized SPH–DEM discretization for the modelling of complex multiphasic free surface flows. In Proceedings of the 8th International SPHERIC Workshop, Trondheim, Norway, 4–6 June 2013; pp. 74–79. [Google Scholar]
  5. Hasanpour, A.; Istrat, D.; Buckle, I. Coupled SPH–FEM Modeling of Tsunami–Borne Large Debris Flow and Impact on Coastal Structures. J. Mar. Sci. Eng. 2021, 9, 1068. [Google Scholar] [CrossRef]
  6. Tang, P.; Yu, D.Y.; Bai, W.; Tian, Y. Numerical simulation of wave run–up on cylindrical offshore structures. Period. Ocean. Univ. China 2016, 46, 116–122. [Google Scholar]
  7. Gao, N.B.; Zhang, H.; Yang, J.M.; Zhang, Y.T. Study on wave run–up of vertical piles under abnormal wave. In Proceedings of the 18th China Ocean Engineering Symposium (Part 2), Zhoushan, China, 22–25 September 2017; p. 6. [Google Scholar]
  8. Zhang, J. Wave Run–Up and Wave Interaction Numerical Analysis of Multi–Column Structure. Master’s Thesis, Dalian University of Technology, Dalian, China, 22 April 2018. [Google Scholar]
  9. Fang, Z.C. Wave Run–Up on Surface–Piercing Square Column and the Mitigation Method Using Multi–Layer Porous Barrier. Ph.D. Thesis, Shanghai Jiao Tong University, Shanghai, China, 29 September 2018. [Google Scholar]
  10. Zhao, B.B.; Chen, Y.B.; Duan, W.Y. Wave run–up simulation on a vertical cylinder based on potential and viscous flow single–direction coupling technique. J. Harbin Eng. Univ. 2019, 40, 1208–1216. [Google Scholar]
  11. Liu, Y.Q. Research on Wave Run–Up and Slamming Characteristics of Multi–Column in Semi–Submersible Platform. Master’s Thesis, Jiangsu University of Science and Technology, Zhenjiang, China, 29 April 2019. [Google Scholar]
  12. Wang, Z.D.; Liu, Y.Q.; Ling, H.J. Influence of column shape on column wave run–up characteristics. China Water Transp. 2019, 19, 176–177. [Google Scholar]
  13. Abdussamie, N.; Ojeda, R.; Amin, W. Prediction of wave–in–deck loads on offshore structures using CFD. In Proceedings of the 19th Australasian Fluid Mechanics Conference, Melbourne, Australia, 8–11 December 2014; pp. 1–4. [Google Scholar]
  14. Abdussamie, N. Towards Reliable Prediction of Wave–In–Deck Loads and Response of Offshore Structures. Ph.D. Thesis, University of Tasmania, Hobart, Australia, 2016. [Google Scholar]
  15. Abdussamie, N.; Ojeda, R.; Thomas, G. Measurements of global and local effects of wave impact on a fixed platform deck. Proc. Inst. Mech. Eng. Part M J. Eng. Marit. Environ. 2017, 231, 212–233. [Google Scholar] [CrossRef]
  16. Yang, X.T.; Zhao, W.W.; Wan, D.C. Numerical simulation of wave run–up of semi–submersible offshore platform under regular wave. Hydrodyn. Res. Prog. (Ser. A) 2021, 36, 48–55. [Google Scholar]
  17. Van der Meer, J.W.; Briganti, R.; Zanuttigh, B.; Wang, B.X. Wave transmission and reflection at low–crested structures: Design formulae, oblique wave attack and spectral change. Coast. Eng. 2005, 52, 915–929. [Google Scholar] [CrossRef]
  18. Istrati, D.; Buckle, I.G. Tsunami Loads on Straight and Skewed Bridges—Part 2: Numerical Investigation and Design Recommendations (No. FHWA–OR–RD–21–13). Oregon Department of Transportation. Research Section; 2021. Available online: https://www.oregon.gov/odot/Programs/ResearchDocuments/Tsunami_Part2_Final.pdf (accessed on 1 December 2021).
  19. Bozorgnia, M.; Lee, J.J.; Raichlen, F. Wave structure interaction: Role of entrapped air on wave impact and uplift forces. Coast. Eng. Proc. 2011, 1, 57. [Google Scholar] [CrossRef]
  20. Anagnostopoulos, S.A. Dynamic response of offshore platforms to extreme waves including fluidstructure interaction. Eng. Struct. 1982, 4, 179–185. [Google Scholar] [CrossRef]
  21. Istrati, D.; Buckle, I.G. Role of trapped air on the tsunami–induced transient loads and response of coastal bridges. Geosciences 2019, 9, 191. [Google Scholar] [CrossRef] [Green Version]
  22. Iwanowski, B.; Marc, L.; Wemmenhove, R. CFD simulation of wave run–up on a semi–submersible and comparison with experiment. In Proceeding of the ASME 2009 28th International Conference on Ocean, Offshore and Arctic Engineering, Honolulu, HI, USA, 31 May–5 June 2009. [Google Scholar]
  23. Bredmose, H.; Peregrine, D.H. Violent breaking wave impacts. Part 2: Modelling the effect of air. J. Fluid Mech. 2009, 641, 389–430. [Google Scholar] [CrossRef]
  24. Ma, Z.H.; Causon, D.M.; Qian, L. Pure and aerated water entry of a flat plate. Phys. Fluids 2016, 28, 49–65. [Google Scholar] [CrossRef] [Green Version]
  25. Peregrine, D.H.; Bredmose, H.; Bullock, G.; Obrhai, C.; Müller, G.; Wolters, G. Violent water wave impact on walls and the role of air. In Coastal Engineering 2004, Proceedings of the 29th International Conference on Coastal Engineering, Lisbon, Portugal, 19–24 September 2004; World Scientific: Singapore, 2004; Volume 1, pp. 4005–4017. [Google Scholar]
  26. Ghosh, S.; Reins, G.; Koo, B.; Wang, Z.Y.; Yang, J.M.; Stern, F. Plunging wave breaking: EFD and CFD. In Proceedings of the 3rd International Conference on Violent Flows, Fukuoka, Japan, 9–11 March 2006. [Google Scholar]
  27. Istrati, D. Large–Scale Experiments of Tsunami Inundation of Bridges Including Fluid–Structure Interaction. Ph.D. Thesis, University of Nevada, Reno, NV, USA, 2017. [Google Scholar]
  28. Simos, A.N.; Sparano, J.V.; Aranha, J.A.P.; Matos, V.C.L. Second–order hydrodynamic effects on resonant heave, pitch and roll motions of a large–volume semi–submersible platform. In Proceeding of the 27th International Conference on Offshore Mechanics and Artic Engineering, Estoril, Portugal, 15–20 June 2008. [Google Scholar]
  29. Fan, X.; Zhang, J.X.; Liu, H. Numerical investigation of run–ups on cylinder in steep regular wave. China Ocean. Eng. 2019, 33, 601–607. [Google Scholar] [CrossRef]
  30. Lu, W.Y.; Li, X.; Zhang, X.T.; Tian, X.L.; Guo, X.X. Experimental study on the wave run–up and air–gap response of a three–column semi–submersible platform. Ocean. Eng. 2020, 203, 107253. [Google Scholar] [CrossRef]
  31. Lu, W.Y.; Zhao, W.H.; Taylor, P.H.; Yang, J.M.; Xiao, L.F.; Li, X. Linearity and nonlinearity in wave run–up and air–gap response for a semi–submersible platform under irregular wave excitation. Appl. Ocean. Res. 2020, 104, 102218. [Google Scholar] [CrossRef]
  32. Istrati, D.; Buckle, I.G. Effect of fluid–structure interaction on connection forces in bridges due to tsunami loads. In Proceedings of the 30th US–Japan Bridge Engineering Workshop, Washington, DC, USA; 2014. [Google Scholar]
  33. Choi, S.J.; Lee, K.H.; Gudmestad, O.T. The effect of dynamic amplification due to a structure’s vibration on breaking wave impact. Ocean. Eng. 2015, 96, 8–20. [Google Scholar] [CrossRef]
  34. Chen, W.Y.; Gao, Y.Y.; Wang, L.Z.; Guo, Z.; Wang, B. Numerical simulation of wave run–up on four cylinders in a square configuration. Appl. Ocean. Res. 2021, 108, 102519. [Google Scholar] [CrossRef]
  35. Cong, P.W.; Teng, B.; Bai, W. Second–order wave run–up on a vertical cylinder adjacent to a plane wall based on the application of quadratic transfer function in bi–directional waves. Mar. Struct. 2021, 76, 102879. [Google Scholar] [CrossRef]
  36. Menter, F.R. Two–equation eddy–viscosity turbulence models for engineering applications. Am. Inst. Aeronaut. Astronaut. J. 1994, 32, 1598–1605. [Google Scholar] [CrossRef] [Green Version]
  37. Spalart, P.R.; Rumsey, C.L. Effective inflow conditions for turbulence models in aerodynamic calculations. Am. Inst. Aeronaut. Astronaut. J. 2007, 45, 2544–2553. [Google Scholar] [CrossRef]
  38. Istrati, D.; Buckle, I.; Lomonaco, P.; Yim, S. Deciphering the tsunami wave impact and associated connection forces in open–girder coastal bridges. J. Mar. Sci. Eng. 2018, 6, 148. [Google Scholar] [CrossRef] [Green Version]
Figure 1. Semisubmersible platform. (a) Numerical platform configuration. (b) Test platform model.
Jmse 10 00116 g001
Figure 2. Distribution of the monitoring points.
Jmse 10 00116 g002
Figure 3. Numerical wave tank.
Jmse 10 00116 g003
Figure 4. Computational domain grid and overlapping area grid. (a) Computational domain grid. (b) Overlapping area grid.
Jmse 10 00116 g004
Figure 5. Pitch decay cures of the platform under 2 degrees of inclination.
Jmse 10 00116 g005
Figure 6. Comparison between theoretical numerical and waveform. (a) 4 m from the calculation domain entrance. (b) 12 m from the calculation domain entrance.
Jmse 10 00116 g006
Figure 7. Installation position of the wave gauge.
Jmse 10 00116 g007
Figure 8. Wave time history of three foundation sizes. (a) Foundation size: 1 m. (b) Foundation size: 2 m. (c) Foundation size: 3 m.
Jmse 10 00116 g008
Figure 9. Comparison of points A4 A7 and B3 wave pressure under the same wave conditions. (a) The monitoring points of A4. (b) The monitoring points of A7. (c) The monitoring points of B3.
Jmse 10 00116 g009
Figure 10. Comparison of points A7 wave pressure under the C12 working condition. (a) Monitoring points of A7. (b) Monitoring points of B3.
Jmse 10 00116 g010
Figure 11. Water ridge phenomenon of the wave during the towing test. (a) Entering the water. (b) Exiting the water.
Jmse 10 00116 g011
Figure 12. Water ridge in front of the column. (a) Water ridge. (b) Wave run–up.
Jmse 10 00116 g012
Figure 13. Water ridge under the brace. (a) First water ridge. (b) Second water ridge.
Jmse 10 00116 g013
Figure 14. Wave pressure and wave run–up under the brace. (a) Time history curves of the wave pressure at different wave heights. (b) Time history curves of the wave pressure and wave run–up in the C5 case. (c) Time history curves of the wave pressure and wave run–up in the C11 case.
Jmse 10 00116 g014
Figure 15. Variation of wave pressure with wave height. (a) Wave pressure at B1. (b) Wave pressure at A7.
Jmse 10 00116 g015
Figure 16. Wave pressure and wave run–up under the brace. (a)Time history curves of the wave pressure at different wave periods. (b) Time history curves of the wave pressure and wave run–up.
Jmse 10 00116 g016
Figure 17. Variation of wave pressure with wave period. (a) Wave pressure on the column. (b) Wave pressure on the brace.
Jmse 10 00116 g017
Table 1. Dimensions of platform body and model.
Structure NameFull ScaleNumerical ModelExperimental ModelUnit
Buoyancy tank (L × w × h)104.5 × 3.9 × 10.055.225 × 0.195 × 0.51.045 × 0.039 × 0.1005m
Main deck height37.551.87750.3755m
Bottom of the deck height29.551.47750.2955m
Center spacing of buoyancy tanks37.51.8750.375m
Longitudinal column spacing55.02.75150.55m
Working draft/Volume of displacement9.5/308000.475/3.850.095/0.0308m/m3
Distance from the sea level to the bottom of the deck20.051.00250.2005m
Table 2. Hydrostatic parameters of the full–scale model.
Center of Gravity (m)Center of Buoyancy (m)Radius of Gyration (m)
Longitudinal center of gravity
(LCG)
Transverse center of gravity
(TCG)
Vertical center of gravity
(VCG)
Longitudinal center of buoyance
(LCB)
Transverse center of buoyance
(TCB)
Vertical center of buoyance
(VCB)
RxRyRz
0.050.023.40.10.06.529.931.634.5
Table 3. Main instruments and gauges of the test and their ranges and errors.
Instrument NameQuantityMeasuring RangeError
Wave height gauge2±250 mm0.5%
Pressure sensor51 MPa0.1%
Six degree of freedom motion measurement system1Yaw: ±180°Yaw: ±0.1°
Pitch: ±90°Pitch: ±0.1°
Roll: ±90°Roll: ±0.1°
Surge: ±10 mSurge: ±2 mm
Sway: ±10 mSway: ±2 mm
Heave: ±1 mHeave: ±2 mm
Computer data acquisition and analysis system3--
Table 4. Studied cases.
CaseH (m)T (s)V (m/s)CaseH (m)T (s)V (m/s)
C15132C1115132
C26132C1220132
C37132C131062
C48132C141082
C59132C1510102
C610132C1610122
C711132C1710142
C812132C1810162
C913132C1910182
C1014132C2010202
Table 5. Natural period of platform at full–scale.
Degrees of FreedomModel Period (s)Numerical Simulation Period (s)Error Percentage
Heave19.219.72.6%
Roll61.661.90.32%
Pitch50.351.93.2%
Table 6. Error analysis.
Monitoring PointMean of Maximum Wave Pressure (kPa)Average Period (s)
Numerical simulationA442.549.49
A752.579.99
B3162.169.97
Experimental testA441.809.53
A750.19.42
B3159.649.89
Error percentageA41.8%0.4%
A74.9%6.0%
B31.6%0.8%
Table 7. Error analysis.
Monitoring PointMean of Maximum Wave Pressure (kPa)Average Period (s)
Numerical simulationA787.913.21
B3170.513.22
Experimental testA776.613.28
B3155.513.04
Error percentageA714.7%0.5%
B39.6%1.4%
Publisher’s Note: MDPI stays neutral with regard to jurisdictional claims in published maps and institutional affiliations.

