Article

Application of Remotely Sensed Imagery and Socioeconomic Surveys to Map Crop Choices in the Bekaa Valley (Lebanon)

1
Research Centre of Geography and Planning, University of Jean Moulin Lyon 3, 7 Chevreul Street, 69007 Lyon, France
2
Centre for Economic, Judicial, and Social Study and Documentation, Cairo 11519, Egypt
3
National Centre of Remote Sensing, Beirut 1107 2260, Lebanon
4
Department of RS&GIS, Faculty of Geography, University of Tehran, Tehran 1417853933, Iran
*
Author to whom correspondence should be addressed.
Agriculture 2019, 9(3), 57; https://doi.org/10.3390/agriculture9030057
Submission received: 1 February 2019 / Revised: 11 March 2019 / Accepted: 15 March 2019 / Published: 19 March 2019

Abstract

:
Based on remotely sensed imagery and socioeconomic data, this research analyzes the reasons why farmers choose one crop over another in the Bekaa Valley in Lebanon. This study mapped the area of the cultivated crop in 2017 with Sentinel-2 images. An accurate and new method was developed to extract the field boundaries from the evolution of the normalized difference vegetation index (NDVI) profile throughout the season. We collected 386 GPS locations for fields that are used for crop cultivation, from which the NDVI profile was extracted. The 386 reference fields were separated into two groups: reference locations and test locations. The Euclidean distance (ED) was calculated between these two groups, and the classification was strongly correlated to the known crop type in the field (overall accuracy: 90%). Our study area cultivated wheat (32%), spring potatoes (25%), spring vegetables (27%), orchards (11%), vineyards (7%), and alfalfa (<1%). Socioeconomic surveys showed that farmers favored these crops over others on account of their profitability. Nonetheless, the surveys highlighted a paradox: despite the lack of a political frame for agriculture in Lebanon, farmers’ crop choices strongly depend on a few existing policies.

1. Introduction

Currently, the agricultural sector in the Mediterranean basin is significant and it is expected that it will grow by 30% in the next few years [1]. The population of the Mediterranean relies on this sector to produce food for its own consumption (subsistence farming) or for income (semi-industrial and industrial farming) in accordance with the scale of the farms [2]. However, the share of agricultural workers in each country in the Mediterranean basin is not homogeneous. This sector employs 43% of the population in Turkey, 33% in Morocco, 5% in Libya, and 3% in Lebanon [3]. Therefore, the agricultural sector has a low share in the national economy of countries such as Libya or Lebanon, where the number of agricultural workers decreased at the end of the last century on account of different economic targets by the government [4]. Since its independence in 1943, Lebanon has focused its economy on trading through the Khoury mandate and economic laissez-faire was encouraged in favor of the services sector [5]. Hence, the Lebanese agricultural sector has not benefitted from actual agricultural policy [6]. There has been no regional development and farmers have received few subsidies except for exportation support such as ExportPlus [7,8], and the purchase of some crops [9]. Current agricultural policies in Lebanon are liberal and without plans or actions since the agricultural sector is not a priority of the government [6].
The absence of government policy causes several problems for the agricultural sector in Lebanon. Firstly, agricultural farms are small in size, and only 5% of the farmers possess farms bigger than 2 ha [10]. This fragmentation undermines the modernization of the agricultural sector, where only large farms can reduce the cost of production per hectare [11,12]. Second, there is a lack of production standardization, such as the classification of fruits and vegetables according to their color, size, and weight [2,13]. This absence restricts export opportunities to markets such as Europe which are highly standardized [14]. Hence, Lebanese farmers have had to turn to Gulf countries as their main export market, even though exports have wound down during the war in Syria on account of closed and unsafe terrestrial roads for trucks [15].
According to the literature, four categories of factors influence farmers’ crop choices and strategies: profitability, climate, personal factors, and geopolitics. The barriers of some markets drive farmers from developing countries to diversify their activities and incomes with several crop choices [16]. Crops are typically chosen depending on their yields and benefits per ton [17]. Local climate is another significant determining factor for farmers [18], for example, crops such as rice can be cultivated only under intense irrigation [19]. Personal factors that influence crop choice were studied in Thailand [20]. For instance, farmers choose crops (a) that do not require a lot of work, (b) that they had already cultivated, or (c) after being advised by neighbors. Furthermore, conflicts can sway crop choices. In the Democratic Republic of Congo, “war-resistant crops” are favored for their discretion [21]. Small crops have more likely to go unnoticed, thus, they are not stolen or destroyed. Above all, these factors are not isolated or specific to only one area. On the contrary, these factors are interlinked and simultaneously influence farmers’ crop choices and strategies [22].
This study uses a cross-sectorial approach—namely, remote sensing and socioeconomic surveys—to find current cultivated crops and the reasons for these crops choices in the Bekaa Valley (Lebanon). Remote sensing is frequently applied to monitor crop areas (and land use in general) based on the phenology of crops [23,24], and the accuracy of these classifications has been proven at regional [25,26] and global scales [27,28,29]. The accuracy depends on weather conditions where cloudy weather reduces image quality [30]. Most of the processes consist in a multi-temporal classification of spectral indexes in order to differentiate crop types on the ground. Numerous satellites such as Landsat, Sentinel, Satellite for observation of Earth (SPOT), Moderate-Resolution Imaging Spectroradiometer (MODIS) or RapidEye are being used since they pass over the ground on a regular basis [30,31]. Beyond the administrative census of agriculture made by governments, remote sensing locates exact fields, their areas [32] and can support agricultural policies, as witnessed by the land parcel identification system in Europe [33]. As a new proposed category (in addition to the above-mentioned four categories for crop choices), this study attempts to consider the absence of agricultural policies and the alleged independence of farmers as the fifth category of influence factors. In addition, this paper tries to understand which components the farmers have switched their strategies to.
The paper is structured into three parts. After the introduction, the cross-sectoral approach is introduced in the second part with the application of remote sensing for crop mapping, in order to understand the popularity of one crop versus another. In addition, this paper proposes a new method to extract the field boundaries (a necessary step before crop mapping). However, the crop map on its own is not enough to understand current crop choices. Therefore, the second part introduces a socioeconomic survey with farmers in order to know the reasons why they choose these crops and their evolution over the last 20 years. The evolution of crop choices mentioned by farmers is also assessed by the evolution of the harvest area per crop type in Lebanon, which has been assessed by the United Nations Food and Agriculture Organisation (FAO) since 1961 [34]. The third part of the paper presents the findings of this research, which is discussed in the fourth part.

2. Material and Methods

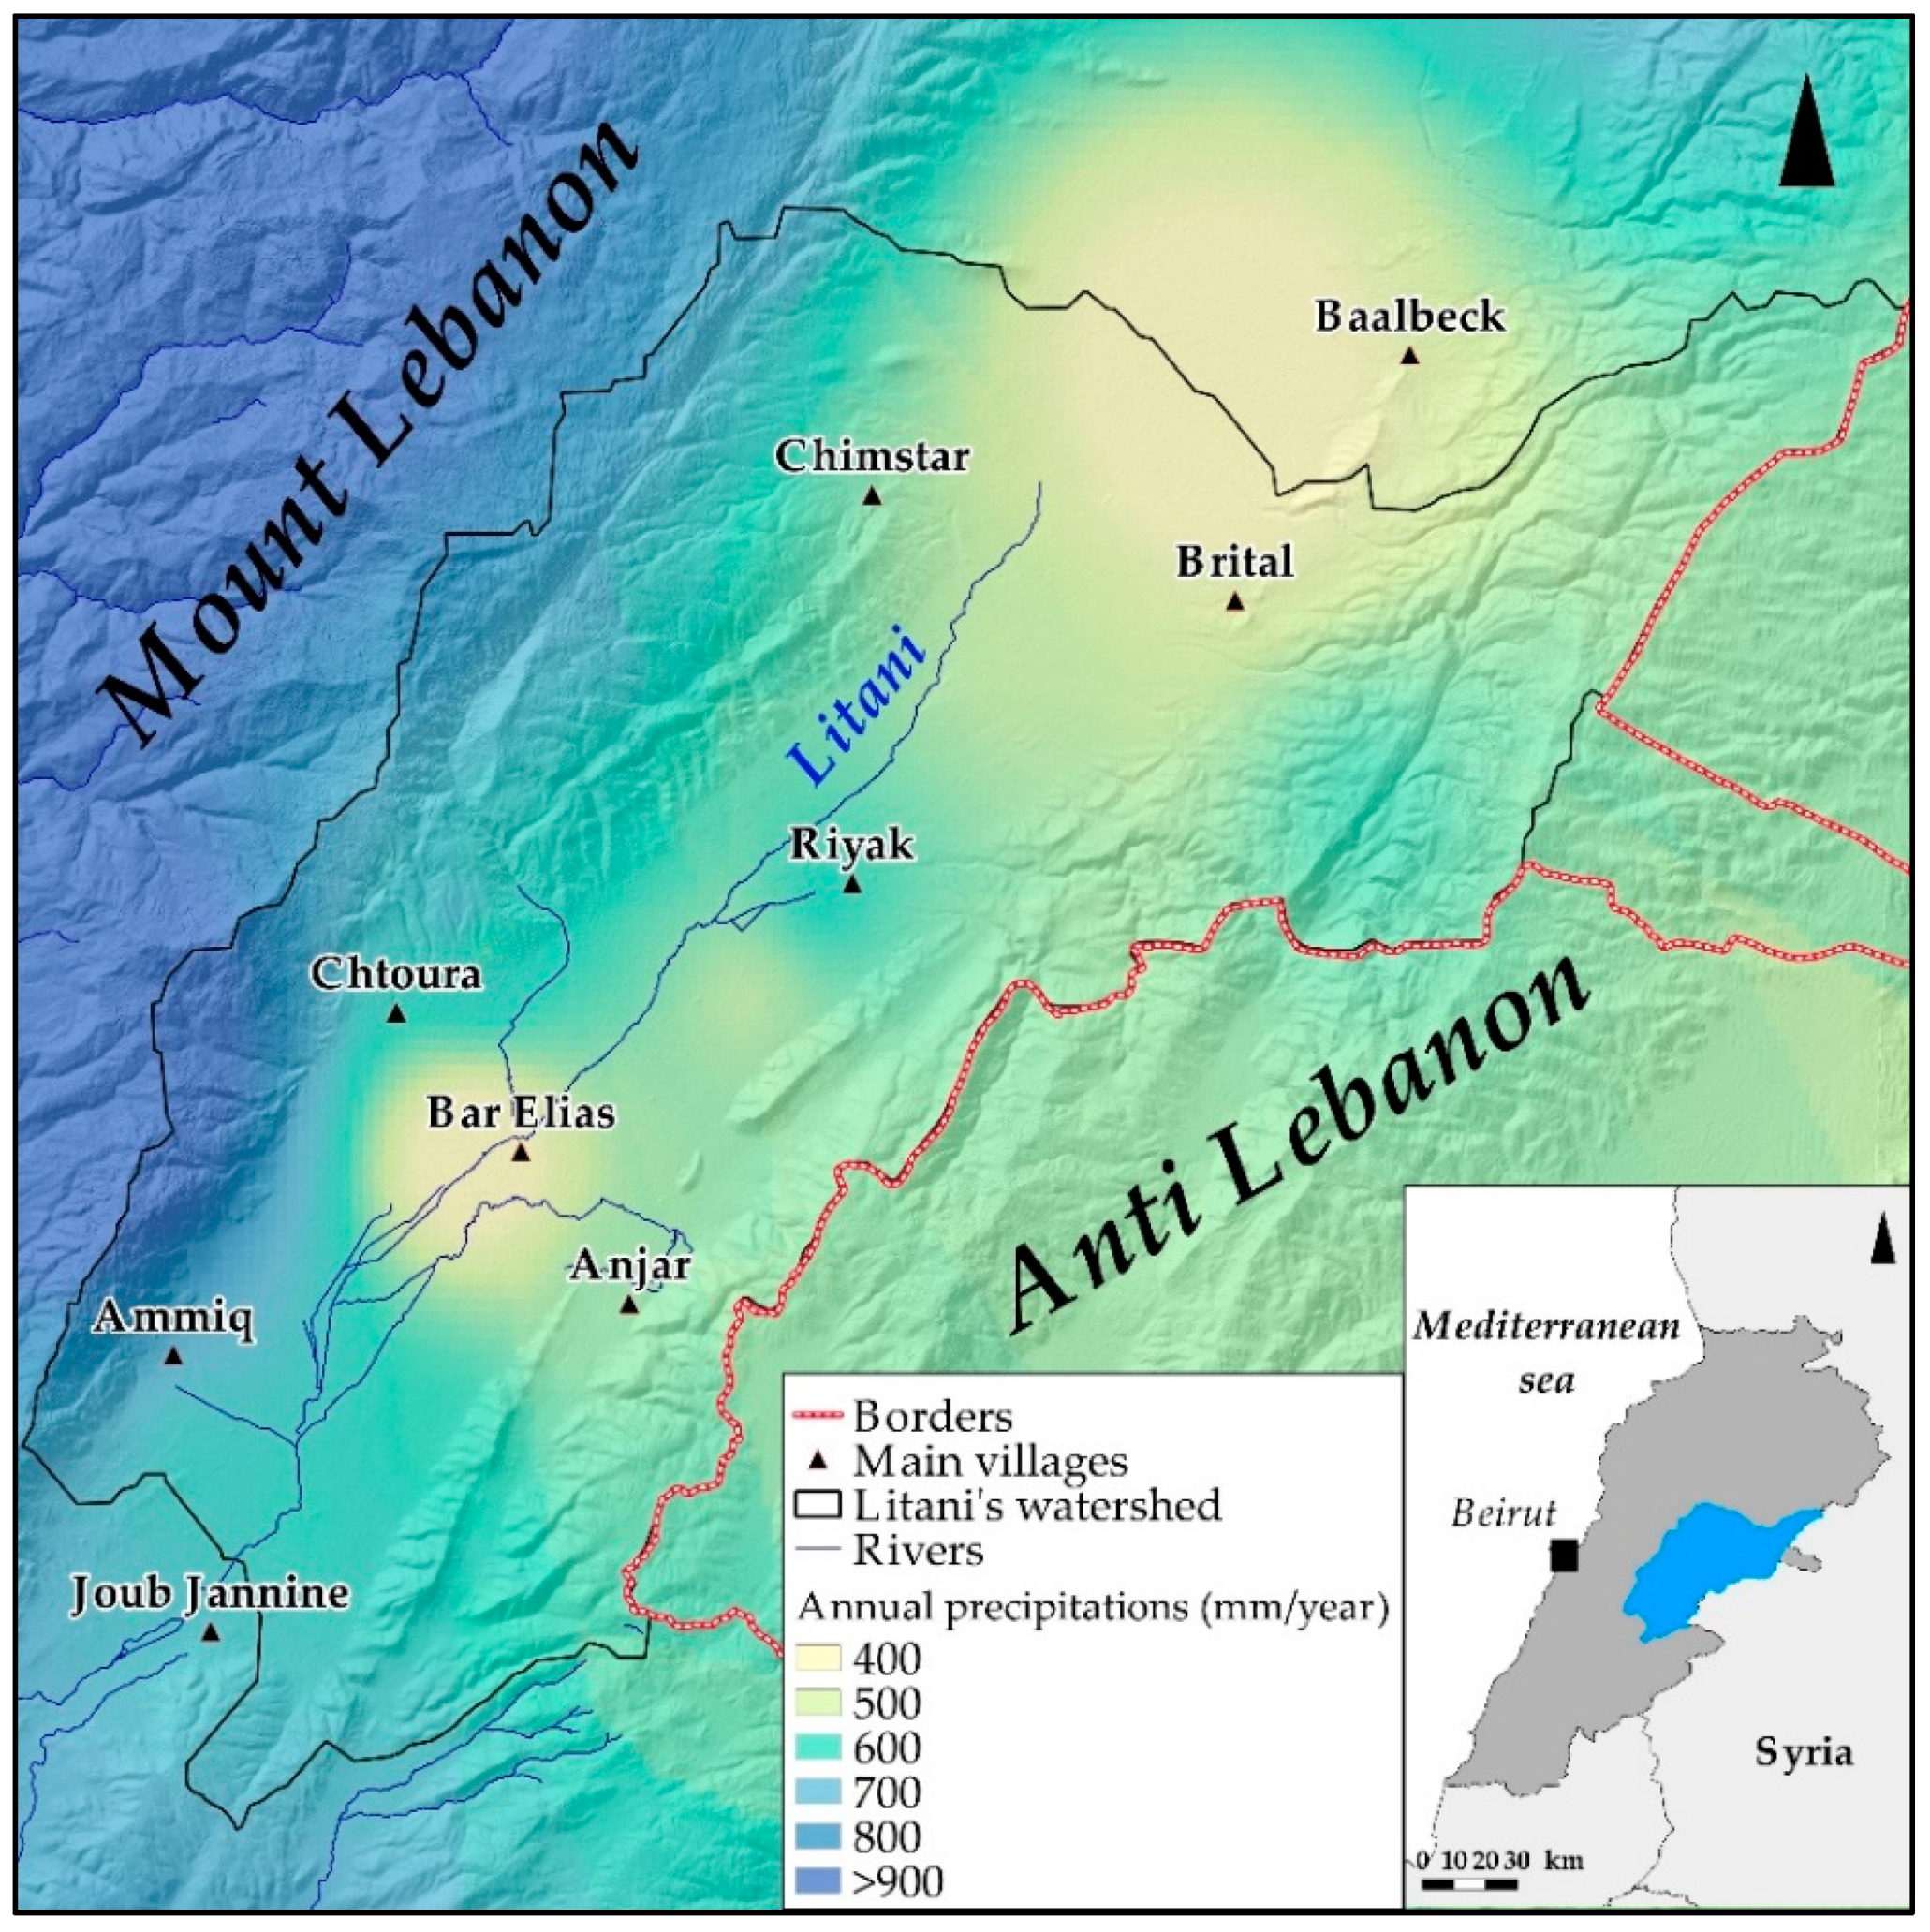
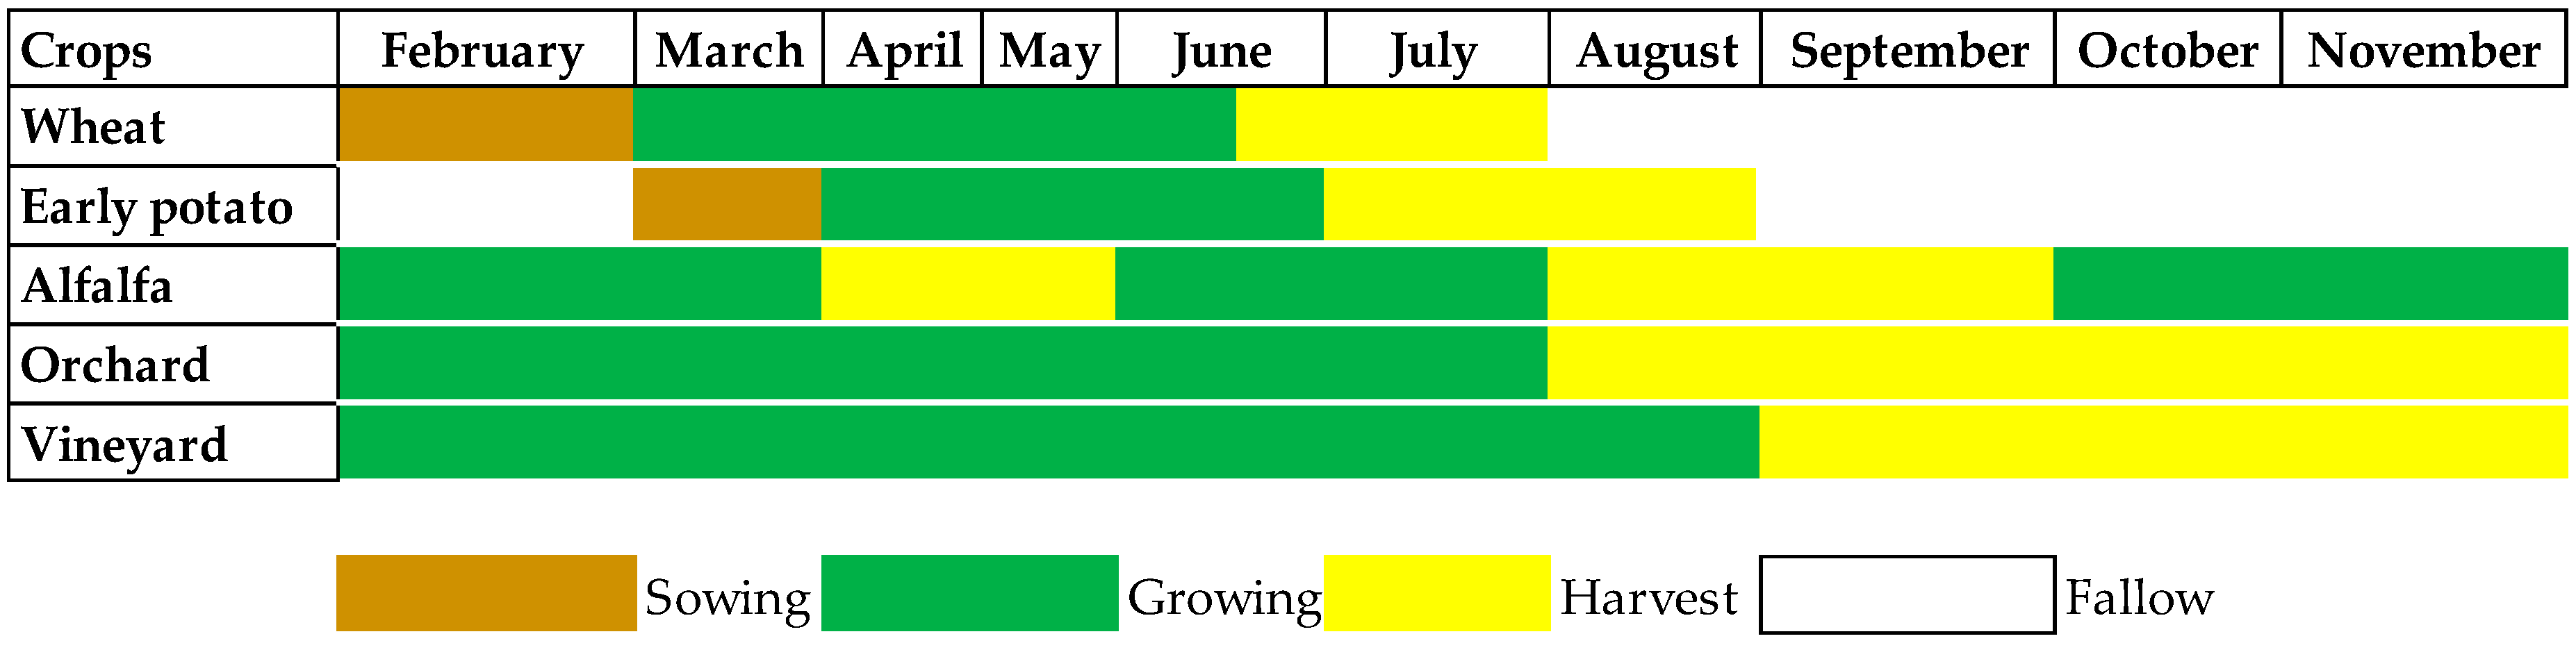
2.1. Crop Mapping of the Study Area

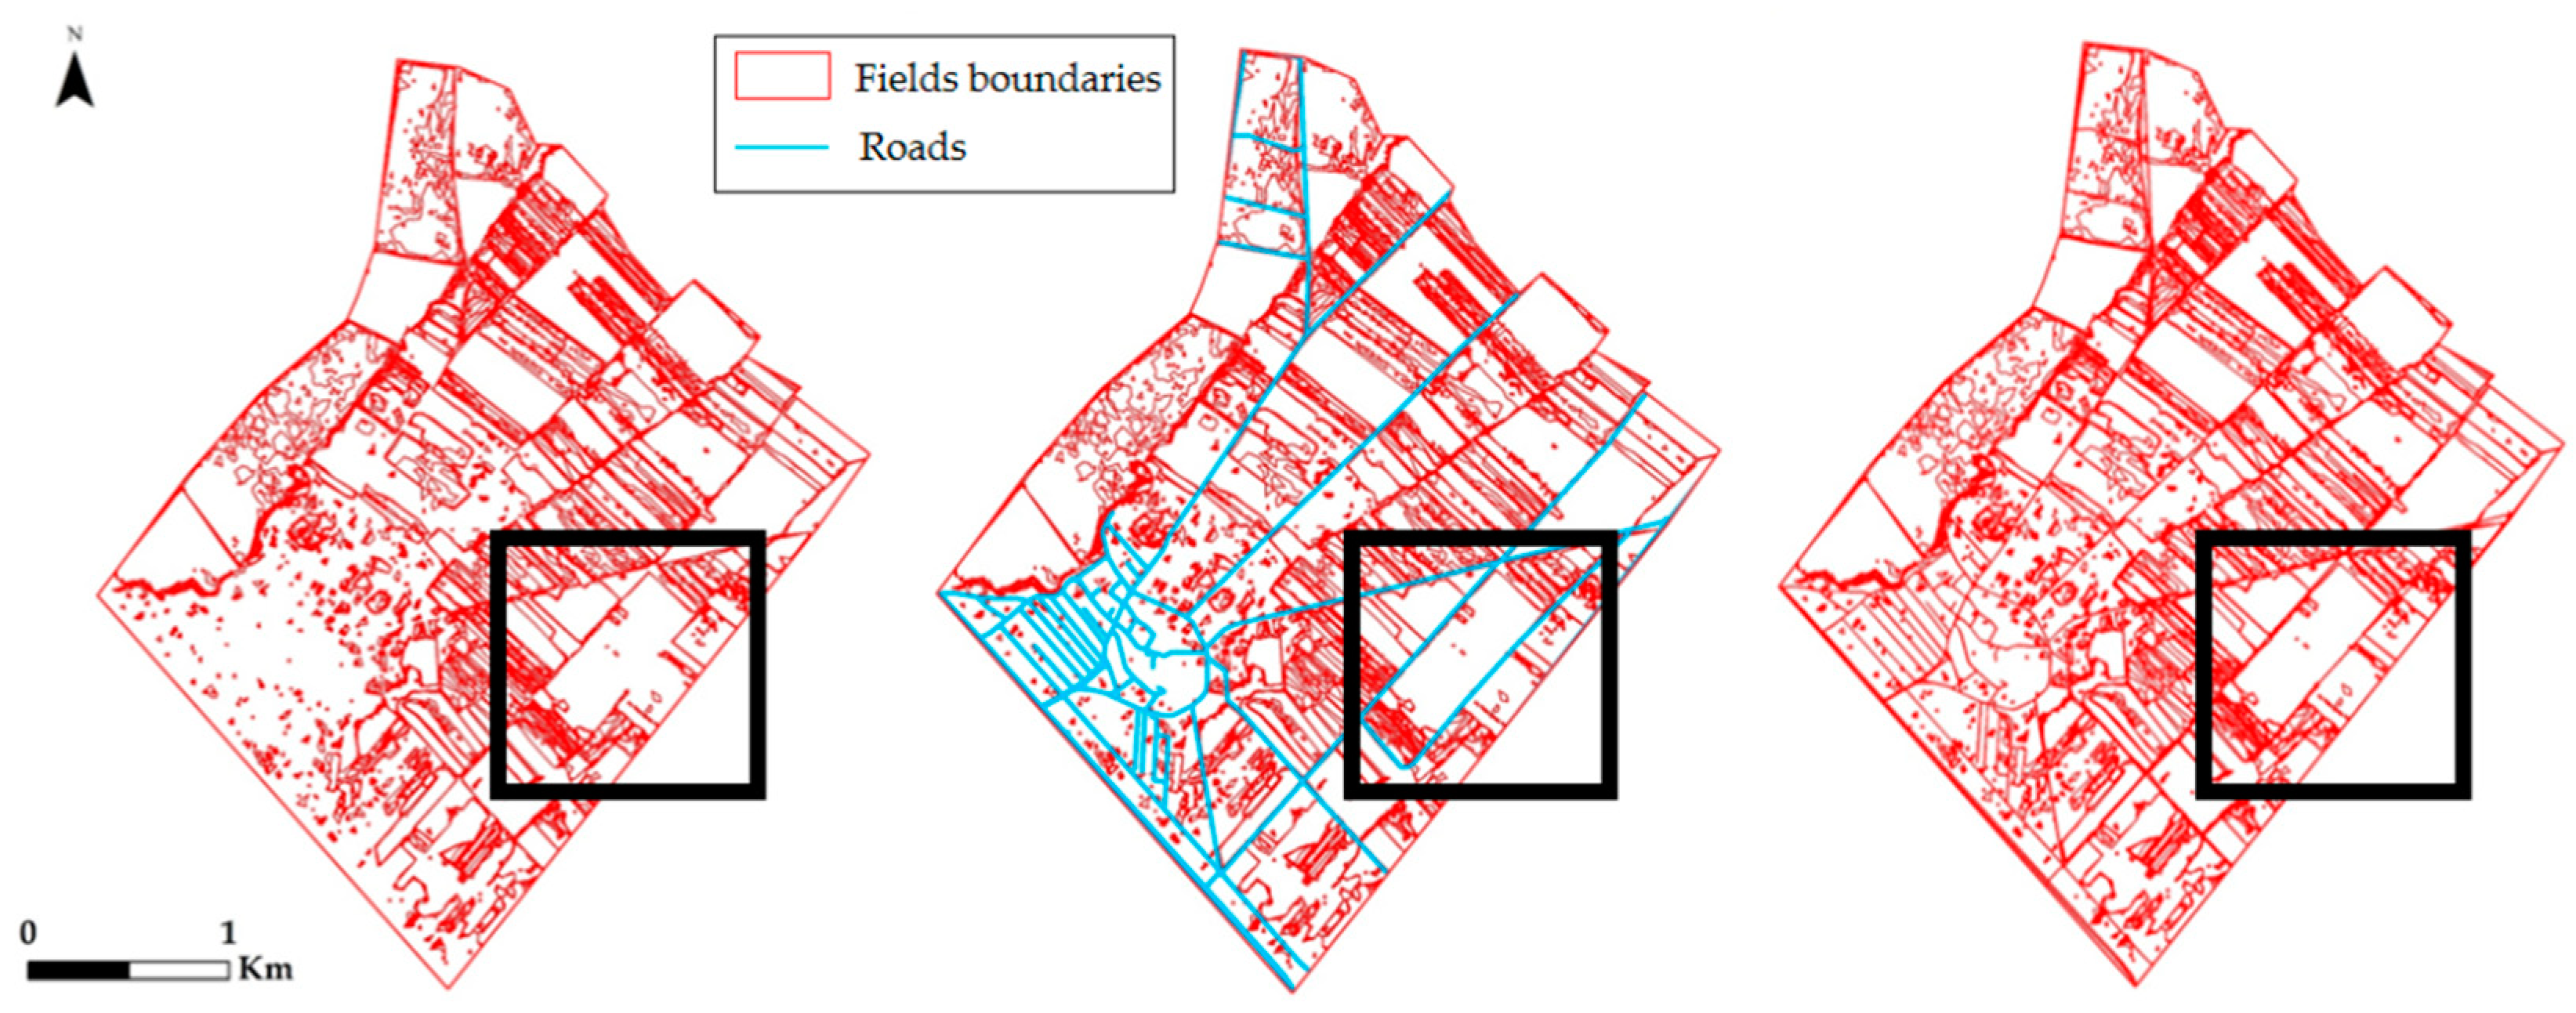
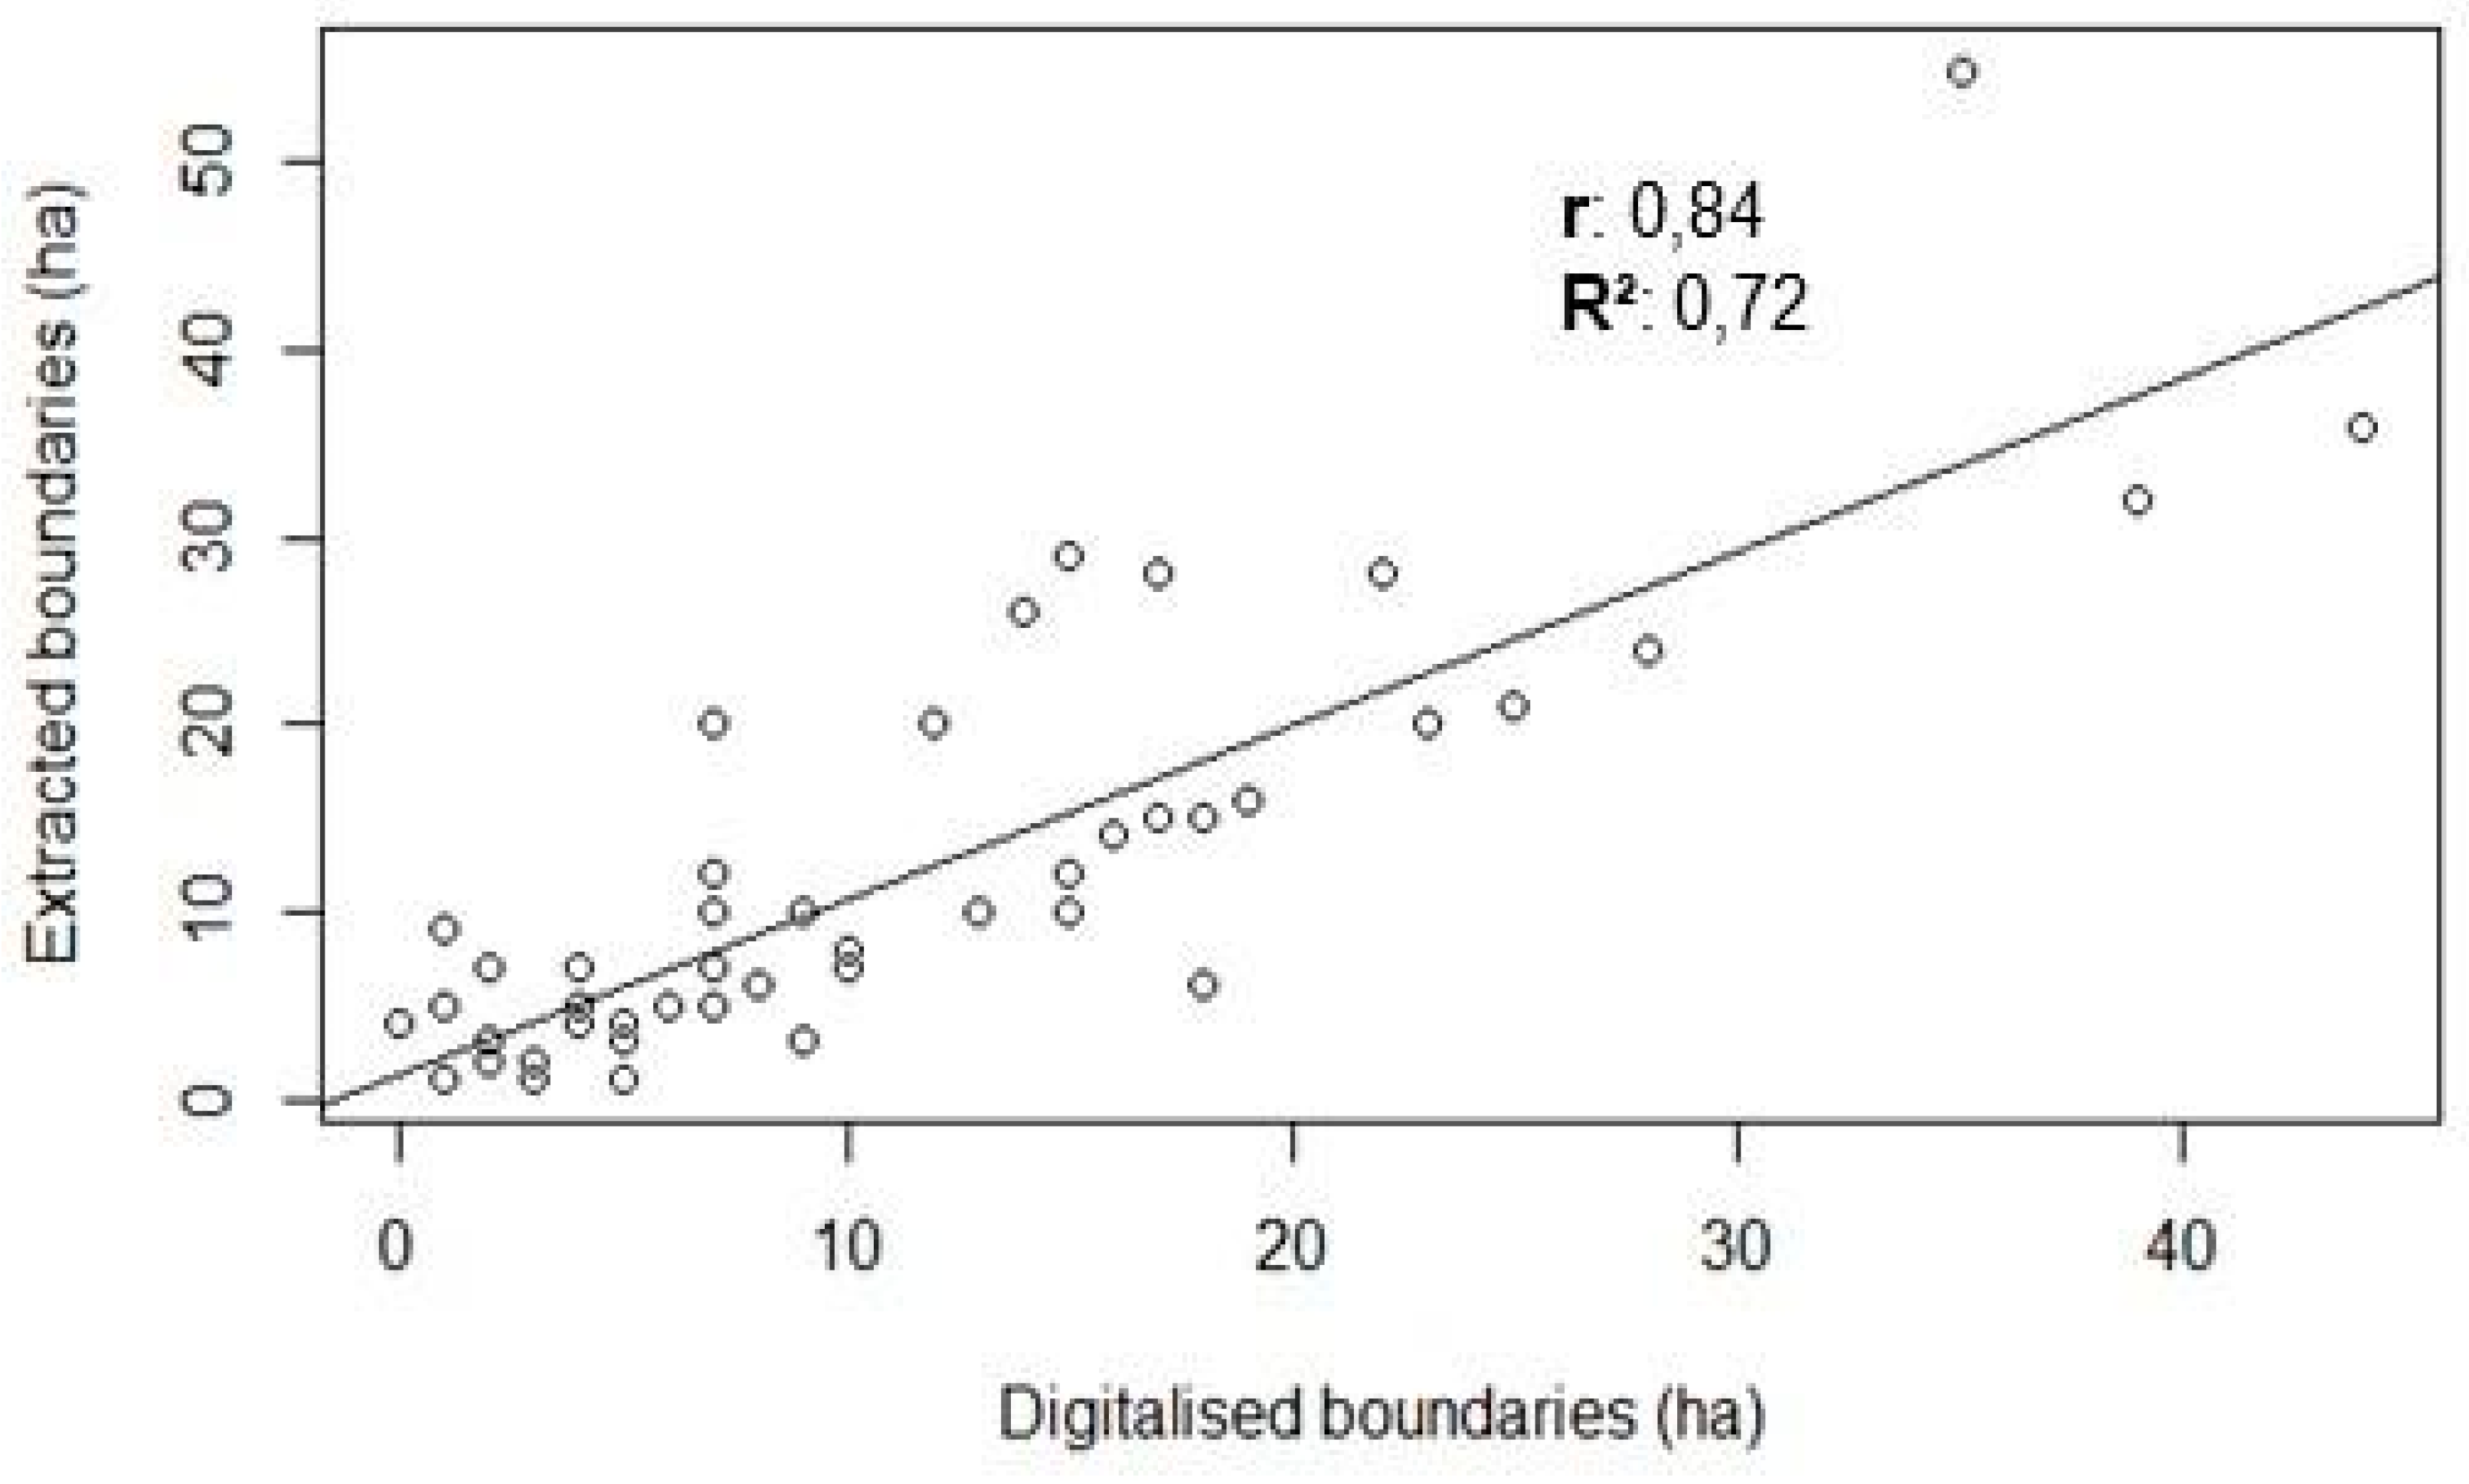
2.1.1. Delimitation of Field Boundaries

The study area of this research, the Bekaa Valley, seems to cope with the difficulties mentioned in the introduction (small farms, lack of standardization, absence of agricultural policy). It is one of the most productive breadbaskets of Lebanon. The agricultural development of the Bekaa Valley is ancient and takes advantage of the fertile alluvial soil [35,36,37] in the area, which is over 1413 km2. Farms are owned by large landowners who lease their lands (inherited under the Ottoman Empire) to modest farmers for a year [6]. The Bekaa Valley is surrounded by Mount Lebanon (west) and the Anti-Lebanon mountain range (east), and farmers benefit from an annual average precipitation of 500 mm at Bar Elias (Figure 1). Also, farms in the Bekaa Valley are mechanized, and farmers use chemical fertilizers in order to obtain significant yields. Thereby, in spite of the absence of a political frame and the abovementioned economic difficulties, the farmers of the Bekaa Valley are able to exploit the potential of their lands.

2.1.2. Sentinel-2 Image Processing

The application of remote sensing has already proven its accuracy in numerous studies using temporal profiles from spectral indexes [39,40,41,42]. A crop map gives the field surface per crop type, and thus, the popularity of one crop over another. Nonetheless, this paper puts forward a new method to extract field boundaries. This method, run in spring 2017 in the Bekaa Valley, aims to be automated, simple, free, and usable by various stakeholders, such as agriculture managers, in the context of an agricultural census.
In the previously mentioned studies, tools such as the normalized difference vegetation index (NDVI) are used to measure greenness and change of vegetation [43] using a ratio between near infra-red (NIR) and red bands (Equation (1)).
N D V I = N I R R N I R + R
After atmospheric corrections using the Sen2Cor tool [44], the NDVI was computed on every Sentinel-2 image using band 4 (red, bandwidth: 38 nanometers) and band 8 (NIR, bandwidth: 145 nanometers) with the NDVI tool in SNAP (version 6.0.0, European Space Agency, Toulouse, France). One image per month was downloaded for this study in order to assess the evolution of the vegetation state during 2017. NDVI values were computed throughout the year depending on different phenological stages of crops: sowing, growing, harvest. Based on different agricultural calendars of crops extracted from the NDVI profile of known fields in the Bekaa Valley, the type of crop in every pixel was classified. All in all, 12 images were processed from December 2016 until November 2017.

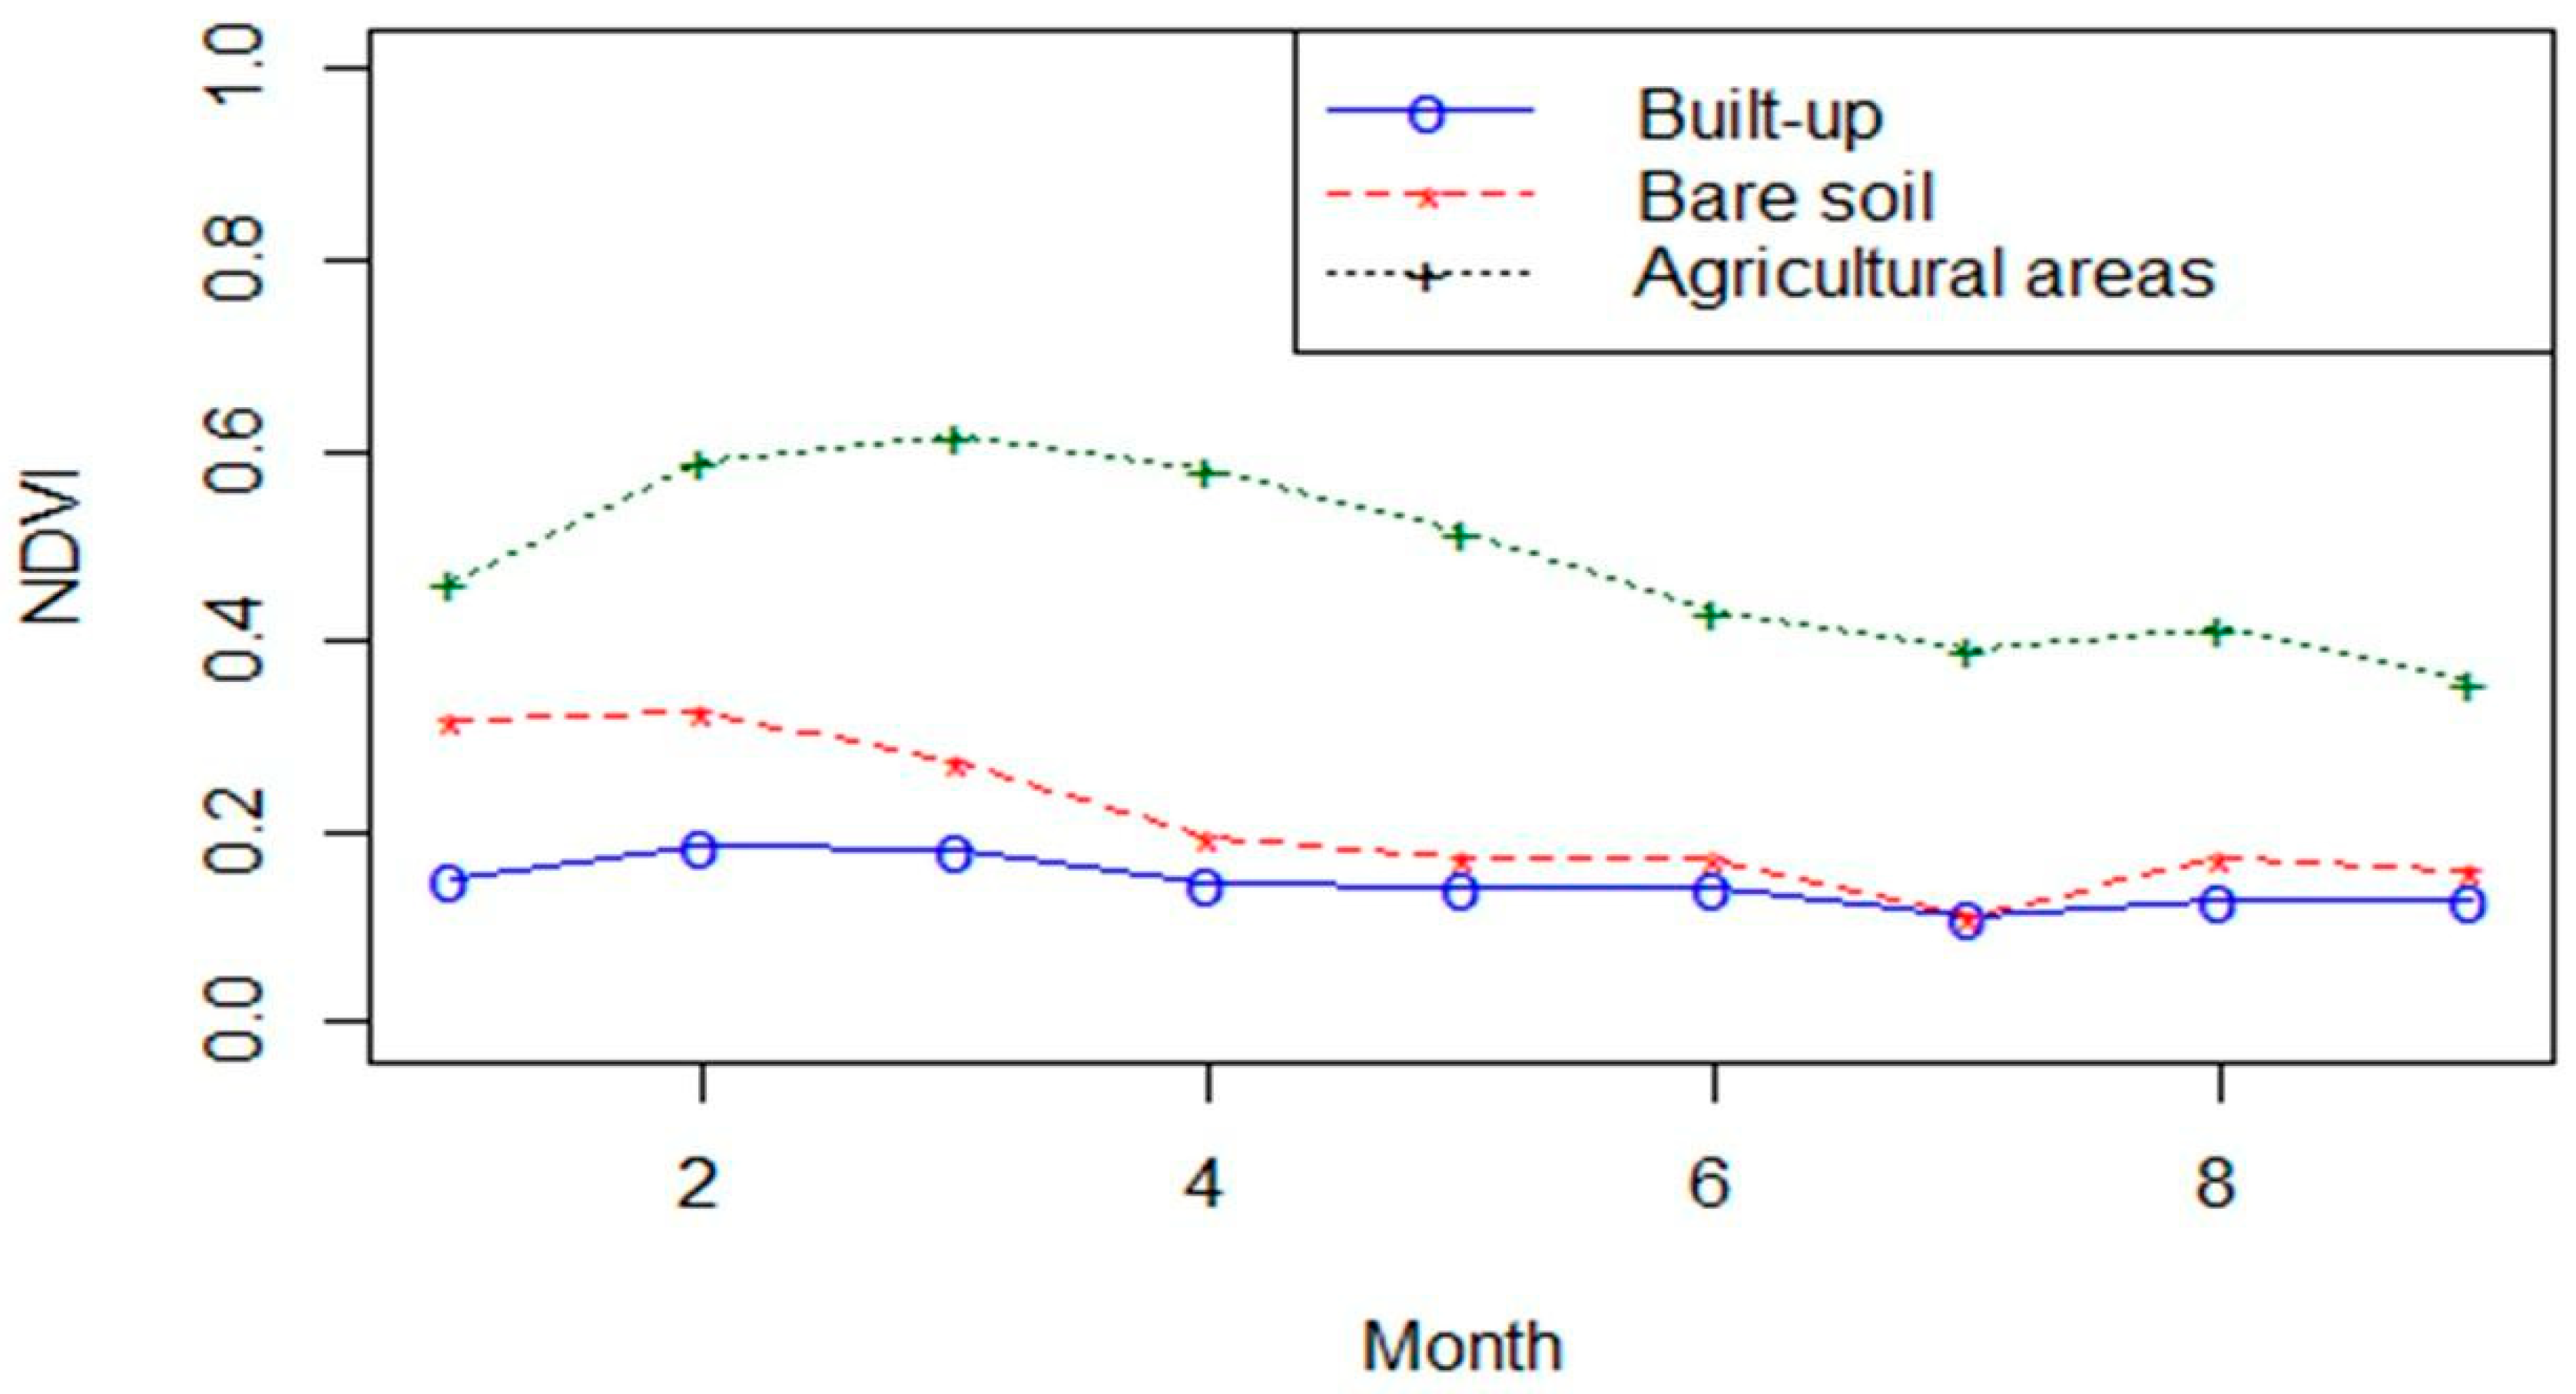
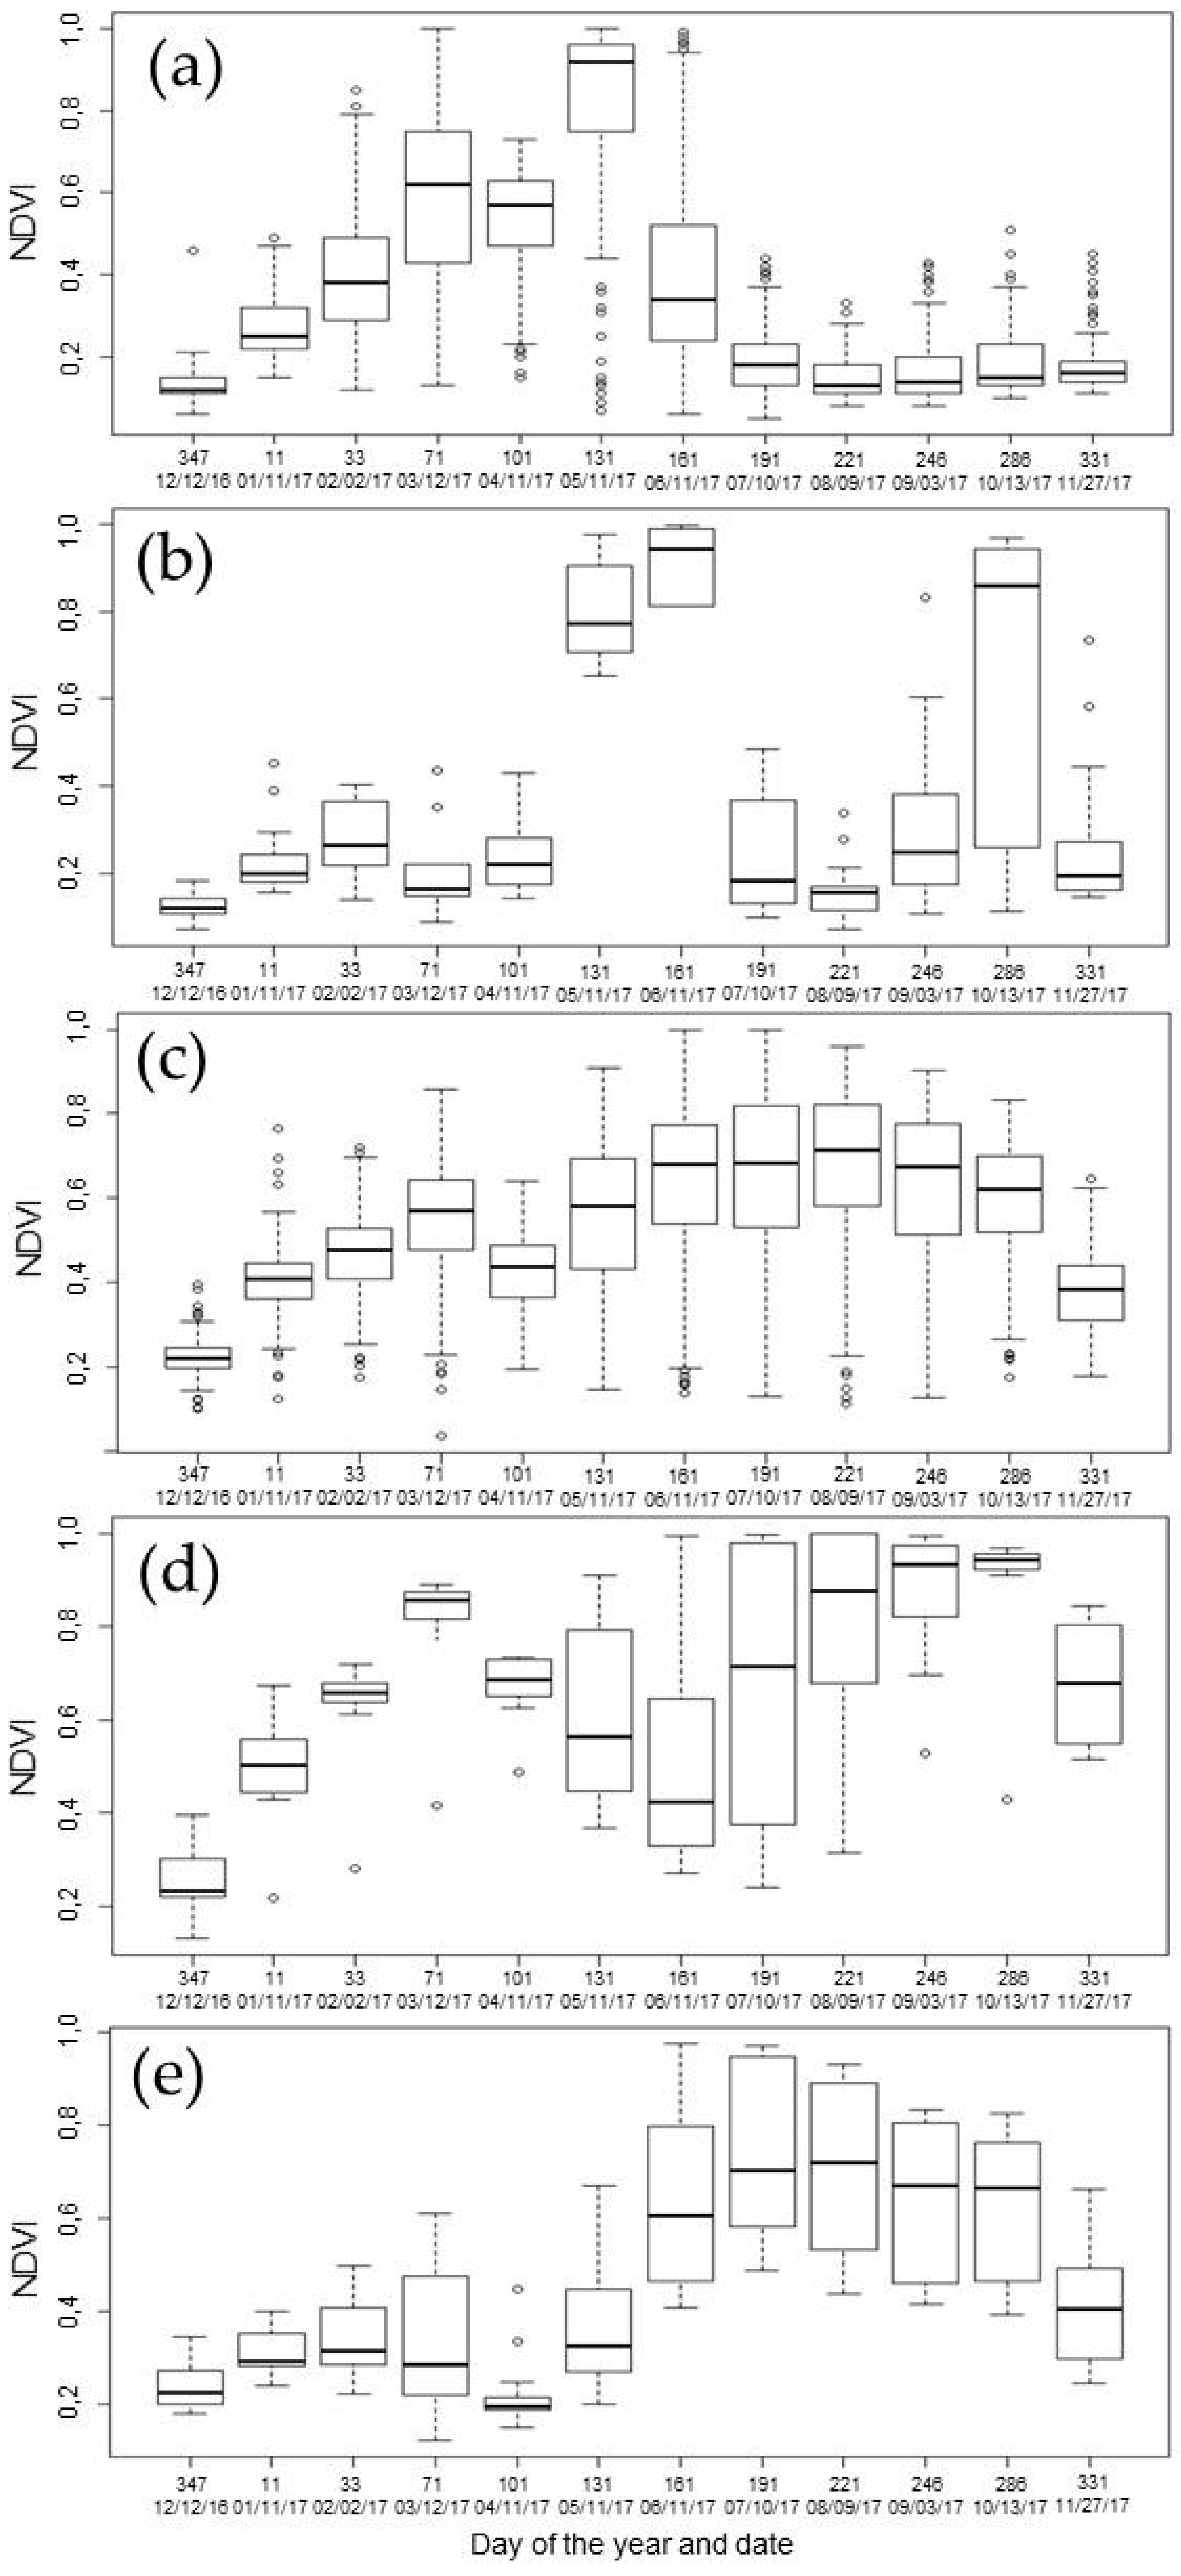
2.1.3. NDVI Evolution

Before classification, field boundaries had to be computed. Field boundaries matched the line where different crop types converged [45]. A vegetation cover that varies through time characterizes these fields, and to differentiate these cultivated areas (fields and orchards) from non-cultivated areas (built-up, water bodies, and bare soil), pixels with a “high vegetative activity threshold” were selected. According to the evolution of the NDVI in the Bekaa Valley, a pixel value over the 0.4 threshold showed significant greenness, and the vegetation cover on these fields is more homogeneous than fields with lower NDVI values (Figure 2 and Figure 3). This selection was computed for every image with a Raster calculator in ArcGis (version 10.5.1, Esri, Redlands, CA, USA) for two reasons: (1) Boundaries are different between spring and summer crops, a field of spring wheat can be subdivided into small fields for vegetable cultivation in summer, while other parts of the same field can be cultivated with corn; and (2) Monthly layers of high NDVI must be vectorized in order to obtain different field limits (Figure 3).
Second, monthly field boundaries were stacked in one layer with the ArcGis union tool in order to gather all the different seasonal boundaries. Nevertheless, Figure 4 shows the necessity to carve the stacked layer of fields with a map of local roads due to some remaining errors. The road map divides fields that were not separated with the previous steps. On the first map in Figure 4, the field’s limits are computed without the roads and some boundaries are missed as pointed out on the map. The second map stacks the fields with roads while the third map represents the final map with the completed field boundaries, which were missed by the selection of high NDVI alone. The final step was the separation of polygons with the single part-to-multipart tool to individualize the fields, which then needed to be classified. Field boundaries were validated by the comparison between 50 fields manually digitized as polygons on Sentinel-2 images, based on fields sampled for crop mapping and the extracted boundaries. This method appeared to be accurate, showing a strong positive correlation of 0.84 between the digitalized and the extracted boundaries (Figure 5).

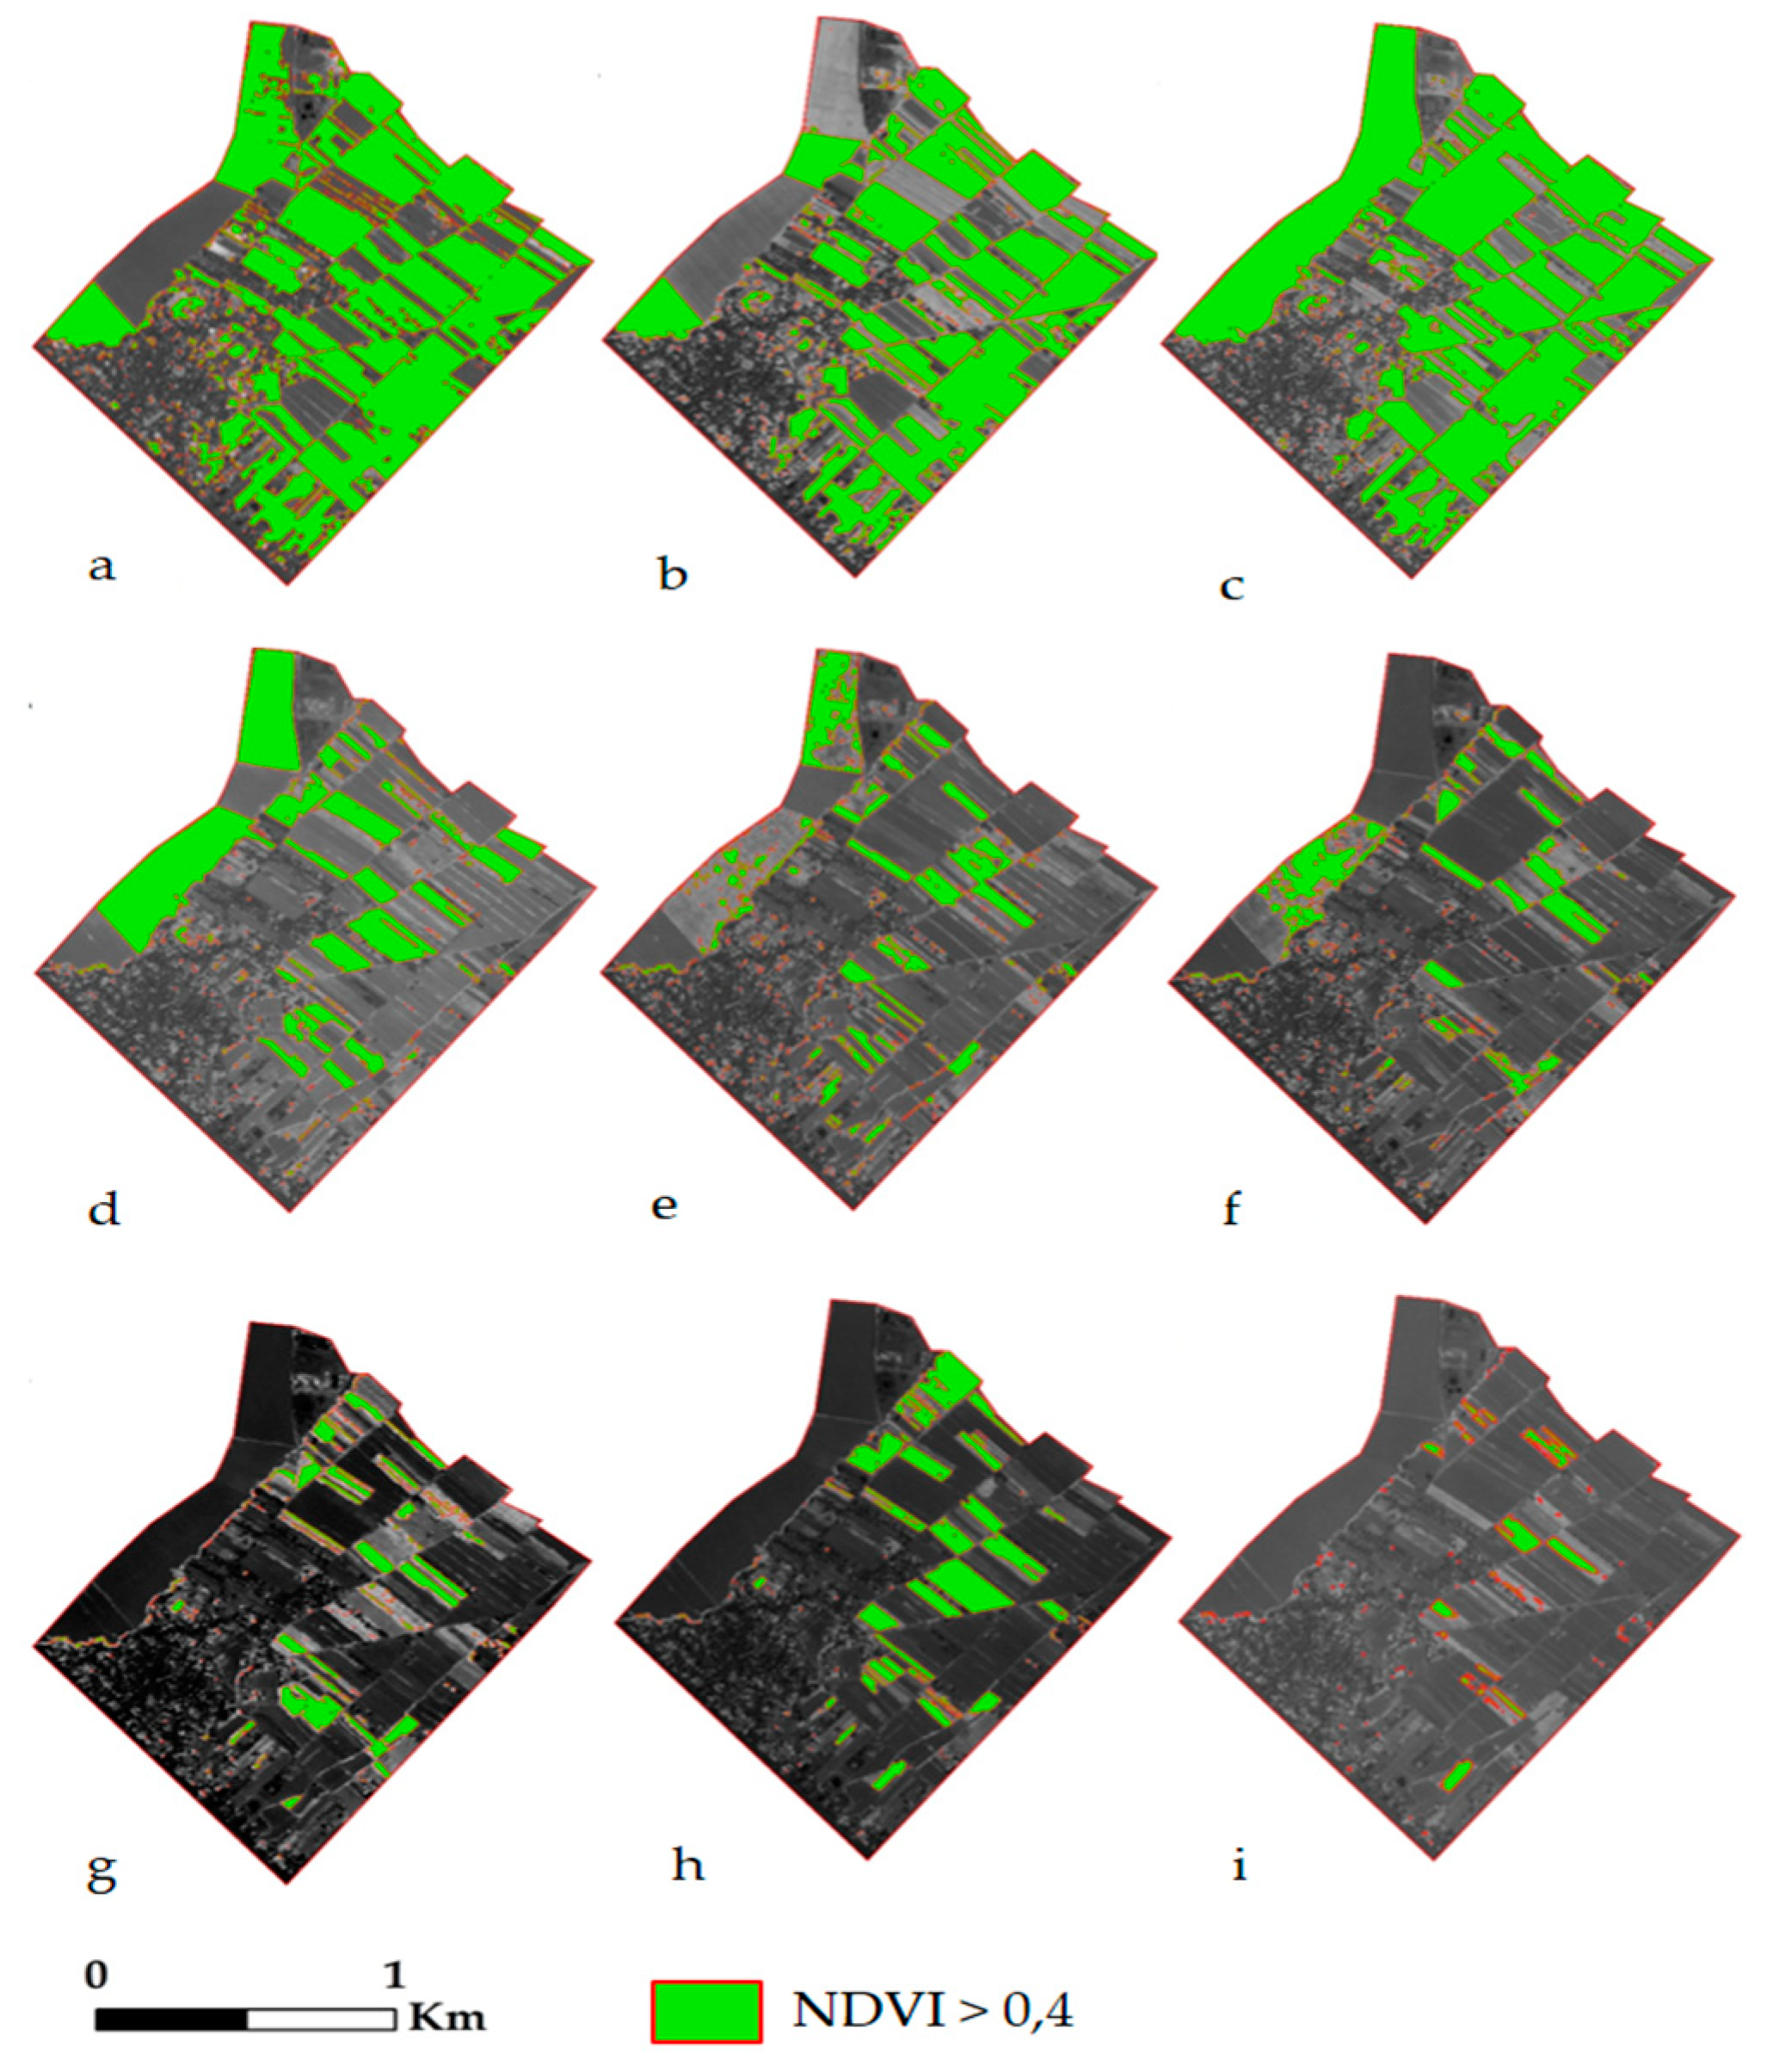
2.1.4. Classification of NDVI Profiles

The classification was carried out based on ground-based data (a) and temporal progression of NDVI (b). Once the field limits were defined, the classification of these numerous polygons could proceed. Due to differences between the crop calendars, a reference database was required: the crop type of cultivated fields in the Bekaa Valley, in spring 2017. Throughout the season, this study collected the crop type of 386 fields. The GPS location of these fields was extracted, and the crop type was assigned to the corresponding polygon field. The NDVI profile was computed on the known and the unknown fields using a zonal statistics tool. The NDVI average inside every polygon was calculated on the monthly images. Hence, one could assess the evolution of NDVI through the season, as depicted by Awad & Darwish in Lebanon [40], and use the known fields to classify the unknown fields. To this extent, the NDVI profile matched the crop calendars (Figure 6 and Figure 7).

2.1.5. Euclidean Distance to Classify Crop Types

To classify and validate the crop type of the totality of the polygons, known fields were divided into two groups (Table 1): 194 reference NDVI profiles (group a) and 192 NDVI profiles for validation (group b). Due to similar NDVI profiles, wheat and barley were gathered under the class “wheat”; and all sampled fruit trees were named “orchard”.
After testing for normality on every NDVI profile, the average of group a was computed, and this research was aimed at classifying group b according to its Euclidean distance (ED) from group a as follows (Equation (2) [46,47]. The ED was calculated using the open-access software Rstudio (version 1.1.463, Rstudio, Boston, MA, USA).
E D = i = 1 n ( a b ) 2
where a is the average of the reference NDVI profiles (group a), b denotes the NDVI profiles to classify (group b), and n is the number of months within the season. Euclidean distance was tested with every reference NDVI profile in order to determine if the NDVI profiles are closer to wheat, potato, alfalfa, vineyards, or orchard profiles. According to field observations, this study stipulates that the remaining NDVI profiles correspond to a class named “spring vegetables” (garlic, radish, beans, onions). Additionally, two other kinds of land use, built-up and bare soil, were classified following the same method in order to differentiate cultivated and non-cultivated areas. Values close to 0 indicate that the NDVI profile for validation is close to the reference NDVI profile that we were testing [46]. In regard to our ED results, values less than 0.4 were considered close to 0. For instance, the ED of alfalfa was 0.31 when the NDVI profiles were similar, and above 0.4 when these profiles were different. The temporal progression of alfalfa is relatively high through the year, except during the two to three harvests, on the contrary to wheat and others spring crops, with an increasing NDVI profile until June, after which the NDVI values are close to 0. Thereby, crop types per field are distinguished based on the resemblance and differences of temporal progressions, as represented by the ED between known and unknown fields. In addition, the final map was rasterized according to crop type in order to lighten and simplify the vectorized map of fields.

2.2. Socioeconomic and Statistical Approach of Farmer Crop Choices and Strategies: Surveys and Interviews with Farmers

2.2.1. Agricultural Profiles

The crop map provides figures for the cultivated areas and highlights current trends according to the surface of each crop. A large surface of only one crop type suggests the farmer’s desire for this cultivation, but socioeconomic surveys should clarify the reason for such preferences. Therefore, questionnaires were completed by a sample of forty-three Bekaa Valley farmers. Longer interviews were conducted whenever possible to delve into farmers’ economic strategies. The surveys were structured by four axes and divided into two sections, starting with the agricultural profiles in order to know what kind of crops the farmers cultivate.

2.2.2. Role of Government and Cooperatives

The second axis of the survey focused on the role of the government and agricultural cooperatives. The aim of this axis was to assess the scope of the current agricultural policies in the Bekaa Valley. As previously discussed, the literature highlights the lack of a political frame in the agricultural sector. On the one hand, farmers are supposed to not be restricted by any agricultural policies. On the other hand, they are not supported by the government and seem to be free to cultivate whatever they desire. Hence, this axis analyzes the involvement of the government in the agricultural sector. Agricultural cooperatives must be mentioned in this part due to their importance in Lebanon, especially the familial clustering of farmers, which plays an important role in farmers’ strategies, sometimes replacing the government.

2.2.3. Abandoned Crops

Climate is often mentioned as a criterion for crop choice. That is why, in this axis, the surveyed farmers were asked about previous crop choice and whether climate change was a reason to abandon certain crops. However, without fieldwork and crop-type GPS collection, it is not possible to map and inventory former crops on satellites images from previous decades. Thereby, this research relies on FAO statistics on a national scale, which show the evolution of harvest areas per crop type in Lebanon for the timeframe between 1961 and 2016, according to statistical estimations and agricultural census [34]. The evolution of the harvest areas per former crop mentioned by farmers is examined and explained according to farmers’ testimonies.

2.2.4. Economic Influences on Farmers’ Strategy

The fourth axis of this survey concerns another kind of change: farmer adaptation to economic evolution. The integration of Lebanese farms into national or international markets could also explain crop choices that have been adapted to profitability and economic opportunities. On the one hand, farmers were asked about crop exports, buyers, prices, and profitability. On the other hand, the economic situation of the Bekaa Valley agricultural sector might be influenced by geopolitical factors, such as the war in Syria. The geopolitical situation in the Middle East affects the exportation of agricultural products, disturbs the market, and sways farmers’ economic strategies. The surveys and interviews considered this dimension with the farmers.

3. Results

3.1. Absence of Agricultural Policies and Dependency on the Government: A Paradox

3.1.1. Current Main Crops: Results and Crop Map Validation

The results of the crop classification produced the following crop map for spring cultivation in the Bekaa Valley in 2017 (Figure 8 and Table 2). First, the crop map is validated by the accuracy of the Euclidian distance classification, as shown in a confusion matrix (Table 3) as recommended by Congalton [48], and the validity of the classification (Table 4). The overall accuracy is 90% (including urban and bare soil) and 87% for the agricultural areas, with a minimum of 71% for vineyards and a maximum of 96% for early potatoes and 100% for alfalfa, bare soil and urban. The recall of alfalfa, bare soil and urban are equal to 100% since every classified field matches the reality on the ground. However, the precision was a bit lower for alfalfa and bare soil since few fields were mixed with other type of crops, namely, orchard (it has a similar NDVI profile to alfalfa) and wheat. This mixed pixel result might be due to an early harvest and therefore, the decrease in the NDVI as observed for bare soil at the beginning of summer. The precision of early potato is also lower than its recall, as it has been mixed with other crops while other known fields were correctly classified. Higher precision was found for wheat and orchard with a significant recall, which strengthens the model and its reproducibility. On the one hand vineyard follows a different trend with the lowest accuracy, recall and precision. On the other hand, the values remain high despite the confusion with orchard (also with a similar NDVI profile and values, mixed between vegetation and bare soil).
Overall, there is strong and positive correlation between fields from group a and b, with a Pearson test score of 0.8. Therefore, 32% of the cultivated area is occupied by wheat, all over the plain from Joub Jannine (south) to Baalbeck (north). The second crop is early potato, which uses 25% of the cultivated area, and is cultivated by a majority of farmers. Spring vegetables occupied 23% of the plain in 2017, including onions, garlic, eggplants, and squash. Orchards are present on the plain (11%), mainly in deep soils such as in Anjar. Vineyards (7%) were also established, especially on the west side of the plain to take advantage of the sunset and limit frozen dew. Alfalfa is the least-cultivated crop, covering less than 1% of the Bekaa Valley area. Thereby, these crop choices need to be explained by the results of the surveys.

3.1.2. Survey Results: Agricultural Profiles and the Preference for Wheat

The crop map’s results were also validated by the socioeconomic interviews of forty-three farmers surveyed in 2017. All of them were male, 68% of them were sharecroppers leasing from traditional land owners and the others owned their farms. Once again, the most cultivated crop in the Bekaa Valley was wheat: 87% of the interviewed farmers cultivate wheat with an average of 106 ha (Table 2). Most of the farmers predominantly choose wheat due to its profitability, since the government purchases the entire wheat production every year. According to the surveys, this rare agricultural policy helps farmers to a significant extent. This wheat policy was framed by the Food Security and Self-Sufficiency Program, made into law and subsidised by the government in 1959 [49]. It explains the desire of farmers for this crop, of which the area was drastically increased in the 1960s (Figure 9). The price of wheat is calculated according to international prices. Hence, wheat is a secure crop since farmers are guaranteed to sell their products at a steady price every year, in comparison with other crops, such as vegetables which have various and unreliable prices from one season to another. Nonetheless, such a policy creates farmer dependency on the government. In addition, several farmers deplored the reduction of these subsidies by saying, “Before 2014, the government subsidized wheat at 1000 $/ha. Now, it’s 790$. This is not enough! It is very difficult for us now!” (S-H, 2017), and, “They (the government) must purchase our wheat production, otherwise we don’t have any other customers to sell our production” (S-H, 2017). Indeed, the wheat policy has changed significantly over time, such as during the civil war in the 1980s when it completely vanished (Figure 9). Nowadays, the Ministry of Finance, which controls this policy, has difficulties in paying back the Treasury and has had to reduce the amount of the subsidies [49]. Since farmers highly depend on this policy, and if the wheat policy was to disappear entirely, farmers would have to find other markets with relevant prices to ensure wheat profitability. Seventy-three percent of the interviewed farmers sell wheat to the government, and the rest sell to traders when the price is sufficient and relevant. Farmers adapted their crop choice to public policies, but the dependency might have consequences, especially since wheat is the main crop type in the Bekaa Valley. It seems that farmers will have to adapt their strategies to new national or international markets, with non-subsidised prices and high competitiveness, in the absence of the government. It seems that only the owners of the largest farms have this capacity on account of high levels of mechanized production.

3.1.3. Dependence on the Market

After wheat, early potatoes are the most widely cultivated crop, and constitute 25% of the plain. Early potato is concurrently cultivated with wheat all over the Bekaa Valley, and were cultivated by 56% of the interviewed farmers (Table 2). The surface areas of early potatoes are smaller than wheat due to their significantly higher yields: 68 t/ha compared to 5 t/ha for wheat. Therefore, early potato is an intensive crop and farmers cultivate it for its adaptability to the national market: potatoes are processed for snacks and chips. Indeed, according to surveyed farmers, it is appropriate to choose early potato as a crop: When the surveys asked: “Would you like to change your current crop for a new one?”, farmers answered: “Why should I change my crop choices? It would not be relevant. In addition, potatoes are purchased and processed by big companies such as (name of company). They’re good customers. They are wholesalers and purchase the entire production in the Bekaa Valley” (G-S, 2017). Surveyed farmers stated that they know potato customers. Hence, the farmers have a strong economic interest in cultivating these strategic crops. Consequently, confirmed by crop-map statistics, there is strong competition for potato in the Bekaa Valley since they are purchased by private companies, contrary to wheat: “The other farmers are strong competitors! Many of them cultivate potatoes all over the Bekaa Valley (…) they are direct competitors. We sell our products to the same companies, so it’s hard to handle the competition.” (R-P, 2017). In this matter, a few agricultural cooperatives play a significant role in this market. Head farmers that lead such cooperatives are also in charge of potato collection and refrigeration. In this regard, cooperatives replace the government’s role and purchase produce from modest farmers in order to sell it to these companies. This example shows that adaptation to an available market is a key criterion for farmers’ crop choices. The presence of these companies increases competitiveness and has favored the increase in potato harvesting since the 1960s (Figure 9). Therefore, farmers have had no reasons to abandon this crop to date since it is profitable for them.

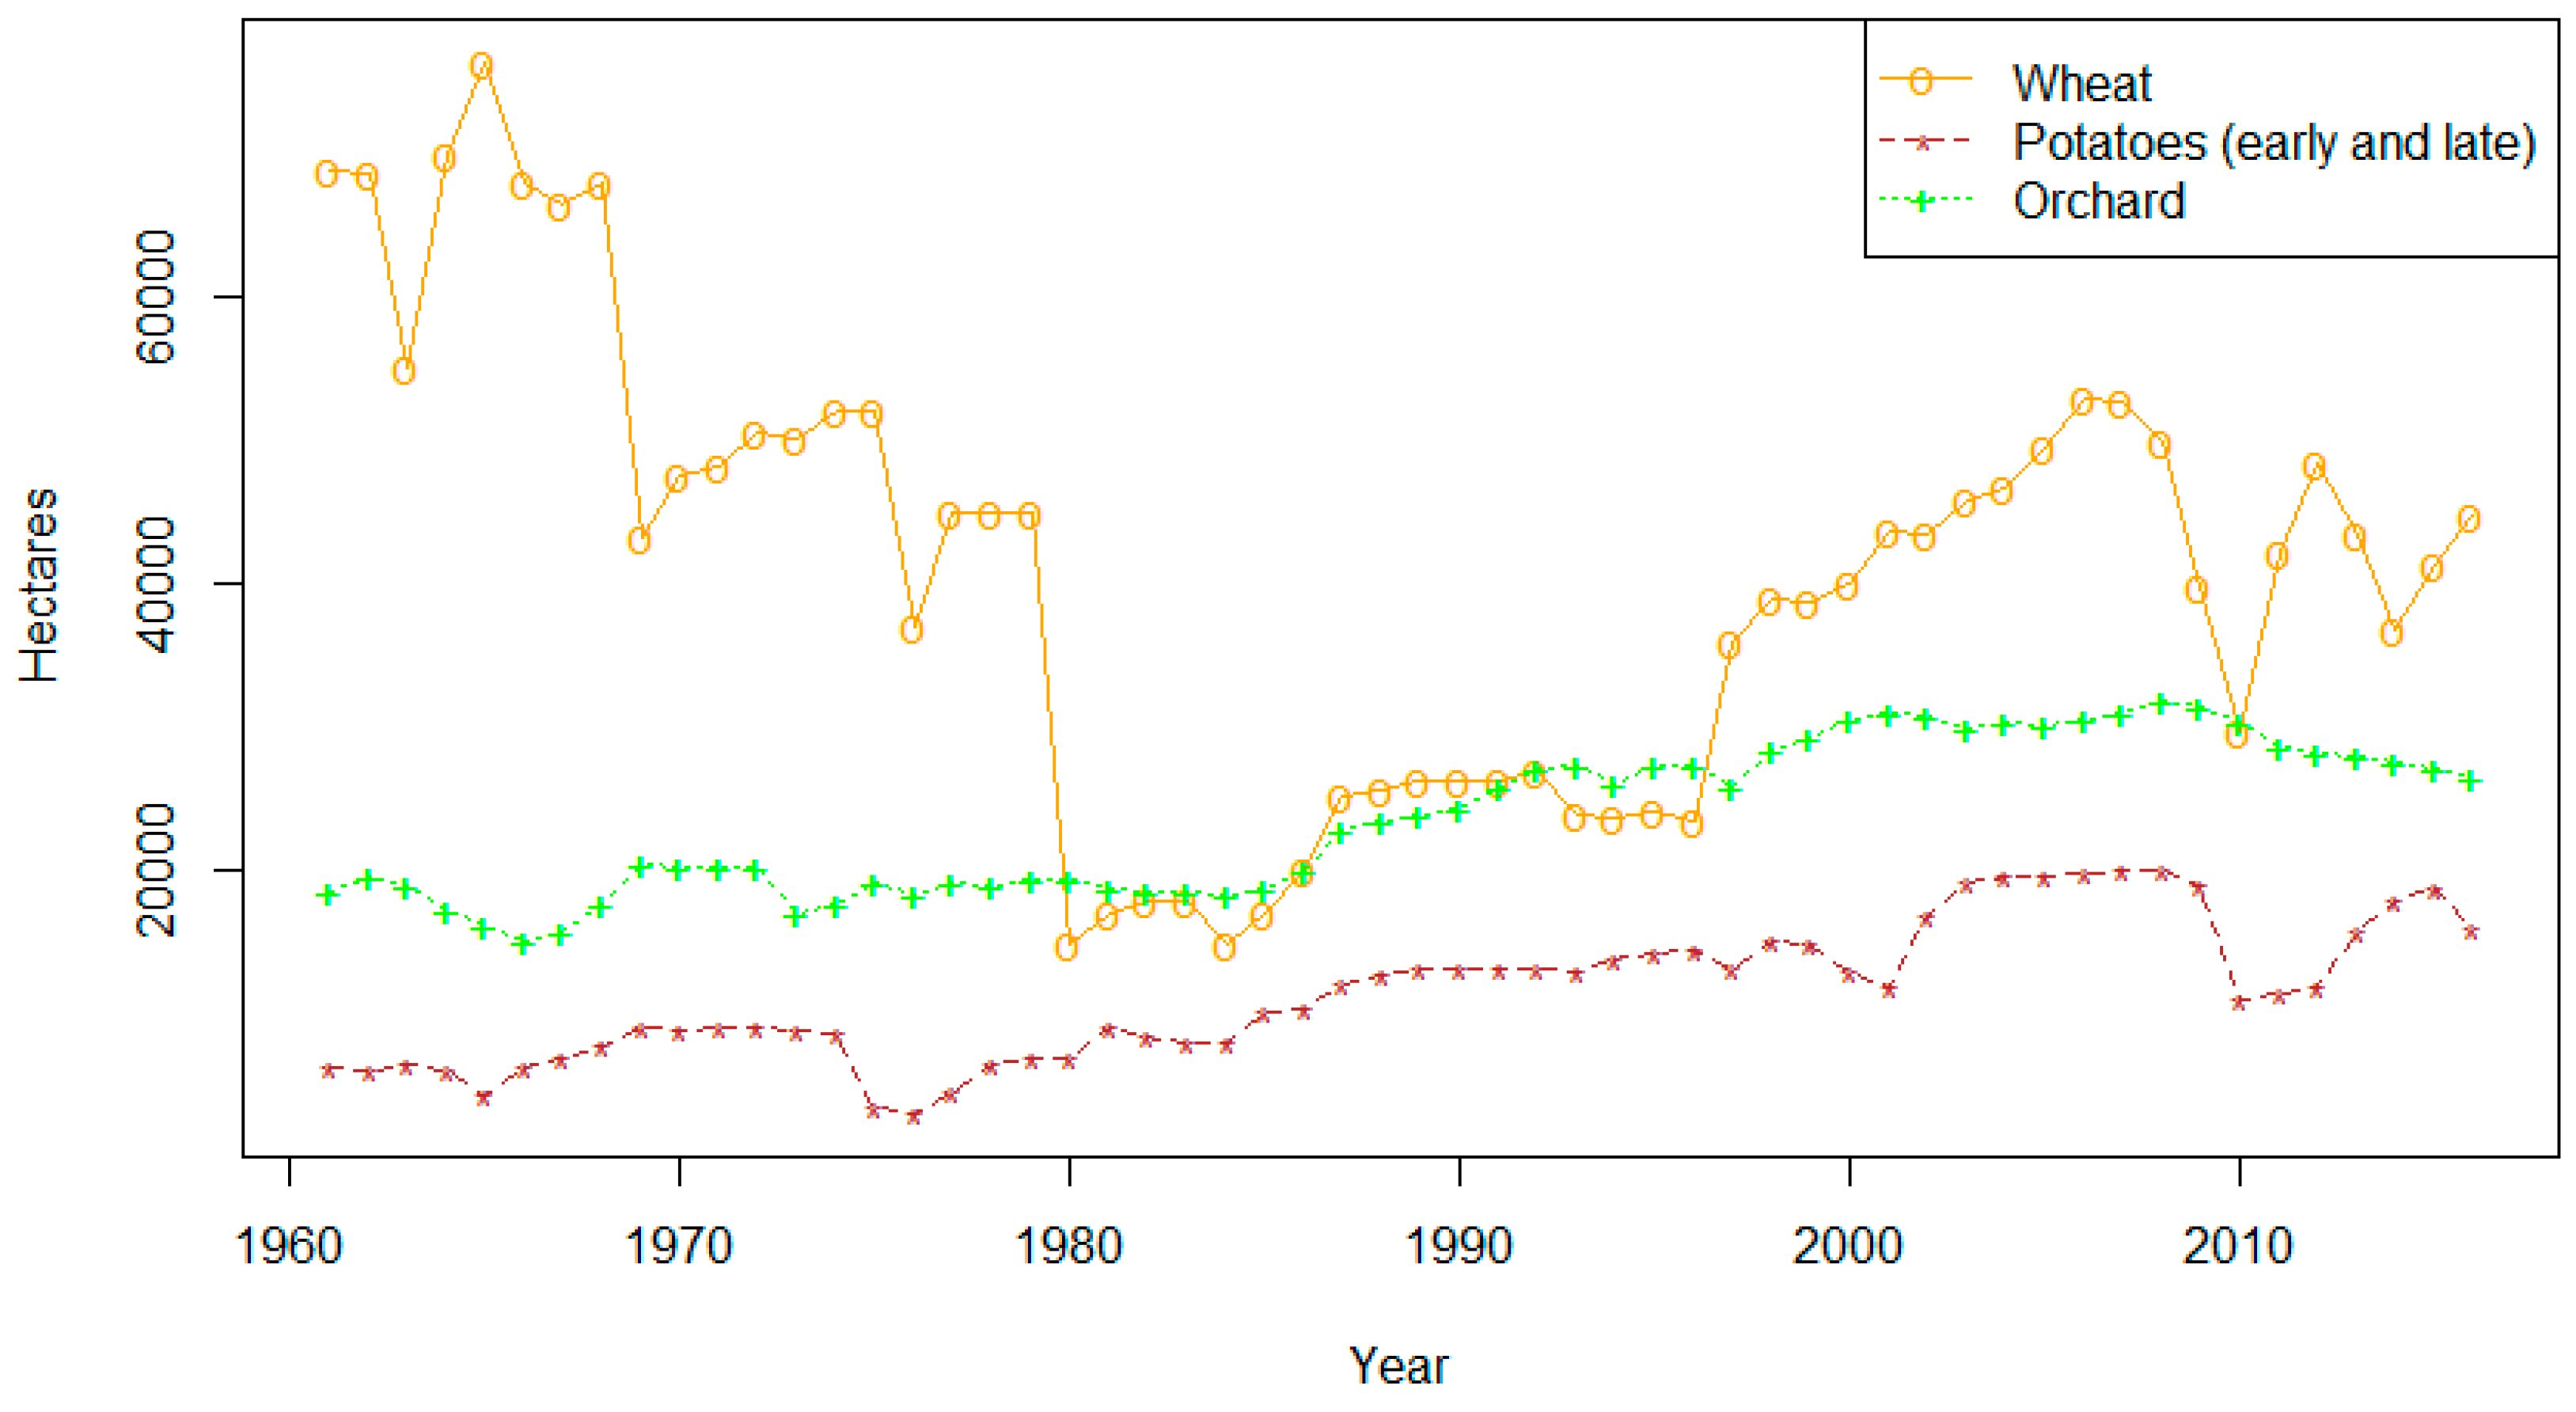
3.1.4. Increasing Crop Surface Area in Lebanon

Each surveyed farmer cultivates fruit trees, including apples, cherries, plums, peaches, and pears in a few hectares. These fruit trees are among the most profitable products in Lebanon. For instance, some farmers would to replace some of their crops with fruit trees: “In Ammiq, we are going to plant peach trees instead of wheat fields. We want more peach trees because it is more profitable” (H-A, 2017). Profitability was the first criterion evoked by surveyed farmers, whereas climate was not mentioned. While orchards require significant irrigation, the question of an orchard’s adaptability to the Bekaa Valley’s dry summer was not seen as a priority. Concurrently, spring vegetables have an important share (23%) of the area in the Bekaa Valley. Fruit trees and spring vegetables have one common characteristic: their ability to be exported to Gulf countries. However, the war in Syria has slowed down exports and led to overproduction in some farms of the Bekaa Valley. Hence, fruit and vegetable prices are much lower than before the war in Syria. Despite the decrease in exportation, the profitability and exportability of products play an important role in farmers’ strategies and have increased the harvest area of orchards over the past five decades (Figure 9). In addition, fruit and vegetables are sold in local markets and distribution centers all year long in order to meet the constant demand for such products in Lebanon.

3.2. Abandonment of Certain Crops

3.2.1. Farmers’ Crop Choice Evolution: Sugar Beet Policy

One of the most recent and relevant examples of change in farmers’ crop choices is the sugar beet produced in the Bekaa Valley. In 1959, the government voted for new subsidies to purchase sugar beet in Lebanon [49]. This policy was administered until 2004, when the subsidy budget for sugar beet was no longer available. The lifetime of such a policy is visible in the evolution of the sugar beet harvest area (Figure 10). As soon as the purchasing policy ended, the sugar beet area almost disappeared from Lebanese fields covering less than 1000 ha in 2016 [34]. This drop in production was further confirmed when interviewed farmers claimed that they had changed crops in 2004–2005. Around 46% of them abandoned the sugar beet due to the end of the subsidies; climate change proved not to be a factor in stopping this cultivation. S-H (2017) stated: “Before, I used to cultivate sugar beet to produce sugar (…) the price of sugar beet on the market was suitable, but the costs of production were high. Moreover, the government did not purchase our productions anymore because they did not have the funds for that”. There is a strong correlation between an observed crop area and agricultural policies. The examples of sugar beet and wheat strengthen the idea that crop choices strongly depend on governmental policies.

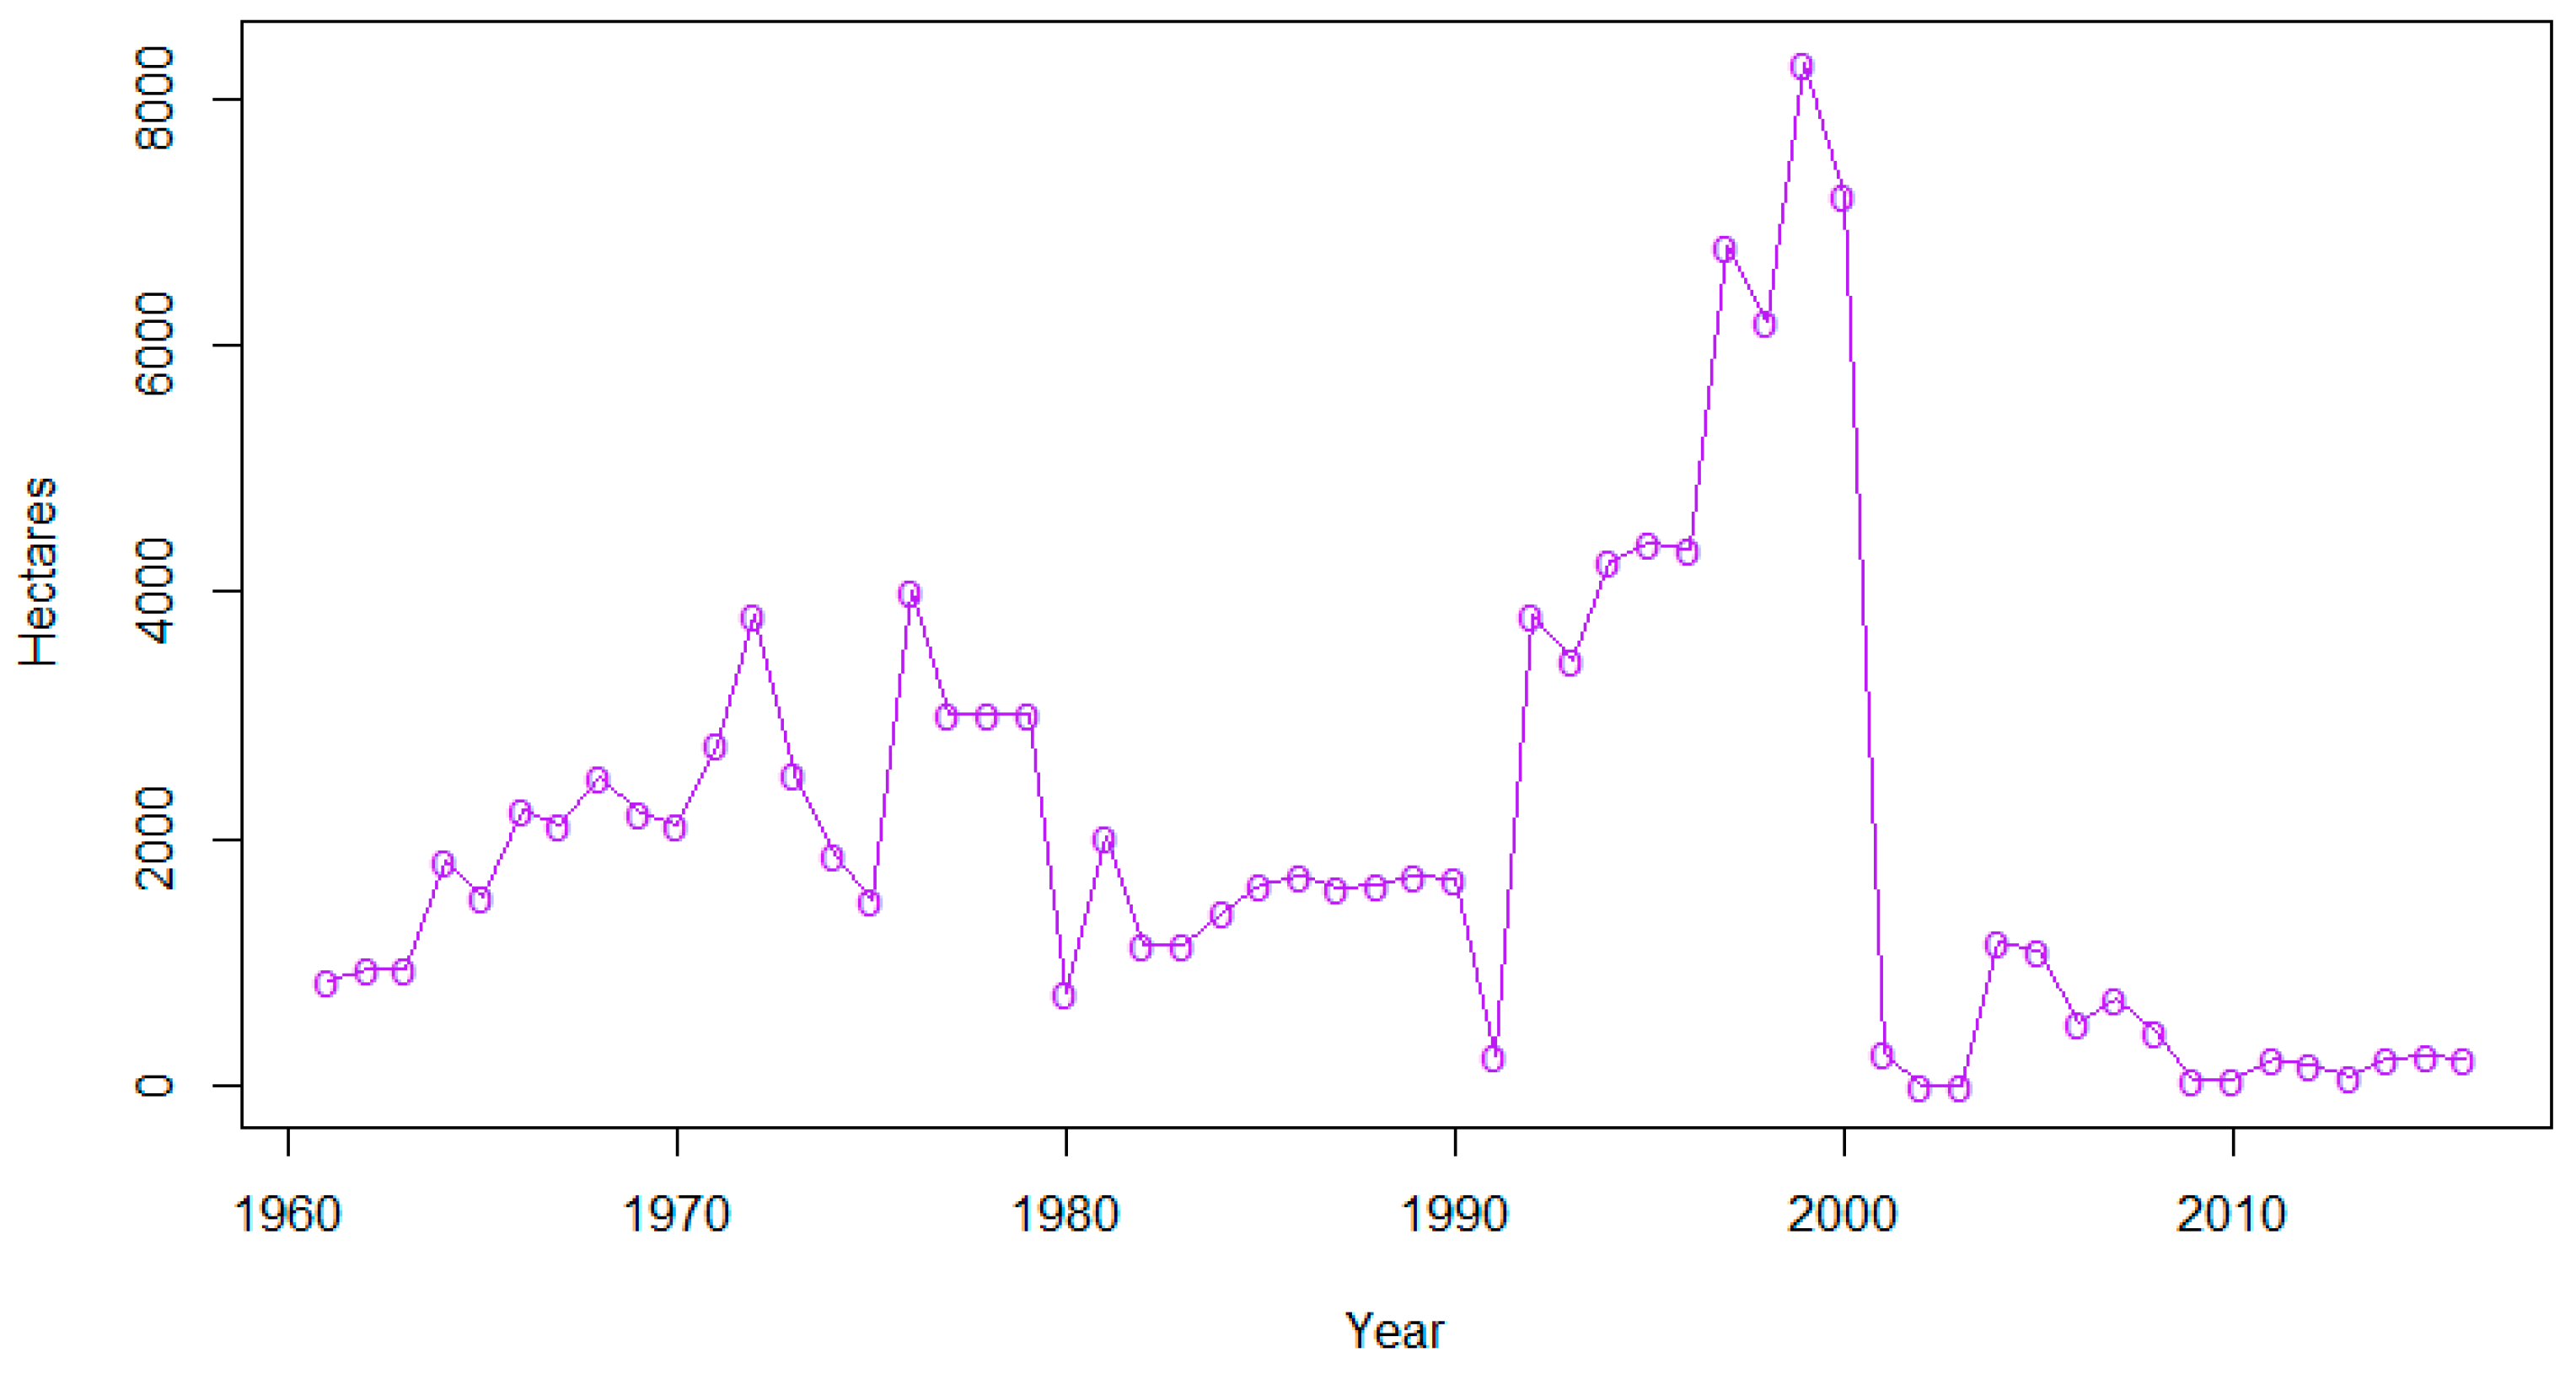
3.2.2. Cannabis: Decreasing Surface Area as a Result of Government Anti-Drug Interventions

Another example of the influence of policies on farmers’ crop choice is cannabis or hashish, which is the main illegal alternative for farmers in the Bekaa Valley. In the 1920s, significant areas of the Bekaa were cultivated with cannabis. This continued until the uprooting policies by the army, which began in 1995 [50]. This crop is very profitable and does not require a lot of effort to obtain significant yields, particularly water: “It is a highly desired alternative for famers, especially when you are in debt. It is highly profitable” (R-K, 2017). Since there is no social insurance and only a few banks that offer loans to Lebanese farmers, some of them decided to cultivate cannabis to maximize their farming revenue. However, its area was drastically decreased from 30,000 ha in 1981 to 5000 ha in 2016 after the intervention of the army, according to the interview with R-K (2017). Some of the interviewed farmers used to cultivate hashish and switched to legal crops such as sugar beet, or wheat before the end of subsidies. Nowadays, the cultivation of cannabis remains well known in the Bekaa Valley: “You can see it everywhere and the army uses the adjacent roads to these fields but they cannot do anything. It is like that everywhere in the Bekaa Valley, mainly in the western part (…) the police were supported by the American Drug Enforcement Administration to destroy the fields, but nowadays, the army is too busy with troubles and terrorists in the Anti-Lebanon war. They don’t have time to look after illegal crops” (R-P, 2017). Cannabis reveals the paradox of an absent state in the Bekaa Valley. Nonetheless, farmers, to some extent, depend on the government’s decisions, as seen with legal crops such as wheat.

3.2.3. Climate or Economy: Unbalanced Criteria

Other new crops and alternatives to wheat or potatoes were studied in the Bekaa Valley. The Lebanese Agricultural Research Institute (LARI) currently leads research on new crops that are profitable and adaptable to the local climate, such as quinoa, which requires minimal water. This crop is an interesting alternative for farmers who can sell one kilo for $10 compared to much less for wheat or potatoes. However, interviewed farmers did not express a strong interest in quinoa for two reasons: (a) high production costs, and (b) they do not have access to quinoa markets: “I’ve heard about quinoa but I have never tried to cultivate it. This is not a consideration in my future farming plans because production is expensive. Seeds and cultivation are expensive… it requires a lot of workers (…) quinoa is adaptable to the Bekaa, it is true… but it is less profitable than wheat and potatoes. We have important customers for wheat and potatoes in Lebanon, but for quinoa, I don’t know any, so we don’t know to whom and where to sell it” (G-S, 2017). The decision not to cultivate quinoa is mostly due to economic rather than climate criteria. Despite adaptation to the local climate, it seems that quinoa will not have a significant share of the crops in the Bekaa Valley for years to come. Farmers prefer to keep their current crop choices since they are adapted to the market demand. The presence of a market appears, once again, to be a key issue in farmers’ crop choices.

3.2.4. Searching for Alternatives

Some surveyed farmers search for alternatives on their own in order to be less dependent on the wheat policy, which could potentially end at any time. Once again, potential new crops must be profitable and attract the interest of farmers. The cultivation of canola was mentioned as a future crop choice by one farmer: “Canola is a good idea. There are many possibilities to make it profitable since we can extract organic biofuel from it. However, we need industries to continue production, and agricultural policies from the government to support us” (S-H, 2017). According to this farmer, if the wheat policy ends, it must be replaced by support for other crops with new agricultural policies. Indeed, 90% of the farmers stated that there were no other agricultural policies, and added that the current support is not financially sufficient. However, this study showed that, despite the absence of the government in this sector, farmers still rely on the purchasing policy for some produces. It seems difficult for farmers to abandon subsidized crops in favor of other competitive crops like quinoa or canola.

4. Discussion

4.1. Other Criteria of Crop Choices in Lebanon

4.1.1. Existence of a Private and Public Market

There are several lessons learned through this research, especially on farmers’ motivations to cultivate some crops instead of others. The existence of a private and public market appeared as the main criterion for farmers to choose the crops. Through the existence of both markets, according to the surveys, profitability determines farmers’ strategies. The dependence on the market also influences farmers who did not choose crops such as quinoa and canola. Despite the adaptability of these new crops to climate conditions, farmers choose not to cultivate them due to a lack of customers. Hence, one can understand that market demand hampers farmers’ free will. In other words, farmers are not free to choose whatever they want to cultivate and strongly depend on external factors, such as the existence of a profitable and competitive market.

4.1.2. Farmer Isolation

Currently, farmers remain isolated since there is no political frame for agriculture in Lebanon, except for the wheat policy. Farmers insisted on the fact that they are alone and without any support from the government, and they mostly cultivate wheat. This isolation makes farmers dependent on private market dynamics. They expect guidelines, information, and communication on new markets from the government, especially during the war in Syria, which has limited access to the Gulf States by truck roads. For instance, the current subsidies on agricultural transportation, ExportPlus, could evolve in this direction by identifying potential customers in other foreign countries instead of supporting transportation by boat of vegetables that cannot endure long distances. In addition, the government could set up plans to guide farmers’ crop choices. However, it seems that the government has chosen to liberalize the agricultural sector, without considering guidelines options, and farmers have adjusted their strategies accordingly.

4.1.3. High Adaptation Capacity or Farmer Autonomy

Regarding the absence of agricultural policies, this research shows that farmers have the capacity to adapt their strategies to other markets, such as potatoes for the Lebanese market or fruits and vegetables for the Gulf states. Despite the domination of wheat in the Bekaa Valley, farmers have had to diversify their crop choices and cultivate other options in order to avoid a monoculture. The presence of various fruits and vegetables, highlights their capacity to decrease their dependency on the government and its purchasing policies. The cultivation of hashish, despite its illegality, is the best example of farmers’ autonomy in a spatial frame where the government is absent, especially in the north of the valley. Indeed, their capacity to adapt is due to the isolation of farmers with low support from the public or private markets. Therefore, farmers are able to find alternatives and cope with the absence of governmental and public support. However, this isolation can lead to illegal crops, thus increasing insecurity issues, as in the case of hashish.

4.1.4. Low “Resistance” Capacity of Farmers’ Strategies

On the one hand, farmers are able to adapt their strategies to face the lack of public framing in agriculture. On the other hand, the data from this study highlight the low capacity for resistance to legitimate profitability. Farmer resistance to globalization in the Mediterranean basin seems to be hampered by the evolution of family farms towards more intensive and productive farms [51]. Regarding the results of this research, it seems that the Bekaa Valley reflects this process. Indeed, farmers have adapted their crop choices according to its profitability in the past and nowadays depend on them. In this study area and to our knowledge, no alternatives other than adaptation to dynamic markets, such as potatoes or fruit trees, were found, and the main strategy of farmers is to follow process profitability through globalization. So far, the only option for farmers after wheat is necessary adaptation to profitable and global markets. This situation leads to individual strategies and the abandonment of familial farms, such as can be seen in Israel, Libya, Spain, and Italy [51]. Thus, the analysis of crop choices in one area helps us to comprehend farming strategies.

4.2. Integration of Remote Sensing and Socioeconomic Surveys

4.2.1. Crop Mapping: Perspectives and Interests

Despite the satisfying accuracy of the crop map of spring crops in the Bekaa Valley obtained in 2017, it is relevant to explore further ways to improve its precision. For instance, the number of GPS coordinates of crop types in the field can be increased. Indeed, wider reference points enable users to extract relevant and representative NDVI profiles and crop calendars. The evolution of the NDVI profile of only a few fields does not represent the NDVI profiles of similar crops all over the plain. In addition, the accuracy of these GPS coordinates is a key feature to guarantee reliable NDVI profiles; GPS locations must be collected in the middle of the field.

4.2.2. Support for Agricultural Census

Overall, the use of the method introduced in this paper was to facilitate the estimation of crops areas from the perspective of an agricultural census. Indeed, remote-sensing processes, based on ground data, such as simple GPS collection can help decision makers map current crops, season by season, in addition to the decennial agricultural census in Lebanon [10]. Indeed, an agricultural census might require cadastral data, which are more difficult to collect. Satellite images could be a replacement whenever such data are not available, especially in Mediterranean countries. Thereby, remotely sensed methods are relevant in countries where access to data is difficult. Nevertheless, the combination of the Lebanese cadastral with such crop maps is strongly relevant for subsidy distribution in Lebanon, especially for wheat. In addition, the user’s accuracy for wheat was one of the highest and could help the national administrations in charge of wheat purchase. The crop maps could also contribute to the estimation of food production in Lebanon. Estimations of yields (based on field surveys or other remote sensing processes) combined with crop areas would provide a precise idea of the national production and thereby, the national needs. Simultaneously, the production estimation could prevent overproduction from one year to another, as has already happened for potatoes in Lebanon: when the price of a product is high enough over a season, farmers choose to massively cultivate this crop the year after, which leads to a waste of food and a decrease in the price per kilo. Overall, the small size of Lebanon makes the application of remote sensing even more pertinent since satellites cover almost the entire surface of the country. Therefore, national agricultural census in Lebanon could be applied with the present method.

4.2.3. Interest of the Cross-Sectorial Approach

This research tried to balance different approaches to the agricultural sector in the Bekaa Valley. The combination of remote-sensing methods as a qualitative approach and the use of socioeconomic surveys for qualitative and quantitative assessment appeared to be beneficial in understanding the crop choices of farmers and the current situation of the agricultural sector in this plain. It seemed relevant to support the interpretation of the crop maps with the results of the socioeconomic surveys with the most concerned stakeholders: the farmers. The results of the crop map highlight the main trends in farmers’ crop choices.

5. Conclusions

The accurate application of remote sensing developed in this research aims to be simple and free for agricultural stakeholders, managers to ease the agricultural census each year. The blend of remotely sensed images and ground surveys enables one to find the preferences of farmers for one crop over another. Two main factors influence farmers’ crop choices: (1) the presence of dynamic markets, despite the economic difficulties mentioned in this study, such as the war in Syria; and (2) the evolution of agricultural subsidies such as wheat and sugar beet were mainly considered by farmers while climate change and the lack of agricultural policies were not. Therefore, remotely sensed images and synchronous surveys help to explain why farmers adapt, or not, their cultivations strategies to future important challenges such as climate change or new economic opportunities. They prefer a secure and known market instead of going for new crops. Such findings may help decision makers to implement new market identification policies.

Author Contributions

Conceptualization, A.C., G.F., D.D., F.A. and K.B.; Methodology, A.C., and G.F.; Software, A.C.; Validation, A.C., G.F. and D.D.; Formal analysis, A.C.; Investigation, A.C.; Resources, A.C.; Data curation, A.C.; Writing—Original draft preparation, A.C. and F.A.; Writing—review and editing, A.C., G.F., D.D., K.B. and F.A.; Visualization, A.C.; Supervision, G.F., D.D. and K.B.; Project administration, D.D. and K.B.

Conflicts of Interest

The authors declare no conflict of interest.

References

  1. Rastoin, J.-L.; Ferroukhi, S.A.; Abis, S.; Hainzelin, E.; Aliouat, B.; Hammoudi, A.; Benabderrazik, H.; Koné, S.; Cheriet, F.; Martin-Prével, Y. Afrique—Méditerranée—Europe: Pour une sécurité et une souveraineté alimentaires durables et partagées. IPEMED 2016, 9, 1–11. [Google Scholar]
  2. Montigaud, P. Les Filières Fruits et Légumes Frais Au Liban: Structures, Fonctionnement et Perspectives; INRA: Montpellier, France, 2004; pp. 1–61. [Google Scholar]
  3. Hervieu, B.; Abis, S. Les dynamiques agricoles en Méditerranée. Conflu. Méditerranée 2006, 58, 169–186. Available online: https://www.cairn.info/revue-confluences-mediterranee-2006-3-p-169.htm (accessed on 5 May 2018). [CrossRef]
  4. Abis, S.; Blanc, P. Chapitre 1—Le contexte sociodémographique. In MediTERRA 2008; Hervieu, B., Abis, S., Blanc, P., Jouvenel, A., Eds.; Presses Sciences: Po, France, 2008; pp. 31–56. [Google Scholar]
  5. Darwich, S. Enjeux de reconversion rurale dans la Béqaa (Liban): Politiques publiques et cultures illicites. In Environnement et Sociétés Rurales en Mutation: Approches Alternatives; Picouet, M., Sghaier, M., Genin, D., Abaab, A., Guillaume, H., Elloumi, M., Eds.; Latitudes 23-IRD: Marseille, France, 2004; pp. 323–339. [Google Scholar]
  6. Blanc, P. Développement régional et cohésion ‘nationale’. Conflu. Méditerranée 2006, 56, 115–129. Available online: https://www.cairn.info/revue-confluences-mediterranee-2006-1-page-115.htm (accessed on 6 March 2018). [CrossRef]
  7. Garçon, L.; Zurayk, R. Dans les Champs de la Bekaa. Le Monde Diplomatique, France, 2010; pp. 18–19. Available online: https://www.monde-diplomatique.fr/2010/09/GARCON/19645 (accessed on 22 March 2018).
  8. World Bank. Lebanon Agriculture Sector Note: Aligning Public Expenditures with Comparative Advantage; 68792; The World Bank: Washington, DC, USA, 2010; pp. 1–27. [Google Scholar]
  9. Allam, N. “Farming Is Like Gambling”: An Examination of the Decline of Produce Farming in Lebanon’s Central Bekaa Valley. Ph.D. Thesis, The George Washington University, Washington, DC, USA, May 2009. [Google Scholar]
  10. Ministère de l’Agriculture Libanais, FAO. Résultats Globaux Du Module de Base Du Recensement de L’ Agriculture 2010. Available online: http://www.agriculture.gov.lb/html/RESULTATS_RECENCEMENT_ AGRICULTURE_2010/RAPPORT_RESULTATS_GLOBAUX_DU_RECENCEMENT_2010.pdf (accessed on 20 June 2018).
  11. Balanche, F. Atlas Du Proche-Orient Arabe; PUPS: Paris, France, 2014; pp. 1–128. [Google Scholar]
  12. Blanc, P. Proche-orient: Le pouvoir, la terre et l’ eau. Géocarrefour 2014, 89, 228. [Google Scholar]
  13. Chehaita, B.; Ibrahim, M. L’agriculture au Liban: La nécessité d’une transition vers l’agriculture durable. Available online: https://www.lebarmy.gov.lb/fr/content/l%E2%80%99agriculture-au-liban-la-n%C3% A9cessit%C3%A9-d%E2%80%99une-transition-vers-l%E2%80%99agriculture-durable (accessed on 8 May 2018).
  14. Lamanthe, A. Extension des marchés et normalisation: Les systèmes agro-alimentaires dans la mondialisation, Summary. Géogr. Écon. Soc. 2007, 9, 257–270. [Google Scholar] [CrossRef]
  15. Caiserman, A. Identification and Classification of Cultivable Lands and Potential Sites for Hill Lakes Planning in the East of the Mediterranean Basin: The Case of the High-Jbeil (Lebanon). Ph.D. Thesis, University of Jean Moulin Lyon 3, Lyon, France, July 2016. [Google Scholar]
  16. Dercon, S. Risk, crop choice, and savings: Evidence from Tanzania. Econ. Dev. Cult. Chang. 1996, 44, 485–513. [Google Scholar] [CrossRef]
  17. Kurosaki, T.; Fafchamps, M. Insurance market efficiency and crop choices in Pakistan. J. Dev. Econ. 2002, 67, 419–453. [Google Scholar] [CrossRef] [Green Version]
  18. Huh, W.T.; Lall, U. Optimal crop choice, irrigation allocation, and the impact of contract farming. Prod. Oper. Manag. 2013, 22, 1126–1143. [Google Scholar] [CrossRef]
  19. Rahman, S. Determinants of crop choices by bangladeshi farmers: A bivariate probit analysis. In Agricultural Economics: New Research; Tomas, H., Ed.; Lee: London, UK, 2010; pp. 1–254. [Google Scholar]
  20. Ekasingh, B.; Ngamsomsuke, K. Searching for simplified farmers’ crop choice models for integrated watershed management in Thailand: A data mining approach. Env. Model. Softw. 2009, 24, 1373–1380. [Google Scholar] [CrossRef]
  21. Kibriya, S.; Savio, G.; Price, E.; King, J. The role of conflict in farmers crop choices in North Kivu, Democratic Republic of the Congo. Int. Food Agribus. Manag. Rev. 2016, 19, 1–20. [Google Scholar]
  22. Greig, L. An analysis of the key factors influencing farmer’s choice of crop, Kibamba Ward, Tanzania. J. Agric. Econ. 2009, 60, 699–715. [Google Scholar] [CrossRef]
  23. Kenduiywo, B.K.; Bargiel, D.; Soergel, U. Crop-type mapping from a sequence of sentinel 1 images. Int. J. Remote Sens. 2018, 39, 6383–6404. [Google Scholar] [CrossRef]
  24. Zhong, L. Efficient Crop Type Mapping Based on Remote Sensing in the Central Valley, California. Ph.D. Thesis, UC Berkeley, Berkeley, CA, USA, 2012. [Google Scholar]
  25. Singha, M.; Wu, B.; Zhang, M. Object-based paddy rice mapping using HJ-1A/B data and temporal features extracted from time series MODIS NDVI data. Sensors 2017, 17, 10. [Google Scholar] [CrossRef] [PubMed]
  26. Song, Q.; Hu, Q.; Zhou, Q.; Hovis, C.; Xiang, M.; Tang, H.; Wu, W. In-season crop mapping with GF-1/WFV data by combining object-based image analysis and random forest. Remote Sens. 2017, 9, 1184. [Google Scholar] [CrossRef]
  27. Pittman, K.; Hansen, M.C.; Becker-Reshef, I.; Potapov, P.V.; Justice, C.O. Estimating global cropland extent with multi-year MODIS data. Remote Sens. 2010, 2, 1844–1863. [Google Scholar] [CrossRef]
  28. Biradar, C.M.; Thenkabail, P.S.; Turral, H.; Noojipady, P.; Jie, L.Y.; Velpuri, M.; Dheeravath, V.; Vithanage, J.; Schull, M.; Cai, X.L.; et al. A global map of rainfed cropland areas at the end of last millennium using remote sensing and geospatial techniques. In Geoinformatics 2006: GNSS and Integrated Geospatial Applications; International Society for Optics and Photonics: San Francisco, CA, USA, 2006. [Google Scholar]
  29. Waldhoff, G.; Lussem, U.; Bareth, G. Multi-data approach for remote sensing-based regional crop rotation mapping: A case study for the rur catchment, Germany. Int. J. Appl. Earth Obs. Geoinf. 2017, 61, 55–69. [Google Scholar] [CrossRef]
  30. Heupel, K.; Spengler, D.; Itzerott, S. A progressive crop-type classification using multitemporal remote sensing data and phenological information. PFG 2018, 86, 53–69. [Google Scholar] [CrossRef]
  31. Hao, P.; Tang, H.; Chen, Z.; Liu, Z. Early-season crop mapping using improved artificial immune network (IAIN) and sentinel data. PeerJ 2018, 6. [Google Scholar] [CrossRef] [PubMed]
  32. Khan, M.R.; de Bie, C.A.J.M.; van Keulen, H.; Smaling, E.M.A.; Real, R. Disaggregating and mapping crop statistics using hypertemporal remote sensing. Int. J. Appl. Earth Obs. Geoinf. 2010, 12, 36–46. [Google Scholar] [CrossRef]
  33. European Commission. Agricultural Monitoring. Available online: https://ec.europa.eu/jrc/en/research-topic/agricultural-monitoring (accessed on 4 March 2019).
  34. FAO. AQUASTAT—FAO’s Information System on Water and Agriculture. Available online: http://www.fao.org/nr/water/aquastat/countries_regions/LBN/ (accessed on 14 July 2018).
  35. Sanlaville, P. Les régions agricoles du Liban. Géocarrefour 1963, 38, 47–90. [Google Scholar] [CrossRef] [Green Version]
  36. Touma, T.H. Le paysan et la terre au Liban aux XVIII e et XIX e siècles. Civilisations 1966, 16, 233–241. [Google Scholar]
  37. Lateef, A.S. Geological history of the Bekaa Valley—Lebanon. In Second International Conference on the Geology of the Tethys; Cairo University: Cairo, Egypt, 2007; pp. 391–402. [Google Scholar]
  38. Lebanese Agriculture Research Institute. Climate Data, Unpublished work.
  39. Akbari, M.; Mamanpoush, A.; Gieske, A.; Miranzadeh, M.; Torabi, M.; Salemi, H.R. Crop and land cover classification in Iran using landsat 7 imagery. Int. J. Remote Sens. 2006, 27, 4117–4135. [Google Scholar] [CrossRef]
  40. Awad, M.; Darwish, T. Possible field crops mapping and assessment in Lebanon using SENTINEL-2 images and GIS; ESA-ESRIN: Frascati, Italy, 2014; pp. 1–4. [Google Scholar]
  41. Zafar, S.; Waqar, M.M. Crop type mapping by integrating satellite data and crop calendar over Okara district, Punjab—Pakistan. J. Space Technol. 2014, 4, 21–25. [Google Scholar]
  42. Asgarian, A.; Soffianian, A.; Pourmanafi, S. Crop type mapping in a highly fragmented and heterogeneous agricultural landscape: A case of central Iran using multi-temporal landsat 8 imagery. Comput. Electron. Agric. 2016, 127, 531–540. [Google Scholar] [CrossRef]
  43. Morawitz, D.F.; Blewett, T.M.; Cohen, A.; Alberti, M. Using NDVI to assess vegetative land cover change in central Puget sound. Env. Monit. Assess. 2006, 114, 85–106. [Google Scholar] [CrossRef] [PubMed]
  44. ESA. Sen2Cor. Available online: http://step.esa.int/main/third-party-plugins-2/sen2cor/ (accessed on 8 May 2018).
  45. Turker, M.; Kok, E.H. Field-based sub-boundary extraction from remote sensing imagery using perceptual grouping. Isprs J. Photogramm. Remote Sens. 2013, 79, 106–121. [Google Scholar] [CrossRef]
  46. Campbell, J.B.; Wynne, R.H. Introduction to Remote Sensing, 5th ed.; Guilford Press: New York, NY, USA, 2011; pp. 1–667. [Google Scholar]
  47. Abade, N.A.; de Júnior, O.A.C.; Guimarães, R.F.; de Oliveira, S.N. Comparative analysis of MODIS time-series classification using support vector machines and methods based upon distance and similarity measures in the Brazilian Cerrado-Caatinga boundary. Remote Sens. 2015, 7, 12160–12191. [Google Scholar] [CrossRef]
  48. Congalton, R.G. A review of assessing the accuracy of classifications of remotely sensed data. Remote Sens. Env. 1991, 37, 35–46. [Google Scholar] [CrossRef]
  49. Ministry of Finance. Wheat and Bread Subsidies; UNDP: Beirut, Lebanon, 2012; pp. 1–24.
  50. Bennafla, K. Le développement au péril de la géopolitique: L’exemple de la plaine de la Békaa (Liban). Géocarrefour 2006, 81. [Google Scholar] [CrossRef]
  51. Purseigle, F.; Hervieu, B. Pour une sociologie des mondes agricoles dans la globalization. For a sociology of agricultural worlds during globalization. Etudes Rural. 2009, 183, 177–200. [Google Scholar]
Figure 1. Annual precipitations of the study area, the Bekaa Valley [38].
Agriculture 09 00057 g001
Figure 2. Normalized difference vegetation index (NDVI) profile evolution of bare soil, built-up, and agricultural areas in the Bekaa Valley, in 2017.
Agriculture 09 00057 g002
Figure 3. Extract of the NDVI value evolution above 0.4 in the Bekaa Valley in 2017 (sample). a: March; b: April; c: May; d: June; e: July; f: August; g: September; h: October; i: November.
Agriculture 09 00057 g003
Figure 4. Use of road map to stake out unseparated fields.
Agriculture 09 00057 g004
Figure 5. Positive correlation between extracted and digitalized field boundaries.
Agriculture 09 00057 g005
Figure 6. Evolution of the NDVI profile of (a) wheat, (b) early potato, (c) alfalfa, (d) orchard, and (e) vineyard in the Bekaa Valley, in 2017.
Agriculture 09 00057 g006
Figure 7. Crop calendars for the Bekaa Valley culture (spring and permanent crops in 2017).
Agriculture 09 00057 g007
Figure 8. Crop map of the Bekaa Valley in spring 2017.
Agriculture 09 00057 g008
Figure 9. Increasing harvest areas in Lebanon: 1960–2016 [34].
Agriculture 09 00057 g009
Figure 10. Decreasing sugar beet harvest areas in Lebanon since 1960 [34].
Agriculture 09 00057 g010
Table 1. Subdivision of the known fields per crop type for classification.
Crop Type:AlfalfaOrchardEarly PotatoVineyardWheatTotal
Known fields101346318161386
Group a56732981194
Group b56731980192
Table 2. Crop-type surfaces in the Bekaa Valley in 2017.
Crop-Map ResultsSocioeconomic-Survey Results
CropsSurface (km2)Surface (ha)Surface of the Plain (%)% of Farmers Cultivating the Related CropCultivated Area (ha)
Wheat and barley115.29411,527.432.587106
Early potatoes90.29026.325.55668
Spring vegetables838306.523.48030
Orchards39.73972.411.2464.5
Vineyards25.82581.87.31075
Alfalfa0.225.80.11221
Total354.135,400100--
Average----50.75
Table 3. Confusion matrix of the crop classification (spring 2017).
AlfalfaEarly PotatoVineyardWheatOrchardBare SoilUrbanTotal
Alfalfa50000005
Early potato0300100031
Vineyard01701009
Wheat0806921080
Orchard1224580067
Bare soil00000303
Urban00000088
Total6419746148203
Table 4. Validity of the crop classification (spring 2017)
CropsAccuracy %Recall %Precision %
Alfalfa100.00100.0083.33
Early potato96.6796.7773.17
Vineyard71.4377.7877.78
Wheat84.0686.2593.24
Orchard84.4886.5795.08
Bare soil100.00100.0075.00
Urban100.00100.00100.00

