Article

The Effects of Agricultural Price Instability on Vertical Price Transmission: A Study of the Wheat Chain in Italy

Department of Environmental Science and Policy, University of Milan, 20133 Milano, Italy
*
Author to whom correspondence should be addressed.
Agriculture 2019, 9(2), 36; https://doi.org/10.3390/agriculture9020036
Submission received: 30 December 2018 / Revised: 5 February 2019 / Accepted: 7 February 2019 / Published: 15 February 2019

Abstract

:
In this paper we analyse vertical price transmission in two typical Italian wheat chains, the pasta and bread chains, that were particularly affected by strong market fluctuations during the last years. After having split the chains into two sides, upstream (farm–wholesale) and downstream (wholesale–retail), we apply a cointegration methodology allowing for the presence of potentially unknown structural breaks. Then, for the different subperiods detected by the break dates, we investigate the evolving price transmission elasticities finding evidence of asymmetric price transmission. In the pasta chain, farmers seem to be price-takers, while in the bread chain price transmission is related to market structure and to the coexistence of small and large retailers.

1. Introduction

Over the last few years agricultural commodity prices have undergone strong fluctuations as a consequence of economic, political and financial issues that have reshaped the global economic equilibrium. In particular, soft and hard wheat prices more than doubled from 2005 to mid-2008 and subsequently declined with remarkable speed both in the international and in the Italian market. In mid-2010 there was a new rise in prices and again a market fall. This strong instability was spread along the food supply chain producing unsatisfactory patterns of marketing margins and altering price transmission mechanisms [1,2]. Indeed, price shocks and volatility may have strong repercussions on the welfare of the different actors of food chains and, thus, it is important to study price transmission mechanisms to provide indications for policy makers [3,4,5].
It is commonly felt that retail prices do not react very quickly to changes in market conditions. For instance, Peltzman [6] argued that retail prices remain sticky even if prices fall due to increases in primary production. This generates an excess in supply, however consumers are not able to fully benefit from declining upstream prices, and this has implications on consumer welfare [7].
Research has given particular attention to the question of asymmetry of price adjustments [3,4,8,9,10,11], i.e., the different size and timing with which increases and decreases of prices are transmitted (upstream or downstream) along the food chains [12]. The main explanations for this asymmetry are related to market power, adjustment costs incurred by firms, search costs, policy interventions, and the common belief that a reduction in upstream prices will only be temporary because it will trigger government intervention, while an increase in upstream prices is more likely to be permanent [6,13,14,15,16,17]. More in detail, results from Bakucs et al. [3] indicate that market structure has a role on the asymmetry of price transmission and that particular conditions and regulations aimed at balancing market power along supply chains (particularly between farmers and retailers) help reduce asymmetry. The same authors also indicate that size, concentration, the level of price competition of the retail sector and the organizational structure of the upstream sector can also influence the level of asymmetry in vertical price transmission. Recent agricultural price instability may have also been caused by structural breaks and, thus, these may have increased the presence of such asymmetry. In this context, it is particularly important to take into account structural breaks when analysing long term food price relationships.
We intend to follow this idea by applying a refined cointegration methodology allowing for the presence of potentially unknown structural breaks. We applied this approach to price relationships in the chains of pasta and bread, two typical Italian products that were particularly affected by strong market fluctuations during the last years. Italy is an interesting ground to study as among OECD countries it is one of the only ones (together with Switzerland and Turkey) for which, according to a OECD survey, food price increases, food price volatility and price transmission along the chain are all key concerns in relation to food prices [18]. Moreover, Italy is the largest player in the market of pasta, both in terms of consumption and production, and thus it is particularly important to study the pasta chain in this country [19]. The bread chain is strongly related to the pasta one due to the shared raw materials, and thus it represents an interesting interconnected market.
Within this framework, the aim of this paper is to estimate the evolving dynamics of the price transmission elasticity during different subperiods defined by the structural break dates. Thus, we first split both supply chains into two phases: the upstream (farm–wholesale) and the downstream (wholesale–retail). Subsequently, after having investigated the order of integration of the variables, for each side of the chain we investigate the stability of the relationships by searching for the presence of multiple endogenous break dates, adopting the approach proposed by Kejriwal and Perron [20]. Given that the test can reject the null hypothesis of stability when the regressor is spurious (i.e., not cointegrated) it is necessary to verify that the variables are cointegrated. To test the cointegration relationship we use the Gregory and Hansen [21] tests (henceforth GH) and the Kejriwal [22] test. Then, following the approach of Boetel and Liu [23], we account for the break dates using dummy variables to estimate the long run price transmission parameters for the different regimes, adopting a dynamic least squares procedure developed by Phillips and Loretan [24]. This approach, which accounts for the dynamics of the data generating process, ensures an unbiased estimation of long-run parameters [25]. Finally, by using long run coefficient estimates we calculate the price transmission elasticities for both of the food chains considered, both in the in the upstream and downstream phases and in relation to the break dates.
The paper is organised as follows. Section 2 describes the theoretical framework in which the research is centred. Section 3 describes the Italian wheat value chain. Section 4 presents the econometric methodology, while Section 5 describes the dataset adopted for the purpose of the study and develops the empirical results. Conclusions and final remarks are reported in Section 6.

2. Background and Literature Review

The interest on the issues related to commodity price fluctuation has increased over the last years when an exceptional price rise has destabilised the world economic scenario and has lowered the level of world agricultural stocks to quantities unseen for 25 years. In particular, between 2007 and 2008 in co-occurrence with the worldwide financial crisis, food prices peaked at unprecedented levels generating strong pressures on global food markets. Among the main causes, some authors indicate the strong increase in the demand for food commodities from China and India and the uncontrolled increase in oil price, which has had repercussions throughout the economy and in particular on the fertiliser market and the transport one [26,27,28]. Others stress the role of financial speculation [28,29,30,31], which caused considerable price volatility and prevented the planning of supply in many countries while contributing to create a situation of marked instability. Moreover, the rush to biofuels still remains a commonly considered factor in relation to the increasing quantities of agricultural products that are being diverted away from their traditional food markets, even if also on this aspect the literature is not unanimous [17,28,29,32,33,34]. Moreover, other scholars highlight the role of internal factors in affecting the asymmetry of price transmission along food chains [27,28,29,35,36].
Within this framework, characterised by very complex processes and dynamics, the aim of this article is to investigate food price relationships. More specifically, the study contributes to the literature of food price relationships applying a price transmission analysis to the pasta and bread chains in Italy. In recent years, indeed, studies about price transmission have been commissioned by several European and Italian institutions to check the behaviour of food supply chain actors and to ensure a sustainable distribution of the value added along the whole chain, in order to control for welfare consequences [4]. Meyer and von Cramon-Taubadel [9], Bakucs et al. [3] and Kouyaté and von Cramon-Taubadel [37] provide an interesting literature review and meta-analysis on price transmission asymmetry applied to agricultural and food markets. Much of the research has investigated case studies in Hungary [38,39,40,41], Spain [42,43,44,45], Greece [46,47] and the USA [23,48,49,50]. Topic-wise, most of the international literature has focused on animal-based products (such as milk and different types of meat and eggs) [39,40,41,42,43,44,45,46,48,49,50,51,52,53], while fewer studies have focused on fruit and vegetable products or bread [38,47,54]. Brunner et al. [13] studied price transmission focusing on the wheat flour case. For what concerns Italy, only few studies have analysed the dynamic nature of price transmission in Italian food chains. For example, Santeramo and von Cramon-Taubadel [55] studied fruit and vegetables products suggesting that price transmission trends are (more) symmetric for products that are perishable. Other studies have focused on milk-related chains. Cavicchioli [12] and Madau et al. [56] studied the buyer power in the supply chain of fresh milk highlighting how market structure affects the upstream and downstream spread of prices. Antonioli et al. [57] analysed the differences along quality differentiated chains focusing on conventional and organic milk, finding that the latter chain is more responsive than the conventional one. Again, differences in the structure of the two markets are found to affect price transmission mechanism. Focusing on wheat-based products, a few studies have focused on price transmission in the pasta chain [19,58,59,60]. More in detail, Carraro and Stefani [58] studied three supply chains, including the pasta one, looking for structural breaks. Other studies focused on market power along the supply chain and anticompetitive behaviour [59,60]. Cacchiarelli et al. [19] analysed the effects of the Common Agricultural Policy reform on price transmission showing that decoupling support from production has generated a contraction in the Italian wheat supply and has contributed to a change in price transmission dynamics downstream. To our knowledge, there are no studies on the bread chain in Italy.
In this paper, we analyse the price transmission dynamics of the Italian pasta and bread wheat chains attempting to infer behavioural evidence from data that is adopting an econometric approach fit to look for structural breaks and asymmetries in the price transmission dynamics. In this regard, it must be specified that the econometric analysis of the price relationships may be approached following different conceptual frameworks [10,61]. One of the most widely used methods is based on the analysis of price transmission mechanisms within the context of market integration [62,63,64,65] and the law of one price [66,67]. Within this framework the analysis proposed in this article follows a nonstructural approach to price transmission, along with a combination of time series mechanisms, to investigate the changing relations and the asymmetry in the adjustment speed to the long run equilibrium.

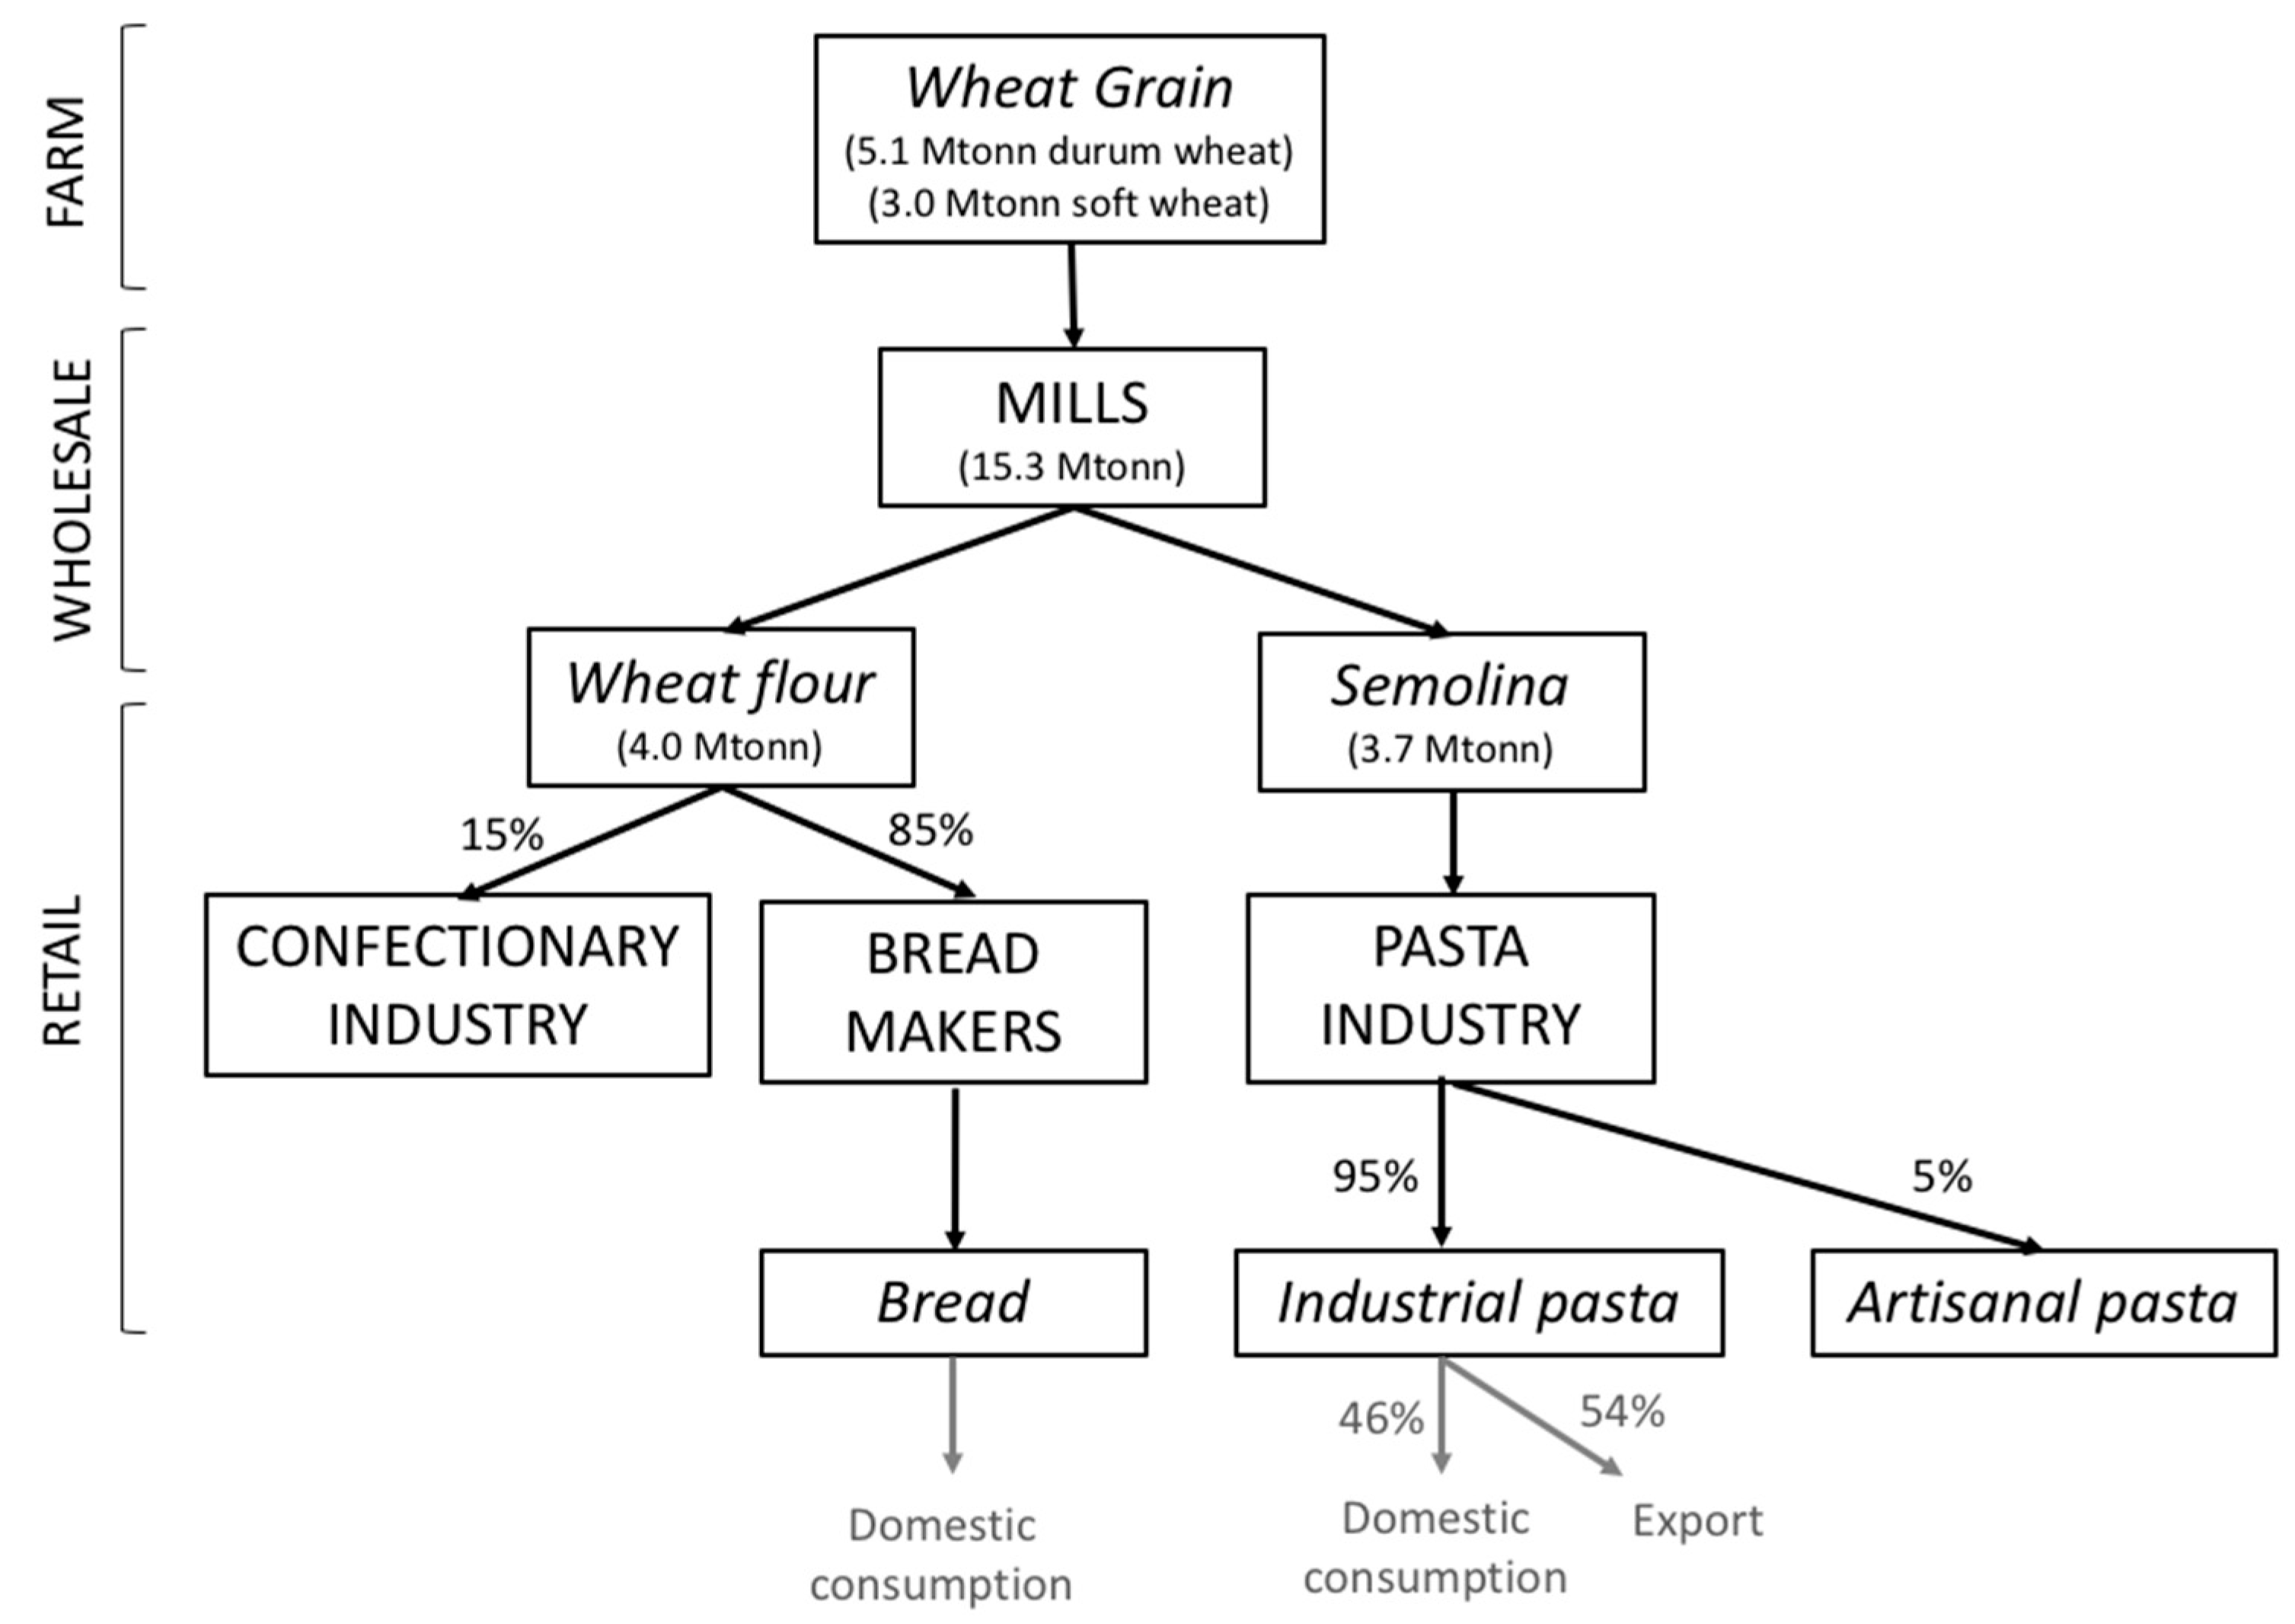
3. The Italian Wheat Value Chain

Cereal production in Italy is a very relevant agricultural activity. Indeed, data from Istituto di Servizi per il Mercato Agricolo Alimentare (ISMEA) [68] indicate that the value of production in 2016 was 4189 million euro, which represents ~15% of agricultural production. Among cereals, 82% of the value is provided by wheat, corn and barley. Moving to the transformation sectors, the turnover of cereal mills in 2016 was 3483 million euro, while that of the pasta industry 4748 million euro.
Figure 1 highlights the structure of the wheat value chain in Italy, highlighting the pasta and bread chains.
Focusing on durum wheat, in Italy there are more than 200 thousand farms covering ~1300 thousands of ha of land, ~125 mills with ~4600 employees yielding more than 3.7 million tonnes of durum wheat flour per year, and 120 pasta industry firms with ~7500 employees producing more 3.3 million tonnes of pasta per year. For soft wheat, the number of farms is around 128 thousand covering about 530 thousands of ha. The production of soft wheat flour is around 4.0 million tonnes with a turnover of the mill industry of more than 1750 million euro; while the production of baked products is of about 1.1 million tonnes for a total value of more than 5250 million euro [68].

4. Materials and Methods

This work analyses the long-run relationship and the price transmission elasticity between farm–wholesale and wholesale–retail prices of pasta and bread during a period when evident breaks occurred. Specifically, to address the research question, the approach starts by investigating the order of integration of the variables. Considering that testing for unit root of a series in the presence of structural breaks using a traditional augmented Dickey–Fuller technique [69] provides biased results [70], the order of integration of the variables is tested using also the alternative methodology of Zivot and Andrews [71]. The Zivot and Andrews test (henceforth ZA) [71] is a sequential test that allows the existence of one endogenous break, where the null hypothesis is that the series is integrated without exogenous structural break. Nevertheless, as outlined by Lee and Strazicich [72], the alternative hypothesis of the ZA test is not unique and would be also unit root with break. Therefore, we adopt the Lee and Strazicich’s LM test (henceforth LS) [72] that allows for the presence of two endogenous breaks both under the null (unit root with breaks) and the alternative hypotheses (stationarity around breaks).
Once the series are found to be of the same order of integration, we test for a cointegrating relationship allowing the presences of multiple structural breaks. The literature presents several different approaches for the analysis of structural breaks. These differ by the estimation and inference about break dates, the inclusion of tests for structural changes, tests for unit root in presence of structural changes in the trend function, as well as tests for cointegration allowing for structural changes (see Perron [73] for an exhaustive review). One of the most important issues concerns the possibility to manage multiple structural breaks when the series are related to each other. Bai and Perron [74] first dealt with these issues proposing a methodology limited to I(0) series. However, to fit within the purpose of this paper, focused on the analysis of the changing dynamics within the pasta and bread chains during the recent financial crisis, Kejriwal and Perron’s approach [20] was adopted to estimate, test and compute multiple endogenous breaks dates in the cointegrated regressor. From the econometric point of view, the Kejriwal and Perron model [20] is an extension of the Bai and Perron procedure [74] to a more general model allowing for the possibility of both I(0) and I(1) variables in the regression.
As in Bai and Perron’s [74,75], the Kejriwal and Perron procedure [20] detects multiple structural breaks at unknown dates, identifying each break point date precisely. The procedure starts with the use of a sup FT (k) type test based on the null hypothesis of no structural breaks (m = 0), against an alternative of m = k breaks. In the second step, the null hypothesis of no structural breaks is tested against the alternative of an unknown number of breaks given some upper bound M for the number of breaks in a double maximum test (UD max). Finally, based on a series of Wald-type tests, the sequential test sup FT (l + 1|l) compares the null hypothesis of l breaks vs. the alternative of (l + 1) breaks. Asymptotic critical values for these tests can be found in Kejriwal and Perron [20].
After having investigated the stability of the relationship using the test of Kejriwal and Perron [20], we need to confirm that the variables are actually cointegrated. Indeed, as outlined by Kejriwal [22], the break test can reject the null of stability when the regression is really a spurious one; therefore, we have to verify that the cointegration relationship holds. This can be done adopting Gregory and Hansen’s approach [21] that extends the two-step procedure of Engle and Granger [76]. This technique allows for the detection of a cointegrating relationship, with a null hypothesis of no-cointegration against an alternative hypothesis of cointegration with one structural break at an unknown date. Nevertheless, this test loses power when in the cointegration relationship there is more than one break. To avoid this problem, we also adopt the Kejriwal test [22] that is a modified version of the Arai and Kurozumi test [77]. This is a residual based test of the null hypothesis of cointegration with multiple structural breaks.
Then, for both commodities considered and for each of the subperiods detected by the breaks in the farm–wholesale and in the wholesale–retail price relationships of the two chains we then investigated the long run relationships adopting the dynamic least square procedure developed by Phillips and Loretan [24]. This procedure, including leading and lagged estimators, accounts for the dynamics of the data generating process and, therefore, it may overcome the biased estimation related to the contemporaneous correlated parameters of the price transmission parameters [25]. In particular, we mainly focused the attention on the possible biased estimate of price transmission elasticity α1 in the equation yt = α + α1xt + εt, that is the same used for the structural break identification. To account for the different regimes identified by the break dates we reshape the Phillips and Loretan dynamic least square procedure [24] including several structural dummy variables to allow for intercept and slope shifts. The equation is given by
y t = α + α D u + α 1 x t + α 1 x t D u + j = m k ϕ j Δ x t j + i = 1 n δ i ( y t 1 α 0 α 1 x t i ) + ν t
with m being the number of leading terms, k the number of lagged terms of first differences of the regressors x, and n the number of lagged terms of the errors ν t which, in the empirical application, are derived from a pre-estimation of the static equation yt = α + αDu + α1xt Du + α1xt + εt. The dummy variables Du takes value 1 or 0 to, respectively, switch-on or switch-off the relative coefficients in the different regimes. Finally, once we have obtained efficient estimates of the parameters, we compute the price transmission elasticities by adding to the slope coefficient of the base regime the estimated parameter of the other regimes.

5. Empirical Results

The research question is investigated by employing monthly data from January 1999 through May 2011. This timeframe is particularly interesting as it includes at least one important shock related to the global economic crisis of 2008. This enables us to study the period before and during a crisis that is particularly important to study to evaluate if there are peculiarities to be identified. Farm prices (durum and soft wheat) and wholesale prices (wheat flour and semolina) are obtained from the the Istituto di Servizi per il Mercato Agricolo Alimentare (ISMEA) database, while retail prices (pasta and bread) from the Italian National Institute of Statistics.
The approach starts investigating the order of integration of the variables using the ADF test and the Zivot and Andrews test [71]. While the first test highlights the presences of unit root in all the series considered, the ZA shows a different behaviour. Specifically, except for semolina with trend and intercept, the farm and wholesale prices are unit root without breaks. For pasta and bread consumer prices the test leads to the rejection of the null hypothesis both in the case of trend and in the case of trend and drift. When a trend is assumed, all the variables turn out to be unit root. More convincing are the results of the Lee and Strazicich test [72] that for all the series considered detects the presence of unit root with two breaks. Table 1 shows the results of the tests.
Provided that the series are integrated of order one, we then analysed the cointegration between them. To investigate the presence of multiple breaks and estimate the data of the breaks in a cointegrating framework we adopted the Kejriwal and Perron procedure [20] after having adjusted the series for lag response by the use of the Akaike information criterion and by accounting for the structure of the markets. For farm–wholesale and wholesale–retail price relationships both for the pasta and bread chain the sup FT(k) tests significantly supports the rejection of the null hypothesis of no structural breaks for k = 1 to k = 3 and provides evidence of the existence of at least one break in all of the price relationships. This is also supported by the highly significant results of the UD max tests, which confirm the existence of at least one break in all the price pairs. Moreover, the use of a sequential procedure test [sup FT (l + 1|l)] also suggests the existence of structural breaks. See Table 2 for details.
To confirm the stability of the cointegration relationship we then conducted other cointegration tests.
Remembering that standard cointegration tests in series with a structural break are biased if the break is not considered, the paper follows the approaches of Gregory and Hansen [21] and Kejriwal [22]. In particular, Gregory and Hansen [21] provide three tests for unit root with new critical value: an augmented Dickey–Fuller test (ADF*) test and Za and Zt Phillips tests [78]. In all three cases, the null hypothesis of no cointegration (against the presence of cointegration with a break) is tested for three alternative models—level shift (C), linear trend (C/T) and regime shift (C/S)—which allow both the intercept and the slope to shift. The ADF* statistics show different results highlighting the existence of cointegration relationships except for the bread–wheat flour price couple. For all the price series analysed the Kejriwal statistic (V3(λ)) [22] shows that the null hypothesis cannot be rejected, thus confirming that the cointegration relationship holds with multiple breaks. See Table 3 for details.
The breaks identified by the Kejriwal and Perron [20] procedure delimit different subperiods that we analyse with the inclusion of dummy variables in the Phillips and Loretan [24] lead and lag approach. Table 4 and Table 5 show the results of the dynamic least square estimation for the pasta and bread chains, respectively.
The estimated coefficients have then been used to calculate the price elasticities (reported in Figure 2) to investigate price transmission mechanisms in the different regimes. In the following paragraphs, we briefly discuss the main results (see Figure 2 for more details).

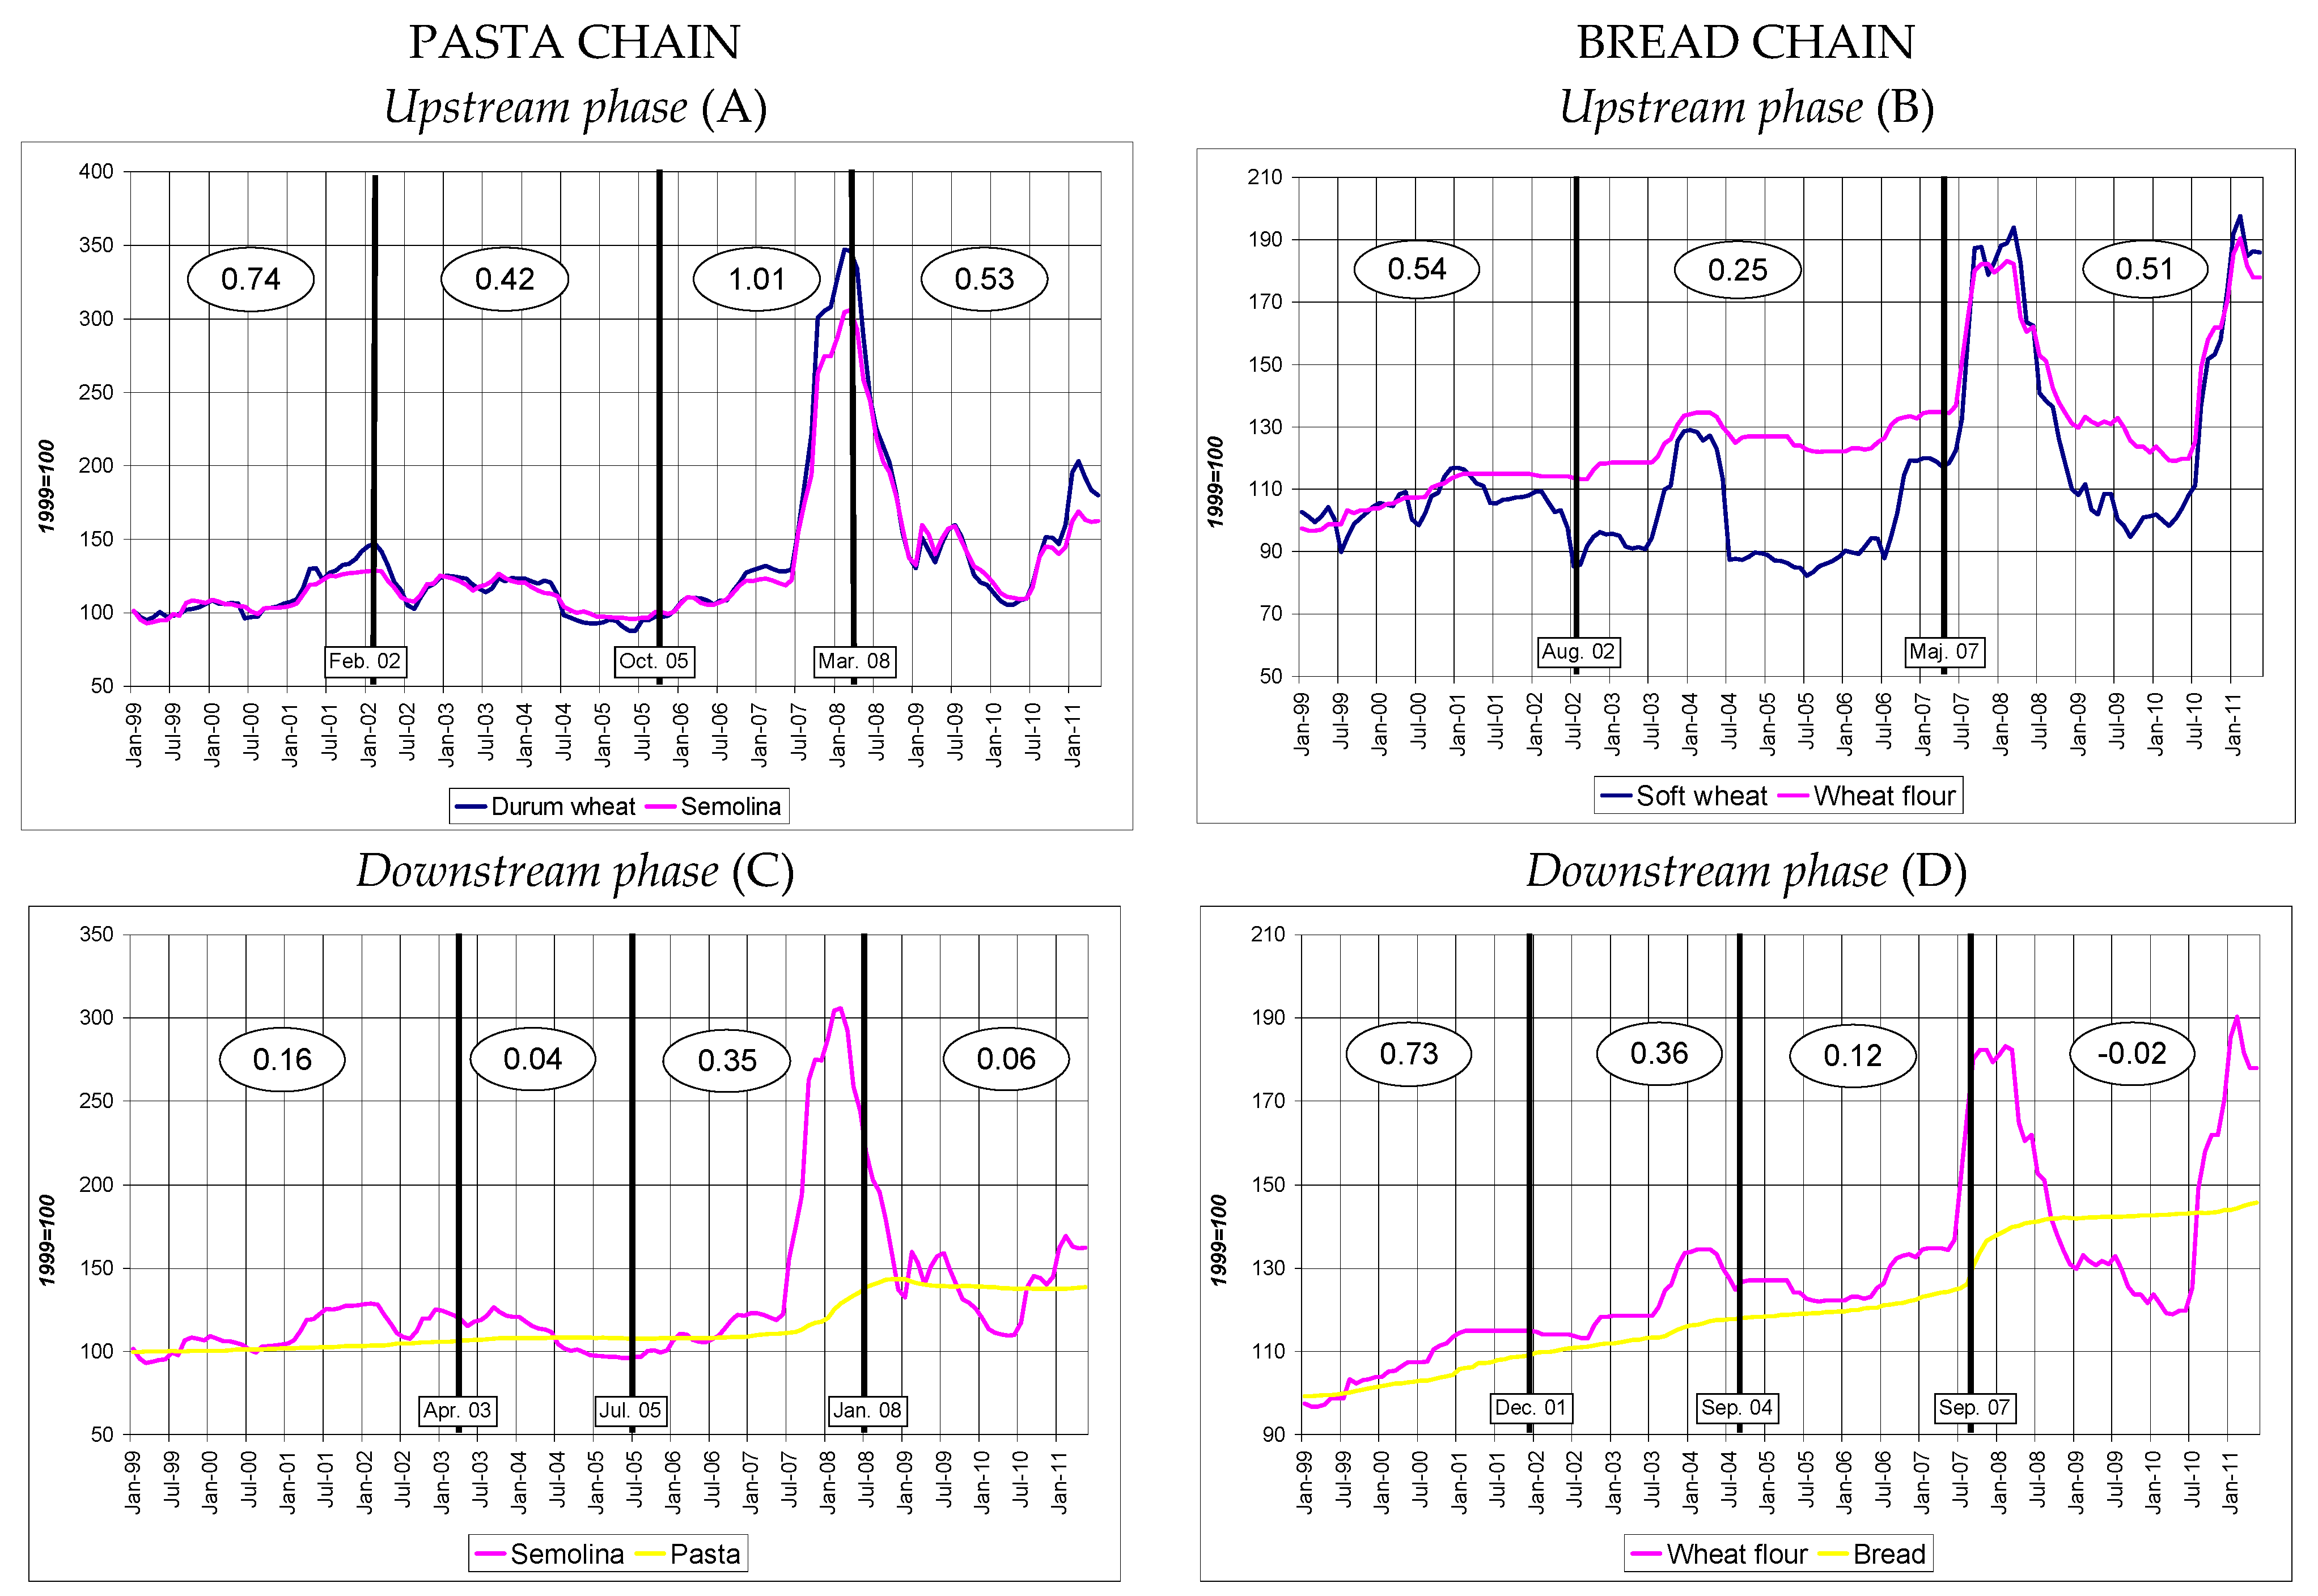
5.1. Price Transmission in the Pasta Chain

The Kejriwal and Perron procedure [20] identifies for both the upstream and downstream side of the chain three breaks and four regimes. In the upstream phase (farm–wholesale) the price transmission elasticity appears generally high especially when the durum wheat prices grew (first and third regimes). In the period between Oct. 2005 and Mar. 2008 (third regime), when prices recorded a very strong rise, the influence of durum wheat price on the semolina price reaches values of 1.01. To the contrary, during phases with decreasing prices—that is in the second and fourth periods—transmission price elasticities are lower. More specifically, when durum wheat price decreased by 1% the semolina prices decreased by 0.42% and 0.53%, respectively. This finding suggests the presence of asymmetry in the transmission of price changes.
Along the downstream chain (wholesale–retail) we generally find a much lower price transmission, with the elasticities spanning from 0.04 to 0.35. This different pattern could be explained by the presence of the distribution sector that acts as a price shock absorber during high volatility periods. Nevertheless, also in these phases, it is possible to identify an asymmetry in the relationships between prices especially in the last two regimes. Indeed, in the third period when semolina prices started to rise suddenly up to very high levels, the pasta price response was quite clear (0.35), viceversa during the fourth period when semolina prices started to fall, the pasta elasticity coefficient appears to be much smaller (0.06). Summarising, in the pasta chain farm agent appear to be price takers while wholesale actors appear to manage with profit the falling price phases; moreover, retail prices remain sticky as in Peltzman [6].

5.2. Price Transmission in the Bread Chain

Compared to the pasta chain, the bread chain appears to be more complex to describe. In the upstream side of chain, the estimated breaks of the Kejriwal and Perron procedure [20] delimit three periods. However, the length of the confidence interval associated with the second break is too wide to consider the corresponding estimate sufficiently reliable (Table 2). Moreover, the coefficient of the Phillips and Loretan lead and lag approach [24] for the third period is not significant (Table 4), which casts some doubts on the validity of the estimated elasticity for this period. Nevertheless, we can underline that during the first and third periods, when the farm price levels were higher on average, the price transmission elasticity from soft wheat to wheat flour appears double than in the second regime.
Worthy of note is the price transmission dynamic from wheat flour to bread. During the period considered, such relationships have progressively weakened. Indeed, in the last ten years consumer prices have gradually dropped compared to wholesale prices. Until the end of 2001 the price transmission elasticity was very high (0.73), then it begun to decrease and finally, after the autumn of 2007, when the commodity price volatility rose, the transmission elasticity became equal to −0.02. This result is quite surprising, but we must consider the structure of Italian bread market where wholesalers are structured firms, while bread retailers are generally small firms. In this context, retailers cannot lose market quotas by rising bread price. However, a more careful analysis of short-term asymmetry could be suitable to better investigate this part of the chain, where different forces act.

6. Conclusions

The aim of this paper was to analyse vertical price transmission dynamics in two wheat-related food chains in Italy: the pasta and bread chains. Such food supply chains are particularly important in the Italian food system and have suffered strong market fluctuations in the last decade, especially since the end of 2007. The scope of the research is ‘glocal’ by nature as it focuses on a local market (the Italian one) that is relevant and strongly linked to the global market. Indeed, during the global economic crisis food commodity prices peaked to unprecedented levels with strong consequences on global food chains, markets and stocks. Thus, it is particularly important to investigate how value is shared along food chains and how price shocks are transmitted. Studying price transmission mechanisms along food chains and how these change with changing conditions is particularly important to understand the market and to evaluate possible effects of its dynamics to better manage future crises. Indeed, the current world context is experiencing strong political transformations (e.g., the evolution in the commercial relations between Europe, China, Canada and the USA) which may affect well-established macroeconomic dynamics and have strong consequences on market equilibria.
This paper has studied the dynamic nature of price transmission by means of a time series analysis of the prices of a set of commodities important for the pasta and bread food chains. The methods adopted allow for the presence of unknown structural breaks and thus to investigate how price elasticities change in the different periods related to the shocks. Results indicate that the pasta chain in Italy is characterised by asymmetry in price transmission. As discussed in Section 1 and Section 2, this may have several causes, but it is often considered as an indication of power imbalances along the chain [3,6,12,79]. Our analyses highlight how the retail sector seems to act as a price shock absorber, but how there is an asymmetry in the transmission of price rises and falls. Indeed, as we move downstream along the value chain the share of raw material process on the final production price becomes less relevant, due to other cost factors, such as for example marketing costs. More in detail, in the pasta chain farmers seem to be very vulnerable to price shocks as they tend to be price takers, while wholesale actors are more able to react to price changes. This is particularly important, given that in the EU public support to agriculture is progressively being decreased. Indeed, the common agricultural policy is gradually reducing payments to farmers that, from our analysis, are the most vulnerable actor of the chain. Instead, globalisation tends to strengthen the already dominant position of retailers. Thus, knowing price transmission dynamics along food chains represents a policy tool to evaluate the effects of policies and to study the dynamics of value distribution among the different actors of food chains. The bread chain in Italy seems to follow more complex dynamics of vertical price transmission and to be strongly dependent on the market structure and, in particular, on the relationship between large and small retailers.
Future work should analyse more in depth also the short-term dynamics of price transmission asymmetry and include other variables in the analysis to widen the scope of the research and, possibly, take into consideration the effects of system changes due to the consideration of sustainability goals.

Author Contributions

The paper is the result of the collaboration among all authors; however, E.C.R. contributed mainly to the sections “Introduction”, “Background and literature review”, “the Italian wheat value chain” and “Conclusions”; while M.P. to the “Empirical results” section and L.B. mainly to the “Materials and Methods” section.

Funding

This research received no external funding.

Conflicts of Interest

The authors declare no conflict of interest.

References

  1. Castellini, C.; Boggia, A.; Cortina, C.; Dal Bosco, A.; Paolotti, L.; Novelli, E.; Mugnai, C. A multicriteria approach for measuring the sustainability of different poultry production systems. J. Clean. Prod. 2012, 37, 192–201. [Google Scholar] [CrossRef]
  2. Ciliberti, S.; Frascarelli, A. L’obbligo dei contratti di cessione dei prodotti agricoli e alimentari: Una valutazione degli effetti dell’articolo 62 della legge n. 27/2012. Econ. Agro-Aliment. 2014. (In Italic) [Google Scholar] [CrossRef]
  3. Bakucs, Z.; Falkowski, J.; Fertö, I. Does market structure influence price transmission in the agro-food sector? A meta-analysis perspective. J. Agric. Econ. 2014, 65, 1–25. [Google Scholar] [CrossRef]
  4. Lloyd, T. Forty years of price transmission research in the food industry: Insights, challenges and prospects. J. Agric. Econ. 2017, 68, 3–21. [Google Scholar] [CrossRef]
  5. Kinnucan, H.W.; Tadjion, O. Theoretical restrictions on farm-retail price transmission elasticities: A note. Agribusiness 2014, 30, 278–289. [Google Scholar] [CrossRef]
  6. Peltzman, S. Prices rise faster than they fall. J. Polit. Econ. 2000, 108, 466–502. [Google Scholar] [CrossRef]
  7. Sexton, R.J.; Lavoie, N. Food processing and distribution: An industrial organization approach. Handb. Agric. Econ. 2001, 1, 863–932. [Google Scholar]
  8. Ball, L.; Mankiw, N.G. Asymmetric price adjustment and economic fluctuations. Econ. J. 1994, 104, 247–261. [Google Scholar] [CrossRef]
  9. Meyer, J.; Von Cramon-Taubadel, S. Asymmetric price transmission: A survey. J. Agric. Econ. 2004, 55, 581–611. [Google Scholar] [CrossRef]
  10. Frey, G.; Manera, M. Econometric Models of Asymmetric Price Transmission. J. Econ. Surv. 2007, 21, 349–415. [Google Scholar] [CrossRef]
  11. Peri, M.; Baldi, L. Nonlinear price dynamics between CO2 futures and Brent. Appl. Econ. Lett. 2011, 18, 1207–1211. [Google Scholar] [CrossRef]
  12. Cavicchioli, D. Detecting Market Power Along Food Supply Chains: Evidence and Methodological Insights from the Fluid Milk Sector in Italy. Agriculture 2018, 8, 191. [Google Scholar] [CrossRef]
  13. Brümmer, B.; Von Cramon-Taubadel, S.; Zorya, S. The impact of market and policy instability on price transmission between wheat and flour in Ukraine. Eur. Rev. Agric. Econ. 2009, 36, 203–230. [Google Scholar] [CrossRef]
  14. Levy, D.; Bergen, M.; Dutta, S.; Venable, R. The magnitude of menu costs: Direct evidence from large US supermarket chains. Q. J. Econ. 1997, 112, 791–824. [Google Scholar] [CrossRef]
  15. Richards, T.J.; Gómez, M.I.; Lee, J. Pass-through and consumer search: An empirical analysis. Am. J. Agric. Econ. 2014, 96, 1049–1069. [Google Scholar] [CrossRef]
  16. Kinnucan, H.W.; Forker, O.D. Asymmetry in farm-retail price transmission for major dairy products. Am. J. Agric. Econ. 1987, 69, 285–292. [Google Scholar] [CrossRef]
  17. Oladosu, G.; Msangi, S. Biofuel-Food Market Interactions: A Review of Modeling Approaches and Findings. Agriculture 2013, 3, 53–71. [Google Scholar] [CrossRef] [Green Version]
  18. OECD Food Price Formation, OECD Trade and Agriculture Directorate 2015. Available online: http://www.oecd.org/site/agrfcn/meetings/agrfcn-7-food-price-formation-paper-october-2015.pdf (accessed on 1 December 2018).
  19. Cacchiarelli, L.; Lass, D.; Sorrentino, A. CAP reform and price transmission in the Italian pasta chain. Agribusiness 2016, 32, 482–497. [Google Scholar] [CrossRef]
  20. Kejriwal, M.; Perron, P. Testing for multiple structural changes in cointegrated regression models. J. Bus. Econ. Stat. 2010, 28, 503–522. [Google Scholar] [CrossRef]
  21. Gregory, A.W.; Hansen, B.E. Residual-based tests for cointegration in models with regime shifts. J. Econ. 1996, 70, 99–126. [Google Scholar] [CrossRef]
  22. Kejriwal, M. Cointegration with structural breaks: An application to the Feldstein-Horioka puzzle. Stud. Nonlinear Dyn. Econ. 2008, 12. [Google Scholar] [CrossRef]
  23. Boetel, B.L.; Liu, D.J. Estimating structural changes in the vertical price relationships in US beef and pork markets. J. Agric. Resour. Econ. 2010, 35, 228–244. [Google Scholar]
  24. Phillips, P.C.; Loretan, M. Estimating long-run economic equilibria. Rev. Econ. Stud. 1991, 58, 407–436. [Google Scholar] [CrossRef]
  25. Banerjee, A.; Dolado, J.J.; Galbraith, J.W.; Hendry, D. Co-integration, error correction, and the econometric analysis of non-stationary data. OUP Cat. 1993. [Google Scholar]
  26. Krugman, P. The finite world. The New York Times, 26 December 2010. [Google Scholar]
  27. Headey, D. Rethinking the global food crisis: The role of trade shocks. Food Policy 2011, 36, 136–146. [Google Scholar] [CrossRef] [Green Version]
  28. Tadasse, G.; Algieri, B.; Kalkuhl, M.; Von Braun, J. Drivers and Triggers of International Food Price Spikes and Volatility. In Food Price Volatility and Its Implications for Food Security and Policy; Kalkuhl, M., Von Braun, J., Torero, M., Eds.; Springer International Publishing: Cham, Switzerland, 2016; pp. 59–82. ISBN 978-3-319-28201-5. [Google Scholar] [Green Version]
  29. Ghosh, J. The Unnatural Coupling: Food and Global Finance. J. Agrar. Ch. 2010, 10, 72–86. [Google Scholar] [CrossRef]
  30. Yang, J.; Qiu, H.; Huang, J.; Rozelle, S. Fighting global food price rises in the developing world: The response of China and its effect on domestic and world markets. Agric. Econ. 2008, 39, 453–464. [Google Scholar] [CrossRef]
  31. Baldi, L.; Peri, M.; Vandone, D. Stock markets’ bubbles burst and volatility spillovers in agricultural commodity markets. Res. Int. Bus. Financ. 2016, 38, 277–285. [Google Scholar] [CrossRef] [Green Version]
  32. Chakravorty, U.; Hubert, M.-H.; Moreaux, M.; Nøstbakken, L. Will Biofuel Mandates Raise Food Prices? University of Alberta, Department of Economics: Edmonton, AB, Canada, 2011. [Google Scholar]
  33. Thompson, P.B. The Agricultural Ethics of Biofuels: The Food vs. Fuel Debate. Agriculture 2012, 2, 339–358. [Google Scholar] [CrossRef]
  34. Hochman, G.; Kaplan, S.; Rajagopal, D.; Zilberman, D. Biofuel and Food-Commodity Prices. Agriculture 2012, 2, 272–281. [Google Scholar] [CrossRef] [Green Version]
  35. Martin, W.; Anderson, K. Export Restrictions and Price Insulation During Commodity Price Booms. Am. J. Agric. Econ. 2012, 94, 422–427. [Google Scholar] [CrossRef]
  36. Wright, B.D. The Economics of Grain Price Volatility. Appl. Econ. Perspect. Policy 2011, 33, 32–58. [Google Scholar] [CrossRef]
  37. Kouyaté, C.; Von Cramon-Taubadel, S. Distance and border effects on price transmission: A meta-analysis. J. Agric. Econ. 2016, 67, 255–271. [Google Scholar] [CrossRef]
  38. Bakucs, L.Z.; Fertö, I.; Szabó, G.G. Price transmission in the Hungarian vegetable sector. Stud. Agric. Econ. 2007, 106, 23–40. [Google Scholar]
  39. Bakucs, L.Z.; Fertö, I. Marketing and pricing dynamics in the presence of structural breaks: The Hungarian pork market. J. Int. Food Agric. Bus. Mark. 2009, 21, 116–133. [Google Scholar] [CrossRef]
  40. Bakucs, L.Z.; Fertö, I. Marketing margins and price transmission on the Hungarian beef market. Acta Agric. Scand. Sect. C 2006, 3, 151–160. [Google Scholar]
  41. Bakucs, L.Z.; Fertö, I. Marketing margins and price transmission on the Hungarian pork meat market. Agribusiness 2005, 21, 273–286. [Google Scholar] [CrossRef]
  42. Guillen, J.; Franquesa, R. Testing for market power in the Spanish meat market: Price transmission elasticity and asymmetry using econometric models. Int. J. Comput. Econ. Econ. 2010, 1, 294–308. [Google Scholar] [CrossRef]
  43. Serra, T.; Goodwin, B.K. Price transmission and asymmetric adjustment in the Spanish dairy sector. Appl. Econ. 2003, 35, 1889–1899. [Google Scholar] [CrossRef]
  44. Ben-Kaabia, M.; Gil, J.M. Asymmetric price transmission in the Spanish lamb sector. Eur. Rev. Agric. Econ. 2007, 34, 53–80. [Google Scholar] [CrossRef] [Green Version]
  45. Ben-Kaabia, M.; Gil, J.M.; Ameur, M. Vertical integration and non-linear price adjustments: The Spanish poultry sector. Agribusiness 2005, 21, 253–271. [Google Scholar] [CrossRef] [Green Version]
  46. Rezitis, A.N.; Reziti, I. Threshold cointegration in the Greek milk market. J. Int. Food Agribus. Mark. 2011, 23, 231–246. [Google Scholar] [CrossRef]
  47. Reziti, I.; Panagopoulos, Y. Asymmetric price transmission in the greek agri-food sector: Some tests. Agribus. Int. J. 2008, 24, 16–30. [Google Scholar] [CrossRef]
  48. Vavra, P.; Goodwin, B.K. Analysis of Price Transmission Along the Food Chain; OECD Publishing: Paris, Franace, 2005. [Google Scholar] [CrossRef]
  49. Bolotova, Y.V.; Novakovic, A.M. The impact of the New York state milk price gouging law on the price transmission process and supermarket pricing strategies in the fluid whole milk market. Agribusiness 2012, 28, 377–399. [Google Scholar] [CrossRef]
  50. Awokuse, T.O.; Wang, X. Threshold effects and asymmetric price adjustments in US dairy markets. Can. J. Agric. Econ. 2009, 57, 269–286. [Google Scholar] [CrossRef]
  51. Karantininis, K.; Katrakilidis, C.; Karfakis, C.; Persson, M. Price Transmission in the Swedish Pork Chain: New Evidence from Asymmetric ARDL modeling. In Proceedings of the EAAE 2011 Congress Change and Uncertainty Challenges for Agriculture, Food and Natural Resources, Zurich, Switzerland, 30 August–2 September 2011. [Google Scholar]
  52. Gervais, J.-P. Disentangling nonlinearities in the long-and short-run price relationships: An application to the US hog/pork supply chain. Appl. Econ. 2011, 43, 1497–1510. [Google Scholar] [CrossRef]
  53. Falkowski, J. Price transmission and market power in a transition context: Evidence from the Polish fluid milk sector. Post-Communist Econ. 2010, 22, 513–529. [Google Scholar] [CrossRef]
  54. London Economics Investigation of the Determinants of Farm-Retail Price Spreads 2004. Available online: https://londoneconomics.co.uk/wp-content/uploads/2011/09/92-Investigation-of-the-determinants-of-farm-retail-price-spreads.pdf (accessed on 30 November 2018).
  55. Santeramo, F.G.; Cramon-Taubadel, S. Von On perishability and Vertical Price Transmission: Empirical evidences from Italy. Bio-Based Appl. Econ. 2016, 5, 199–214. [Google Scholar]
  56. Madau, F.A.; Furesi, R.; Pulina, P. The existence of buyer power in the Italian fresh milk supply chain. Br. Food J. 2016, 118, 70–82. [Google Scholar] [CrossRef]
  57. Antonioli, F.; Ben Kaabia, M.; Arfini, F.; Gil, J.M. Price transmission dynamics for quality-certified food products: A comparison between conventional and organic fluid milk in Italy. Agribusiness 2018. [Google Scholar] [CrossRef]
  58. Carraro, A.; Stefani, G. Vertical price transmission in Italian agri–food chains: Does the transmission elasticity change always or sometimes. In Proceedings of the presentation at the XLVII Conference SIDEA, Campobasso, Italy, 22–25 September 2010; Volume 22, p. 25. [Google Scholar]
  59. Cacchiarelli, L.; Sorrentino, A. Antitrust intervention and price transmission in pasta supply chain. Agric. Food Econ. 2015, 4, 2. [Google Scholar] [CrossRef]
  60. Cacchiarelli, L.; Sorrentino, A. Market power in food supply chain: Evidence from Italian pasta chain. Br. Food J. 2018, 120, 2129–2141. [Google Scholar] [CrossRef]
  61. Monasterolo, I.; Pasqualino, R.; Janetos, A.C.; Jones, A. Sustainable and Inclusive Food Systems through the Lenses of a Complex System Thinking Approach—A Bibliometric Review. Agriculture 2016, 6, 44. [Google Scholar] [CrossRef]
  62. Ravallion, M. Testing market integration. Am. J. Agric. Econ. 1986, 68, 102–109. [Google Scholar] [CrossRef]
  63. Sexton, R.J.; Kling, C.L.; Carman, H.F. Market integration, efficiency of arbitrage, and imperfect competition: Methodology and application to US celery. Am. J. Agric. Econ. 1991, 73, 568–580. [Google Scholar] [CrossRef]
  64. Zanias, G.P. Testing for integration in European Community agricultural product markets. J. Agric. Econ. 1993, 44, 418–427. [Google Scholar] [CrossRef]
  65. Baulch, B. Testing for food market integration revisited. J. Dev. Stud. 1997, 33, 512–534. [Google Scholar] [CrossRef]
  66. Ardeni, P.G. Does the law of one price really hold for commodity prices? Am. J. Agric. Econ. 1989, 71, 661–669. [Google Scholar] [CrossRef]
  67. Baffes, J. Some further evidence on the law of one price: The law of one price still holds. Am. J. Agric. Econ. 1991, 73, 1264–1273. [Google Scholar] [CrossRef]
  68. ISMEA Scheda di Settore Cereali 2017. Available online: http://www.ismeamercati.it/flex/cm/pages/ServeBLOB.php/L/IT/IDPagina/3524. (accessed on 18 January 2019).
  69. Dickey, D.A.; Fuller, W.A. Distribution of the Estimators for Autoregressive Time Series with a Unit Root. J. Am. Stat. Assoc. 1979, 74, 427–431. [Google Scholar]
  70. Perron, P. The great crash, the oil price shock, and the unit root hypothesis. Econom. J. Econ. Soc. 1989, 1361–1401. [Google Scholar] [CrossRef]
  71. Zivot, E.; Andrews, D.W.K. Further evidence on the great crash, the oil-price shock, and the unit-root hypothesis. J. Bus. Econ. Stat. 2002, 20, 25–44. [Google Scholar] [CrossRef]
  72. Lee, J.; Strazicich, M.C. Minimum Lagrange multiplier unit root test with two structural breaks. Rev. Econ. Stat. 2003, 85, 1082–1089. [Google Scholar] [CrossRef]
  73. Perron, P. Dealing with structural breaks. Palgrave Handb. Econ. 2006, 1, 278–352. [Google Scholar]
  74. Bai, J.; Perron, P. Estimating and testing linear models with multiple structural changes. Econometrica 1998, 47–78. [Google Scholar] [CrossRef]
  75. Bai, J.; Perron, P. Computation and analysis of multiple structural change models. J. Appl. Econ. 2003, 18, 1–22. [Google Scholar] [CrossRef] [Green Version]
  76. Engle, R.F.; Granger, C.W. Co-integration and error correction: Representation, estimation, and testing. Econom. J. Econ. Soc. 1987, 251–276. [Google Scholar] [CrossRef]
  77. Arai, Y.; Kurozumi, E. Testing for the null hypothesis of cointegration with a structural break. Econ. Rev. 2007, 26, 705–739. [Google Scholar] [CrossRef]
  78. Phillips, P.C. Time series regression with a unit root. Econom. J. Econ. Soc. 1987, 277–301. [Google Scholar] [CrossRef]
  79. Cutts, M.; Kirsten, J. Asymmetric Price Transmission and Market Concentration: An Investigation into Four South African Agro-Food Industries. S. Afr. J. Econ. 2006, 74, 323–333. [Google Scholar] [CrossRef]
Figure 1. Wheat Value Chain. Source: Adapted from ISMEA [68].
Agriculture 09 00036 g001
Figure 2. Price dynamics, structural break and elasticity for pasta and bread chain (Top left panel A: Pasta chain—Upstream phase; Top right panel B: Bread chain—Upstream phase; Bottom left panel C: Pasta chain—Downstream phase; Bottom right panel D: Bread chain—Downstream phase.
Agriculture 09 00036 g002
Table 1. Unit root tests.
TestADFZALS
LevelLevel+TrendLevelLevel+TrendTrendLevelLevel+Trend
Durum wheat−2.49−2.84−3.85−4.93−3.06−3.18−4.54
Semolina−2.80−3.21−4.49−6.01−3.29−2.88−4.33
Pasta−1.04−2.84−7.59−7.16−3.76−3.27 −4.67
Soft wheat−1.83−2.33−3.42−3.43−2.87−2.78−4.19
Flour−1.74−2.88−3.63−3.71−3.00−2.90−4.17
Bread−0.57−2.25−5.57−8.96−2.35−2.45 −4.18
Critical Value
1%−3.48−4.02−5.43−5.57−4.93−4.55−6.32−6.45
5%−2.88−3.44−4.80−5.08−4.42−3.84−5.73−5.67
10%−2.58−3.14 −3.50−5.32−5.31
Notes: For the Zivot and Andrews test (ZA) and the Lee and Strazicich’s LM test (LS) tests break dates not reported. ADF - H0: Unit Root. ZA- H0: I (1) no break, alternative not unique and therefore would be also unit root with break(s). LS- H0: I (1) with 2 breaks, alternative I (0) with 2 breaks.
Table 2. Kejriwal and Perron [20] tests of multiple structural changes.
Specifications: zt = {1, variable}, q = 2, M = 3, ε = 0.20, xt = {0} p = 0
ySemolinaPastaWheat flourBread
zDurum wheatSemolinaSoft wheatWheat flour
sup FT(1)12.33 ***214.90 ***70.25 ***1,177.43 ***
sup FT(2)73.05 ***336.69 ***40.20 ***2,085.04 ***
sup FT(3)329.99 ***1,357.70 ***58.89 ***27,553.76 ***
UD max329.99 ***1,357.70 ***70.25 ***27,553.76 ***
sup FT(2|1)96.08 ***80.70 ***18.68 **72.97 ***
sup FT(3|2)16.78 *205.14 *** 48.87 ***
Break dates
T ^ 1 Feb. 03Apr. 03Aug. 02Dec. 01
C.I. 95%Aug. 00—Feb. 03Mar. 03—Jun. 03May 02—Mar. 03Oct. 01—Feb. 02
T ^ 2 Oct. 05Jul. 05May 07Sep. 04
C.I. 95%Aug. 05—Feb. 06Jan. 05—Aug. 05Oct. 05—Dec. 08May 04—Oct. 04
T ^ 3 Mar. 08Jan. 08 Sep. 07
C.I. 95%Dec. 07—May 08Nov. 07—Feb. 08 Aug. 07—Oct. 07
Notes: The sup FT(k) tests, the standard errors and the confidences interval use the following specifications; serial correlation in the errors, different variances of the error terms across segments and different distribution for the data across segments. Finally, for the confidence interval the moment matrix of the data is assumed identical across segments. *, ** and *** denote significance at the 10%, 5% and 1% levels, respectively. Critical values are obtained from Tables 1 and 3 of Kejriwal and Perron [20].
Table 3. Cointegration tests.
Gregory Hansen (ADF*, Zt*)Arai-Kurozumi-Kejrival
TestCC/TC/SV3(λ)V2(λ)λ1λ2λ3
Semolina/Durum wheat−4.73−4.84−5.210.04 0.240.540.74
Pasta/Semolina−4.06−5.86−4.040.05 0.280.480.70
Wheat flour/Soft wheat−5.50−6.89−5.58 0.150.290.67
Bread/Wheat flour−2.72−2.95−3.710.12 0.230.460.70
Critical Value
1% 0.150.16
5% 0.090.09
10%−4.34−4.72−4.680.070.08
Notes: For both the test break dates are not reported. Gregory and Hansen–H0: No cointegration, alternative cointegration with 1 structural break. Arai-Kurozumi-Kejrival–H0: Cointegration with multiple structural breaks.
Table 4. Estimation results of Phillips Loretan dynamic least square equation for pasta chain.
Pasta Chain
upstream (farm-wholesale)downstream (wholesale-retail)
SemolinaPasta
Est. Param.t-stat. Est. Param.t-stat.
Intercept:
Constant (D1)1.242.12Constant (D1)3.9139.27
D21.502.19D20.602.03
D3−1.18−1.92D3−0.82−4.07
D41.071.76D40.726.95
Farm Price:
Durum wheat0.745.96Semolina0.167.35
Durum wheat*D2−0.33−2.24Semolina*D2−0.12−1.92
Durum wheat*D30.272.07Semolina*D30.194.44
Durum wheat*D4−0.21−1.63Semolina*D4−0.10−4.45
Phillips & Loretan (1,1,1,) Terms:
Contempor. coeff.−0.67−4.62Contempor. coeff.−0.03−1.17
Lead coeff.0.372.69Lead coeff.0.041.72
Lag coeff.0.130.97Lag coeff.−0.01−0.61
Lagged residuals0.8211.28Lagged residuals0.669.21
Adjusted R20.93 Adjusted R20.99
Durbin-Watson1.49 Durbin-Watson1.91
Table 5. Estimation results of Phillips Loretan dynamic least square equation for bread chain.
Bread Chain
upstream (farm-wholesale)downstream (wholesale-retail)
Wheat flourBread
Intercept:Est. Param.t-stat. Est. Param.t-stat.
Constant (D1)2.165.23Constant (D1)1.2214.95
D21.533.58D21.7814.27
D30.350.83D32.9921.48
D43.8543.78
Farm Price:
Soft wheat0.546.15Wheat flour0.7342.12
Soft wheat*D2−0.30−3.21Wheat flour*D2−0.37−14.13
Soft wheat*D3−0.04−0.40Wheat flour*D3−0.61−21.22
Wheat flour*D4−0.76−40.65
Phillips & Loretan (1.1,1,) Terms:
Contempor. coeff.−0.23−3.88Contempor. coeff.−0.06−2.27
Lead coeff.0.193.37Lead coeff.0.031.01
Lag coeff.0.040.67Lag coeff.0.052.09
Lagged residuals0.8012.83Lagged residuals0.9719.07
Adjusted R20.96 Adjusted R20.997
Durbin-Watson1.66 Durbin-Watson1.87

