Generational Changes in Agriculture: The Influence of Farm Characteristics and Socio-Economic Factors


Abstract
1. Introduction
2. Theoretical Background: Generational Changes and Their Drivers in Peri-Urban/Metropolitan Agriculture
3. Research Methodology
3.1. Data Sources
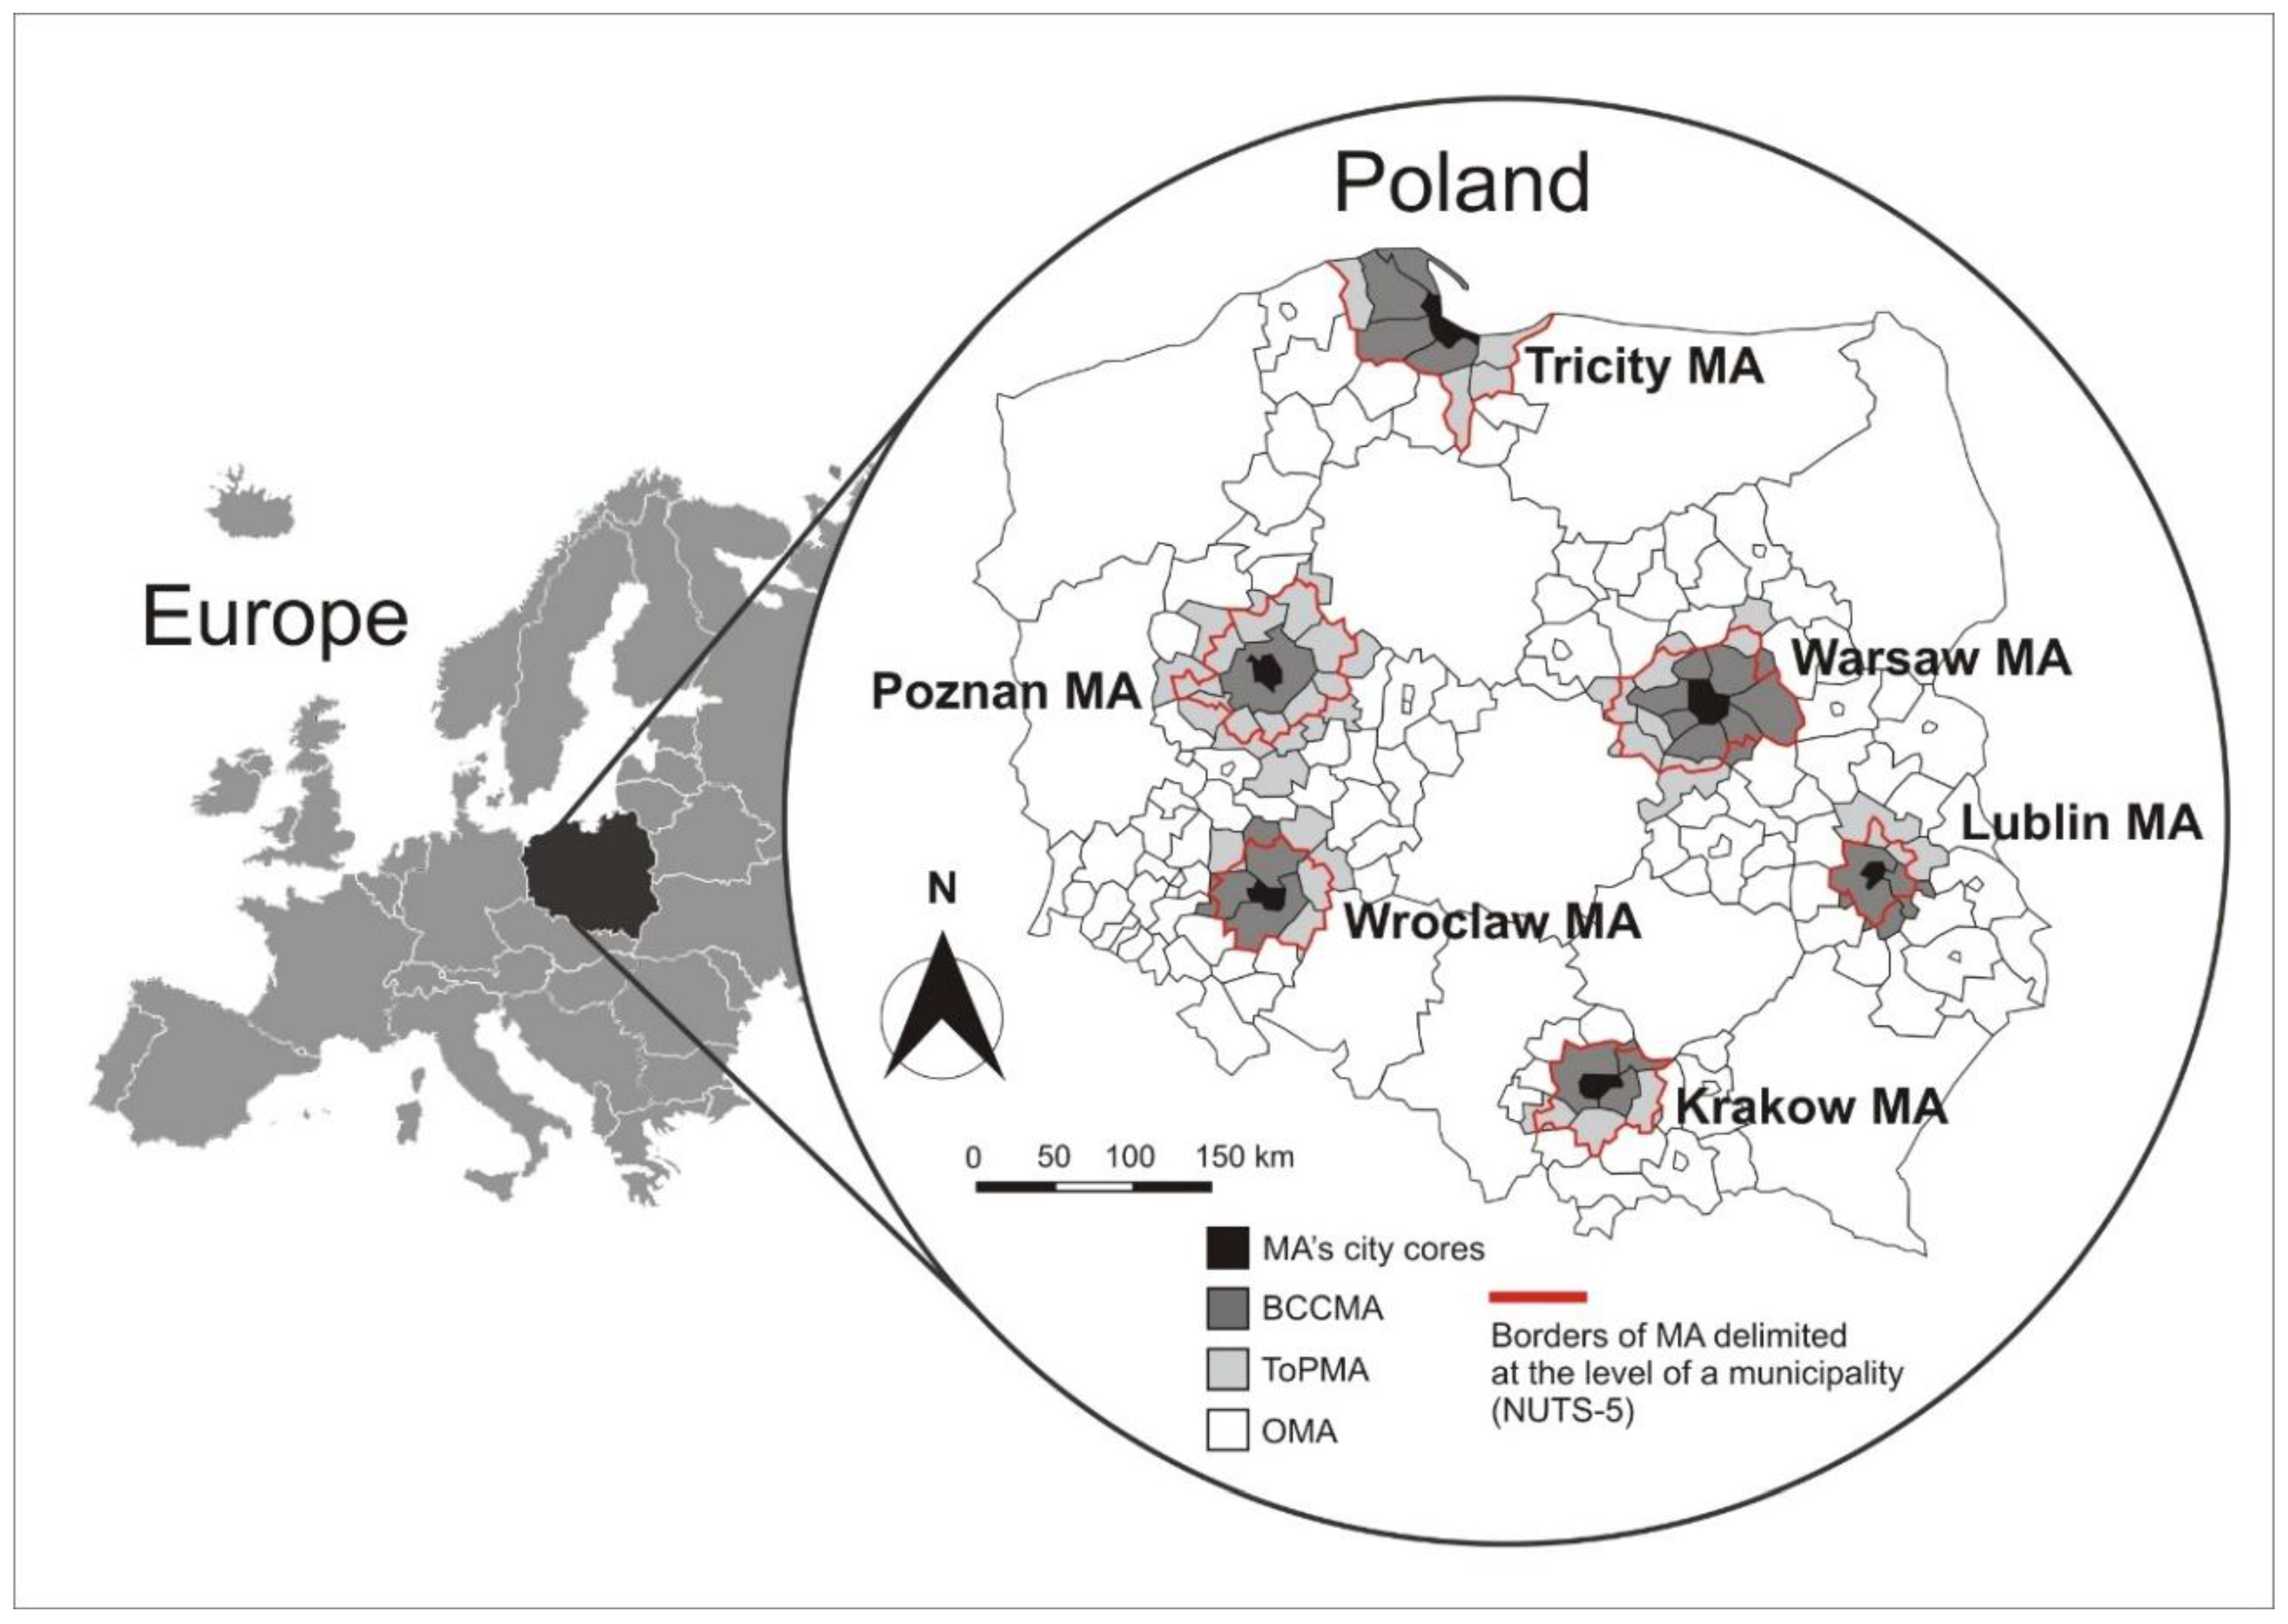
3.2. Study Area
3.3. Selection of Variables
3.3.1. Dependent Variables—Pace of Generational Changes
3.3.2. Independent Variables
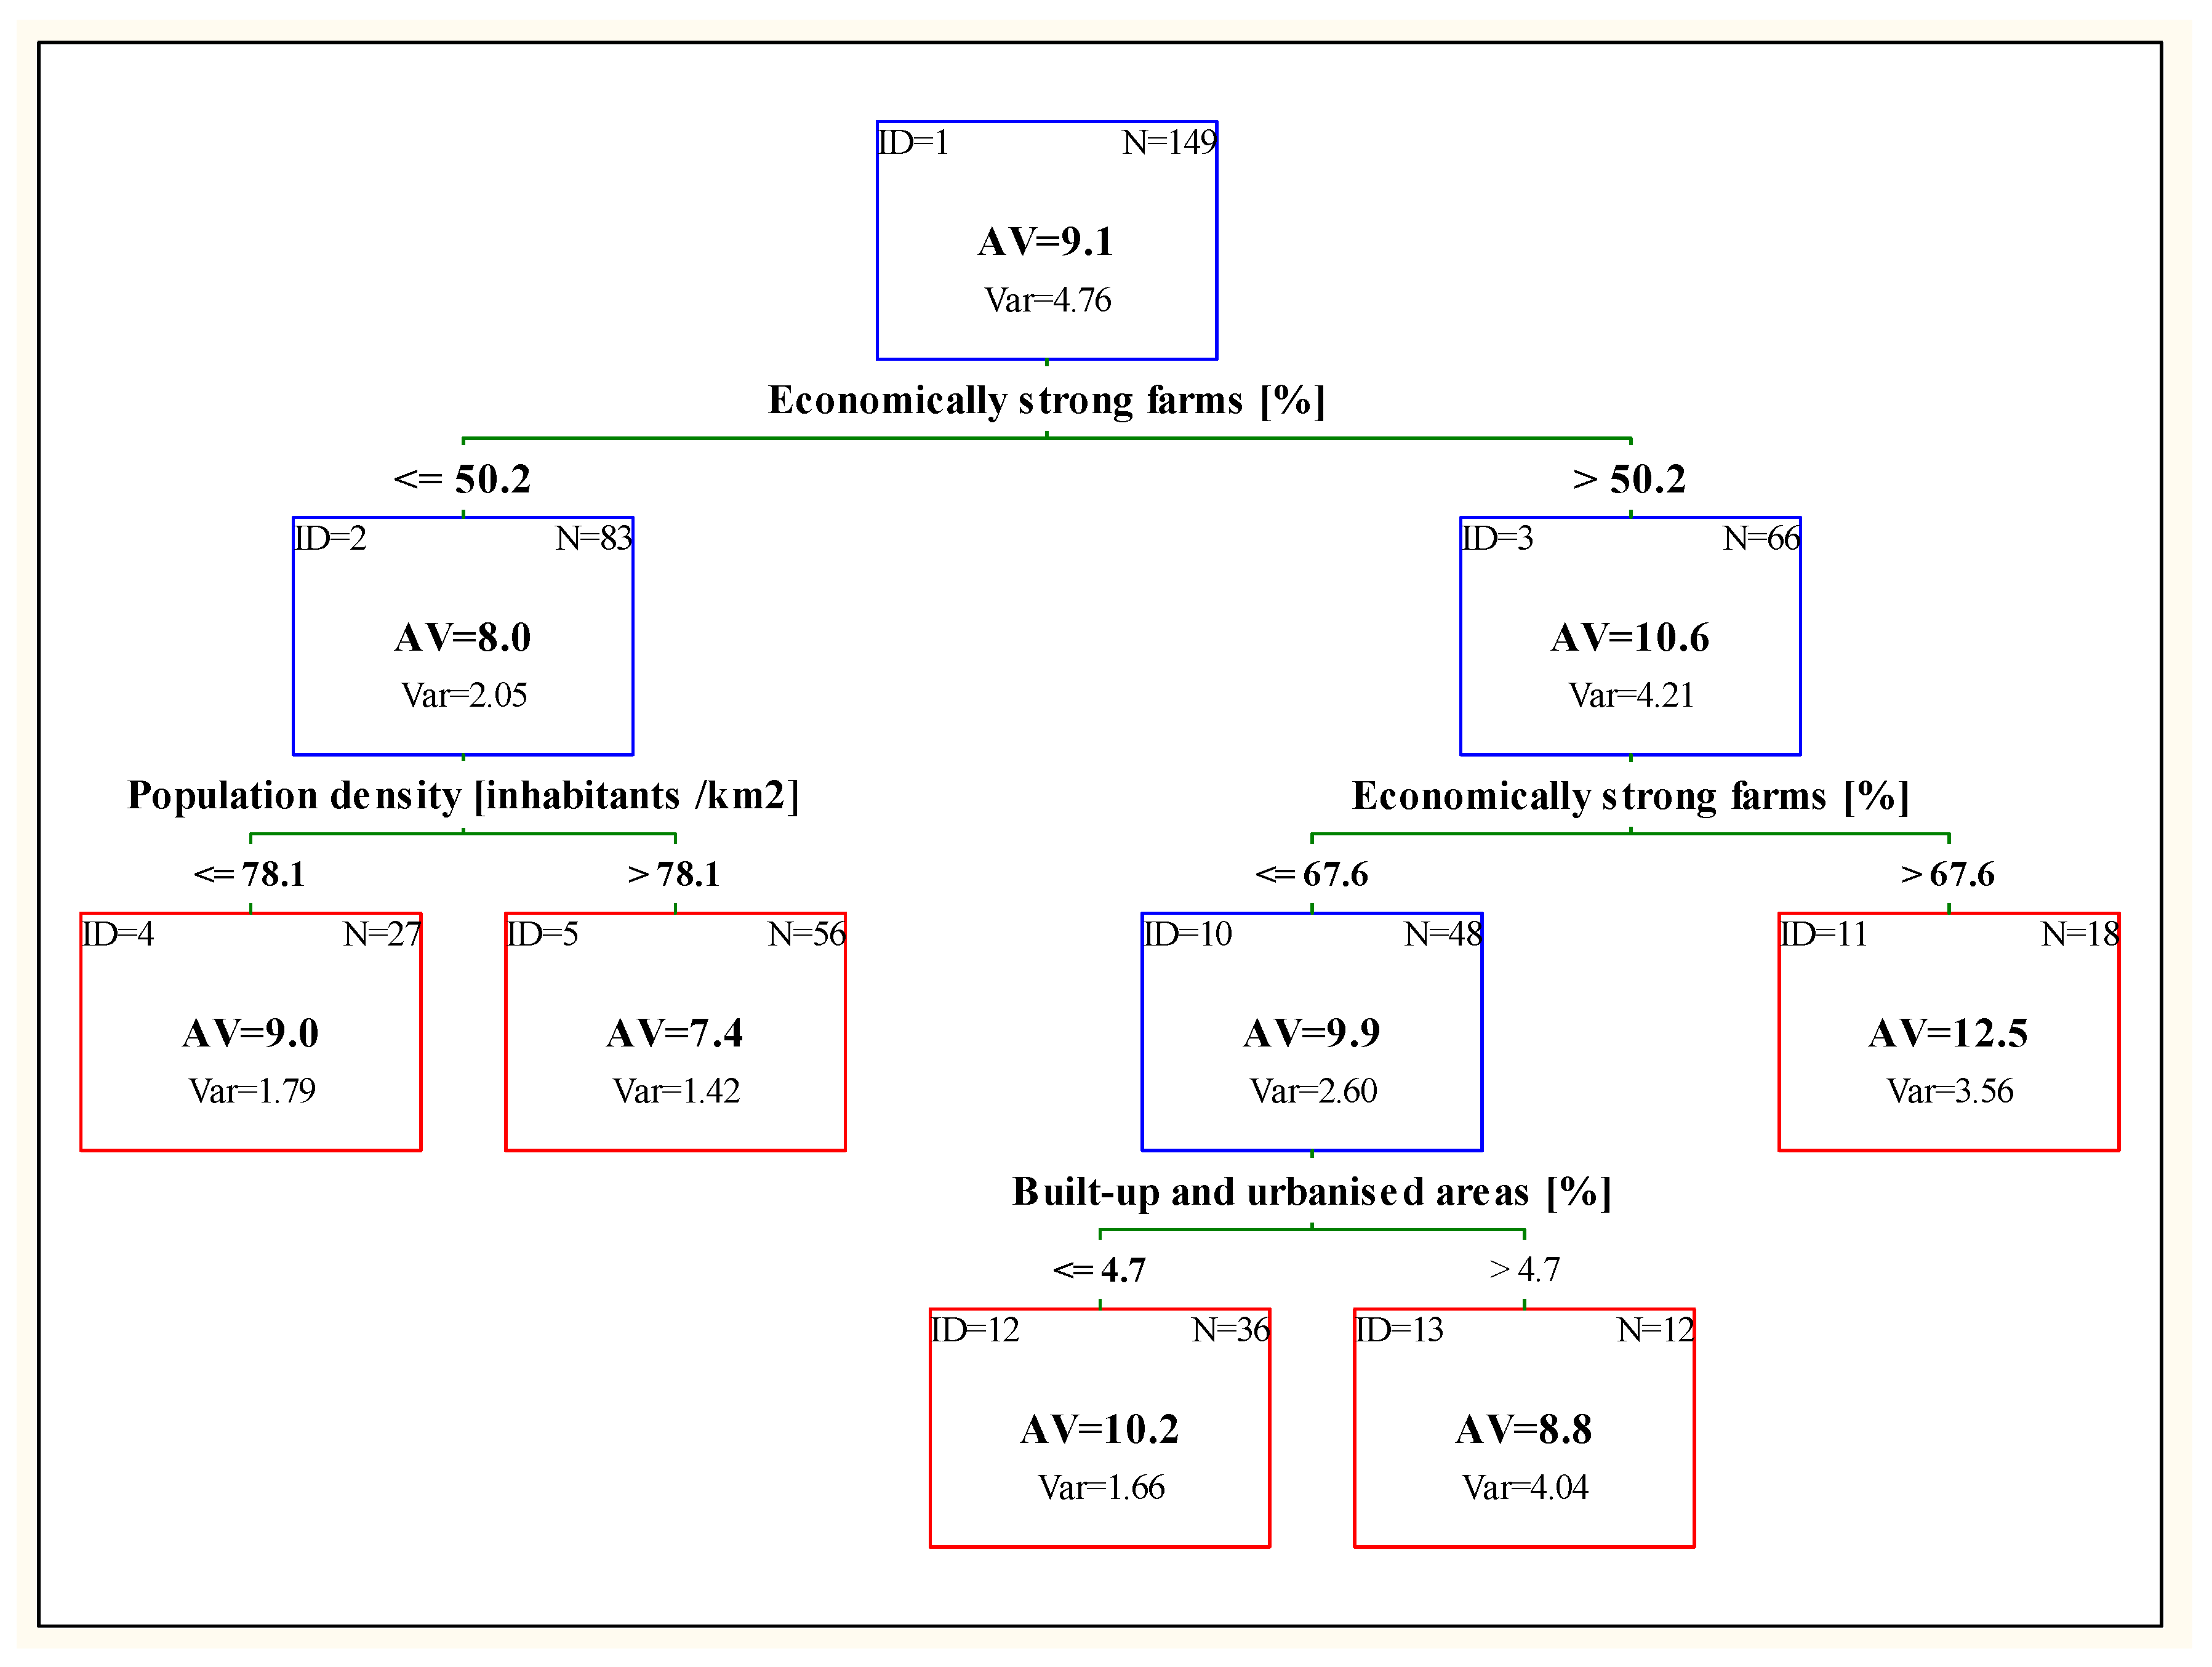
3.4. Data Analysis: Regressions Trees
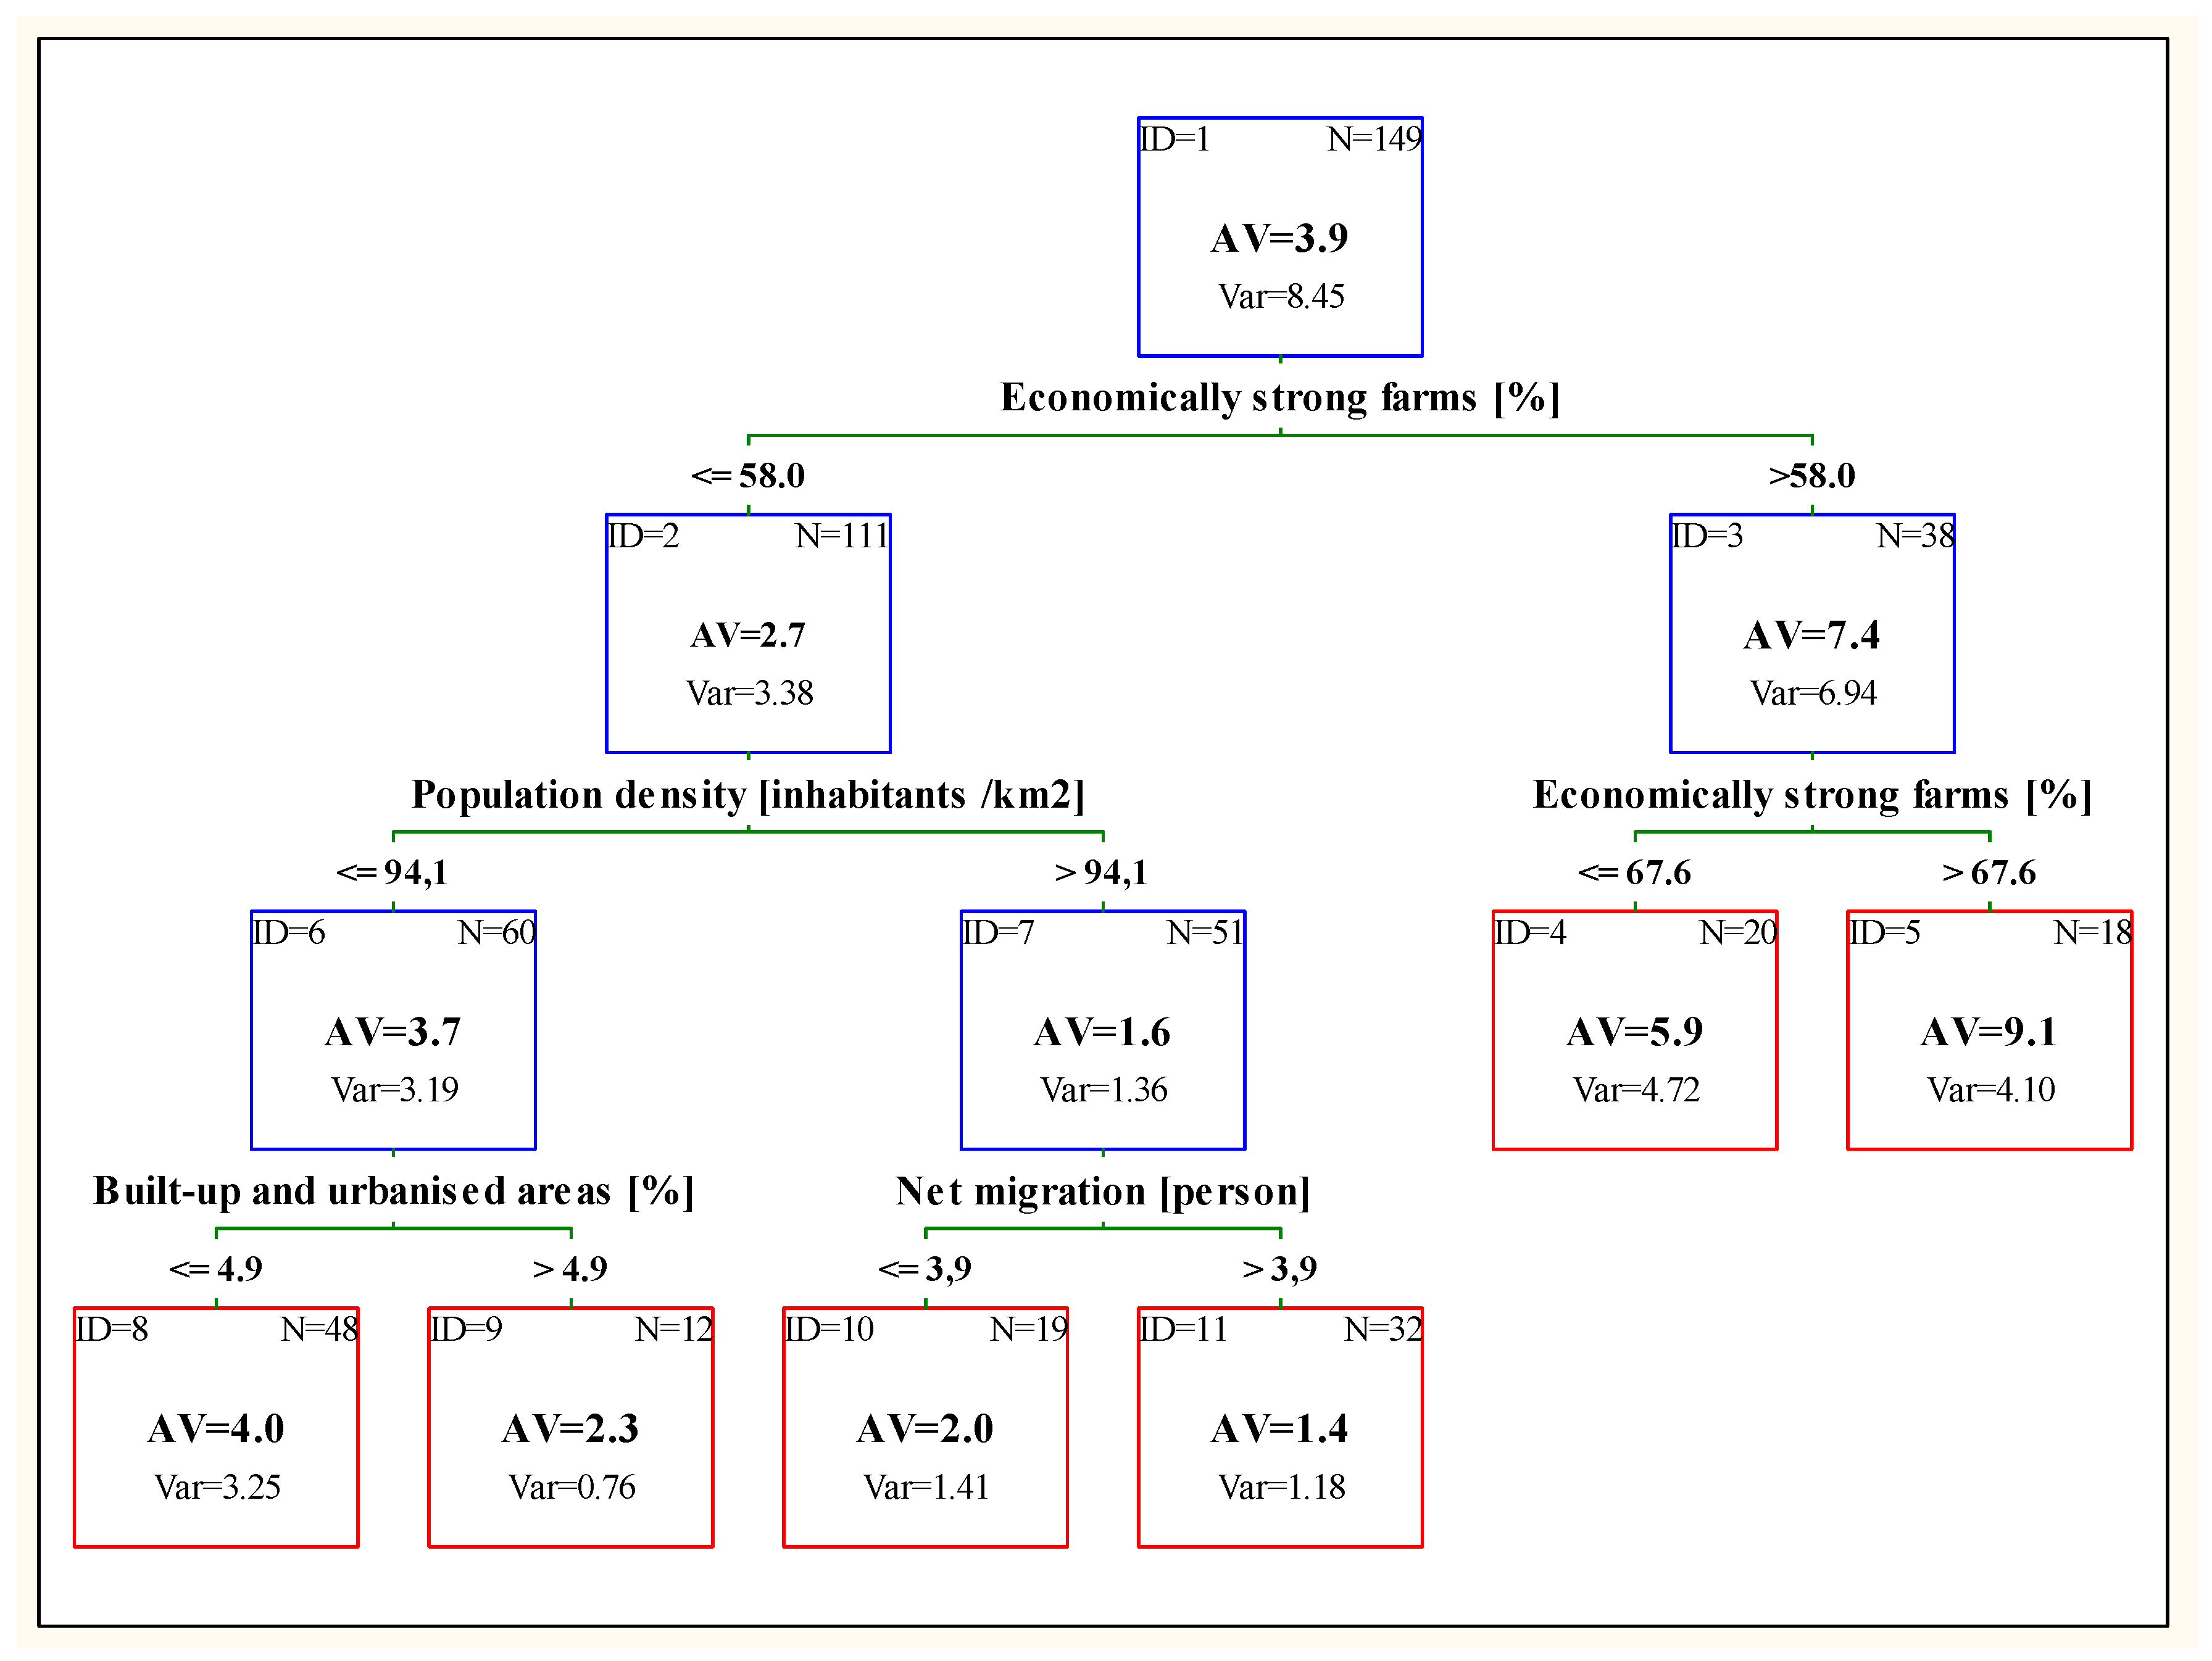
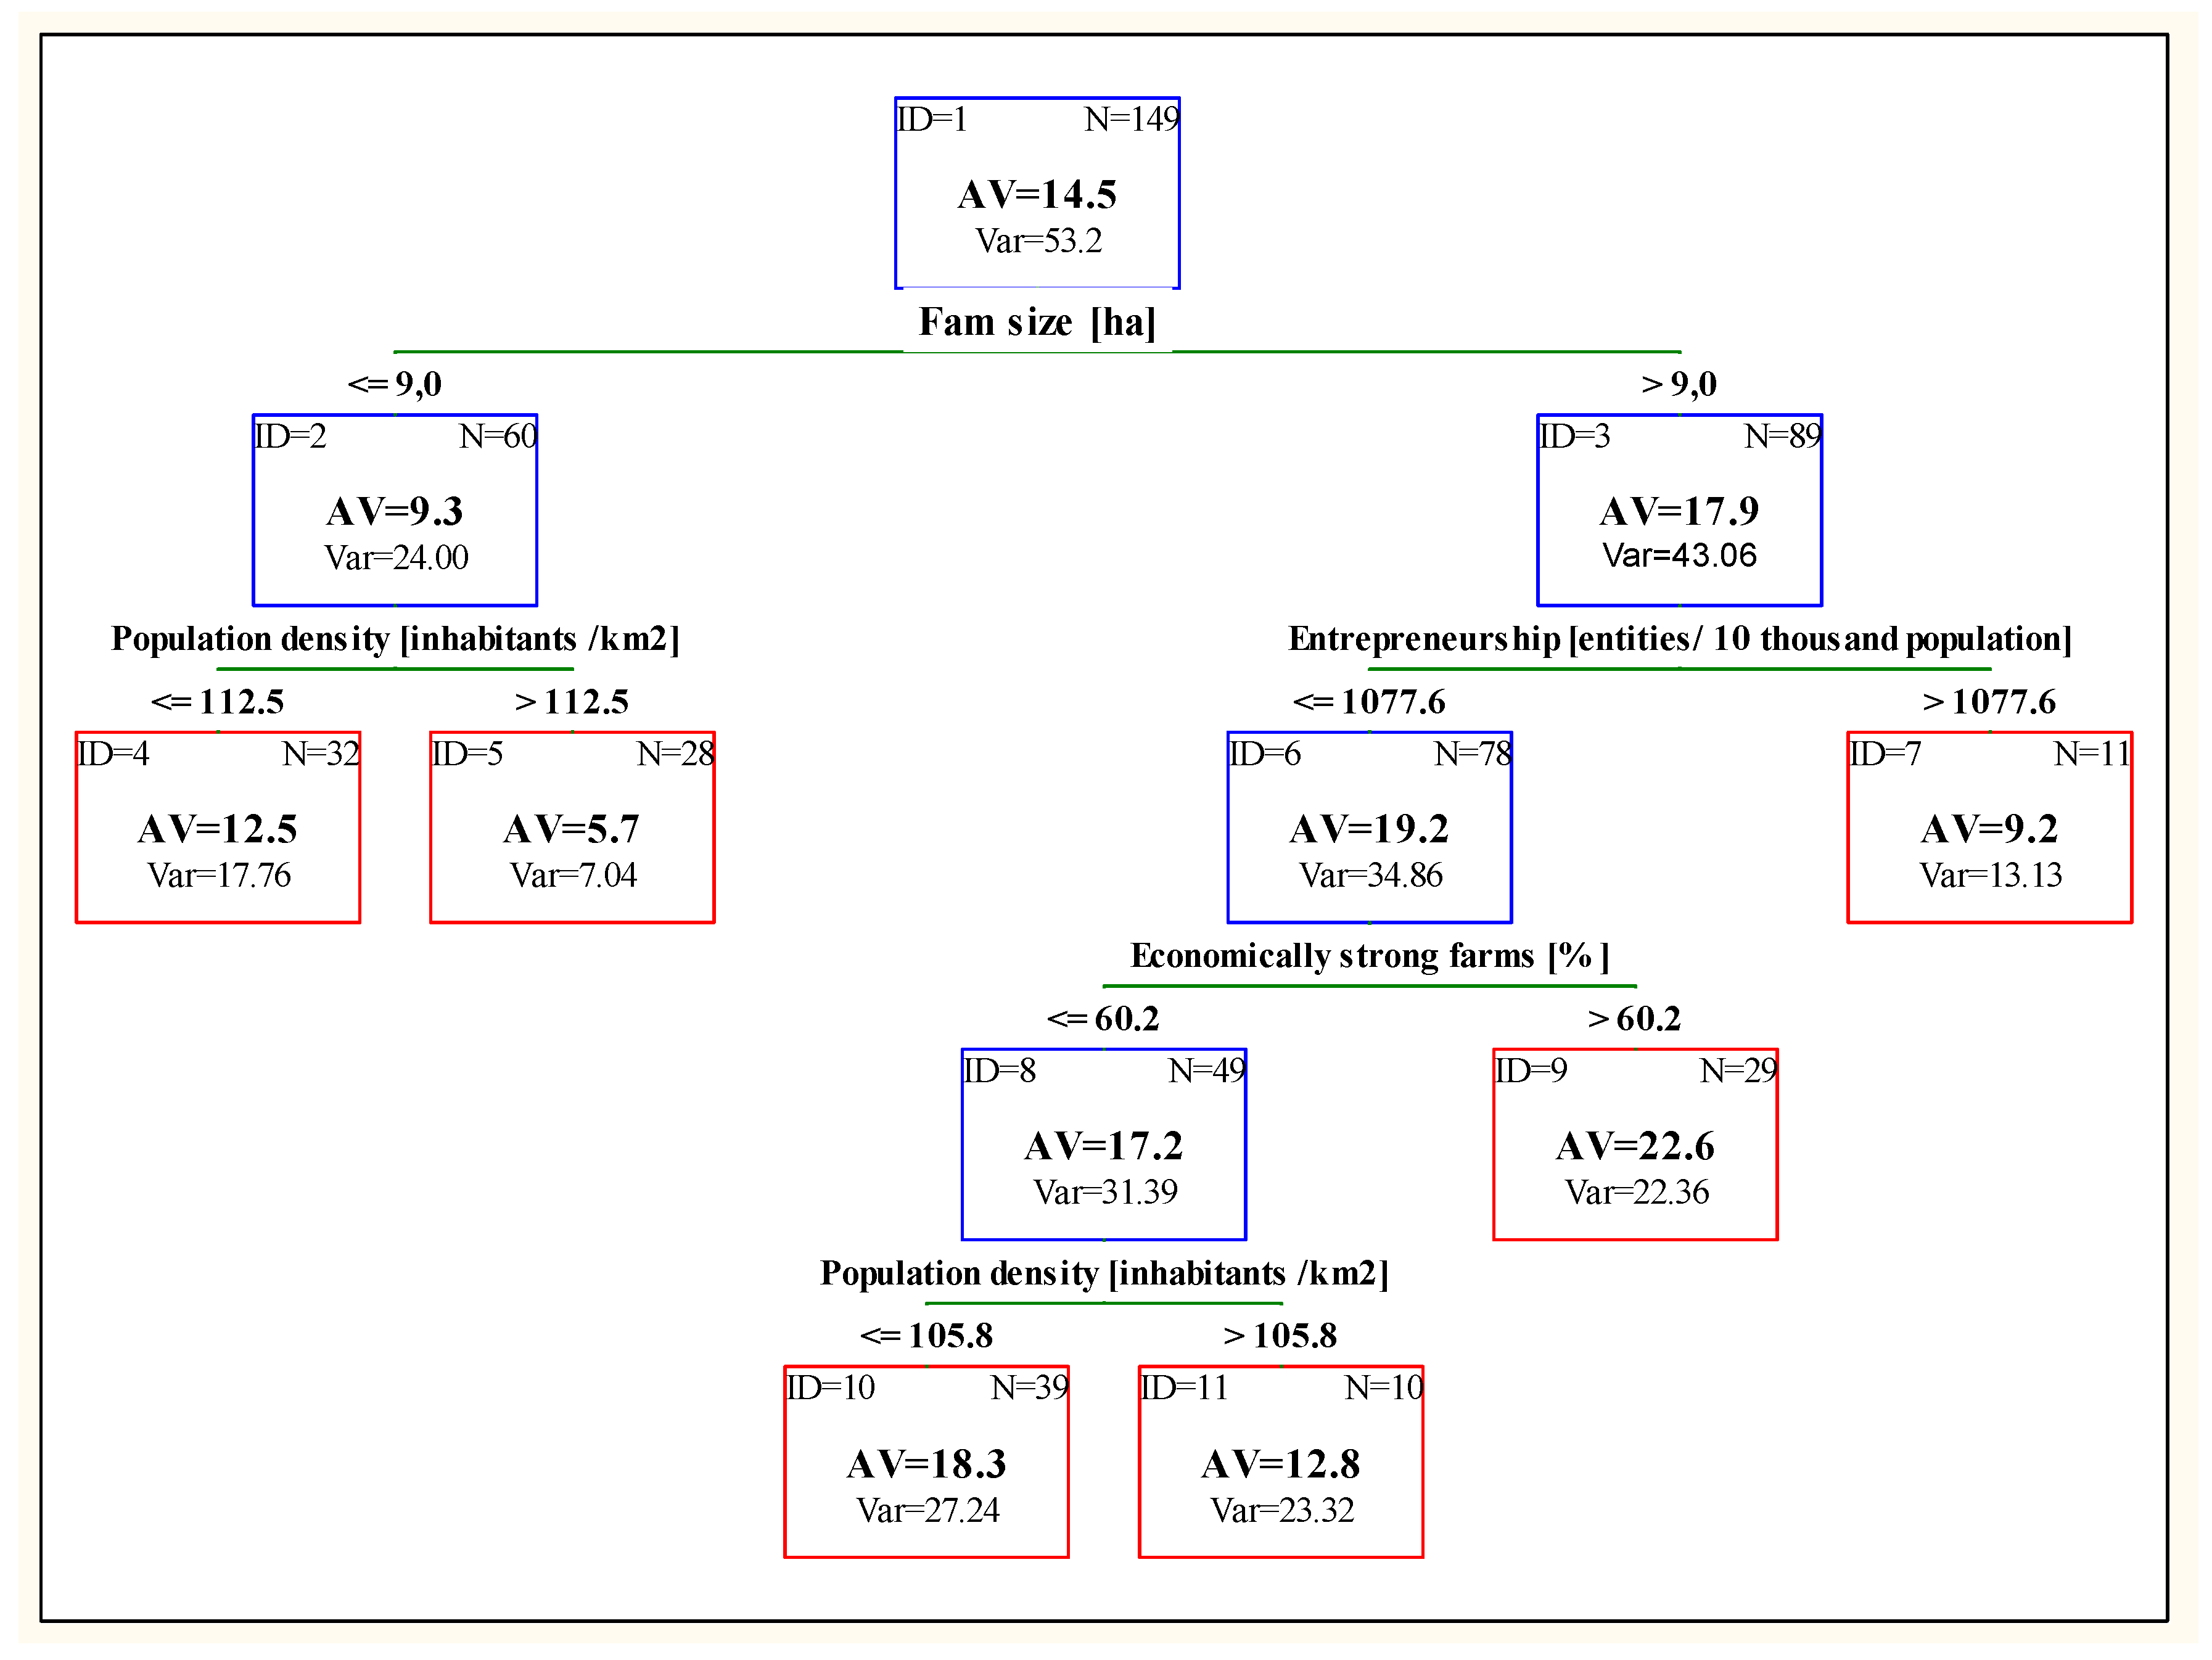
4. Research Findings
4.1. Location Matters: Generational Changes Depending on the Farm’s Location
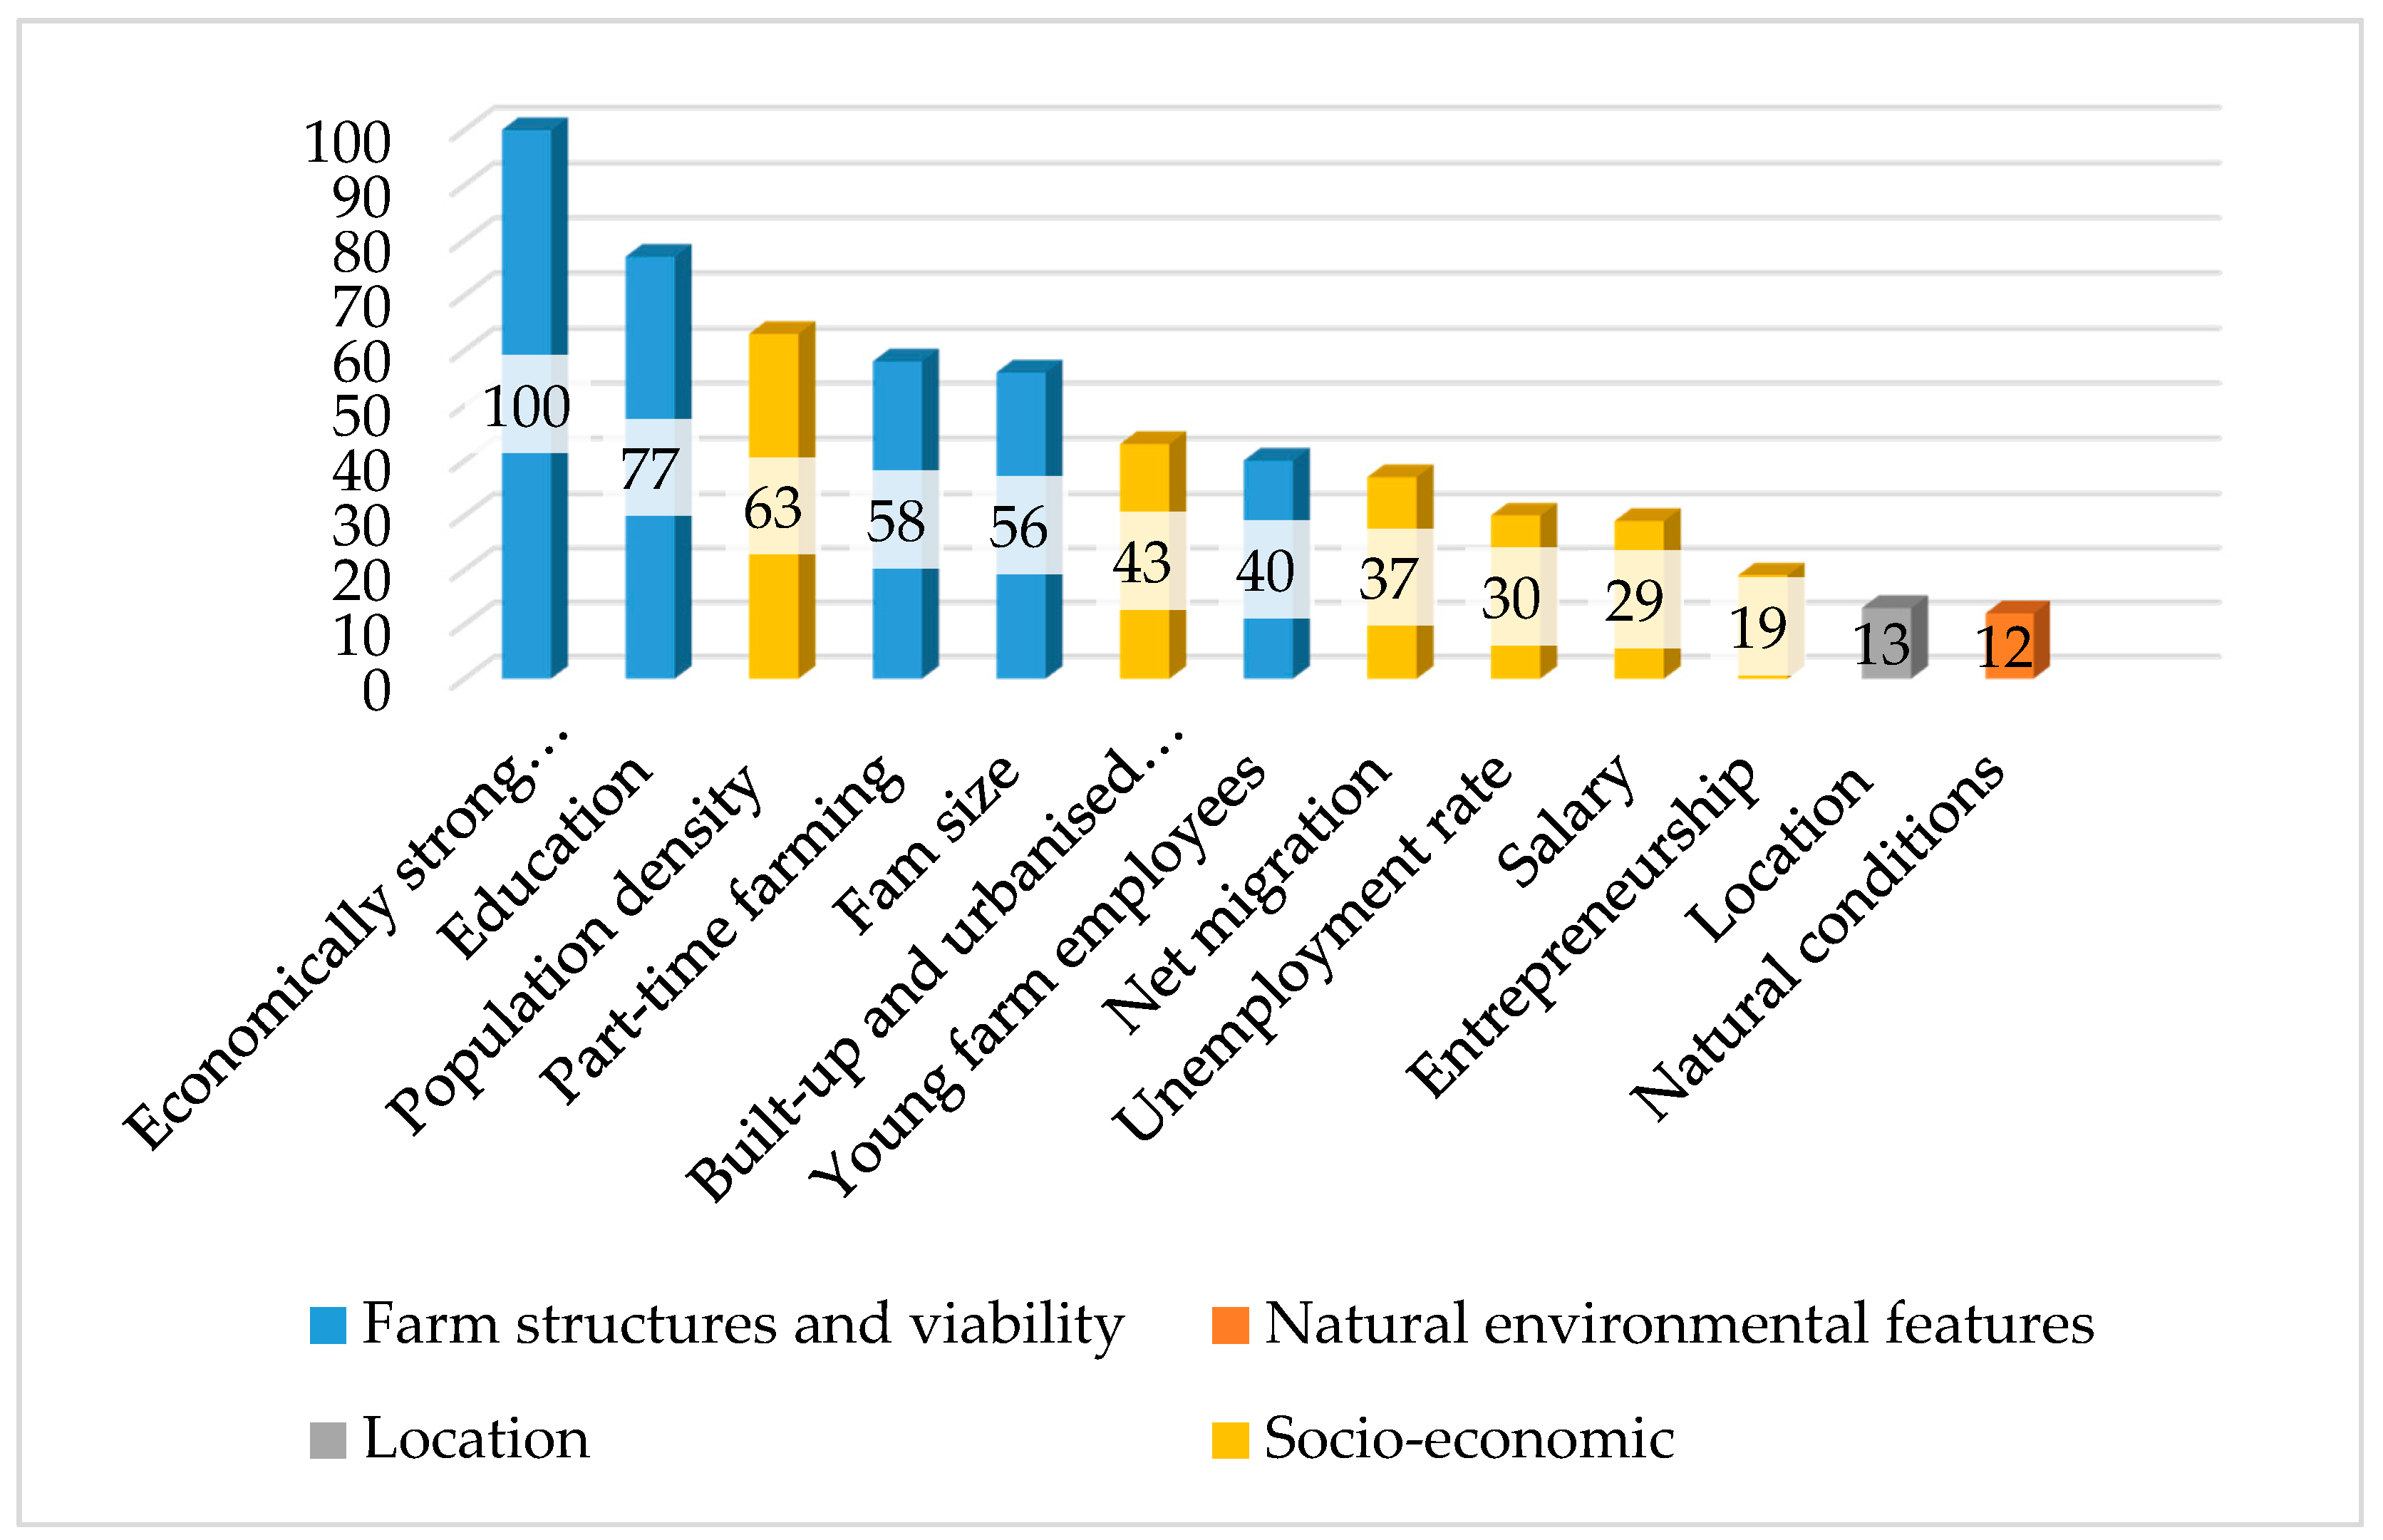
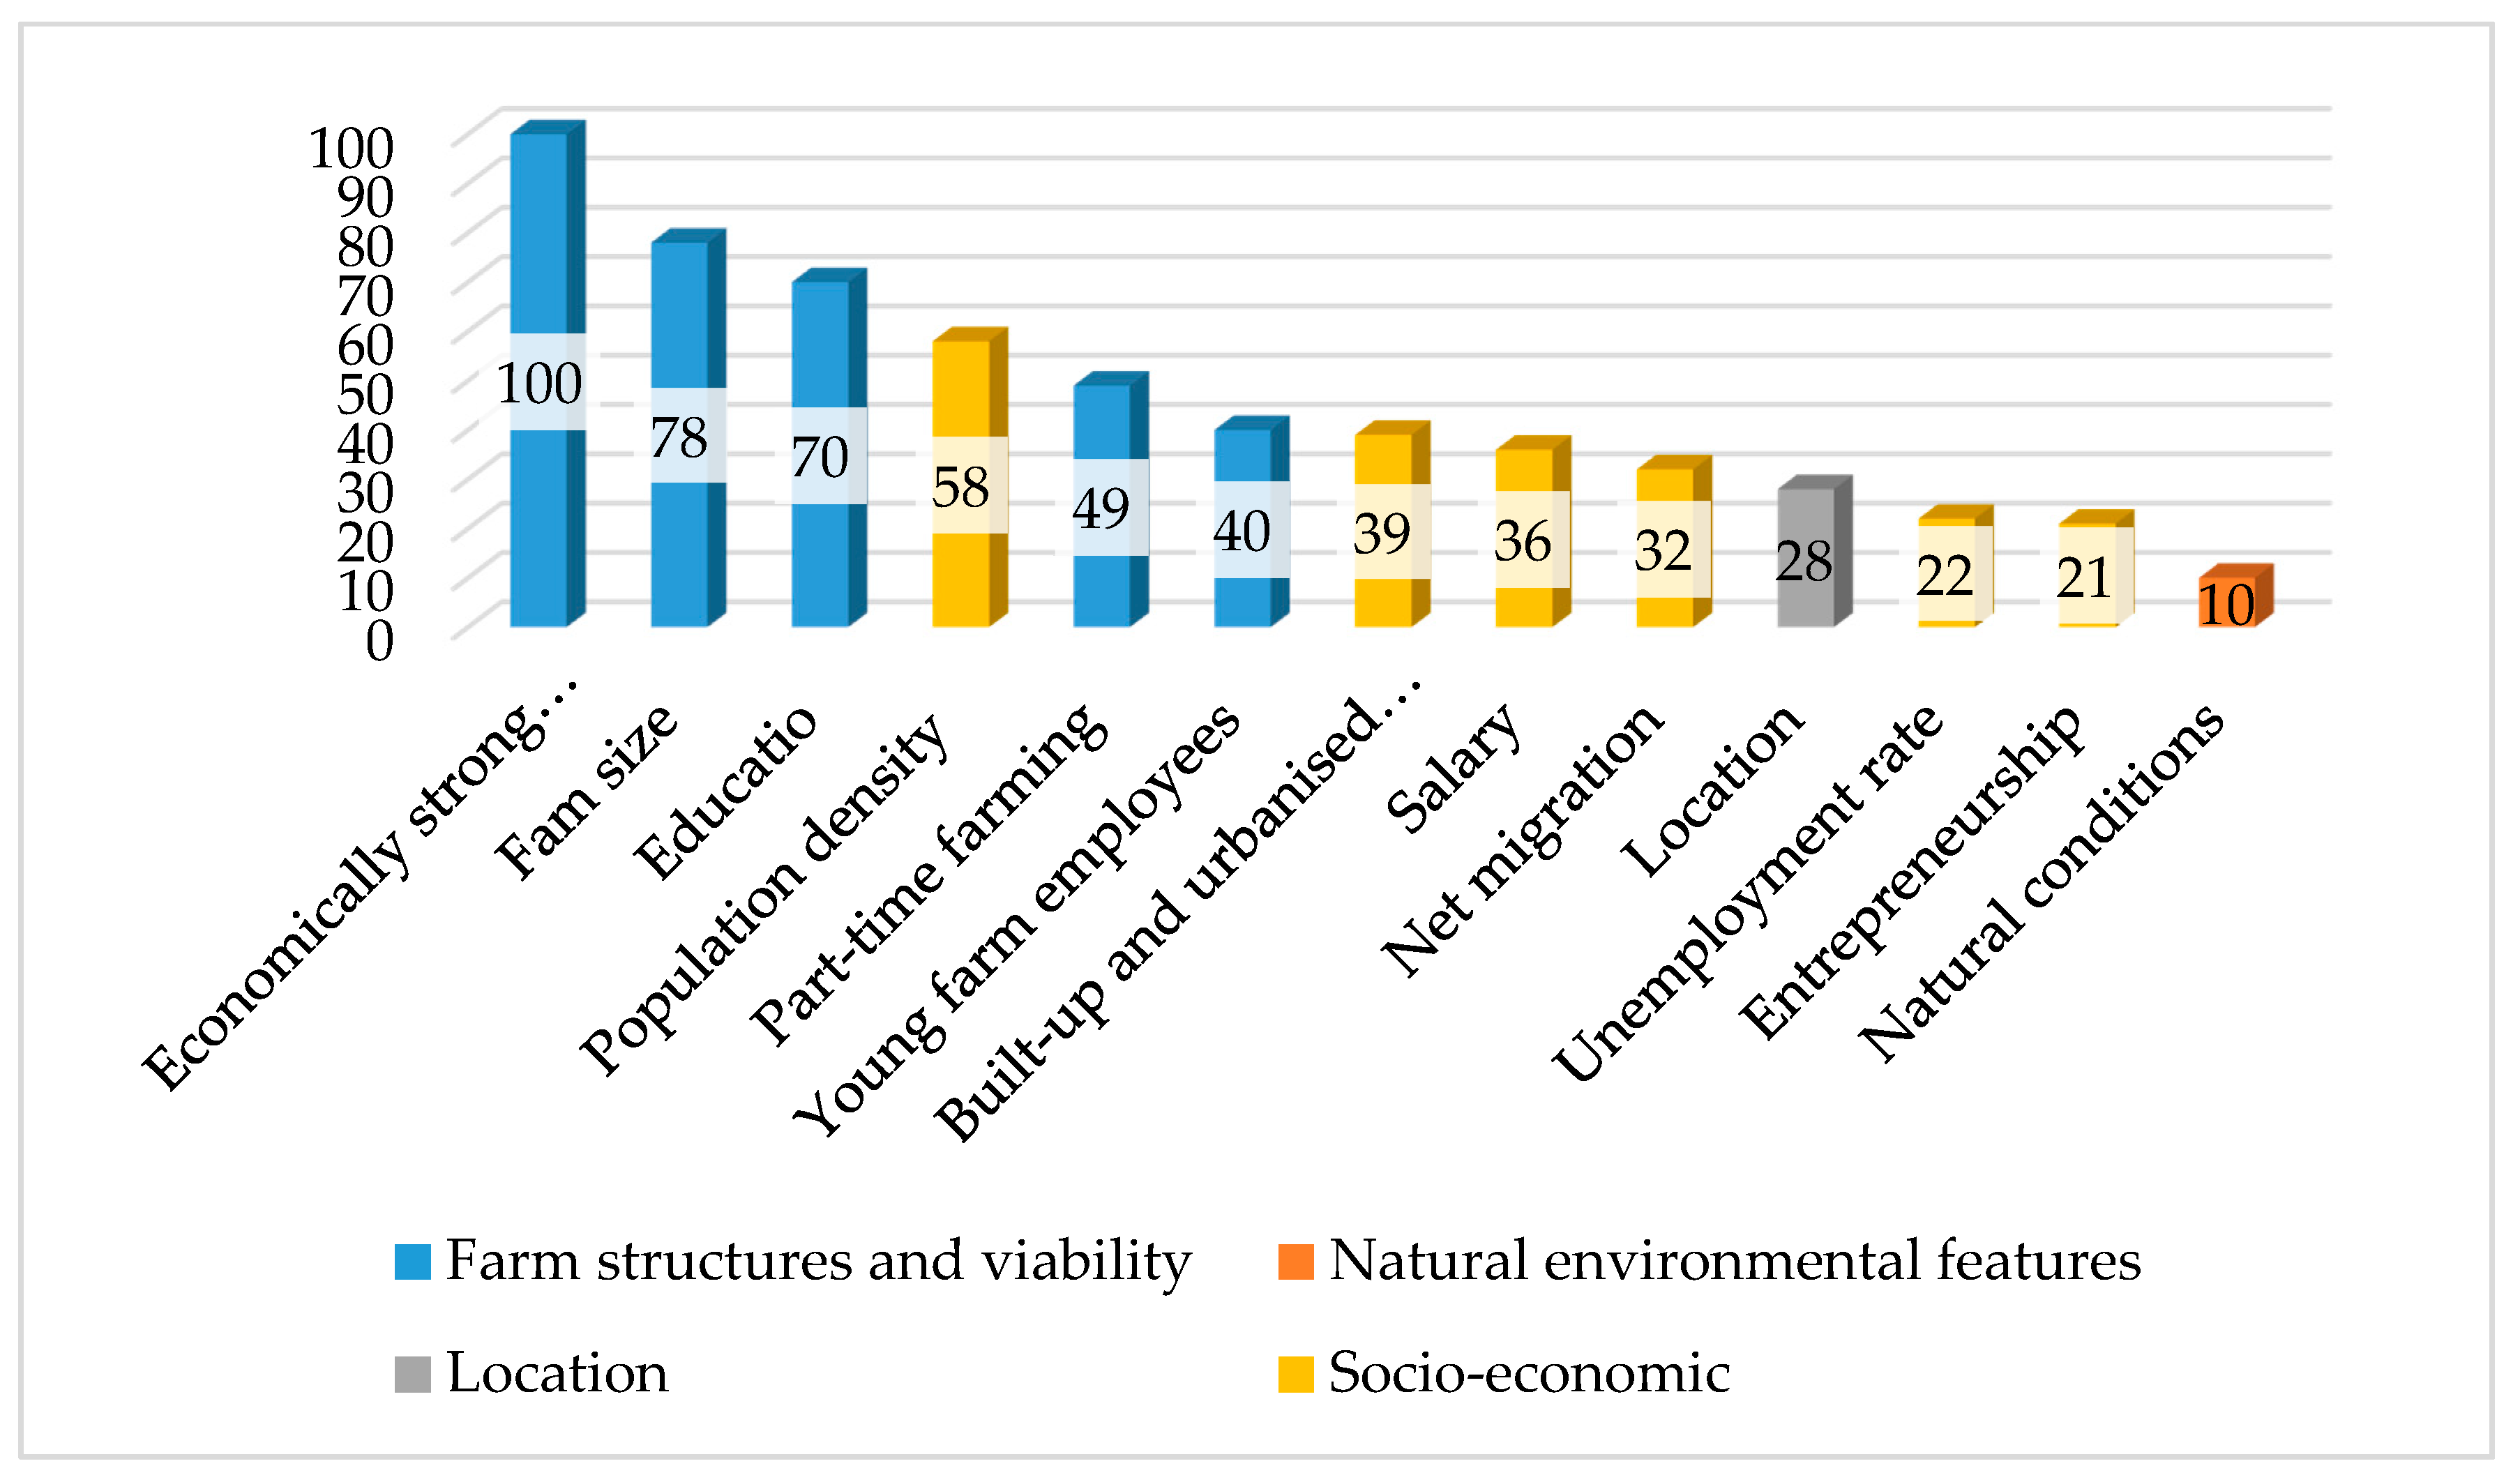
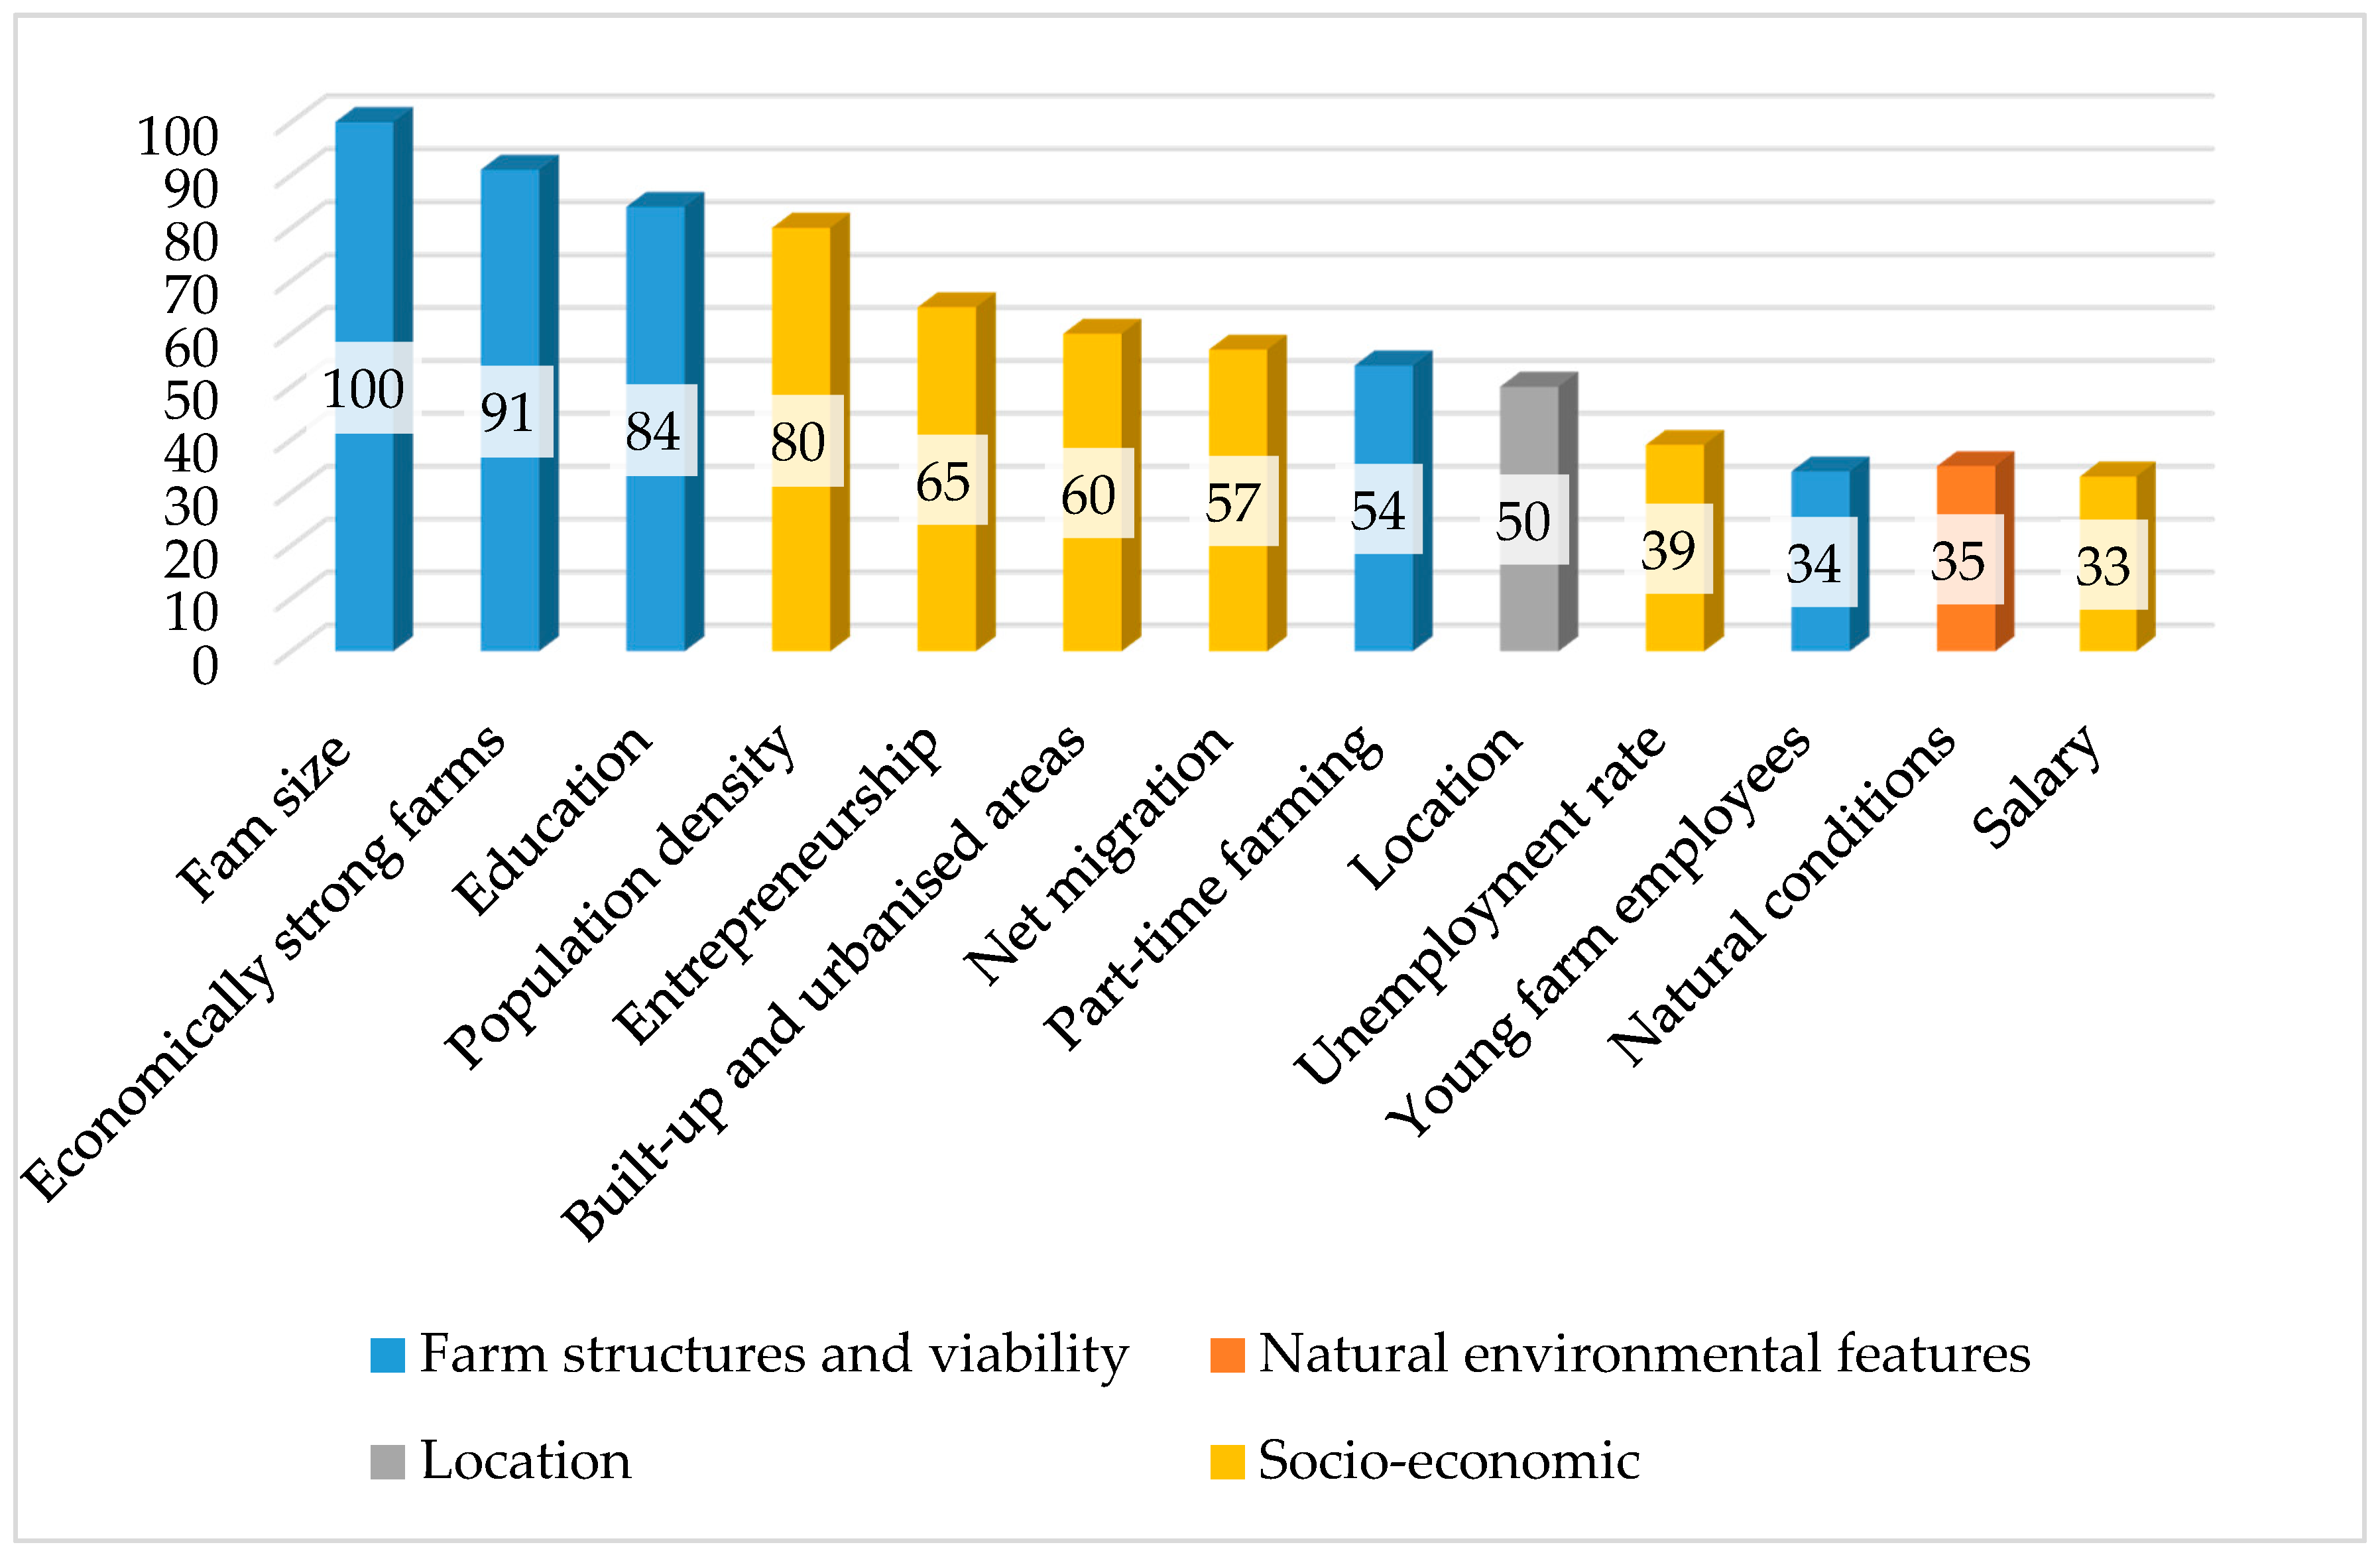
4.2. Drivers of Generational Changes
5. Discussion
6. Conclusions
Author Contributions
Funding
Acknowledgments
Conflicts of Interest
Appendix A


References
- Mougeot, L.J.A. Growing Better Cities: Urban Agriculture for Sustainable Development; International Development Research Centre: Ottawa, ON, Canada, 2006. [Google Scholar]
- Lovell, S.T. Multifunctional urban agriculture for sustainable land use planning in the United States. Sustainability 2010, 2, 2499–2522. [Google Scholar] [CrossRef]
- Specht, K.; Weith, T.; Swoboda, K.; Siebert, R. Socially acceptable urban agriculture businesses. Agron. Sustain. Dev. 2016, 36, 17. [Google Scholar] [CrossRef]
- Sroka, W. Perception of Benefits of Urban and Peri-Urban Agriculture—A Study in Polish Metropolitan Areas. Rocz. Nauk. Stowarzyszenia Ekon. Rol. Agrobiz. 2018, XX, 236–242. [Google Scholar] [CrossRef]
- Cavicchioli, D.; Bertoni, D.; Frisio, D.G.; Pretolani, R. Does the future of a farm depend on its neighbourhood? Evidence on intra-family succession among fruit and vegetable farms in Italy. Agric. Food Econ. 2019, 7, 10. [Google Scholar] [CrossRef]
- Dudek, M. A matter of family? An analysis of determinants of farm succession in Polish agriculture. Stud. Agric. Econ. 2016, 118, 61–67. [Google Scholar] [CrossRef]
- Gasson, R.; Errington, A. The Family Farm Business; CAB International: Wallingford, CT, USA, 1993. [Google Scholar]
- Burton, R.J.F.; Fischer, H. The succession crisis in European agriculture. Sociol. Rural. 2015, 55, 155–166. [Google Scholar] [CrossRef]
- Wojewodzic, T. Pozorna sukcesja—Zaburzenie cyklu życia gospodarstw rolniczych. Zesz. Nauk. Szkoły Głównej Gospod. Wiej. Warszawie. Ekon. Organ. Gospod. Żywnościowej 2013, 103, 141–152. [Google Scholar]
- Corsi, A. Family farm succession and specific knowledge in Italy. Riv. Econ. Agrar. 2009, 64, 13–30. [Google Scholar]
- European Commission. Generational Renewal in EU Agriculture: Statistical Background, EU Agricultural Economic Briefs, Brief No 6. Available online: https://ec.europa.eu/info/sites/info/files/food-farming-fisheries/farming/documents/agri-economics-brief-06_en.pdf (accessed on 14 September 2019).
- Zagata, L.; Sutherland, L.-A. Deconstructing the “young farmer problem”: Towards a research agenda. J. Rural Stud. 2015, 38, 39–51. [Google Scholar] [CrossRef]
- Agra CEAS Consulting 2003. Ex-Post Evaluation of Measures under Regulation (EC) No 950/97. In Final Report for the European Commission Directorate-General for Agriculture. 2003. Available online: https://ec.europa.eu/agriculture/sites/agriculture/files/evaluation/rural-development-reports/2003/951/full.pdf (accessed on 15 August 2019).
- Sroka, W.; Pölling, B.; Mergenthaler, M. City adjustments as the main factor of success of urban and peri-urban farms-empirical evidence from the Ruhr metropolis. NJAS-Wagening. J. Life Sci. 2019, 89. [Google Scholar] [CrossRef]
- Wojewodzic, T.; Sroka, W. Commercial Farms in Polish Metropolitan Areas: Changes in Production Factors. WieśRol. 2018, 4, 91–110. [Google Scholar] [CrossRef]
- Cavicchioli, D.; Bertoni, D.; Pretolani, R. Farm succession at a crossroads: The interaction among farm characteristics, labour market conditions, and gender and birth order effects. J. Rural Stud. 2018, 61, 73–83. [Google Scholar] [CrossRef]
- AldanondoOchoa, A.M.; Casanovas Oliva, V.; AlmanasaSaez, C. Explaining farm succession: An impact of farm location and off-farm employment opportunities. Span. J. Agric. Res. 2007, 5, 214–225. [Google Scholar] [CrossRef]
- Alasia, A.; Weersink, A.; Bollman, R.D.; Cranfield, J. Off-farm labour decision of Canadian farm operators: Urbanization effects and rural labour market linkages. J. Rural Stud. 2009, 25, 12–24. [Google Scholar] [CrossRef]
- Calus, M.; Van Huylenbroeck, G.; Van Lierde, D. The relationship between farm succession and farm assets on Belgian farms. Sociol. Rural. 2008, 48, 38–56. [Google Scholar] [CrossRef]
- Mishra, A.K.; El-Osta, H.S.; Shaik, S. Succession decisions in U.S. family farm business. J. Agric. Resour. Econ. 2010, 35, 133–152. [Google Scholar] [CrossRef]
- Lobley, M.; Baker, J.R. Succession and retirement in family farm business. In Keeping it in the Family. International Perspectives on Succession and Retirement on Family Farms; Lobley, M., Baker, J.R., Whitehead, I., Eds.; Ashgate Publishing Company: Farnham, UK, 2012; pp. 49–64. [Google Scholar]
- Zegar, J.S. Kwestia Agrarna w Polsce; IERiGŻ-PIB: Warszawa, Poland, 2018. [Google Scholar]
- Woś, A. Mechanizmy Restrukturyzacji Rolnictwa; Komunikaty Raport Ekspertyzy 449; IERiGŻ: Warszawa, Poland, 1999. [Google Scholar]
- Whitehead, I.; Lobley, M.; Baker, J.R. From generation to generation: Drawing the threads together. In Keeping it in the Family. International Perspectives on Succession and Retirement on Family Farms; Lobley, M., Baker, J.R., Whitehead, I., Eds.; Ashgate Publishing Company: Farnham, UK, 2012; pp. 211–240. [Google Scholar]
- Glauben, T.; Petrick, M.; Tietje, H.; Weiss, C. Probability and timing of succession or closure in family firms: A switching regression analysis of farm households in Germany. Appl. Econ. 2009, 41, 45–54. [Google Scholar] [CrossRef]
- Dudek, M. Sukcesja Indywidualnych Gospodarstw Rolnych Jako Czynnik Przeobrażeń Strukturalnych w Polskim Rolnictwie; Studia i Monografie No. 170; IERiGŻ-PIB: Warszawa, Poland, 2016. [Google Scholar]
- Fischer, H.; Burton, R.J.F. Understanding farm succession as socially constructed endogenous cycles. Sociol. Rural. 2014, 54, 417–436. [Google Scholar] [CrossRef]
- Viira, A.-H.; Poder, A.; Varnik, R. Discrepancies between the intentions and Behaviour of farm operators in the context of farm growth, decline, continuation and exit-evidence from Estonia. Ger. J. Agric. Econ. 2014, 63, 46–62. [Google Scholar] [CrossRef]
- Bertoni, D.; Cavicchioli, D. Farm succession, occupational choice and farm adaptation at the rural-urban interface: The case of Italian horticultural farms. Land Use Policy 2016, 57, 739–748. [Google Scholar] [CrossRef]
- Glauben, T.; Tietje, T.; Weiss, C.R. Intergenerational succession in farm households: Evidence from Upper Austria. Rev. Econ. Househ. 2004, 2, 443–462. [Google Scholar] [CrossRef]
- Wierzbicka, W. Czynniki lokalizacji przedsiębiorstw w warunkach zmienności otoczenia. Zesz. Nauk. Uniw. Przyr.-Humanist. Siedlcach Ser. Adm. Zarządzanie 2015, 33, 239–250. [Google Scholar]
- Inwood, S.M.; Sharp, J.S. Farm persistence and adaptation at the rural-urban interface: Succession and farm adjustment. J. Rural Stud. 2012, 28, 107–117. [Google Scholar] [CrossRef]
- Smętkowski, M. The Metropolisation Process on Different Territorial Scales: Focus on Capital City Regions in Central and Eastern European Countries; GRINCOH Working Paper Series, Paper No. 6.06, 2014. Available online: http://www.grincoh.eu/media/serie_6_spaces__territories_and_regions/grincoh_wp6.06_smetkowski.pdf (accessed on 14 September 2019).
- Chmieliński, P. Labour markets for rural population: Commuting and migration abroad. Econ. Agric. 2013, 60, 511–521. [Google Scholar] [CrossRef]
- Piorr, A.; Ravetz, J.; Tosics, I. Peri-Urbanisation in Europe: Towards European Policies to Sustain Urban-Rural Futures; Forest & Landscape; University of Copenhagen: Copenhagen, Denmark, 2011. [Google Scholar]
- Olper, A.; Raimondi, V.; Cavicchioli, D.; Vigani, M. Do CAP payments reduce farm labour migration? A panel data analysis across EU regions. Eur. Rev. Agric. Econ. 2014, 41, 843–873. [Google Scholar] [CrossRef]
- Satoła, L.; Wojewodzic, T.; Sroka, W. Barriers to exit encountered by small farms in light of the theory of new institutional economics. Agric. Econ. 2018, 64, 277–290. [Google Scholar] [CrossRef]
- Gradinaru, S.R.; Ioja, C.I.; Onose, D.A.; Gavrilidis, A.A.; Patru-Stupariu, I.; Kienast, F.; Hersperger, A.M. Land abandonment as a precursor of built-up development at the sprawling periphery of former socialist cities. Ecol. Indic. 2015, 57, 305–313. [Google Scholar] [CrossRef]
- Zasada, I. Multifunctional peri-urban agriculture—A review of societal demands and the provision of goods and services by farming. Land Use Policy 2011, 28, 639–648. [Google Scholar] [CrossRef]
- Pölling, B.; Mergenthaler, M.; Lorleberg, W. Professional urban agriculture and its characteristic business models in Metropolis Ruhr, Germany. Land Use Policy 2016, 58, 366–379. [Google Scholar] [CrossRef]
- Lohrberg, F.; Licka, L.; Scazzosi, L.; Timpe, A. Urban Agriculture Europe; JOVIS Verlag GmbH: Berlin, Germany, 2015. [Google Scholar]
- Wästfelt, A.; Zhang, Q. Reclaiming localisation for revitalising agriculture: A case study of peri-urban agricultural change in Gothenburg, Sweden. J. Rural Stud. 2016, 47, 172–185. [Google Scholar] [CrossRef]
- Pölling, B.; Sroka, W.; Mergenthaler, M. Success of urban farming’s city-adjustments and business models—Findings from a survey among farmers in Ruhr Metropolis, Germany. Land Use Policy 2017, 69, 372–385. [Google Scholar] [CrossRef]
- Klank, L. Sukcesja Gospodarstw Rolnych w Polsce; IRWiR PAN: Warszawa, Poland, 2006. [Google Scholar]
- Sroka, W.; Mikolajczyk, J.; Wojewodzic, T.; Kwoczyńska, B. Agricultural land vs. urbanisation in chosen Polish Metropolitan areas: A spatial analysis based on regression trees. Sustainability 2018, 10. [Google Scholar] [CrossRef]
- Bański, J. Changes in agricultural land ownership in Poland in the period of the market economy. Agric. Econ. 2011, 57, 93–101. [Google Scholar] [CrossRef]
- Ministerstwo Rozwoju Regionalnego. KoncepcjaPrzestrzennego Zagospodarowania Kraju 2030; Ministerstwo Rozwoju Regionalnego: Warszawa, Poland, 2011.
- European Commission. Direct Payments. The Young Farmer Payment under Pillar I of the Common Agricultural Policy. Available online: https://ec.europa.eu/agriculture/sites/agriculture/files/direct-support/direct-payments/docs/young-farmer-payment_en.pdf (accessed on 14 September 2019).
- Adamowicz, M.; Szepeluk, A. Wsparcie młodych rolników jako element polityki rolnej Unii Europejskiej. ZagadnieniaEkon. Rolnej 2016, 3, 106–128. [Google Scholar] [CrossRef][Green Version]
- Pięta, P. Farmer’s Pensions as an Instrument of Changing the Agrarian Structure in Poland. Socioecon. Chall. 2018, 2, 60–65. [Google Scholar] [CrossRef]
- Witek, T. Waloryzacja Rolniczej Przestrzeni Produkcyjnej Polski Według Gmin; IUNG: Puławy, Poland, 1994. [Google Scholar]
- Mazzocchi, C.; Sali, G.; Corsi, S. Land use conversion in metropolitan areas and the permanence of agriculture: Sensitivity Index of Agricultural Land (SIAL), a tool for territorial analysis. Land Use Policy 2013, 35, 155–162. [Google Scholar] [CrossRef]
- Suess-Reyes, J.; Fuetsch, E. The future of family farming: A literature review on innovative, sustainable and succession-oriented strategies. J. Rural Stud. 2016, 47, 117–140. [Google Scholar] [CrossRef]
- Cavicchioli, D.; Bertoni, D.; Tesser, F.; Frisio, D.G. What factors encourage intrafamily farm succession in mountain areas? Mt. Res. Dev. 2015, 35, 152–160. [Google Scholar] [CrossRef]
- Diogo, V.; Koomen, E.; Kuhlman, T. An economic theory-based explanatory model of agricultural land-use patterns: The Netherlands as a case study. Agric. Syst. 2015, 139, 1–16. [Google Scholar] [CrossRef]
- Łapczyński, M. Drzewa Klasyfikacyjne i Regresyjne w Badaniach Marketingowych; Wydawnictwo Uniwersytetu Ekonomicznego w Krakowie: Kraków, Poland, 2010. [Google Scholar]
- Sroka, W.; Dacko, M. Ocena czynników rozwoju przodujących gospodarstw rolniczych z wykorzystaniem metody drzew regresyjnych typu C&RT. ZagadnieniaEkon. Rolnej 2010, 2, 100–112. [Google Scholar]
- Breiman, L.; Friedman, J.H.; Olshen, R.A.; Stone, C.J. Classification and Regression Trees; Wadsworth & Brooks: Monterey, CA, USA, 1984. [Google Scholar]
- Jarosik, V. CART and related methods. In Encyclopedia of Biological Invasions; Simberlo, D., Rejmánek, M., Eds.; University of California Press: Berkeley, CA, USA, 2011; pp. 104–108. [Google Scholar]
- Ives, C.D.; Kendal, D. Values and attitudes of the urban public towards peri-urban agricultural land. Land Use Policy 2013, 34, 80–90. [Google Scholar] [CrossRef]
- Sroka, W. Struktura oraz intensywność użytkowania gruntów rolnych w miastach i na obszarach podmiejskich. Rocz. Stowarzyszenia Ekon. Rol. Agrobiz. 2014, XVI, 449–455. [Google Scholar]
- Czyżewski, A.; Gronowski, B.; Matuszczak, A. Gminy wiejskie i rolnictwo w aglomeracji poznańskiej po 2004 r. Probl. Drob. Gospod. Rol. 2017, 4, 49–61. [Google Scholar] [CrossRef]
- Williams, F.; Farrington, J. Succession and the future of farming: Problem or perception. In Conference on the Rural Citizen: Governance, Culture and Wellbeing in the 21st Century; University of Plymouth: Plymouth, UK, 2006; pp. 1–7. [Google Scholar]
- Brandth, B.; Overrein, G. Resourcing children in a changing rural context: Fathering and farm succession in two generations of farmers. Sociol. Rural. 2013, 53, 95–111. [Google Scholar] [CrossRef]
- Zasada, I.; Loibl, W.; Köstl, M.; Piorr, A. Agriculture under human influence: A spatial analysis of farming systems and land use in European rural-urban-regions. Eur. Countrys. 2013, 5, 71–88. [Google Scholar] [CrossRef]
- Vinogradovs, I.; Nikodemus, O.; Elferts, D.; Brumelis, G. Assessment of site-specific drivers of farmland abandonment in mosaic-type landscapes: A case study in Vidzeme, Latvia. Agric. Ecosyst. Environ. 2018, 253, 113–121. [Google Scholar] [CrossRef]
- Paül, V.; Tonts, M. Containing urban sprawl: Trends in land use and spatial planning in the metropolitan region of Barcelona. J. Environ. Plan. Manag. 2005, 48, 7–35. [Google Scholar] [CrossRef]
- Zasada, I.; Fertner, C.; Piorr, A.; Nielsen, T.S. Peri-urbanisation and multifunctional adaptation of agriculture around Copenhagen. Geogr. Tidsskr.-Dan. J. Geogr. 2011, 111, 59–72. [Google Scholar] [CrossRef]
- Sroka, W.; Wąs, A.; Pölling, B. Development Strategies of Urban Farms in Developed Countries on the Example of Ruhr Metropolis (Germany) and Upper Silesia Metropolis (Poland). Probl. Agric. Econ. 2016, 3, 65–88. [Google Scholar]
- Kerbler, B. Factors affecting farm succession: The case of Slovenia. Agric. Econ. 2012, 58, 285–298. [Google Scholar] [CrossRef]
- Alonso, W. Location and Land Use; Harvard University Press: Cambridge, MA, USA, 1964. [Google Scholar]
- Deng, X.; Huang, J.; Rozelle, S.; Zhang, J.; Li, Z. Impact of urbanization on cultivated land changes in China. Land Use Policy 2015, 45, 1–7. [Google Scholar] [CrossRef]
- Bika, Z. The territorial impact of the farmers’ early retirement scheme. Sociol. Rural. 2007, 47, 246–272. [Google Scholar] [CrossRef]
- Chaplin, H.; Davidova, S.; Gorton, M. Agricultural adjustment and the diversification of farm households and corporate farms in Central Europe. J. Rural Stud. 2004, 20, 61–77. [Google Scholar] [CrossRef]


| Specification | Areas Studied | MA’s City Cores * | Poland Overall ** | ||
|---|---|---|---|---|---|
| BCCMA | ToPMA | OMA | |||
| Net migration per 10,000 population–average for 2007–2017 (person) | 237.6 | 19.9 | −35.2 | 10.5 | 0.17 |
| Average population density for the period 2007–2017; (inhabitants/km2) | 192.6 | 112.3 | 90.9 | 2474.7 | 122.7 |
| Share of built-up areas in the total area–average for 2012–2014 (%) | 8.0 | 5.2 | 4.3 | 46.0 | 5.3 |
| Average monthly gross salary in the years 2007-2017 (Euro ***) | 3400 | 3254 | 3049 | 4209 | 3726 |
| Economic entities including natural persons–average for 2007–2017 (entities/10 thousand population) | 1128 | 949 | 791 | 1843 | 1039 |
| Unemployment rate in the years 2007–2017 (%) | 9.0 | 11.5 | 14.5 | 4.8 | 10.9 |
| The Number of Beneficiaries in the Study Area | Values of the Characteristics | Correlation Coefficient | |||
|---|---|---|---|---|---|
| Mean | Coefficient of Variation (%) | I-1 | I-2 | I-3 | |
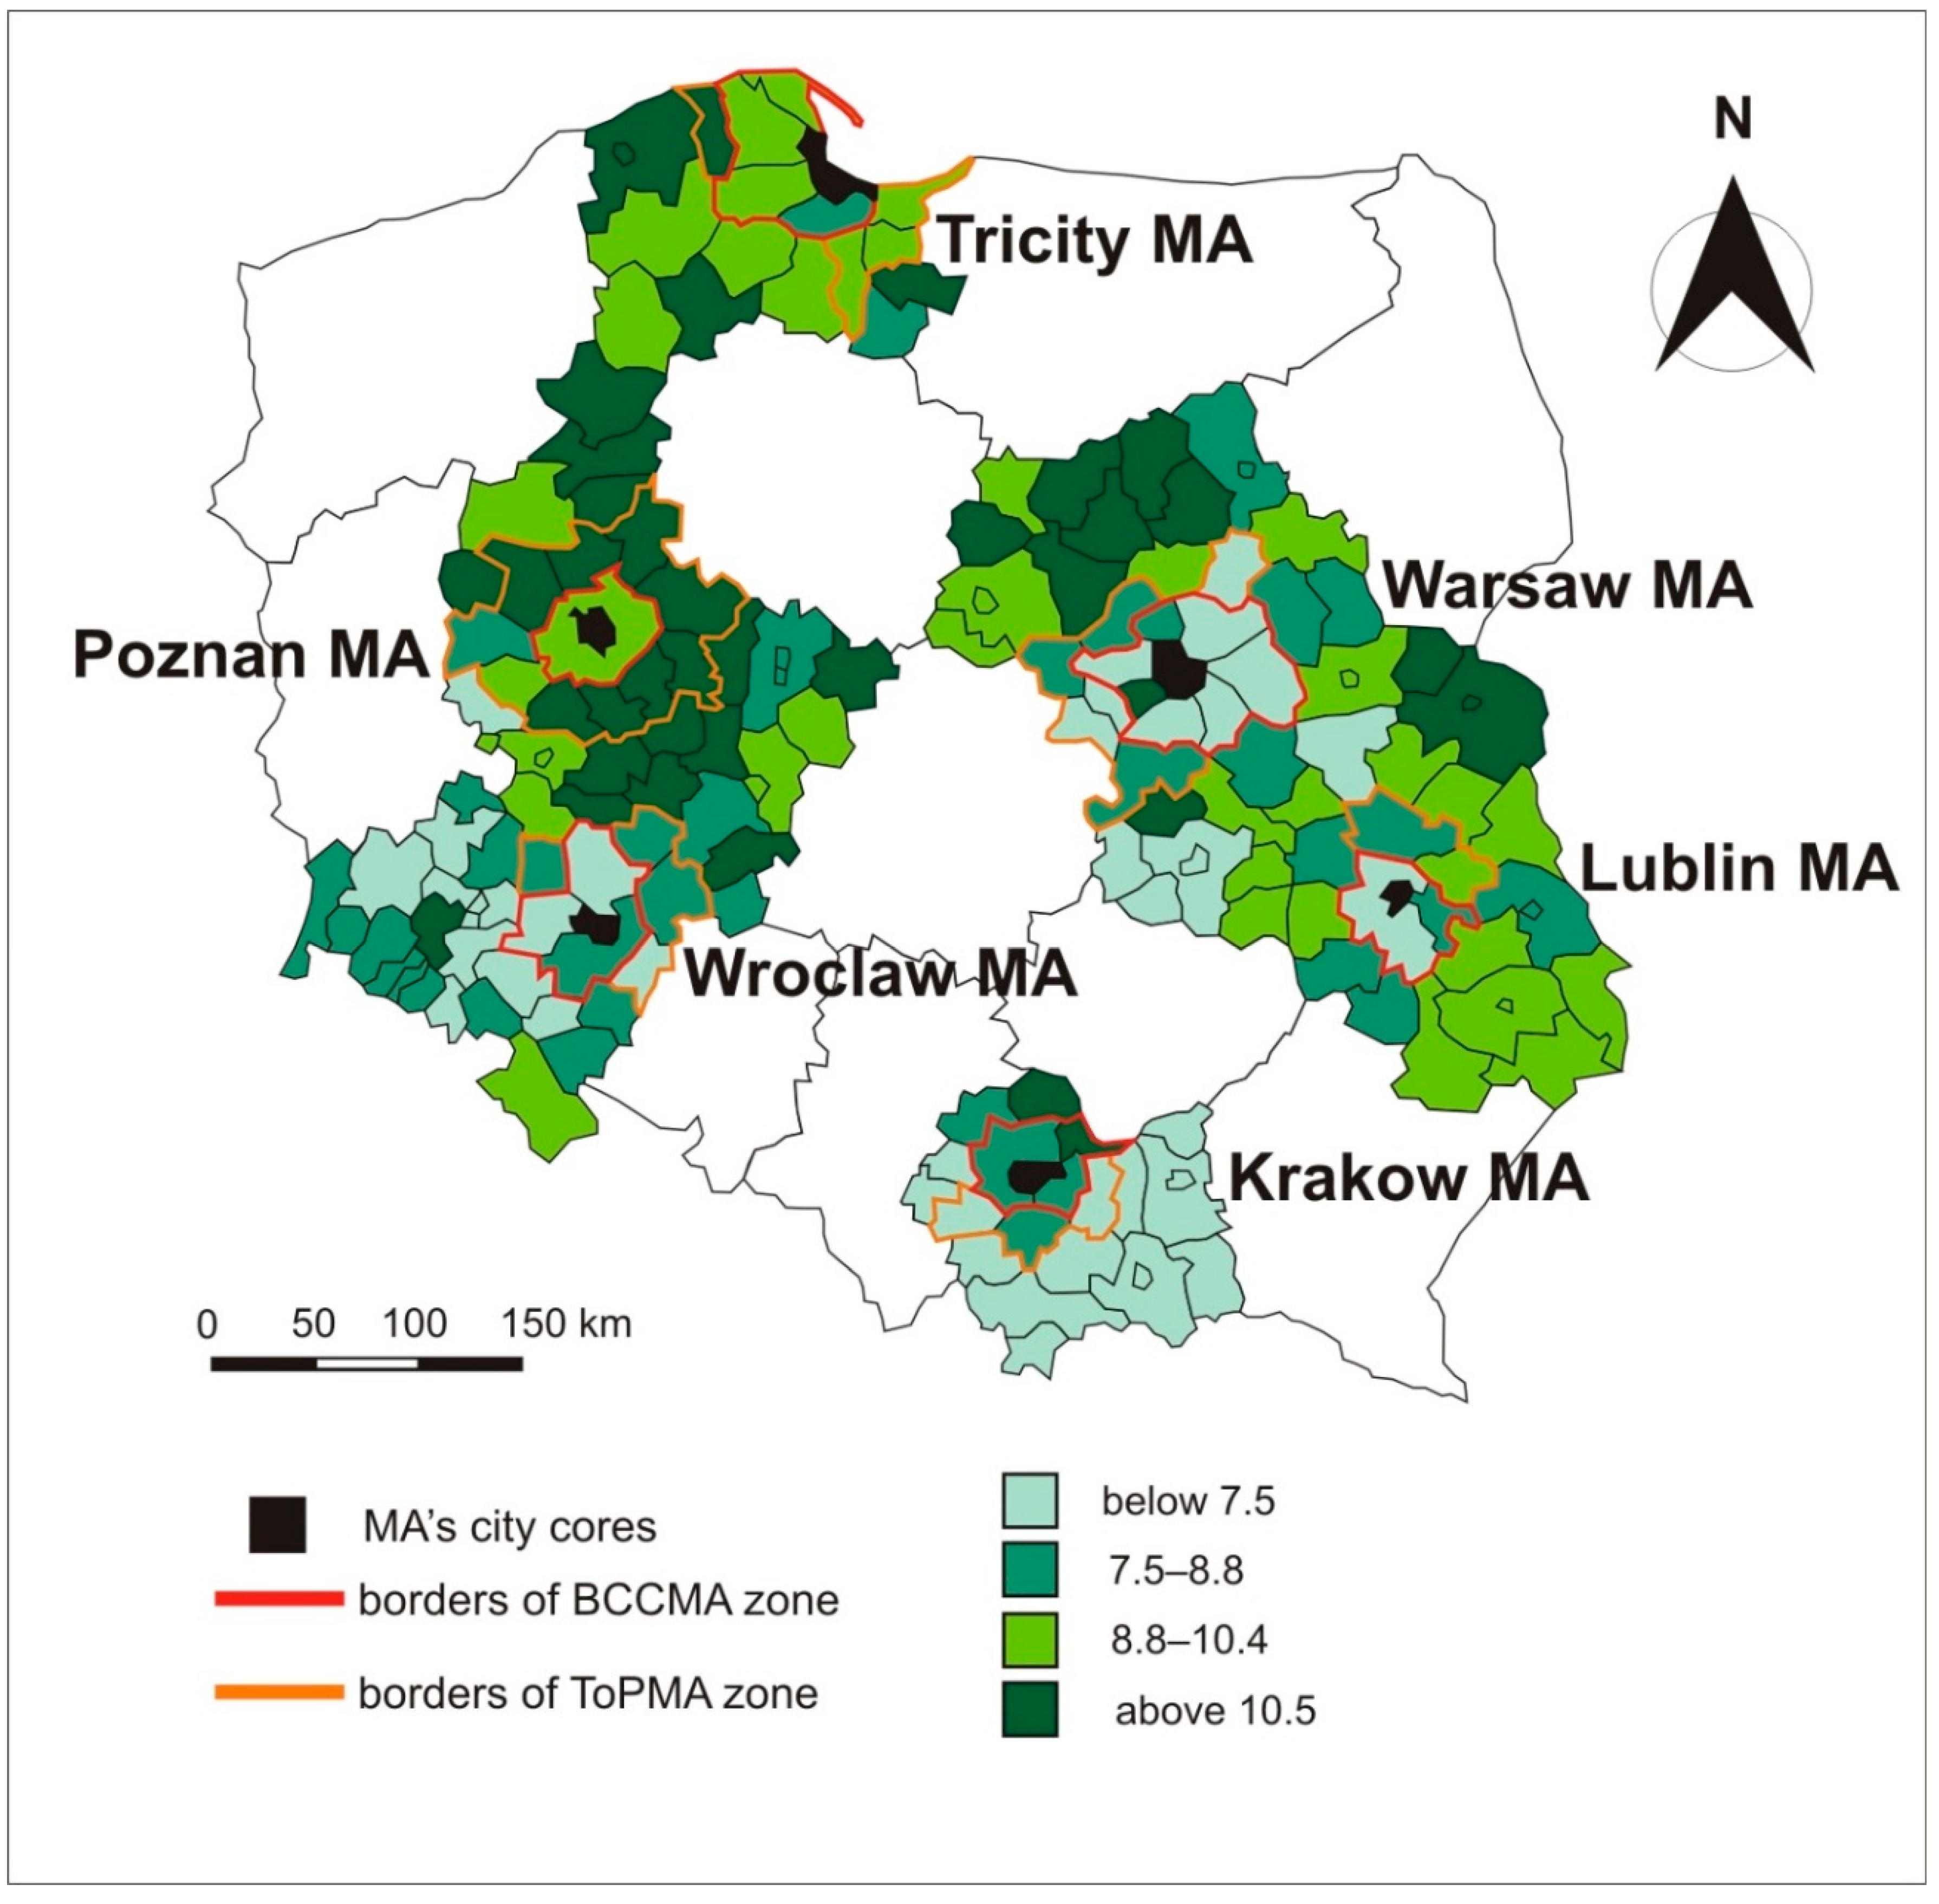
| I-1—Number of beneficiaries of the “Young Farmer Payment” per 1000 farms benefiting from direct payments (average for 2015–2017) (Young farmer–CAP Pillar I) | 9.1 | 23.9 | 1.00 | - | - |
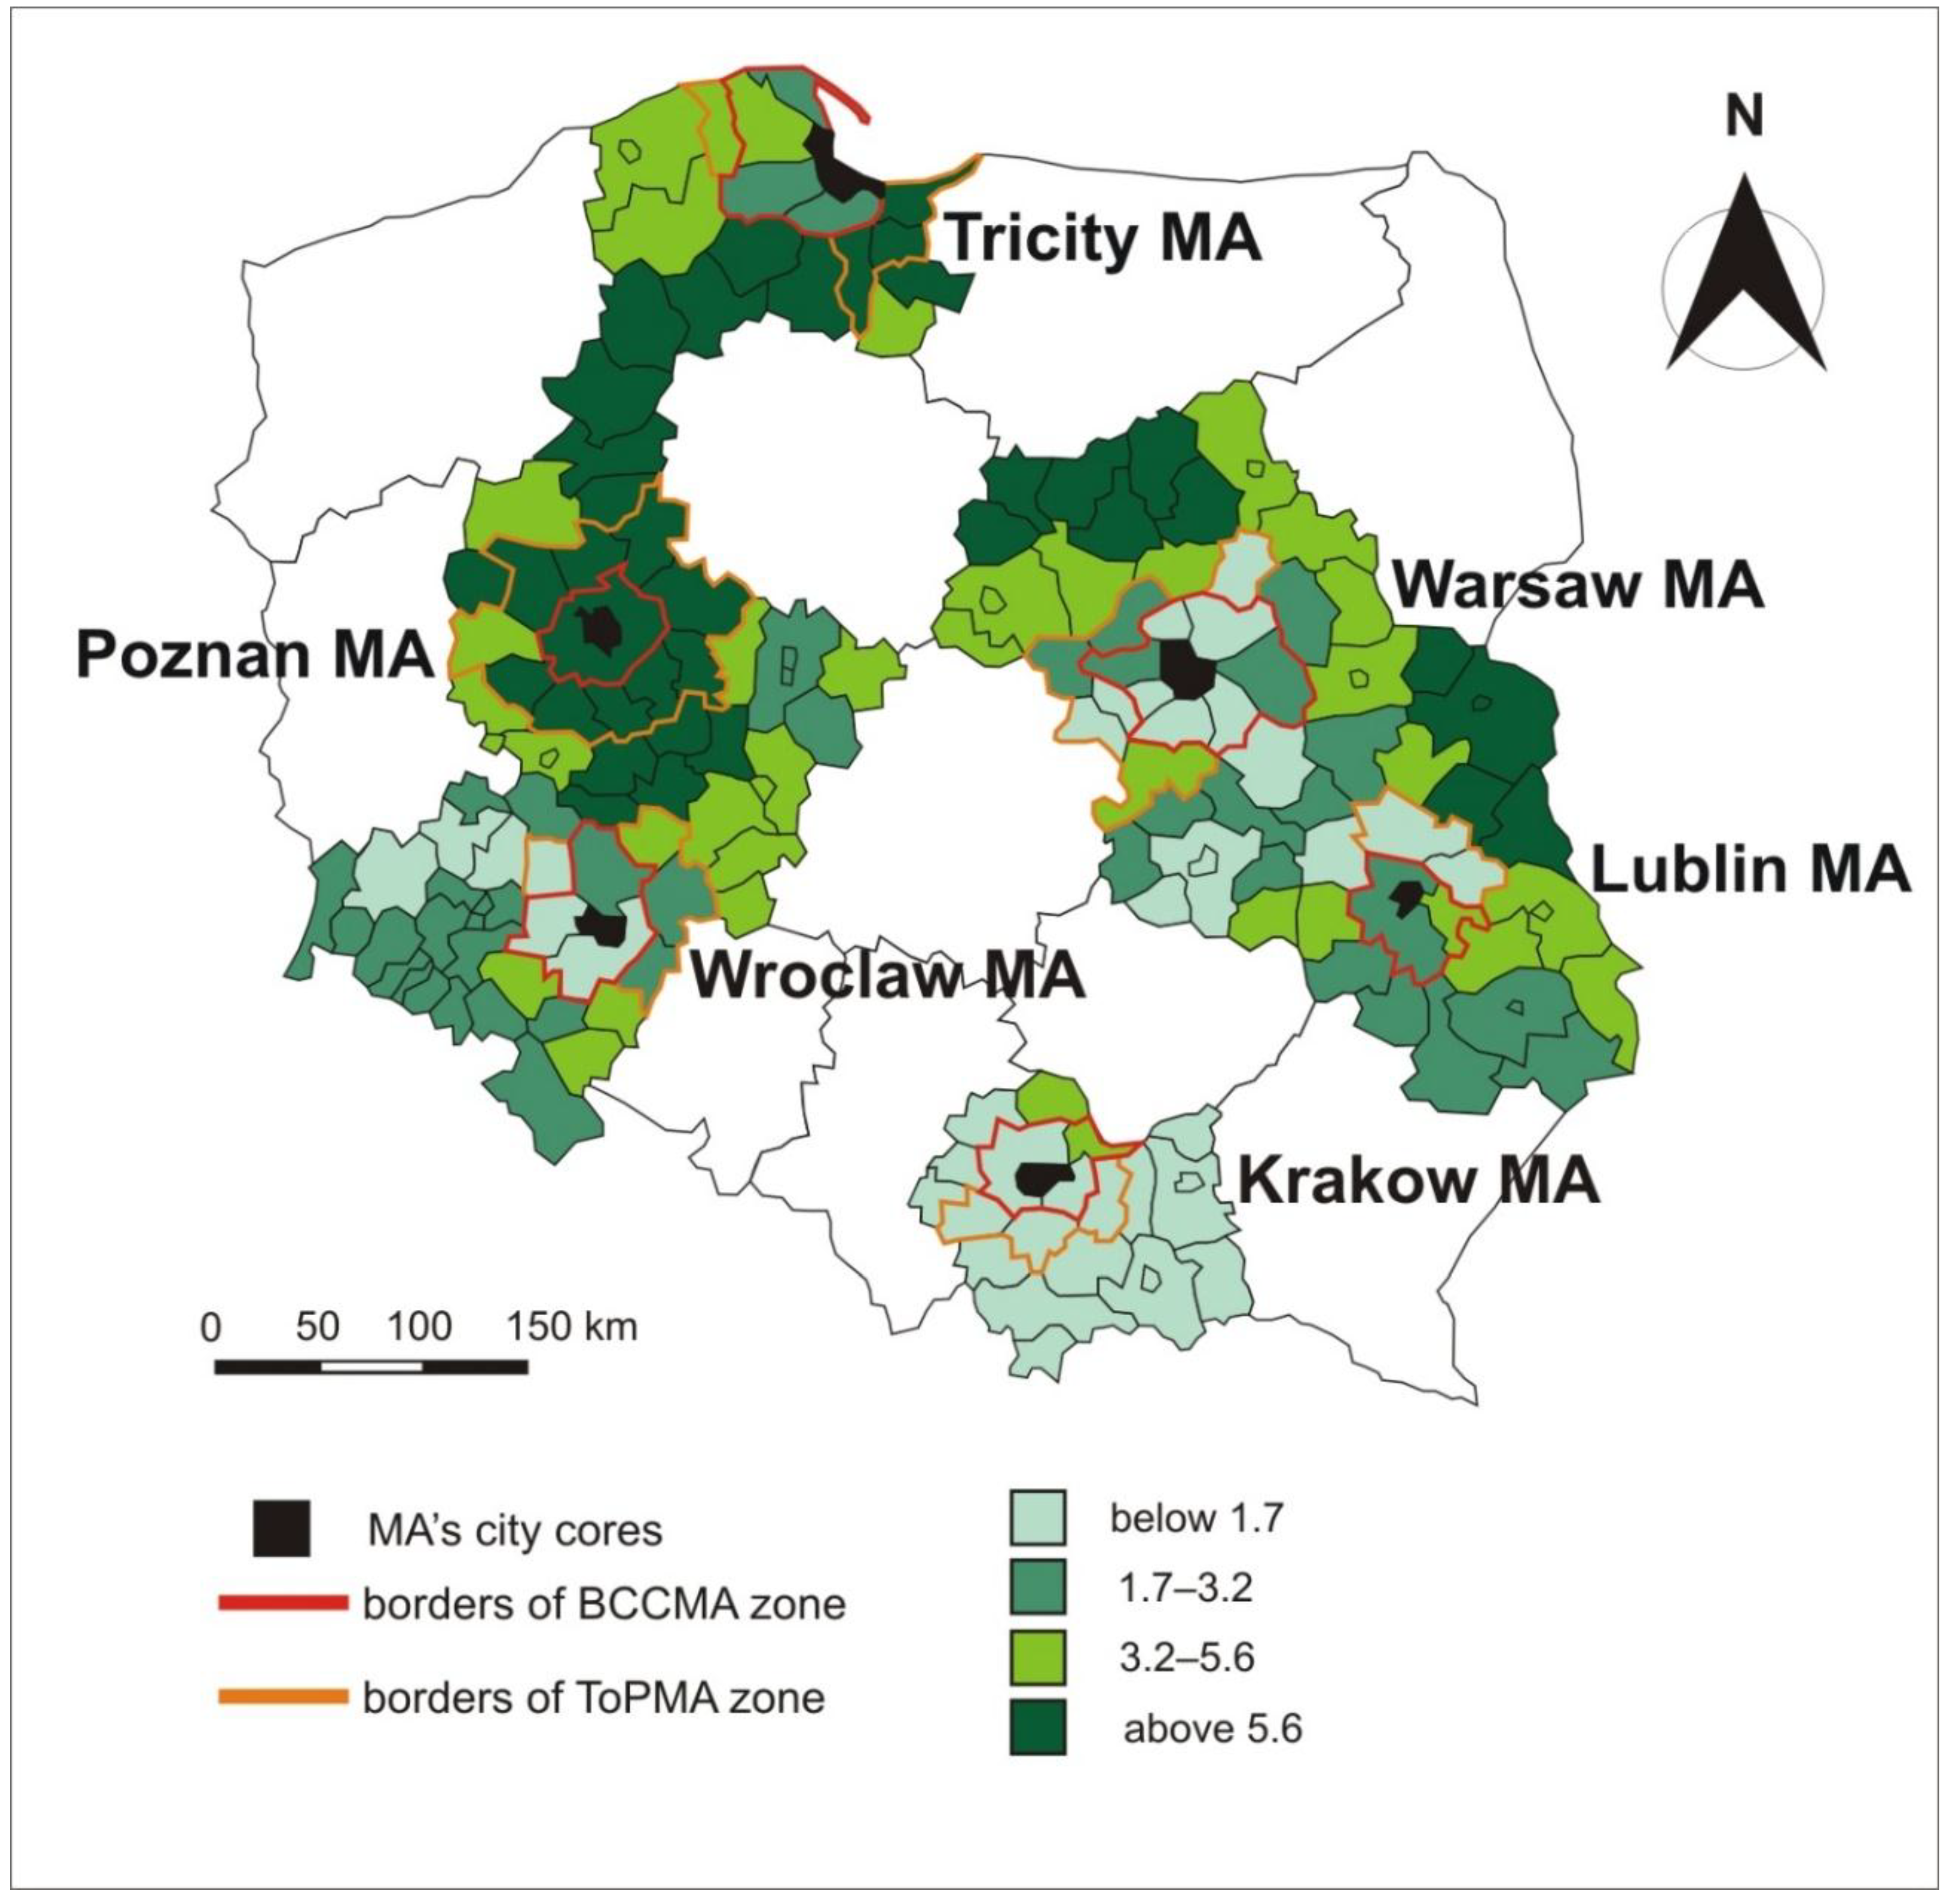
| I-2—Number of beneficiaries of the“Setting up of young farmers” grantsper 1000 farms benefiting from direct payments (average for 2007–2017) (Young farmer–CAP Pillar II) | 3.9 | 74.2 | 0.82 * | 1.00 | - |
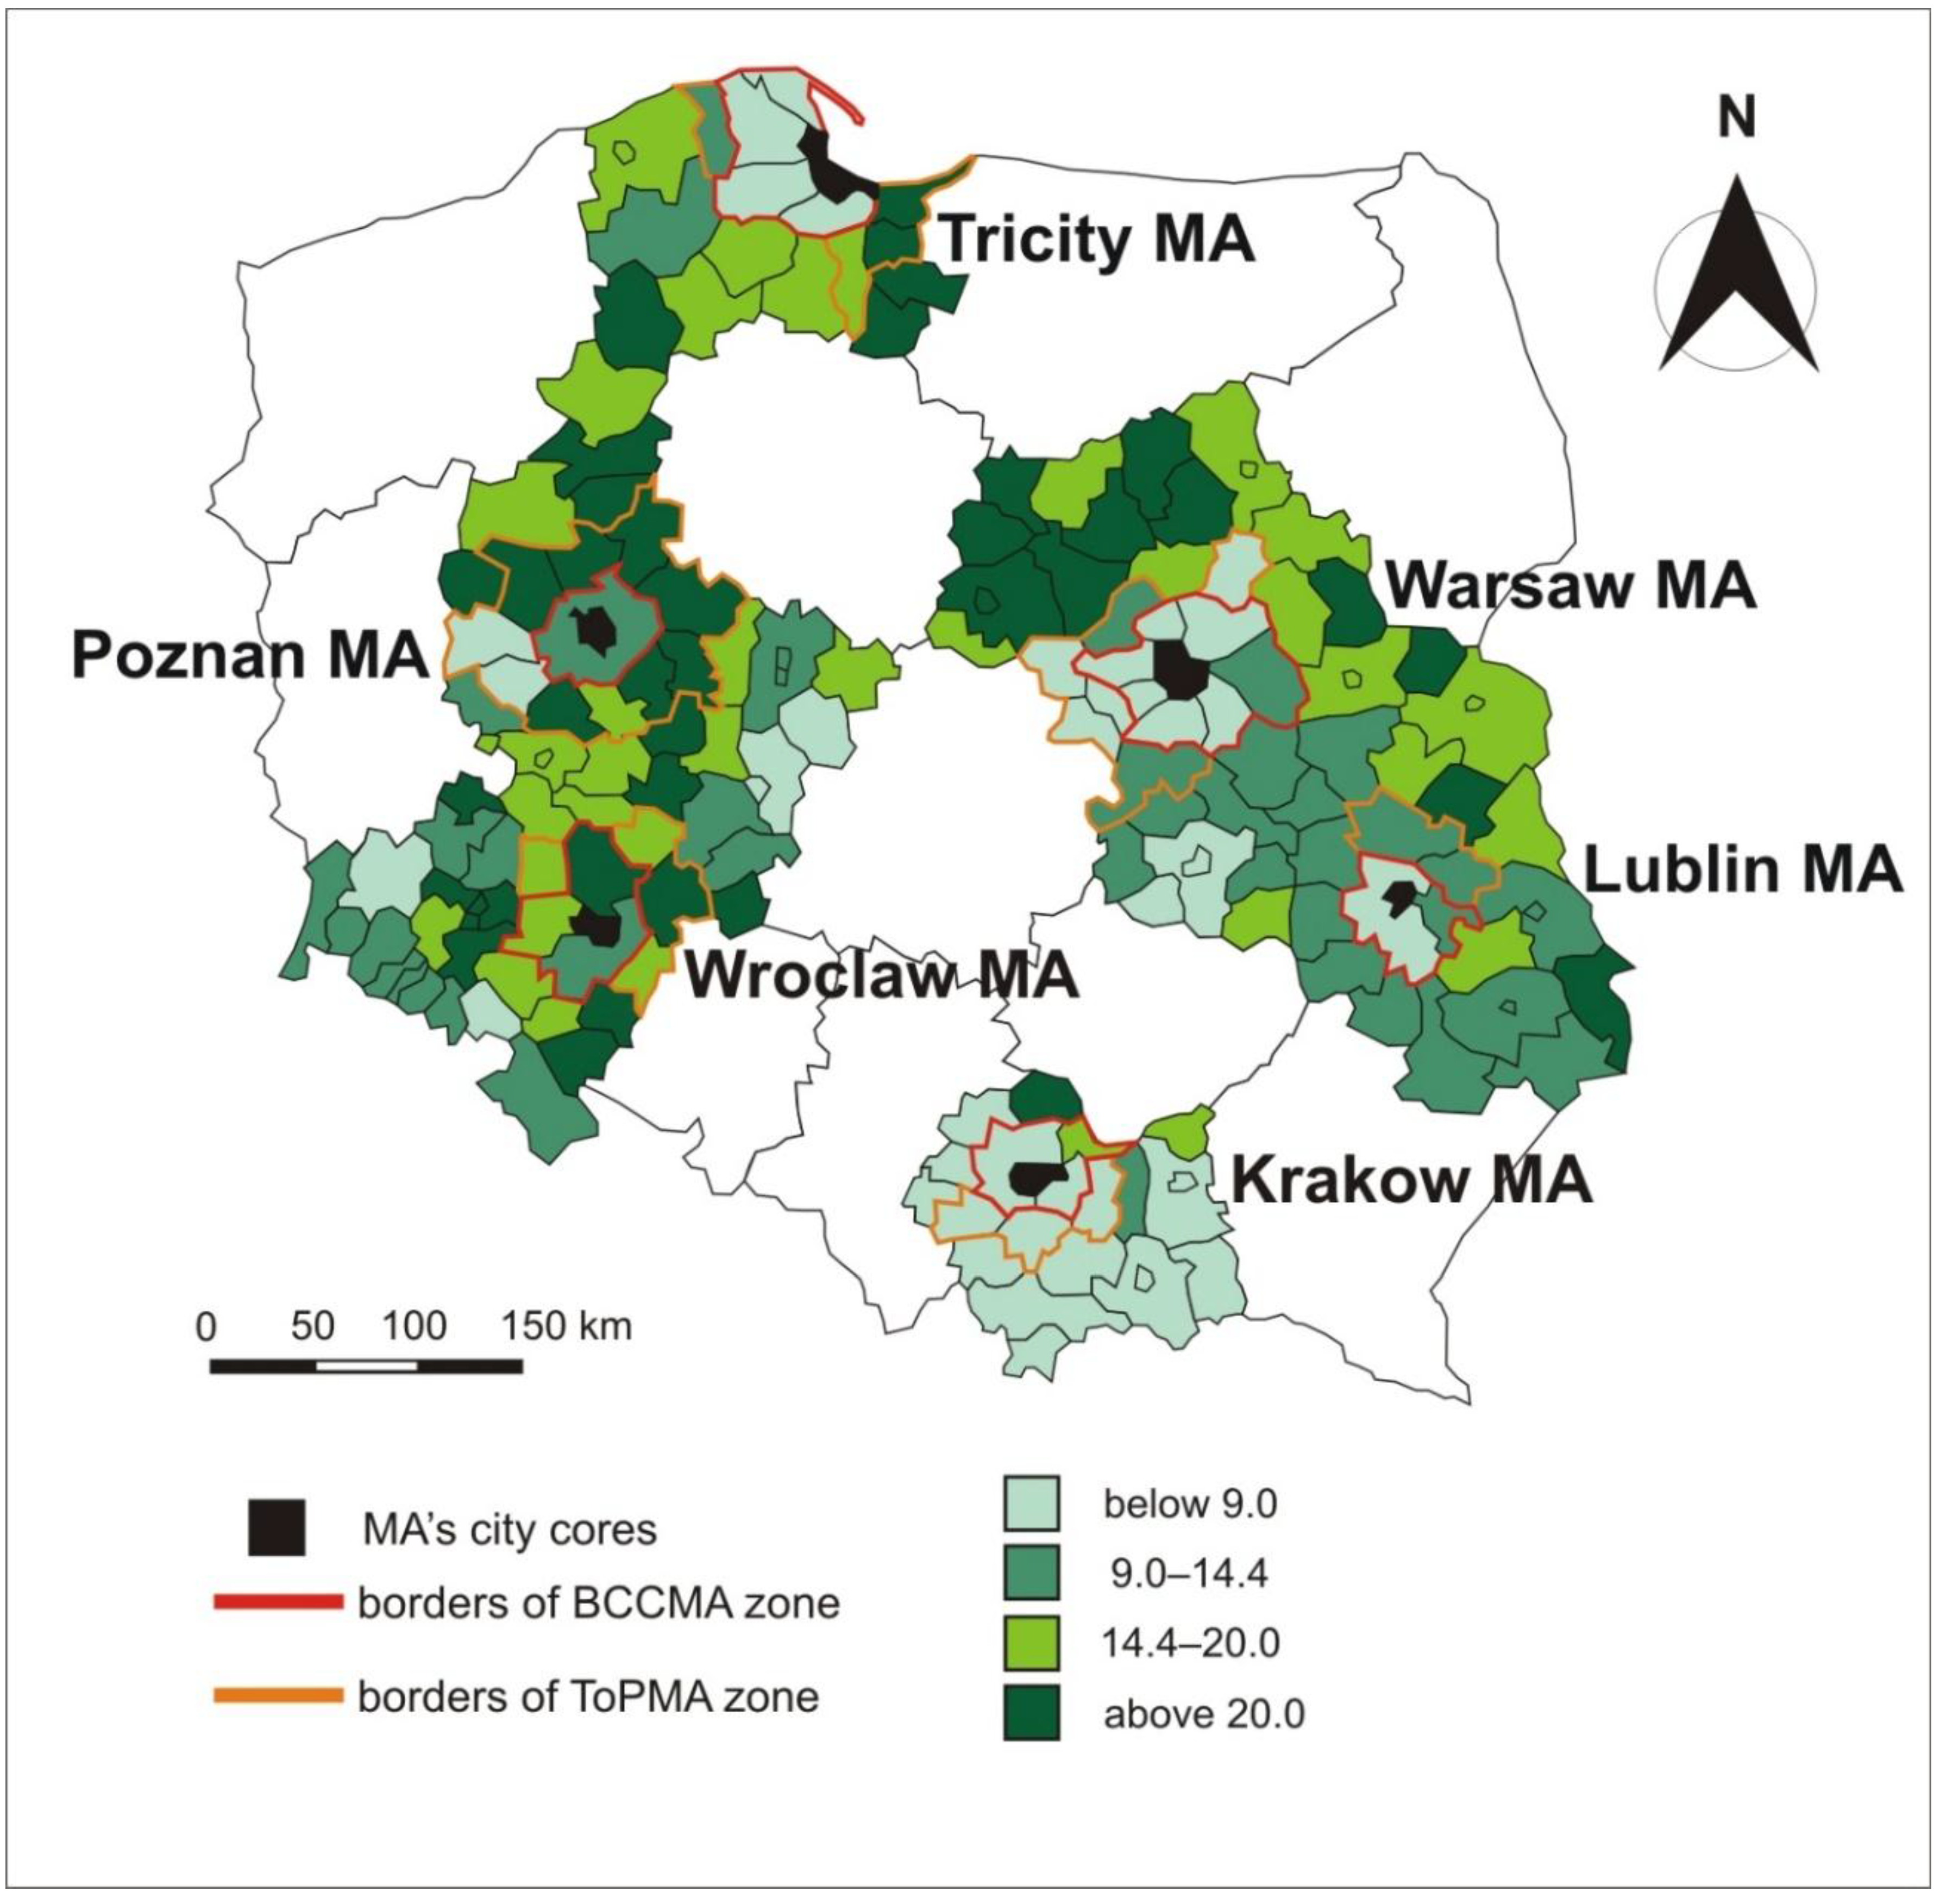
| I-3—Number of beneficiaries of “Early retirement” grant per 1000 beneficiaries of direct payments (average for 2007–2010) (Early retirement–CAP Pillar II) | 14.5 | 50.3 | 0.53 * | 0.72 * | 1.00 |
| Factors | Name of Variable | Definition of Variable and Unit | Range of Variation/Size in the Study Area | Source |
|---|---|---|---|---|
| Socio-economic factors | Salary | Average monthly gross salary in the years 2007–2017 (Euro *) | AV = 729.4, Min = 542.2, Max = 1484.9 | LDB Poland |
| Unemployment rate | Average unemployment rate in the years 2007–2017 (%) | AV = 13.2, Min = 3.2, Max = 33.5 | LDB Poland | |
| Entrepreneurship | Economic entities including natural persons—average for 2007–2017 (entities/10 thousand population) | AV = 867.2, Min = 434.0, Max = 1635.5 | LDB Poland | |
| Net migration | Net migration per 10,000 population—average for 2007–2017 (person) | AV = 12.2, Min = −156.6, Max = 571.0 | LDB Poland | |
| Population density | Population density—average for 2007–2017; (inhabitants/km2) | AV = 108.8, Min = 31.4, Max = 644.1 | LDB Poland | |
| Built-up and urbanized areas | Share of built-up areas in the total area—average for 2012–2014) (%) | AV = 5.0, Min = 2.2, Max = 23.9 | LDB Poland | |
| Farm structures and viability | Farm size | Average size of an agricultural farm receiving area payment in the years 2004–2006. (ha) | AV = 11.5, Min = 2.4, Max = 34.7 | ARMA |
| Young farm employees | Share of people aged 15–34 among those working on farms in 2010 (%) | AV = 30.7, Min = 22.4, Max = 38.5 | LDB Poland | |
| Economically strong farms | Share of farms with an economic size in excess of € 15,000 of Standard Output—2010 (%) | AV = 46.8, Min = 3.0, Max = 77.8 | LDB Poland | |
| Part-time farmer | Share of farm users making a living mainly from an off-farm job in 2002 (%) | AV = 33.8, Min = 17.4, Max = 60.5 | LDB Poland | |
| Education | Share of farmers with at least medium-level agricultural education in 2002 (%) | AV = 7.9, Min = 0.5, Max = 20.9 | LDB Poland | |
| Natural environmental features | Natural conditions | Soil conditions, agro-climate, relief and water conditions calculated on the basis of the Agricultural Production Space Valuation Ratio (APSVR) (points) | AV = 67.1, Min = 33.0, Max = 100.0 | [51] |
| Location | Location | (dummy variable: BCCMA, ToPMA, OMA) | –BCCMA–20 poviats ToPMA-29 poviats OMA-100 poviats | Own elaboration |
| Farms by Location | I-1—Young Farmer-CAP Pillar I | |||
|---|---|---|---|---|
| Mean | p-Values | |||
| BCCMA | ToPMA | OMA | ||
| BCCMA | 8.1 | |||
| ToPMA | 9.6 | 0.0190 * | ||
| OMA | 9.2 | 0.0358 * | 0.04210 | |
| SUM | 9.1 | Univariate ANOVA: 0.0458 * | ||
| Farms by Location | I-2—Young Farmer-CAP Pillar II | |||
|---|---|---|---|---|
| Mean | p-Values | |||
| BCCMA | ToPMA | OMA | ||
| BCCMA | 2.1 | |||
| ToPMA | 4.6 | 0.0029 * | ||
| OMA | 4.0 | 0.0085 * | 0.2881 | |
| SUM | 3.9 | Univariate ANOVA: 0.0001 * | ||
| Farms by Location | I-3—Early Retirement | |||
|---|---|---|---|---|
| Mean | p-Values | |||
| BCCMA | ToPMA | OMA | ||
| BCCMA | 7.7 | |||
| ToPMA | 15.6 | 0.0001 * | ||
| OMA | 15.5 | 0.0001 * | 0.9587 | |
| SUM | 14.5 | Univariate ANOVA: 0.0041 * | ||
© 2019 by the authors. Licensee MDPI, Basel, Switzerland. This article is an open access article distributed under the terms and conditions of the Creative Commons Attribution (CC BY) license (http://creativecommons.org/licenses/by/4.0/).
Share and Cite
Sroka, W.; Dudek, M.; Wojewodzic, T.; Król, K. Generational Changes in Agriculture: The Influence of Farm Characteristics and Socio-Economic Factors. Agriculture 2019, 9, 264. https://doi.org/10.3390/agriculture9120264
Sroka W, Dudek M, Wojewodzic T, Król K. Generational Changes in Agriculture: The Influence of Farm Characteristics and Socio-Economic Factors. Agriculture. 2019; 9(12):264. https://doi.org/10.3390/agriculture9120264
Chicago/Turabian StyleSroka, Wojciech, Michał Dudek, Tomasz Wojewodzic, and Karol Król. 2019. "Generational Changes in Agriculture: The Influence of Farm Characteristics and Socio-Economic Factors" Agriculture 9, no. 12: 264. https://doi.org/10.3390/agriculture9120264
APA StyleSroka, W., Dudek, M., Wojewodzic, T., & Król, K. (2019). Generational Changes in Agriculture: The Influence of Farm Characteristics and Socio-Economic Factors. Agriculture, 9(12), 264. https://doi.org/10.3390/agriculture9120264