Article

Durum Wheat Breeding: In the Heat of the Senegal River

1
International Center for the Agricultural Research in the Dry Areas (ICARDA), Rabat 10000, Morocco
2
Faculty of Science, University Mohammed V, Rabat 10100, Morocco
3
University Cheikh Anta Diop, Dakar 12500, Senegal
4
Institut Sénégalais de Recherches Agricoles (ISRA), Saint-Louis 46024, Senegal
5
Centre national de recherche agronomique et de développement agricole (CNARDA), Kaedi 40101, Mauritania
6
Sveriges lantbruksuniversitet (SLU), Institutionen för växtförädling (VF), Alnarp 23053, Sweden
*
Author to whom correspondence should be addressed.
Agriculture 2018, 8(7), 99; https://doi.org/10.3390/agriculture8070099
Submission received: 29 May 2018 / Revised: 22 June 2018 / Accepted: 26 June 2018 / Published: 2 July 2018
(This article belongs to the Special Issue Plant Breeding in Agriculture)

Abstract

:
Global warming may cause +4 °C temperature increases before the end of this century. Heat tolerant bred-germplasm remains the most promising method to ensure farm productivity under this scenario. A global set of 384 durum wheat accessions were exposed to very high temperatures occurring along the Senegal River at two sites for two years. The goal was to identify germplasm with enhanced tolerance to heat. There was significant variation for all traits. The genetic (G) effect accounted for >15% of the total variation, while the genotype by environment interaction (G × E) reached 25%. A selection index that combines G and a G × E wide adaptation index was used to identify stable high yielding germplasm. Forty-eight accessions had a stable grain yield above the average (2.7 t ha−1), with the three top lines above 3.5 t ha−1. Flowering time, spike fertility and harvest index were the most critical traits for heat tolerance, while 1000-kernel weight and spike density only had environment-specific effects. Testing of six subpopulations for grain yield across heat-prone sites revealed an even distribution among clusters, thus showing the potential of this panel for dissecting heat tolerance via association genetics.

1. Introduction

Global warming is expected to have a major impact in Africa, due to a serious reduction of water availability and a significant increase of temperatures [1]. Senegal, Mauritania and Mali are extremely famine-affected poor countries, with high scores in the Global Hunger Index [2], and a strong dependence on agriculture (including livestock). These West African countries share a fertile area along the Senegal River with of 375,000 ha of potential arable and irrigated land. Today, approximately 200,000 ha are intensively cultivated with double seasons of rice [3]. However, the cool season between middle of November to early March is not suitable for rice cultivation, and fields are mostly left at fallow. While Mauritania and Senegal are consumers of cuscus and other semolina products, which are obtained from durum wheat grains, the production of this crop is extremely limited in Mauritania and does not exist yet in Senegal. The durum wheat cultivars that are currently grown by the farmers in Mauritania are not well adapted to the extreme heat and dry conditions of the region, and the average yields are below 2 t ha−1. The deployment of high-yielding newly-bred cultivars with good adaptation, in combination with improved crop husbandry practices, has been identified as the best strategy to reduce famine and poverty in these countries [4]. As most of the farmers in the region depend on their fields to provide them with food, crop rotations can only be realistically practiced between staple crops. The introduction of high-yielding and adapted wheat cultivars would then provide an ideal complementation to rice [5]. This concept was also echoed by the Ministry of Agriculture of Senegal, who asked for international help to increase the amount of wheat grown along the Senegal River and for the release of high yielding cultivars well-adapted to this region [6]. The adaptability of a cultivar over a diverse environment is usually tested by the degree of its interaction with it [7]. The importance of genotype × environment (G × E) interactions in breeding programs occurs in many major crops, including wheat [8,9]. This interaction complicates the identification of superior genotypes for a range of environments and calls for the evaluation in multiple sites to determine their true genetic potential [10]. The additive main effect and multiplicative interaction (AMMI) model was developed specifically for analysis of G × E interaction in multi-environment trials [11] and it can be adapted to select for stability in durum wheat breeding programs [12,13].
Plant breeding programs should employ effectively core subsets that simultaneously contain elite cultivars, advance breeding lines and landraces [14] to generate adapted and high-yielding cultivars through hybridization and selection. The goal of the research-for-development undertaking presented herein was to search the suitability of deploying a durum wheat core subset under the high temperatures that occur along the Senegal River in both Mauritania and Senegal. In particular, the core panel used was described by Kabbaj et al. [15] at it includes landraces and modern lines collected from all the main durum wheat producing countries. The aim was to identify genetic variation as well as the top yielding germplasm for use in breeding, together with the identification of the most critical traits for adaptation to heat and pave the road to the identification of DNA marker-traits linkages for use in marker-aided selection (MAS).

2. Materials and Methods

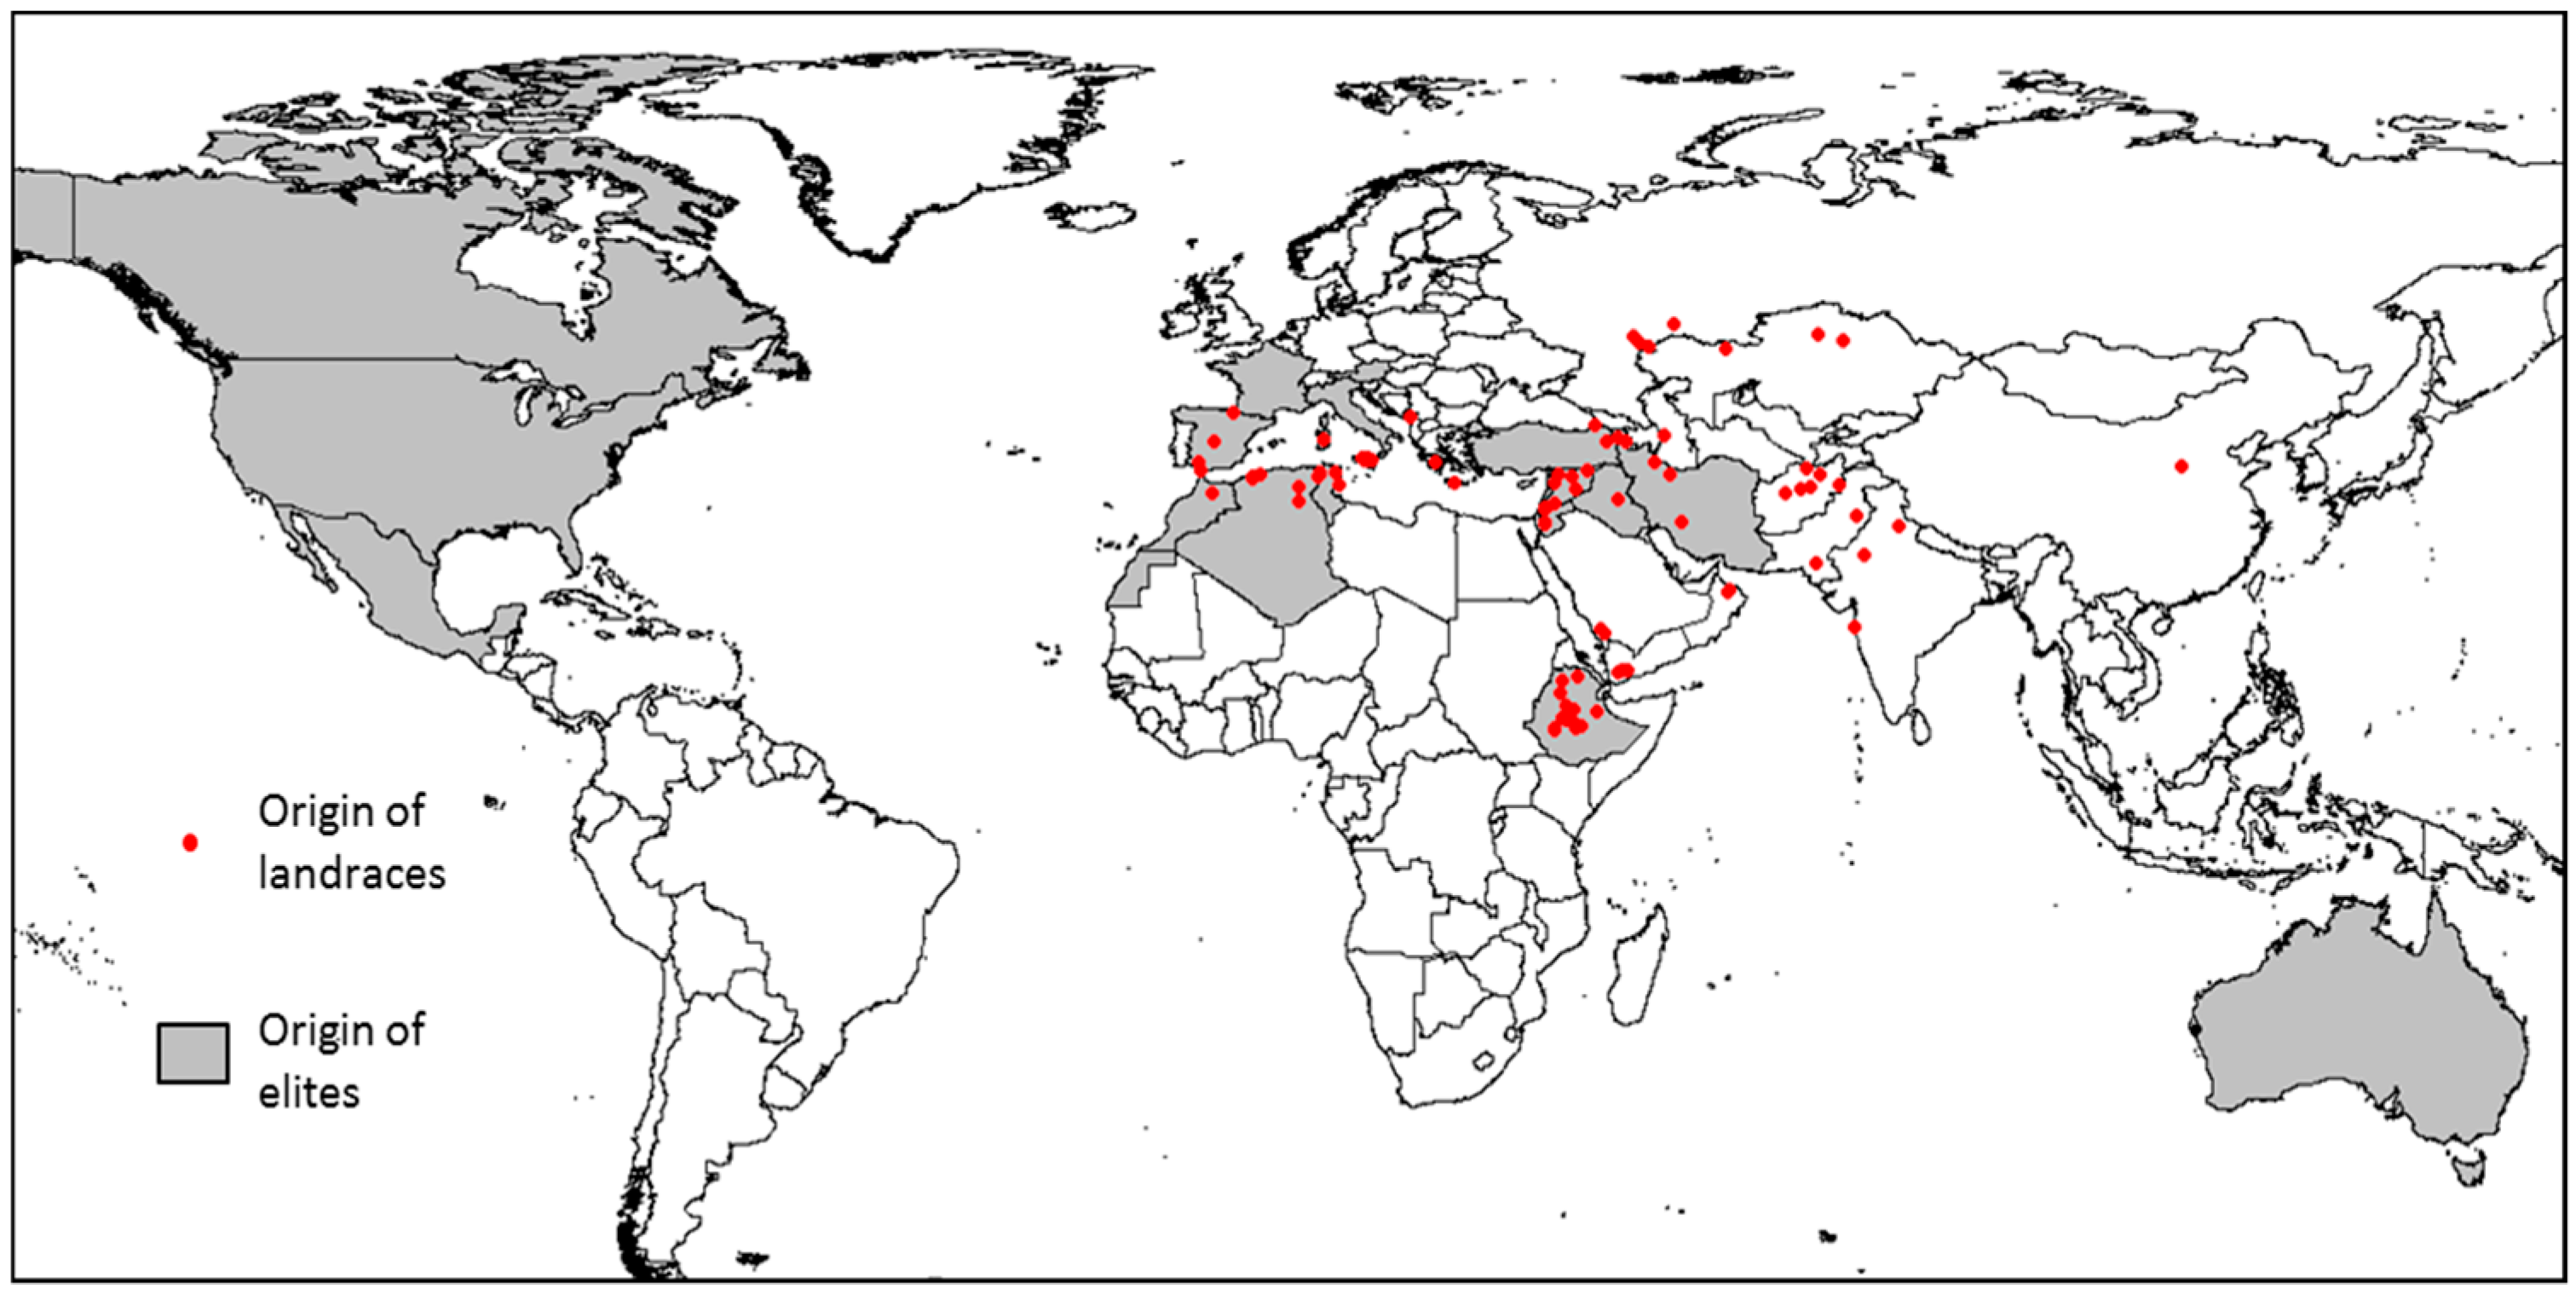
2.1. Plant Material and Panel Structure

The core subset deployed included 288 modern cultivars and 96 landrace durum wheat lines, gathered from all main durum wheat growing countries. In particular, the germplasm originated from 30 countries and two major international breeding centers: Afghanistan, Algeria, Armenia, Australia, Austria, Azores, Canada, Centro Internacional de Mejorameinto de Maíz y Trigo (CIMMYT, Mexico), China, Mexico, Spain, Ethiopia, France, Georgia, Greece, International Center for Agricultural Research in Dry Areas (ICARDA, Syria), India, Iran, Iraq, Italy, Jordan, Kazakhstan, Morocco, Tunisia, Oman, Pakistan, Russia, Saudi Arabia, USA, Turkey, Yemen, and Serbia (Figure 1).

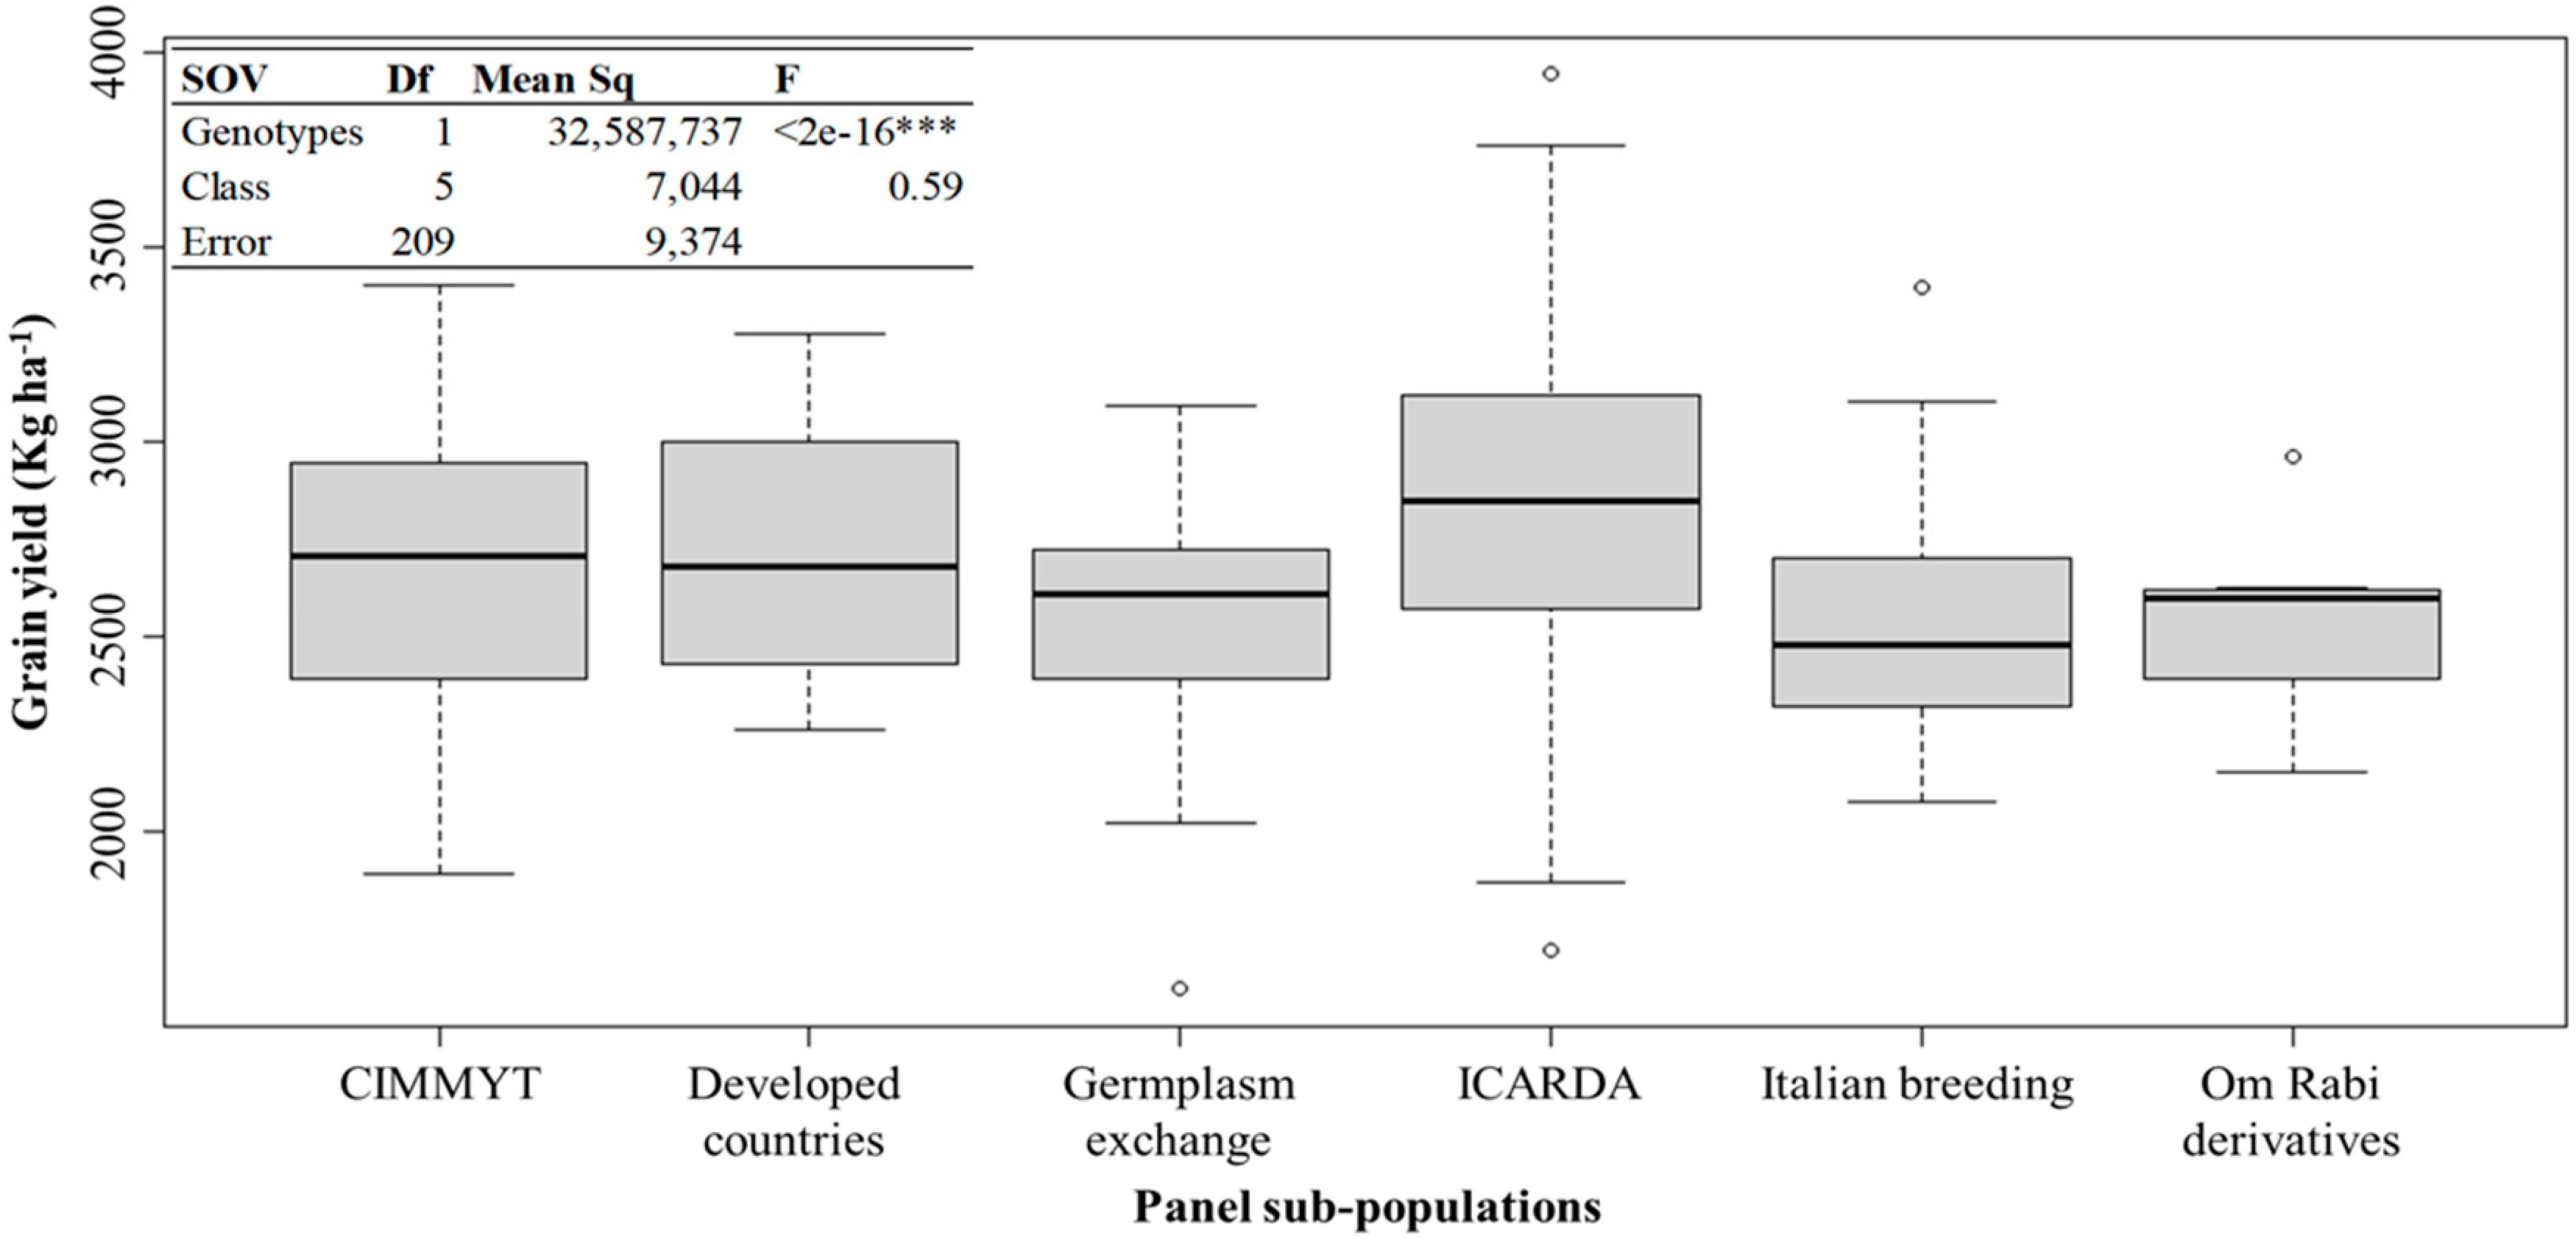
2.2. Population Sub-Structure

A complete description of the genotyping methodology and structuring was previously presented [15]. Briefly, Axiom 35K array was used to screen 370 entries of the panel. A total of 7652 high quality polymorphic markers were retained for downstream analysis having frequency of minor allele higher than 5%, frequency of heterozygotes less than 10%. These were aligned via BLAST to the available Bread Wheat Reference Genome [16] with a matching identity cut-off of 99%. As described in Kabbaj et al. [15], a selection of 500 hihgly informative and evenly spaced markers with PIC value superior to 0.2 was used to determine that this panel is constituted of 10 sub-populations, of which 4 are landraces: T. abyssinicum type, Central and South Asian, Mediterranean trades, and Middle East. Modern lines were instead divided into 6 sub-groups based on the breeding program of origin: ICARDA, CIMMYT, Italy, Developed countries, ‘Om Rabi’ derivatives, and breeding program exchange.

2.3. Field Trials and Phenotypic Characterization

The experiments were carried out in two locations under irrigated conditions: Fanaye, Senegal (FAN: 16°53′′ N; 15°53′′ W) and Kaedi, Mauritania (KED: 16°14′′ N; 13°46′′ W) during the winter seasons of 2014–2015 and 2015–2016. Detailed information on these sites and their discrimination ability is presented in Sall et al. [5]. Briefly, temperatures in FAN15 were 32 °C average maximum and 15 °C average minimum, with peaks of 38 °C, while in FAN16 average maximum was 34 °C and average minimum at 15 °C, with peaks of 40 °C. These differences were mostly due to a delay of planting date from the 6th to the 17th of December in the second growing season. Instead in KED16 average minimum temperatures was 22 °C while average max temperature was 34 °C and reached a maximum of 41 °C. Precise temperature data are not available for KED15. Water input changed between the two seasons: During the 2014–2015 season, a total estimated of 320 mm and 410 mm of water were provided in KED and in FAN, respectively. While for 2015–2016 season, an attempt was made to homogenize irrigation water between the two sites with 360 mm and 380 mm total in FAN16 and KED16, respectively. The amount of irrigation water provided was calculated based on the pump bars pressure, the time for which water was pumped, divided by the total surface to be irrigated. Hence, these values are to be considered approximations since irrigation water was also loss in the canals, as well via evaporation.
The accessions were tested in a partially replicated (augmented) design of 19 blocks of size 24 including 4 replicated checks each. The checks were ‘Omrabi 5’, ‘Icarasha 2’, ‘Azeghar2’ and ‘Waha’. The plot planting surface was of 3 m length × 5 rows spaced 30 cm apart (4.5 m2) at a sowing density of 120 kg ha−1. Fields were fertilized and managed following the standard agricultural practices adopted in each location; weeds were chemically and mechanically controlled for the first season while it was only mechanically controlled in season 2015–2016.
Phenology traits, yield components and grain yield (GY) were recorded for all genotypes. The days to heading (DtH) was recorded as the number of days elapsed from sowing to the moment that 50% of the plot showed spikes emerging from the flag leaf at stage 59 in the Zadoks scale (Z59: [17]). Before maturity (Z83-87), the number of fertile spike per meter square (Spk.m−2) were counted. Days to maturity (DtM) was recorded when 50% of the spikes turned yellow (Z91-92). A proxy of grain filling period (GFP) was then computed as the difference between DtM and DtH. Plant height (PLH) was measured in cm from the ground to the top of a representative ear excluding its awns. For each plot, only the middle rows were harvested for a total surface of 2.7 m2, dried and the biomass (Biom) weighted before threshing. The weight of the threshed grains was converted into yield (GY) expressed as kg ha−1. The ratio between the GY and Biom was expressed as harvest index (HI). One thousand grains were weighted in grams as 1000-kernels weight (TKW). The number of grain per meter square (Gr.m−2) was imputed using the weight of the grains harvested from 2.7 m2 area and the weight of one kernel derived from the TKW value, as per:
Gr . m 2 = Harvested   weight   of   plot 2.7 m 2 x   TKW 1000
The number of grains per spike (Gr.spk−1) was derived from dividing the imputed number of grains per unit area by the number of spikes recorded for the same area, as follows:
Gr . spk 1 = Gr . m 2 Spk . m 2
DtM, GFP, and Spk.m−2 were not recorded for season 2014–2015.

2.4. Statistical Analyses

For each environment, the BLUE of each trait was analyzed using the DAU.test function of the agricolae package of R version 3.2.1 [18]. Box whiskers graph was obtained using the function boxplot dividing the germplasm into their six genetically distinct sub-groups. Mean performances across environments and combined analysis of variance for traits recorded in all environments was obtained by the AMMI model using R version 3.2.1 [18]. Interaction principal components axes (IPCAs) for the AMMI values were used to derive an ‘AMMI wide adaptation index’ (AWAI, described in [13]) to asses yield stability:
AWAI = i s i absolute   value   for   IPCA i
where i is the number of significant interaction principal components axes (IPCA) for the AMMI and si is the percentage of total G × E variation explained by each IPCA. AWAI values close to ‘0’ are obtained for the most widely adapted germplasm. To identify the best accessions for heat tolerance and stability, a performance index was generated by simultaneously selecting performance genotypes above average yield (GY > 3 t ha−1) and stability index better than average (AWAI < 5).
Heritability was calculated as explained in [5]:
H 2 = σ 2 g σ 2 p = M S g M S e r M S e + M S g M S e r + M S g x e M S e r e
where σ2g is genotypic variance, σ2p is phenotypic variance, MSg is the mean square for the genotype, MSe is error mean square, MSgxe is the mean square of the interaction, r is the number of replicates and e is the number of environments considered.
The ratio of variance accounted by each source of variations (G, E, and GxE) was calculated by dividing the sum of square of each for the total sum of square of the experiment.

3. Results

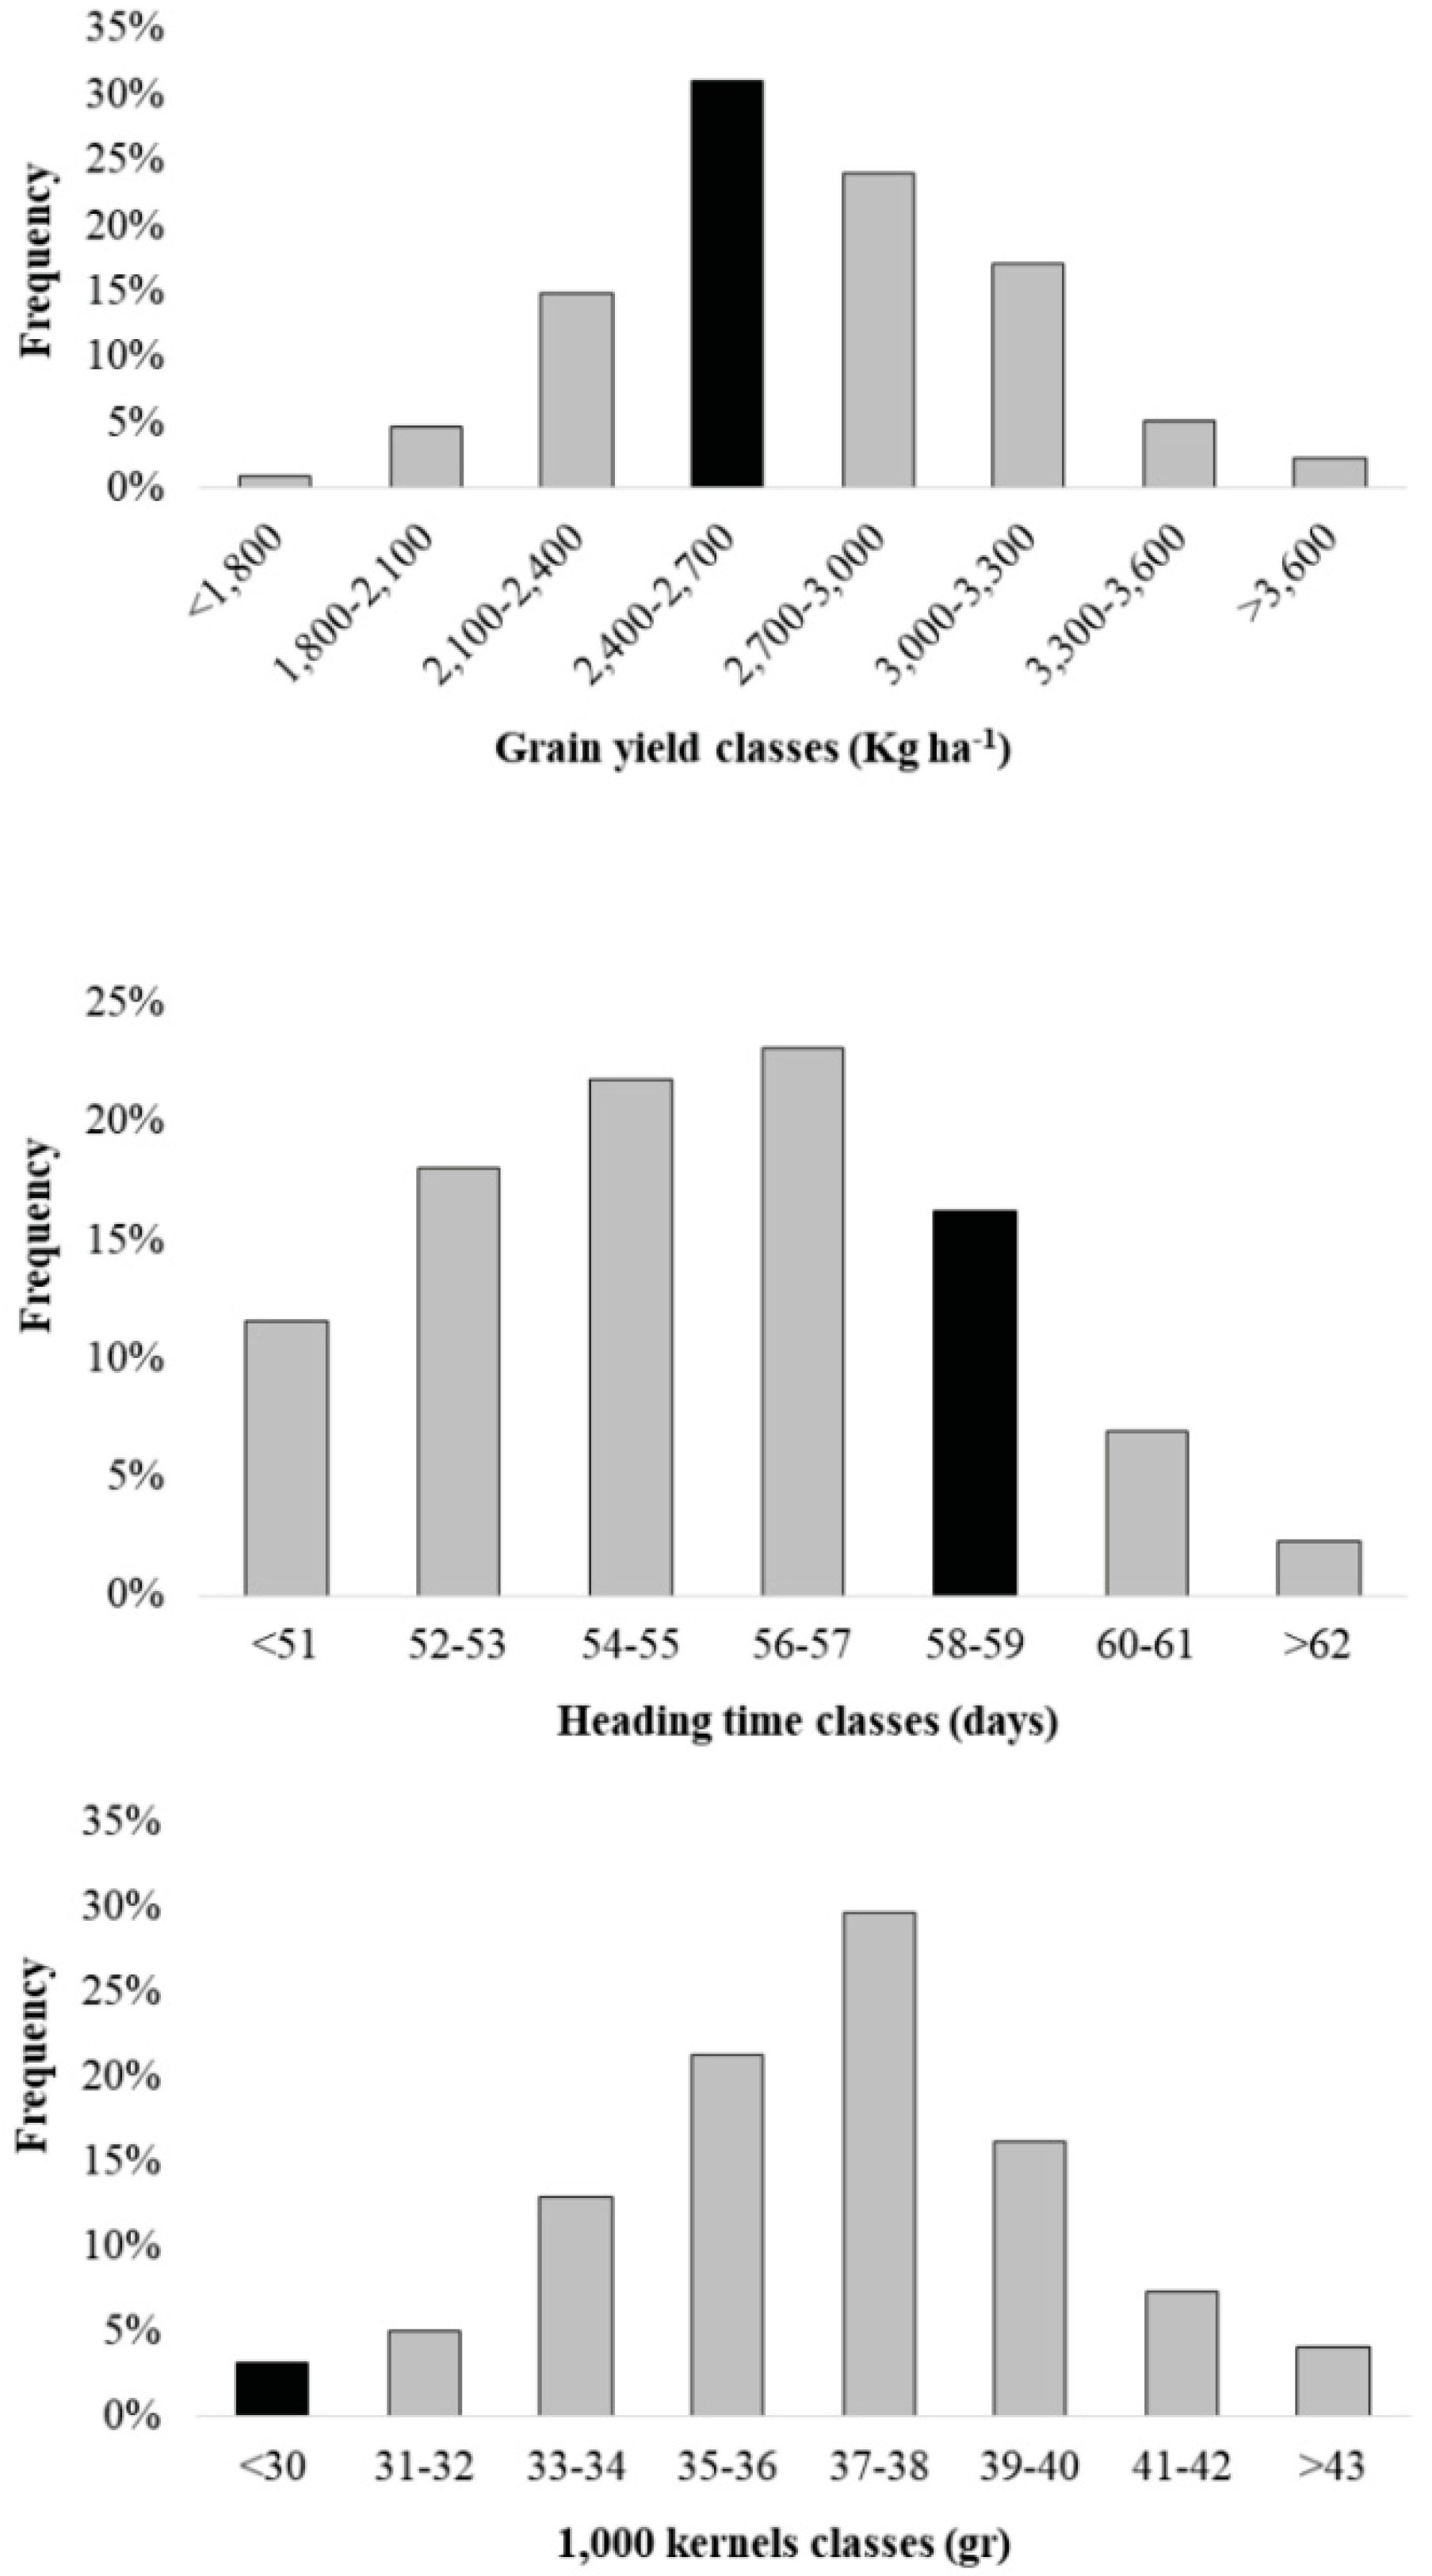
3.1. Phenotypic Variation of the Agronomical Traits

The full core subset composed of 384 durum wheat accessions was planted in season 2014–2015 and accurately phenotyped for response to heat in different agronomical traits such as DTH, PLH, TKW and GY. Unfortunately, none of the landraces reached flowering or maturity within the time window of the field trial (140 days), and hence could not produce any grains. Likewise, some of the modern lines originated in the North of Europe or Canada did not reach maturity due to vernalization or photoperiod requirements. Hence, only a subset of 224 modern spring lines that showed correct phenology was planted in the season 2015–2016.
The combined analysis of variance (Table 1) revealed significant phenotypic variation among genotypes for all traits. Heritability for GY reached 0.47, and it was 0.82, 0.52, and 0.43 for DtH, TKW, and PLH, respectively. Biom and HI had the lowest heritability: 0.17 and 0.37, respectively.
GY varied between a minimum of 639 kg ha−1 to a maximum of 5822 kg ha−1 at FAN15. The lowest average GY (1951 kg ha−1) was obtained at FAN16 and the highest at the same station in the previous year (3897 kg ha−1). The average yield across sites (BLUE) for the four combined environments was 2726 kg ha−1, and the highest yielding lines overall were ‘Beghouata1’, ‘Icambel’, and ‘Margherita 2’ with 3943, 3637, and 3522 kg ha−1, respectively (Table 2).
The modern lines of the panel were divided into the six genetically different sub-groups identified by Kabbaj et al. [15], and the average yield performance across environments (BLUE) was estimated for each cluster (Figure 2). Overall, the average GY performances across groups did not varied significantly. However, lines belonging to CIMMYT and ICARDA groups reached the highest yields overall.
The flowering time general mean was 55 days with a minimum of 50 days for line ‘Icavicre’ from ICARDA and a maximum of 65 days for ‘Yawa’ from Australia (Figure 3). The Mauritanian site (KED) was drier and hotter, in both season and hence achieved the earliest flowering with an average of 54 days, while FAN 56 days in the two seasons, respectively. A wide range of variation was also observed in the panel for TKW with an average minimum of 29 g for line ‘FIGSDRYWET134’ and a maximum of 44 g for ICARDA line ‘Magrour’. The CIMMYT group reached average of 34 g for TKW, while ICARDA and ‘Om Rabi’ derived groups reached averages 38 g and all three groups had a maximum of 44 g. The environment with the largest grain size was FAN with an average of 39 g, and the smallest was KED with an average of 34 g. Variation on plant height (63 to 88 cm) and biomass (6766 to 16,966 kg ha−1) was also observed across environments.

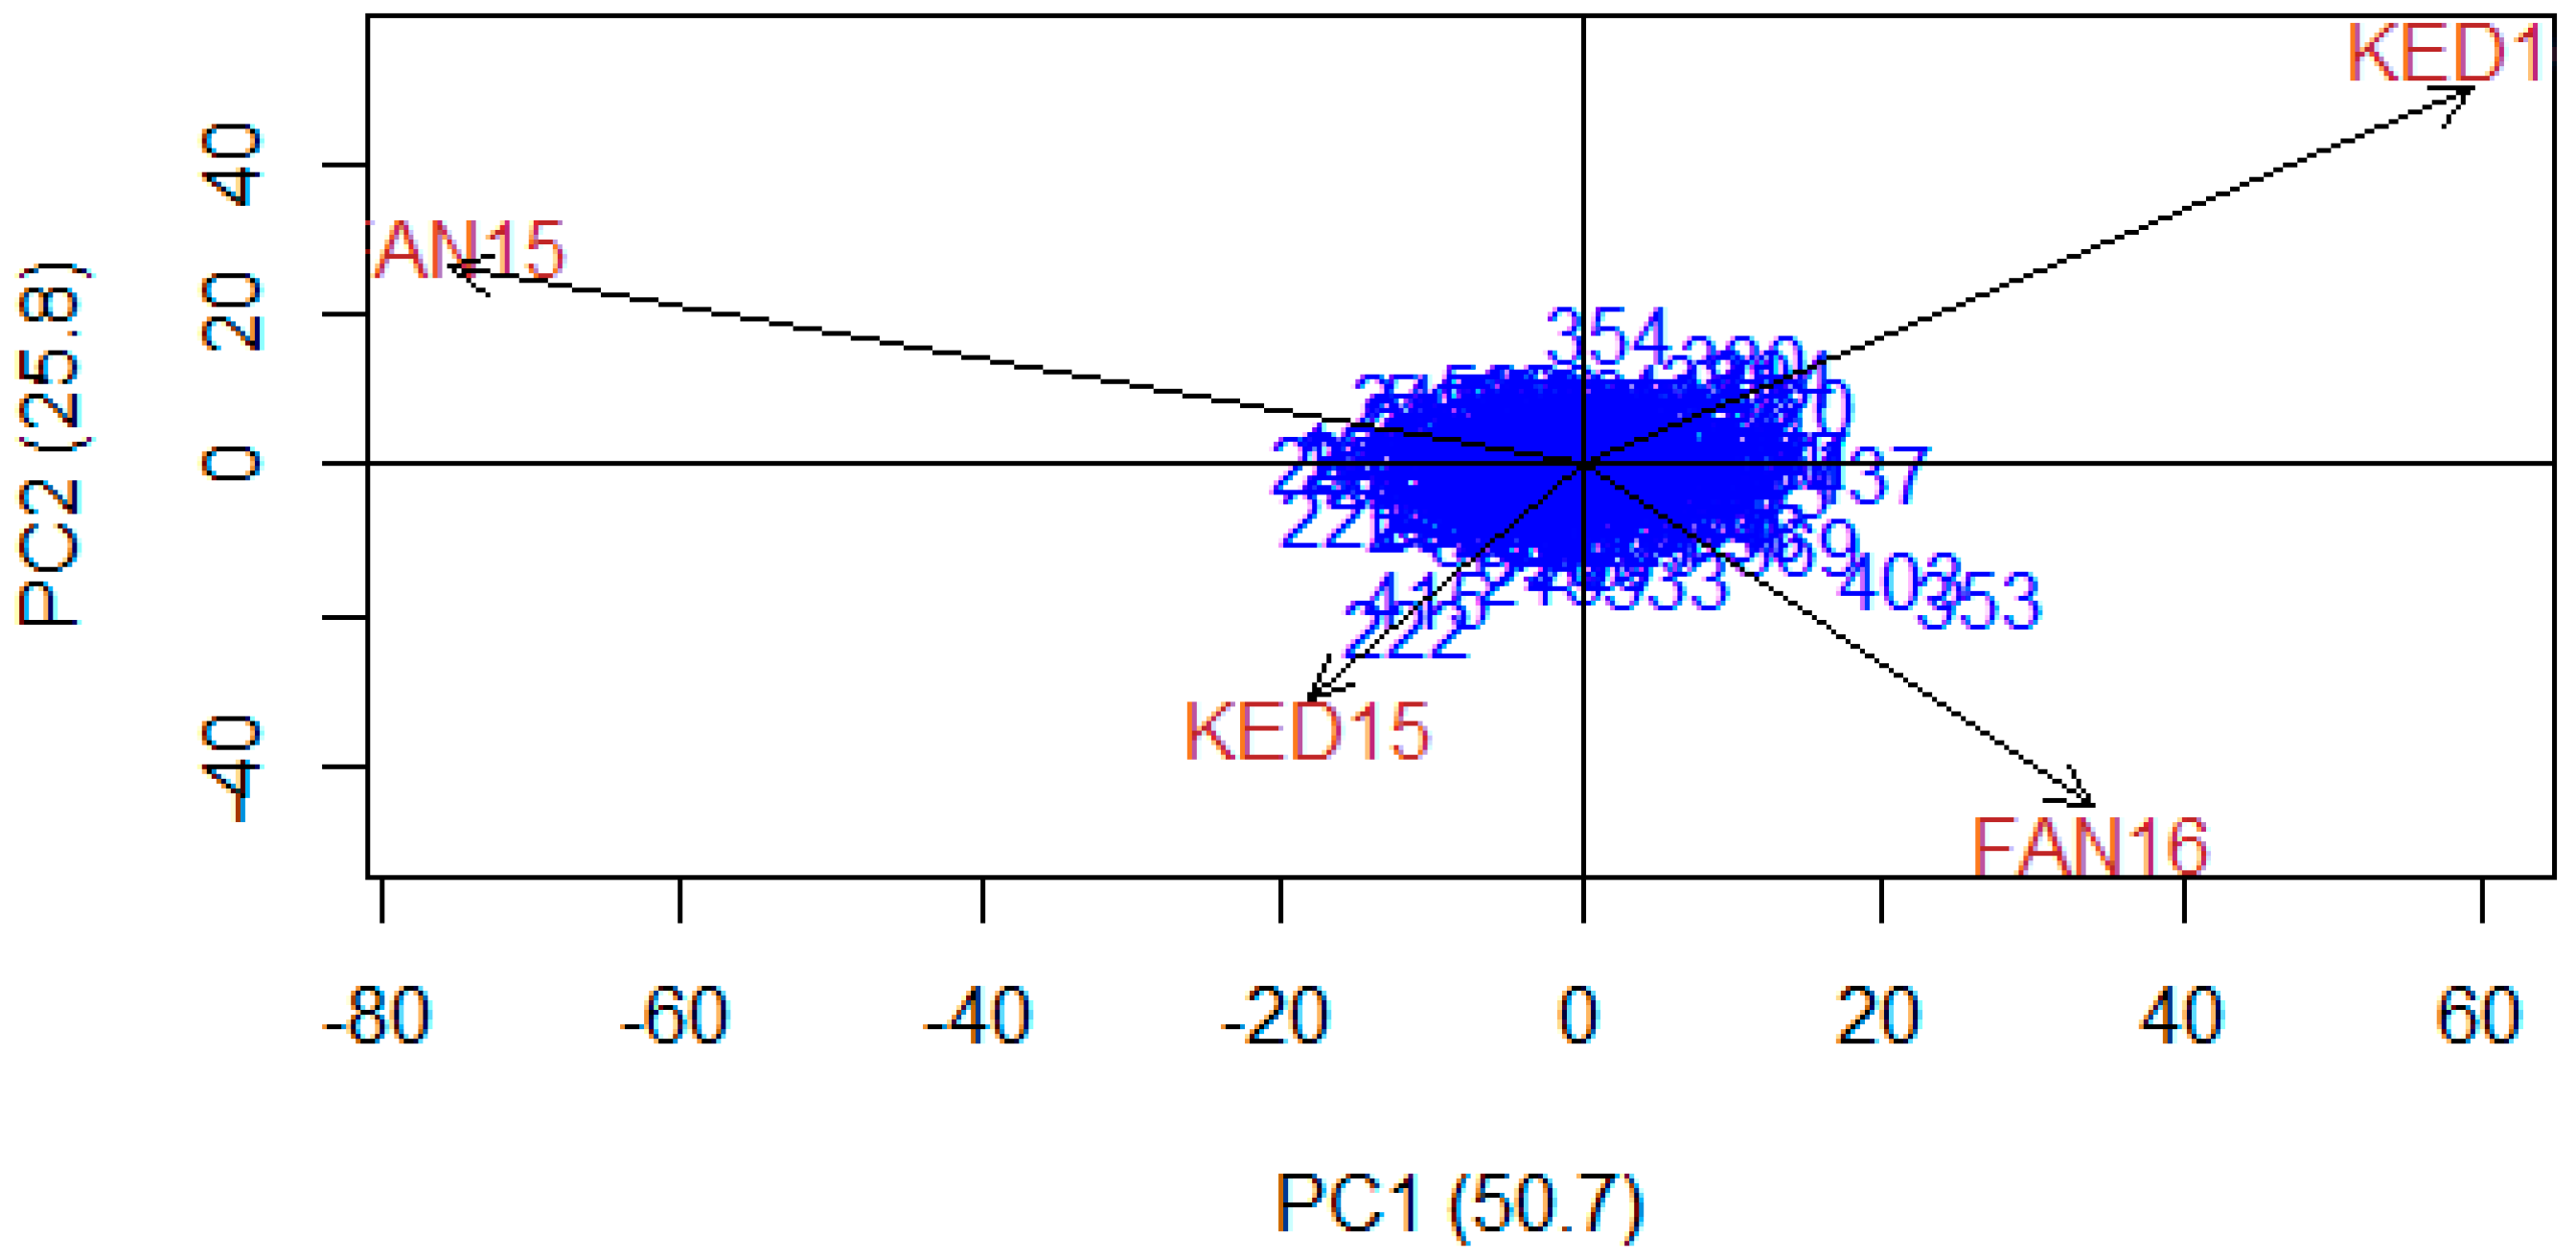
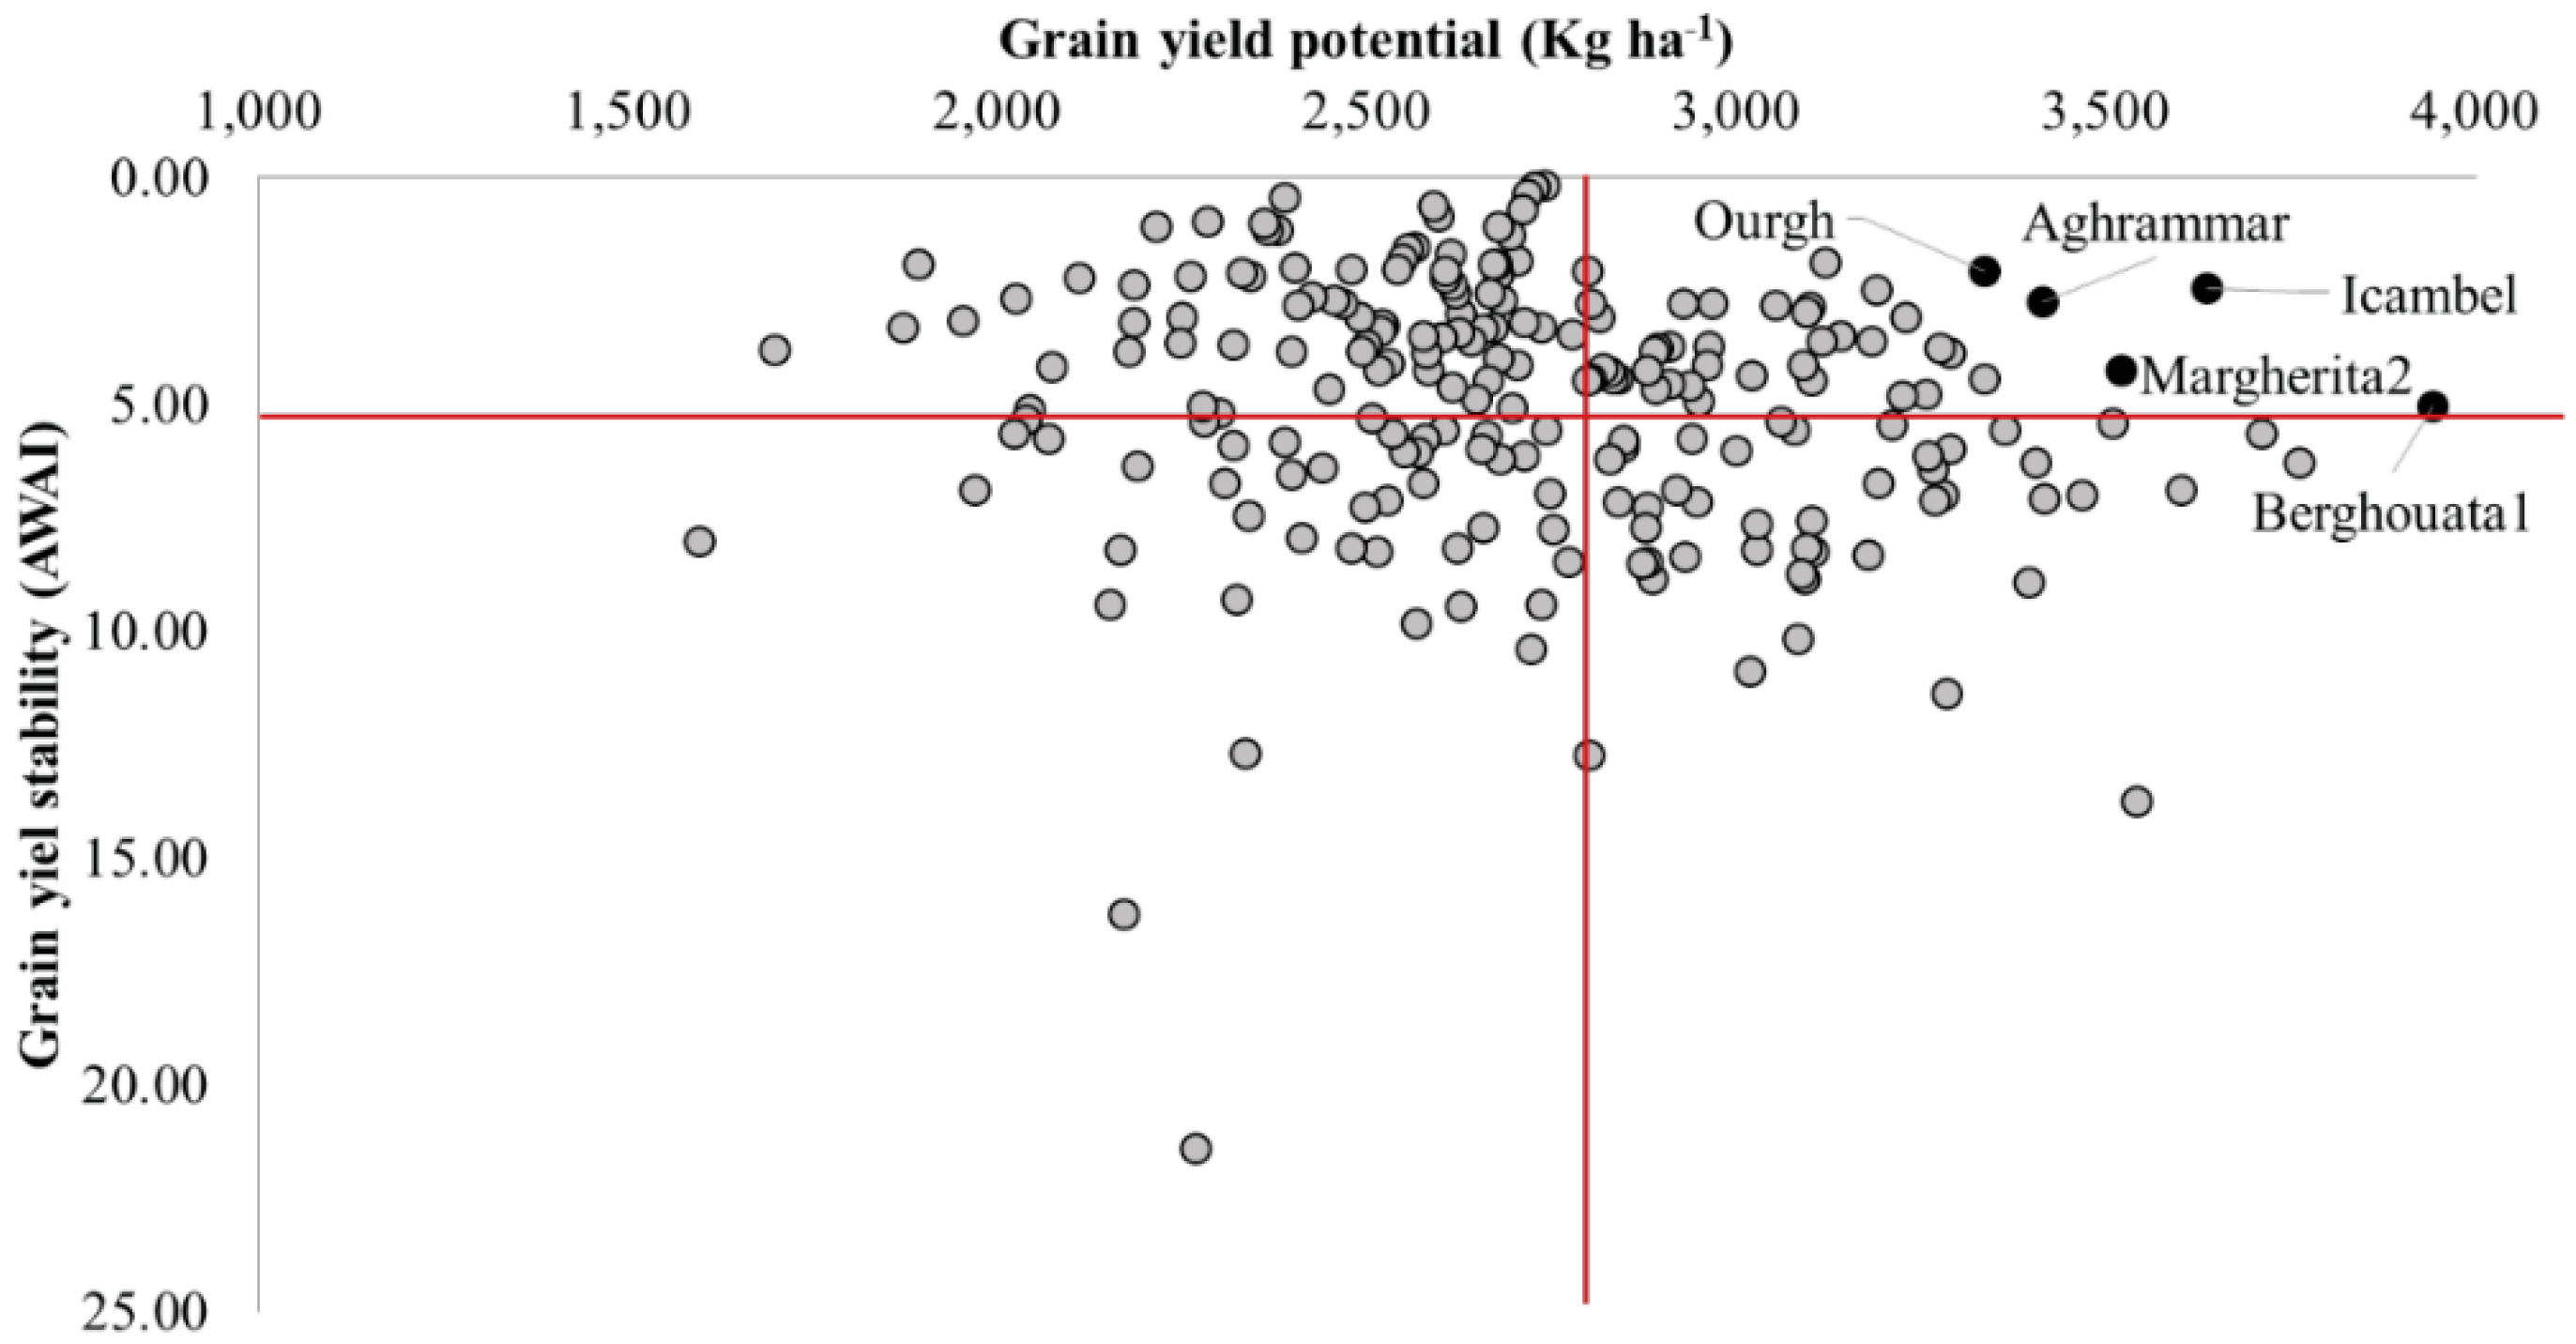
3.2. Yield Stability of Specific Durum Lines Against Heat

The analysis of variance for 224 durum wheat genotypes across four environments revealed that 58.52% of the total variance was attributable to environments (E), 15.96% to genotypes (G), and 25.53% to G × E effects. G × E effects were partitioned into three IPCA via AMMI, each explaining respectively 50.7, 25.8, and 23.4% of the G × E variation. The MS for all three IPCAs were highly significant (p = 0.001 level), and the first two IPCAs (explaining together 76.5% of the total interaction) are presented in Figure 4. Each environment occupied a quadrant of the biplot, indicating excellent capacity to discriminate among genotypes. AMMI approach revealed a wide spread of genotypes across environments.
In general, the closer a genotype is to each axis, the least it suffers of the specific G × E factor represented by that axis, and hence the more stable it is. The AWAI score measures that distance and a smaller value is indicative of genotypes falling closer to all axes and therefore more stable. More than half of the genotypes had a value inferior to the average of the experiment (AWAI < 5). However, stability can also be reached by constantly low yielding lines, which are of scarce interest for breeders. Hence, a biplot was designed to compare G × E stability (AWAI), against G value for yield (BLUE) under heat stress (Figure 5). Forty-eight genotypes were identified as yielding above average and more stable than the average (AWAI < 5). Of these, 28 are new elites from ICARDA, eight are elites from CIMMYT, three are cultivars from Italy, three are from Australia, two are Spanish cultivars, and one each are from Morocco, Tunisia, southwestern USA, and Canada. The three top yielding and stable lines were all from ICARDA: ‘Berghouata1’, ‘Icambel’, and ‘Margherita 2’ (Table 2). Their heading time was comprised between 50 and 53 days, corresponding to the earliest class (Figure 3). The weight of 1000 kernels for the top lines was 35–40 gr, which corresponds to the average range of the panel.

3.3. Correlation between Phenology, Yield and Its Components

The effect of phenology traits and yield components on grain productivity was investigated by a correlation analysis (Table 3) to understand the strategy of adaptation to heat stress. Phenology traits (DtH, DtM and GFP) affected significantly GY in the most stressed environment (FAN16). DtH and DtM was negatively and significantly correlated to GY (p < 0.001), with earlier lines typically performing better, while GFP had a significant positive effect on GY (p < 0.001). Instead PLH did not show any significant effect on grain yield. Yield components traits (TKW, Spk.m−2, Gr.spk−1, Biom and HI), had a significant positive effect on GY across environments (p < 0.001). Significant effect of TKW was noticed at FAN, the site with highest moisture availability due to soil with better water holding capacity. Biom affected positively grain yield in less stressed environments, while spike density, spike fertility and harvest index were correlated positively with yield at all environments of the Senegal River.

4. Discussion

Heat stress is a major environmental factor limiting crop growth and grain yield. It occurs along the Senegal River Basin, with temperatures constantly above 30 °C throughout the wheat growing cycle and begin to rise further at the end of the season in late February to early March [5]. A durum wheat panel was investigated here under different sowing dates and amounts of water inputs across sites and years. In fact, the largest proportion of phenotypic variation for GY was due to the environment effect (58.52%), confirming that the differences among the environmental means (seasonal fluctuations) were very high. Further, the AMMI distribution of G × E effects (Figure 3) confirmed the discrimination capacity of these four heat prone environments. A similar conclusion was reached by Sall et al. [5] when testing 24 modern lines under the same environmental conditions. In fact, GY at FAN16 and KED16 were 51% and 24% lower compared to the timely sown season 2014–2015 at the same sites, respectively. In FAN16 the germplasm was exposed to the highest average temperatures (34 °C) during flowering, while it was lower (31 °C) in FAN15. This result shows the level of damage that the increase of just 3 °C in temperature can cause to the productivity of durum wheat if it occurs at the time of heading, as reported in Sall et al. [5]. However, a 12% reduction in moisture was also imposed between FAN15 and FAN16, which can account for a portion of the variation in GY. Thus, the suggested 51% reduction in GY in FAN between seasons it is to be considered only an estimate, and more detailed studies would be required to measure the exact effect on yield of a 3 °C increase in temperatures.
Testing of a large set of germplasm under these conditions revealed a good level of diversity, with 15.96% of the total variation for GY captured by the G effect, and over 42% of the testing accessions (mostly landraces) that could never complete the cycle due to the wrong phenology. This last point is of interest because it could explain why durum wheat was not cultivated in the past along the Senegal River. In fact, all germplasm tested that predated the introduction of photoperiod insensitivity and early spring genes could not adapt to the local conditions. This means that local farmers who tested this type of germplasm would have found it to be of poor use, and hence can build the rural knowledge that wheat cannot be cultivated along the Senegal River. However, the testing of new modern bred-germplasm has revealed excellent performances with yields above 3 t ha−1 obtainable in just 93 days from sowing to harvest [5].
The magnitude of G × E variance (25.53%) was also significant, thus indicating the need for multi-site testing to identify a stable high-yielding germplasm. The use of a combined selection index for G (BLUE) and GxE (AWAI) (Figure 5) confirmed that 20% of the tested accessions could reach stable yields above 2.7 t ha−1. The best three of these widely adapted lines achieved yields of 3.5 to 3.9 t ha−1 and originated from the ICARDA durum wheat breeding program.
Phenology traits (DtH, DtM and GFP) and yield components traits (TKW, Spike.m−2, Gr.spk−1 Biom and HI) affected significantly (p < 0.001) grain yield, indicating their decisive role in performance under heat stress. The earliest genotypes performed better overall supporting assertion from Maccaferri et al. [19] and Lopes et al. [20]. This is probably due to their ability to escape the hottest days during heading and extend their GFP. The high and positive effect of TKW in the current study was supported by Baril [21] and Mohammadi et al. [22], who concluded that genotypes with larger kernels tend to yield better when grown under irrigated conditions. In addition, the capacity of maintaining good grain weight after exposure to heat stress during the grain filling period is commonly regarded as a good indication of tolerant to this stress [23,24,25,26]. In this regard, Dias and Lidon [27] proposed that high TKW can be a useful selection criteria for improving heat tolerance. Best yielding genotypes in this study produced also more spikes per unit of area, a strategic method to ensure a high grain number and hence better yields [28,29,30]. More importantly, as it was the case in Sall et al. [5], the number of grains per spike was among the traits that showed good influence on yields in all environment where it was measured. In fact, it was previously concluded [5] that the spike is particularly sensitive to loss of fertility when temperatures are high, mostly because of the drying out of the pollen. Hence, the capacity to maintain good spike fertility (Gr.spk−1) is probably the most critical trait to ensure good heat tolerance. Finally, harvest index and biomass were also found to be among the most critical traits to ensure high yields under irrigated and hot conditions. However, since PLH did not affect GY, it is probably a more strategic approach to increase these traits via breeding to target selection for more spikes (Spk.m2) rather than other components of biomass. Hence, durum wheat breeders targeting heat tolerance should aim at selecting early flowering genotypes that produce many tillers, each with a high degree of fertility, and when possible also with larger grain size (TKW).
The six sub-groups of genetically diverse modern lines identified by Kabbaj et al. [15] were tested for average performances across sites (Figure 2) to reveal even distribution of high and low yielding accessions within each group. This well distributed variation is of great importance for undertaking a genome-wide association study (GWAS), thus avoiding bias due to kinship. In addition, high heritability was noted for GY and its components, which are also other critical factors when search true G effects via GWAS.

5. Conclusions

The current context of major cereal yield losses due to global warming and rapid increase in food demand further expose African countries to food insecurity and poverty. Here we have presented a handful of new potential durum wheat cultivars that can withstand the high temperatures of West African drylands, and whose harvests yields more 3 t ha−1 of grain (depending on soil type and temperatures), and with a fast cycle of about 3 months between planting and harvest. This new crop for the Senegal River Basin, if properly supported, has the potential to replace the fallow period between rice seasons with a productive durum wheat crop. Estimates based on the average yield (3 t ha−1) and considering 200,000 ha of irrigated rice land cultivated today in Mali, Mauritania, and Senegal, suggests that up to 0.6 million t of new food could be generated without affecting the current cropping cycle. Since high quality durum wheat grains are traded on the international market at € 280 to 300 per t, this outcome could be converted into a significant new business worth over € 180 million per year to fight poverty. In addition, it was demonstrated that the two stations along the Senegal River provide ideal conditions for testing heat tolerance in wheat. This fact, in combination with the significant variation shown by the panel derived from the core subset when tested along the Senegal River Basin, and its acceptable LD decay, indicate good potential to identify the specific quantitative trait loci that provide adaptation to this type of heat. In the scenario of global warming with a +4 °C raise in temperatures expected within the end of the century [1], the critical international importance of the work presented here becomes evident. In fact, this research shows that heat tolerant germplasm can now be used in breeding and reveals the specific traits for heat adaptation to be used for selection. GWAS will further identify the DNA markers linked to these traits for use in MAS in those environments where the temperatures have not yet reached the harsh conditions that exist today along the Senegal River.

Author Contributions

F.M.B. and R.O. conceived and designed the experiment. A.T.S., H.G. and M.C. performed the experiments. All analyzed the data and wrote the paper.

Funding

This research was financed by the Swedish Research Council (Vetenskapsradet) U-Forsk2013, “Deployment of molecular durum breeding to the Senegal Basin: capacity building to face global warming”.

Acknowledgments

The authors wish to thank the technical staff of CNRADA, ISRA, and ICARDA for support in conducting the field research.

Conflicts of Interest

The authors declare no conflict of interest. The funding sponsors had no role in the design of the stud; in the collection, analyses, or interpretation of data; in the writing of the manuscript, and in the decision to publish the results.

References

  1. Pereira, L. Climate change impacts on agriculture across Africa. In Oxford Research Encyclopedia of Environmental Science; Oxford University Press: New York, NY, USA, 2017. [Google Scholar] [CrossRef]
  2. Von Grebmer, K.; Bernstein, J.; Hossain, N.; Brown, T.; Prasai, N.; Yohannes, Y.; Patterson, F.; Sonttag, A.; Zimmermnan, S.-M.; Towey, O. Global Hunger Index: The Inequalities of Hunger; International Food Policy Research Institute: Washington, DC, USA; Bonn, Germany; Dublin, Ireland, 2017. [Google Scholar]
  3. FAO (Food and Agriculture Organization). Senegal: Irrigation Market Brief; Report No. 26; FAO: Rome, Italy, 2016; Available online: http://www.fao.org/3/a-i5365e.pdf (accessed on 11 May 2017).
  4. Wiebe, K.; Sulser, T.B.; Mason-D’Croz, D.; Rosegrant, M.W. The effects of climate change on agriculture and food security in Africa. In A Thriving Agricultural Sector in a Changing Climate: Meeting Malabo Declaration Goals Through Climate-Smart Agriculture; De Pinto, A., Ulimwengu, J.M., Eds.; International Food Policy Research Institute: Washington, DC, USA, 2017; pp. 5–21. [Google Scholar]
  5. Sall, A.T.; Kabbaj, H.; Cisse, M.; Gueye, H.; Ndoye, I.; Maltouf, A.F.; El-Mourid, M.; Ortiz, R.; Bassi, F.M. Heat tolerance of durum wheat (tritcum durum desf.) elite germplasm tested along the senegal river. J. Agric. Sci. 2018, 10. [Google Scholar] [CrossRef]
  6. Ama. Le Soleil, 18 April 2013; 10.
  7. Ashraf, M.; Quresh, A.S.; Ghafoor, I.A.; Khan, N.A. Genotype environment interaction in wheat. Pakistan J. Biol. Sci. 2001, 1, 356–357. [Google Scholar]
  8. Najafian, G.; Kaffashi, A.K.; Jafar-Nezhad, A. Analysis of grain yield stability in hexaploid wheat genotypes grown in temperate regions of Iran using additive main effects and multiplicative interaction. J. Agric. Sci. Technol. 2010, 12, 213–222. [Google Scholar]
  9. Zali, H.; Farshadfar, E.; Sabaghpour, S.H. Non-parametric analysis of phenotypic stability in chickpea (Cicer arietinum L.) genotypes in Iran. Crop Breed. J. 2011, 1, 89–100. [Google Scholar]
  10. Yaghotipoor, A.; Farshadfar, E. Non-parametric estimation and component analysis of phenotypic stability in chickpea (Cicer arietinum L.). Pak. J. Biol. Sci. 2007, 10, 26–46. [Google Scholar]
  11. Zobel, R.W.; Wright, M.J.; Gauch, H.G. Statistical analysis of a yield trial. Agron. J. 1988, 80, 388–393. [Google Scholar] [CrossRef]
  12. Malosetti, M.; Ribaut, J.; Van, E.F.A. The statistical analysis of multi-environment data: Modeling genotype-by-environment interaction and its genetic basis. Front. Physiol. 2013, 4, 1–17. [Google Scholar] [CrossRef] [PubMed]
  13. Bassi, F.M.; Sanchez-Garcia, M. Adaptation and stability analysis of ICARDA durum wheat (Triticum durum Desf.) elites across 18 countries. Crop Sci. 2017, 57, 1–12. [Google Scholar] [CrossRef]
  14. Ortiz, R. Plant Breeding in the Omics Era; Springer International: New York, NY, USA, 2017. [Google Scholar]
  15. Kabbaj, H.; Sall, A.T.; Al-Abdallat, A.; Geleta, M.; Amri, A.; Filali-Maltouf, A.; Belkadi, B.; Ortiz, R.; Bassi, F.M. Genetic diversity within a global panel of durum wheat (Triticum durum) landraces and modern germplasm reveals the history of alleles exchange. Front. Plant Sci. 2017, 8, 1277. [Google Scholar] [CrossRef] [PubMed]
  16. Winfield, M.O.; Allen, A.M.; Burridge, A.J.; Barker, G.L.; Benbow, H.R.; Wilkinson, P.A. High-density SNP genotyping array for hexaploid wheat and its secondary and tertiary gene pool. Plant Biotechnol. J. 2016, 14, 1195–1206. [Google Scholar] [CrossRef] [PubMed]
  17. Zadoks, J.C.; Chang, T.T.; Konzak, C.F. A decimal code for the growth stages of cereals. Weed Res. 1974, 14, 415–421. [Google Scholar] [CrossRef]
  18. R Core Team. R: A Language and Environment for Statistical Computing; R Foundation for Statistical Computing; R Core Team: Vienna, Austria, 2015. [Google Scholar]
  19. Maccaferri, M.; Corinna, M.; Demontis, S.A.; El-Ahmed, A.; Garcia del Moral, L.; Maalouf, F.; Nachit, M.; Nserallah, N.; Ouabbou, H.; Rhouma, S.; et al. Association mapping in durum wheat grown across a broad range of water regimes. J. Exp. Bot. 2011, 62, 409–438. [Google Scholar] [CrossRef] [PubMed]
  20. Lopes, M.S.; Dreisigacker, S.; Peña, R.J.; Sukumaran, S.; Reynolds, M.P. Genetic characterization of the wheat association mapping initiative (WAMI) panel for dissection of complex traits in spring wheat. Theor. Appl. Genet. 2014, 128, 453–464. [Google Scholar] [CrossRef] [PubMed]
  21. Baril, C.P. Factor regression for interpreting genotype-environment interaction in bread-wheat trials. Theor. Appl. Genet. 1992, 83, 1022–1026. [Google Scholar] [CrossRef] [PubMed]
  22. Mohammadi, M.; Sharifi, P.; Karimizadeh, R.; Shefazadeh, M.K. Relationships between grain yield and yield components in bread wheat under different water availability (dryland and supplemental irrigation conditions). Not. Bot. Horti Agrobo. 2012, 40, 195–200. [Google Scholar] [CrossRef]
  23. Gupta, N.K.; Gupta, S.; Kumar, A. Effect of water stress on physiological attributes and their relationship with growth and yield in wheat cullivars at different growth stages. J. Agron. 2001, 86, 1437–1439. [Google Scholar]
  24. Tyagi, P.K.; Pannu, R.K.; Sharma, K.D.; Chaudhary, B.D.; Singh, D.P. Response of different wheat (Triticum aestivum L.) cultivars to terminal heat stress. Tests Agrochem. Cultiv. 2003, 24, 20–21. [Google Scholar]
  25. Singha, P.; Bhowmick, J.; Chaudhury, B.K. Effect of temperature on yield and yield components of fourteen wheat (Triticum aestivum L.) genotypes. Environ. Ecol. 2006, 24, 550–554. [Google Scholar]
  26. Atefeh, N.A.; Etminan, A.; Teixeira da Silva, J.A.; Mohammadi, R. Assessment of yield, yield-related traits and drought tolerance of durum wheat genotypes (Triticum turjidum var. durum Desf.). Aus. J. Crop Sci. 2011, 5, 8–16. [Google Scholar]
  27. Dias, A.S.; Lidon, F.C. Evaluation of grain filling rate and duration in bread and durum wheat, under heat stress after anthesis. J. Agron. Crop Sci. 2009, 195, 137–147. [Google Scholar] [CrossRef]
  28. Abbassenne, F.; Bouzerzour, H.; Hachemi, L. Phénologie et production du blé dur (Triticum durum Desf.) en zone semi-aride d’altitude. Ann. Inst. National Agron. Harrach 1997, 18, 24–36. [Google Scholar]
  29. Masoni, A.; Ercoli, L.; Mariotti, M.; Arduini, I. Post-anthesis accumulation and remobilization of dry matter, nitrogen and phosphorus in durum wheat as affected by soil type. Eur. J. Agron. 2007, 26, 179–186. [Google Scholar] [CrossRef]
  30. Bahlouli, F.; Bouzerzour, H.; Benmahammed, A. Effets de la vitesse et de la durée du remplissage du grain ainsi que de l’accumulation des assimilats de la tige dans l’élaboration du rendement du blé dur (Triticum durum Desf.) dans les conditions de culture des hautes plaines orientales d’Algérie. Biotechnol. Agron. Soc. Environ. 2008, 12, 31–39. [Google Scholar]
Figure 1. Geographical origin of the accessions included in the 384-core subset of durum wheat. Red dots indicate actual collection sites of landraces while grey shade indicates country origin of elite material.
Agriculture 08 00099 g001
Figure 2. Grain yield distribution across different sub-groups of modern cultivars in the durum wheat panel. Thick dark horizontal lines show the averages, the box provides the total variation for the 2nd and 3rd quartile, whiskers have the length of one standard deviation, and empty circle indicate lines performing above or below one standard deviation from the mean. ANOVA table is reported as reference.
Agriculture 08 00099 g002
Figure 3. Distribution of performances of the tested panel for three traits presented as BLUEs across two heat-prone sites along the Senegal River tested over two seasons. The black filled bar indicates the class corresponding to the commercially available variety ‘Karim’.
Agriculture 08 00099 g003
Figure 4. The additive main effect multiplicative interaction (AMMI biplot) of the first two interaction principal components (PC) displaying the spread of 224 durum wheat genotypes (blue numbers) and four environments (red text) for their yield response. Numbers in brackets following PCi in each axis are the percentages they account for the genotype × environment interaction after testing in either Fanaye (FAN) or Kaedi in 2014–2015 (15) or 2015–2016 (16) seasons.
Agriculture 08 00099 g004
Figure 5. Biplot graph between yield potential (kg ha−1) and stability (AWAI). Red lines represent the average for each axis. Genotypes within the top right square are the best yielding and most stable among those tested.
Agriculture 08 00099 g005
Table 1. Means squares for genotypes (MSG), environments (MSE) and their interaction (MSG×E) from the analysis of variance and broad-sense heritability for agronomic traits of a durum wheat core subset across seasons and sites along the Senegal River.
Traits zMSGMSEMSG×EH2
GY1,263,893 *344,471,841 *673,841 *0.47
DtH76 *1794 *14 *0.82
PLH105 *9915 *60 *0.43
TKW77 *3659 *37 *0.52
Biom20,246,949 *1,469,491,352 *16,734,589 *0.17
HI87 *39,829 *55 *0.37
z GY: grain yield, DtH: days to heading, PLH: plant height, TKW: 1000-kernel weight, Biom: biomass, HI: harvest index. * indicates significant at p < 0.001.
Table 2. Performances of top 10 yielding and stable lines presented as BLUEs across two heat-prone sites along the Senegal River tested over two seasons.
NameClusterPedigreeGrain Yield (kg ha−1)Yield Stability (AWAI)Heading (days)1000-Kernels (gr)
Berghouata1ICARDATer1//Mrf1/Stj239435.005038
IcambelICARDAMrb3/Mna1//Ter1/3/IcamorTA0459/Ammar7/4/Beltagy236372.465340
Margherita2ICARDATerbol975/Geruftel235224.245235
AghrammarICARDAMgnl3/Ainzen1//Ammar134152.755237
OurghICARDAD67GTA/2/BOYERO/BIT//MEXICALI33362.085137
IcavicreICARDAIcamorTA0468/6/21563/AA//Fg/3/D68102A2A1A/4/Vitron/5/Bcr33364.425039
IDuWUE-024CIMMYTGS/CRA//SBA81/3/HO/MEXI1/5/MEMO/6/2 *32883.875336
ItaloDevelopedCross Italian × Turkish32753.745538
KunmikiICARDAMorlF38//Bcrch1/Kund1149/3/Bicrederaa1/Miki32574.785039
Ouassara1ICARDAOuasloukos1/5/Azn1/4/BEZAIZSHF//SD19539/Waha/3/Gdr232283.075138
A backcross is indicated by asterisk symbol (*).
Table 3. Effect of phenology and yield components traits on grain yield.
FAN15KED15FAN16KED16Across Environments
DtH z−0.26−0.27−0.36 *−0.19−0.47 *
DtM −0.47 *0.08−0.17
GFP 0.29 *0.190.31 *
PLH−0.020.170.150.230.19
TKW0.34 *0.220.33 *0.110.30 *
Spk.m−2 0.46 *0.49 *0.28
Gr.spk−1 0.63 *0.51 *0.30 *
Biom0.51 *0.68 *0.140.55 *0.45 *
HI0.57 *0.77 *0.61 *0.48 *0.62 *
z DtH: days to heading, DtM: days to maturity, GFP: grain filling period, PLH: plant height, TKW: 1000-kernel weight, Spk.m−2: spike per m2, Gr.spk−1: grains per spike, Biom: biomass, HI: harvest index. * Critical value Pearson’s correlation 0.29 (p < 0.001).

