Article

Miscanthus Biochar had Limited Effects on Soil Physical Properties, Microbial Biomass, and Grain Yield in a Four-Year Field Experiment in Norway

1
Department of Soil Quality and Climate Change, Norwegian Institute of Bioeconomy Research, Høgskoleveien 7, 1430 Ås, Norway
2
Faculty of Environmental Sciences and Natural Resource Management, Norwegian University of Life Sciences (NMBU), 1432 Ås, Norway
3
Soil Geography and Landscape Group, Wageningen University, 6700 Wageningen, The Netherlands
4
Laboratory of Plant and Microbial Ecology, InBioS, Botany B22, Chemin de la Vallée 4, University of Liège, 4000 Liège, Belgium
*
Author to whom correspondence should be addressed.
Agriculture 2018, 8(11), 171; https://doi.org/10.3390/agriculture8110171
Submission received: 13 August 2018 / Revised: 8 October 2018 / Accepted: 18 October 2018 / Published: 27 October 2018

Abstract

:
The application of biochar to soils is a promising technique for increasing soil organic C and offsetting GHG emissions. However, large-scale adoption by farmers will likely require the proof of its utility to improve plant growth and soil quality. In this context, we conducted a four-year field experiment between October 2010 to October 2014 on a fertile silty clay loam Albeluvisol in Norway to assess the impact of biochar on soil physical properties, soil microbial biomass, and oat and barley yield. The following treatments were included: Control (soil), miscanthus biochar 8 t C ha−1 (BC8), miscanthus straw feedstock 8 t C ha−1 (MC8), and miscanthus biochar 25 t C ha−1 (BC25). Average volumetric water content at field capacity was significantly higher in BC25 when compared to the control due to changes in BD and total porosity. The biochar amendment had no effect on soil aggregate (2–6 mm) stability, pore size distribution, penetration resistance, soil microbial biomass C and N, and basal respiration. Biochar did not alter crop yields of oat and barley during the four growing seasons. In order to realize biochar’s climate mitigation potential, we suggest future research and development efforts should focus on improving the agronomic utility of biochar in engineered fertilizer and soil amendment products.

1. Introduction

The challenge of producing more food for a growing world population while also mitigating climate change demands new solutions for managing agricultural systems [1]. The application of biochar to soil has received increasing attention as an alternative method for increasing long-term soil carbon levels while potentially improving soil quality and crop productivity [2]. Biochar is the term given to charcoal or carbonized biomass when it is used for the purpose of soil carbon sequestration and for improving soil fertility [3]. Meta-analyses confirm that biochar can improve soil physical and hydrological functioning [4] and can reduce N2O and CH4 emissions [5,6]. Across multiple studies, biochar has been shown to increase crop yields on average by 25% in the tropics but has had no effect in temperate regions [7]. In Norway, biochar application is recognized as one of several methods with the potential to significantly reduce the carbon footprint of the agricultural sector [8]. Our previous investigations using the same biochar and soil used in this study confirm a low annual C mineralization rate of 0.8% and estimated mean residence time of >100 years for biochar in the soil [9].
While climate benefits of biochar application appear promising, adoption by farmers requires a demonstration of its safety and, ideally, its benefit in terms of soil quality and crop yield. Previous biochar agronomic studies have shown that biochar can enhance water retention [10,11], which is often attributed to the large surface area and intra-porosity of biochar and its ability to alter inter-pore porosity between mineral soil particles [12]. Biochar has been shown to both increase saturated hydraulic conductivity (Ksat) in clay soil and decrease it in sandy soil [13,14] due to biochar either filling pore spaces in sand or opening pore channels in clay [15]. However, the results from studies on biochar effects on Ksat vary widely according to the soil, type of biochar used, and amendment rate [4]. Several studies report improvements in soil structure, which is indicated by increased aggregate stability [11,16,17] and reduced penetration resistance (PR) [18,19]. Once again, the mechanisms involved rely upon interactions between biochar and soil properties. In clay soils, biochar has been shown to reduce soil tensile strength and the plasticity index (degree of swelling/shrinkage), but usually requires large application rates [20,21,22].
The impact of biochar on soil biota has received less attention, but studies to date show increases in microbial abundance in the short to medium term [23,24]. The effects seem to be more pronounced in weathered soils where soil organic matter is often a limiting factor [25]. Mechanisms for increases in microbial biomass and changes in microbial community diversity include direct effects from labile C fractions present in fresh biochar and/or indirect effects brought about by short-term changes to soil physio-chemical conditions such as pH [26].
Our study was the first field trial testing of biochar in Norway. The objectives were to assess the agronomic effects of miscanthus biochar under field conditions over four years and to give farmers and authorities in Norway insight for the suitability of biochar as a climate change mitigation method. Our results provide an agronomic context to Reference [9] (where we previously investigated biochar C stability from the same field site). In the present study, we hypothesized that biochar could improve soil water retention and alleviate short-term soil water deficits as are common in the early summer in Norway. This, we proposed, would indirectly lead to increased plant growth and crop yield. Furthermore, we hypothesized that the relative stability of the biochar carbon would mean that relatively large amounts of biochar could be added to improve soil physical conditions without leading to microbial N-immobilization, which is usually the case with the addition of high C:N organic materials.

2. Materials and Methods

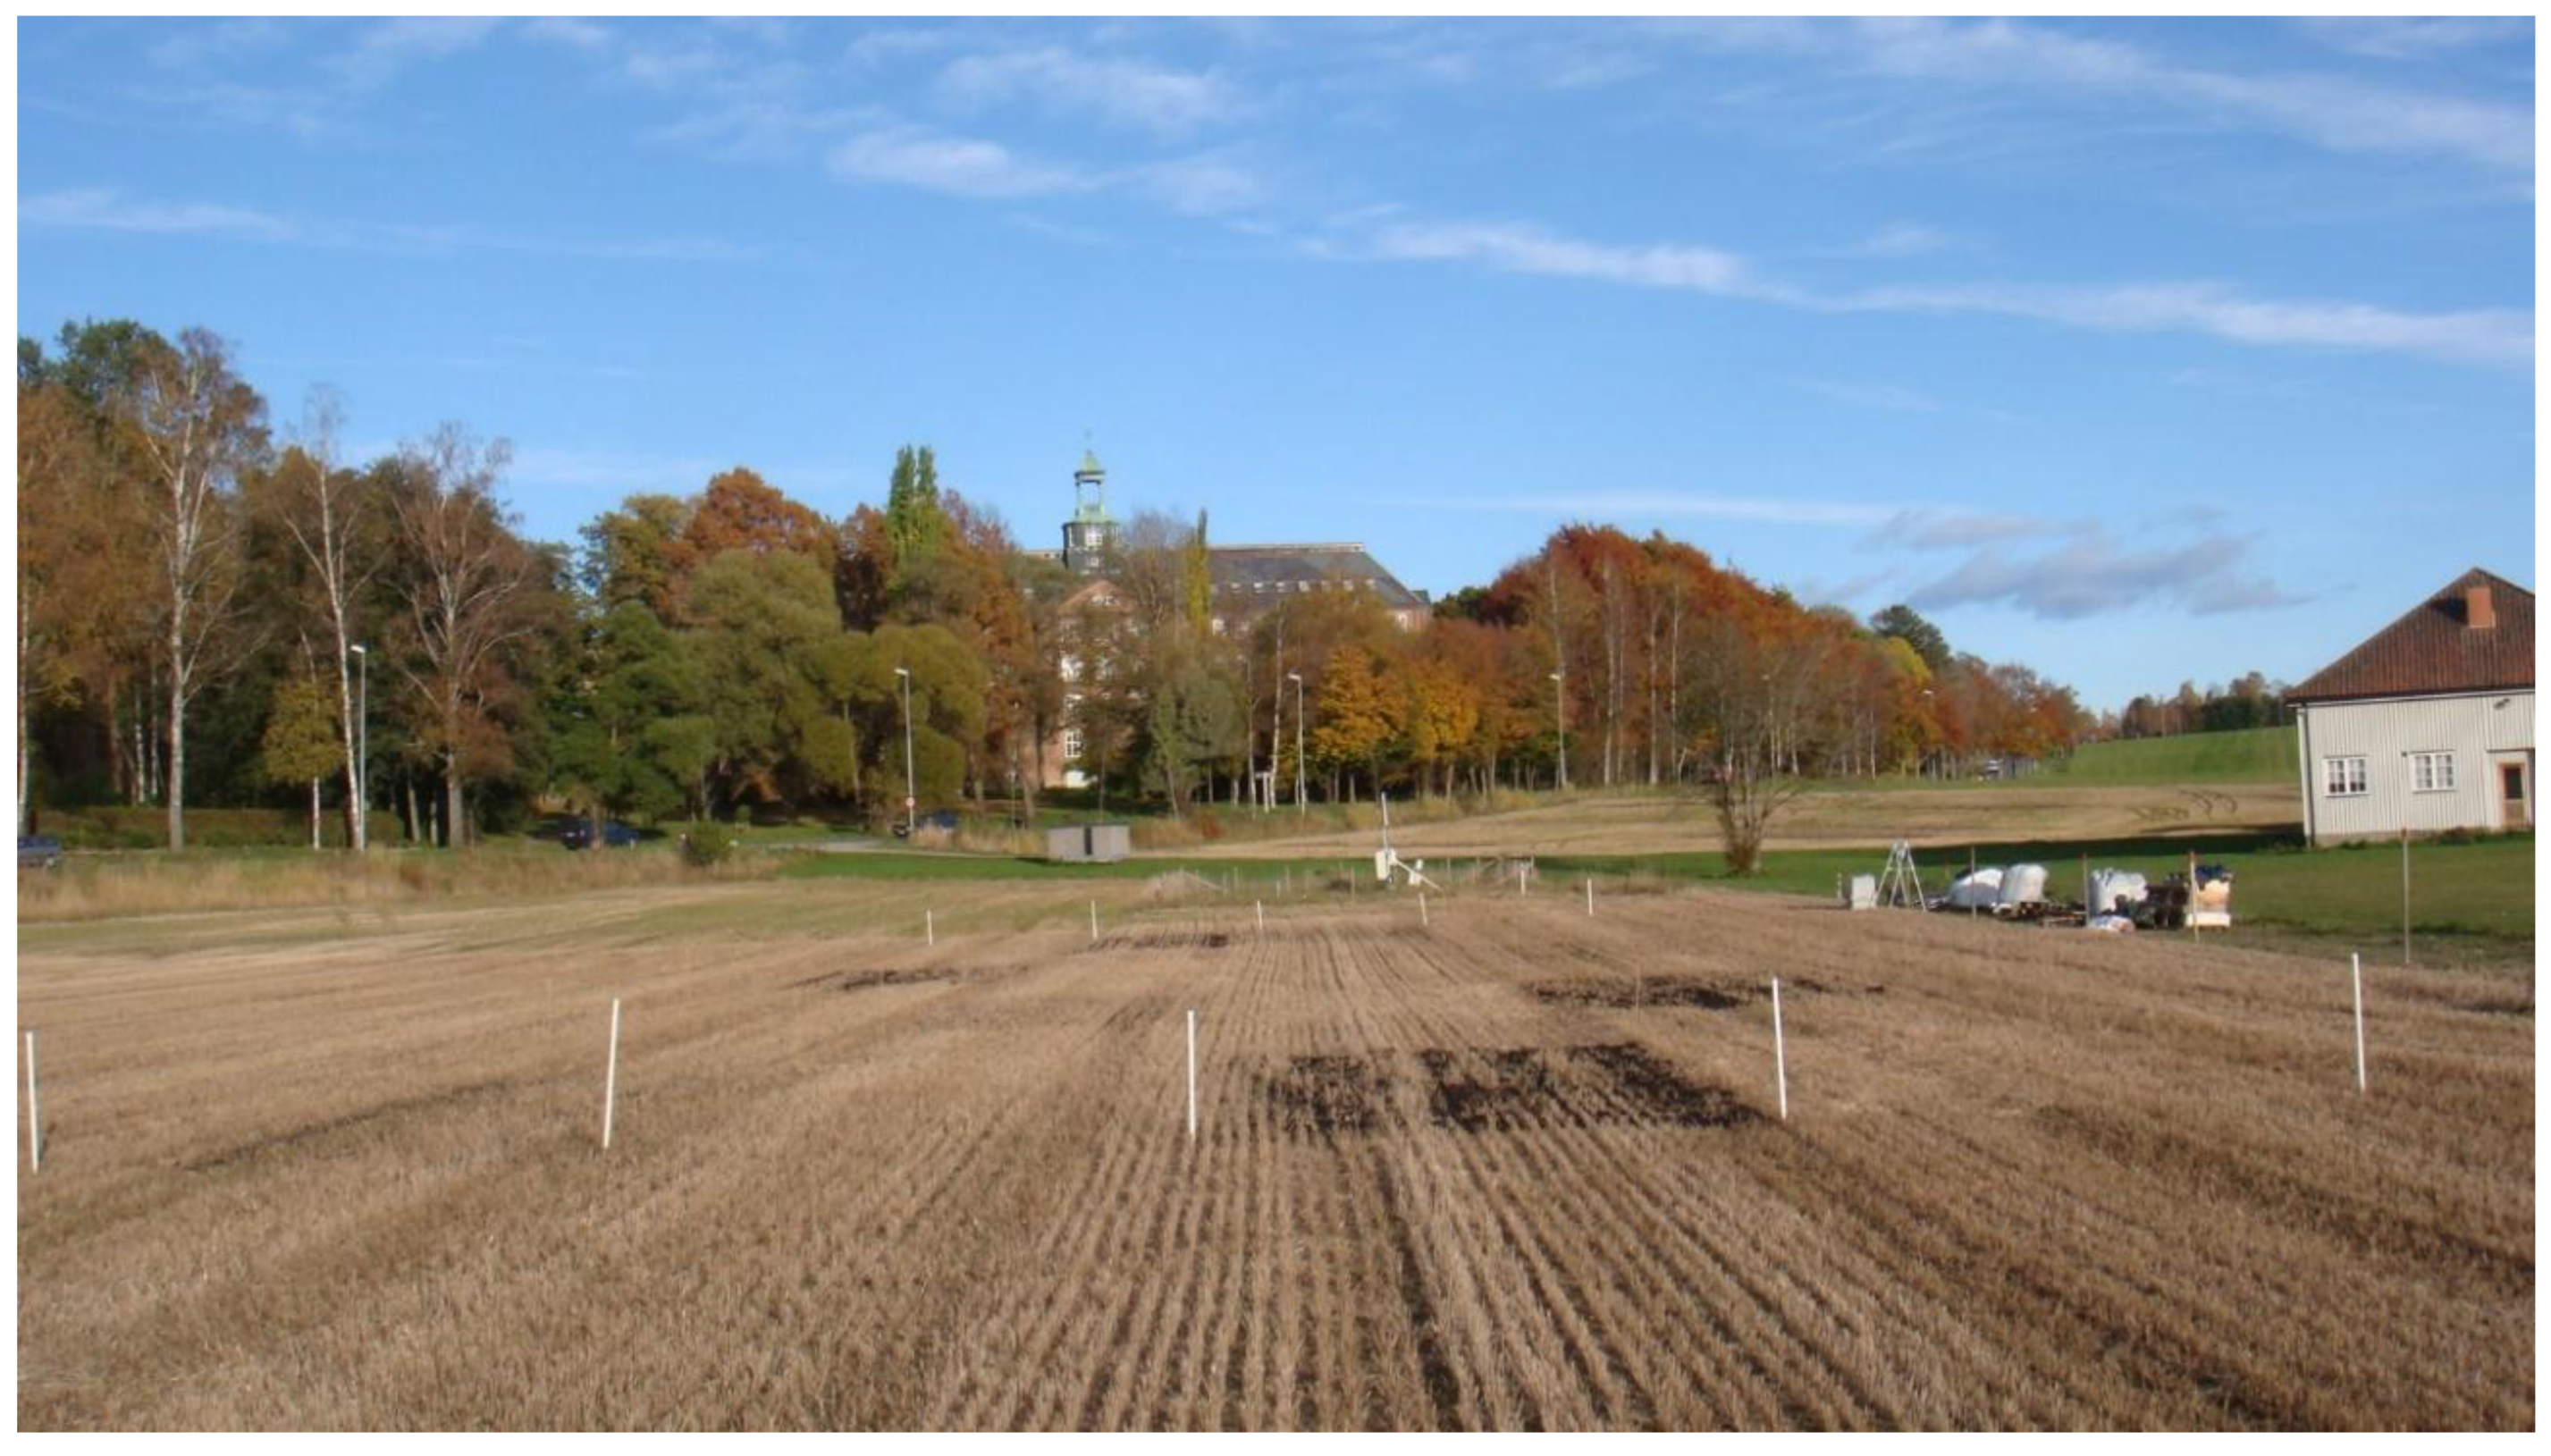
2.1. Field Description and Experimental Design

A field experiment was conducted from September 2010 to October 2014 at the Norwegian University of Life Sciences (NMBU) field station in Ås, Norway (59°39′51″ N 10°45’40″ E) (Figure 1). The field had been used for field research for grain and grass production since the 1950s. Weather data (Table S1) collected 1.3 km from the field site at the NMBUs weather station.
The soil is a silty clay loam Albeluvisol (WRB classification) with an average content of 27% clay, 43% silt, and 30% sand. The biochar was produced from Miscanthus giganteous straw by Pyreg Gmbh (DE) in a continuous slow pyrolysis machine, which is operated on a commercial basis. Pyreg reported a working temperature range between 500 and 750 °C during the production of the biochar. The biochar was cooled and moistened with water to approximately 35% moisture content after exiting the pyrolysis reactor.
The experiment was of randomized complete block design with 4 treatments × 4 blocks. Plots were 8 m × 4 m and buffer areas between blocks were 6 m wide. The four treatments consisted of: Control (no organic amendments), Miscanthus biochar 8 t C ha−1 (BC8), Miscanthus straw (unpyrolyzed) 8 t C ha−1 (MC8), and Miscanthus biochar 25 t C ha−1 (BC25). Dose units are given in tons C to show that equivalent amounts of carbon were added in the MC8 and BC8 treatments. Corresponding BC application rates and mass percent concentrations in the 23 cm Ap soil horizon were 11.4 t BC ha−1 or 0.38% (w/w) for BC8 and 35 t BC ha−1 or 1.16% (w/w) for BC25. Miscanthus was chosen as a feedstock because it is a C3 plant with contrasting δ13C to the C4 soil, which was relevant for the primary objective of the field experiment as reported in Rasse et al. [9] (i.e., biochar-C stability over two years under field conditions). Biochar or Miscanthus straw were applied and raked out on the surface of the plots in September 2010 and all plots (including controls) were then mouldboard ploughed to a depth of 23 cm. Mouldboard ploughing resulted in the biochar and straw being distributed in concentrated diagonal seams in the Ap horizon in 2011 (Figure S1A). Further ploughing and harrowing in 2012–2014 resulted in more evenly distributed biochar and resulted in a more even distribution throughout the Ap (Figure S1B) even though biochar patchiness persisted to some degree, which we discovered by visual inspection of soil during soil sampling campaigns. Tillage operations were the same across all treatments over the experiment period and consisted of autumn ploughing and spring harrowing. The field was sown with oat on 9 May 2011, barley on 19 May 2012, and oat on 3 June 2013 and 27 May 2014. Fertilizer (Yaramila ™ NPK 22-3-10, Yara Norge AS, Oslo, Norway) was applied at a rate of 550 kg ha−1 (110 kg N, 16.5 kg P, and 55 kg K ha−1) on an annual basis at the time of seeding.

2.2. Soil and Biochar Analysis (Table 1)

For soil pH, 11 g of field moist soil was shaken for 1 hour in 50 mL of distilled water and left to stand for 3 h before measurement with a pH electrode. Biochar pH was measured with distilled water using a 1:5 (w/w) ratio. Shaking time was increased to 1.5 h to increase equilibration between biochar surfaces and the solution [27]. Proximate and elemental analyses and heavy metal content of biochar were conducted by Eurofins Ost Gmbh (Aschheim-Dornach, Germany), according to standards DIN5178 (H2O), DIN5179 (Ash), DIN51720 (VM), DIN51734 (FC), DIN51732 (C,H,N), DIN51733 (O), 51724-3 (S), NS EN ISO 11885 (As, Pb, Cr, Ni), NS 4768 (Hg), and NS 4781-1 (Cd). Total N and P, NO3, and NH4 in soil were measured by the ALS labs, Norway, according to EN-ISO standards. Plant-available P, Ca, K, and Mg in soil and biochar were measured in-house using the Egners AL (ammonium lactate) method [28]. The extraction fluid (pH 3.75) was a mixture of ammonium lactate (0.1 mol L−1) and acetic acid (0.4 mol L−1). Specific surface area for biochar was measured by N adsorption–desorption isotherms at 77 K using a Micromeritics Tri Star 3000 instrument (Micromeritics Instrument Corp., Norcross, GA, USA). Before analysis, the samples were dried at 120 °C and degassed overnight in a VacPrep 061 Degasser (Micromeritics Instrument Corp.) at 0.05 mbar and 393 K. The Brunauer–Emmet–Teller equation was used to calculate the specific surface area [29]. Particle size distribution of biochar was determined via sieving 285 g and by using a Retsch AS200 (Retsch GmbH, Haan, Germany) nested machine sieve with eight size fractions between 63 µm and 4 mm. Sieving was done initially for 3 min at 55 amplitude and then the largest fraction (2–4 mm) was redistributed into two sieves to make sure that smaller particles were not floating on top of a mass of larger biochar particles and being prevented from passing through. Then a second 3 min of sieving was repeated.

2.3. Sampling and Analysis Methods

2.3.1. Soil Sampling

For soil chemical analysis, soil sampling was done using a 2 cm wide soil auger to take 10 sub-samples per plot to a depth of 23 cm. The soil sub-samples were mixed to form one composite sample per plot. The same method was used for taking soil samples for microbial analysis and were taken in the summer of 2012.
Bulk density (BD) was measured in 2012 and 2014 with 4 × 100 cm3 metal rings in each plot. Intact 250 cm3 soil cores were taken (2–9 cm and 12–19 cm) in 2014 for the water retention experiment and BD. Total porosity was calculated according to the formula below.
  P o r o s i t y = ( 1 B D M D ) × 100   ( v o l % )  
We assumed a material density (MD) of 2.65 g cm−3 for mineral soil and skeletal density of 1.5 g cm−3 for biochar [30,31] and by that adjusted biochar/soil mix density to 2.646 g cm−3 and 2.637 g cm−3 in BC8 and BC25 to account for the lighter biochar particles present. Soil aggregates used for aggregate stability tests were taken from the Ap horizon of the field in 2015 by using a shovel to collect a representative 2.5 L bulk sample from each plot. Plant roots, organisms, and soil that was compacted from the spade were excluded from the sample. Soil aggregates >30 mm were carefully broken into smaller aggregates by hand and air-dried at 20 °C for one week.

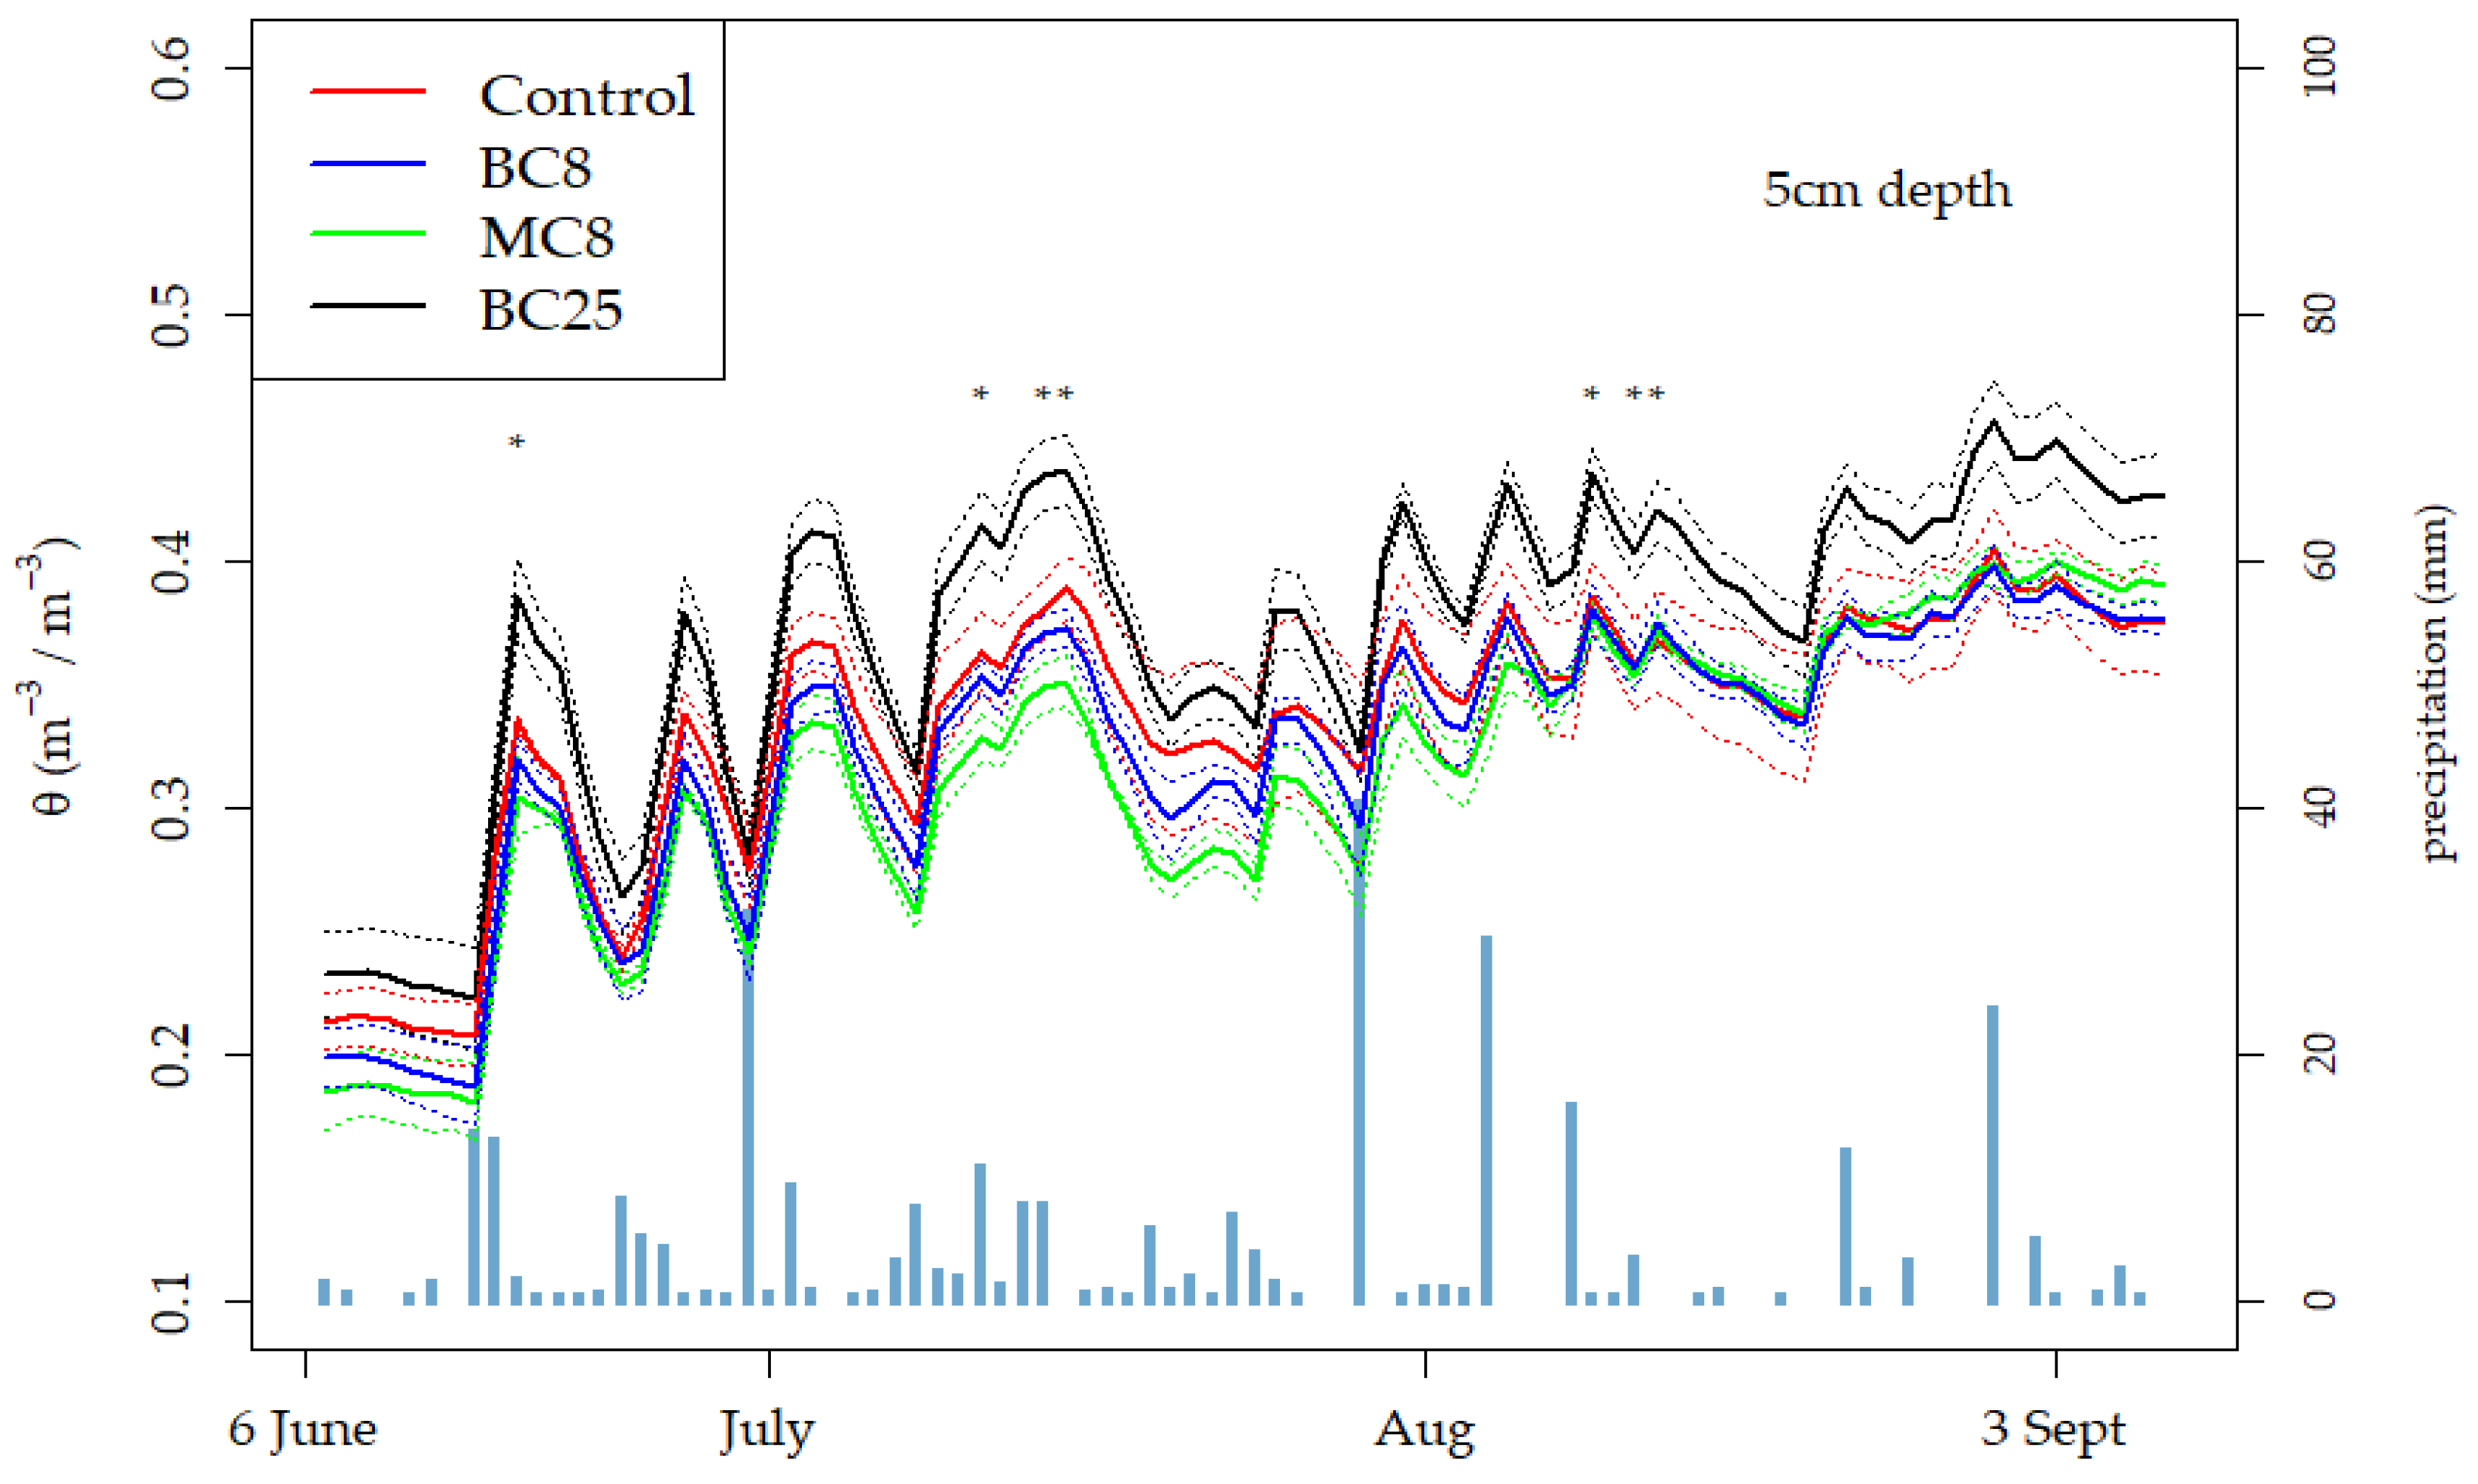
2.3.2. Soil Water Content in the Field

Soil moisture content was measured every hour in the growth seasons of 2012 (n = 3) and 2014 (n = 4) using Time Domain Reflectance (TDR) soil moisture sensors (5TM model, Decagon Devices, Inc., Pullman, WA, USA). One TDR was inserted horizontally in undisturbed soil at 5 cm and 15 cm depth of each plot. The TDRs were calibrated in the lab using dried soil repacked in 1 liter containers with and without biochar at known gravimetric and volumetric water contents. Linear regressions were derived between probe output (mV) and VWC for the control and biochar amended soils BC8 and BC25 and these equations (S.8) were used to correct field measured TDR data.

2.3.3. Soil Water Retention and Pore Size Distribution from Intact Cores

Soil water retention characteristics θ(h) were measured between pF 1–3.2 with the evaporation method [32] and by using a Ku-pF apparatus (Umwelt-Geräte-Technik GmbH, Müncheberg, Germany). In the lab, soil cores were saturated with water from below after which two micro tensiometers were inserted horizontally in pre-drilled holes before being placed on the Ku-pF apparatus. The cores were weighed automatically every 10 min over 2 weeks whereby the tensiometer reading and sample weight loss were converted to matric potential (cm head) and volumetric water content (θ) values at each time step. Available water for the plants was calculated as the difference of θ between field capacity (FC) (−33 kPa) and the permanent wilting point (PWP) (−1500 kPa). Due to the limited pressure range of the tensiometers at the dry end of the soil water retention curve (<1000 kPa), θ and matric potential at the dry end were estimated by fitting observed data to the van Genuchten-Maulem model (VGM) [33] in R (R Core Development Team, Vienna, Austria). The permanent wilting point was estimated by the use of a pedotransfer function developed by Reference [34], which calibrated the function based on the SOM (%), gravel (%), and BD of 192 silty clay loam soil samples from South East Norway.
The high frequency measurements of matric potential and soil water content during evaporation can be directly related to emptying of water from soil pores of different sizes. Pore size distribution in the core samples was estimated by taking the derivative of Theta (pF) and converting pF in pore size following the equation from Reference [35].
  d =   3000 10 p F  
where d represents the equivalent pore diameter in µm corresponding to a given level of matric potential.
Using Equation (2), we further estimated the proportion of the soil volume occupied by pores characterized by d ≤ 3.5 µm and by pores with 3.5 µm < d < 300 µm, noted respectively P < 3.5 and P = 3.5 to 300.
  P < 3.5   = θ ( log ( h ) ( 3000 3.5 ) )  
  P < 300   = θ ( log ( h ) ( 3000 300 ) )  
  P 3.5 300   = P < 300   P < 3.5    
where θ is the volumetric soil water content as a function of the matric potential (pF).

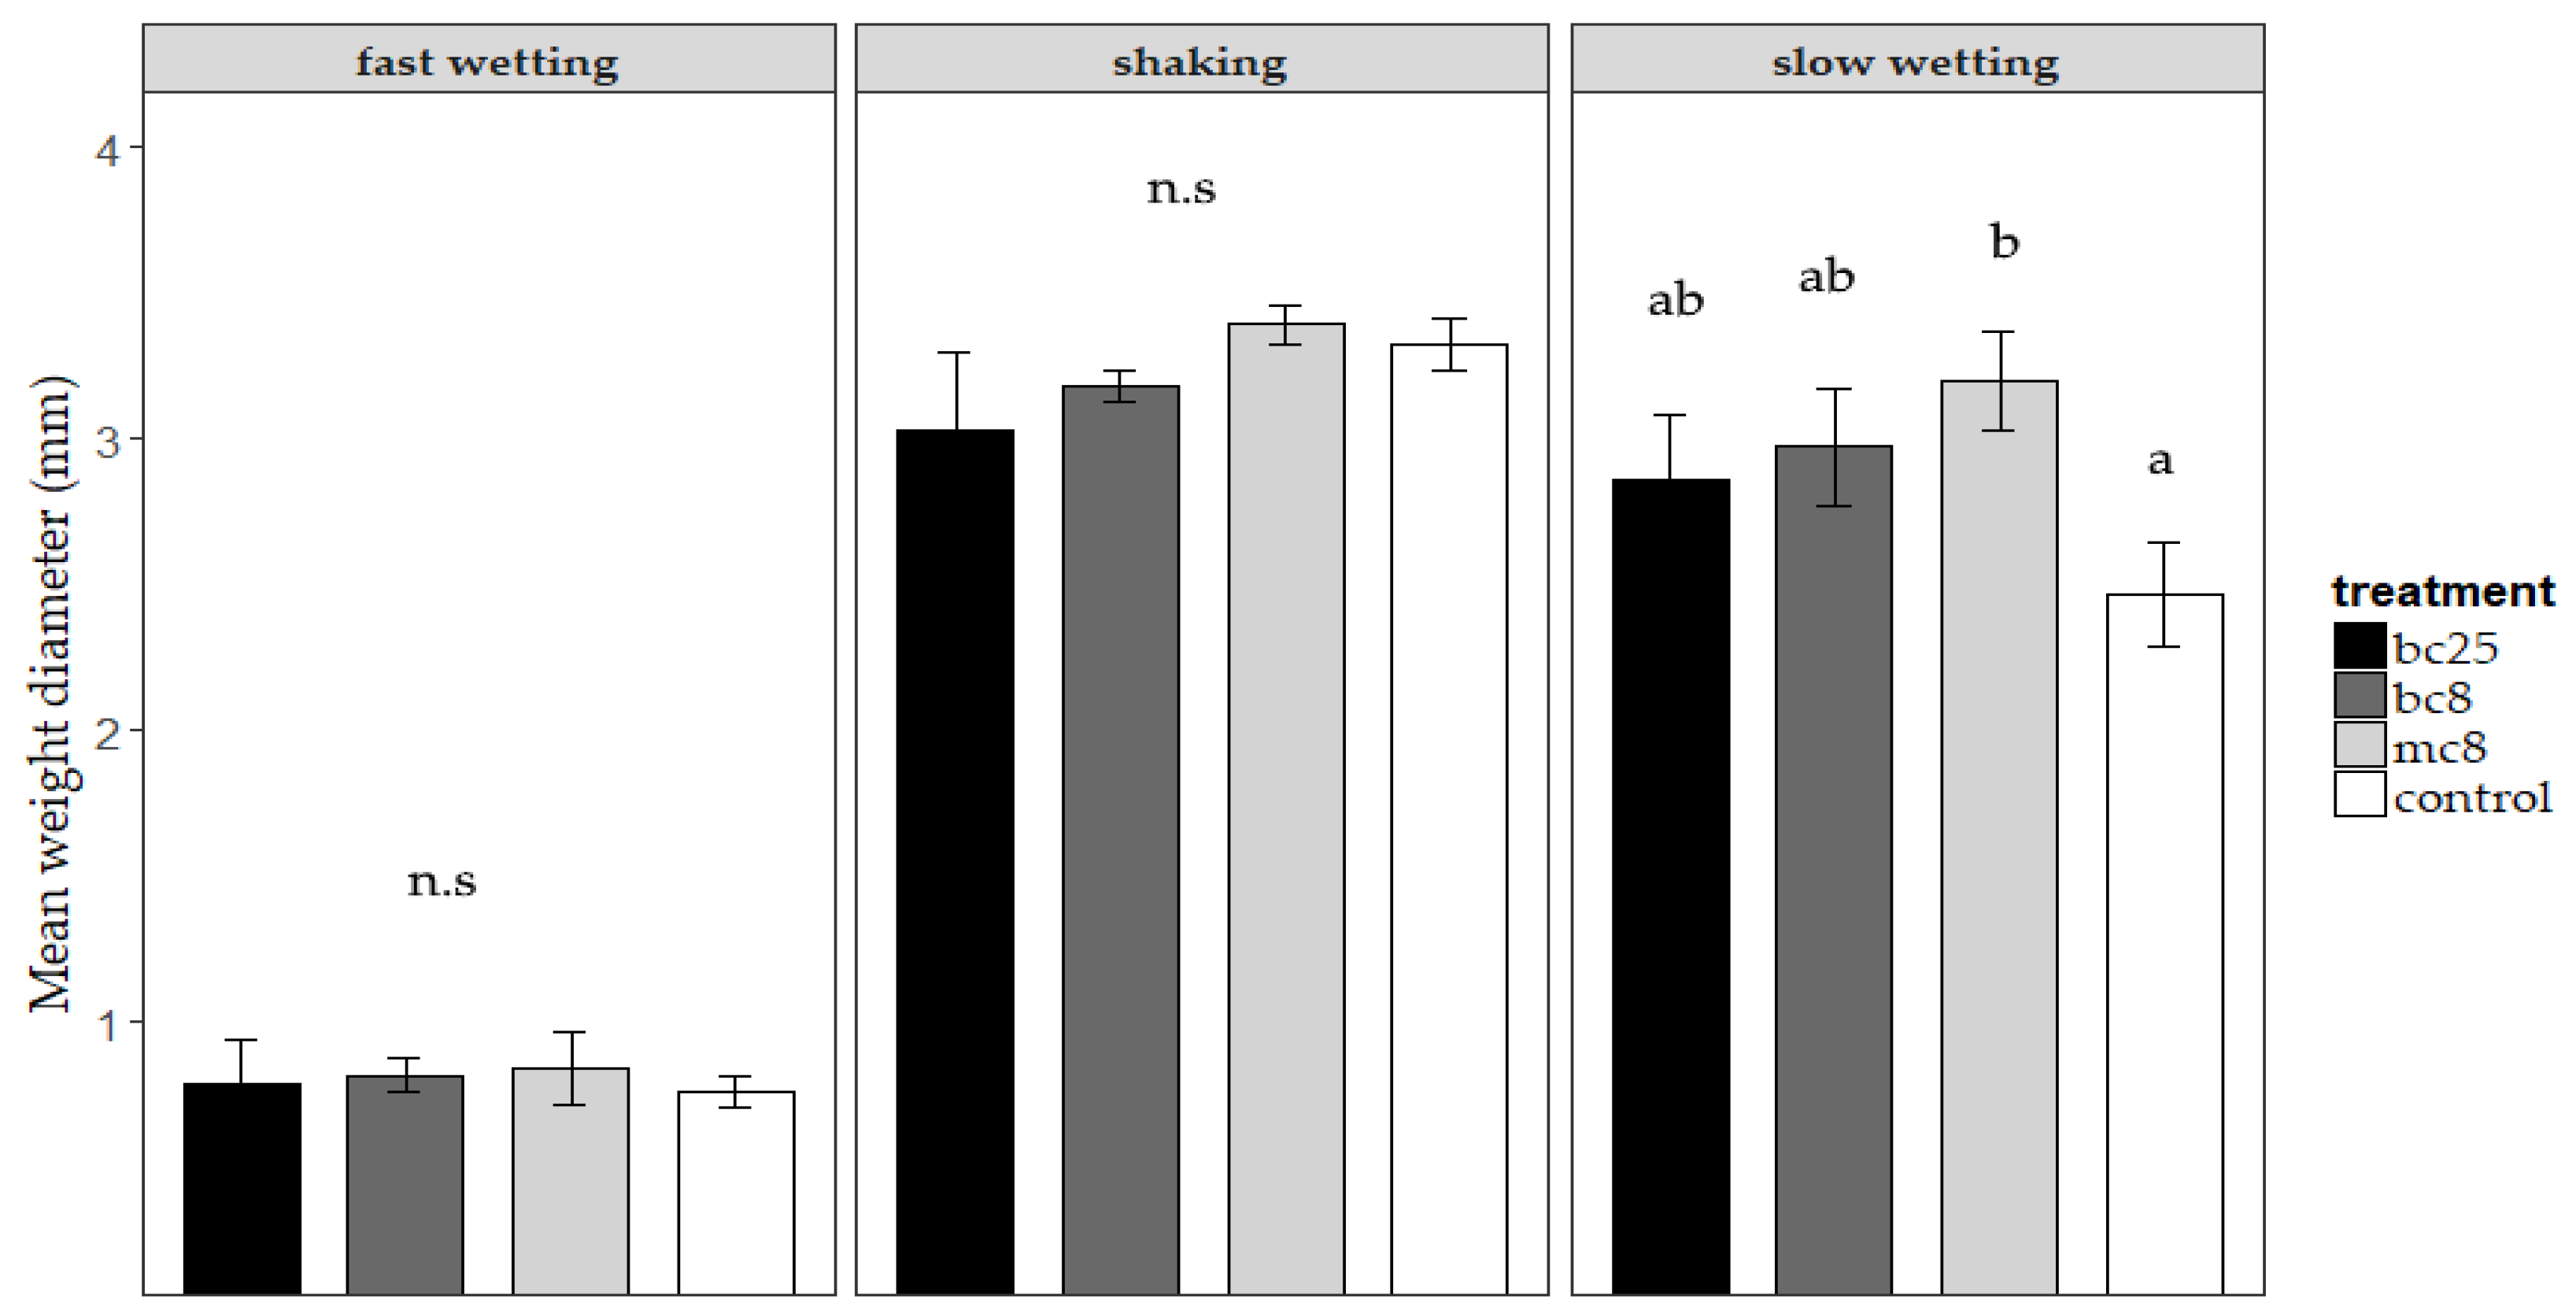
2.3.4. Aggregate Stability

Aggregate size distribution in size classes: <0.6, 0.6–2, 2–6, 6–20, and >20 mm were determined by dry sieving 2.5 L of air-dried soil for 3 min using a mechanical sieving apparatus, which is described by Reference [36].
Wet sieving was performed on aggregates from the 2–6 mm size class and by using a wet sieving apparatus (Eijkelkamp, Giesbeek, The Netherlands) following the method described by Kemper and Rosenau (1986). The procedure involved placing 4 g of 2–6 mm aggregates (×4 replicates/treatment) in small sieves and exposing them to intermittent submerging in distilled water for 3.75 min. To avoid the artefact of premature aggregate breakdown, which can occur when trapped air in dry aggregates is expelled upon rapid exposure to water [37]. Samples were pre-wetted by exposure to a mist produced from a consumer electronic humidifier. After wet sieving, aggregates remaining on the sieve were dried, weighed, and then passed through a set of nested sieves to determine aggregate size classes >2 mm, 1–2 mm, 0.5–1 mm, 250–500 µm, 125–250 µm, 63–125 µm, and <63 µm to determine the Mean Weight Diameter (MWD), which was calculated by using the equation below.
  M W D = i   =   1 n D × W  
where D is the mean diameter of each size fraction (mm) and W is the proportion of the sample mass in the corresponding aggregate size fraction. The percentage of water stable aggregates (WSA) was also calculated as the percentage of aggregates in the 2–6 mm size range remaining on the sieve after the 3.75 min wet sieving exposure.
To elucidate upon how treatments affected the different aggregate breakdown mechanisms, further tests were conducted by using the methods of Le Bissonnais, 1996 [38]. In this case, the main mechanisms of aggregate breakdown, namely breakdown by compression of trapped air (slaking), breakdown by differential swelling, and mechanical breakdown by raindrop impact and physio-chemical dispersion are simulated by three tests: fast wetting (for slaking), slow wetting (for differential swelling), and shaking (for mechanical and physio-chemical dispersion). Aggregates were also pre-wetted with mist for the slow wetting test following the method mentioned previously. To evaluate results from all aggregate tests, a comparison was made with an MWD stability index developed by Le Bissonais [38].

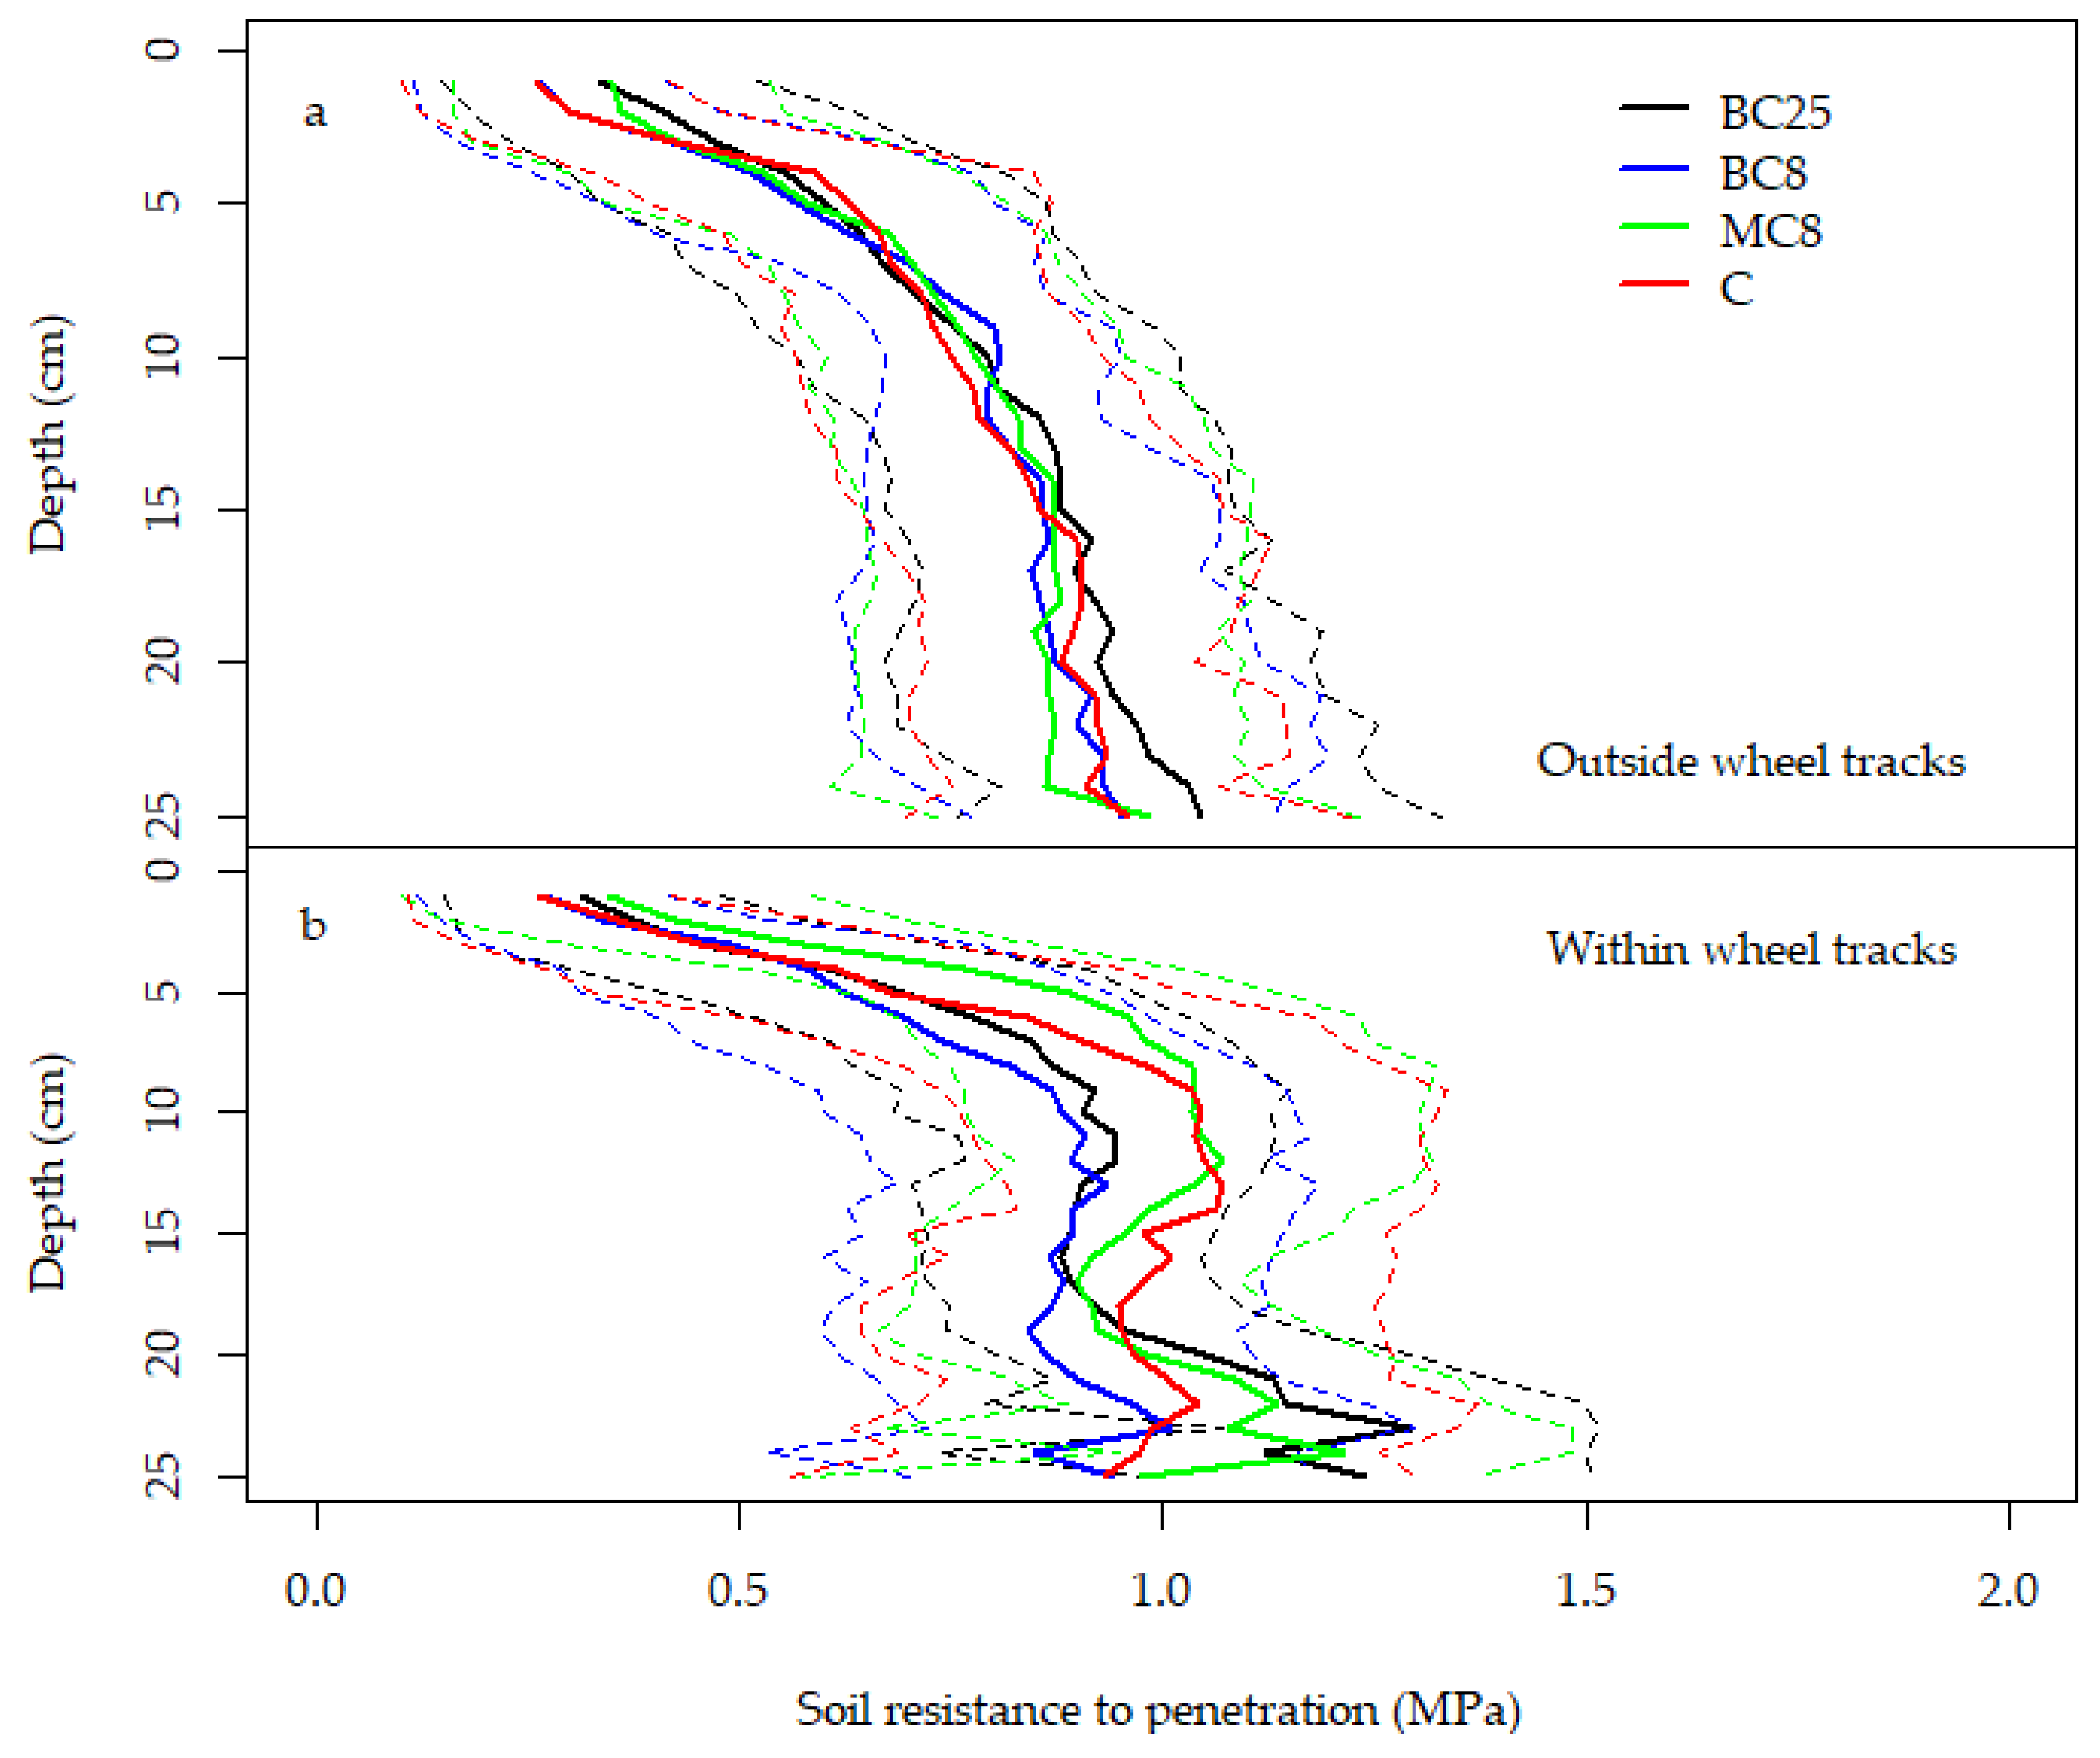
2.3.5. Soil Penetration Resistance

Soil penetration resistance (PR) was measured in October 2015 from 0–40 cm by using an electronic penetrometer (2 cm2 cone tip) that continuously logs depth and soil resistance upon probe insertion (Eijkelkamp Soil and Water, Giesbeek, The Netherlands). Ten measurements were conducted per plot (5 between tractor wheel tracks and 5 within tractor wheel tracks) to assess to what extent biochar moderated soil compaction. Soil BD and moisture were also measured (2–7 cm depth) alongside PR measurements, since these are known to influence PR [39].

2.3.6. Soil Microbial Biomass C and Respiration Potential

Soil microbial biomass C (Cmic) and N were determined by the chloroform fumigation extraction method [40,41]. Fumigations were carried out for three days in vacuum desiccators with alcohol-free chloroform. 15 g of soil of both fumigated and unfumigated field moist soils were extracted with 0.5 M K2SO4 (1:5, w:v). After filtration (Whatman n° 42, GE Healthcare Life Sciences, Buckinghamshire, UK), extracts were analyzed for organic C using a Total Organic Carbon analyzer (LabToc, Pollution and Process Monitoring limited, Kent, UK). Soil microbial biomass C and N were calculated by dividing the difference of total extract between fumigated and unfumigated samples with a Cmic extraction efficiency factor of 0.45 [42] and 0.54 for microbial biomass N [43].
Respiration potential [44] was measured as CO2 accumulation in the headspace (250 mL) of an amber bottle (Supelco, Merck KGaA, Darmstadt, Germany) from 20 g fresh soil at 15 °C in the dark after an overnight pre-incubation. Gas samples (4 mL) were taken at 0, 120, 150, and 180 min with an air-tight syringe (Hamilton Model 1005, The Hamilton Company, Reno, NV, USA) and analyzed with an infrared absorption gas analyzer (EGM-4, PP-Systems, Hitchin, UK). The respiration potential was estimated by linear regression of CO2-C against time.

2.3.7. Plant Grain and Straw Yields

Grain and straw yields were measured in 2011–2014 by using a field station harvester (Wintersteiger Nurserymaster elite). The harvested area of each plot measured 1.5 m × 6 m (9 m−2) and was located in the middle of the 32 m−2 plots so that plot edges were avoided. Grain quality, as measured by protein and fat content and 1000 grain weight, were measured in 2012 (Barley) and 2014 (Oat) for BC25 and control treatments only. For this, a subsample of 200 g was taken from the harvested grain from each plot for protein and fat content (via NIR spectrometry using an InfratecTM Grain Analyzer (Foss Analytics, Hilleroed, Denmark) and 1000 grain weight analysis.

2.4. Statistical Analysis

Statistical analyses were carried out by using packages from R software (The R Foundation for Statistical Computing, Vienna, Austria) [45] and SigmaPlot v.13. Statistical (Systat Software Inc., London, UK) significance was set at α = 0.05 for all analyses. Statistical differences between treatment means for grain and straw yield, aggregate stability tests, Cmic, Nmic, and respiration potential were tested with ANOVA and post-hoc multiple comparison of treatments vs. control via the Dunnett’s test if p < 0.05. The Welch two sample t-test was used to test differences between the mean grain protein and 1000 grain weight in BC25 and Control. Soil PR was summarized at 5 cm range intervals until 25 cm depth for both within and outside tractor tracks and treatment averages within these range intervals used for ANOVA. Hourly soil water content measurements from the TDR sensors were averaged for each day and daily averages were statistically analyzed via two-way repeated measures ANOVA with treatment and time as factors and Dunnett’s test for post hoc multiple pair comparison of treatments vs. the control by using SigmaPlot v.13 software. Daily averages were used for statistical analysis due to our observation that, within day soil, water content did not differ greatly and, therefore, the use of daily averages represented a simplified approach, which reduced data size and analysis complexity. For analysis of pore-size distribution, we used the lme4 package from R to perform a linear mixed effects analysis of the relationship between the volume of pores of various size and the manipulated parameters of the experiment (i.e., Biochar amendments and depth). As random effects, we had intercepts for the plot.

3. Results

3.1. Effects of Biochar on Bulk Density

There were no significant differences between the treatments in soil bulk density and porosity in 2012. However, bulk density was significantly lower by 7% in BC25 in 2014 compared to the control while the lower dose treatment (BC8) did not differ from the control (Table 2). There was a reduced standard error in BC25 and BC8 in 2014 compared to 2012. Total porosity was higher in BC25 compared to the control in 2014 while BC8 did not differ.

3.2. Soil Aggregate Distribution and Stability

Dry aggregate size distribution was not significantly different between treatments (Figure S4). The air-dry soil aggregates did not separate easily into smaller fractions via machine sieving possibly due to a moderately high clay content (27%) and hardening during air-drying. There was no significant differences among treatments for the percentage of 2 to 6 mm water stable aggregates remaining on the sieves after exposure to wet sieving (p = 0.19).
The addition of unpyrolyzed feedstock (MC8) significantly increased soil aggregate stability in the clay swelling test (slow wetting) compared to the control (p = 0.049) while biochar treatments had no significant effect (Figure 2). Across all treatments, only slaking (fast wetting) caused unstable soil aggregates (Figure 2, Table S2). Neither biochar nor its feedstock buffered the impact of slaking (fast wetting test) (Figure 2).

3.3. Soil Resistance to Penetration

Biochar amendments did not significantly moderate soil compaction as measured via the PR outside wheel tracks (p = 0.4) (Figure 3a) or inside the wheel tracks (p = 0.2) (Figure 3b). Volumetric soil water content and BD outside of the wheel tracks on the day of PR measurements were 34% ± 2% and 1.25 g cm−3 for BC25 and 31% ± 2% and 1.30 g cm−3 for the control (not significant). Volumetric water content and BD were not measured for BC8 and MC8.

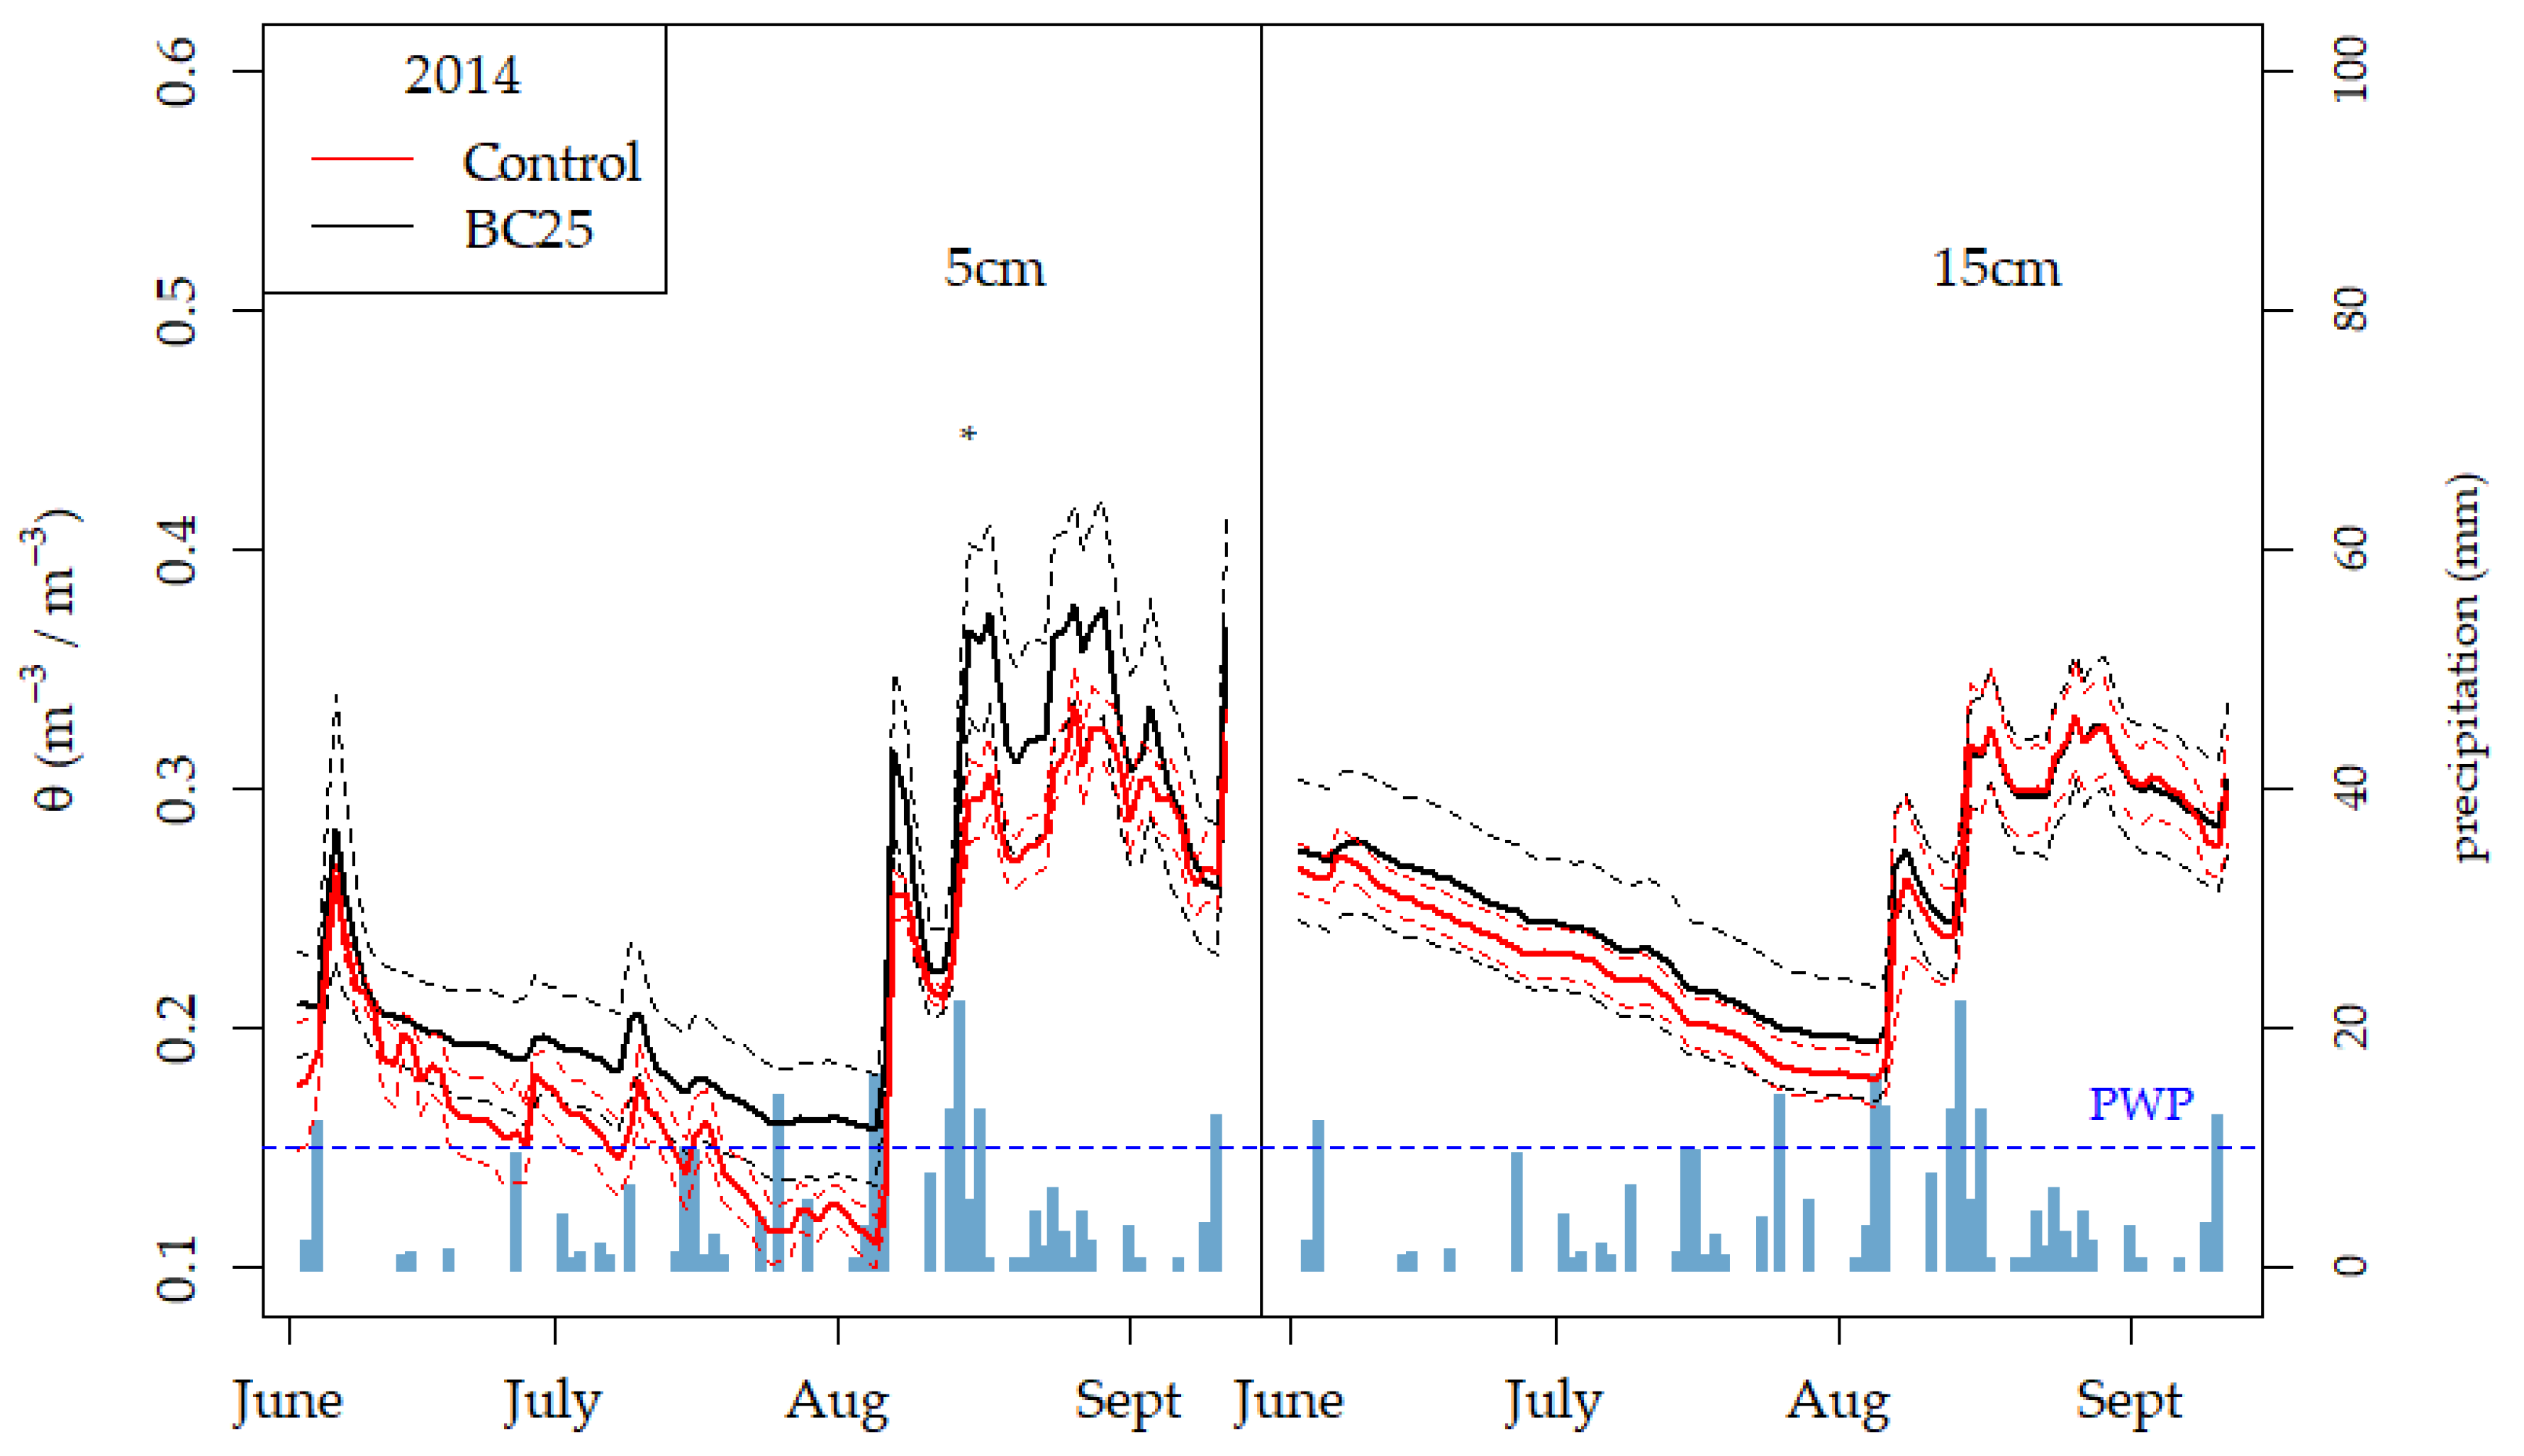
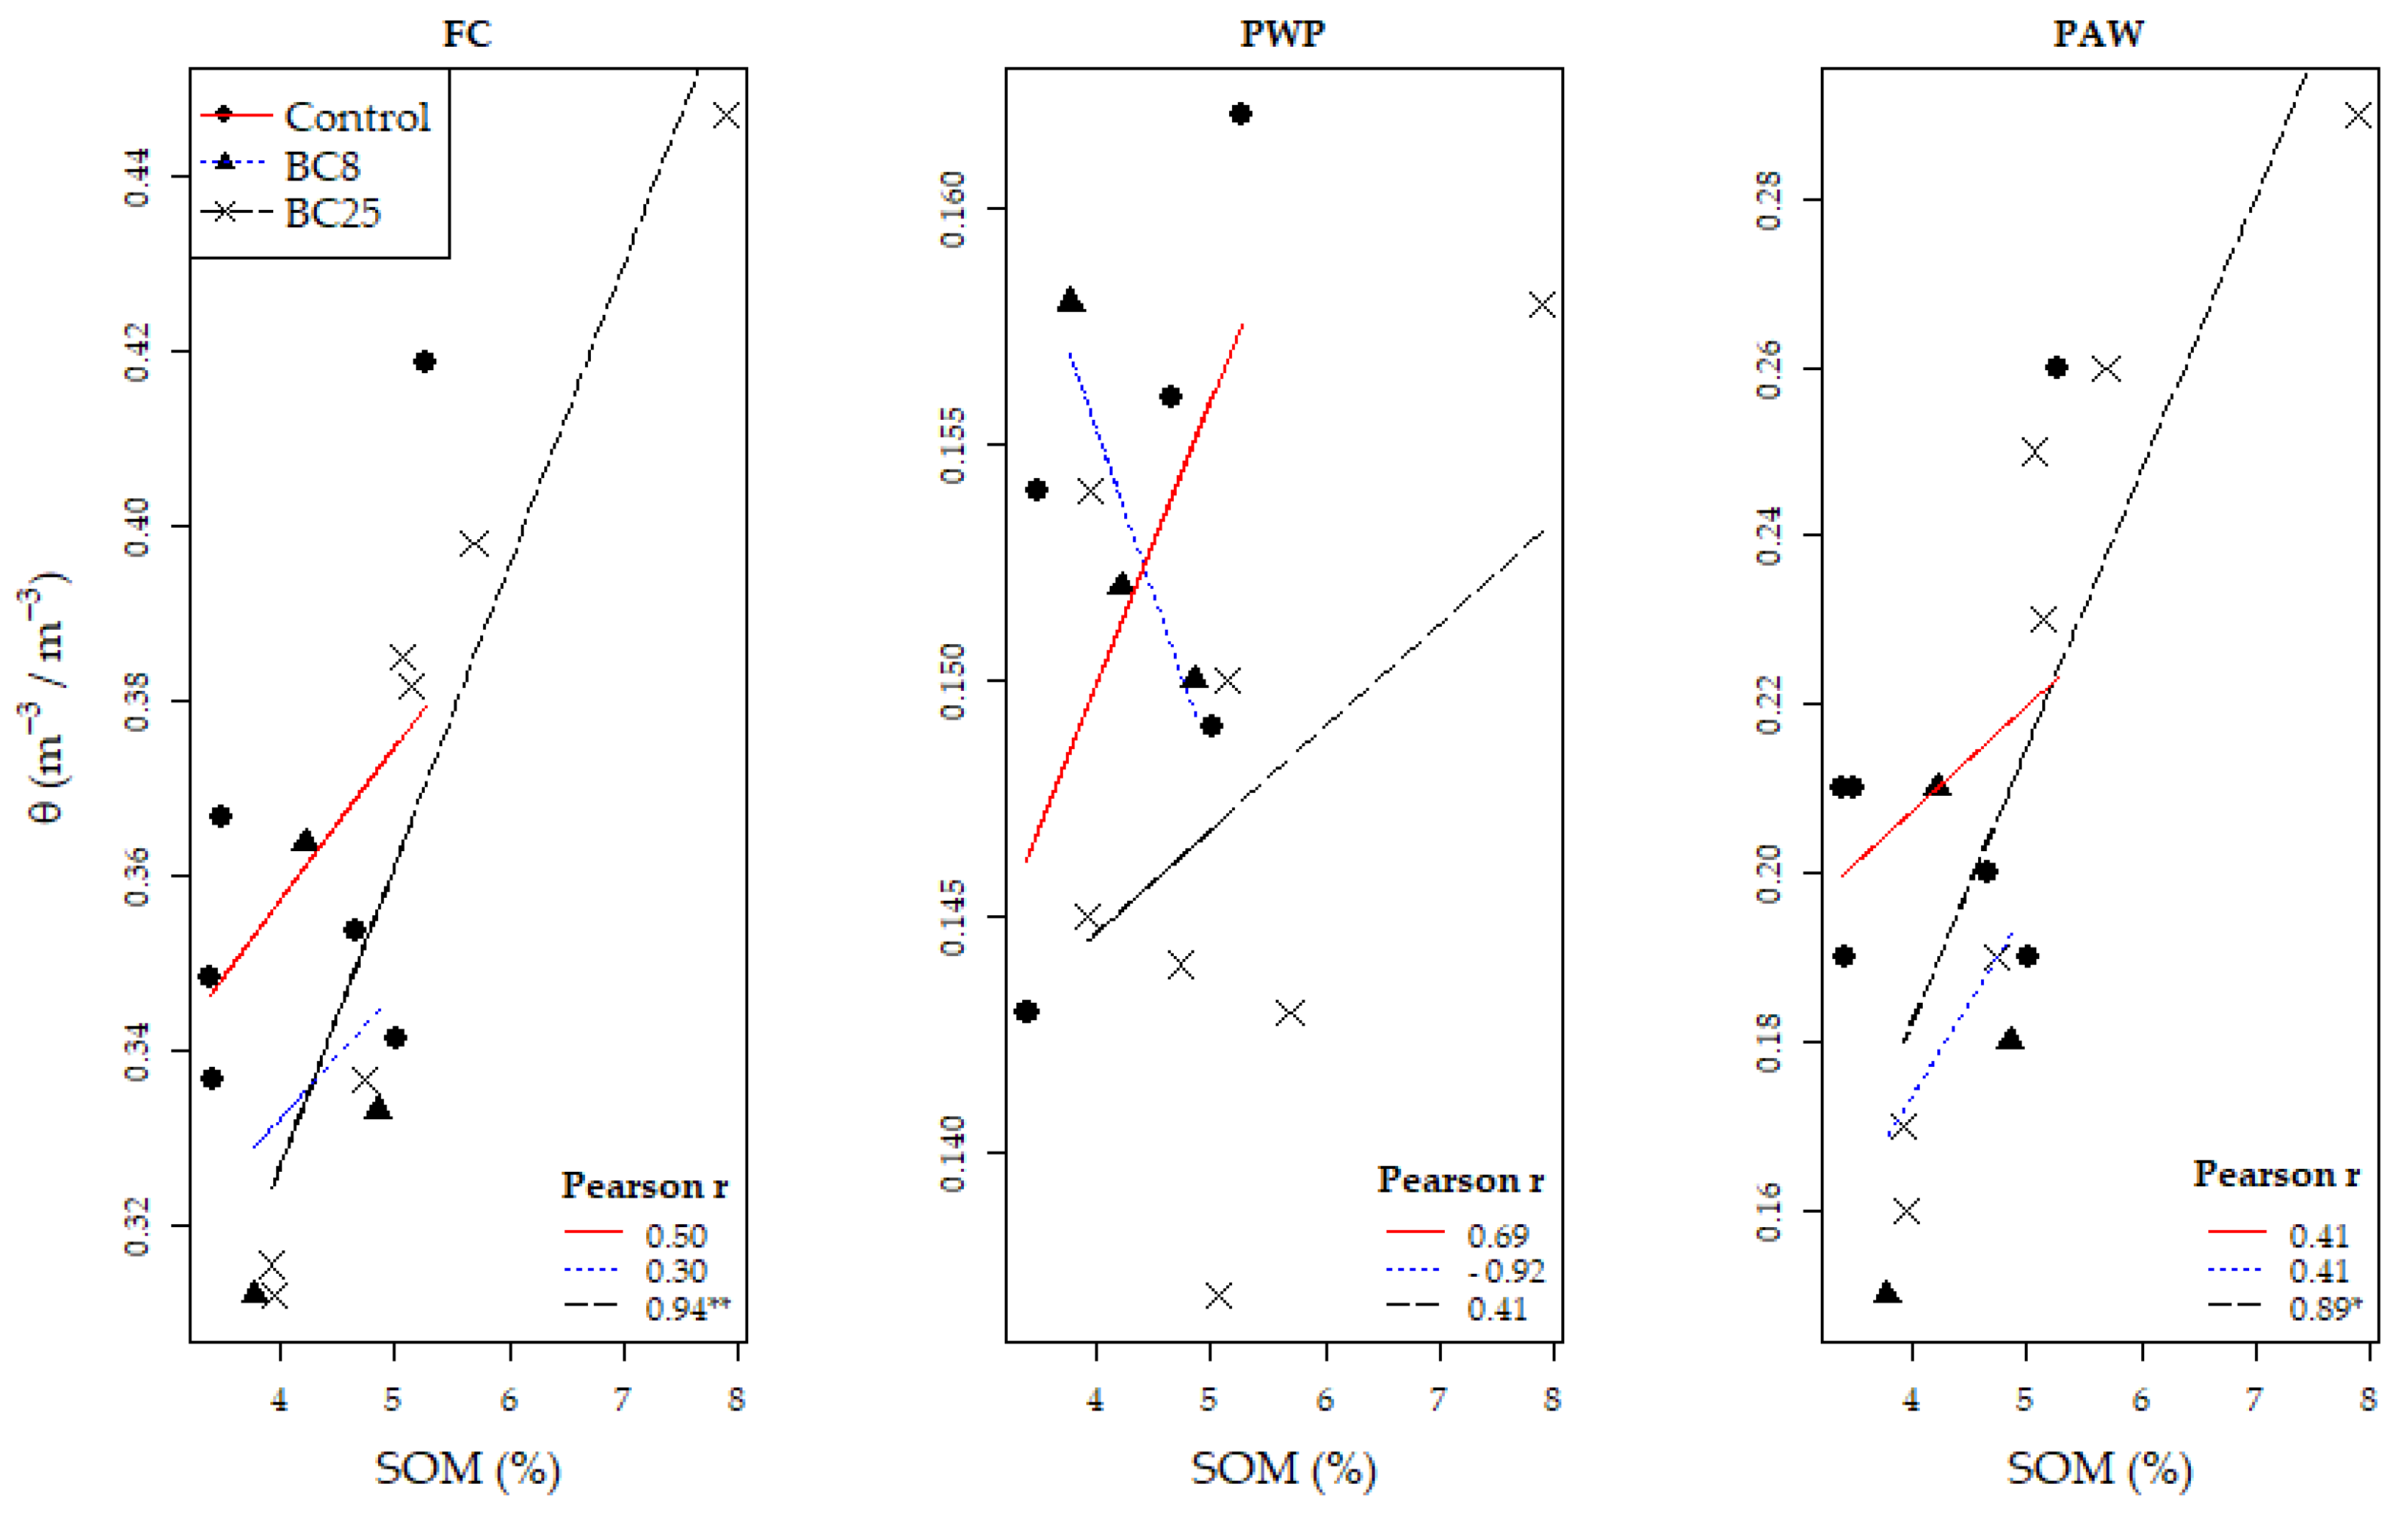
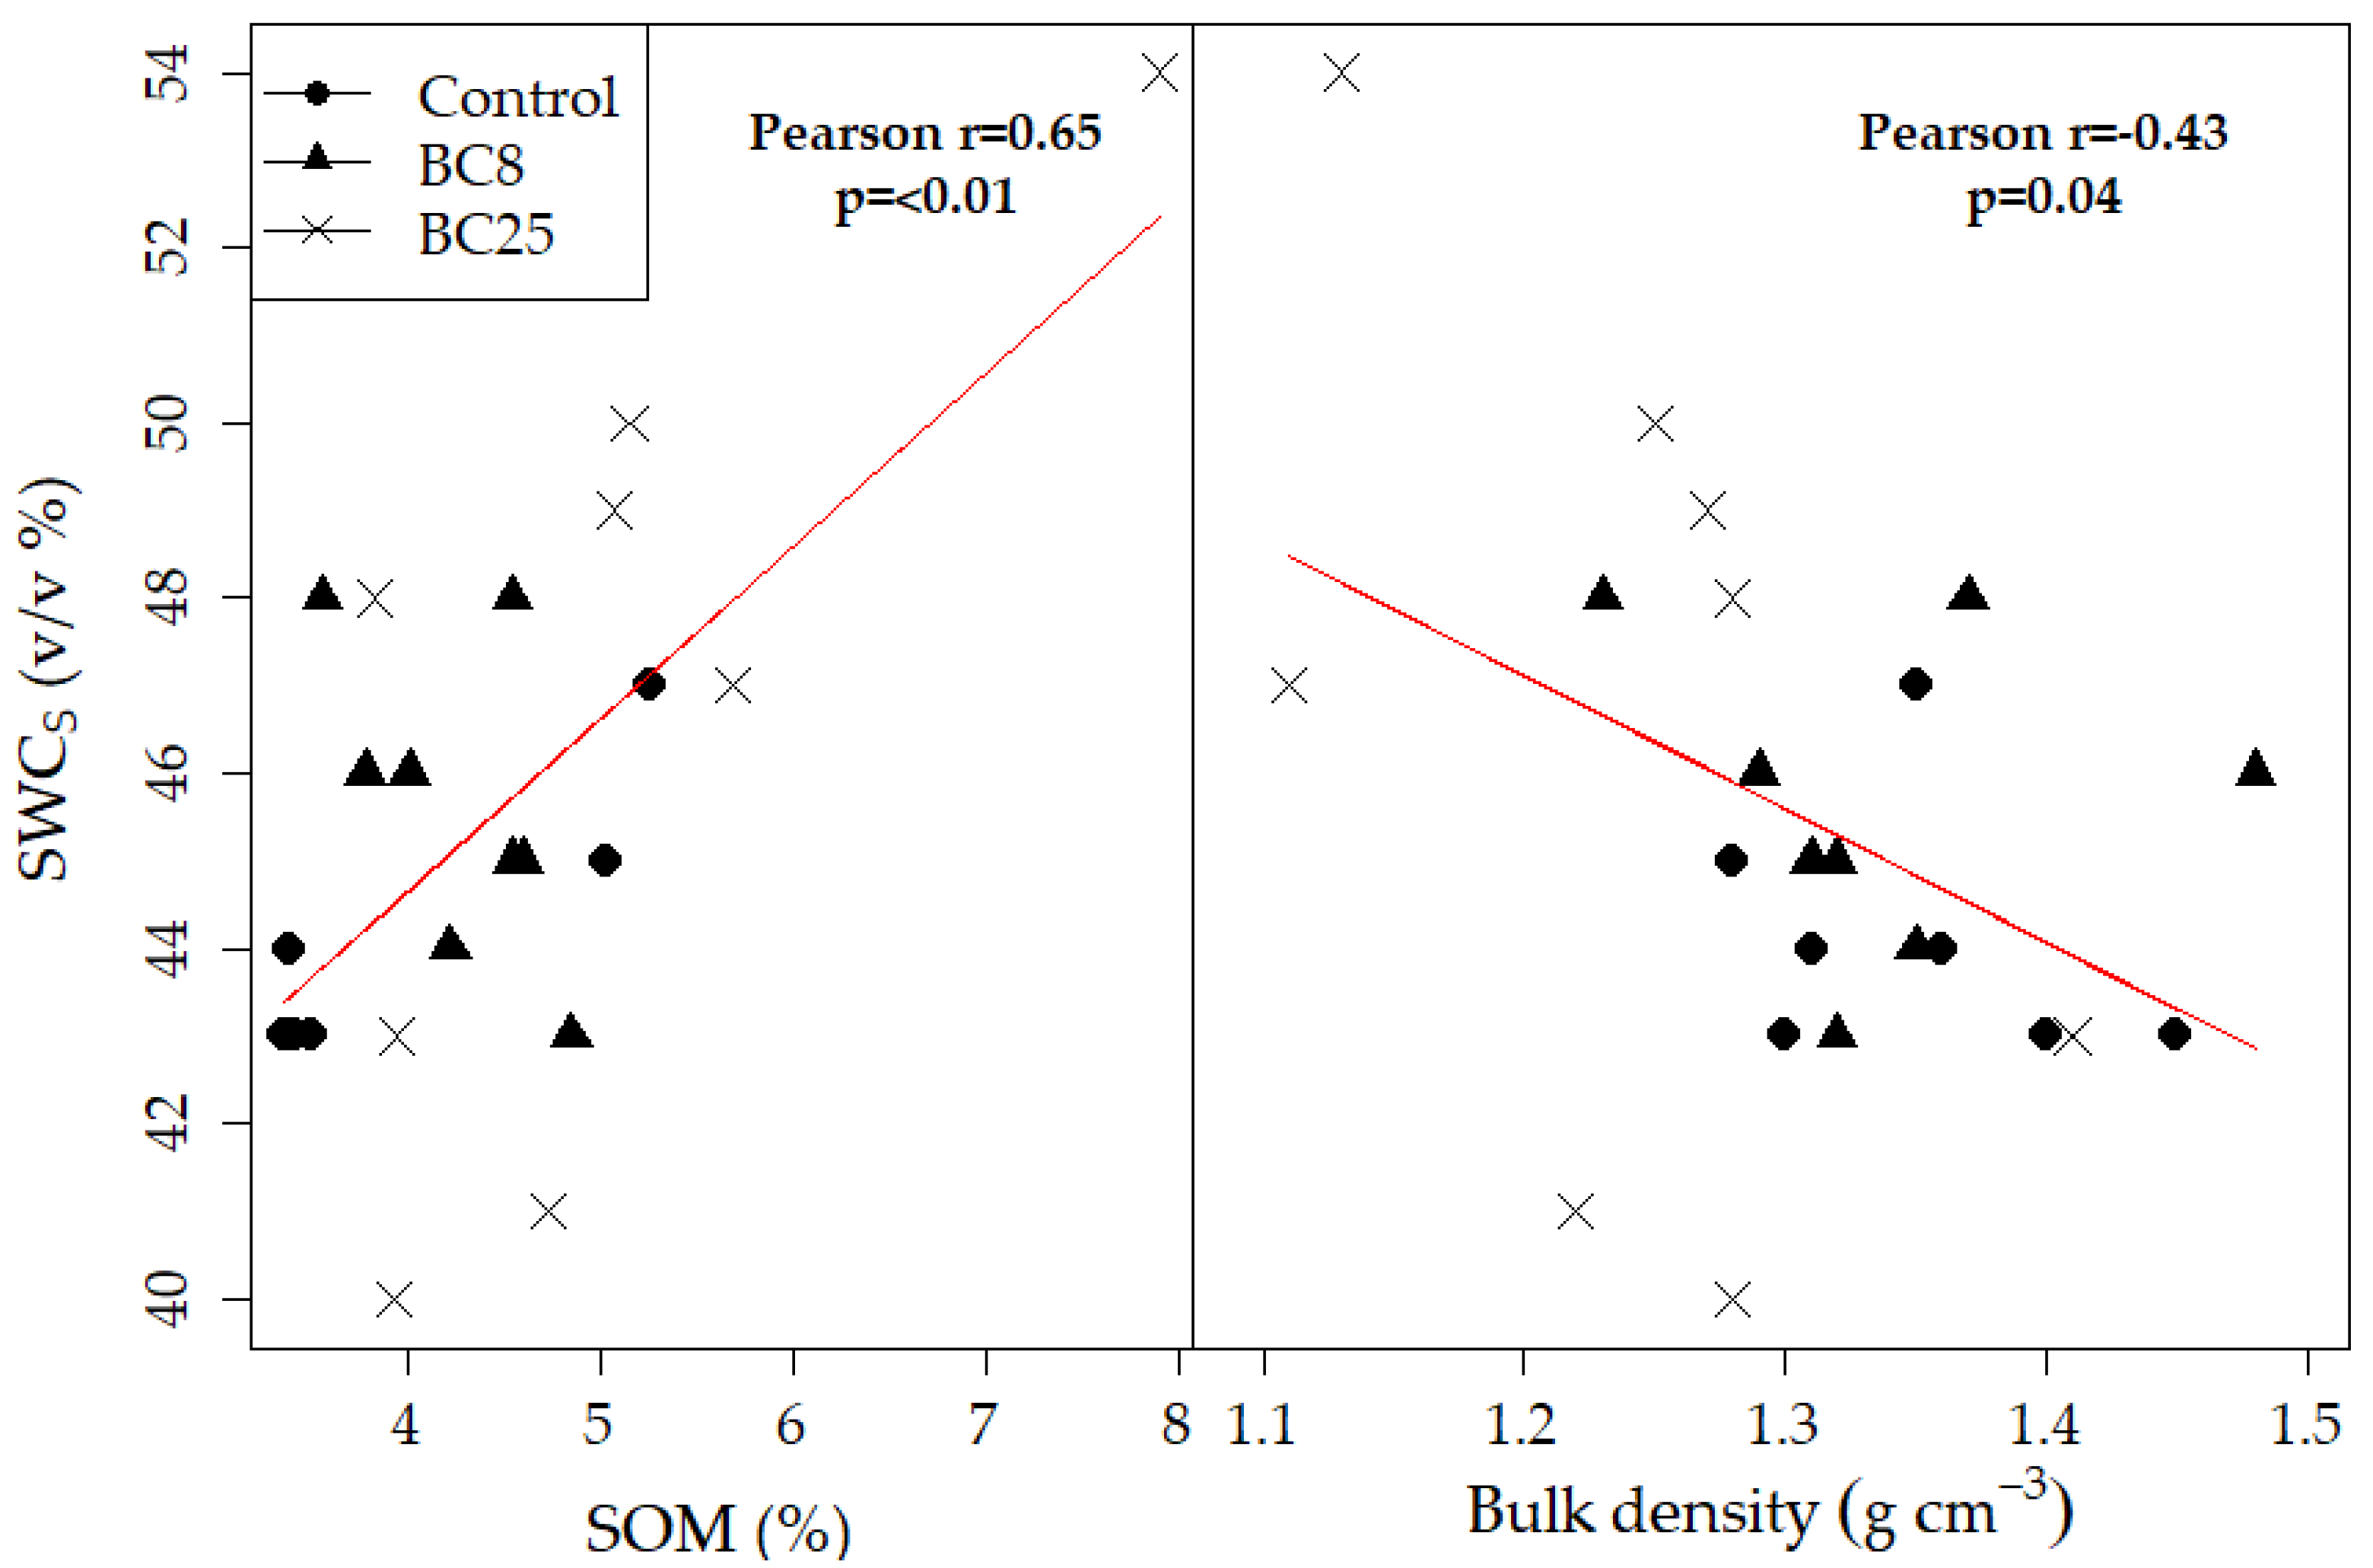
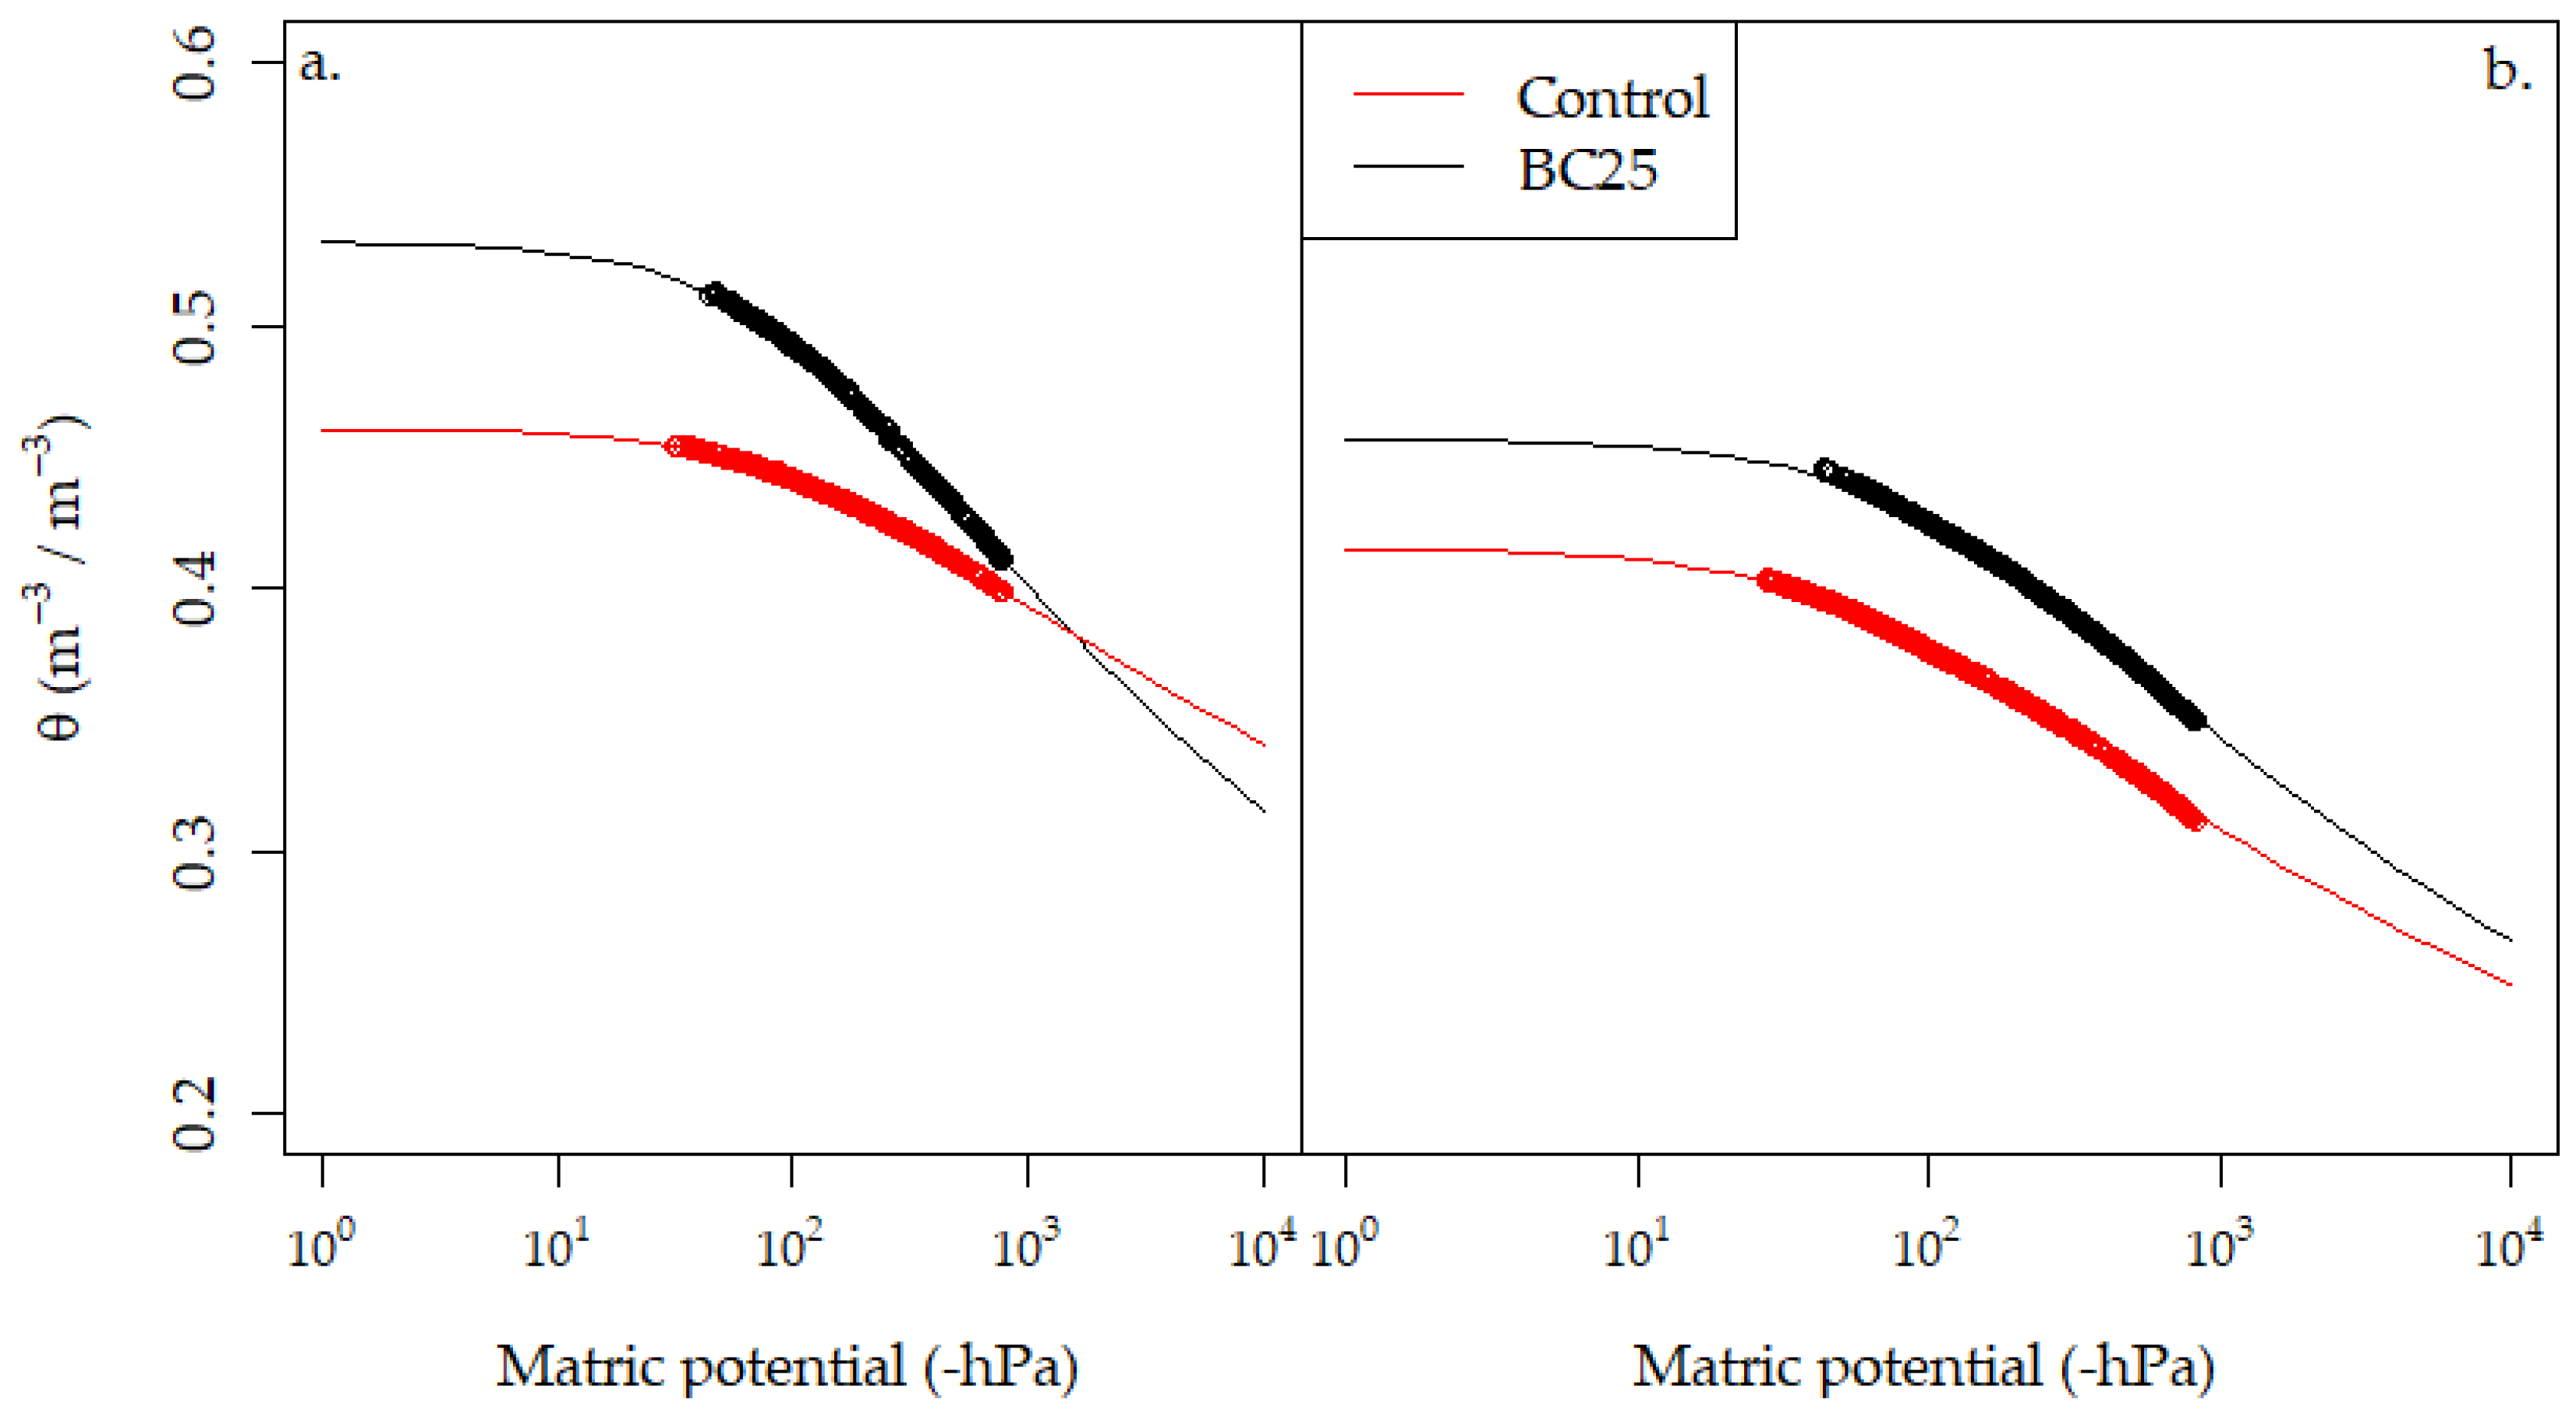
3.4. Soil Water Content and Retention

In the 2012 growth season, average volumetric water content (VWC) was significantly higher in BC25 compared to the control (p = 0.025) while MC8 and BC8 did not differ from the control (Figure 4). Average volumetric water content for the treatments in 2012 were as follows: BC25 37.10% (±1.05%), Control 33.42% (±1.21%), BC8 32.37% (±1.21%), and MC8 31.43% (±1.21%). In 2014, only BC25 and the control were measured and the data revealed only a few days in the growth season (Figure 5) where VWC was significantly higher in BC25 than in the control plots. This coincided with precipitation events. A dry period in June and July 2014 (Table S1, Figure 5) caused soil moisture in the top 5 cm of the control plots to dip below the permanent wilting point (PWP) of 15% VWC while the biochar plots on average retained moisture above PWP and were approximately 5% points higher than the control (although not statistically significant). Soil moisture in 2014 remained above the PWP at a 15 cm soil depth and, therefore, the plant roots had probably enough water reserves at this depth to avoid wilting (Figure 5).
For the soil water retention measurements carried out on intact soil cores, there was a significant effect from SOM content across treatments on plant available water (p < 0.001) (Figure 6) and a significant positive correlation between SOM and both FC and PAW specifically in the BC25 treatment (Figure 6). Across treatments, θsat was positively correlated with SOM and negatively correlated with BD (Figure 7). Variation in the water retention curve start-points and end-points were greater in BC25 when compared to BC8 and the control (Figure S7). In individual samples where biochar content was high, the wet end of the soil retention curve was observably influenced (Figure 8). There was no significant difference between treatments for pore volume in the <3.5 µm or the 3.5–300 µm range.

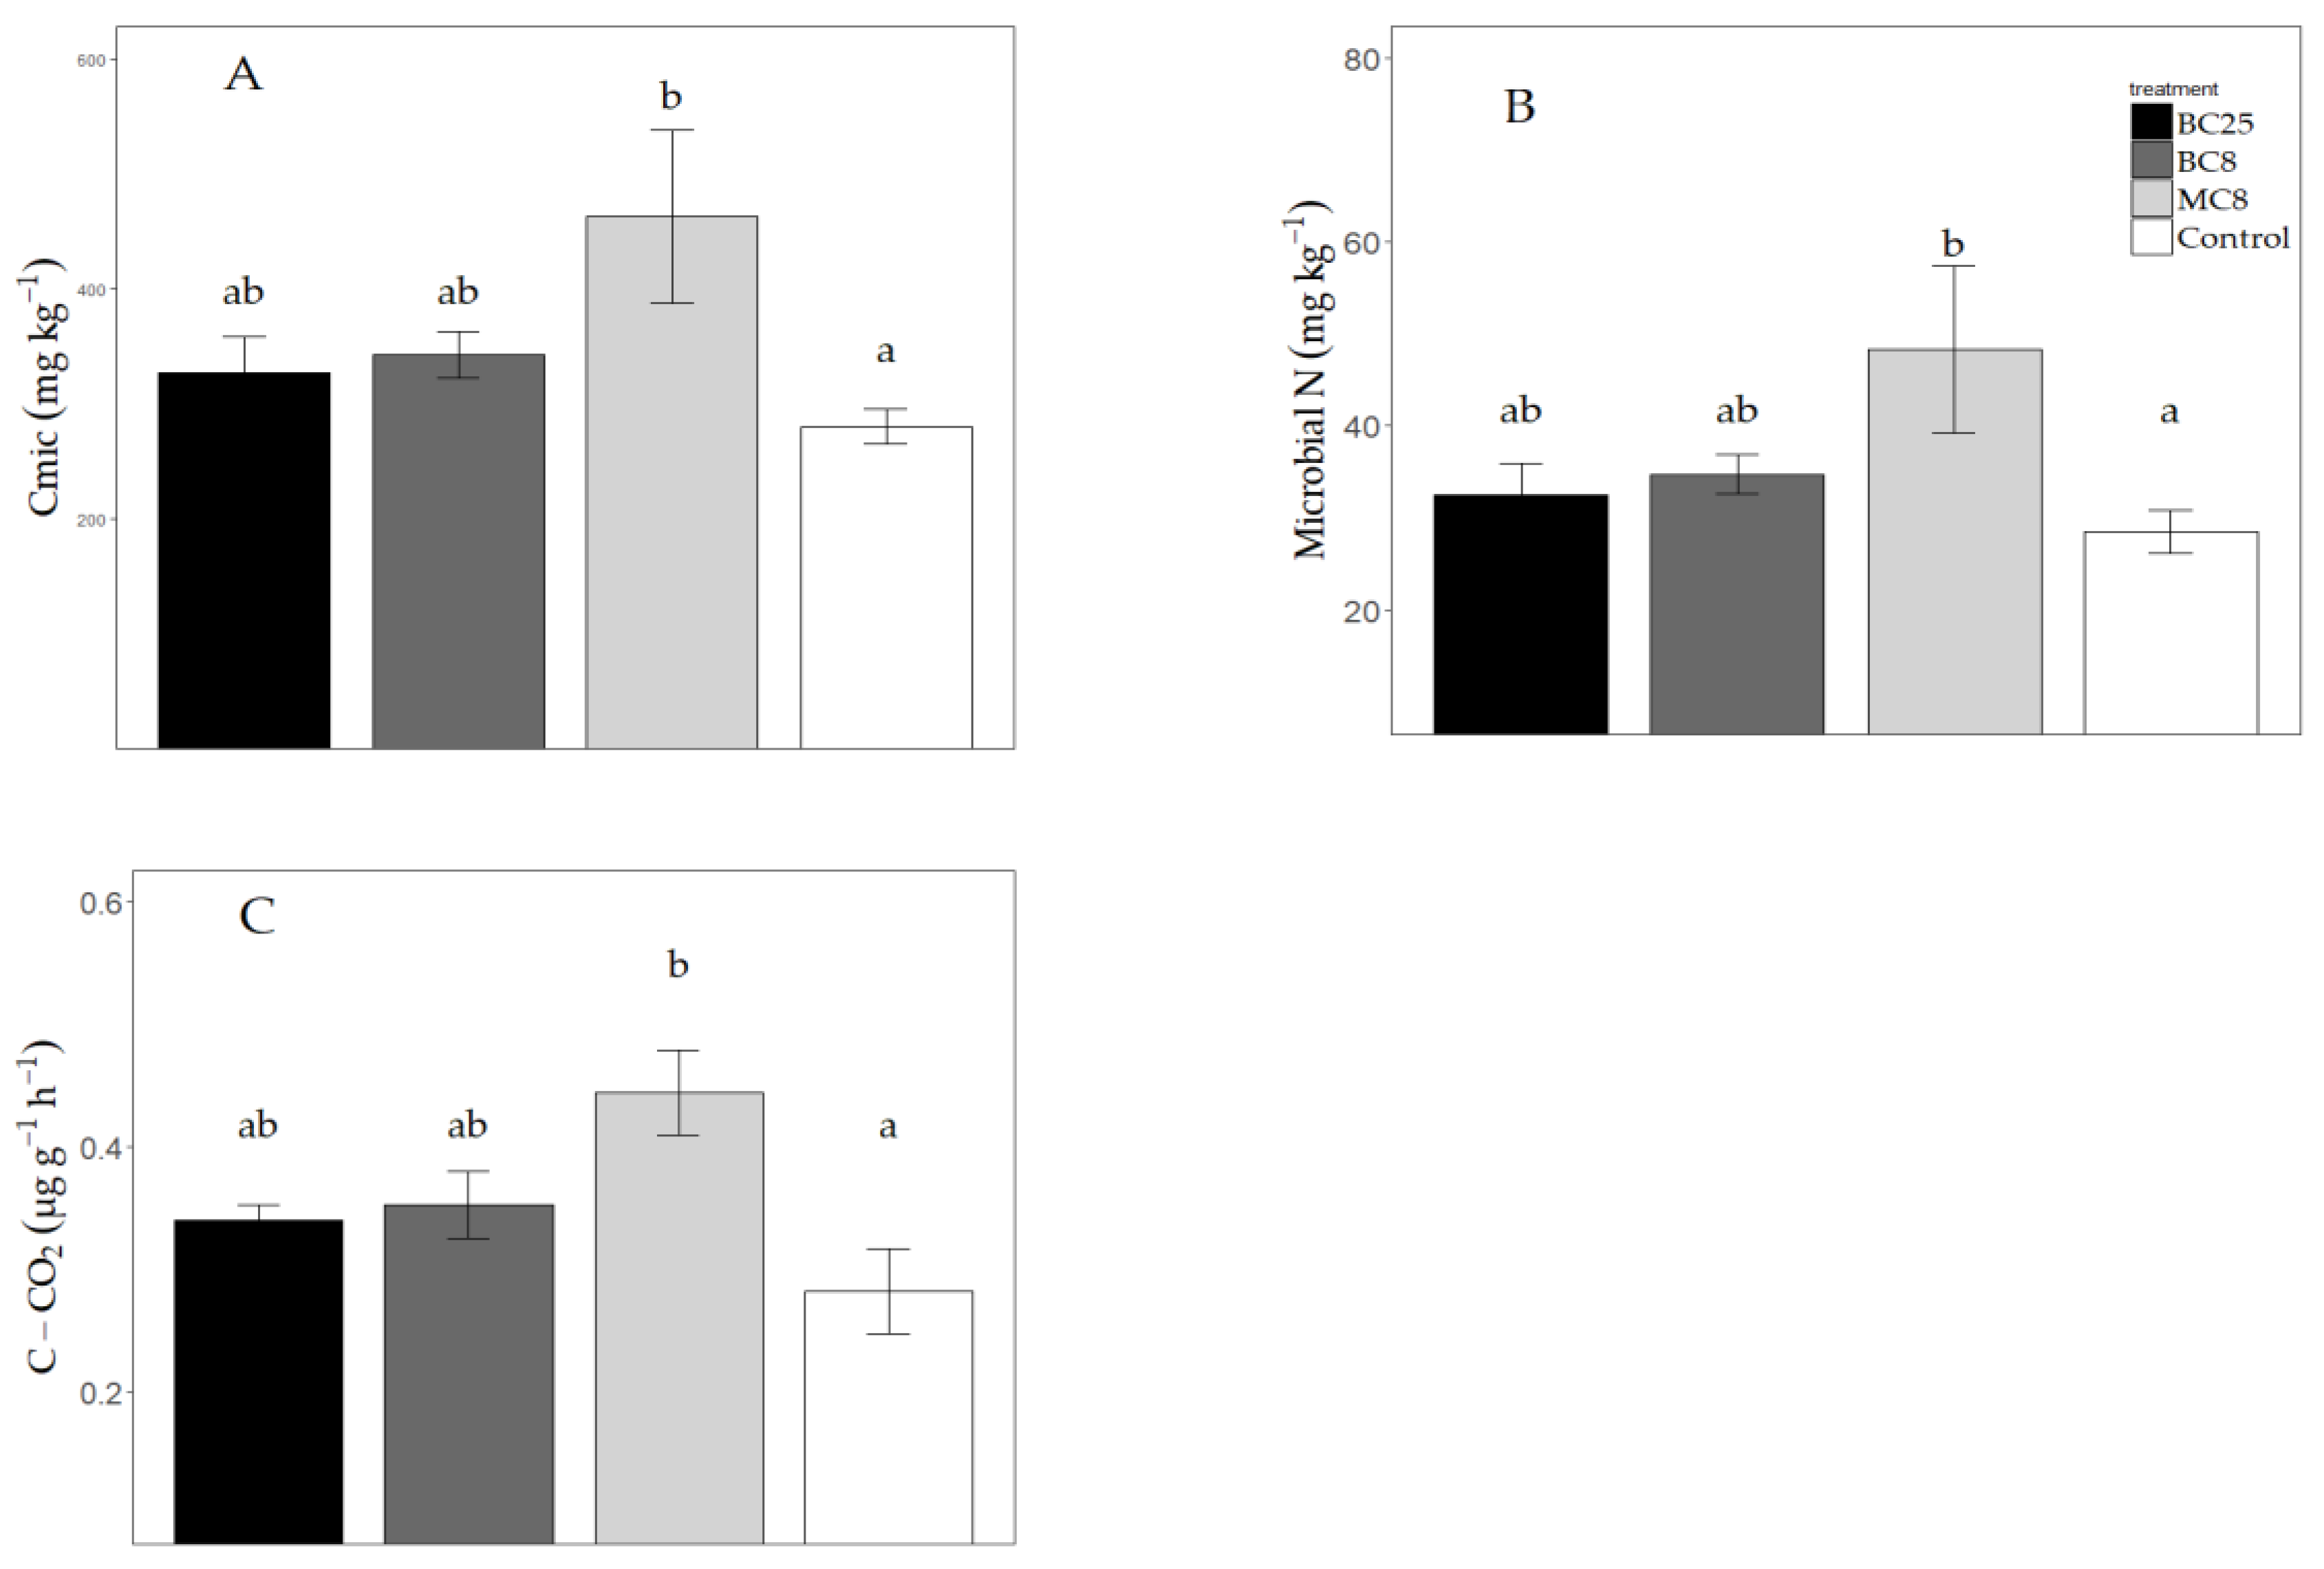
3.5. Microbial Biomass C and N and Basal Respiration

Twenty-two months after the treatment application in the field, microbial biomass C, N, and basal respiration were significantly higher in the MC8 treatment when compared to the control (p = 0.05 and p = 0.005, respectively) (Figure 9). Biochar treatments (BC8 and BC25) did not differ when compared to the control for these three measurements.

3.6. Grain and Straw Yield

Grain yields from MC8, BC8, or BC25 were not significantly different compared to the control in any of the four years (2011–2014). Straw yields were also not significantly different across all years (Table 3). The reduced oat yield in 2014 compared to previous years was due to late planting, which coincides with a dry period (Table S3) and further delays plant growth and establishment. The quality of the grain, as measured by the weight of a 1000 grains and the protein content, were also not significantly modified by the biochar treatment (Table 3).

4. Discussion

4.1. Biochar Suitability as a Soil C Amendment in Reference to Regulations and Standards

Miscanthus biochar was low in heavy metals and complied with the highest quality class (class 0) set for organic soil amendments under the Norwegian law (Table S3). Total C content was high (80%) and H:C and O:C ratios (Table 1), and Reference [9] were well below the respective thresholds (H:C 0.6, O:C 0.4) that characterize biochars thought to be suitable for long term soil carbon sequestration [46,47]. This biochar fulfills the minimum requirements for safety and utility as a material to increase carbon in agricultural soil. However, this cannot be generalized for other biochars and, thus, future producers in Norway are recommended to have their products tested in a like manner and compare values against the industry standards such as the European Biochar [48].

4.2. Biochar Effects on Soil Physical Properties

A biochar application rate of 1.16% (w/w) (BC25) reduced the BD of this silty clay loam by 7% while 0.38% (BC8) did not differ from the control. Our results concur well with the meta-analysis of 463 studies by Reference [4] where they calculated an average reduction in BD of 7.6% due to the biochar application. Between 2012 and 2014, variability in BD among intact BC25 cores decreased, which suggests that the biochar became more evenly distributed in the soil over time. Evidence of this can be seen from photographs taken in 2015 compared to 2011 (Figure S1A–C). Reduction in BD after biochar addition is reported to be due to more than just the dilution of the soil with lower density biochar [49] and is likely attributable to the irregular-shaped biochar particles altering the packing arrangement of mineral soil particles where macropores are formed, which was shown in Reference [12]. From BD and MD data, we attribute 7% of the reduction in BD to mass dilution and 93% to increased intra-particle and inter-particle porosity caused by a biochar addition in our study. The increased porosity is the likely explanation for observed increases of θ in BC25 as measured by TDR in the field in 2012. While there were no statistical differences between treatments for PAW, we did find that SOM content influenced PAW and that samples high in biochar content increased θ at the higher matric potential levels. An obvious benefit of greater soil water retention in dry conditions is an extension of time before which plants experience water deficit stress. Under wetter conditions, increased water retention can also help to reduce water surface runoff and erosion [50]. However, one disadvantage may also be a delay in soil drying, which can put soils at risk of compaction if tractors are driven on wet soils [51].
Biochar did not affect penetration resistance as expected. Penetration resistance tests are used frequently by agronomists to assess the degree of soil compactness, impediments to root growth, and surface crusting. Soil compaction is an increasing concern in Norway since it is estimated to reduce yields by 6% to 20% when compared to optimal soil conditions [52]. Compaction problems have intensified in recent years due to the wetter soils under a wetter climate [53], outdated drainage systems, and the increasing use of heavier tractors [54]. In our study, the soil was not excessively compacted with PR values below 2 MPa, which has been observed as a critical limit for root growth in a variety of soils [55]. Previous studies such as Reference [56] and Reference [20] have observed reductions of up to 66% in PR with biochar additions, but these were both in repacked soil cores at a lab scale and where two to 10 times more biochar was applied when compared to our study. These amounts may be unrealistic and uneconomic for farmers to apply. Biochar may have more utility in ameliorating compaction in subsoils where it has been shown to support greater root growth and water retention [57] provided practical methods are developed to incorporate biochar at lower depths.
Biochar had a limited effect on aggregate stability in our experiment probably due to the fact that this soil was well aggregated from before with sufficient levels of soil organic matter (~5%), moderate clay content (27%), and abundant earthworm activity, which are all factors known to improve soil aggregation [50]. Only the MC8 treatment significantly increased MWD under slow wetting (Figure 2). This suggests that the labile C in Miscanthus straw and the subsequent promotion of microbial activity was the primary driver of increased aggregate stability. Similarly, labile C sources from crop residues have been reported to increase soil aggregation more than changes in soil properties induced by mulching (Rasse, Smucker, and Santos, 2000) [58]. By contrast, the miscanthus biochar used for the field experiment is highly stable [9], which probably explains the absence of effect on microbial biomass and, therefore, the absence of significant effect on soil aggregate stability.
We later identified that some of the 2–6 mm aggregates that were wet sieved from the BC25 treatment were clay encrusted biochar particles appearing to be soil aggregates in the 2–6 mm range (Figure S4). These washed biochar particles were removed (the washed and ejected biochar from BC25 weighed an average of 1.2% of the aggregate weight and, therefore, did not overly influence the end MWD result for BC25) from the sample after sieving and, thus, lowered the MWD of BC25. In future experiments, selecting a larger aggregate size class e.g., 2 to 20 mm would allow for greater occlusion of larger biochar particles in aggregates. The MWD of aggregates in clay swelling and mechanical breakdown tests remained over the 1.3 mm threshold of Le Bissonnais’ MWD stability index (Table S2). Slaking had the greatest impact on aggregate breakdown and was not moderated by the addition of biochar (Figure 2). Slaking was also reported as the main aggregate breakdown mechanism in biochar studies conducted by References [11,17]. In the study by Sun and Lu, 2014 [11] very high gravimetric concentrations of 4% to 6% were needed in order to improve resistance to slaking while a lower biochar dose (2%) actually increased slaking compared to the control.

4.3. Effects on Microbial C and N and Basal Respiration

Straw significantly increased microbial biomass and basal soil respiration (lab incubation) while biochar had no effect. These results are consistent with soil respiration measurements (field chamber measurements) taken from the same experimental site as this study in 2011 and 2012 and which showed no significant difference between biochar and control plots [9]. In another study under temperate conditions, microbial abundance was also unaffected three months after the addition of 30 t ha−1 (approx. 1.2% w/w) Miscanthus biochar [59]. Gomez et al. [24] report that microbial abundance as estimated by phospholipid fatty acids (PLFAs) only differed from the control at biochar rates >5% (w/w) and not at 1%, which suggests that high application rates of biochar are needed to affect microbial biomass in soils. A similar trend was observed by Reference [60] where biochar applications between 5–10% w/w in soil significantly increased microbial activity (substrate induced respiration and basal respiration) but not so for 1% and 2.5%. A 5–10% w/w concentration in laboratory soil incubation equates to field application rates of 150–300 t ha−1, which is unrealistically high for a single application and would be too expensive for farmers to apply without significant carbon subsidies [61]. The limited microbial response from the addition of significant amounts of carbon to the soil supports the claim that biochar-C is difficult for microbes to use as an energy source and provides a means to store more carbon in soil without having to simultaneously add extra amounts of N to satisfy plant and microbial needs. Increasing biochar C application by three times (BC8 vs. BC25) did not lead to any difference in Microbial N, which confirms the high stability of this biochar C as reported in Rasse et al. [9].

4.4. Grain Yield and Quality

As biochar is a material with high C content, some farmers may be concerned that adding large amounts to their soils (the amount of biochar in BC25 applied in our experiment is 10 times that of yearly straw produced from the same land area) may lead to a microbial immobilization of N and, thus, reduce plant yields. While some studies have shown short-term N immobilization that restricts plant growth [62,63], we did not observe this under field conditions over four years where even the higher BC treatment did not reduce grain, straw yields, and grain protein or increase Microbal C or N. A lack of yield response after the biochar amendment concurs with other studies in boreal and temperate regions. Reference [64] found no yield differences in wheat or faba bean after applying spruce and pine biochar at 10 t ha−1 in a three-year field experiment in Finland and a similar absence of yield effect was found in a two-year field ring trial carried out in seven different countries in Northern Europe [65]. However, increased hay grass yield was observed in the two last years of a three-year field trial in Wales [66]. Jones reports that yield increases were attributed to increased water holding capacity from the biochar during a dry spring planting season. Short-term dry periods are also common in the Norwegian spring and we hypothesized that the extra water holding capacity of biochar would translate to higher crop yields. This, however, was not the case for this loamy soil, which had a sufficient amount of available water for plants throughout the season, which was observed from TDR measurements at 15 cm. In general, biochar is expected to increase agricultural productivity when it alleviates a limiting factor for plant growth such as water stress or soil acidity [67]. The extent to which biochar can do this depends on the type of biochar, the soil environment, and the cropping system. The absence of a yield response to biochar in our study suggests that none of these factors were a constraint to production in our field. However, other soils in Norway with reduced water holding capacity might benefit from the addition of biochar. Sandy soils characterize 10–15% of the agricultural soils in the main grain growing counties and up to 30% in irrigated vegetable growing counties in Norway [68] and could be a potential target area for future biochar applications and testing. With regard to grain quality, the unchanged levels of grain protein in our study concurs with the results from Reference [65] where six of the seven countries participating in a two-year field trial reported no significant differences in grain protein in biochar amended plots (20 t ha−1) when compared to the control. We participated as one of the seven countries in a field adjacent to the one used in the current study and, in 2012, the barley grain yield or quality did not differ between biochar and control.

5. Conclusions

Application of pure Miscanthus biochar at 8 and 25 t ha−1 to a clay loam did not increase crop yields over four years in a temperate climate even in the 2014 season when biochar contributed to greater soil water content during a prolonged dry spell. One of the aims of our study was to see whether there were sufficient soil improvement benefits of applying biochar (apart from carbon sequestration), which would encourage farmers to use it. We observed that there was higher plant available water with greater amounts of added biochar but no differences in aggregate stability. Microbial activity or Microbial N were not significantly stimulated by either biochar at low (BC8) or high (BC25) application rates, as compared to straw, which confirms that microbial immobilization due to a high-C substrate was not a concern with this Miscanthus biochar. This means that it is technically possible to add significant amounts of biochar to agricultural soil to increase soil C and mitigate climate change without it negatively affecting grain yields. However, without yield increases or subsidies for carbon sequestration, there would be little incentive for farmers to use biochar until revenues exceed costs. Therefore, in order to realize the biochar’s climate mitigation potential, we suggest future research and development efforts should focus on improving the agronomic utility of biochar in the engineered fertilizer and soil amendment products.

Supplementary Materials

The following are available online at https://www.mdpi.com/2077-0472/8/11/171/s1, Figure S1: (A) Images of concentrated seams of biochar in soil profile caused by inverse ploughing of surface applied biochar. (B) Image of biochar distribution on soil surface in April 2012; Figure S2: Aggregate size distribution from machine dry sieving; Figure S3: SEM images of fresh Miscanthus biochar showing the porous surface and irregular shape; Figure S4: SEM image of weathered Miscanthus biochar collected after 5 years of field incubation. Evidence of partial clogging of surface micropores with soil particles; Figure S5: Approximately 15 g of 2–6 mm sized aggregates placed in small sieves prior to pre-wetting and wet sieving; Figure S6: Illustrative evidence of “Biochar patchiness” or “hot spots” in field samples; Figure S7: Water retention curves for each intact soil core in each treatment and depth with corresponding SOM content for each soil core; Figure S8: Linear regression equations for calibrating the TDR sensors; Table S1: Mean air temperature (°C) and monthly precipitation (mm) in Ås, Norway for four growing seasons (2011–2014) compared with normal (1961–1990) monthly averages; Table S2: Classes of stability and crustability, according to MWD values (reprinted with permission from [38]); Table S3: Maximum limit for heavy metals under Norwegian law for soil improvement materials of organic origin.

Author Contributions

A.O. and D.R. designed the experiment. A.O.T. collected field data, A.S. conducted Aggregate Stability tests, and M.C. and B.B. conducted microbial analysis. C.M. assisted with field work and pore-size distribution calculations and statistical analysis. S.W. assisted with water retention curve data and analysis. A.O.T. wrote the paper with input and comment from authors especially D.R. who co-supervised this work.

Funding

Funding for the research was provided by the Research Council of Norway (NFR) through the projects: “Creating a scientific basis for an integrated evaluation of soil-borne GHG emissions in Norwegian agriculture” NFR/192856 and “Capture+: Sustainable biochar systems for a zero emission society”; and by the Norwegian Ministry of Climate and Environment through the NIBIO SIS:Jordkarbon project.

Acknowledgments

Special thanks to NMBU Tore Krogstad, Trond Børresen, and Trine Sogn and Daniel Rasse for their supervision during the Ph.D period.

Conflicts of Interest

There were no conflicts of interest between the authors and the subject of study in this article.

References

  1. Smith, P.; Gregory, P.J. Climate change and sustainable food production. Proc. Nutr. Soc. 2013, 72, 21–28. [Google Scholar] [CrossRef] [PubMed]
  2. Lehmann, J.; Gaunt, J.; Rondon, M. Bio-char sequestration in terrestrial ecosystems—A review. Mitig. Adapt. Strat. Glob. Chang. 2006, 11, 395–419. [Google Scholar] [CrossRef]
  3. O’Toole, A.; Rasse, D. Biochar: Soil carbon and fertility. In Encyclopedia of Soil Science, 3rd ed.; Rattan, L., Ed.; Taylor and Francis: New York, NY, USA, 2016; pp. 193–197. [Google Scholar]
  4. Omondi, M.O.; Xia, X.; Nahayo, A.; Liu, X.; Korai, P.K.; Pan, G. Quantification of biochar effects on soil hydrological properties using meta-analysis of literature data. Geoderma 2016, 274, 28–34. [Google Scholar] [CrossRef]
  5. Cayuela, M.L.; van Zwieten, L.; Singh, B.P.; Jeffery, S.; Roig, A.; Sánchez-Monedero, M.A. Biochar’s role in mitigating soil nitrous oxide emissions: A review and meta-analysis. Agric. Ecosyst. Environ. 2014, 191, 5–16. [Google Scholar] [CrossRef]
  6. Jeffery, S.; Verheijen, F.G.A.; Kammann, C.; Abalos, D. Biochar effects on methane emissions from soils: A meta-analysis. Soil Biol. Biochem. 2016, 101, 251–258. [Google Scholar] [CrossRef] [Green Version]
  7. Jeffery, S.; Abalos, D.; Prodana, M.; Bastos, A.C.; van Groenigen, J.W.; Hungate, B.A.; Verheijen, F. Biochar boosts tropical but not temperate crop yields. Environ. Res. Lett. 2017, 12, 053001. [Google Scholar] [CrossRef] [Green Version]
  8. Strategy and Incentives for Reducing Emissions of GHGs from the Agricultural Sector; Norwegian Environment Department: Oslo, Norway, 2010.
  9. Rasse, D.P.; Budai, A.; O’Toole, A.; Ma, X.; Rumpel, C.; Abiven, S. Persistence in soil of Miscanthus biochar in laboratory and field conditions. PLoS ONE 2017, 12, e0184383. [Google Scholar] [CrossRef] [PubMed]
  10. Peake, L.R.; Reid, B.J.; Tang, X. Quantifying the influence of biochar on the physical and hydrological properties of dissimilar soils. Geoderma 2014, 235, 182–190. [Google Scholar] [CrossRef]
  11. Sun, F.; Lu, S. Biochars improve aggregate stability, water retention, and pore-space properties of clayey soil. J. Plant Nutr. Soil Sci. 2014, 177, 26–33. [Google Scholar] [CrossRef]
  12. Liu, Z.; Dugan, B.; Masiello, C.A.; Gonnermann, H.M. Biochar particle size, shape, and porosity act together to influence soil water properties. PLoS ONE 2017, 12, 1–19. [Google Scholar] [CrossRef] [PubMed]
  13. Barnes, R.T.; Gallagher, M.E.; Masiello, C.A.; Liu, A.; Dugan, B. Biochar-induced changes in soil hydraulic conductivity and dissolved nutrient fluxes constrained by laboratory experiments. PLoS ONE 2014, 9, e108340. [Google Scholar] [CrossRef] [PubMed]
  14. Lim, T.J.; Spokas, K.A.; Feyereisen, G.; Novak, J.M. Predicting the impact of biochar additions on soil hydraulic properties. Chemosphere 2016, 142, 136–144. [Google Scholar] [CrossRef] [PubMed]
  15. Masiello, C.M.; Dugan, B.; Brewer, C.; Spokas, K.A.; Novak, J.M.; Liu, Z.; Sorrenti, G. Biochar effects on soil hydrology. In Biochar for Environmental Management, 2nd ed.; Lehmann, J., Joseph, S., Eds.; Routledge: New York, NY, USA, 2015; pp. 543–562. [Google Scholar]
  16. Obia, A.; Mulder, J.; Martinsen, V.; Cornelissen, G.; Børresen, T. In situ effects of biochar on aggregation, water retention and porosity in light-textured tropical soils. Soil Till. Res. 2016, 155, 35–44. [Google Scholar] [CrossRef]
  17. Herath, H.; Camps-Arbestain, M.; Hedley, M. Effect of biochar on soil physical properties in two contrasting soils: An Alfisol and an Andisol. Geoderma 2013, 209, 188–197. [Google Scholar] [CrossRef]
  18. Busscher, W.J.; Novak, J.M.; Evans, D.E.; Watts, D.W.; Niandou, M.A.S.; Ahmedna, M. Influence of pecan biochar on physical properties of a Norfolk loamy sand. Soil Sci. 2010, 175, 10–14. [Google Scholar] [CrossRef]
  19. Obia, A.; Børresen, T.; Martinsen, V.; Cornelissen, G.; Mulder, J. Effect of biochar on crust formation, penetration resistance and hydraulic properties of two coarse-textured tropical soils. Soil Till. Res. 2017, 170, 114–121. [Google Scholar] [CrossRef]
  20. Ahmed, A.; Gariepy, Y.; Raghavan, V. Influence of wood-derived biochar on the compactibility and strength of silt loam soil. Int. Agrophys. 2017, 31, 149–155. [Google Scholar] [CrossRef] [Green Version]
  21. Chan, K.Y.; Van Zwieten, L.; Meszaros, I.; Downie, A.; Joseph, S. Agronomic values of greenwaste biochar as a soil amendment. Soil Res. 2008, 45, 629–634. [Google Scholar] [CrossRef]
  22. Zong, Y.; Chen, D.; Lu, S. Impact of biochars on swell-shrinkage behavior, mechanical strength, and surface cracking of clayey soil. J. Plant Nutr. Soil Sci. 2014. [Google Scholar] [CrossRef]
  23. Domene, X.; Mattana, S.; Hanley, K.; Enders, A.; Lehmann, J. Medium-term effects of corn biochar addition on soil biota activities and functions in a temperate soil cropped to corn. Soil Biol. Biochem. 2014, 72, 152–162. [Google Scholar] [CrossRef] [Green Version]
  24. Gomez, J.D.; Denef, K.; Stewart, C.E.; Zheng, J.; Cotrufo, M.F. Biochar addition rate influences soil microbial abundance and activity in temperate soils. Eur. J. Soil Sci. 2014, 65, 28–39. [Google Scholar] [CrossRef]
  25. Yu, J.; Deem, L.M.; Crow, S.E.; Deenik, J.L.; Penton, C.R. Biochar application Influences microbial assemblage complexity and composition due to soil and bioenergy crop type interactions. Soil Biol. Biochem. 2018, 117, 97–107. [Google Scholar] [CrossRef]
  26. Nielsen, S.; Minchin, T.; Kimber, S.; van Zwieten, L.; Gilbert, J.; Munroe, P.; Joseph, S.; Thomas, T. Comparative analysis of the microbial communities in agricultural soil amended with enhanced biochars or traditional fertilisers. Agric. Ecosyst. Environ. 2014, 191, 73–82. [Google Scholar] [CrossRef]
  27. Rajkovich, S.; Enders, A.; Hanley, K.; Hyland, C.; Zimmerman, A.R.; Lehmann, J. Corn growth and nitrogen nutrition after additions of biochars with varying properties to a temperate soil. Biol. Fertil. Soils 2011, 48, 271–284. [Google Scholar] [CrossRef]
  28. Krogstad, T. Methods for Soil Analysis (in Norwegian); Institute for Soil Science, Norwegian Agricultural College: Ås, Norway, 1992. [Google Scholar]
  29. Brunauer, S.; Emmett, P.H.; Teller, E. Adsorption of gases in multimolecular layers. J. Am. Chem. Soc. 1938, 60, 309–319. [Google Scholar] [CrossRef]
  30. Brewer, C.E.; Chuang, V.J.; Masiello, C.A.; Gonnermann, H.; Gao, X.; Dugan, B.; Driver, L.E.; Panzacchi, P.; Zygourakis, K.; Davies, C.A. New approaches to measuring biochar density and porosity. Biomass Bioenerg. 2014, 66, 176–185. [Google Scholar] [CrossRef]
  31. Brown, R.A.; Kerche, A.K.; Nguyen, T.H.; Nagle, D.C.; Ball, W.P. Production and characterization of synthetic wood chars for use as surrogates for natural sorbents. Org. Geochem. 2006, 37, 321–333. [Google Scholar] [CrossRef]
  32. Schindler, U. A rapid method for measuring the hydraulic conductivity in cylinder core samples from unsaturated soil. Archiv fur Acker-und Pflanzenbau und Bodenkunde 1980, 24, 1–7. [Google Scholar]
  33. Van Genuchten, M.T. A closed-form equation for predicting the hydraulic conductivity of unsaturated soils. Soil Sci. Soc. Am. J. 1980, 44, 892–898. [Google Scholar] [CrossRef]
  34. Riley, H. Estimation of physical properties of cultivated soils in southeast Norway from readily available soil information. Norway from readily available soil information. Norw. J. Agric. Sci. 1996, 25, 51. [Google Scholar]
  35. Schjønning, P. Size distribution of dispersed and aggregated particles and of soil pores in 12 Danish soils. Acta Agric. Scand. B Plant Soil Sci. 1992, 42, 26–33. [Google Scholar]
  36. Njøs, A. Dry sieving. In West-European Methods for Soil Structure Determination; De Boodt, M., Ed.; State Faculty of Agricultural Sciences: Ghent, Belgium, 1967. [Google Scholar]
  37. Kemper, W.D.; Rosenau, R.C. Aggregate stability and size distributlon. In Methods of Soil Analysis; USDA: Washington, DC, USA, 1986. [Google Scholar]
  38. Bissonnais, Y.L. Aggregate stability and assessment of soil crustability and erodibility: I. Theory and methodology. Eur. J. Soil Sci. 1996, 47, 425–437. [Google Scholar] [CrossRef]
  39. Perfect, E.; Groenevelt, P.H.; Kay, B.D.; Grant, C.D. Spatial variability of soil penetrometer measurements at the mesoscopic scale. Soil Till. Res. 1990, 16, 257–271. [Google Scholar] [CrossRef]
  40. Beck, T.; Joergensen, R.G.; Kandeler, E.; Makeschin, F.; Nuss, E.; Oberholzer, H.R.; Scheu, S. An inter-laboratory comparison of ten different ways of measuring soil microbial biomass C. Soil Biol. Biochem. 1997, 29, 1023–1032. [Google Scholar] [CrossRef]
  41. Vance, E.D.; Brookes, P.C.; Jenkinson, D.S. Microbial biomass measurements in forest soils: The use of the chloroform fumigation-incubation method in strongly acid soils. Soil Biol. Biochem. 1987, 19, 697–702. [Google Scholar] [CrossRef]
  42. Sparling, G.P.; West, A.M. Modifications to the Flmigation-extraction technique to permit simultaneous extraction and estimation of soil microbial C and N. Commun. Soil Sci. Plant Anal. 1988, 19, 327–344. [Google Scholar] [CrossRef]
  43. Brookes, P.C.; Landmann, A.; Prugen, G.; Jenkinson, D.S. Chloroform fumigation and the release of soil nitrogen: a rapid direct extraction method to measure microbial biomass nitrogen in soil. Soil Biol. Biochem. 1985, 17, 837–842. [Google Scholar] [CrossRef]
  44. Robertson, G.P.; Wedin, D.; Groffmann, P.M.; Blair, J.M.; Holland, E.A.; Nadelhoffer, K.J. Soil carbon and nitrogen availability: Nitrogen mineralization, nitrification, and soil respiration potentials. In Standard Soil Methods for Long-Term Ecological Research; Robertson, G.P., Coleman, D.C., Bledsoe, C.S., Sollins, P, Eds.; Oxford University Press: New York, NY, USA, 1999; pp. 258–271. [Google Scholar]
  45. R: A Language and Environment for Statistical Computing. Available online: http://www.R-project.org/ (accessed on 15 April 2018).
  46. Budai, A.; Zimmerman, A.R.; Cowie, A.L.; Webber, J.B.W.; Singh, B.P.; Glaser, B.; Masiello, C.A; Andersson, D.; Shields, F.; Lehmann, J.; et al. Biochar Carbon Stability Test Method: An Assessment of Methods to Determine Biochar Carbon Stability; International Biochar Initiative: Canandaigua, NY, USA, 2013. [Google Scholar]
  47. Schimmelpfennig, S.; Glaser, B. One step forward toward characterization: Some important material properties to distinguish biochars. J. Environ. Qual. 2012, 41, 1001–1013. [Google Scholar] [CrossRef] [PubMed]
  48. Guidelines for a Sustainable Production of Biochar. Version 6.2E. Available online: http://www.european-biochar.org/biochar/media/doc/ebc-guidelines.pdf (accessed on 15 April 2018).
  49. Laird, D.; Fleming, P.; Wang, B.; Horton, R.; Karlen, D. 2010. Biochar impact on nutrient leaching from a midwestern agricultural soil. Geoderma 2018, 158, 436–442. [Google Scholar] [CrossRef]
  50. Brady, N.C.; Weil, R.R. Elements of the Nature and Properties of Soils, 3 ed.; Prentice Hall: New Jersey, NJ, USA, 2010. [Google Scholar]
  51. Droogers, P.; Fermont, A.; Bouma, J. Effects of ecological soil management on workability and trafficability of a loamy soil in the Netherlands. Geoderma 1996, 73, 131–145. [Google Scholar] [CrossRef]
  52. Kjersti, U.A.; Trond, B.; Johannes, D.; Wendy, W.; Einar, S.; Azzaroli, B.M.; Till, S.; Sigrun, K.; Tove, S.; Morten, L.; et al. Økt Kornproduksjon Gjennom Forbedret Agronomisk Praksis. En Vurdering Av Agronomiske Tiltak Som Kan Bidra Til Avlingsøkninger i Kornproduksjonen; NIBIO: Ås, Norway, 2017. [Google Scholar]
  53. Hohle, E.; Appointed Working Group. Agriculture and Climate Change; Norwegian Agriculture and Food Department: Oslo, Norway, 2016. [Google Scholar]
  54. Seehusen, T.; Børresen, T.; Rostad, B.I.; Fleige, H.; Zink, A.; Riley, H. Verification of traffic-induced soil compaction after long-term ploughing and 10 years minimum tillage on clay loam soil in South-East Norway. Acta Agric. Scand. B Soil Plant Sci. 2014, 64, 312–328. [Google Scholar] [CrossRef]
  55. Martino, D.L.; Shaykewich, C.F. Root penetration profiles of wheat and barley as affected by soil penetration resistance in field conditions. Can. J. Soil Sci. 1994, 74, 193–200. [Google Scholar] [CrossRef] [Green Version]
  56. Hseu, Z.-Y.; Jien, S.-H.; Chien, W.-H.; Liou, R.-C. Impacts of biochar on physical properties and erosion potential of a mudstone slopeland soil. Sci. World J. 2014. [Google Scholar] [CrossRef] [PubMed]
  57. Bruun, E.W.; Petersen, C.T.; Hansen, E.; Holm, J.K. Hauggaard-Nielsen, H. Biochar amendment to coarse sandy subsoil improves root growth and increases water retention. Soil Use Manag. 2014, 30, 109–118. [Google Scholar] [CrossRef]
  58. Rasse, D.P.; Smucker, A.J.M.; Santos, D. Alfalfa root and shoot mulching effects on soil hydraulic properties and aggregation. Soil Sci. Soc. Am. J. 2000, 64, 725. [Google Scholar] [CrossRef]
  59. Bamminger, C.; Poll, C.; Sixt, C.; Högy, P.; Wüst, D.; Kandeler, E.; Marhan, S. Short-term response of soil microorganisms to biochar addition in a temperate agroecosystem under soil warming. Agric. Ecosyst. Environ. 2016, 233, 308–317. [Google Scholar] [CrossRef]
  60. Kolb, S.E.; Fermanich, K.J.; Dornbush, M.E. Effect of charcoal quantity on microbial biomass and activity in temperate soils. Soil Sci. Soc. Am. J. 2009, 73, 1173–1181. [Google Scholar] [CrossRef]
  61. Joseph, S.; Graber, E.R.; Chia, C.; Munroe, P.; Donne, S.; Thomas, T.; Nielsen, S.; Marjo, C.; Rutlidge, H.; Pan, G.X.; et al. Shifting paradigms: Development of high-efficiency biochar fertilizers based on nano-structures and soluble components. Carbon Manag. 2013, 4, 323–343. [Google Scholar] [CrossRef]
  62. Deenik, J.L.; McClellan, T.; Uehara, G.; Antal, M.J.; Campbell, S. Charcoal volatile matter content influences plant growth and soil nitrogen transformations. Soil Sci. Soc. Am. J. 2010, 74, 1259–1270. [Google Scholar] [CrossRef]
  63. O’Toole, A.; de Zarruk, K.K.; Steffens, M.; Rasse, D.P. Characterization, Stability, and Plant Effects of Kiln-Produced Wheat Straw Biochar. J. Environ. Qual. 2013, 42, 429–436. [Google Scholar] [CrossRef] [PubMed]
  64. Tammeorg, P.; Simojoki, A.; Mäkelä, P.; Stoddard, F.L.; Alakukku, L.; Helenius, J. Biochar application to a fertile sandy clay loam in boreal conditions: Effects on soil properties and yield formation of wheat, turnip rape and faba bean. Plant Soil 2014, 374, 89–107. [Google Scholar] [CrossRef]
  65. Ruysschaert, G.; Nelissen, V.; Postma, R.; Bruun, E.; O’Toole, A.; Hammond, J.; Rödger, J.M.; Hylander, L.; Kihlberg, T.; Zwart, K.; et al. Field applications of pure biochar in the North Sea region and across Europe. In Biochar in European Soils and Agriculture: Science and Practice; Shackley, S., Ruysschaert, G., Zwart, K., Glaser, B., Eds.; Routledge: London, UK, 2016; pp. 99–136. [Google Scholar]
  66. Jones, D.L.; Rousk, J.; Edwards-Jones, G.; DeLuca, T.H.; Murphy, D.V. Biochar-mediated changes in soil quality and plant growth in a three year field trial. Soil Biol. Biochem. 2012, 45, 113–124. [Google Scholar] [CrossRef]
  67. Jeffery, S.; Verheijen, F.G.A.; van der Velde, M.; Bastos, A.C. A quantitative review of the effects of biochar application to soils on crop productivity using meta-analysis. Agric. Ecosyst. Environ. 2011, 144, 175–187. [Google Scholar] [CrossRef]
  68. Klakegg, O. Soil Statistics for Oslo and Akerhus Counties; Norwegian Institute for Soil and Forestry Mapping: Ås, Norway, 2002. [Google Scholar]
Figure 1. Biochar field site in Ås, Norway, September 2010. The darkest plots visible are the BC25 treatment.
Agriculture 08 00171 g001
Figure 2. Aggregate mean weight diameter as influenced by slaking (fast wetting), mechanical force (shaking), and clay swelling (slow wetting). Error bars = SE for n = 4. Different letters indicate significant differences between treatments within each test (p < 0.05). n.s. = not significant.
Agriculture 08 00171 g002
Figure 3. Soil resistance to penetration outside (a) and within (b) harvester wheel tracks on harvested plots in autumn 2015 (Solid lines are averages from four plots from where five subsamples were averaged to one measurement per plot, dotted lines are SD). There are no statistical differences between treatments for measurements taken outside and within wheel tracks.
Agriculture 08 00171 g003
Figure 4. Soil volumetric water content in 2012 at 5 cm depth. Solid lines depict the treatment mean and dotted lines SEM, n = 3. Blue bar graph is daily precipitation in the measurement period. An asterix (*) above the lines indicates dates when there was a significant difference between BC25 and the control (only). Otherwise, treatment means were not significantly different at other dates.
Agriculture 08 00171 g004
Figure 5. Soil volumetric water content in 2014 for BC25 vs. the control at 5 and 15 cm depth. Solid lines depict the treatment mean and the dotted lines SEM, n = 4. An asterix (*) above lines depicts dates when there was a significant difference between treatments. Otherwise, treatment means were not significantly different at other dates.
Agriculture 08 00171 g005
Figure 6. Field capacity (FC), Permanent Wilting Point (PWP), and Plant available water (PAW) as a function of SOM content (%) in intact soil cores from the water retention experiment.
Agriculture 08 00171 g006
Figure 7. Pearson correlation coefficient between soil water content at saturation (SWCs) and SOM% (left) and Bulk Density (right).
Agriculture 08 00171 g007
Figure 8. Soil water retention curve from selected cores with (a) high (5.2–7.9%) and (b) moderate (5%) SOM content (n = 1). Points are measured values and lines are model fits to the van Genuchten-Maulem model.
Agriculture 08 00171 g008
Figure 9. Microbial biomass C (A), microbial biomass N (B), and basal respiration (C) measured in soil samples from each treatment in 2012. ± SE, n = 4. Different letters denote significance p < 0.05 between treatments and the control.
Agriculture 08 00171 g009
Table 1. Properties of miscanthus biochar, miscanthus straw (biochar feedstock), and the soil.
UnitMiscanthus BiocharMiscanthus Straw (Biochar Feedstock)Soil (Spring 2011)
Fixed C%DM81.10--
Volatile matter%DM7.40--
Ash%DM11.503.50-
Total C%DM80.0046.732.45
H%DM1.2--
N%DM0.60.200.23
O%DM6.6--
S%DM0.100.05-
C:NRatio256.77233.6517.45
Total Pmg kg−11300802900
P-ALmg kg−11100-106
K-ALmg kg−17500-86
Ca-ALmg kg−14600-2058
Mg-ALmg kg−1640-116
Na-ALmg kg−1360-28
Simg kg−1-3.40-
NO3mg kg−13.32-12.10
NH4mg kg−1--1.50
Femg kg−11100--
Mnmg kg−1160--
Momg kg−1<1.1--
Znmg kg−139--
Clmg kg−1477--
Bmg kg−15.10--
BET-N2m2 g1348--
pH (±SD, n = 9)(H2O)7.86 ± 0.05 (n = 3)-6.39 ± 0.2
ECmS/m130-4.10
Δ13C (±SD, n = 3)−13.60 ± 0.2−12.38 ± 0.1 −27.13 ± 0.1
H:C (atomic) 0.18--
O:C (atomic) 0.06--
Table 2. Bulk density (g cm−3) and total porosity.
BD (1–8 cm)BD (12–19 cm)Total Porosity (%)
2012
Control1.30 ± 0.02 a-50.87 ± 0.84 a
MC81.19 ± 0.04 a-54.99 ± 1.32 a
BC81.16 ± 0.05 a-56.33 ± 2.03 a
BC251.22 ± 0.07 a-53.87± 2.56 a
2014
Control1.30 ± 0.02 a1.36 ± 0.02 a49.93 ± 0.66 a
BC81.29 ± 0.02 a1.38 ± 0.03 a49.67 ± 1.04 a
BC251.21 ± 0.03 b1.26 ± 0.02 b53.27 ± 0.81 b
Bulk density (BD) ± SE, Sampling density, 2012: n = 4 for each treatment, 2014: BC8 (n = 8), BC25 (n = 13), control (n = 10), different letters denote statistically significance difference between the treatment and the control within each depth and year.
Table 3. Grain and straw yield and grain quality (2011–2014). Values are mean (n = 4) ± SE. No significant differences between treatment means within each year.
2011—Oat2012—Barley2013—Oat2014—Oat
Graint ha−1t ha−1t ha−1t ha−1
Control5.33 ± 0.363.76 ± 0.944.84 ± 0.161.92 ± 0.10
MC85.24 ± 0.243.77 ± 0.454.58 ± 0.171.93 ± 0.14
BC85.13 ± 0.094.07 ± 0.654.92 ± 0.241.88 ± 0.25
BC25 5.64 ± 0.273.96 ± 0.734.84 ± 0.112.04 ± 0.50
Strawt ha−1t ha−1t ha−1t ha−1
Control3.10 ± 0.201.38 ± 0.19-0.99 ± 0.12
MC82.65 ± 0.221.66 ± 0.05-1.01 ± 0.86
BC82.96 ± 0.981.47 ± 0.25-0.94 ± 0.14
BC25 3.06 ± 0.181.68 ± 0.12-1.03 ± 0.09
1000 grain weight g g
Control-37.04 ± 0.37-32.56 ± 0.54
BC25-37.74 ± 0.16-33.11 ± 0.31
Grain protein % %
Control-9.85 ± 0.23-9.80 ± 0.44
BC25-10.33 ± 0.25-9.02 ± 0.33

