Article

Effect of Saline Irrigation on Accumulation of Na+, K+, Ca2+, and Mg2+ Ions in Rice Plants

1
Graduate School of Agriculture, Ehime University, 3-5-7 Tarumi, Matsuyama 790-8566, Ehime, Japan
2
Biotechnology Research Institute, Chinese Academy of Agricultural Sciences, Beijing 100081, China
*
Author to whom correspondence should be addressed.
Agriculture 2018, 8(10), 164; https://doi.org/10.3390/agriculture8100164
Submission received: 9 September 2018 / Revised: 13 October 2018 / Accepted: 17 October 2018 / Published: 19 October 2018
(This article belongs to the Special Issue Response and Tolerance of Agricultural Crops to Salinity Stress)

Abstract

:
Salinity is an abiotic stress that curtails rice production in many parts of the world. Although Koshihikari and Nikomaru are high-yielding japonica rice cultivars, their salinity-tolerance levels are not well known. This experiment was conducted in Ehime, Japan to assess the effect of salinity on ion accumulation and dry mass production of Koshihikari and Nikomaru compared with a salinity-tolerant indica rice cultivar (Pokkali). Control (0.16 dS/m), 6 dS/m and 12 dS/m irrigation treatments were conducted during the tillering stage (1st phase of experiment), and later only control and 6 dS/m irrigations were applied during the reproductive stage (2nd phase of experiment). Excessive Na+ accumulation in plants hampers the uptake of the macronutrients K+, Ca2+, and Mg2+, which consequently retards growth and yield. Because salinity-tolerant plants can avoid this stress, minimal Na+ was found in Pokkali during the tillering stage (under 6 dS/m salinity). Additionally, Nikomaru showed better growth and dry mass than Koshihikari. Moreover, the Koshihikari leaves contained more Na+ than Nikomaru and Pokkali. The japonica cultivars had higher Na+/K+ in their leaves than Pokkali. In the reproductive stage, the two japonica cultivars accumulated almost the same amount of Na+ under 6 dS/m salinity. However, under 6 dS/m salinity, the grain yield of Nikomaru was higher than control, whereas that of Koshihikari decreased because of salinity. Meanwhile, Pokkali had the lowest Na+/K+ in the whole plant, and most parts of Nikomaru showed lower Na+/K+ than Koshihikari. Koshihikari was relatively less tolerant than Nikomaru under 6 dS/m salinity during both stages, while both failed to withstand 12 dS/m.

1. Introduction

Rice (Oryza sativa L.) is the staple food crop for over half of the global population. The world population is expanding yearly and there is a strong possibility that it will reach 9 billion by 2050 [1], so rice production should be increased by at least 60% [2]. Meanwhile, climate change causes problems for agricultural production. The increasing hazard of salinity has become linked to the effects of climate change, especially in sea-level areas. Salt stress is progressively endangering crop production even in inland areas covering arid and semi-arid zones because of the accumulation of salt as a result of excessive irrigation using poor-quality water without proper drainage [3,4,5].
Rice plants are inherently sensitive to salt stress [3,6] because the uptake of excessive salt shortens the lifespan of leaves, and carbon assimilation is directly affected by reduced gas exchange and endo-membrane injury, all of which reduce grain yield [7,8]. Salinity causes osmotic stress and ion toxicity. Osmotic stress is the outcome of salt accumulation in growth solution, which reduces the ability of the plant to uptake water, while ion toxicity increases with the accumulation of excessive salts through transpiration flow, which thereby impairs leaf cells; consequently, decreased photosynthesis and growth are the major effects of salt stress [9]. On the other hand, rice is relatively saline tolerant during the germination stage, whereas it is susceptible to salinity during the vegetative and early reproduction stages, and thereby directly influences yield [10]. Researchers have examined the phenotypic expression of salt-tolerant and salt-sensitive rice genotypes under salinity during the vegetative stage of growth and concluded that salt-tolerant genotypes have a lower Na+/K+ in the shoots; perhaps they are comparatively less stressed at the cellular level than salt-sensitive genotypes [11]. Under salt (NaCl) stress, excessive accumulation of Na+ hampers the uptake of macronutrients (K+, Ca2+, Mg2+) by plants, which ultimately results in an ion imbalance [5]. Na+ adversely affects K+ uptake by cells, possibly by hampering K+ transporters [12,13]. Additionally, a large cytosolic Na+ influx causes membrane depolarization which enhances K+ efflux via depolarization-activated outward-rectifying K+ channels [14,15]. The protective effect of Ca2+ in salinized plants to maintain growth is caused by its role in maintaining membrane integrity, and a disruption of membrane integrity caused by displacement of Ca2+ from the cell surface by Na+ is one of the primary effects of salinity [16,17]. Along with Ca2+, Mg2+ concentrations in the roots and shoots increase in parallel with increased salt concentration [18]. However, salinity-tolerant plants usually rely on several defensive mechanisms such as osmoregulation and ion uptake restriction and ion compartmentation [5,19,20,21].
Plant growth is hindered under salt stress due to inadequate photosynthesis, and stress acutely hampers cell division and expansion. Some plants are so sensitive to stress that they almost stop growing even under mild stress. However, some plants are probably not reactive enough and so run the risk of dying by continuing to grow when stress is already serious. Fine tuning this responsiveness could potentially improve productivity under salt stress [19]. Reductions in growth and dry mass in salinity-susceptible cultivars cause a loss of assimilates after being exported from the assimilation site, and this apparent loss might happen because of several factors: root decomposition and exudation; and energy using mechanisms, such as osmoregulation and interruption of Na+ and K+ in transpiration flow and subsequent accumulation in leaf sheaths [20]. On the other hand, several researchers have stated that faster growth indicates the salt-tolerance level of a cultivar under salinity, because it minimizes the fatal effects of excessive Na+ ions through dilution [21]. Thus, rapid growth might help to avoid salinity stress and acquire regular growth and consequently result in proper yield and dry mass. Therefore, growth response to salinity can be used effectively to evaluate resistance.
Salinity tolerance of Koshihikari and Nikomaru (two high-yield japonica rice cultivars) is not well known due to a lack of research in this area. Furthermore, this information would be of great value because growers could determine whether these cultivars are suitable for cultivation in salinized soil and/or whether they possess characteristics that could be improved through traditional plant breeding and genetic engineering. In this study, the effect of salinity stress on Koshihikari and Nikomaru was investigated compared with Pokkali (salt-tolerant indica rice cultivar) through determining and evaluating the concentration of Na+, K+, Ca2+, and Mg2+ ions in different parts of the rice cultivars during two growth phases under salinity conditions; analyzing the Na+/K+ ratio in different parts of the three rice cultivars under salinity stress and determining the tolerance level of the cultivars, especially Koshihikari and Nikomaru; and assessing the dry mass of the cultivars under salinity conditions to determine their performance.

2. Materials and Methods

2.1. Plant Materials and Soil

Two popular japonica rice cultivars, Koshihikari and Nikomaru, and one indica rice cultivar, Pokkali, were used in this experiment. Seeds of Pokkali were obtained from the Genetic Resources Center, NARO, Japan, and other cultivar seeds were kindly provided by Professor Takuya Araki (Ehime University). First, rice seedlings were raised from seeds in plastic trays containing JA Baido (granular type soil substance containing 0.7% nitrogen, 0.7% phosphate, and 0.7% potassium), then transplanted to plastic pots. Each pot (10 L) contained only one healthy seedling. Air-dried and properly sieved rice-field soil was mixed with JA Baido in a 2:1 ratio for the pot experiment. This ratio was considered suitable for proper drainage of water (10–15 mm/day) based on the results of trial and error with different ratios of rice-field soil and JA Baido. The average pH and EC values of this mixed soil were 6.1 and 0.061 dS/m, respectively.

2.2. Preparation of Pot and Experimental Site

Twenty-five holes (0.8 mm radius/hole) were made at the bottom of each plastic pot (10 L) to allow infiltration, and the bottom of the pot was then covered with nylon net from the inside. The mixed soil was then poured into each pot uniformly. Each pot was kept above a plastic tray that was used to collect the drained water and prevent the extended roots of the rice plants from touching the ground. The soil in each plastic pot was supplied with 3.5 g NPK (13-13-13) fertilizer before transplanting. The pot experiment was conducted in a glasshouse in the experimental area of the Graduate School of Agriculture, Ehime University, Ehime, Japan (June–November, 2016). The environmental condition of the glasshouse was 25 ± 2 °C, 70 ± 10% relative humidity, and L12:D12 photoperiod.

2.3. Irrigation

All rice plants were irrigated every day (once in the morning). The salinity-treated plants were irrigated with saline water (1 L saline water/pot) twice a week. On other days, those plants were irrigated with tap water to maintain the desired EC in the plant root solution (surface water). A surface water depth of about 3 cm was maintained in each rice plant-containing pot so that all plants were provided with approximately the same amount of tap water after measuring their surface water depth. The pH value of the surface water of each pot was measured each day before irrigation, and its range was 7.0–8.0. The experiment was divided into two growth phases: 1. Tillering stage: from minimum tillering to maximum tillering; 2. Reproductive stage: from flag leaf initiation (FLI) to before harvesting (H) day. The control plants were always irrigated with tap water (EC = 0.16 dS/m), whereas the salinity-treated plants were irrigated with 6 and 12 dS/m saline water during the first phase. Because the japonica cultivars failed to tolerate 12 dS/m salinity, the experiment was restarted at the reproductive stage, in which the salinity-treated plants were irrigated only with 6 dS/m saline water. The same tap water was used to prepare saline irrigation water by adding table salt (NaCl) until the desired EC level was obtained. Primarily, the formula: 1 dS/m = 1 mS/cm = 1 mmho/cm = 640 ppm = 640 mg/L = 0.64 g/L was followed to estimate the approximate amount of salt to mix with tap water to prepare the saline water; sometimes, slightly more or less than the exact calculated amount of salt was needed to adjust the EC level. Horiba D-54 (HORIBA, Ltd., Kyoto, Japan) water quality meter was used to measure EC and pH values.

2.4. Experimental Design, Data Collection and Statistical Analysis

In this research, a completely randomized design was used. One seedling of each rice cultivar per pot was used for each irrigation treatment with six replications. Plants were sampled at the maximum tillering stage (only replications of 6 and 12 dS/m salinity-treated plants) and after harvesting (replications of control and 6 dS/m salinity-treated plants) to measure dry mass and determine the total concentration of Na+, K+, Ca2+, and Mg2+ in the different parts (grain, leaf, upper and lower stems, root) of the rice plant using atomic absorption spectrophotometer analysis (AAS analysis). The whole stem of each plant was equally divided into two parts (upper and lower), with the length of each divided part being at least 30 cm to ensure there was enough sample after drying and grinding. Because the whole stems of the Koshihikari plants under 12 dS/m salinity (in the tillering stage) were very short and thin due to poor growth, its whole stem was used to measure dry mass and ion concentration without dividing it into two parts. At the end of the 1st phase of the experiment, the control plants were not sampled due to the lack of enough extra plants to restart the experiment at the reproductive stage. During the 2nd phase of the experiment, these plants were used again as control plants, and some extra plants, which were cultivated earlier under control conditions, were subjected to saline irrigation (6 dS/m). In the tillering stage, the plants of all cultivars were sampled on 29th July (after being subjected to saline irrigation for about one month), when all the rice cultivars were showing a maximum number of tillers. In the reproductive stage, Koshihikari (FLI = 1st August; H = 19th September), Nikomaru (FLI = 12th August; H = 30th September) and Pokkali (FLI = 13th September; H = 1st November) were irrigated with saline water from the FLI day to one week before H day. Data were analyzed statistically using the statistical software package SPSS 16.0, 2007 (SPSS Inc., Chicago, IL, USA). One-way analysis of variance (ANOVA) was performed, where the treatment means were compared using the least significant difference (LSD) test at the 5% significance level, and standard errors of the mean were used for further comparison of the treatments.

3. Results

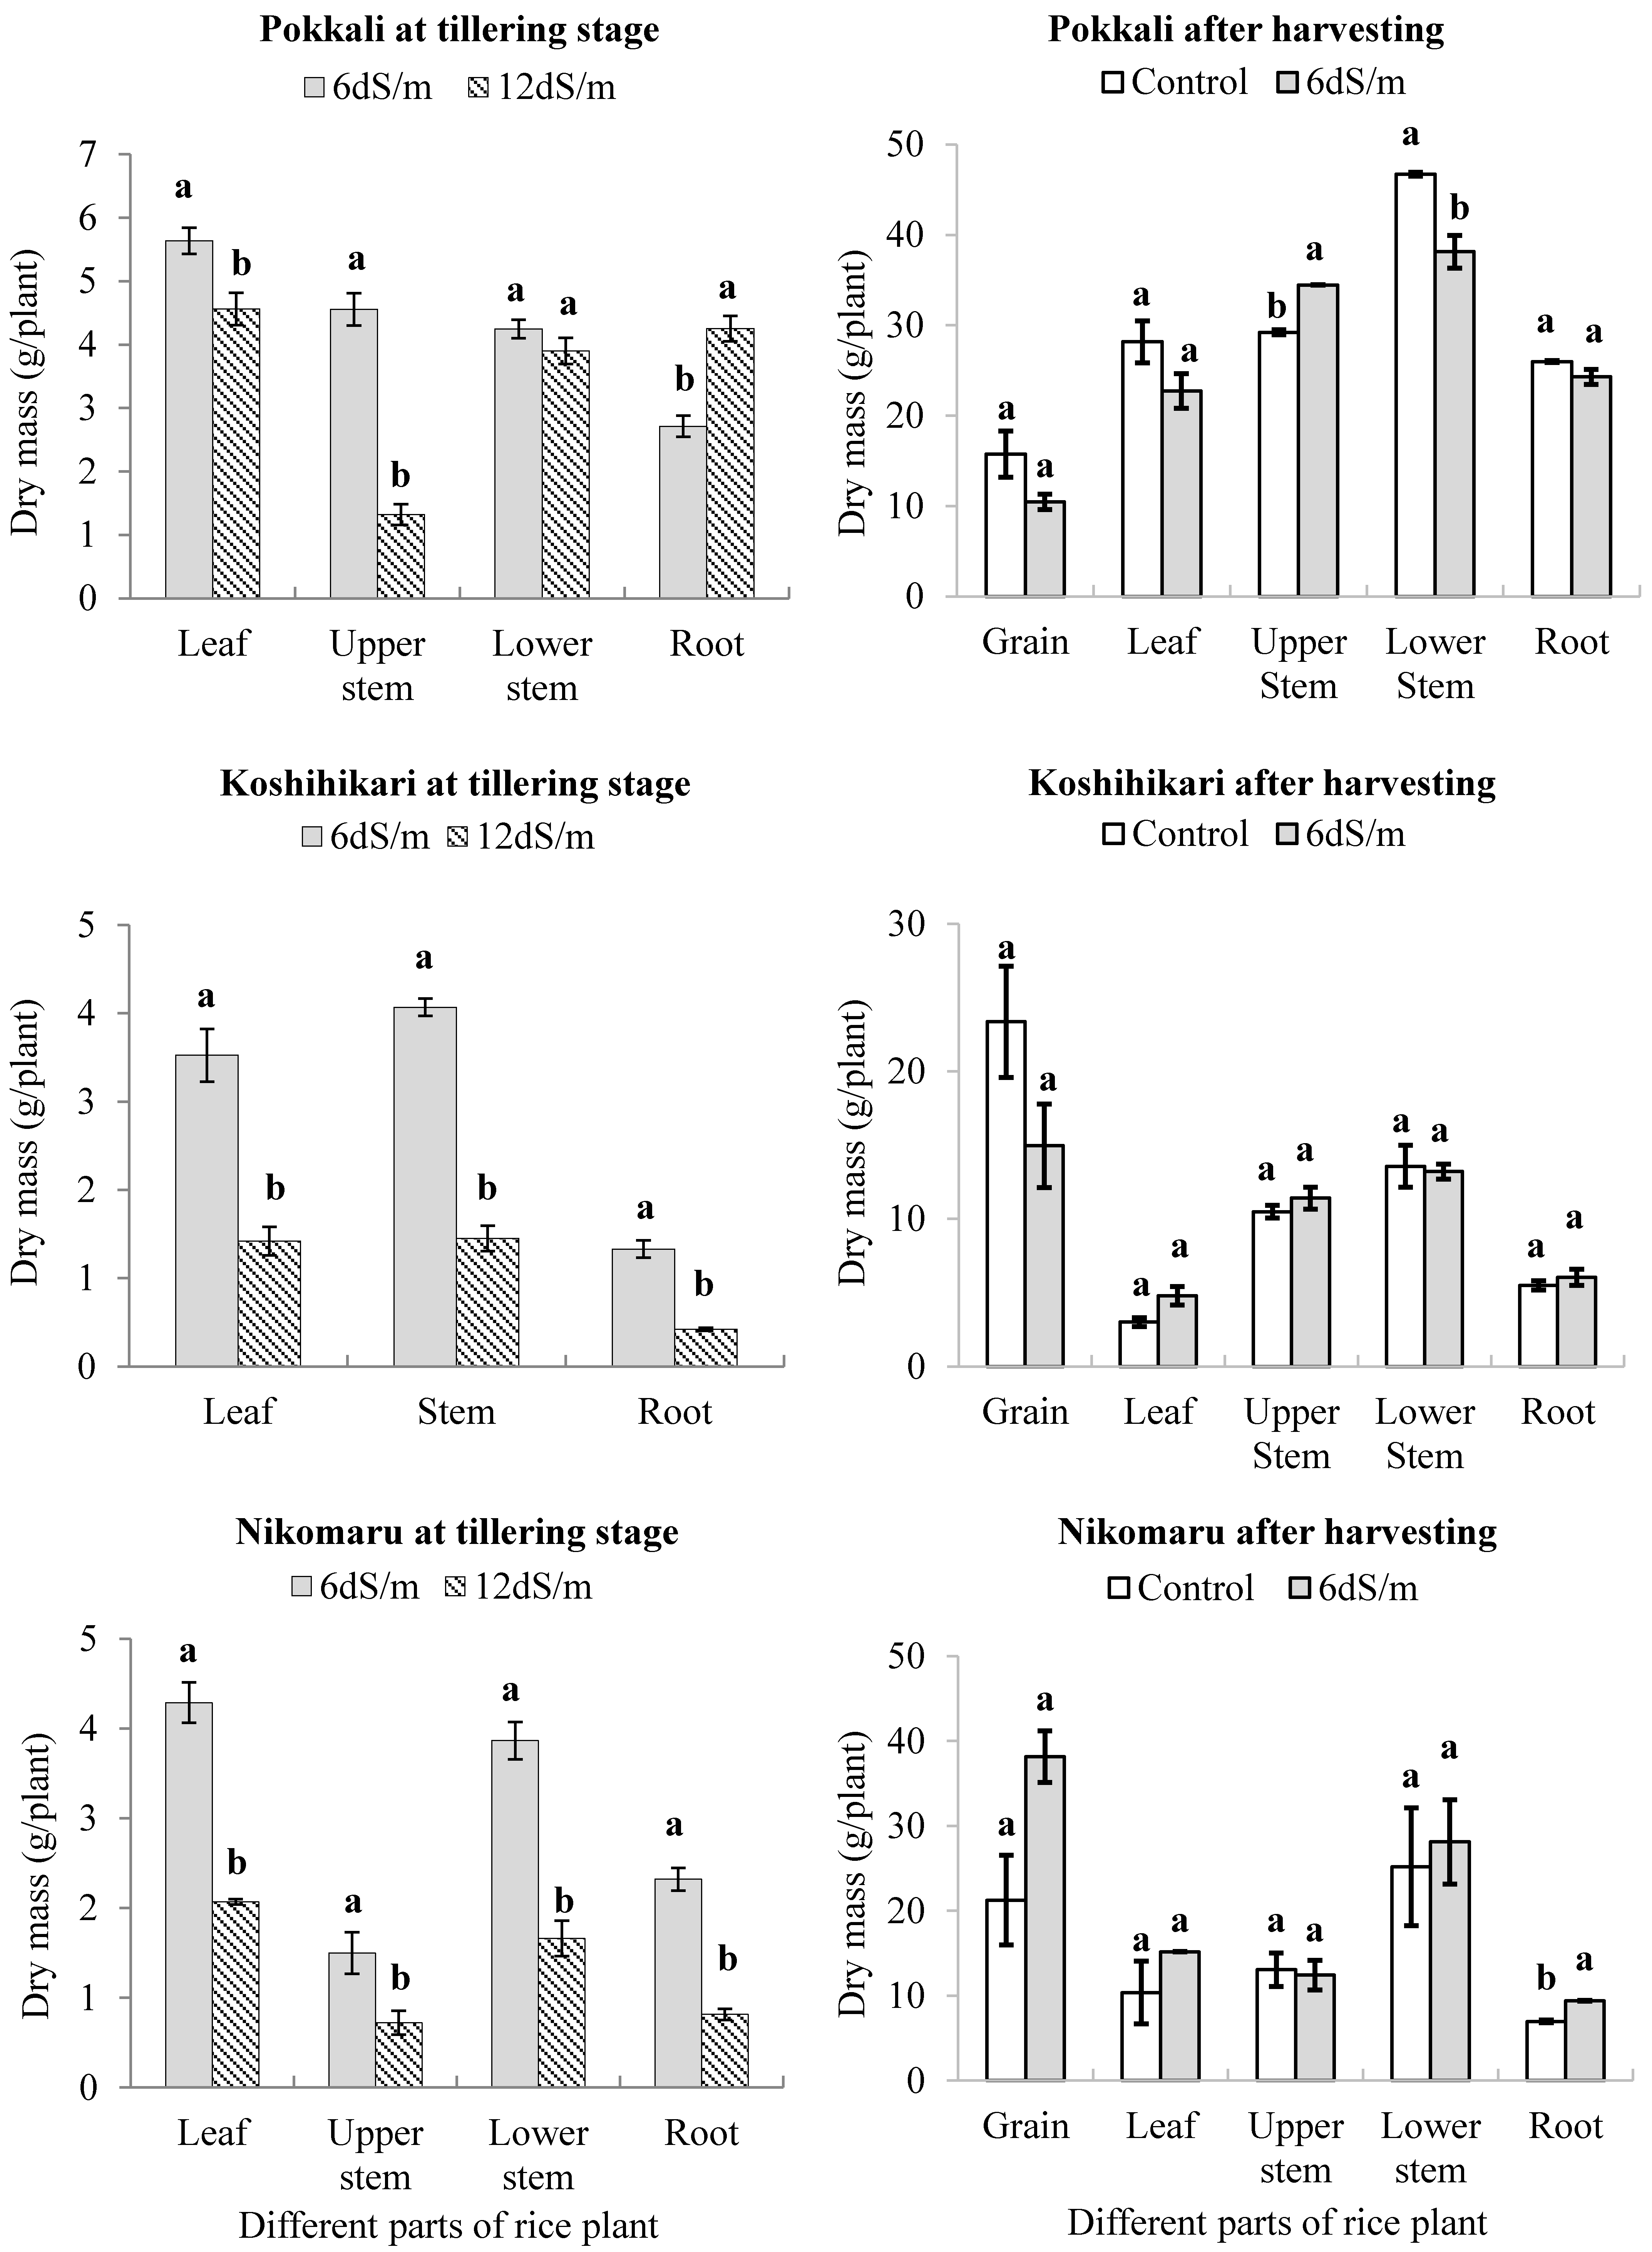
3.1. Effect of Saline Irrigation on the Dry Mass of the Three Rice Cultivars

In the tillering stage, when the plants were sampled and separated into different parts, dried in an oven, and the dry masses were measured, it was observed that the dry mass of all parts of the three rice cultivars decreased under 12 dS/m salinity except the roots of Pokkali (6 dS/m = 2.71 g/plant and 12 dS/m = 4.25 g/plant; p = 0.0042). Under 12 dS/m salinity, Pokkali showed an 18.2% decrease in total dry mass followed by Nikomaru (56.0% decrease) and Koshihikari (63.2% decrease) compared with the plants under 6 dS/m salinity. Additionally, the leaf dry masses of Pokkali (p = 0.0302), Koshihikari (p = 0.0035), and Nikomaru (p = 0.0006) showed significant decreases under 12 dS/m salinity. Similarly, the dry masses of the upper stems of Pokkali (p = 0.0004) and Nikomaru (p = 0.0429) and the whole stems of Koshihikari (p = 0.0001) had a significant reduction under 12 dS/m salinity compared with 6 dS/m salinity. Under 12 dS/m salinity, significant decreases were also observed in the roots (dry mass) of Koshihikari (p = 0.0008) and Nikomaru (p = 0.0004), as well as in the lower stems (dry mass) of Nikomaru (p = 0.0015), whereas the lower stems (dry mass) of Pokkali exhibited no significant difference (Figure 1).
In the reproductive phase, when the three rice cultivars were irrigated with tap water (control) and 6 dS/m saline water only, the Nikomaru plants showed a non-significant increase in the dry masses of grain, leaf, and lower stem under 6 dS/m salinity, whereas a significant increase was found in its root dry mass (control = 6.96 g/plant and 6 dS/m = 9.39 g/plant; p = 0.0001). The upper stems of Nikomaru showed a non-significant decrease in dry mass. Moreover, the dry masses of different parts of Koshihikari revealed no significant difference between control and the 6 dS/m saline treatment. Similar results were observed in the leaf, grain, and root of Pokkali. On the other hand, a significant increase was observed in the upper stems (dry mass) of Pokkali (control = 29.23 g/plant and 6 dS/m = 34.46 g/plant; p = 0.0001), whereas its lower stems had a significant decrease in dry mass (control = 46.72 g/plant and 6 dS/m = 38.14 g/plant; p = 0.0095). Nikomaru had a 34.5% increase (control = 76.77 g/plant and 6 dS/m = 103.23 g/plant) in total dry mass; in contrast, Koshihikari (control = 55.92 g/plant and 6 dS/m = 50.42 g/plant) and Pokkali (control = 145.87 g/plant and 6 dS/m = 130.11 g/plant) showed 9.8 and 10.8% decreases, respectively. In this study, a lower grain dry mass was measured for Pokkali (control = 15.76 g/plant and 6 dS/m = 10.47 g/plant). Nikomaru grain dry mass (21.25 g/plant) was slightly lower than Koshihikari (23.36 g/plant) under the control condition, but the opposite result was observed under 6 dS/m salinity (Nikomaru = 38.15 g/plant and Koshihikari = 14.96 g/plant) (Figure 1). Additionally, the saline-treated Nikomaru plants matured for harvesting about one week earlier than the control plants of Nikomaru.

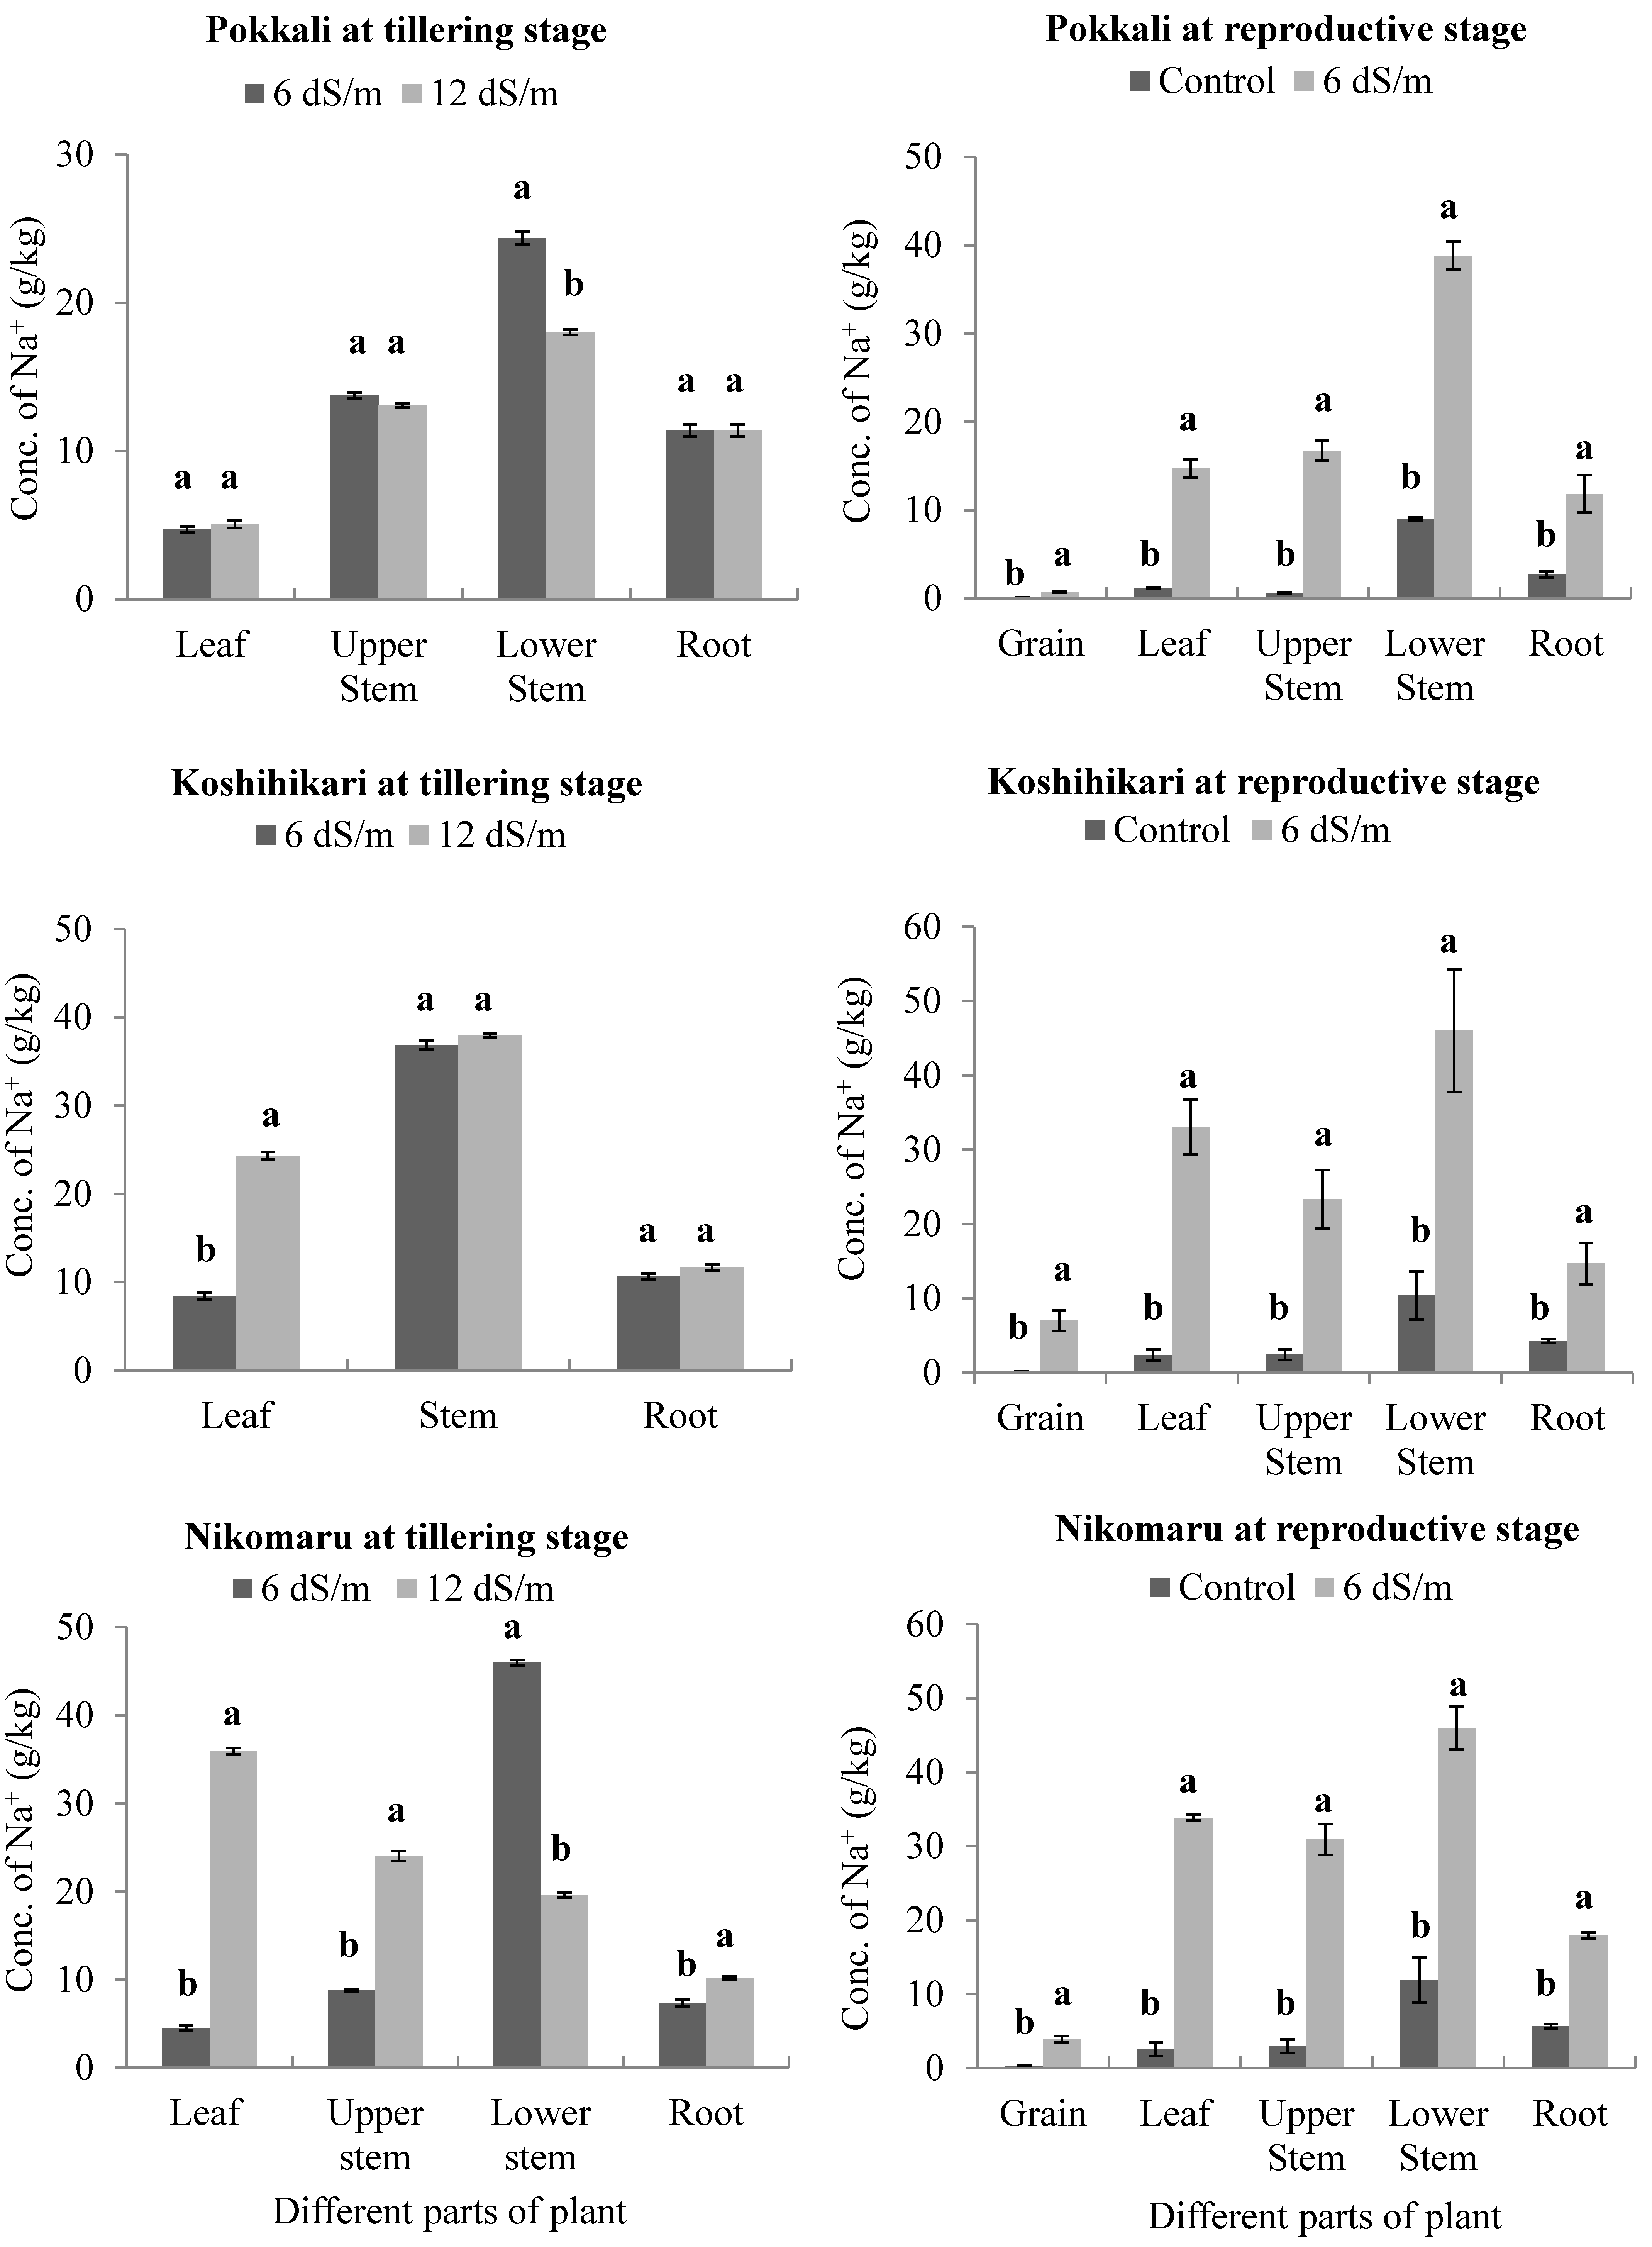
3.2. Effect of Saline Irrigation on the Accumulation of Sodium (Na+) Ions in Different Parts of the Rice Plant Body

In the tillering stage, it was observed that the leaves of Koshihikari and Nikomaru were not protected from higher Na+ compared with Pokkali under 12 dS/m salinity. Accumulation of Na+ increased significantly in the leaves of Koshihikari (6 dS/m = 8.401 g/kg and 12 dS/m = 24.316 g/kg; p = 0.0001) and Nikomaru (6 dS/m = 4.515 g/kg and 12 dS/m = 35.945 g/kg; p = 0.0001), whereas the leaves of Pokkali showed no significant difference between the two saline treatments. Moreover, different parts of Pokkali exhibited non-significant differences between the two saline treatments except the lower stems, which had a significant reduction in Na+ accumulation (6 dS/m = 24.362 g/kg and 12 dS/m = 18.022 g/kg; p = 0.0002). Similarly, a significant decrease was found in the lower stems of Nikomaru (6 dS/m = 45.984 g/kg and 12 dS/m = 19.582 g/kg; p = 0.0001). On the other hand, the upper stems (6 dS/m = 8.790 g/kg and 12 dS/m = 24.022 g/kg; p = 0.0001) and roots (6 dS/m = 7.309 g/kg and 12 dS/m = 10.173 g/kg; p = 0.0032) of Nikomaru showed a significant increase in Na+ accumulation under 12 dS/m salinity compared with 6 dS/m salinity. However, the roots (6 dS/m = 10.619 g/kg and 12 dS/m = 11.673 g/kg; p = 0.0984) and whole stems (6 dS/m = 36.867 g/kg and 12 dS/m = 37.909 g/kg; p = 0.1255) of Koshihikari had a non-significant difference in accumulation of Na+ (Figure 2).
In the reproductive stage, the replications of the three rice cultivars that were irrigated with only tap water (control) absorbed lower Na+ than the 6 dS/m salinity-treated plants. All parts of Pokkali, Koshihikari, and Nikomaru showed a significant increase in accumulation of Na+ under 6 dS/m salinity compared with control. In the leaves, Pokkali had a relatively lower accumulation of Na+ (control = 1.178 g/kg and 6 dS/m = 14.735 g/kg; p = 0.0002), whereas Koshihikari (control = 2.403 g/kg and 6 dS/m = 33.064 g/kg; p = 0.0013) and Nikomaru (control = 2.510 g/kg and 6 dS/m = 33.840 g/kg; p = 0.0001) showed a relatively higher accumulation (Figure 2).

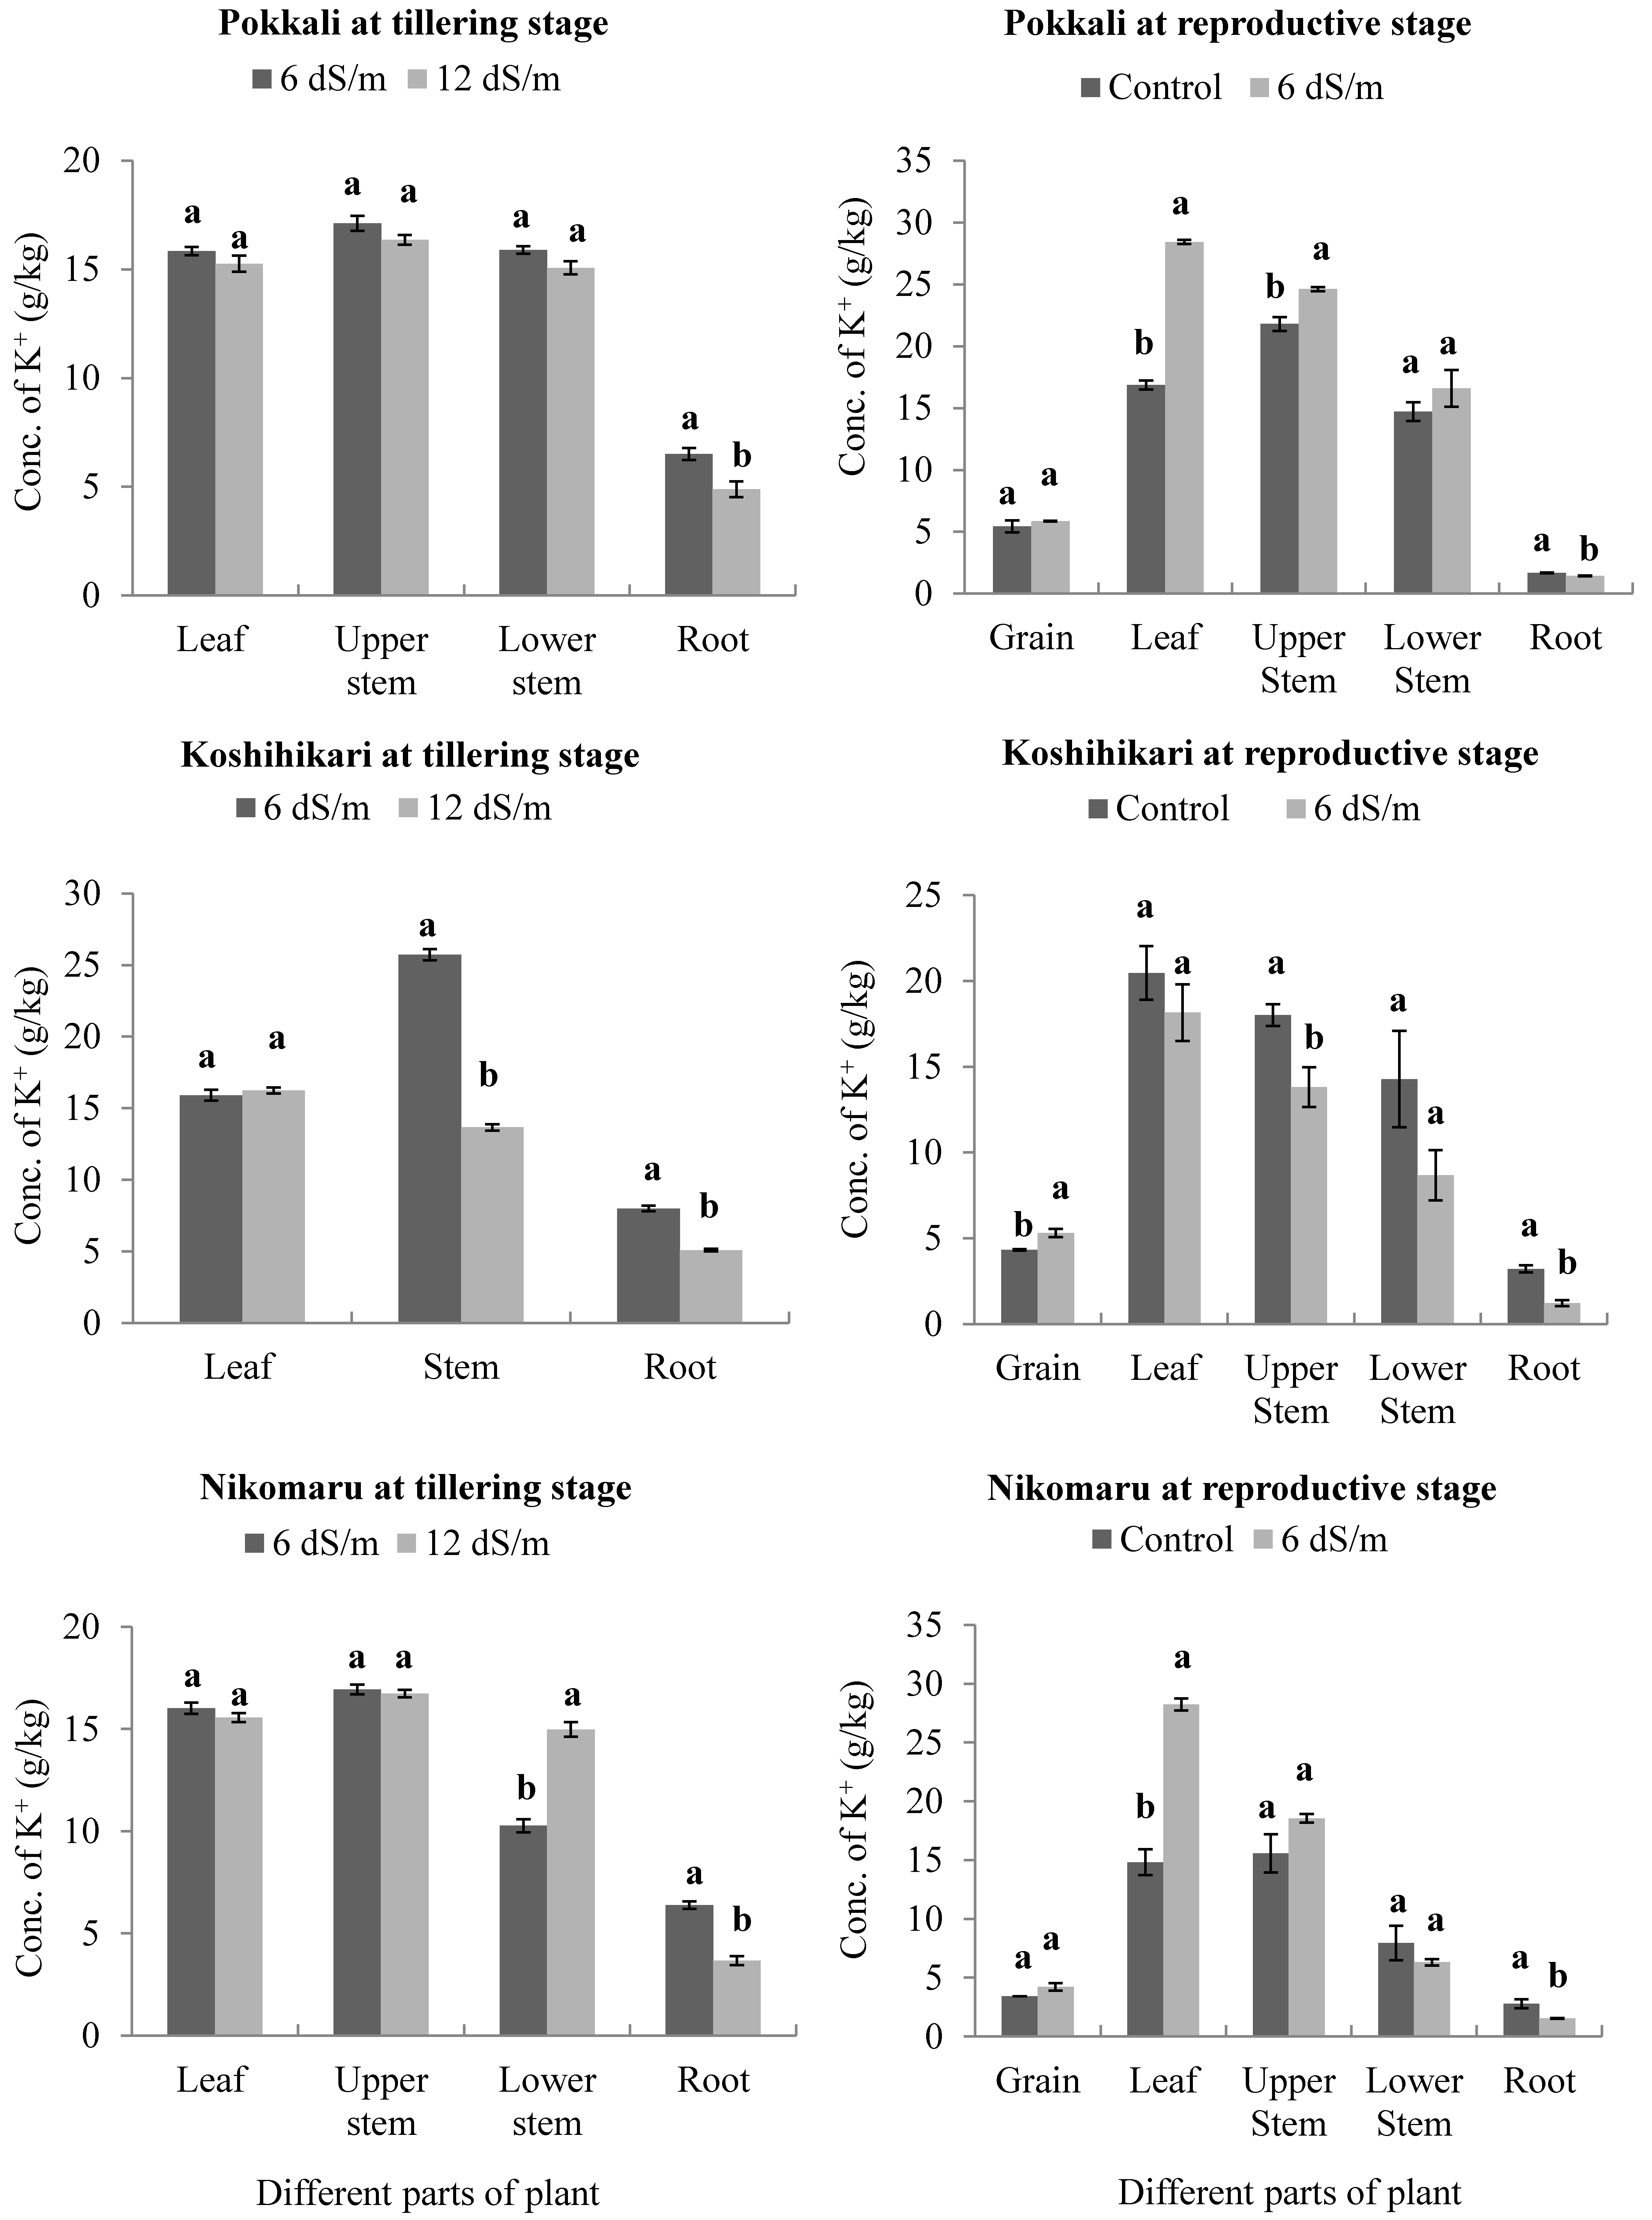
3.3. Effect of Saline Irrigation on the Accumulation of Potassium (K+) Ions in Different Parts of the Rice Plant Body

In the tillering stage, the roots stored a relatively lower amount of K+ than other parts of Pokkali, Koshihikari, and Nikomaru. Under 6 dS/m salinity, the roots of Nikomaru contained 6.384 g/kg K+, whereas 6.511 and 7.990 g/kg K+ were found in the roots of Pokkali and Koshihikari, respectively. In addition, the concentrations of K+ in the roots of the cultivars decreased significantly under the higher salinity level. Under 12 dS/m salinity, the lowest concentration was found in the roots of Nikomaru (3.673 g/kg; p = 0.0007), followed by the roots of Pokkali (4.887 g/kg; p = 0.0233) and Koshihikari (5.086 g/kg; p = 0.0002). Moreover, the leaves of the three cultivars, the upper and lower stems of Pokkali, and the upper stems of Nikomaru showed non-significant differences in accumulation of K+ between the two saline treatments. However, a significant decrease was found in stored K+ in the whole stems of Koshihikari (p = 0.0001) under 12 dS/m salinity compared with 6 dS/m salinity. Meanwhile, the lower stems of Nikomaru stored a higher amount of K+ under 12 dS/m salinity (14.975 g/kg) than under 6 dS/m salinity (10.270 g/kg) (p = 0.0006) (Figure 3).
In the reproductive stage, the roots of the three cultivars showed lower concentrations of K+ under 6 dS/m salinity than the control plants. Under control irrigation, K+ concentrations in the roots of Pokkali, Nikomaru, and Koshihikari were 1.683, 2.772, and 3.219 g/kg, respectively, whereas 1.432, 1.530, and 1.218 g/kg K+ were found in the roots of Pokkali, Nikomaru, and Koshihikari, respectively, under 6 dS/m salinity. In Pokkali, the concentrations of K+ in the leaves (28.446 g/kg; p = 0.0001) and upper stems (24.629 g/kg; p = 0.0087) increased significantly under 6 dS/m salinity, whereas 16.868 and 21.805 g/kg K+ were measured in the leaves and upper stems, respectively, under control. However, no significant difference was observed in K+ accumulation in the grains and lower stems. In Nikomaru, K+ increased significantly (p = 0.0004) in the leaves (6 dS/m = 28.242 g/kg; control = 14.806 g/kg), whereas its grains, upper stems and lower stems showed no significant differences in K+ accumulation. In all the cultivars, K+ concentration decreased in the roots under 6 dS/m salinity. Koshihikari exhibited a non-significant difference between the two treatments in accumulation of K+ in the leaves. However, significant decreases were observed in the upper stems (6 dS/m = 13.811 g/kg; control = 18.015 g/kg; p = 0.0331) and roots (6 dS/m = 8.672 g/kg; control = 14.284 g/kg; p = 0.0016) under 6 dS/m salinity compared with control, but its grains and lower stems showed no significant difference (Figure 3).

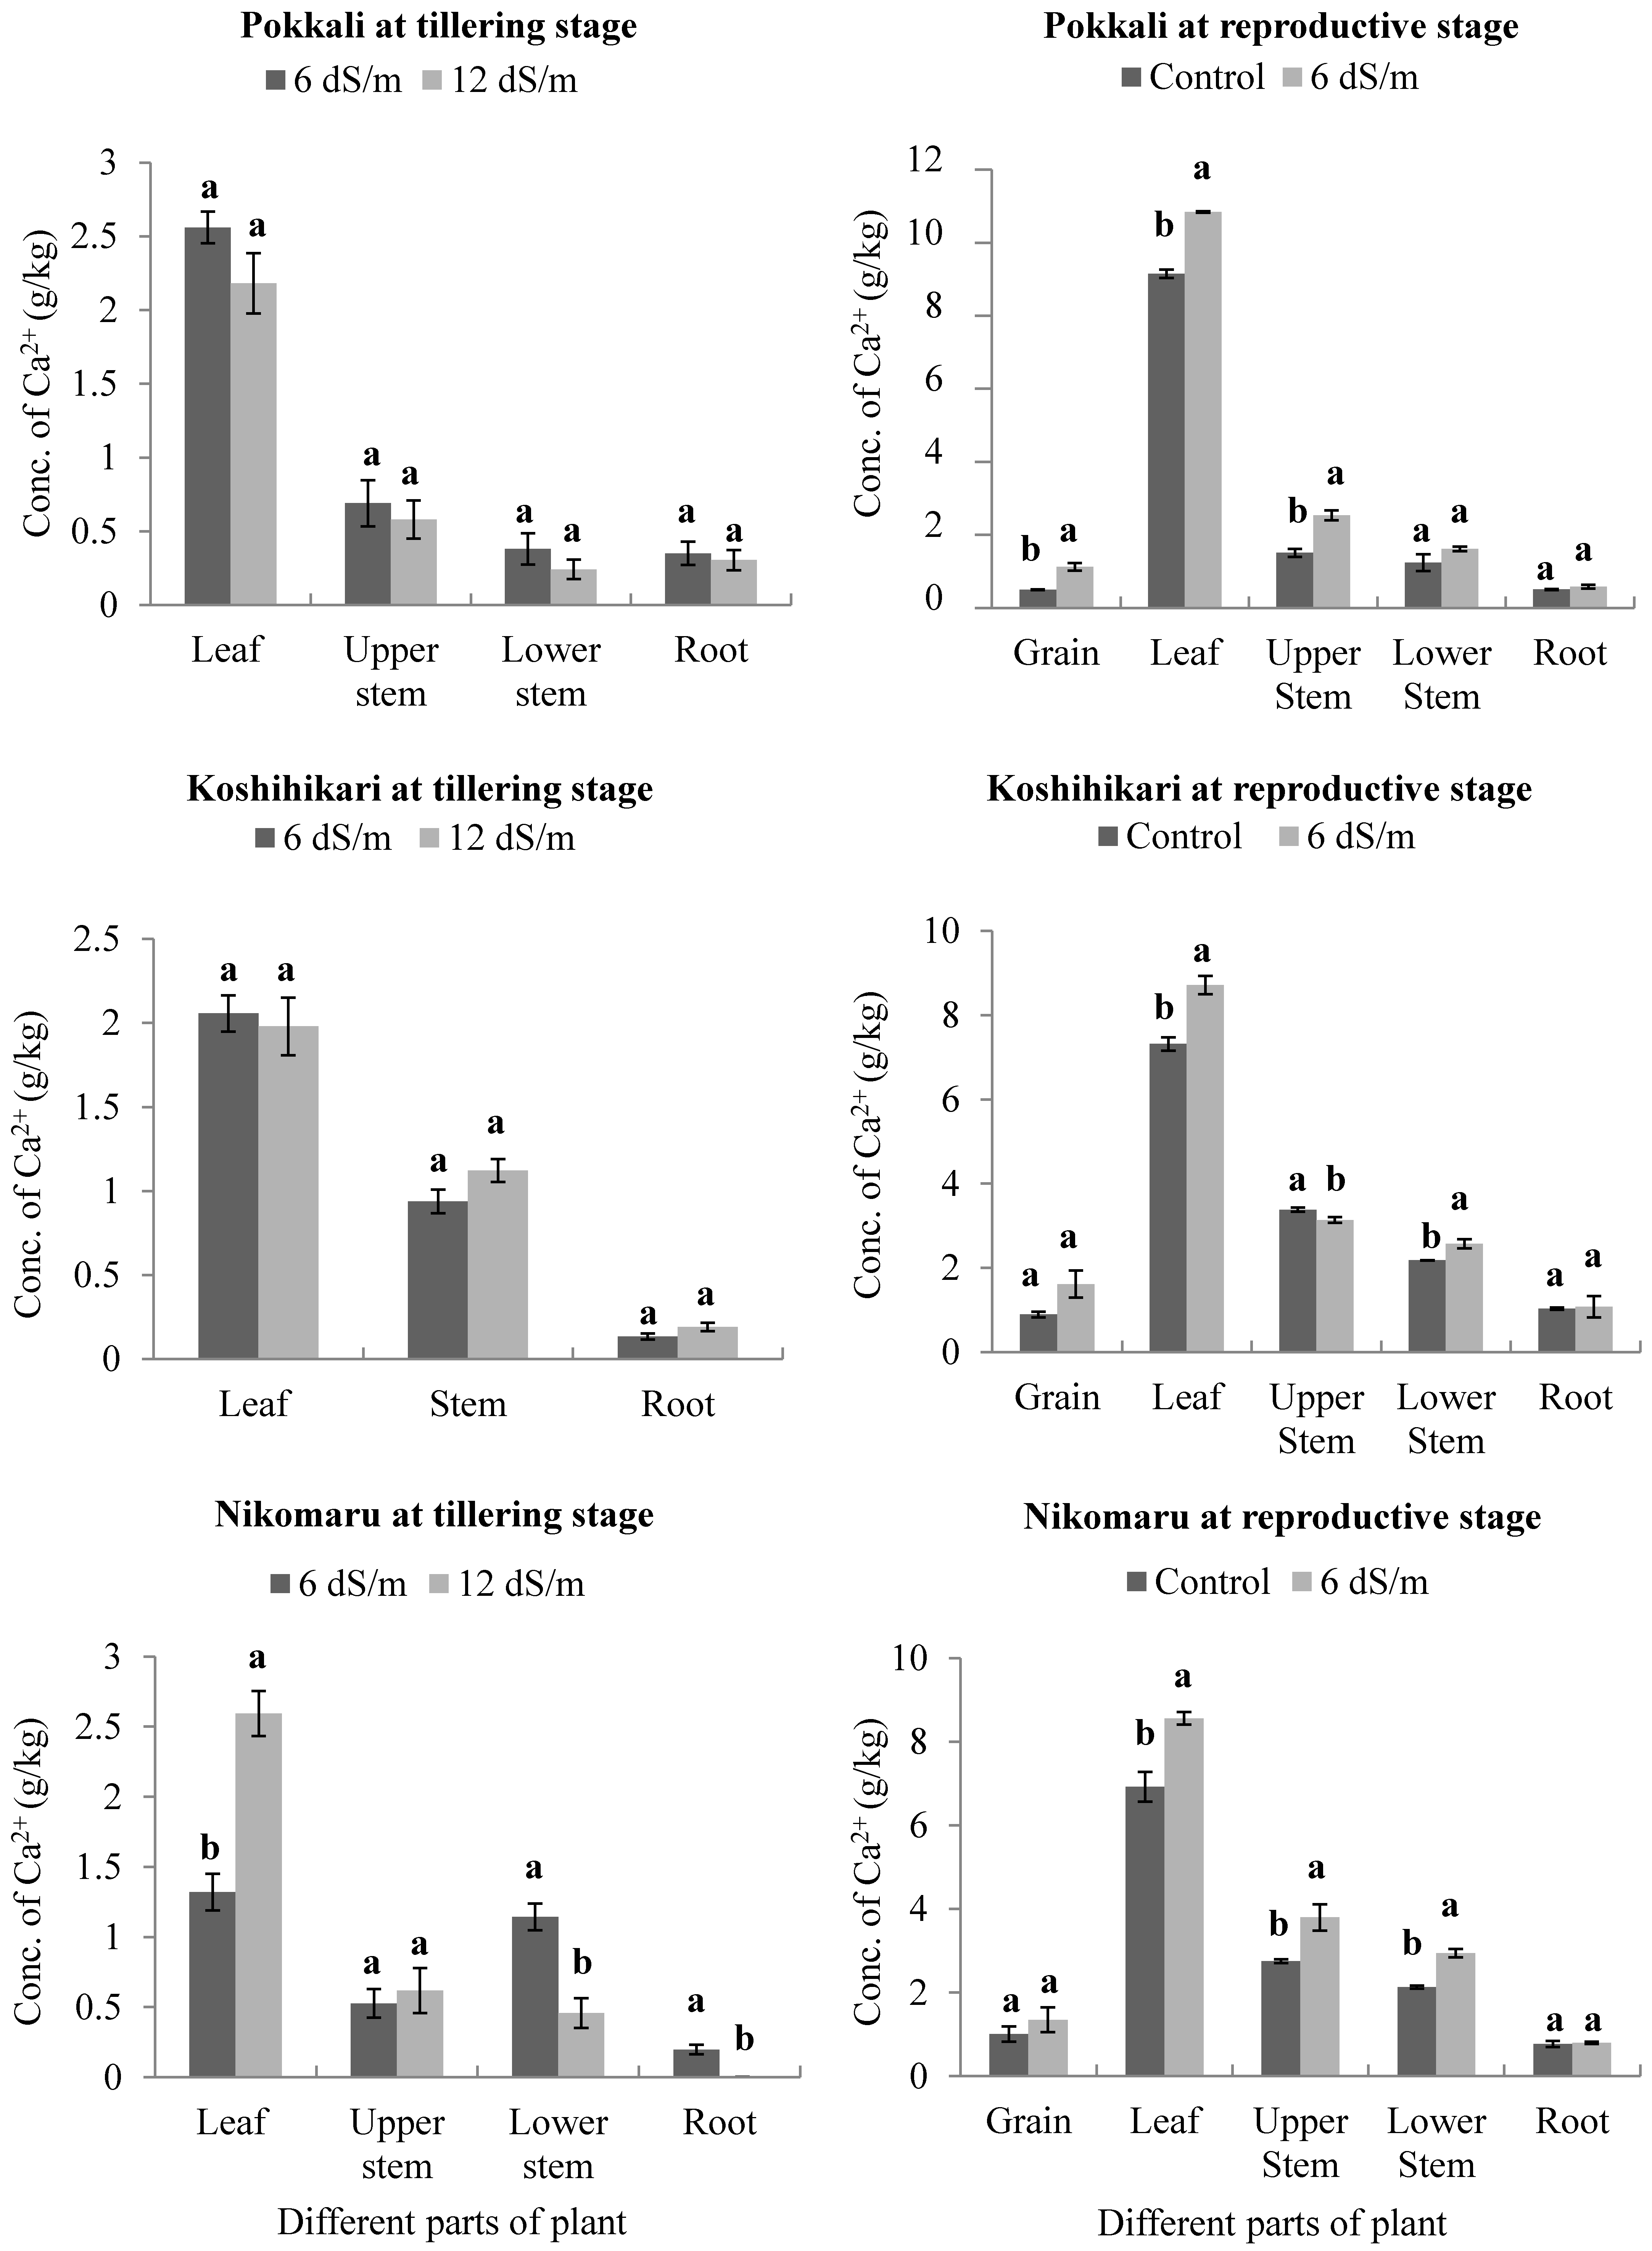
3.4. Effects of Saline Irrigation on the Accumulation of Calcium (Ca2+) Ions in Different Parts of the Rice Plant Body

In the tillering stage, the highest amount of Ca2+ was found in the leaves of Pokkali (2.560 g/kg), followed by the leaves of Koshihikari (2.057 g/kg) and Nikomaru (1.319 g/kg). The accumulation of Ca2+ in the leaves of Nikomaru increased significantly under 12 dS/m salinity (2.593 g/kg) compared with 6 dS/m salinity (1.319 g/kg) (p = 0.0036). However, Pokkali and Koshihikari showed non-significant differences. Additionally, Ca2+ decreased significantly in the lower stems of Nikomaru under 12 dS/m salinity (0.458 g/kg) compared with 6 dS/m salinity (1.143 g/kg) (p = 0.0085), whereas the upper stems of Nikomaru, whole stems of Koshihikari, and upper and lower stems of Pokkali exhibited no significant differences between the two treatments. The concentration was significantly reduced in the roots of Nikomaru under 12 dS/m salinity (0.002 g/kg) compared with 6 dS/m salinity (0.197 g/kg) (p = 0.0043), and no significant difference was found in the accumulation of Ca2+ in the roots of Koshihikari and Pokkali between the two saline treatments (Figure 4).
In the reproductive stage, when the three rice cultivars were irrigated with 6 dS/m saline water, the concentration of Ca2+ in their leaves increased significantly compared with the control plants of the three cultivars (p-values for Pokkali, Koshihikari, and Nikomaru were 0.0001, 0.0062, and 0.0133, respectively). Similarly, the accumulation of Ca2+ increased significantly in the upper stems of Pokkali (p = 0.0041) and Nikomaru (p = 0.0294) under 6 dS/m salinity compared with control. However, the concentration was slightly lower in the upper stems of Koshihikari under 6 dS/m salinity (p = 0.0433). Furthermore, significantly larger concentrations of Ca2+ were found in the grains of Pokkali (p = 0.0039) and lower stems of Koshihikari (p = 0.0232) and Nikomaru (p = 0.0016). On the other hand, the concentrations of Ca2+ in the roots of the three rice cultivars revealed non-significant variation between 6 dS/m salinity and control, and no significant difference was observed in the lower stems of Pokkali and the grains of the two japonica cultivars (Figure 4).

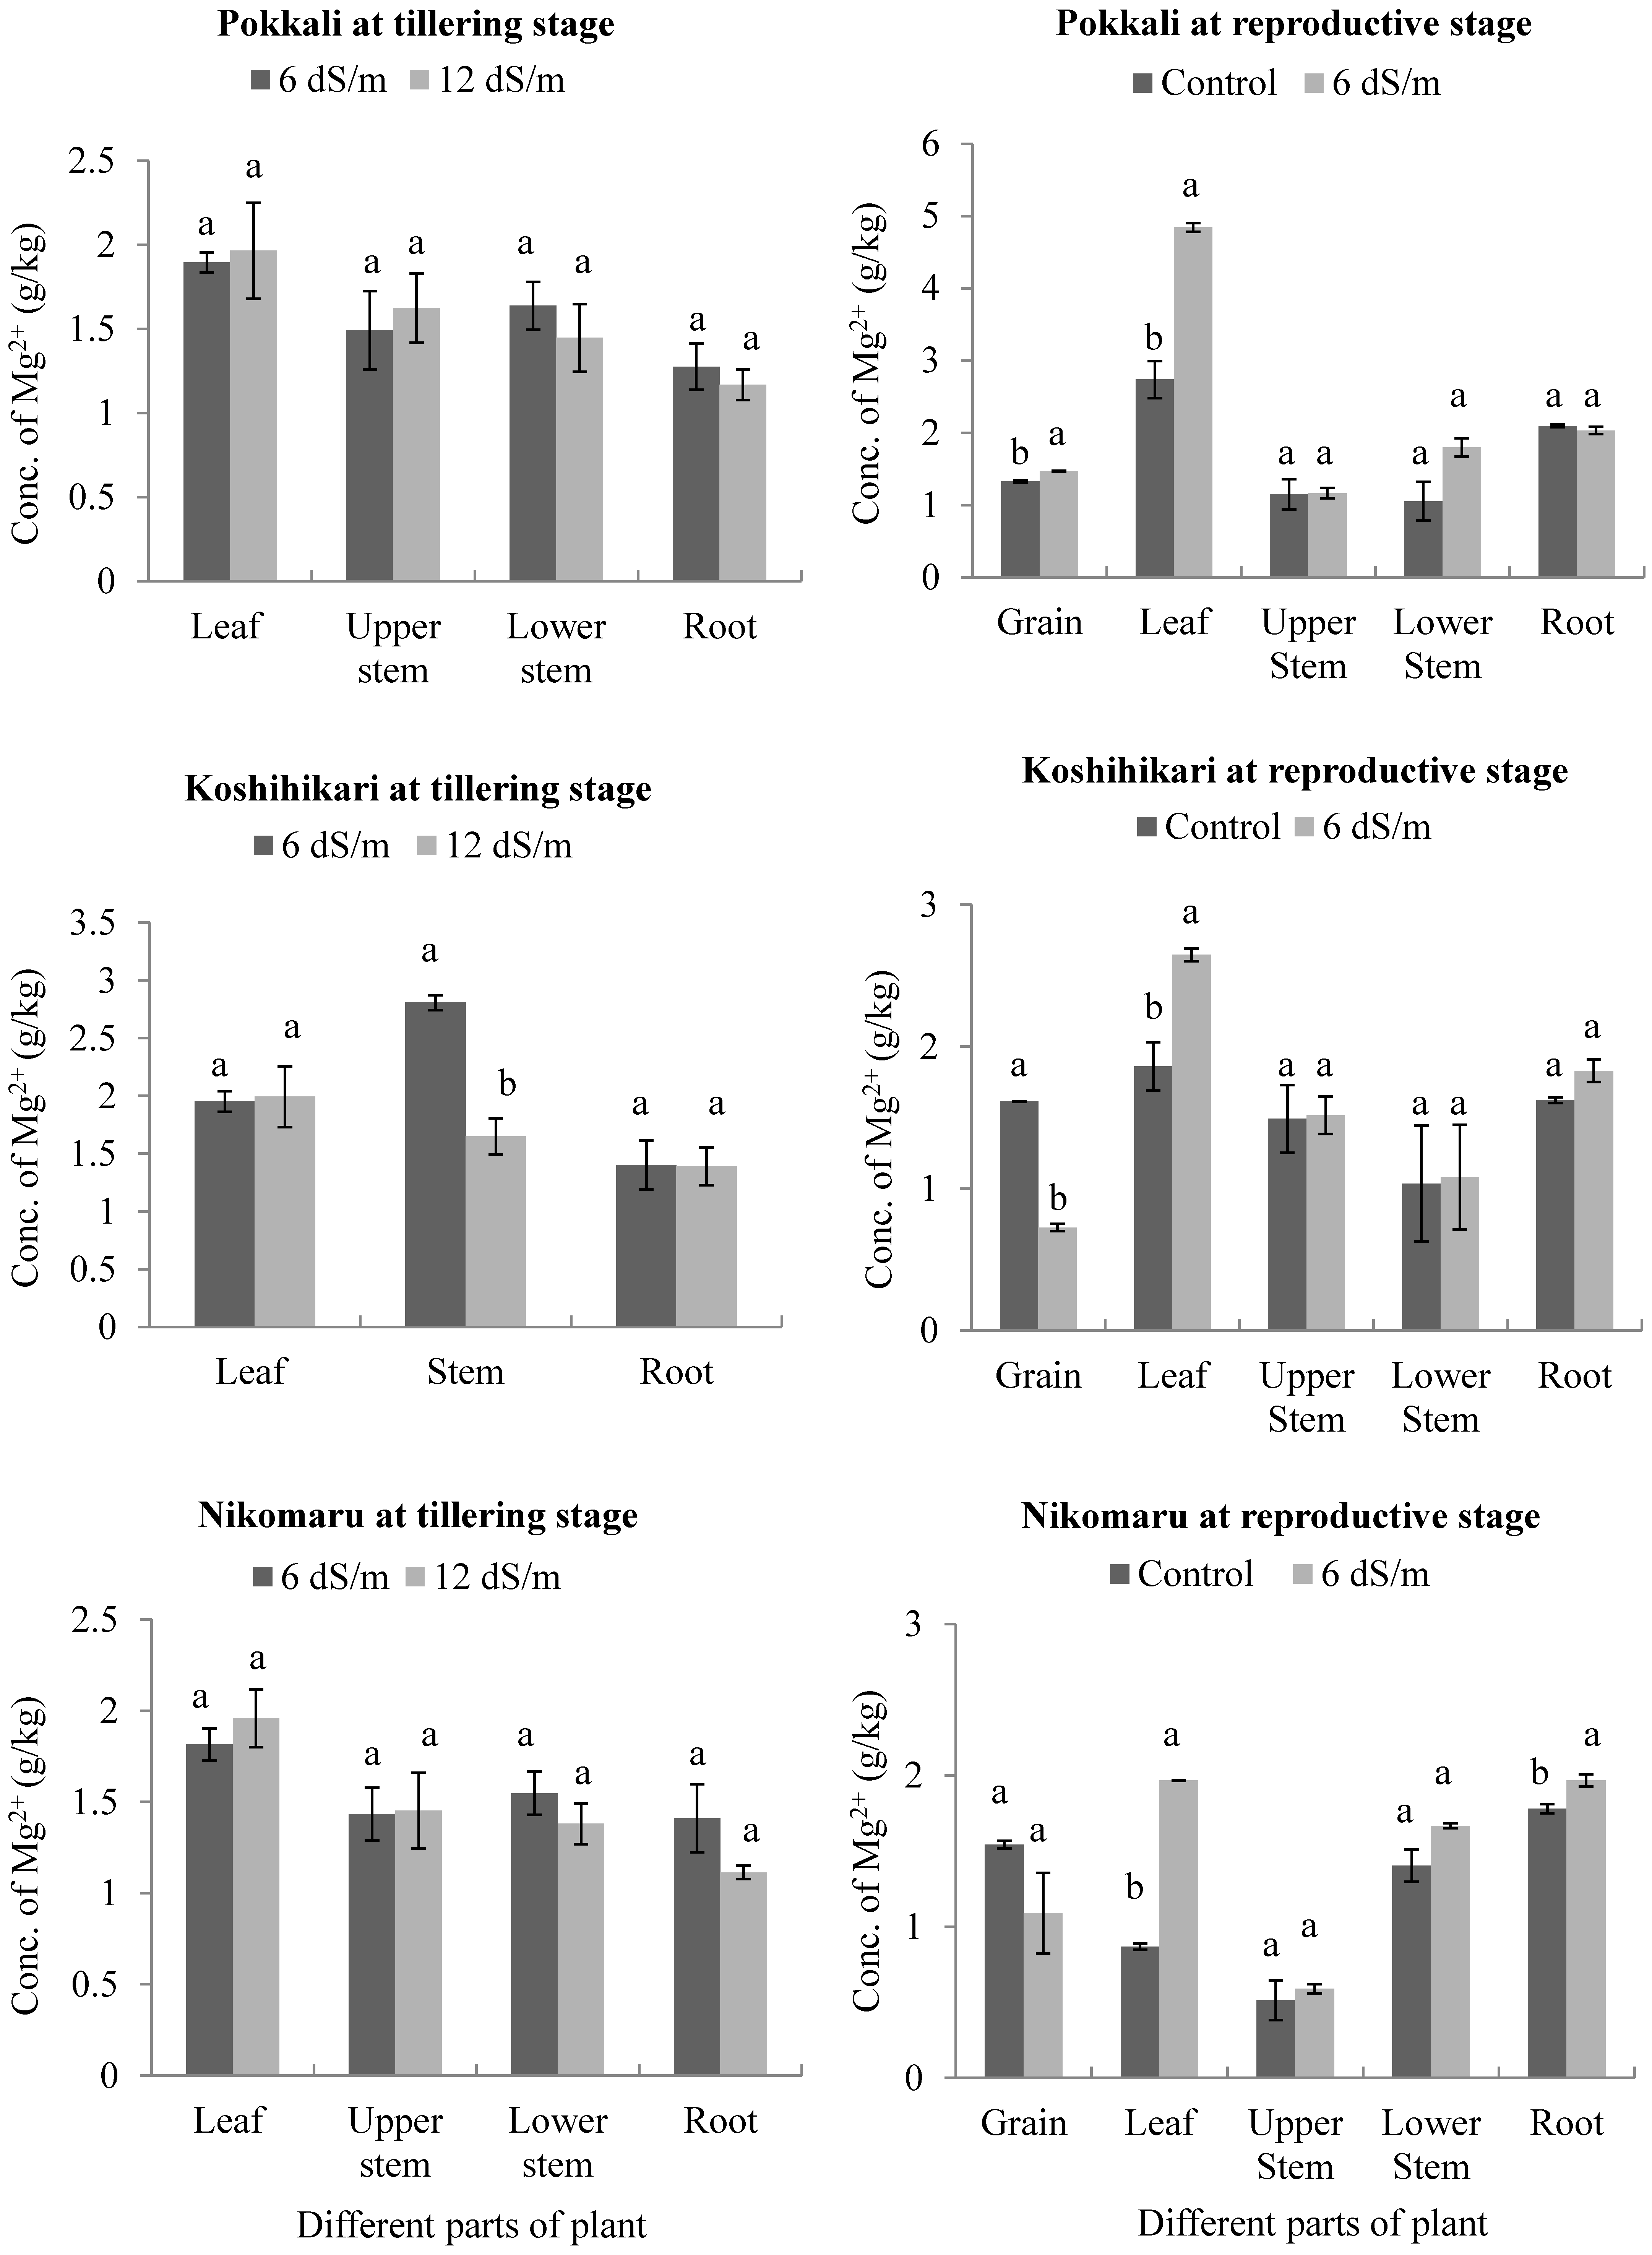
3.5. Effects of Saline Irrigation on the Accumulation of Magnesium (Mg2+) Ions in Different Parts of the Rice Plant Body

In the tillering stage, Mg2+ concentrations increased non-significantly in the leaves but decreased in the roots of the three cultivars under 12 dS/m salinity. However, 12 dS/m salinity did not cause a significant difference in the overall accumulation of Mg2+ in different parts of the plants of the three rice cultivars, except the stems of Koshihikari, which showed a significant reduction in the accumulation of Mg2+ compared with 6 dS/m salinity (p = 0.0024) (Figure 5).
In the reproductive stage, the leaves of Pokkali contained 2.737 g/kg of Mg2+ under control irrigation, whereas the leaves of Koshihikari and Nikomaru had 1.862 and 0.867 g/kg of Mg2+, respectively. Moreover, these concentrations increased significantly under 6 dS/m salinity, and the amounts were 4.843 (p = 0.0013), 2.647 (p = 0.0108), and 1.967 g/kg (p = 0.0001) in the leaves of Pokkali, Koshihikari, and Nikomaru, respectively. The upper and lower stems of the three cultivars showed a non-significant difference between control and 6 dS/m salinity. Additionally, the roots of Pokkali and Koshihikari and the grains of Nikomaru did not exhibit any significant difference between control and saline treatment. The accumulation of Mg2+ in the grains of Pokkali (p = 0.0007) and in the roots of Nikomaru (p = 0.0203) increased significantly under 6 dS/m salinity, whereas it was significantly reduced in the grains of Koshihikari (p = 0.0001) (Figure 5).

3.6. Effects of Saline Irrigation on the Na+/K+ Ratio in Different Parts of the Rice Plant Body

In the tillering stage, the lowest Na+/K+ in the leaves was found in Nikomaru (0.281) under 6 dS/m salinity, closely followed by Pokkali (0.297), whereas the leaves of Koshihikari showed a slightly higher Na+/K+ (0.530). However, it was also observed that in Pokkali, the highest Na+/K+ was measured in the roots under 6 dS/m salinity. On the other hand, in Koshihikari and Nikomaru, the higher ratios were found in the whole stems and lower stems, respectively. Under 6 dS/m salinity, Nikomaru stored Na+ mostly in the lower stems, which resulted in a higher Na+/K+ in the lower stems and prevented the upward flow of Na+ towards the leaves to maintain a lower Na+/K+ in the leaves. Under 12 dS/m salinity, Pokkali had a lower Na+/K+ in the leaves and higher Na+/K+ in the roots. In contrast, Nikomaru and Koshihikari did not have a lower Na+/K+ in the leaves (Table 1). In addition, the plant height of Koshihikari was severely reduced due to higher salinity; consequently, its whole stem was considered for AAS analysis without dividing into upper and lower parts. These results revealed that Koshihikari and Nikomaru were both sensitive to 12 dS/m salinity in the tillering stage. In the reproductive stage, Na+/K+ increased in most parts of the plants of the three rice cultivars under 6 dS/m salinity compared with control. In all three cultivars, the highest Na+/K+ was found in the roots and the ratios were 8.210, 11.760, and 14.102 in Pokkali, Nikomaru, and Koshihikari, respectively. In the leaves, the lowest ratio was observed in Pokkali (0.518) under 6 dS/m salinity, followed by the leaves of Nikomaru (1.200). On the other hand, the leaves of Koshihikari showed a slightly larger ratio (1.814) under 6 dS/m salinity (Table 2).

4. Discussion

Growth response to salinity is often regarded as a useful basis for evaluation of resistance, and it has been reported that salt-tolerant cultivars have a smaller reduction in dry matter compared with salt-susceptible cultivars [22,23]. In this study, when salinity was 12 dS/m in the tillering stage, salinity-tolerant Pokkali showed a smaller decrease (18.2%) in total dry mass than Nikomaru (56.0%) and Koshihikari (63.2%) compared with the plants under 6 dS/m salinity. In the reproductive stage, when salinity was 6 dS/m, Nikomaru had a 34.5% increase in total plant dry mass compared with the control plants, whereas Koshihikari and Pokkali showed 9.8 and 10.8% decreases, respectively. The average grain yield of Pokkali is very low compared with high yielding varieties [24]; similarly, we observed lower grain dry mass in Pokkali. Nikomaru grain dry mass (21.25 g/plant) was slightly lower than Koshihikari (23.36 g/plant) under the control condition, but the opposite result was observed under 6 dS/m salinity (Nikomaru = 38.15 g/plant and Koshihikari = 14.96 g/plant). Additionally, the saline-treated Nikomaru plants matured earlier than the control plants of Nikomaru. Faster growth under salinity is an indicator of the extent of salt tolerance of a cultivar because the toxic effects are reduced through dilution of the toxic ions. Thus, this faster growth might help to alleviate salinity stress and obtain regular growth, which might result in higher yield and dry mass [21].
As a salinity defense mechanism, plants need to protect leaf cells from higher accumulation of Na+ as much as possible, and usually the salt-tolerant cultivars have a significantly lower concentration of Na+ in their leaves than salt-sensitive cultivars [25]. In the tillering stage, accumulation of Na+ increased significantly in the leaves of Koshihikari and Nikomaru, whereas the leaves of Pokkali showed no significant difference between the two saline treatments. Moreover, different parts of Pokkali exhibited non-significant differences between the two saline treatments, whereas the upper stems and roots of Nikomaru showed a significant increase in Na+ accumulation under 12 dS/m salinity compared with 6 dS/m salinity. Meanwhile, the roots and whole stems of Koshihikari revealed a non-significant difference in accumulation of Na+. In the reproductive stage, all parts of the three cultivars showed a significant increase in accumulation of Na+ under 6 dS/m salinity compared with control. In the leaves, Pokkali had a relatively lower accumulation of Na+, whereas the two japonica cultivars showed a relatively higher accumulation. The salt-tolerant plants usually accumulate Na+ in the root zone and also prevent Na+ from entering the plant body. Salt exclusion, which has been identified as a major trait associated with salt tolerance in rice, also functions to reduce the rate at which salt accumulates in the roots and transpiring organs [3,5,26]. It has also been reported that with excessive amounts of Na+, plants sometimes compartmentalize Na+ in the stem [20].
Na+ and K+ are both positively charged ions and both compete in using the same channels to enter the cells. Na+ has a strong inhibitory effect on K+ uptake by cells, probably by inhibiting K+ transporters. Additionally, membrane depolarization caused by large cytosolic Na+ influx results in increased K+ efflux through depolarization-activated outward-rectifying K+ channels [14,15]. According to Hakim et al. [27], K+ ions decreased more in the roots than the shoots under salinity stress. Similarly, the concentrations of K+ in the roots of the three cultivars in this study decreased significantly in the tillering stage under 12 dS/m salinity compared with 6 dS/m salinity. Meanwhile, a significant decrease was found in stored K+ in the whole stems of Koshihikari under 12 dS/m salinity compared with 6 dS/m salinity. On the other hand, the lower stems of Nikomaru stored a higher amount of K+ under 12 dS/m salinity than 6 dS/m salinity. In the reproductive stage, the roots of the three cultivars showed lower concentrations of K+ under 6 dS/m salinity than the control plants. In Pokkali, the concentrations of K+ in the leaves and upper stems increased significantly under 6 dS/m salinity compared with control. Additionally, K+ increased significantly in the leaves of Nikomaru, whereas Koshihikari exhibited a non-significant difference between the two treatments in the accumulation of K+ in the leaves. However, significant decreases were observed in the upper stems and roots of Koshihikari under 6 dS/m salinity compared with control. Salt-tolerant plants usually accumulate low Na+ and high K+ as opposed to salt-sensitive plants, through selective uptake mechanisms [3,28]. As part of a shielding mechanism against salinity stress, Pokkali and Nikomaru plants increased the accumulation of K+ ions under salinity stress more than under the control condition.
One of the primary effects of salinity is a disruption of membrane integrity caused by displacement of Ca2+ from the cell surface by Na+ [17]. The Ca2+ concentration of plants under salinity stress must be high to maintain plant growth [16]. In the tillering stage, the accumulation of Ca2+ increased significantly in the leaves of Nikomaru but decreased in its lower stems and roots under 12 dS/m salinity compared with 6 dS/m salinity. Meanwhile, Pokkali and Koshihikari showed a non-significant difference in the accumulation of Ca2+ in their different parts. In the reproductive stage, the concentrations of Ca2+ in the leaves of the three cultivars, and the upper stems of Pokkali and Nikomaru increased significantly under 6 dS/m salinity compared with control. Furthermore, significantly larger concentrations of Ca2+ were found in the grains of Pokkali and the lower stems of Koshihikari and Nikomaru under 6 dS/m salinity compared with control. Our findings for the leaves and roots in the reproductive stage were similar to those of Hakim et al. [27] in that Ca2+ accumulation varied significantly among different treatments, but all cultivars showed a similar response in the accumulation of Ca2+ in the shoots and roots to the respective salinity levels. However, the opposite results were observed in the tillering stage for the leaves, lower stems and roots of Nikomaru.
Mg2+ concentration in plants increases in parallel with increased salinity stress [18,29,30]. In contrast, Mg2+ concentration decreases in the shoots and roots with increasing salinity levels and also varies in the roots and shoots depending on cultivars and salinity [27]. In this experiment, when the salinity level was 12 dS/m in the tillering stage, Mg2+ concentrations increased in the leaves but decreased in the roots of the three cultivars compared with 6 dS/m salinity. However, salinity did not cause much difference in the overall accumulation of Mg2+ in the whole plant body of the three rice cultivars. During the reproductive stage, average concentrations of Mg2+ in the whole plant body were higher in the three rice cultivars under 6 dS/m salinity compared with their control plants. This result was dissimilar to the findings of other researchers [31,32,33,34]. The contradictory result of the present study necessitates further research to determine the actual mechanism behind this result.
It has been shown that cultivars having lower Na+/K+ in the leaves, greater K ion flux, and growth under saline conditions could lead to increased chance for survival [35]. Additionally, a physiological approach based on the mechanisms of salt tolerance by using physiological traits to select cultivars with low sodium uptake or with high selectivity for K over Na have successfully contributed to selecting for salt tolerance [36]. In the tillering stage, the lowest Na+/K+ in leaves was found in Nikomaru under 6 dS/m salinity, closely followed by Pokkali, whereas the leaves of Koshihikari showed a slightly higher Na+/K+. However, the highest Na+/K+ ratio was measured in the roots of Pokkali under 6 dS/m salinity. Another study found that Na+/K+ ratio increases markedly in roots under salt stress [37]. Under 12 dS/m salinity, Pokkali had a lower Na+/K+ in the leaves and a higher Na+/K+ in the roots. Under 6 dS/m salinity, Nikomaru stored Na+ mostly in lower stems, which caused a higher Na+/K+ in the lower stems and prevented the upward flow of Na+ towards the leaves to maintain a lower Na+/K+ in the leaves. It was reported that with an excessive amount of Na+, plants sometimes compartmentalize Na+ in the stems [38]. Under 12 dS/m salinity, Nikomaru and Koshihikari did not have a lower Na+/K+ in the leaves. In addition, the plant height of Koshihikari was severely reduced due to higher salinity; consequently, its whole stem was considered for AAS analysis without dividing into upper and lower parts. These results revealed that Koshihikari and Nikomaru were both sensitive to 12 dS/m salinity in the tillering stage. In the reproductive stage, Na+/K+ increased in most parts of the plants of the three rice cultivars under 6 dS/m salinity compared with control, and high Na+/K+ was mostly found in the roots of the three cultivars. On the other hand, the grain yield of Nikomaru was larger under 6 dS/m salinity compared with control, and the 6 dS/m salinity-treated plants of Nikomaru showed earlier maturity than its control plants. Because faster growth might help to alleviate salinity stress and obtain regular growth, which might result in higher yield and dry mass [24], the above results for Nikomaru indicate salinity tolerance under 6 dS/m salinity.

5. Conclusions

This study helped to show the salinity tolerance level of two high-yielding japonica rice cultivars (Koshihikari and Nikomaru) compared with a salt-tolerant indica rice cultivar (Pokkali). In the tillering stage, Nikomaru showed better tolerance than Koshihikari through the compartmentation of Na+ mostly in the lower part and prevented its upward flow towards the leaves under 6 dS/m salinity. However, the japonica cultivars were very sensitive to 12 dS/m salinity compared with Pokkali. In the reproductive stage, both japonica cultivars showed more or less the same amount of accumulation of ions under 6 dS/m salinity, but the grain yield and total dry mass of Nikomaru were much better than Koshihikari. Even the salinity-treated Nikomaru plants showed faster growth and maturity than its control plants. To conclude, Nikomaru was relatively more tolerant than Koshihikari under 6 dS/m salinity in the tillering and reproductive stages, whereas both failed to withstand 12 dS/m salinity. Moreover, further experiments with a well-focused approach combining the molecular, physiological, biochemical, and metabolic aspects of salt tolerance are essential to improve the present high-yielding japonica rice cultivars and develop them as salt-tolerant cultivars.

Author Contributions

Conceptualization, M.A. and H.O.; Data curation, M.A.; Formal analysis, M.A.; Funding acquisition, H.O.; Investigation, M.A.; Methodology, M.A. and H.O.; Resources, H.O.; Software, M.A.; Supervision, H.O.; Visualization, M.A.; Writing—original draft, M.A.; Writing—review and editing, H.O.

Funding

This research received no external funding.

Acknowledgments

Our sincere thanks to Hideto Ueno in the Soil Science and Plant Nutrition Laboratory and Takuya Araki in the Crop Science Laboratory, Graduate School of Agriculture, Ehime University for their kind support during the glass house and laboratory research. We are also grateful to Dennis Murphy in the United Graduate School of Agricultural Sciences, Ehime University for his kind help to edit the English language of the manuscript.

Conflicts of Interest

We declare no potential conflict of interest for this research.

References

  1. Karki, S.; Rizal, G.; Quick, W.P. Improvement of photosynthesis in rice (Oryza sativa L.) by inserting the C4 pathway. Rice 2013, 6, 28. [Google Scholar] [CrossRef] [PubMed]
  2. FAO. FAO’s Director-General on how to feed the World in 2050. Popul. Dev. Rev. 2009, 35, 837–839. [Google Scholar] [CrossRef]
  3. Ismail, A.M.; Heuer, S.; Thomson, M.J.; Wissuwa, M. Genetic and genomic approaches to develop rice germplasm for problem soils. Plant Mol. Biol. 2007, 65, 547–570. [Google Scholar] [CrossRef] [PubMed]
  4. Ismail, A.M.; Thomson, M.J.; Vergara, G.V.; Rahman, M.A.; Singh, R.K.; Gregorio, G.B.; Mackill, D.J. 12 Designing Resilient Rice Varieties for Coastal Deltas Using Modern Breeding Tools. In Tropical Deltas and Coastal Zones: Food Production, Communities and Environment at the Land-Water Interface; CABI: Wallingford, UK, 2010; pp. 154–165. [Google Scholar]
  5. Munns, R.; Tester, M. Mechanisms of salinity tolerance. Annu. Rev. Plant Biol. 2008, 59, 651–681. [Google Scholar] [CrossRef] [PubMed]
  6. Singh, R.K.; Redoña, E.; Refuerzo, L. Varietal improvement for abiotic stress tolerance in crop plants: Special reference to salinity in rice. In Abiotic Stress Adaptation in Plants; Springer: Dordrecht, The Netherlands, 2009; pp. 387–415. [Google Scholar]
  7. Munns, R. Comparative physiology of salt and water stress. Plant Cell Environ. 2002, 25, 239–250. [Google Scholar] [CrossRef] [PubMed] [Green Version]
  8. Moradi, F.; Ismail, A.M. Responses of photosynthesis, chlorophyll fluorescence and ROS-scavenging systems to salt stress during seedling and reproductive stages in rice. Ann. Bot. 2007, 99, 1161–1173. [Google Scholar] [CrossRef] [PubMed]
  9. Munns, R.; James, R.A.; Läuchli, A. Approaches to increasing the salt tolerance of wheat and other cereals. J. Exp. Bot. 2006, 57, 1025–1043. [Google Scholar] [CrossRef] [PubMed] [Green Version]
  10. Zeng, L. Response and correlated response to salt tolerance selection in rice by yield parameters. Cereal Res. Commun. 2004, 32, 477–484. [Google Scholar]
  11. Walia, H.; Wilson, C.; Condamine, P.; Liu, X.; Ismail, A.M.; Zeng, L.; Wanamaker, S.I.; Mandal, J.; Xu, J.; Cui, X.; et al. Comparative transcriptional profiling of two contrasting rice genotypes under salinity stress during the vegetative growth stage. Plant Physiol. 2005, 139, 822–835. [Google Scholar] [CrossRef] [PubMed]
  12. Fuchs, I.; Stölzle, S.; Ivashikina, N.; Hedrich, R. Rice K+ uptake channel OsAKT1 is sensitive to salt stress. Planta 2005, 221, 212–221. [Google Scholar] [CrossRef] [PubMed]
  13. Nieves-Cordones, M.; Alemán, F.; Martínez, V.; Rubio, F. The Arabidopsis thaliana HAK5 K+ transporter is required for plant growth and K+ acquisition from low K+ solutions under saline conditions. Mol. Plant 2010, 3, 326–333. [Google Scholar] [CrossRef] [PubMed]
  14. Adams, E.; Shin, R. Transport, signaling, and homeostasis of potassium and sodium in plants. J. Integr. Plant Biol. 2014, 56, 231–249. [Google Scholar] [CrossRef] [PubMed] [Green Version]
  15. Sun, J.; Dai, S.; Wang, R.; Chen, S.; Li, N.; Zhou, X.; Lu, C.; Shen, X.; Zheng, X.; Hu, Z.; et al. Calcium mediates root K+/Na+ homeostasis in poplar species differing in salt tolerance. Tree Physiol. 2009, 29, 1175–1186. [Google Scholar] [CrossRef] [PubMed]
  16. Tuna, A.L.; Kaya, C.; Ashraf, M.; Altunlu, H.; Yokas, I.; Yagmur, B. The effects of calcium sulphate on growth, membrane stability and nutrient uptake of tomato plants grown under salt stress. Environ. Exp. Bot. 2007, 59, 173–178. [Google Scholar] [CrossRef]
  17. Kent, L.M.; Läuchli, A. Germination and seedling growth of cotton: Salinity-calcium interactions. Plant Cell Environ. 2006, 8, 155–159. [Google Scholar] [CrossRef]
  18. Koksal, N.; Alkan-Torun, A.; Kulahlioglu, I.; Ertargin, E.; Karalar, E. Ion uptake of marigold under saline growth conditions. SpringerPlus 2016, 5, 1–12. [Google Scholar] [CrossRef] [PubMed]
  19. Zhu, J. Plant Salt Stress; John Wiley & Sons, Ltd.: Hoboken, NJ, USA, 2007. [Google Scholar]
  20. Asch, F.; Dingkuhn, M.; Dörffling, K.; Miezan, K. Leaf K/Na ratio predicts salinity induced yield loss in irrigated rice. Euphytica 2000, 113, 109–118. [Google Scholar] [CrossRef]
  21. Yeo, A.R.; Yeo, M.E.; Flowers, S.A.; Flowers, T.J. Screening of rice (Oryza sativa L.) genotypes for physiological characters contributing to salinity resistance, and their relationship to overall performance. Theor. Appl. Genet. 1990, 79, 377–384. [Google Scholar] [CrossRef] [PubMed]
  22. Weimberg, R.; Shannon, M.C. Vigor and salt tolerance in 3 lines of tall wheatgrass. Physiol. Plant 1988, 73, 232–237. [Google Scholar] [CrossRef]
  23. Asch, F.; Dingkuhn, M.; Dorffling, K. Salinity increases CO2 assimilation but reduces growth in field-grown, irrigated rice. Plant Soil 2000, 218, 1–10. [Google Scholar] [CrossRef]
  24. Chandramohanan, K.T.; Mohanan, K.V. Rice cultivation in the saline wetlands of Kerala—An overview. In Proceedings of the IInd National Seminar on Genetics, Breeding and Biotechnology (Gregor Mendel Foundation Proceedings 2011), Kerala, India, 16–17 December 2011; pp. 7–12. [Google Scholar]
  25. Rahman, M.A.; Thomson, M.J.; Shahealam, M.; De, O.M.; Egdane, J.; Ismail, A.M. Exploring novel genetic sources of salinity tolerance in rice through molecular and physiological characterization. Ann. Bot. 2016, 117, 1083–1097. [Google Scholar] [CrossRef] [PubMed] [Green Version]
  26. Rajendran, K.; Tester, M.; Roy, S.J. Quantifying the three main components of salinity tolerance in cereals. Plant Cell Environ. 2009, 32, 237–249. [Google Scholar] [CrossRef] [PubMed] [Green Version]
  27. Hakim, M.A.; Juraimi, A.S.; Hanafi, M.M.; Ismail, M.R.; Rafii, M.Y.; Islam, M.M.; Selamat, A. The effect of salinity on growth, ion accumulation and yield of rice varieties. J. Anim. Plant Sci. 2014, 24, 874–885. [Google Scholar]
  28. Platten, J.D.; Egdane, J.A.; Ismail, A.M. Salinity tolerance, Na+ exclusion and allele mining of HKT1; 5 in Oryza sativa and O. glaberrima: Many sources, many genes, one mechanism? BMC Plant Biol. 2013, 13, 32. [Google Scholar] [CrossRef] [PubMed]
  29. Valdez-Aguilar, L.A.; Grieve, C.M.; Poss, J.; Layfield, D.A. Salinity and alkaline pH in irrigation water affect marigold plants: II. Mineral ion relations. HortScience 2009, 44, 1726–1735. [Google Scholar]
  30. Carter, C.T.; Grieve, C.M.; Poss, J.A.; Suarez, D.L. Production and ion uptake of Celosia argentea, irrigated with saline wastewaters. Sci. Hortic. 2005, 106, 381–394. [Google Scholar] [CrossRef]
  31. Razzaque, M.A.; Talukder, N.M.; Islam, M.S.; Bhadra, A.K.; Dutta, R.K. The effect of salinity on morphological characteristics of seven rice (Oryza sativa) genotypes differing in salt tolerance. Pak. J. Biol. Sci. 2009, 12, 406–412. [Google Scholar] [PubMed]
  32. Momayezi, M.R.; Zaharah, A.R.; Hanafi, M.M.; Mohd Razi, I. Agronomic characteristics and proline accumulation of Iranian rice genotypes at early seedling stage under sodium salts stress. Malays. J. Soil Sci. 2009, 13, 59–75. [Google Scholar]
  33. Amirjani, M.R. Effect of salinity stress on growth, mineral composition, proline content, antioxidant enzymes of soybean. Am. J. Plant Physiol. 2010, 5, 350–360. [Google Scholar] [CrossRef]
  34. Summart, J.; Thanonkeo, P.; Panichajakul, S.; Prathepha, P.; McManus, M.T. Effect of salt stress on growth, inorganic ion and proline accumulation in Thai aromatic rice, Khao Dawk Mali 105, callus culture. Afr. J. Biotechnol. 2010, 9, 145–151. [Google Scholar]
  35. Din, J.; Khan, S.U.; Ali, I. Physiological response of wheat (Triticum aesitivum L.) varieties as influenced by salinity stress. J. Anim. Plant Sci. 2008, 18, 125–129. [Google Scholar]
  36. Shah, S.H.; Gorham, J.; Forster, B.P.; Wyn Jones, R.G. Salt tolerance in the Triticeae: The contribution of the D genome to cation selectivity in hexaploid wheat. J. Exp. Bot. 1987, 38, 254–269. [Google Scholar] [CrossRef]
  37. Taiz, L.; Zeiger, E. Plant Physiology, 4th ed.; Sinauer Associates, Inc. Publishers: Sunderland, MA, USA, 2006. [Google Scholar]
  38. Roy, S.J.; Negrão, S.; Tester, M. Salt resistant crop plants. Curr. Opin. Biotechnol. 2014, 26, 115–124. [Google Scholar] [CrossRef] [PubMed]
Figure 1. Average dry mass of different parts of the rice plant body in the tillering stage (under 6 and 12 dS/m saline irrigation) and in the reproductive stage (under control and 6 dS/m saline irrigation). Error bars represent standard errors (n = 6). Different letters on bars indicate statistical difference at p ≤ 0.05.
Agriculture 08 00164 g001
Figure 2. Average concentration of sodium ions in different parts of the rice plant body in the tillering stage (under 6 and 12 dS/m saline irrigation) and in the reproductive stage (under control and 6 dS/m saline irrigation). Error bars represent standard errors (n = 6). Different letters on bars indicate statistical difference at p ≤ 0.05.
Agriculture 08 00164 g002
Figure 3. Average concentration of potassium ions in different parts of the rice plant body in the tillering stage (under 6 and 12 dS/m saline irrigation) and in the reproductive stage (under control and 6 dS/m saline irrigation). Error bars represent standard errors (n = 6). Different letters on bars indicate statistical difference at p ≤ 0.05.
Agriculture 08 00164 g003
Figure 4. Average concentration of calcium ions in different parts of the rice plant body in the tillering stage (under 6 and 12 dS/m saline irrigation) and in the reproductive stage (under control and 6 dS/m saline irrigation). Error bars represent standard errors (n = 6). Different letters on bars indicate statistical difference at p ≤ 0.05.
Agriculture 08 00164 g004
Figure 5. Average concentration of magnesium ions in different parts of the rice plant body in the tillering stage (under 6 and 12 dS/m saline irrigation) and in the reproductive stage (under control and 6 dS/m saline irrigation). Error bars represent standard errors (n = 6). Different letters on bars indicate statistical difference at p ≤ 0.05.
Agriculture 08 00164 g005
Table 1. Na+/K+ ratio in different parts of the rice plant body under 6 and 12 dS/m saline irrigation in the tillering stage. Means ± standard error followed by the different letters in the same column are significantly different at p ≤ 0.05. * Coefficient of Variation.
CultivarType of IrrigationNa+/K+ Ratio in Different Plant Parts in the Tillering Stage
LeafUpper StemLower StemRoot
Pokkali6 dS/m0.297 ± 0.008 a0.803 ± 0.004 a1.534 ± 0.044 a1.761 ± 0.135 a
12 dS/m0.332 ± 0.025 a0.799 ± 0.002 a1.196 ± 0.012 b2.369 ± 0.260 a
p-value (0.05)0.24950.45010.00180.1060
CV *10.020.734.0817.36
Koshihikari6 dS/m0.530 ± 0.038 b1.433 ± 0.003 b1.329 ± 0.011 b
12 dS/m1.497 ± 0.008 a2.775 ± 0.029 a2.299 ± 0.112 a
p-value (0.05)0.00010.00010.0010
CV *4.691.677.62
Nikomaru6 dS/m0.281 ± 0.013 b0.519 ± 0.001 b4.488 ± 0.170 a1.143 ± 0.031 b
12 dS/m2.310 ± 0.010 a1.436 ± 0.050 a1.310 ± 0.047 b2.783 ± 0.112 a
p-value (0.05)0.00010.00010.00010.0001
CV *1.536.227.467.25
Table 2. Na+/K+ ratio in different parts of the rice plant body under control and 6 dS/m saline irrigation in the reproductive stage. Means ± standard error followed by the different letters in the same column are significantly different at p ≤ 0.05. * Coefficient of Variation.
CultivarIrrigationNa+/K+ Ratio in Different Plant Parts in the Reproductive Stage
GrainLeafUpper StemLower StemRoot
PokkaliControl0.006 ± 0.003 b0.070 ± 0.001 b0.029 ± 0.005 b0.617 ± 0.042 b1.626 ± 0.252 b
6 dS/m0.122 ± 0.017 a0.518 ± 0.033 a0.680 ± 0.050 a2.396 ± 0.314 a8.210 ± 1.250 a
p-value (0.05)0.00250.00020.00020.00500.0067
CV *32.6513.6217.3525.7731.75
KoshihikariControl0.033 ± 0.008 b0.124 ± 0.046 b0.138 ± 0.046 b0.895 ± 0.428 a1.356 ± 0.121 b
6 dS/m1.268 ± 0.238 a1.814 ± 0.040 a1.764 ± 0.437 a5.991 ± 2.051 a14.102 ± 3.287 a
p-value (0.05)0.00040.00010.02080.07180.0031
CV *63.457.7456.5574.5473.72
NikomaruControl0.069 ± 0.023 b0.181 ± 0.075 b0.206 ± 0.081 b1.773 ± 0.753 b2.158 ± 0.425 b
6 dS/m0.920 ± 0.032 a1.200 ± 0.036 a1.663 ± 0.079 a7.359 ± 0.783 a11.760 ± 0.613 a
p-value (0.05)0.00010.00030.00020.00680.0002
CV *9.7814.7714.7929.1413.13

