Article

Spinach (Spinacea oleracea L.) Response to Salinity: Nutritional Value, Physiological Parameters, Antioxidant Capacity, and Gene Expression

1
US Salinity Laboratory (USDA-ARS), Riverside, CA 92507, USA
2
Northern Great Plains Research Laboratory (USDA-ARS), Mandan, ND 58554, USA
*
Author to whom correspondence should be addressed.
Agriculture 2018, 8(10), 163; https://doi.org/10.3390/agriculture8100163
Submission received: 28 September 2018 / Revised: 11 October 2018 / Accepted: 13 October 2018 / Published: 17 October 2018
(This article belongs to the Special Issue Response and Tolerance of Agricultural Crops to Salinity Stress)

Abstract

:
Scarcity of good-quality irrigation water is a major impediment to meet food demand for a growing world population. Recycled waters may be available locally more affordably, but their higher salinity is a concern. Salinity effects on spinach mineral composition, antioxidant capacity, photosynthesis, and gene expression have not been established. Spinach cv. Raccoon was greenhouse-grown and irrigated with four levels of water salinity of electrical conductivities (ECiw) of 1.4 (control) or ranging from 3.6 to 9.4 dS m−1, combined with three levels of K (3, 5, and 7 meq L−1). Irrigation waters had 2, 20, 40, and 80 meq L−1 of NaCl. After 23 treatment days, plants significantly accumulated Na and Cl in shoots and roots with increasing salinity, regardless of the K concentration in the irrigation water. Plants exhibited no visual symptoms of salt toxicity and there were no differences in shoot growth. Plants maintained their overall concentrations of mineral nutrients, physiological parameters, and oxalic acid across salinity treatments. Leaves retained all their antioxidant capacity at 20 meq L−1 NaCl, and 74% to 66% at 40 and 80 meq L−1 NaCl, respectively. Expression analyses of ten genes, that play important role in salt tolerance, indicated that although some genes were upregulated in plants under salinity, compared to the control, there was no association between Na or K tissue concentrations and gene expression. Results clearly show that spinach maintains its growth, mineral composition, and antioxidant capacity up to ECiw = 9.4 dS m−1. As this salinity is equivalent to a soil salinity of 4.5 dS m−1, spinach can tolerate over two-fold its previously-considered salinity threshold. Thus, growers can cultivate spinach using recycled, saline, waters without detriment to shoot biomass accumulation, and nutritional value.

Graphical Abstract

1. Introduction

Commercial spinach cultivated today probably originated from Spinacia tetranda L., a wild edible green found in Nepal. In 647 AD spinach was taken from Nepal to China where it was referred to as the “Persian green.” Spinach was introduced by the Moors of North Africa to Spain in the 11th century. By the Middle Ages, spinach was grown and sold throughout the rest of Europe, and it was known in England as the “Spanish vegetable”. It was not until the 1400’s that spinach became a staple in Mediterranean cooking (https://underwoodgardens.com/history-spinach/).
According to the National Nutrient Database for Standard Reference Release of 1 April 2018 (https://ndb.nal.usda.gov/ndb/foods/show/11457?n1=%7BQv%3D1%7D&fgcd=&man=&lfacet=&count=&max=&sort=&qlookup=&offset=&format=Full&new=&measureby=&Qv=1&ds=&qt=&qp=&qa=&qn=&q=&ing=) fresh spinach is rich (per 100 mg of fresh weight, FW) in the minerals K (558 mg), Ca (99 mg) Mg (79 mg), Na (79 mg), P (49 mg), Fe (2.7 mg); and vitamins C (28 mg), betaine (102.6 mg), lutein and zeaxanthin (12.2 mg), B-carotene (5.6 mg), vitamins E (2.0 mg), A (9377 IU), and K, a.k.a. phylloquinone (483 µg), folate (194 µg), and 2.86% protein based on FW. However, due to the high concentration of oxalates and phytates in spinach leaves, only 2–5% of its Ca or P is bioavailable to humans [1,2].
Although spinach can grow in different climates and in soils of low salinity, increasing soil and/or irrigation water salinities can decrease spinach (Spinacia oleracea L.) yield [3]. As an example, 45% of farmlands (315, 655 ha) in the West San Joaquim Valley in southern California are affected with high soil salinity (ECe > 4.0 dS m−1) [4]. Although excess Na+ and Cl are known to be toxic to glycophytic (salt-sensitive) plants, some species may tolerate Na+ and Cl once adapted to a moderate saline stress. Exposure to high concentrations of NaCl may adversely affect crop performance due to salinity-induced nutritional imbalance, such as Na+ antagonism to K+ and Cl antagonism to NO3 [5]. Although some glycophytic plants of the family Chenopodiaceae [such as sugar beet (Beta vulgaris L.), and spinach] are hypothesized to utilize both Na+ and K+ for growth and development [6], this has not been explicitly proven for spinach. Other members of the Chenopodiaceae can derive benefit from Na+ even when K+ is present in sufficient concentrations in the growth medium [7,8]. These do not require K+ depletion to benefit from Na+, indicating that Na+ effects are not solely substitutive [6]. These authors also suggest that the possibility that Na+ can act as a generic, benign, osmoticum in plant vacuoles is perfectly plausible due to its similarities with K+. If this proves true, Na+ would benefit spinach growth under conditions of saline stress or K+ deficiency.
Potassium is one of the three most important mineral nutrients that plays a key role as a cofactor of several enzymes involved in physiological functions in the plant. Although N can be as (or more) important than K+ for growth, the latter can accumulate in leaves in levels two-fold higher than N. In experiments involving salinity, NaCl accumulation in plant tissues is reported to lead to a significant decrease in K+ and NO3, depending on the species and on the level of salinity used to grow the plants [5,9]. When spinach was grown with 50 and 250 mM of NaCl, approximately ECiw of 5 and 25 dS m−1, respectively, plants of the ‘Henderson’s Hybrid 102’ increased their shoot dry weight under both NaCl concentrations when KCl was applied at 0.01, 0.1, 1.0, and 10 mM [10]. However, the positive response to K+ may have been partially because these (mostly low) doses of KCl were applied instead of the 6.0 mM of KNO3 the plants received in their first two weeks. Thus, although some K+ remained in tissues after plants were switched to their salinity treatments, the low nominal concentrations of KCl may have accounted for their plants low dry weight regardless of the NaCl doses of either 50 and 250 mM. Thus, testing spinach salinity tolerance at higher salinity with sufficient doses of K+ may help verify if increasing K+ levels may indeed ameliorate salinity effects on spinach.
Although total phenolics and non-enzymatic antioxidants have been studied in response to several stresses, data available is often contrasting in its trend [11], and the roles of plant non-enzymatic antioxidants in response to salinity are not always clear [12]. Although recent experiments on Arabidopsis have shown that overaccumulation of flavonoids have led to a better drought tolerance [13], increased antioxidant capacity of alfalfa was not related to the salinity tolerance of 12 genotypes [14]. When it comes to salinity, we have found no published work on the effect of antioxidant flavonoids on the salinity tolerance of spinach. In addition, there is no published information on the effect of salinity on leaf nutritional characteristics, including antioxidant capacity. Most work on spinach has focused on cultural practices (e.g., irrigation), fertilization, cultivars, and their effect of growth, biomass accumulation [15], and the nutritional value of the crop irrigated with low-salinity water. However, there are no studies that have evaluated the effect of moderate to high-salinity irrigation waters, or the combined effects of high tissue Na+ and Cl, on the nutritional value, antioxidant capacity, and gene expression of spinach. This work aimed to evaluate the combined effect of increasing Na+ and Cl from irrigation, with three levels of K+, on the tissue NaCl accumulation, fresh shoot biomass, shoot minerals, physiological parameters, soluble oxalates, and genetic responses of spinach plants. Based on growth data previously published by colleagues from the US Salinity Laboratory [3,16], our goals were (1) to show that moderate to high tissue Na+ and Cl accumulation would not alter spinach growth and nutritional value and (2) to show that Na+ absorption by spinach would decrease when K+ was provided at levels above crop requirement (3 meq L−1).

2. Materials and Methods

The experiment, conducted in a greenhouse with spinach (Spinacea oleracea L., cv. Raccoon) between January (seeding) and March (harvest) 2017 in Riverside, CA (Lat. 33.9°58′24′′ N, Long. 117°19′12′′ E, Alt. 311 m) was arranged in a randomized design with ten salinity treatments, including control irrigation water with an electrical conductivity (ECiw) of 1.43 dS m−1. Three seeds were sown directly into six-inch diameter pots filled with three parts non-washed, non-sterile sand and one-part peat moss. After germination, plants were thinned to one plant per pot. Seeding was done on 6 January 2017, and plants grew to eight true leaves (24 February) before being submitted to salinity treatments. Greenhouse temperature was maintained at 25 °C (days)/17 °C (nights) under natural illumination. Spinach can grow in California in temperatures ranging from 5 to 30 °C, with optimal growth between 15–18 °C, and can withstand low temperatures of −9 to −6 °C [17].

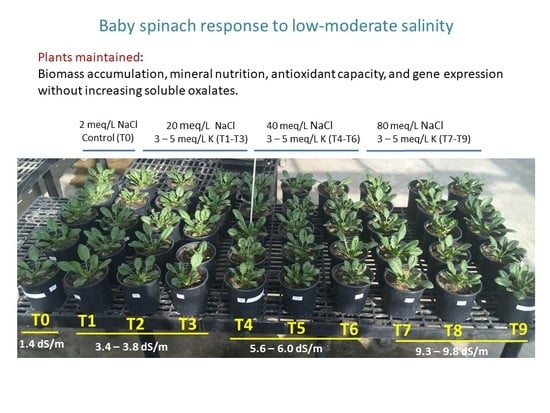
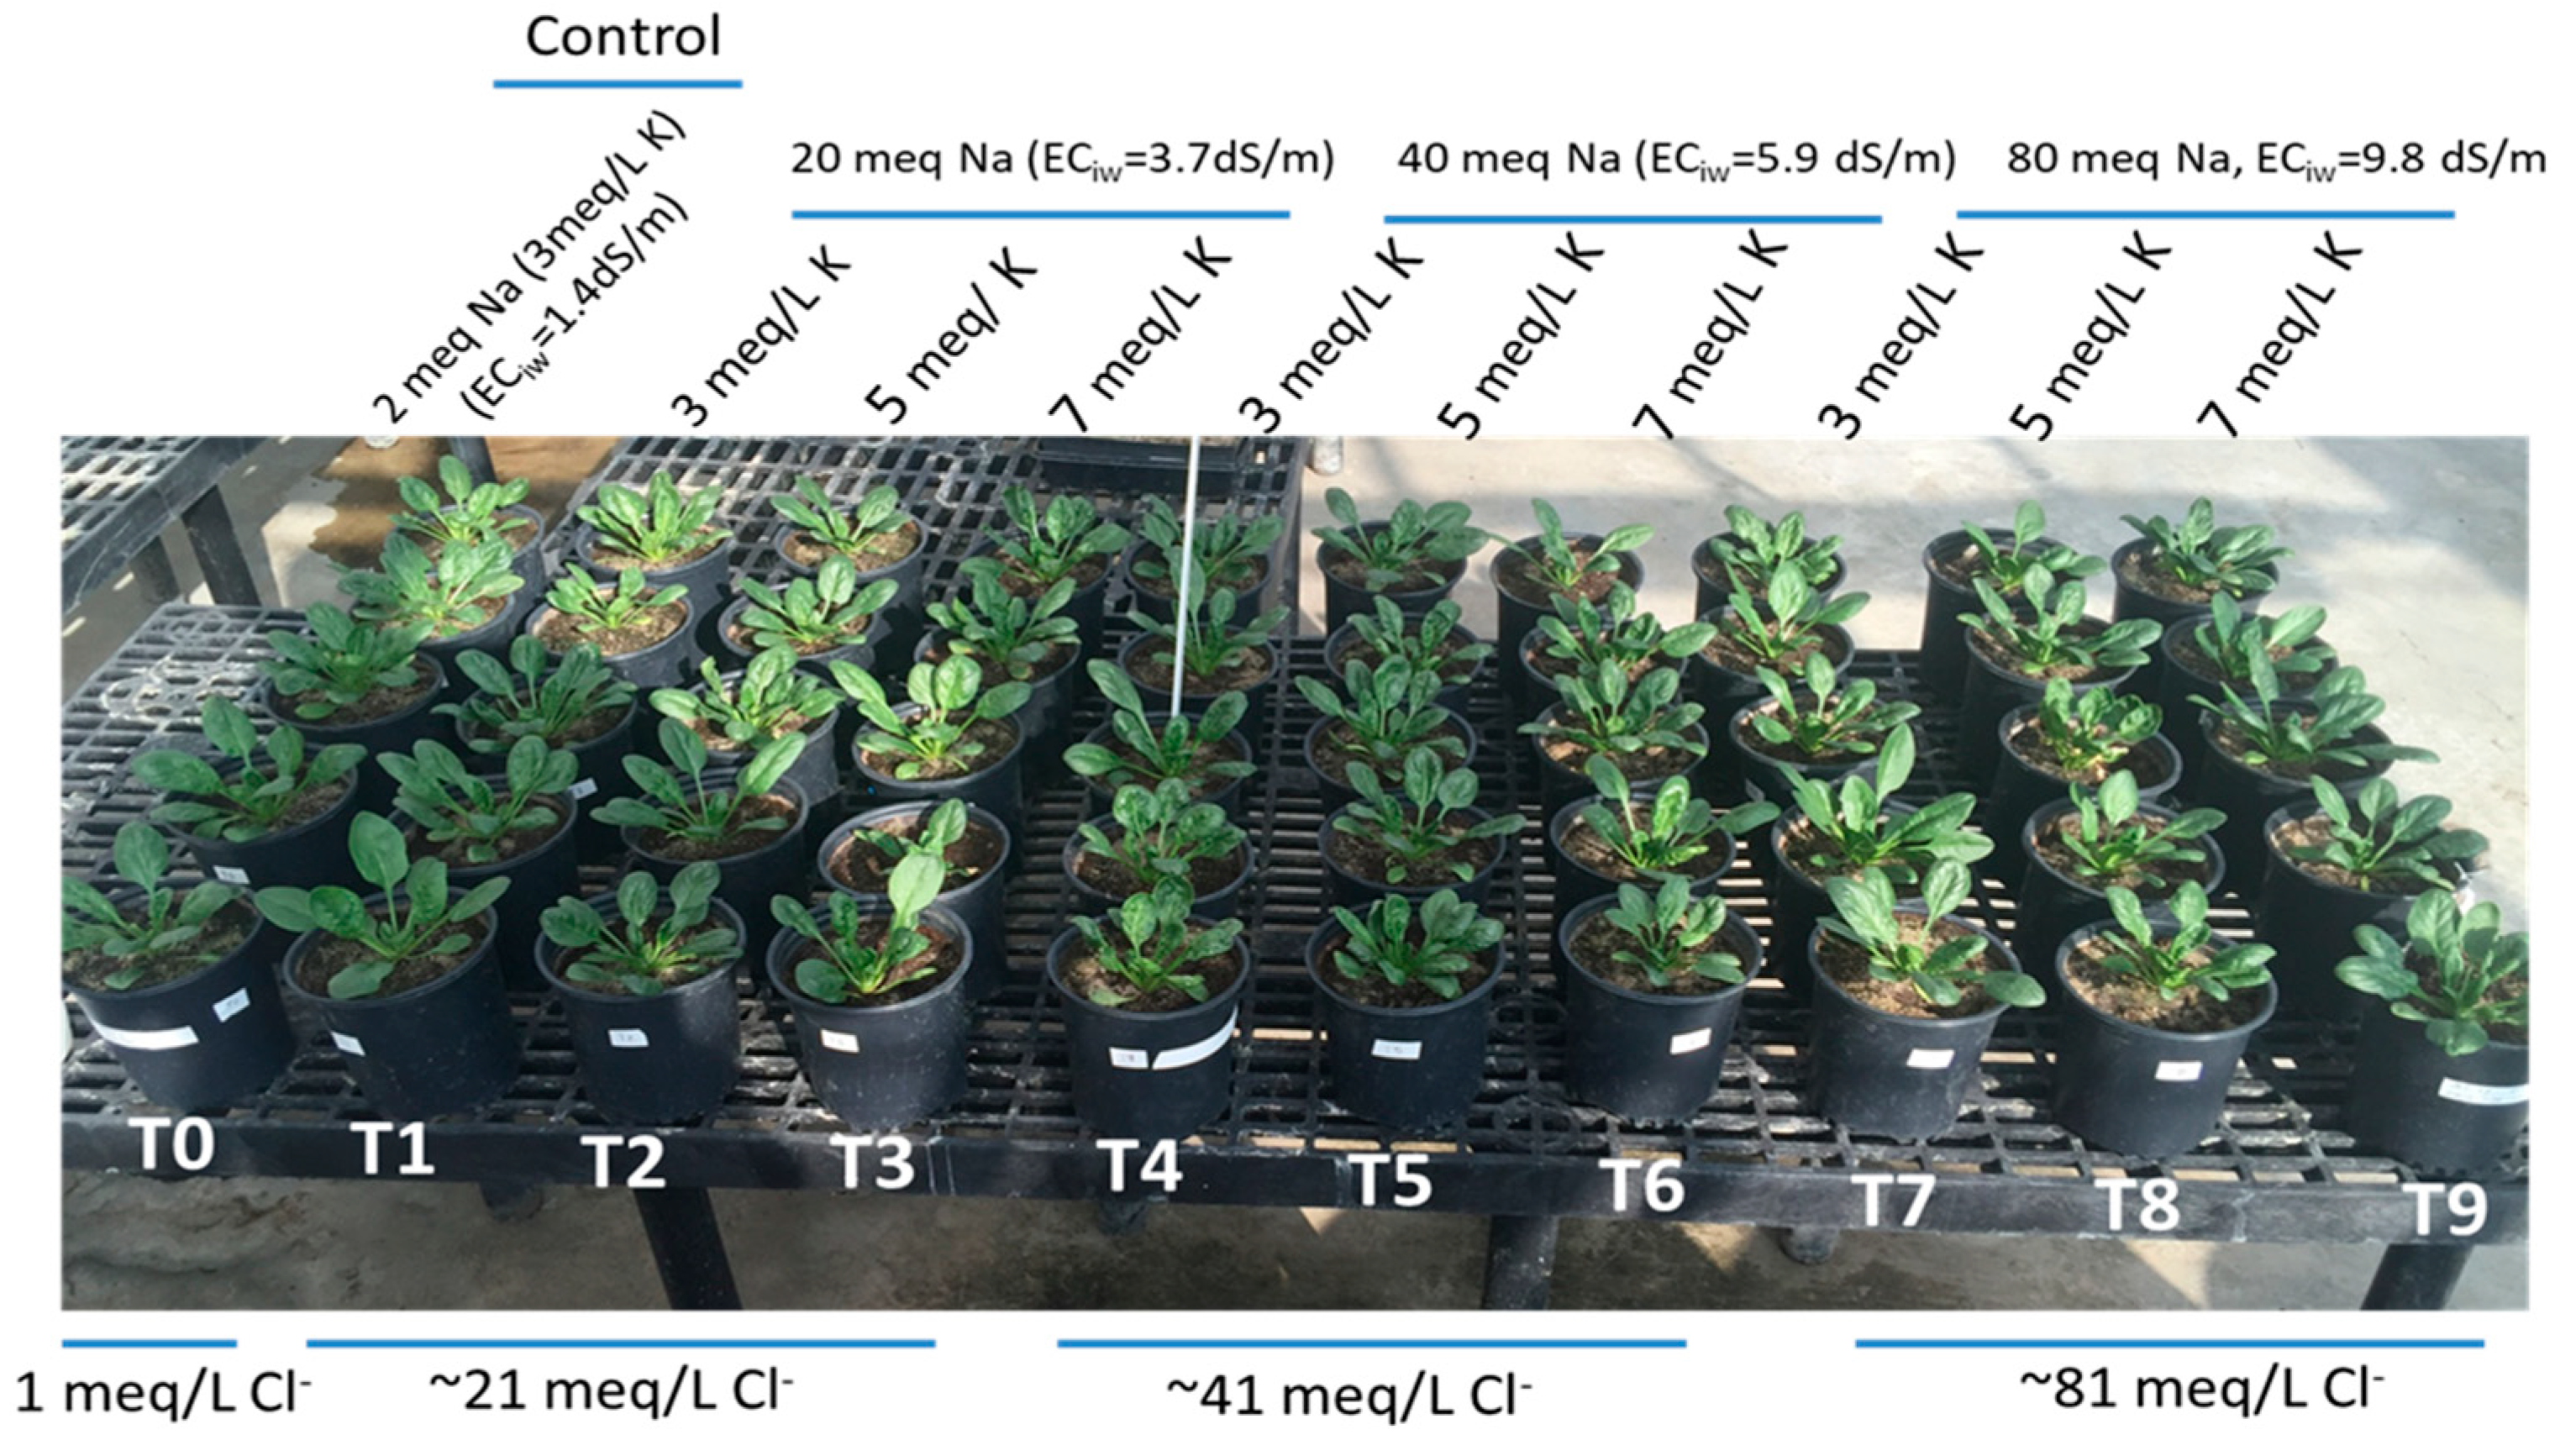
2.1. Plant Irrigation and Treatments

For the first 1.5 months (up to eight true leaves), irrigations consisted of only Riverside city water (average EC = 0.6 dS m−1 and pH = 7.5) with mineral composition presented in Table 1. Then, all pots were irrigated daily with modified half-strength Hoagland’s solution (ECiw = 1.43 dS m−1, pH = 6.8) for five days. This Hoagland’s solution contained (in mM): Ca (NO3)2 (3.5), KNO3 (3.0), KH2PO4 (0.15), MgSO4 (2.0), Fe (0.05) as sodium ferric diethylenetriamine pentaacetate (NaFe-EDTA), H3BO3 (0.023), MnSO4 (0.005), ZnSO4 (0.0004), CuSO4 (0.0002), and H3MoO4 (0.0001). This nutrient solution, without NaCl or other salts, served as the low-salinity control (ECiw = 1.43 dS m−1) and the base nutrient solution to all treatments. In addition to the control, pots (n = 5) were randomly selected to receive one of 9 other treatment solutions prepared in advance and balanced for salts as presented in Table 1. For each treatment salt concentration, we used a model developed by Suarez and Simunek [18] to predict the ion composition needed to achieve the target ECiw values, considering the complementary nature of Na+ and K+.
Irrigation with treatment solutions was initiated beginning on 29 February, after the third pair of true leaves was fully expanded and while the fourth pair was developing on all the seedlings. Salinity treatments were applied to plants at once, at their intended salinity level and thereafter irrigated every other day with 100 mL pot−1 for the first three days to maintain soil saturation; then, with 200 mL/pot to allow an approximate 10% leaching fraction. Irrigation with the different treatment solutions continued for 23 days before harvest in plants for analysis.

2.2. Plant and Soil Mineral Analysis

Plants were harvested, washed with tap water, then deionized water to remove any mineral impurities remaining from irrigation, blotted dry and separated into roots and shoots. Shoots and roots were oven dried at 65 °C for 48 h. Tissue mineral concentration was based on shoot dry weight (DW). Chloride was determined from nitric-acetic acid extracts by amperometric titration. The levels of Na+, of the macronutrients P, K, Ca, Mg, and total-S, and of the micronutrients Fe, Cu, Mn, Zn, and Mo were determined from nitric acid digestions of the dried, ground, plant material by Inductively Coupled Plasma Optical Emission Spectrometry (ICP-OES, 3300DV, Perkin-Elmer Corp., Waltham, MA, USA). Nitrogen was analyzed by combustion using an Elementar Rapid N Exceed® (https://www.elementaramericas.com/products/nproteinanalyse/rapid-n-exceed.html). After plant harvest, three samples of pot soil were taken at three cardinal points around the pot, down to 10 cm from soil surface from each pot and combined as one soil sample. Each soil sample weighed about 340 g and its saturation paste and extracts were analyzed by Inductively Coupled Plasma Optical Emission Spectrometry (ICP-OES) as described for leaves. Soil extract EC and pH were also measured.

2.3. Oxygen Radical Absorbance Capacity (ORAC), Total Phenolics and Oxalate analyses

Shoot and root material, assayed for antioxidants and total phenolics, was washed with tap water, then deionized water, blotted dry, and immediately dipped into liquid nitrogen for about 1.5 min. Frozen samples were kept at −80 °C until freeze-dried at −52 °C to −55 °C in a Freeze Dry System (FreeZone 6, Labconco, Kansas City, MO, USA) for 72 h. From each treatment, three out of five plants of each experimental plot (in three replicates) were harvested, lyophilized, and ground in a Wiley mill to pass a 40-mesh (0.635 mm) screen. Plants of each of three replicates were combined into a composite sample for the analyses of oxygen radical absorbance capacity (ORAC), total phenolics (TP), and oxalic acid analyses.
Ground shoot samples (0.5 g), in triplicates, were mixed with 5 g of sand and funneled into stainless-steel liquid extraction (PLE) cells (ASE 350, Dionex Corp., Bannockburn, IL, USA) for pressurized extraction. The ASE 350 was set for static: 5 min; flush: 100%; purge: 60 s cycle: 2; temperature: 80 °C; and 1500 psi (10,342 KPa). Samples were first extracted with hexane to obtain the lipophilic fraction; then extracted with aqueous acetone (acetone:water:acetic acid = 70:29.5:0.5) for the hydrophilic fraction. The hexane extract was blown dry using nitrogen gas in a nitrogen evaporator (N-EVAP, Organomation, ASS., Berlin, MA, USA) at 37 °C. The dry sediments were dissolved in 10 mL of pure acetone, and a 40 µL aliquot was diluted for lipophilic oxygen radical absorbance capacity (ORACLipo) analysis. The aqueous acetone extract of each sample was brought up to 25 mL using the acetone-water-acetic acid solution, of which, a 50 µL and a 40 µL aliquots, were diluted for hydrophilic ORAC analysis (ORACHydro). The ORAC assay is based upon the inhibition of the peroxyl-radical-induced oxidation initiated by thermal decomposition of azo-compounds such as [2,2′-azobis(2-amidino-propane) dihydrochloride (AAPH)] [19].
Total phenolics were assayed according to the Folin-Ciocalteu method [20,21] using gallic acid (398225, Sigma-Aldrich, St. Louis, MO, USA) as a standard. A 20-µL aliquot of the ORAC hydrophilic fraction extraction was used for total phenolic analysis. A 20 µL sample or gallic acid standard solution at each concentration was pipetted into a cell of a 96-cell microplate, followed by the addition of 100 µL of 0.4 N Folin Ciocalteu phenol reagent (stock solution, F9252, Sigma-Aldrich, St. Louis, MO, USA) and the addition of 80 µL of 0.943 M Na2CO3. The plate was covered with a sticky plastic plate cover and the color was developed in an incubator at 50 °C for 5 min. The absorbance was read at 765 nm using a microplate spectrophotometer (xMark, BIO-RAD, Hercules, CA, USA). Samples were analyzed in triplicate and their total phenol concentration was quantified against a gallic acid standard curve.
Oxalic acid was assayed according to the procedures described in the Technical Bulletin for MAK179, Sigma-Aldrich (https://www.sigmaaldrich.com/content/dam/sigma-aldrich/docs/Sigma/Bulletin/1/mak179bul.pdf). A ground sample of plant biomass (0.015 g) was transferred to a 1.5 mL microcentrifuge tube, and 1.0 mL oxalate assay buffer (MAK179, Sigma-Aldrich, St. Louis, MO, USA) was added to it. The tubes were vortexed for 15 s and set on ice for 10 min to extract soluble oxalate (Na and K oxalate) from the samples. The tubes were then centrifuged at 10,000 g for 10 min. The supernatant was diluted 5-fold, 2 µL of the diluted supernatant was used for oxalic acid enzymatic-colorimetric assay in a 96-cell microplate, according to the procedures described in the Technical Bulletin for MAK179 (link above). The plate cells were read at 450 nm using a microplate spectrophotometer (xMark, BIO-RAD, Hercules, CA, USA). Samples were analyzed in duplicates.

2.4. Leaf Photosynthetic Performance

A Li-Cor 6400 Photosynthesis System (Li-Cor, Lincoln, NE, USA) was used for the measurement of leaf gas exchange of leaf net photosynthesis (Pn), stomatal conductance (gs), and transpiration rate (Tr). All the measurements were taken on the youngest fully expanded leaves exposed to sunlight. Measurements were taken at a photosynthetic photon flux density, 1200 μmolphoton m−2 s−1 provided by a red LED light diode source emitting at 670 nm mounted on the top of leaf chamber; with an operational or chamber ambient CO2 concentration of 400 μmol CO2 mol−1; and with a leaf to air vapor pressure deficit of 0.90–2.9 kPa. Chamber air temperature during measurements fluctuated from 24–29 °C, close to the outside air temperature, due to poor control by the chamber cooling fan. Leaf water use efficiency (WUE) was calculated using formula WUE = Pn/Tr, expressed as µmol CO2 mmol−1 H2O). Licor data was taken for one leaf of each potted plant (n = 5).

2.5. Gene Expression

Ten genes known to play important role in salt tolerance were selected based on their functional characterization in Arabidopsis. The Arabidopsis gene sequences were used in Basic Local Alignment Search Tool (BLAST) analyses against the spinach genome to identify corresponding genes in spinach [22]. For each gene, the spinach gene sequence with the highest level of homology to the Arabidopsis gene was selected for analysis. quantitative Reverse Transcription-PCR (qRT-PCR) primers were designed for each gene using the NCBI Primer-BLAST program (Table S1). To avoid PCR amplification from genomic DNA, at least one of the PCR primers out of each pair was designed from two exons flanking an intron.
Leaf and root samples were collected for RNA isolation 8 days after initiating the salt treatment. Samples were frozen immediately in liquid nitrogen and RNA was isolated using TRIzol® reagent (Invitrogen, Carlsbad, CA, USA). Contaminating DNA was removed by treating RNA samples with DNase I, following manufacturer’s instructions (Thermo Scientific, Waltham, MA, USA). iTaqTM Universal SYBR® Green One-Step Kit was used to perform qRT-PCR reactions in BioRad CFX96 System (Bio-Rad Laboratories, Hercules, CA, USA). qRT-PCR reactions were carried out in 10 µL volume containing 100 ng total RNA, 0.75 µM of each of the primers, 0.125 µL iScriptTM Reverse Transcriptase and 5 µL of 2x one-step SYBR® Green Reaction mix. The alfalfa Actin (Act) and Actin depolymerization factor (Actdf) genes were used as reference genes in the expression analyses. The PCR conditions were as follows: 50 °C for 10 min, 95 °C for 1 min, then 40 cycles of 95 °C denaturation for 10 s, 57 °C annealing for 30 s, and 68 °C extension for 30 s. The relative quantity of the target gene was normalized by comparing cycle threshold values with the reference genes (ΔΔCq) to calculate expression differences [23]. The normalized expression was calculated using the following equation:
Normalized Expressionsample(GOI) = [RQsample (GOI)]/[RQsample (Ref 1) × RQsample (Ref 2) × … RQsample (Ref n)]1/n.
where GOI is gene of interest, RQ represents relative sample quantity, Ref is the reference target (gene or sequence) in a run (includes one or more reference targets in each samples), and n = number of reference targets. Amplification specificity was tested using melt curve analysis by increasing the temperature 95 °C for 10 s and back to 65 °C for 5 s followed by incremental increases of 0.5 °C/cycle up to 95 °C. A list of the primers used to evaluate gene expression is provided (Table S2).

2.6. Statistical Analysis

Main effects and interaction of salinity, Na+, and K+ on Na+ and K+ in both roots and shoots was tested using GLM procedures for split plot design in SAS (version 9.3; SAS Institute, Cary, NC, USA). Significance of specific differences were analyzed among the levels of K+ and Na+, and salinity, and among the ten levels (treatments) at each salinity and salt composition for shoots and roots separately at p ≤ 0.05 using the Bonferroni multi-comparison method in GLM procedure of SAS. Significant differences between leaf and root tissues were evaluated at p ≤ 0.05 by the t-test procedure in SAS.

3. Results

3.1. Salt Increase in Spinach Tissues and Mineral Tissue Composition

Treatments will be referred to as control (T0) or denominated as treatments T1 to T9 according to the concentration ratio of NaCl:K+ in meq L−1 used to irrigate potted plants (Figure 1, Table 1). Salinity treatments significantly increased both Na and Cl in roots and shoots of spinach. Average tissue Cl accumulation was generally 4–8 times higher than Na in roots, and 1.6–2.5 higher than Na in shoots. Spinach shoots accumulated 1.3 to 3.0 times more Na+ than roots at each increase in salinity, while Cl levels were similar for roots and shoots at each salinity increase (Table 2).
As NaCl water concentrations increased from T0 (control) to 20 meq L−1, the average pot medium (3 parts sand:1 part peat moss) accumulated 5.3-fold more Na+ and 18.7-fold more Cl in the soil saturated paste. When concentrations of NaCl doubled from 20 to 40 and from 40 to 80 meq L−1, pot medium had their concentrations of both Na+ and Cl also increased by approximately twice at each salinity increase. Both Na and Cl increased in roots and shoots with increasing salinity, regardless of K doses (Table 2).
In shoots, there were no significant changes in average macronutrients across K doses, but average K (treatments T7–T9) was significantly lower when plants were irrigated with 80 meq L−1 of NaCl (Table 2). Root average micronutrients remained stable across K doses, but Mn and Zn increased significantly at the two highest salinity treatments. In shoots, only Mn increased significantly at the highest salinity treatments (Table S1). Average concentration of mineral nutrients in shoots were: 6.3% (K), 4.3% (N), 1.2% (Mg), 0.64% (Ca), and 0.4% (P). Shoot Na concentrations ranged from 0.4 to 2.8% and shoot Cl from 1.0 to 4.5% (Table 2), while Fe ranged from 177–205 ppm (Table S1). Estimation of the leaf protein concentration using the specific N:Protein conversion factor of 4.39 established for vegetables, including spinach [24] produced a shoot protein content of 18.9%. According to these authors, the conversion factor of 4.39 accounts for non-protein N in spinach, which is 27% of the total N and is more accurate than the general conversion factor of 6.25.

3.2. Shoot Biomass, Antioxidant Capacity, and Oxalic Acid

Average shoot biomass remained constant across salinity and K levels (Table 2). Shoot average hydrophilic (ORACHydro) antioxidant capacity and total phenolics both decreased significantly as salinity increased from T0 (control) to T9, while oxalic acid levels were unaffected by the salinity levels tested (Table 3). The average spinach total antioxidant capacity (ORACHydro + ORACLipo) also decreased from 214 (T0) to 150 (T7–T9) as salinity increased. Control spinach shoots had a lipophilic antioxidant capacity of 26 meq TE g−1 DW. Total phenolics ranged from 3 to 4 mg of gallic acid equivalent per gram of dry weight (mg GAE g−1 DW). Spinach shoots ranged in their oxalic acid concentrations from 7.6 to 9.7% (w/w) (Table 3).

3.3. Leaf Photosynthetic Performance

Physiological parameters were evaluated 18 days after the plants started receiving treatments. Although there was no difference in SPAD chlorophyll levels, Photosynthetic rate (Pn), stomatal conductance (gs), and transpiration (Tr) decreased (significantly or not) in treatments that had the highest salinity (T7–T9), while water use efficiency (WUE) increased significantly with salinity (Table 4).

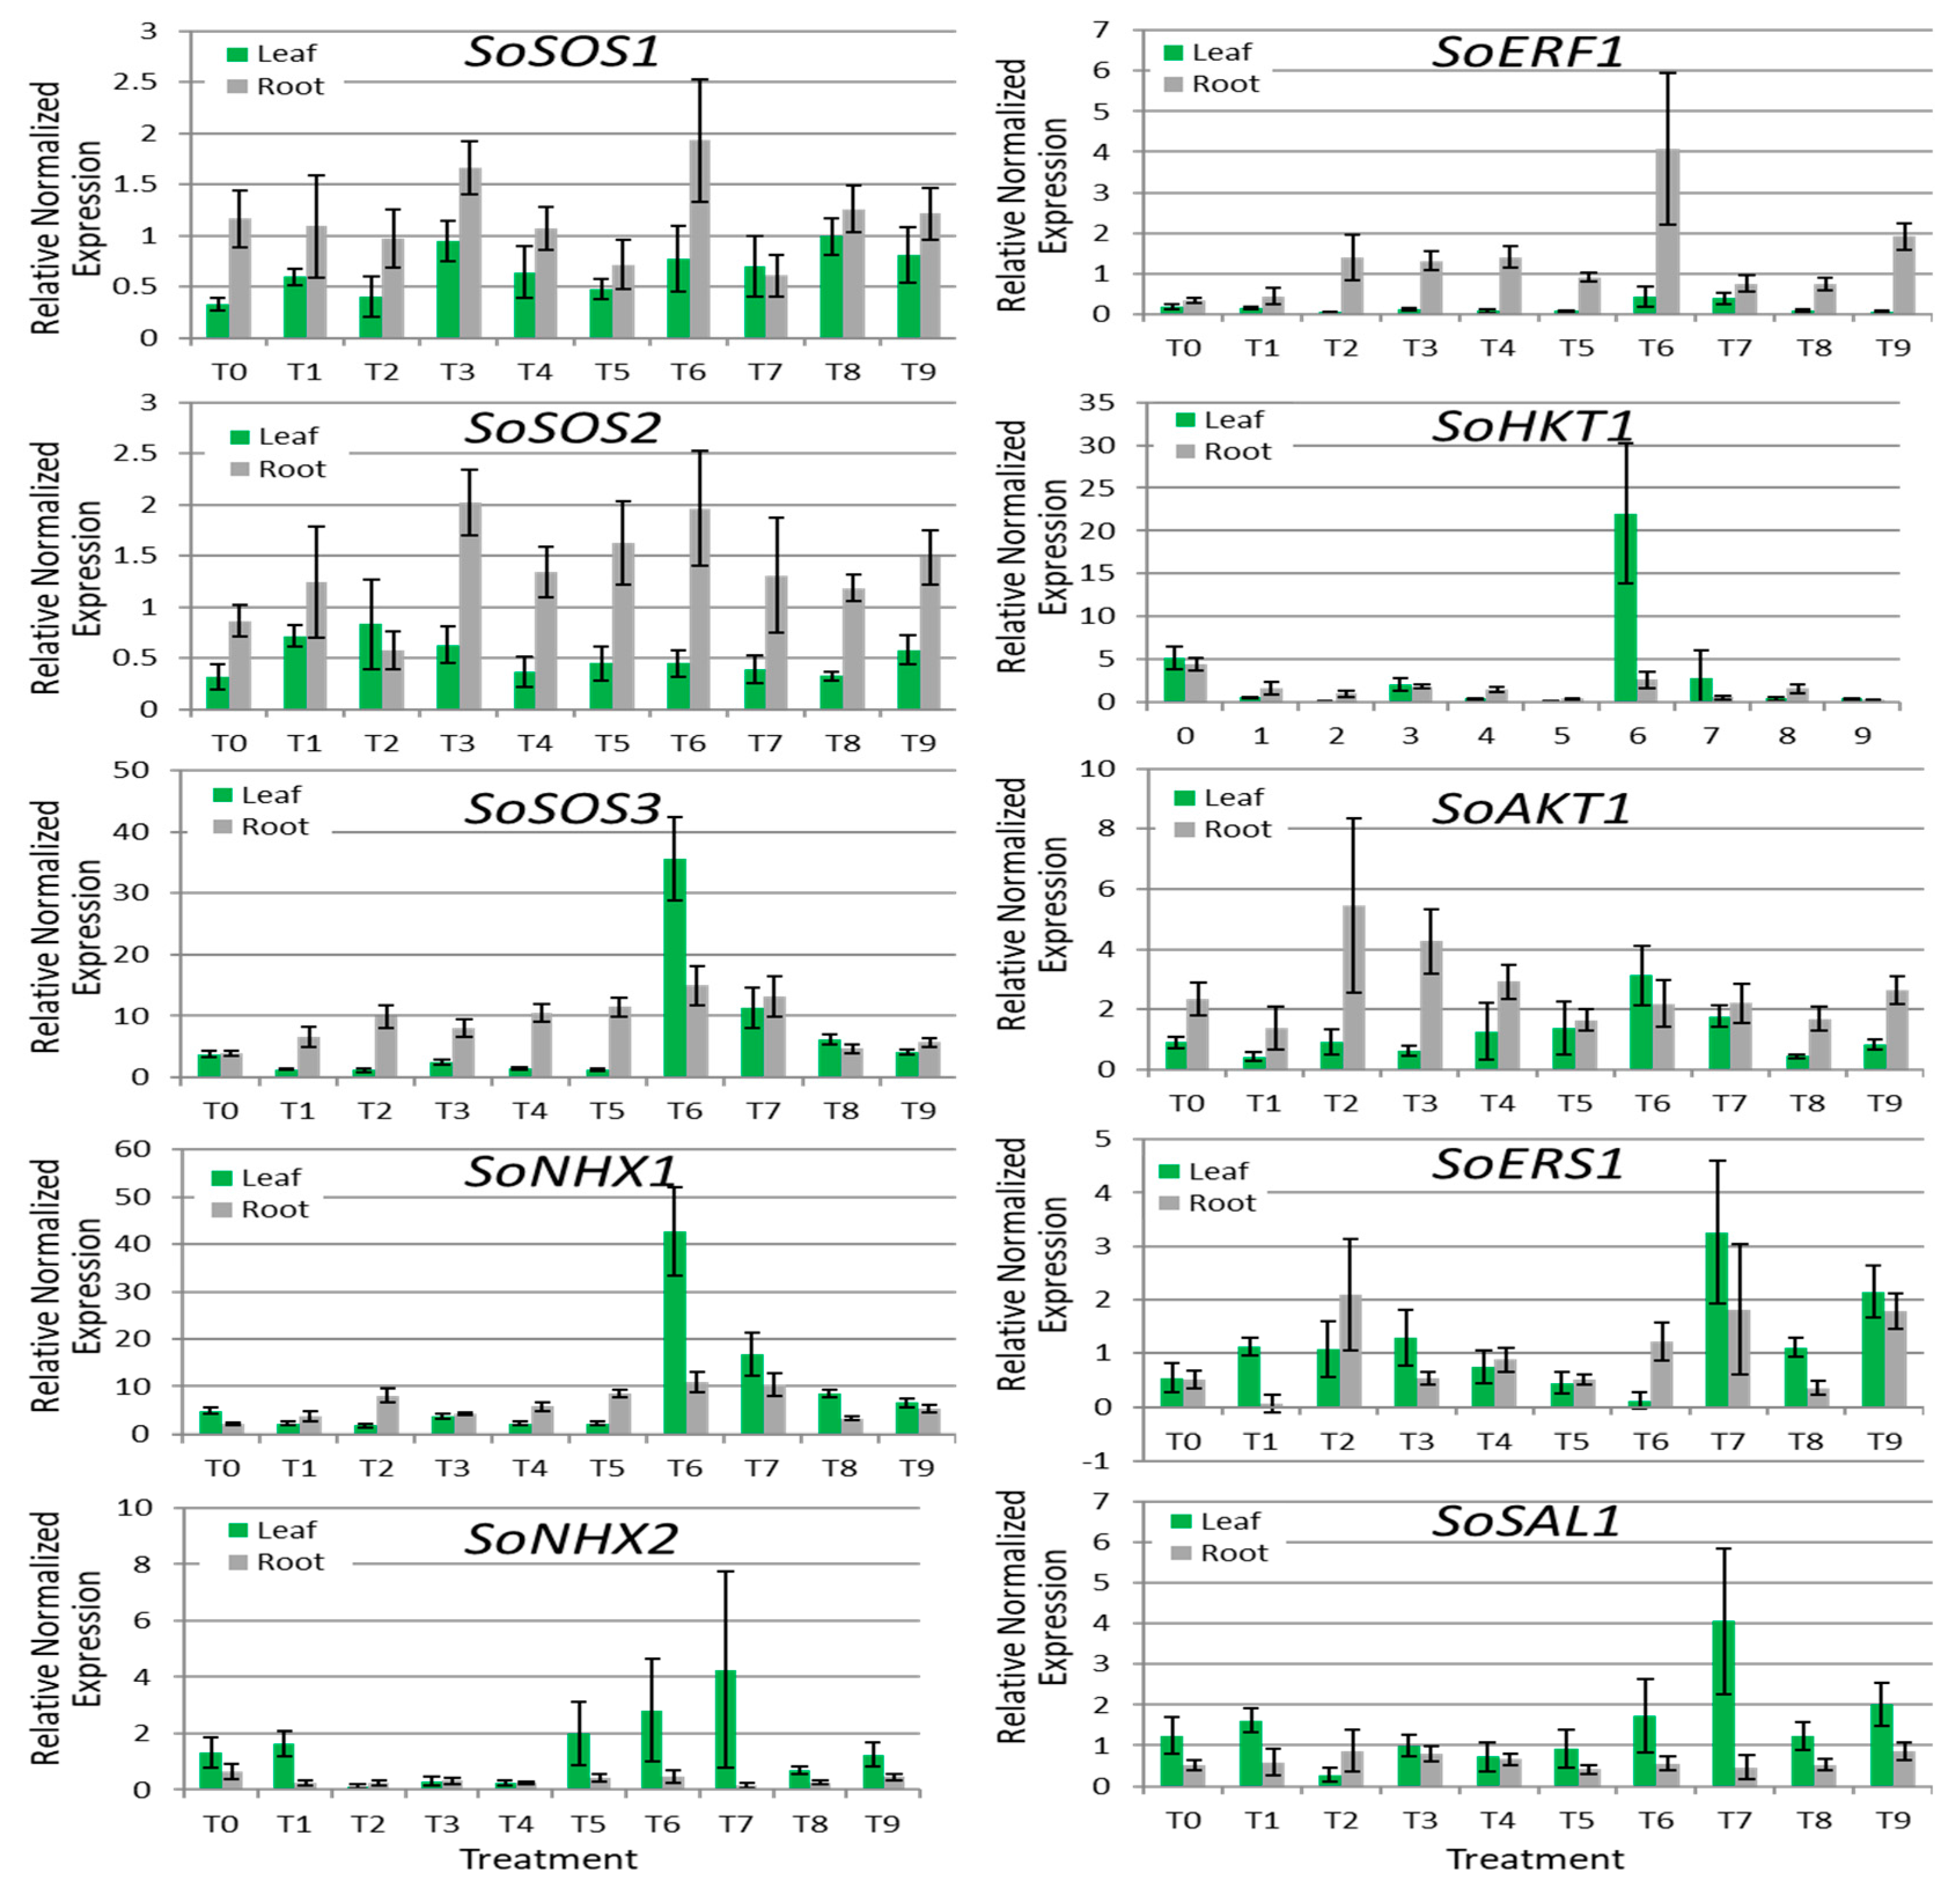
3.4. Gene Expression Analyses

A set of 10 spinach genes (SoSOS1, SoSOS2, SoSOS3, SoNHX1, SoNHX2, SoERF1, SoHKT1, SoAKT1, SoERS1 and SoSAL1), selected based on functional conservation to genes known to play important role in salt tolerance in Arabidopsis, was used to study gene expression in different salt treatments. Average relative expressions of SoSOS1 (p = 0.003), SoSOS2 (p < 0.001), SoERF1 (p = 0.008) and SoAKT1 (p = 0.006) were higher in roots as compared to leaves and expressions of SoNHX2 (p = 0.025) and SoSAL1 (p = 0.028) were higher in leaves as compared to roots (Figure 2). SoSOS3 expression in roots was significantly higher in treatments containing 40 meq L−1 Na+ (T4, P = 0.01; T5, p = 0.01; T6, p = 0.03) as compared to the control. Similarly, SoNHX1 expression in roots was significantly higher than T0 in treatments T4 (p = 0.02), T5 (p = 0.03) and T6 (p = 0.01). Among all the treatments, one with 40 meq L−1 Na+ and 7 meq L−1 K+ displayed highest level of expression for SoSOS1, SoNHX1 and SoERF1 in roots and SoSOS3 and SoNHX1 in leaves (Figure 2). In roots, SoNHX1 was upregulated in all treatments as compared to control, with highest expression at 40 meq L−1 Na+ and 7 meq L−1 K+ (Figure 2). At the highest salinity level (EC = 9.2 dS m−1) and the lowest K+ level (3 meq L−1) (T7), SoERS1 and SoSAL1 showed highest expression in leaves as compared to the other treatments. SoSOS2 expression in root was the highest for the treatment with the maximum concentration of K+ (7 meq L−1) at each salinity level. Interestingly, the relative expression patterns of SoSOS3 and SoNHX1 were extremely similar. Although there were some differences in expression in treatments as compared to the control, there was no significant correlation between different salinity levels and gene expression (Table 5).

4. Discussion

4.1. Salt Increase in Spinach Tissues and Mineral Tissue Composition

Spinach accumulated more Na in shoots than in roots, and Na tissue accumulation increased regardless of K+ concentration in irrigation waters. The increase in pot medium salinity of two-fold when water salinity went from 20 to 40 and 40 to 80 meq L−1 NaCl reflected the two-fold increase of NaCl in the saline treatment water and confirmed that plants had a homogeneous salinity at their root zone. Salinity increase from control to 20 meq L−1 NaCl resulted in 2–3 times increase in Na and Cl in both roots and shoots. This increase was also similar, but always higher for shoot Na (approximately 10 g kg−1 of Na for each increase in water salinity) than for root Na (approximately 3 g kg−1).
Literature on spinach mineral nutrients affected by abiotic stresses is scarce [25]. Although these authors did not present detailed analysis of macro and macronutrients, they reported that irrigation water with salinity of ECiw = 6.5 dS m−1 reduced spinach fresh and dry weight by 34% and 27%, respectively, for the cv. Crocodile. Other research reported that NaCl-based salinity up to a soil salinity of ECe = 11.5 dS m−1 increased the concentrations of N, P, and Zn, but decreased K [26]. While the concentrations of Na+ and Cl increased in spinach plants, when grown with irrigation waters of increasing salinity, our results show that spinach cv. Raccoon shoot concentrations of macro or micronutrients remained mostly unaffected (except potassium) by irrigation water salinity up to 80 meq L−1 of NaCl (approximately an ECiw = 9.5 dS m−1 and an estimated soil ECe = 4.3 dS m−1). The decrease in shoot K at the highest salinity treatments (T7–T9) is explained by the increase in shoot Na caused by salinity. However, tissue macro and micronutrient concentration were at sufficient levels for plant growth and development and for adequate mineral composition of shoots [27]. The concentration of N in shoots of our plants (4.3%) was very similar to values recently reported [15] for baby spinach with several rates of NPK. The protein content of baby spinach reported by these authors ranged from 24–26.5%, but would have ranged from 17.6–19.9% (similar to ours) had they used the same correction factor (4.39) for vegetables, which considers only protein N [24]. Other macronutrients, such as K, Ca, and Mg were similar to the leaf concentrations of, respectively, 70, 14, and 9 g kg−1 reported for spinach grown without saline waters [2].
Our experiment also shows clearly that 3 meq L−1 of K in the irrigation water is sufficient for plant growth and shoot mineral nutrients as K concentration in leaves ranged from 5.9 to 6.9%, which was three-fold higher than K concentration in leaves of spinach plants grown with 30 to 70% of the recommended K dose [28]. Our plants also contained 0.4% P, about the same concentration as reported for spinach plants cultivated in a sandy soil containing 0.31 meq L−1 of K, reported by these authors. Our data indicates that the irrigation water salinity used in this experiment (T1 to T9) was not high enough to affect shoot mineral nutrition of spinach

4.2. Shoot Biomass, Antioxidant Capacity, and Oxalic Acid

Although root biomass was significantly lower across salinity for the two higher K doses, this may have been caused by loss of root biomass during plant harvest, and as there was no biomass reduction for shoots (considered to develop in a close relationship with roots). The average shoot biomass accumulation in this baby spinach was fairly homogeneous reflecting the stable concentrations of macronutrients and micronutrients accumulated by the leaves, regardless of the levels of salinity and potassium doses.
Spinach antioxidants include the flavonoids kaempferol (6.5 mg kg−1 FW) and quercetin (4.0 mg kg−1 FW), according to the USDA Nutrient Database for Standard Reference of April 2018. According to this source, spinach also has 483 µg 100 g−1 FW of vitamin K (phylloquinone), a fat-soluble vitamin that helps blood clotting and is also an inti-inflammatory. Spinach also has unique antioxidant flavonoids identified as patuletin, spinacetin, and two hydroxylated glucuronides [29]. These authors reported that only the patuletin derivatives had significant antioxidant activity in vitro.
The average total antioxidant capacity (ORAChydro+lipo) of our baby spinach leaves (immature plants) ranged from 148 to 214 µmoles TE g−1, and was reduced by 31% in the highest salinity level applied to the plants, regardless of K dose (Table 3). Our results agree with those of Xu and Mou [25] who reported that salinity (ECiw = 6.5 dS m−1) did not change total phenolics, but differ as they reported that leaf antioxidants (measured by the DPPH method) significantly increased with salinity. Additionally, these authors reported that 6.5 dS m−1 reduced dry weight by 27%, indicating that their spinach cv. Crocodile was stressed by the salinity applied, while our plants of the cv Raccoon showed no decrease in shoot biomass or any visible sign of stress at ECiw = 9.8 dS m−1. Values similar to our ORAC values (ranging from 150 to 185 µmoles TE g−1) were reported for immature spinach by Pandjaitan et al. [30] who also observed that mid-mature spinach leaves had the highest antioxidant capacity (230 to 332 µmoles TE g−1) compared to either immature (top) or mature (bottom) leaves. However, their values for total phenolics (18 to 30 mg gallic acid equivalents (GAE) g−1 DW) were much higher than ours (3 to 4 mg GAE g−1 DW). This difference could be explained by the fact that their plants were field grown in the fall, while our plants were spring-grown in a greenhouse.
Environmental factors, culture conditions, harvest time, and cultivars all have been reported to influence total phenolics and antioxidant capacity of strawberries [31]. However, none of these authors have evaluated the total phenolics and antioxidant capacity of spinach under salinity. Non-enzymatic antioxidants (such as flavonoids) accumulate in plant vacuoles, just as salts do, and have been linked to mechanisms of salinity tolerance in plants. The enhancement of flavonoid biosynthesis was paralleled with increased glutathione-S-transferase, involved in the transport of flavonoids to the vacuole [32] and the increase in carbon allocated to myricetin and quercetin glycosides (both antioxidant flavonols) increased significantly in salt-sensitive Myrtus communis L. compared to salt-tolerant Pistacia lentiscus L. [33]. According to the results reported by the latter authors, our results indicate that shoot antioxidants may have been used to counteract salinity effects in ‘Raccoon’ spinach and to maintain shoot growth.
Calcium oxalate (CaOx) crystals occur in many plant species and in most organs and tissues, generally accumulating within cells, although it can happen extracellularly [34]. These authors reported that these plant crystals may accumulate to maintain ionic cell balance. Oxalate may be present as the soluble sodium or potassium salts or as the insoluble calcium oxalate. Although CaOx crystals have been studied in several plants, there is no evidence of its function in the plant other than ionic balance and protection against herbivory. Oxalate concentration varies from species to species, but a screening of the spinach germplasm determined that oxalate ranged from 5.3 to 11.6% in a dry weight basis [35], while other authors [2] reported spinach leaves to have 11.4% of soluble (Na and K oxalate) and 2.2% of insoluble oxalate (CaOx). Oxalate values in this study ranged from 7.6 to 9.7% (Table 3). Our plant samples were extracted with hot water (not acid) to extract only the soluble Na or K oxalate. Judging from previous experiments where Na accumulation caused no visual symptoms of toxicity, we hypothesize that the extra Na+ accumulating in the vacuole could have been used to make Na oxalate, also stored in cell vacuoles and the dominant form of oxalate in spinach [36]. These authors reported that oxalate accumulation was the highest in leaves > petioles > roots and ranged in leaves from 7.2 to 9.7% of DW. They also reported that soluble oxalate was lower when N and Ca2+ were available to plants, respectively, at 8 and 5 mmol L−1 and that oxalate in those plants was reduced to 9.1%. Our plants were provided similar concentrations of N and Ca2+ (7.5 N and 3.5 mmol L−1 Ca2+), but still had a total average oxalate concentration of 9.1% (Table 3). Thus, our data indicates that saline water at the range used in this experiment, and with the concentrations of N and Ca2+ used, did not increase shoot levels of oxalate in spinach and can be used to produce spinach for human consumption. However, our data also indicate that neither Na or K oxalate was involved in the salt tolerance mechanism of spinach at the salinity levels applied.

4.3. Leaf Photosynthetic Performance

Spinach plants treated with saline irrigation water maintained their SPAD chlorophyll levels, but had reduced photosynthetic rate (Pn), stomatal conductance (gs), and transpiration rate (Tr). Salinity causes stomatal closure, which in turns decreases the transpiration rate, but also decreases the internal leaf CO2 levels. This decrease in internal CO2 usually accounts for the decreased Pn seen in our spinach plants under salinity. However, the decrease in Pn was at a lower magnitude than the decrease in Tr, resulting in an increased water use efficiency (WUE) by spinach plants (Table 4). This increased WUE may explain the fact that this same cv Raccoon did better under drought conditions when irrigated with saline waters during the spring [3].
Our plants had a similar photosynthetic rate within each salinity level, indicating that K levels of 3, 5, and 7 meq L−1 were all sufficient for photosynthetic functions. In a previous study, Xu and Mou [25] found that when spinach cv. Crocodile was grown with irrigation water of ECiw = 6.5 dS m−1, its shoot dry weight was significantly reduced by 27%, but chlorophyll a content increased significantly and chlorophyll b content increased slightly, thus increasing significantly the total concentration of chlorophyll. Spinach photosynthetic capacity (µmol O2 m−2 s−1) increased in plants grown with both 50 (low salinity) and 250 mM NaCl (high salinity equivalent to ECiw = 25 dS m−1) when K was provided as 0.01, 0.1, 1.0 and 10 mM of KCl [10]. However, the photosynthetic capacity was the same, regardless of salinity, when plants were provided 10 mM KCl. This indicates that when K was deficient (doses below 10 mM KCl) there was a K effect in both salinity levels, but when K was sufficient, the effect disappeared.

4.4. Gene Expression Analyses

With the objective to determine the importance of different component traits in the salt tolerance mechanism in spinach, expression analyses of 10 spinach genes known to play important role in salt tolerance in different plant species were carried out on different salt treatments. Of these genes, SOS1, SOS2 and SOS3 are known to play important role in Na+ efflux from root to soil, NHX1 and NHX2 are critical for sequestering Na+ in the vacuole, HKT1 and AKT1 are involved in retrieving Na+ from xylem into root and ERS1 and SAL1 are involved in signal transduction [14,37]. The comparison of expression patterns of the genes studied showed no linear association with the salinity of the irrigation waters. The lack of direct relationship between gene expression and salinity may be due to insufficient salinity stress imposed by the salt treatments used in this study. This hypothesis is in line with the visual aspect, shoot biomass, and mineral tissue accumulation of the plants, which together indicate that NaCl tissue concentration were not high enough to trigger significantly different genetic expression. Additionally, the regulation of the salt tolerance mechanism may be little different in spinach as compared to Arabidopsis which may require analyses of additional genes, not included in this study. In some species such as strawberries and avocadoes, Cl toxicity is more critical than Na+ toxicity [38,39,40]. Analysis of some genes involved in Cl transport is warranted to understand the role of different players in salt tolerance in spinach.

5. Conclusions

Physiological and genetic data corroborate that, although spinach plants absorbed and accumulated increasing amounts of Na and Cl, these ions did not reach a phytotoxic level, even at 80 meq L−1, conferred by the irrigation water with an ECiw of approximately 10 dS m−1. Regarding salt tolerance mechanism in spinach, our data indicates that providing K in excess of crop requirement will not decrease shoot accumulation of Na and that increased tissue Na was neither a hindrance nor a benefit for spinach shoot growth. Also, neither sodium or potassium oxalate seem to be involved in maintaining ionic balance in shoot tissue as accumulation of shoot Na did not increase soluble oxalate concentration. Spinach maintained 70% of its total antioxidant capacity at the highest salinity level (ECiw = 9.8 dS m−1) provided in the irrigation water, and the decrease in total shoot antioxidant capacity may have accounted for sustained plant growth and good appearance of plants throughout salinity treatments. However, more work is needed to elucidate the relationship between increased Zn and Mn in roots, decreased antioxidant capacity in shoots, and sustained shoot growth in spinach plants. Although spinach shoots are a rich source of minerals, vitamins, and antioxidants, their high concentration of oxalates (7–9%) confirm previous statements that spinach is a not a good source of bioavailable calcium. Although our plants accumulated significantly more tissue Na and Cl at each increasing level of salinity, salinity did not cause any visual toxic effects in spinach shoots that could affect its commercial value. Thus, this study indicates that spinach can be successfully cultivated as a winter crop using waters with moderate salinity without altering its growth, overall shoot mineral composition (nutritional value), shoot oxalate concentrations, or most of its antioxidant capacity.

Supplementary Materials

The following are available online at https://www.mdpi.com/2077-0472/8/10/163/s1, Table S1: Micronutrient accumulation in spinach (cv. Raccoon) irrigated with waters ranging from 20–80 meq L−1 of NaCl and three potassium (K+) concentrations. Data are means (one plant per pot) with n = 2–5 for roots, and 4–5 for shoots. K+ was applied as KNO3 or KCl. Numbers within brackets were not used for statistics of average data in table. Table S2: Characterization of primers (5′–3′) used to evaluate expression analysis of target genes.

Author Contributions

Conceptualization, J.F.S.F. and D.S.; Data curation, X.L.; Formal analysis, X.L.; Investigation, J.F.S.F. and D.S.; Methodology, X.L.; Project administration, J.F.S.F. and D.S.; Software, X.L.; Visualization, J.J.H.; Writing, original draft, J.F.S.F. and D.S.; Writing, review and editing, J.F.S.F., D.S. and J.J.H.

Funding

This research was funded by the United States Department of Agriculture (USDA-ARS) as part of the internal project: CRIS 2036-13210-006-00D; Enhancing Specialty Crop Tolerance to Saline Irrigation Waters.

Acknowledgments

The authors thank Manju Pudussery to technical help and Pangki Xiong for the analyses of minerals in leaves and soil and ions in irrigation water analysis.

Conflicts of Interest

The authors declare no conflict of interest. The U.S. Department of Agriculture (USDA) prohibits discrimination in all its programs and activities on the basis of race, color, national origin, age, disability, and where applicable, sex, marital status, family status, parental status, religion, sexual orientation, genetic information, political beliefs, reprisal, or because all or part of an individual’s income is derived from any public assistance program (Not all prohibited bases apply to all programs). USDA is an equal opportunity provider and employer. Mention of commercial products and organizations in this manuscript is solely to provide specific information. It does not constitute endorsement by USDA-ARS over other products and organizations not mentioned.

References

  1. Heaney, R.P.; Weaver, C.M.; Recker, R.R. Calcium absorbability from spinach. Am. J. Clin. Nutr. 1988, 47, 707–709. [Google Scholar] [CrossRef] [PubMed]
  2. McConn, M.M.; Nakata, P.A. Oxalate reduces calcium availability in the pads of the prickly pear cactus through formation of calcium oxalate crystals. J. Agric. Food Chem. 2004, 52, 1371–1374. [Google Scholar] [CrossRef] [PubMed]
  3. Ors, S.; Suarez, D.L. Spinach biomass yield and physiological response to interactive salinity and water stress. Agric. Water Manag. 2017, 190, 31–41. [Google Scholar] [CrossRef]
  4. Scudiero, E.; Corwin, D.L.; Anderson, R.G.; Yemoto, K.; Clary, W.; Wang, Z.; Skaggs, T.H. Remote sensing is a viable tool for mapping soil salinity in agricultural lands. Calif. Agric. 2017, 71, 231–238. [Google Scholar] [CrossRef] [Green Version]
  5. Grattan, S.R.; Grieve, C.M. Salinity–mineral nutrient relations in horticultural crops. Sci. Hort. 1999, 78, 127–157. [Google Scholar] [CrossRef]
  6. Kronzucker, H.J.; Coskun, D.; Schulze, L.M.; Wong, J.R.; Britto, D.T. Sodium as nutrient and toxicant. Plant Soil 2013, 369, 1–23. [Google Scholar] [CrossRef] [Green Version]
  7. Marschner, H.; Possingham, J.V. Effect of K+ and Na+ on growth of leaf discs of sugar beet and spinach. Z. Pflanzenphysiol. 1975, 75, 6–16. [Google Scholar] [CrossRef]
  8. Subbarao, G.V.; Ito, O.; Berry, W.L.; Wheeler, R.M. Sodium—A functional plant nutrient. Crit. Rev. Plant Sci. 2003, 22, 391–416. [Google Scholar] [CrossRef]
  9. Fisarakis, I.; Chartzoulakis, K.; Stavrakas, D. Response of Sultana vines (V. vinifera L.) on six rootstocks to NaCl salinity exposure and recovery. Agric. Water Manag. 2001, 51, 13–27. [Google Scholar] [CrossRef]
  10. Chow, W.S.; Ball, M.C.; Anderson, J.M. Growth and photosynthetic responses of spinach to salinity: Implications of K+ nutrition for salt tolerance. Func. Plant Biol. 1990, 17, 563–578. [Google Scholar] [CrossRef]
  11. Alam, M.A.; Juraimi, A.S.; Rafii, M.Y.; Hamid, A.A.; Aslani, F.; Alam, M.Z. Effects of salinity and salinity-induced augmented bioactive compounds in purslane (Portulaca oleracea L.) for possible economical use. Food Chem. 2015, 169, 439–447. [Google Scholar] [CrossRef] [PubMed]
  12. Petridis, A.; Therios, I.; Samouris, G.; Tananaki, C. Salinity-induced changes in phenolic compounds in leaves and roots of four olive cultivars (Olea europaea L.) and their relationship to antioxidant activity. Environ. Exp. Bot. 2012, 79, 37–43. [Google Scholar] [CrossRef]
  13. Nakabayashi, R.; Yonekura-Sakakibara, K.; Urano, K.; Suzuki, M.; Yamada, Y.; Nishizawa, T.; Matsuda, F.; Kojima, M.; Sakakibara, H.; Shinozaki, K.; et al. Enhancement of oxidative and drought tolerance in Arabidopsis by overaccumulation of antioxidant flavonoids. Plant J. 2014, 77, 367–379. [Google Scholar] [CrossRef] [PubMed]
  14. Sandhu, D.; Cornacchione, M.V.; Ferreira, J.F.; Suarez, D.L. Variable salinity responses of 12 alfalfa genotypes and comparative expression analyses of salt-response genes. Sci. Rep. 2017, 7, 42958. [Google Scholar] [CrossRef] [PubMed] [Green Version]
  15. Nemadodzi, L.E.; Araya, H.; Nkomo, M.; Ngezimana, W.; Mudau, N.F. Nitrogen, phosphorus, and potassium effects on the physiology and biomass yield of baby spinach (Spinacia oleracea L.). J. Plant Nutr. 2017, 40, 2033–2044. [Google Scholar] [CrossRef]
  16. Ors, S.; Suarez, D.L. Salt tolerance of spinach as related to seasonal climate. Hort. Sci. (Prague) 2016, 43, 33–41. [Google Scholar] [CrossRef] [Green Version]
  17. Koike, S.T.; Cahn, M.; Cantwell, M.; Fennimore, S.; Lestrange, M.; Natwick, E.; Smith, R.F.; Takele, E. Spinach Production in California; UC Agriculture and Natural Resources: Davis, CA, USA, 2011; pp. 1–6. [Google Scholar]
  18. Simunek, J.; Suarez, D.L. Sodic soil reclamation using multicomponent transport modeling. J. Irrig. Drain. Eng. 1997, 123, 367–376. [Google Scholar] [CrossRef]
  19. Prior, R.L.; Hoang, H.; Gu, L.; Wu, X.; Bacchiocca, M.; Howard, L.; Hampsch-Woodill, M.; Huang, D.; Ou, B.; Jacob, R. Assays for hydrophilic and lipophilic antioxidant capacity [oxygen radical absorbance capacity (ORAC)] of plasma and other biological and food samples. J. Agric. Food Chem. 2003, 51, 3273–3279. [Google Scholar] [CrossRef] [PubMed]
  20. Slinkard, K.; Singleton, V.L. Total phenol analysis: Automation and comparison with manual methods. Am. J. Enol. Vitic. 1977, 28, 49–55. [Google Scholar]
  21. Singleton, V.L.; Rossi, J.A. Colorimetry of total Phenolics with phosphomolybdic-phosphotungstic acid reagents. Am. J. Enol. Vitic. 1965, 16, 144–158. [Google Scholar]
  22. Xu, C.; Jiao, C.; Sun, H.; Cai, X.; Wang, X.; Ge, C.; Zheng, Y.; Liu, W.; Sun, X.; Xu, Y.; et al. Draft genome of spinach and transcriptome diversity of 120 Spinacia accessions. Nat. Commun. 2017, 8, 15275. [Google Scholar] [CrossRef] [PubMed]
  23. Vandesompele, J.; De Preter, K.; Pattyn, F.; Poppe, B.; Van Roy, N.; De Paepe, A.; Speleman, F. Accurate normalization of real-time quantitative RT-PCR data by geometric averaging of multiple internal control genes. Genome Biol. 2002, 3, RESEARCH0034. [Google Scholar] [CrossRef] [PubMed] [Green Version]
  24. Fujihara, S.; Kasuga, A.; Aoyagi, Y. Nitrogen-to-protein conversion factors for common vegetables in Japan. J. Food Sci. 2001, 66, 412–415. [Google Scholar] [CrossRef]
  25. Xu, C.; Mou, B. Responses of spinach to salinity and nutrient deficiency in growth, physiology, and nutritional value. J. Am. Soc. Hort. Sci. 2016, 141, 12–21. [Google Scholar]
  26. Sheikhi, J.; Ronaghi, A. Growth and macro and micronutrients concentration in spinach (Spinacia oleracea L.) as influenced by salinity and nitrogen rates. Int. Res. J. Appl. Basic Sci. 2012, 3, 770–777. [Google Scholar]
  27. Gülser, F. Effects of ammonium sulphate and urea on NO3 and NO2− accumulation, nutrient contents and yield criteria in spinach. Sci. Hortic. 2005, 106, 330–340. [Google Scholar] [CrossRef]
  28. Aisha, H.A.; Hafez, M.M.; Asmaa, R.M.; Shafeek, M.R. Effect of bio and chemical fertilizers on growth, yield and chemical properties of spinach plant (Spinacia oleracea L.). Middle East J. 2013, 2, 16–20. [Google Scholar]
  29. Howard, L.R.; Pandjaitan, N.; Morelock, T.; Gil, M.I. Antioxidant capacity and phenolic content of spinach as affected by genetics and growing season. J. Agric. Food Chem. 2002, 50, 5891–5896. [Google Scholar] [CrossRef] [PubMed]
  30. Pandjaitan, N.; Howard, L.R.; Morelock, T.; Gil, M.I. Antioxidant capacity and phenolic content of spinach as affected by genetics and maturation. J. Agric. Food Chem. 2005, 53, 8618–8623. [Google Scholar] [CrossRef] [PubMed]
  31. Pincemail, J.; Kevers, C.; Tabart, J.; Defraigne, J.O.; Dommes, J. Cultivars, culture conditions, and harvest time influence phenolic and ascorbic acid contents and antioxidant capacity of strawberry (Fragaria × ananassa). J. Food Sci. 2012, 77, C205–C210. [Google Scholar] [CrossRef] [PubMed]
  32. Zhao, J.; Dixon, R.A. The ‘ins’ and ‘outs’ of flavonoid transport. Trend. Plant Sci. 2010, 15, 72–80. [Google Scholar] [CrossRef] [PubMed] [Green Version]
  33. Tattini, M.; Remorini, D.; Pinelli, P.; Agati, G.; Saracini, E.; Traversi, M.L.; Massai, R. Morpho-anatomical, physiological and biochemical adjustments in response to root zone salinity stress and high solar radiation in two Mediterranean evergreen shrubs, Myrtus communis and Pistacia lentiscus. New Phytol. 2006, 170, 779–794. [Google Scholar] [CrossRef] [PubMed]
  34. Franceschi, V.R.; Horner, H.T. Calcium oxalate crystals in plants. Bot. Rev. 1980, 46, 361–427. [Google Scholar] [CrossRef]
  35. Mou, B. Evaluation of oxalate concentration in the U.S. spinach germplasm collection. HortScience 2008, 43, 1690–1693. [Google Scholar]
  36. Zhang, Y.; Li, Y.; Wei, J.; Sun, M.; Tian, Y.; Li, Z. Effects of nitrogen and calcium nutrition on oxalate contents, forms, and distribution in spinach. J. Plant Nutr. 2009, 32, 2123–2139. [Google Scholar] [CrossRef]
  37. Munns, R.; Tester, M. Mechanisms of salinity tolerance. Annu. Rev. Plant Biol. 2008, 59, 651–681. [Google Scholar] [CrossRef] [PubMed]
  38. Li, B.; Tester, M.; Gilliham, M. Chloride on the Move. Trend. Plant Sci. 2017, 22, 236–248. [Google Scholar] [CrossRef] [PubMed]
  39. Suarez, D.L.; Grieve, C.M. Growth, yield, and ion relations of strawberry in response to irrigation with chloride-dominated waters. J. Plant Nutr. 2013, 36, 1963–1981. [Google Scholar] [CrossRef]
  40. Tregeagle, J.M.; Tisdall, J.M.; Tester, M.; Walker, R.R. Cl uptake, transport and accumulation in grapevine rootstocks of differing capacity for Cl exclusion. Funct. Plant Biol. 2010, 37, 665–673. [Google Scholar] [CrossRef]
Figure 1. Spinach plants of the cultivar Raccoon 23 days after exposure to irrigation water salinities with electrical conductivities (ECiw) ranging from 1.4 dS m−1 (2 meq L−1 NaCl) to 9.8 dS m−1 (80 meq L−1 NaCl). NO3 and SO4−2 were kept constant at 7.5 and 2.0 meq L−1, respectively, and pH = 7.3. Treatments were labeled T0 (control, 2 meq L−1 Na+, 1 meq L−1 Cl, 3 meq L−1 K+) to T9 (80 meq L−1 NaCl:7 meq L−1 K+).
Agriculture 08 00163 g001
Figure 2. Gene expression in leaves and roots of Spinacia oleracea cv Raccoon in response to salinity of irrigation water with electrical conductivities (ECiw) ranging from 1.4 dS m−1 (2 meq L−1 NaCl) to 9.8 dS m−1 (80 meq L−1 NaCl).
Agriculture 08 00163 g002
Table 1. Electrical conductivity (ECiw) of irrigation waters and chemical composition (in meq L−1) of the Riverside city water used to make the salinized water treatments T0 (control) and T1–T9 used to irrigate spinach. Average water pH was 6.8. All treatments (T0 to T9) contained ½-strength modified Hoagland’s solution as basic fertilization. The concentrations of HCO3, Na+, and Cl came from the Riverside city water. Treatments are described as low in NaCl (T0, control) or as T1–T9, according to the ratios of NaCl:K (in meq L−1) concentrations.
Treatment[Na+][Cl][K+]ECiwNO3PO4−3HCO3Ca+2Mg+2SO4−2
(meq L−1)(dS m−1)(meq L−1)
City water2120.60.380.0013.33.20.781.4
T0 + (control)2131.47.501.5003.37.02.002.0
T1201933.47.501.5003.37.02.002.0
T2202153.77.501.5003.37.02.002.0
T3202373.87.501.5003.37.02.002.0
T4403935.67.501.5003.37.02.002.0
T5404156.07.501.5003.37.02.002.0
T6404376.07.501.5003.37.02.002.0
T7807939.37.501.5003.37.02.002.0
T8808159.37.501.5003.37.02.002.0
T9808379.87.501.5003.37.02.002.0
+ T0 was composed of Riverside city water (ECiw = 0.57) enriched with ½-strength Hoagland’s salts, except for HCO3, Na+, or Cl.
Table 2. Sodium (Na), chloride (Cl), macronutrients and dry weight of spinach plants cv. Raccoon irrigated with waters of 20–80 meq L−1 of NaCl and three potassium (K) concentrations. Data are means (n = 2–5 for roots, and 4–5 for shoots). K+ was applied as KNO3 or KCl. Missing data (-) resulted from insufficient material for analysis.
Treatment[NaCl][K+]ECNaClKNCaMgSPPlant DW
(meq L−1)(dS m−1)(g kg−1 DW)(g plant−1)
Roots
T0 (control)231.42.9cγ6.9cδ41.0bα26.1aα2.9bα5.3aαβ2.0aα5.7aα0.45aαβ
T12033.44.1cA22.4bA49.9aA25.3aA2.7cA5.0aA1.7aA6.5aA0.45aA
T2 *2053.72.614.023.8-2.44.11.10.70.14
T32073.82.3bB26.2aA41.1aA-2.1aA3.5aB1.4aB4.7aB0.30bB
Avg (T1–T3)3.2γ24.3γ45.5α25.3α2.4α4.2β1.5α5.6α0.38αβ
T44035.66.9bA29.9abA46.4abA27.8aA3.2aA5.5aA1.9aA7.1aA0.35aA
T54056.06.0bA32.0aA49.1aA-2.5aA5.0aA1.8aA6.3aA0.31aA
T64076.05.6abA35.5aA51.4aA-2.2aA5.0aA1.8aA7.0aA0.29bA
Avg (T4–T6)6.2β32.5β49.0α27.8α2.6α5.2αβ1.8α6.8α0.32β
T78039.39.9aA38.5aA51.0aA29.0aA2.6cA5.9aA2.0aA7.7aA0.40aA
T88059.39.4aA38.3aA50.8aA25.12.3aA5.6aA1.9aA7.3aA0.46aA
T98079.88.4aA37.4aA51.7aA25.82.5aA5.2aA1.7aA6.2aA0.5aA
Avg (T7–T9)9.3α38.1α51.2α26.6α2.5α5.6α1.9α7.1α0.46α
Shoots
T0 (control)231.44.0dδ10.1dδ59.2aβγ40.7aα7.7aα11.8aα3.9aα3.6aβ4.7aα
T12033.411.1cA21.9cA59.9aB41.8aA6.7aAB13.3aA4.0aA3.8aA4.7aA
T2*2053.77.3-59.239.08.213.73.40.91.6
T32073.87.5cB22.8bA74.8aA43.7aA4.9aB10.4aB3.9aA4.4aA4.0aA
Avg (T1–T3)9.3γ22.4γ67.4αβ42.8α5.8α11.9α3.9α4.1αβ4.4α
T44035.619.5bA29.7bA61.5aB44.2aA5.9aA12.8aAB3.8aA4.4aA4.1aA
T54056.017.3bA31.4bA70.2aAB43.4aA6.5aA13.7aA4.3aA4.7aA4.1aA
T64076.015.3bA28.9bA78.2aA45.2aA5.8aA11.5aB4.2aA4.6aA3.7aA
Avg (T4–T6)17.4β30.0β70.0α44.3α6.1α12.7α4.1α4.6α4.0α
T78039.326.7aA39.9aA55.9aA46.1aA5.3aA12.5aA4.2aA3.9aA4.1aA
T88059.327.7aA39.5aA53.7aA46.1aA5.3aA13.8aA4.1abA4.3aA3.9aA
T98079.829.4aA54.3aA53.4bA39.8aA7.9aA11.9aA3.9aA3.3aA4.8aA
Avg (T7–T9)27.9α44.6α54.3γ44.0α6.2α12.7α4.1α3.8β4.3α
Lowercase letters show significant (p ≤ 0.05) difference among different NaCl treatments within a tissue type and at the same K level. Capital letters indicate significant (p ≤ 0.05) differences among the three K treatments within a tissue type at the same NaCl treatment level. Greek letters show significant (p ≤ 0.05) average (Avg) differences among different salinity (NaCl) treatments within a tissue type. * Treatment omitted from statistical analysis of biomass and minerals, thus no letters.
Table 3. Shoot antioxidant capacity of hydrophilic fraction measured (ORACHydro) and lipophilic fraction (ORACLipo) (measured as oxygen radical absorbance capacity) with total phenol content (TPHydro) of hydrophilic fraction, and oxalic acid concentration (Oxal) of spinach plants (Spinacia oleracea L., cv. Raccoon) irrigated with saline waters of three NaCl concentrations in respect to three KCl concentrations. Data are means with sample size (pot, one plant per pot) n = 4–5. TE: trolox equivalent, GAE: gallic acid equivalent. Na+ was applied as NaCl and K+ was applied as KNO3 or KCl.
Treatment[NaCl][K+]ECORACHydroORACLipoTPHydroOxalate
(meq L−1)(dS m−1)(µmol TE g−1 DW)(mg GAE g−1 DW)(mg g−1 DW)
T0 (control)231.4188.1aα26.2aαβ4.0aα76.1aα
T12033.4171.2aA34.6aA3.6abA95.2aA
T22053.7234.0aA13.6bB4.9aA76.5aA
T32073.8144.9aA32.8aAB3.8aA80.7aA
Avg (T1–T3)158.0αβ33.7αβ3.7αβ88.0α
T44035.6135.9aA36.6aA3.3bA93.4aA
T54056.0165.5aA33.3aA3.4aA95.8aA
T64076.0113.3aA34.6aA3.0aA103.0aA
Avg (T4–T6)138.2αβ34.8α3.2β97.4α
T78039.3129.9aA26.7aA3.3bA92.4aA
T88059.3108.6aA23.5abA3.0aA98.8aA
T98079.8131.9aA22.6aA3.2aA84.2aA
Avg (T7–T9)123.5β24.3β3.2β91.8α
Lowercase letters show significant (p ≤ 0.05) difference among different Na treatments within shoots at the same K level. Capital letters indicate significant (p ≤ 0.05) difference among the three K treatments at the same NaCl treatment level. Greek letters show significant (p ≤ 0.05) average (Avg) difference among different NaCl treatments, across potassium doses.
Table 4. Leaf SPAD chlorophyll readings, net photosynthetic rate (Pn, µmol CO2 m−2 s−1), stomatal conductance (gs, mol H2O m−2 s−1), transpiration rate (Tr, mmol H2O m−2 s−1), and water use efficiency (WUE, µmol CO2 mmol−1 H2O) of spinach plants (Spinacea oleracea, cv. Raccoon) irrigated with saline waters of three NaCl concentrations in respect to three KCl concentrations. Data are means of one leaf per plant, per pot (n = 5) or averages (Avg) of three K+ doses (n = 15) within the same NaCl dose.
TreatmentNaClK+ECiwSPADPngsTrWUE
(meq L−1)(dS m−1)(µmol CO2 m−2 s−1)(mol H2O m−2 s−1)(mmol H2O m−2 s−1)(µmol CO2 mmol−1 H2O)
19 days after treatment
T0 (control)231.466.9aα20.1abα0.37aα5.8aα3.4cβ
T12033.467.9aA20.7aA0.32aA4.9bA4.2abA
T22053.764.6aA12.9bC0.20bB3.1aC4.2aA
T32073.866.6aA18.0aAB0.32aA4.0aB4.5aA
Avg (T1–T3)67.3α19.4α0.32α4.5β4.4α
T44035.668.5aA19.0abA0.34aA4.5bcA4.2abA
T54056.066.9aA17.3aA0.32aA3.9aAB4.4aA
T64076.067.5aA16.9aA0.36aA3.9aB4.4aA
Avg (T4–T6)67.6α17.7αβ0.34α4.1βγ4.3α
T78039.369.3aA17.6bA0.26aA3.9cAB4.5aA
T88059.367.9aA17.5aA0.20bAB4.1aA4.3aA
T98079.866.7aA16.0aA0.19bB3.3bB4.9aA
Avg (T7–T9)68.0α17.0β0.22β3.8γ4.6α
Lowercase letters show significant (p ≤ 0.05) difference among different Na treatments for shoots at the same K level. Capital letters show significant (p ≤0.05) difference among the three K treatments within same collection date at the same Na treatment level. Greek letters show significant (p ≤0.05) average (Avg) differences among different sodium (NaCl) treatments, across K+ doses.
Table 5. Correlation between the expression of 10 genes in leaves and roots of Spinacea oleracea with salinity expressed as electrical conductivity of the irrigation water (ECiw).
GeneTissue ExpressionCorrelation with ECiwp Value
SoSOS1Leaf0.620.06
Root−0.150.67
SoSOS2Leaf−0.310.39
Root0.220.53
SoSOS3Leaf0.200.57
Root0.130.72
SoNHX1Leaf0.260.48
Root0.300.40
SoNHX2Leaf0.350.31
Root−0.350.33
SoERF1Leaf0.430.21
Root0.180.62
SoHKT1Leaf−0.070.85
Root−0.620.06
SoAKT1Leaf0.130.72
Root−0.310.39
SoERS1Leaf0.580.08
Root0.360.31
SoSAL1Leaf0.550.10
Root−0.080.82

