Abstract
An image processing-based variable rate chemical sprayer for disease and pest-infested coconut plantations was designed and evaluated. The manual application of chemicals is considered risky and hazardous to workers, and provides low precision. The designed sprayer consisted of a sprayer frame, motors, a power system, a chemical tank and pump, a crane, a nozzle with a remote monitoring system, and motion and crane controlling systems. As the target was confirmed, the nozzle was moved towards the target area (tree canopy) using the remote monitoring system. The pump then sprayed chemicals to the target at a specified rate. The results suggested optimal design values for 5–9 m tall coconut trees, including the distance between nozzle and target (1 m), pressure (1.5 bar), spraying rate (2.712 L/min), the highest movement speed (1.5 km/h), fuel consumption (0.58 L/h), and working capacity (0.056 ha/h). The sprayer reduced labor requirements, prevented chemical hazards to workers, and increased coconut pest controlling efficiency.
1. Introduction
Coconut is one of the highest economic value agricultural products in Thailand. Coconut is used to cook main dishes, as well as various kinds of dessert in Thai cooking. In 2015, 0.216 M ha of area was under coconut cultivation, which produced 1.06 M tones of coconuts. According to the National Statistical Office, 8273.2 g or 18 coconuts are consumed per person per year in Thailand. With a population of 55 million, 990 M coconuts or 65% of total production were consumed domestically. The rest, 489 M coconuts (35%), went to industry or were exported. Regarding export, Thailand stood seventh in world rankings, and the fifth in a statistical database provides comprehensive data for countries in the Asia-Pacific region for a range of indicators (ASEAN rankings). Total export volume in ASEAN was 4.61 M tones, comprising 42% from Indonesia, 17% from Malaysia, 16% from Philippines, 2% from Vietnam, and 1% from Thailand [1].
Coconut pest infestation is a serious challenge to its growers; for instance, coconut shoots are bitten by two-colored coconut leaf beetles (Brontispa longissima) and coconut black-headed caterpillars (Opisina arenosella), and drilled by coconut rhinoceros beetles (Oryctes rhinoceros). These pests cause serious damage to coconut trees, which may eventually lead to dead trees [2]. These problems result in the decrease in coconut production quantity and severe economic damage to coconut plantations. Some farmers use parasitic wasps to control coconut pests naturally. However, this method did not work well in pest control, and was also labor intensive. Some farmers drill holes on coconut trees and fill chemicals inside, which may leave chemical residue in coconuts [3]. On the other hand, the limitations of chemical sprayers include their reach to the full height of coconut trees and the heavy weight of bamboo stick (sprayer boom).
Many researchers have integrated a real-time machine vision sensing system and an individual nozzle-controlling device with a commercial map-driven-ready herbicide sprayer to create a spraying system. The smart sprayer was tested to determine its effectiveness and performance under varying commercial field conditions. Using the on-board differential GPS, geo-referenced chemical input maps (equivalent to weed maps) were also recorded in real-time. The performance accuracy of the spot-applicable fertilizer spreader was evaluated both in laboratory simulation and real-time field tests. Simulation results reported that the accuracy of the developed system was 94.9%. Real-time field tests reported that the system produced acceptable results at ground speeds of 1.6 km h−1 and 3.2 km h−1 for the spot application of fertilizer at target areas (in plant areas only) within the selected field [4,5,6,7,8,9,10,11].
After considering the challenges of conventional chemical spraying, as well as the objectives of increasing plantation yield, reducing production cost, and minimizing the environmental and health hazards of excessive chemical usage, a variable rate chemical sprayer was developed and evaluated. The sprayer uses an image processing technique for disease and pest infestation in coconut plantations, and provides effective pest control, as shown in Figure 1.
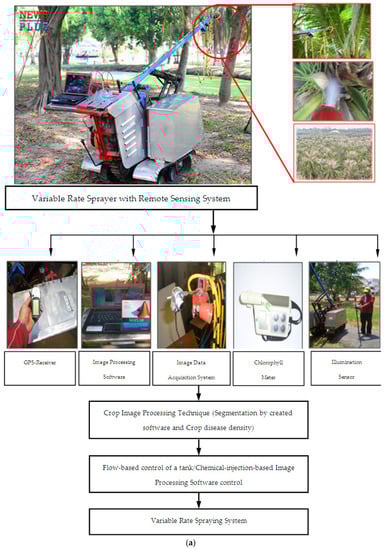
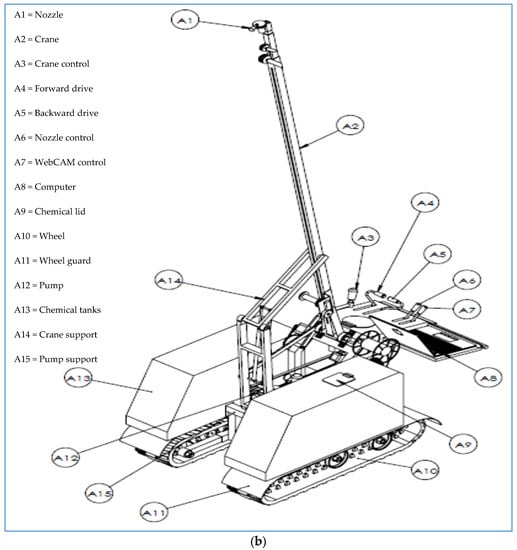
Figure 1.
Instrumentation and overall procedural configuration; (a) Variable rate spraying system is a flow-based control of chemical application rate; (b) Isometric view of variable rate sprayer with remote sensing system.
2. Materials and Methods
2.1. Experimental Set up and Field Preparation
The experimental field was located at the Rajamangala University of Technology Thanyaburi (RMUTT), Thailand (14.03 °N, 100.61 °E). In coconut plantations, a triangle pattern is preferred, as about 15% more coconut trees can be planted compared with a square pattern. The distance between coconut trees was kept as 9 m for the chosen variety of coconut tree, and distance between rows was 7.8 m, which resulted in 138 coconut trees/ha. Coconut was transplanted in an experimental area of 40 m × 40 m. The application rate of fertilizer in the coconut plantation was 59–91 kg/ha for nitrogen, 27–40 kg/ha for phosphorous, and 85–131 kg/ha for potassium. The soil physical properties of the site are shown in Table 1.

Table 1.
Physical properties of soil and fertilizer application* in the coconut plantation.
2.2. Image Data Acquisition System
The remote sensing system platform for the variable rate sprayer consisted of a WebCAM camera with two very small pieces of completely black photographic negative filter (Vimicro USB2.0 UVC PC Camera SWIFT-TECH ELECTRONICS Co. Ltd., Beijing, China) that modify an ordinary a WebCAM camera to capture images in the near infrared wavelength (>700 nm)and spraying nozzle (9000-45OS, THANAPHAN Co. Ltd., Bangkok, Thailand) with a wireless trigger control (Jelsoft Enterprises Ltd., London, England).The red/far red sensor measures radiation in μmol photons m−2s−1 in two wavebands (measured using two-channels with central bands at 660 and 730 nm; Skye Instruments, Ltd., Powys, UK) through a notebook (Pentium (R) Dual-Core CPU, T4200@2.00GHz, 1.93 GB of RAM) and software created using MATLAB® (R2013a, Windows, C++, https://www.mathworks.com/products/matlab.html, The Math Works, Inc., Natick, MA, USA)and a specifically developed data acquisition system. The specifically created software provided image orientation correction and loaded images from a WebCAM. After that, it estimated the disease density by dividing the selected image into four zones. The program converted the colored images into gray-scale images, then determined the volume flow rate of the solenoid valve for nozzle injection. The SKR 1800 illumination sensor measured prevailing sunlight intensity. The illumination sensor was attached to a data logger (Spectrum Technology Inc., Powys, PA, USA). A leaf chlorophyll meter (Minolta SPAD 502; Konica Minolta Sensing Inc., Osaka, Japan) was used to measure the average chlorophyll content (expressed as a single-photon avalanche diode (SPAD) values) of coconut tree leaves during the experiment. A feature common to disease infection in plants is the reduction in the number of chloroplasts in mesophyll. Apart from the frequent color change due to coconut shoots bitten by two-colored coconut leaf beetles (Brontispa longissima) and coconut black-headed caterpillars (Opisina arenosella), and drilled by coconut rhinoceros beetles (Oryctes rhinoceros), most of the plants showed that chlorophyll content was less in healthy plants, which had possibly been destroyed as a consequence of infection [6,7,8]. The units for the Minolta SPAD-502 leaf chlorophyll meter can be described by the following equation [12];
where M is the leaf chlorophyll meter reading (digital number), and Chl is the chlorophyll content in µmol m−2.
The green normalized differential vegetation index (GNDVI) values were estimated to establish the suitability of this reflectance index for coconut plantation at different growth stages of the tree. The GNDVI, which is based on the greenness level, represented the chlorophyll content as determined by the radiance at the leaf surface. It is also a significant indicator for distinguishing young and aged healthy or infected coconut trees. The GNDVI is estimated [13] as follows;
where ρNIR is the reflectance value for the near infrared band, and ρG is the reflectance value for the green band.
2.3. Design and Fabrication of Variable Rate Chemical Sprayer
2.3.1. Observation of Pests and Disease Infestation at the Coconut Tree Canopy
Information pertaining to coconut pests and disease infestation was collected at the apex of the coconut tree. The data collected were used to design a chemical sprayer with a remote monitoring system. A selected chemical (bacillus thuringiensis aizawaiwere) was tested in order to find the most appropriate dose with the highest efficiency that would also be hazard-free to the operator at the rate of 80–100 cc. in 20 liters of water. Moreover, prevailing pest control practices were studied in order to understand clearly how chemicals are used by farmers. The pests considered in the study were two-colored coconut leaf beetles, coconut black-headed caterpillars, and coconut rhinoceros beetles.
2.3.2. Fabrication of the Variable Rate Chemical Sprayer with Remote Monitoring System
The sprayer was fabricated after considering pertinent observations of trees, spraying practices, and the field. Caterpillar® track was used in the mobility of a sprayer crane. The crane must be to reach an altitude of 10 m. The nozzle was controlled manually using two operators. The sprayer consisted of seven major components, which were the sprayer frame (body), motors, the power system, a chemical tank and pump, a crane system, a nozzle with a remote monitoring system, a controlling system, and a crane controlling system.
The variable rate chemical sprayer with a remote monitoring system was fabricated at the Agricultural Machinery Engineering workshop of the Rajamangala University of Technology Thanyaburi.
The sprayer frame was fabricated from three-inch channel steel with dimensions of 1000 mm × 1500 mm × 800 mm. The sprayer was driven by a 10 hp Honda motor using belts and gears. The movement direction was controlled by a clutch system. The sprayer moved back and forth using a gear system. The crane boom was maneuvered from the motor through belts, reduction gears, and string reels. A mixture of chemicals was stored in the chemical tank, and pumped through a three-cylinder pump and nozzle.
The crane system was fabricated from 1.2 inch × 1.2 inch × 3000 mm carbon steel. The three carbon steel tubes were fixed at1.6 inch × 1.6 inch × 3000 mm, 2 inch × 2 inch × 3000 mm, and 2.2 inch × 2.2 inch × 3000 mm, which made it 10 m long at maximum stretch. Strings were attached to each tube to make it a telescopic crane boom when pulled in or out together. A WebCAM was installed at the nozzle in order to increase spraying precision and the ability to control nozzle direction.
In the design of the movement of the controller and crane, which is important in sprayer and crane operation, considered factors included crane elevation, chemical spraying, and camera angle (field of view) adjustment. The operation started when an operator controlled the sprayer to the targeted coconut tree. Crane and motors were controlled until the crane boom reached the top of the coconut tree and the infestation target was confirmed. The nozzle was pointed to the target using a remote monitoring system, and the bacillus thuringiensis aizawai, the chemical control, was pumped to the infested area at a specific rate.
2.4. Image Processing Software
An algorithm was specifically developed for image processing, particularly to separate the object of interest from its background. The developed software loaded images from the WebCAM (in near infrared-green-blue), and allowed the user to choose specific image profiles. The developed software estimated the disease density by dividing the selected image into four zones. Yellow and brown coconut shoots were detected in order to calculate density percentage per area and processed images (Figure 2). The results were displayed on the program screen. After that, the program converted colored images into gray-scale images, and determined the volume flow rate of the solenoid valve for nozzle injection. Lastly, the processed images were saved to a hard disk (Gray image, Bimodal image), as shown in Figure 3.
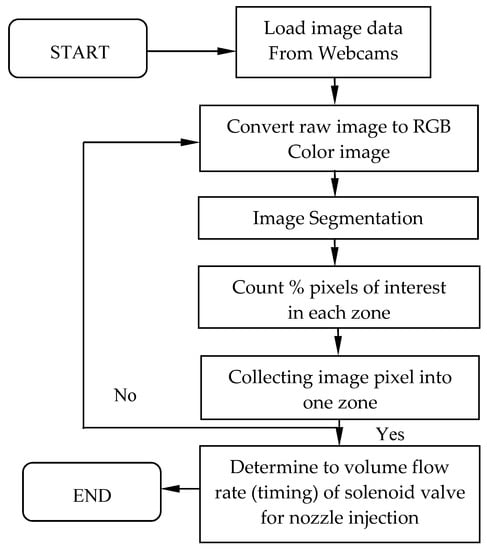
Figure 2.
Image processing algorithm.
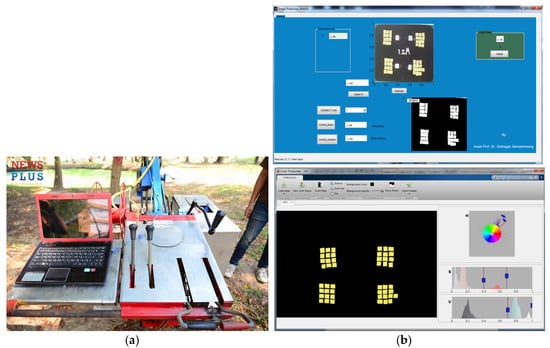
Figure 3.
Image processing software; (a) Operating system; (b) Yellow thresholding.
2.5. Field Testing and Performance Evaluation
The developed sprayer was evaluated in the field for its machine capacity. Factors considered in the assessment were the ability to work at an altitude up to 10 m, fuel consumption, and electricity consumption. The details of these indicators are presented as below.
- a)
- Actual working capacity of the sprayer (ha/h)
- b)
- Fuel consumption of the sprayer (L/h)
- c)
- Electricity consumption of the sprayer (kW/h)when
- I = Electricity current (Ampere)
- V = Electromotive force (Volt)
- t = Working time (h)
2.6. Calibration
For a suitable spraying footprint (diameter, cm) and altitude levels of the nozzle (m), the accuracy of a target covered by spray was assessed using a standard reference frame of 50 cm × 50 cm. Different samples were kept in the reference frame to represent the diseases and pests infestation area, comprising of yellow cards with 2.54 cm × 2.54 cm dimensions. Trials were made with sheets of three sample color groups: 25% (13 pieces), 50% (26 pieces), and 100% (52 pieces), which were kept at different heights from the nozzle (0.5 m, 0.7 m, and 1 m), as shown in Figure 4. This calibration also included variations in illumination levels with time of the day, as images were collected under cloud-free conditions between 10:30 and 12:30 standard local time.
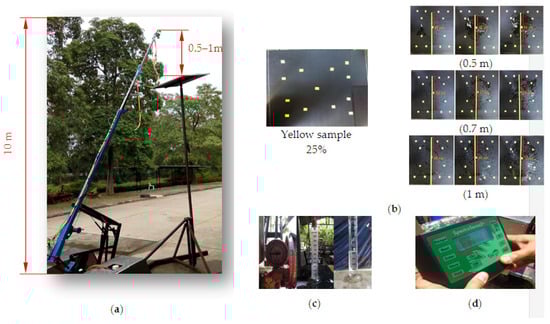
Figure 4.
Experimental setup for the calibration of spraying, (a)Variable sprayer set up; (b)Test with a 25% yellow sample at different heights from the nozzle; (c) Average fluid flow rate determination; (d) SKR 1800 (Skye Instruments, Ltd., Powys, UK) illumination sensor.
2.7. Statistical Analysis
All of the measurements were performed in triplicates. The experiments were accomplished using a randomized complete block design (RCBD). The experiment data were statistically analyzed. Analysis of variance (ANOVA) was used to determine significance between treatments, and Duncan’s multiple range test (DMRT) was used to compare the means at 95% confidence level [8].
3. Results
3.1. Chemical Spraying
The chemical pump was tested at three pressure levels: 1, 1.5, and 2 bar, which resulted in the spraying flow rates of 2.706, 2.712, and 3.27 L/min, respectively. The pressure value of 1.5 bar was chosen as it decreased spraying time and farmers were able to adjust the spraying angle easily (Table 2). The spraying footprint, which was measured as the diameter of the sprayed area and the distribution performance of the chemical, was tested at nozzle altitudes of 0.5, 0.7, and 1 m, and at a pressure of 1, 1.5, and 2 bar when at 25% (13 pieces), 50% (26 pieces), and 100% (52 pieces) density for the yellow color, respectively (Table 3).
Table 2.
Chemical spraying rate testing.
Table 3.
Spraying footprint (diameter, cm) at different heights and the percentage of three sample color groups.
For the calibration of the variable rate spraying system, the image data acquisition and processing system were calibrated against the known values of color densities with yellow colors at different altitudes (5 m, 7 m, and 9 m) using a wireless WebCAM. The color density of the sample sheets was varied at 25% (13 pieces), 50% (26 pieces), and 100% (52 pieces) for the yellow color.
These color panels, which were used for calibration, represented the top canopy area of the tree at the spraying footprint (Figure 4a). Table 3 shows the effect of nozzle height on the image processing accuracy of the wireless WebCAM. The altitude of the 1-m nozzle can be considered as having an acceptably high accuracy for both image processing data and the spraying area, which was 70.33 cm, 71.33 cm, and 72 cm, respectively, for 5 m, 7 m and 9 m spraying altitudes with 100% yellow color density. Figure 5 shows a sample image from the remote monitoring system.
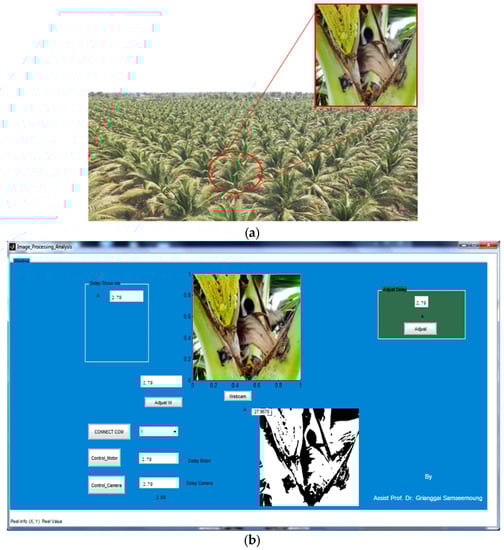
Figure 5.
Image from the remote monitoring system; (a) coconut pest disease infestation, (b) image data processing (segmentation).
3.2. Machine Performance
The results showed that the speed of the sprayer movement had a direct relationship with fuel consumption, as expected. Movement at speeds of 1, 1.5, 2, and 2.5 km/h consumed 0.46, 0.58, 0.73, 0.86 L/h of fuel, respectively. The working capacity of the sprayer was 0.048, 0.057, 0.064, and 0.076 ha/h, and electricity consumed was 0.015, 0.016, 0.018, and 0.022 kWh, respectively at the four speeds tested (Figure 6).
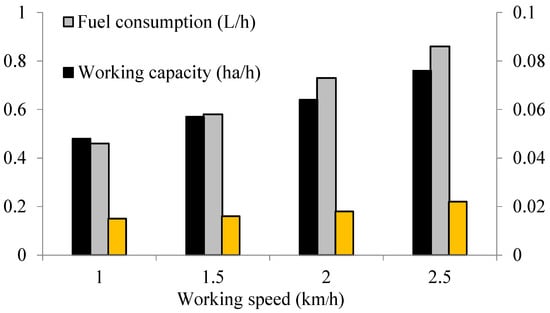
Figure 6.
Variable sprayer system field performance.
4. Discussion
The stressed or diseased (infected) coconut trees are characterized with a lower level of chlorophyll than the healthy trees. Dead coconut trees had the lowest spectral reflectance. This was probably due to its lowest moisture content, which least absorbs the reflectance energy in the infrared portion of the electromagnetic spectrum, and at the same time decreases its reflectance [14].
The green normalized difference vegetation index(GNDVI) and variable rate sprayer system index also showed the coefficient of determination correlation (R2 value of 0.687 and 0.66) slightly better when compared with the normalized difference vegetation index NDVI and variable rate sprayer system index(R2 = 0.687 and 0.621). This may be due to a close link between the ‘G’ spectral band value and the greenness of the healthy young and infected mature coconut leaves, respectively (Figure 7). For healthy mature and infected young coconut trees, the GNDVI and variable rate sprayer system index also showed a higher correlation with R2 value of 0.66 and 0.92, as compared with 0.621 and 0.71 for the NDVI and variable rate sprayer system index (Figure 8).
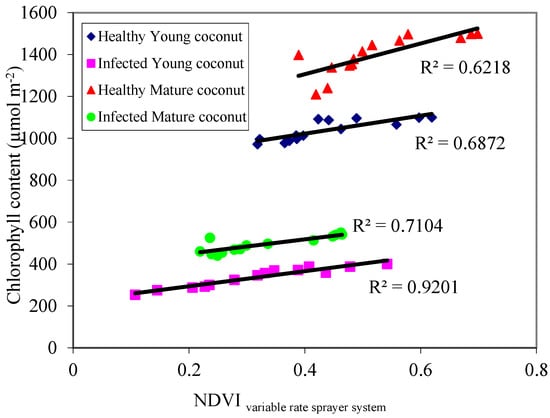
Figure 7.
Estimation of leaf chlorophyll content using the normalized differential vegetation index (NDVI) and variable rate sprayer system for healthy and infected coconut trees.
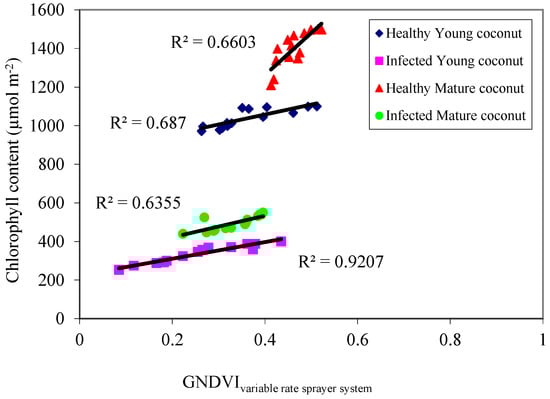
Figure 8.
Estimation of leaf chlorophyll content using the green normalized differential vegetation index (GNDVI) and variable rate sprayer system for healthy and infected coconut trees.
The variable rate chemical sprayer for monitoring diseases and pests infestation in coconut plantations with various sensors was assembled and configured for an accurate reading of vegetation in coconut trees. The system was based on an Arduino board (Arduitronics CO., Ltd., Bangkok, Thailand) that is able to control the different sectors and nozzles of the system [8]. As the target was confirmed, the nozzle was moved towards the target area (tree canopy) using a remote monitoring system. The pump then sprayed the chemical to the target at a specified rate. The same system is also able to operate the position of the actuator on the air-adjusting louver system as described, and the electronic system can register data from all the systems via a serial port operating at a maximum frequency of 2 Hz [15].
5. Conclusions
A chemical sprayer with a remote monitoring system was designed and fabricated, which consisted of major parts such as a sprayer frame, motors, a power system, a chemical tank and pump, a nozzle and remote monitoring system, a movement controller, and a crane. The spraying rate was 162.72 L/h at a forward speed of 1.5 km/h, which offered fuel consumption of 0.58 L/h, and a working capacity of 0.056 ha/h. Furthermore, for the calibration of a variable rate spraying system, the image data acquisition and processing system were calibrated against the known values of color densities with yellow colors with a wireless WebCAM. The nozzle with an altitude of 1 m can be considered as having an acceptably high accuracy in image processing data and the spraying area.
The variable rate sprayer could reduce the labor force requirement, prevent chemical hazards to workers and the environment, and increase coconut pest controlling efficiency.
Acknowledgments
The authors thank Asian Institute of Technology (AIT), School of Environment, Resources and Development, Agricultural Systems and Engineering, Pathumthani, for providing experimental facilities. This work was financially supported by Rajamangala University of Technology Thanyaburi (RMUTT), Faculty of Engineering, Agricultural Engineering, Klong 6, Thanyaburi, Pathumthani, Thailand. Rajamangala University of Technology Thanyaburi is not necessary to agree with the results of this study.
Author Contributions
Grianggai Samseemoung designed and conceived the experiment. Pimsiri Suwan analyzed the data. Grianggai Samseemoung, Peeyush Soni and Pimsiri Suwan drafted the article.
Conflicts of Interest
The authors declare no conflict of interest.
Abbreviations
| Full Name | Symbol |
| Hectare | ha |
| Kilogram | kg |
| Kilowatt | kW |
| Kilowatt-hour | kW h |
| Liter | L |
| Meter | m |
| Revolutions per minute | rpm |
| Square | sq. |
| Volt | V |
| Watt | W |
| Horse power | Hp |
References
- Office of agricultural economics: Ministry of agriculture and cooperatives. Agricultural Economic Basic Information. 2015. Available online: http://www.oae.go.th (accessed on 9 November 2015).
- Abidin, C.M.R.Z.; Ahmad, A.H.; Salim, H.; Hamid, N.H. Population dynamics of Oryctes rhinoceros in decomposing oil palm trunks in areas practicing zero burning and partial burning. J. Oil Palm Res. 2014, 26, 140–145. [Google Scholar]
- Bedford, G.O. Advances in the control of rhinoceros beetle, Oryctes rhinoceros in oil palm. J. Oil Palm Res. 2014, 26, 183–194. [Google Scholar]
- Zaman, Q.U.; Esau, T.J.; Schumann, A.W.; Percival, D.C.; Chang, Y.K.; Read, S.M.; Farooque, A.A. Development of prototype automated variable rate sprayer for real-time spot-application of agrochemicals in blueberry fields. Comput. Electron. Agric. 2011, 76, 175–182. [Google Scholar] [CrossRef]
- Stafford, J.V.; Benloch, J.V. Machine assisted detection of weeds and weed patches. In Precision Agriculture; Stafford, J.V., Ed.; BIOS Scientific Publishers Limited: Oxford, UK, 1997; pp. 511–518. [Google Scholar]
- Samseemoung, G.; Jayasuriya, H.P.W.; Soni, P. Oil palm pest infestation monitoring and evaluation by helicopter-mounted, low altitude remote sensing platform. J. Appl. Remote Sens. 2011, 5, 053540. [Google Scholar] [CrossRef]
- Samseemoung, G.; Soni, P.; Jayasuriya, H.P.W.; Salokhe, V.M. Application of low altitude remote sensing (LARS) platform for monitoring crop growth and weed infestation in a soybean plantation. Precis. Agric. 2012, 13, 611. [Google Scholar] [CrossRef]
- Samseemoung, G.; Soni, P.; Sirikul, C. Monitoring and Precision Spraying for Orchid Plantation with Wireless WebCAMs. Agriculture 2017, 7, 87. [Google Scholar] [CrossRef]
- Tangwongkit, R.; Salokhe, V.; Jayasuriya, H.P.W. Development of a Tractor Mounted Real-time, Variable Rate Herbicide Applicator for Sugarcane Planting. Agric. Eng. Int. 2006, 8, 1–11. [Google Scholar]
- Tian, L. Development of a sensor-based precision herbicide application system. Comput. Electron. Agric. 2002, 36, 133–149. [Google Scholar] [CrossRef]
- Tian, L.; Steward, B.; Tang, L. Smart sprayer project: Sensor-based selective herbicide application system. Proc. SPIE 2000, 4203, 73–80. [Google Scholar]
- Markwell, J.; Osterman, J.C.; Mitchell, J.L. Calibration of the Minolta SPAD-502 leaf chlorophyll meter. Photosynth. Res. 1995, 46, 467–472. [Google Scholar] [CrossRef] [PubMed]
- Gitelson, A.; Kaufman, Y.J.; Merzlyak, M.N. Use of a green channel in remote sensing of global vegetation from EOS-MODIS. Remote Sens.Environ. 1996, 58, 289–298. [Google Scholar] [CrossRef]
- Jusoff, K.; Hussein, Z.H.; SoonYew, J.; Din, M.S.H. The Life Satisfaction of academic and Non-Academic Staff in a Malaysian Higher Education Institution. Int. Educ. Stud. 2009, 2, 143–150. [Google Scholar] [CrossRef]
- Landers, A.J.; Larzelere, W.; Muise, B. Advances in autonomous pesticide application technology for orange groves. In Aspects of Applied Biology 114, International Advances in Pesticide Application; Association of Applied Biologists: Wageningen, The Netherlands, 2012; pp. 91–98. [Google Scholar]
© 2017 by the authors. Licensee MDPI, Basel, Switzerland. This article is an open access article distributed under the terms and conditions of the Creative Commons Attribution (CC BY) license (http://creativecommons.org/licenses/by/4.0/).