Article

Development Interventions and Agriculture Adaptation: A Social Network Analysis of Farmer Knowledge Transfer in Ghana

1
Department of Geography, University of Toronto, Toronto, ON M5S 3G3, Canada
2
Faculty of Renewable Natural Resources, Kwame Nkrumah University of Science and Technology, Kumasi, Ghana
3
Department of Physical and Environmental Sciences and the Centre for Critical Development Studies, University of Toronto Scarborough, Toronto, ON M1C 1A4, Canada
*
Author to whom correspondence should be addressed.
Agriculture 2016, 6(3), 32; https://doi.org/10.3390/agriculture6030032
Submission received: 17 May 2016 / Revised: 14 July 2016 / Accepted: 21 July 2016 / Published: 26 July 2016

Abstract

:
Social ties play an important role in agricultural knowledge exchange, particularly in developing countries with high exposure to agriculture development interventions. Institutions often facilitate agricultural training projects, with a focus on agroecological practices, such as agroforestry and agrobiodiversity. The structural characteristics of social networks amongst land managers influences decision-making to adopt such adaptive agroecoloigcal practice; however, the extent of knowledge transfer beyond direct project participants is often unknown. Using a social network approach, we chart the structure of agrarian knowledge networks (n = 131) in six communities, which have been differentially exposed to agriculture development interventions in Ghana. Farmer network size, density and composition were distinctly variable; development project-affiliated farmers were embedded in larger networks, had non-affiliated farmers within their networks, were engaged in more diverse agricultural production and reported adopting and adapting agroecological practice more frequently. Such bridging ties that link across distinctive groups in a network can expose network members to new and innovative agroecological practices, such as increasing agrobiodiversity, thus, contributing to livelihood strategies that mitigate environmental and market risk. Furthermore, we show that these knowledge networks were crop-specific where network size varied given the type of crop produced. Such factors, which may influence the rate and extent of agroecological knowledge diffusion, are critical for the effectiveness of land management practices as well as the persistence of agriculture development interventions.

Graphical Abstract

1. Introduction

In agriculture-based economies, implementing agroecological practices, such as diversifying crop production, and, thus, expanding livelihood strategies within the agricultural sector, may reduce vulnerability [1]. Agroecology, or the ecological, social and economic dimensions of a food system and associated pro-environmental agroecological practices [2,3], has been shown to improve the resilience of agricultural systems to environmental and economic risk [3,4,5]. Enhancing agrobiodiversity provides many ecosystem services and economic benefits; risk of crop failure can be minimized while sources of income are diversified through potentially greater economic returns per unit of area.
Such strategies are particularly important in the agricultural sector of Ghana, where 60% of the population lives in rural areas and relies on agriculture for their livelihoods [6]. Despite the importance of agriculture, Ghana lies within a climatic transition zone and agricultural production is occurring in regions facing mounting agricultural constraints from climate change [7,8]. As a result of these challenges, agriculture-related international development interventions are very active in Ghana [9]. Agriculture-related development projects in Ghana are facilitated by non-governmental organizations (NGOs), government extension officers and other proponents of development aid and often promote practices associated with small-scale, labour intensive farming systems [10]. Many projects involve training on agriculture-related, agroecological practices that are meant to enhance the capacity of farmers in the face of environmental challenges while increasing yield, and subsequently decrease their vulnerability to food insecurity. Such practices include agroforestry adoption, ‘slash-without-burning’ agriculture, weeding, planting in rows, intercropping, removal of disease-affected plants and use of shade-trees that have been shown to increase yield for some crops [9].
Agriculture-related development interventions, including training projects, often target ‘key’ individuals that may be considered influential within their community. The intention is that this gained knowledge will be transferred to the larger population [11]. Franzel and Scherr [12] argue that farmers play a central role in extension in terms of technology selection and design but also in farmer-to-farmer transfer of knowledge related to new agricultural technologies. Although farmer-to-farmer knowledge transfer is an effective method of agricultural extension, it is often unclear whether farmers that participate in agricultural interventions influence the larger community as a whole in terms of adaptation of practices or whether certain sub-populations remain isolated from access to such knowledge. Social ties within and beyond community boundaries are critical for individuals and the group to acquire useful information from external agencies [13,14,15] as the diffusion of information and the subsequent adoption of innovation rely heavily on social relationships.
Social network analysis has gained attention as a useful tool to examine the diffusion of knowledge and the potential impact on natural resource governance [15,16,17]. In the developing-country context, where agriculture constitutes an important rural livelihood strategy, informal networks often contribute to effective land management because in times of rapid change, such networks can enable innovation and enhance flexibility, which may be hindered by the bureaucracy associated with government programs or other agricultural outreach programs [18]. Recent studies have demonstrated that social ties play an important role in agricultural knowledge exchange, resulting in more effective and sustainable farming practices, particularly in developing-country agriculture [14,19,20,21,22]. Spielman et al. [23] argue that social network analysis is key to understanding how innovation occurs in developing-country agriculture and Meinzen-Dick et al. [24] demonstrate that gender may play a significant role in these innovation networks. Despite these recent advances in understanding network structure and diffusion of knowledge in land management, more information is needed on the influence of formally-established, knowledge-sharing sources (such as agriculture development NGOs) within an agricultural information landscape and the consequences in terms of knowledge transfer to the larger agricultural community.
Using social network analysis, this study explores knowledge networks among Ghanaian agriculturalists. We assess whether farmers affiliated with agriculture development organizations are positioned differently in agriculture-related information networks than non-affiliated farmers and whether these informal information networks differentiate by farmer attributes, specifically gender. Given that different extension providers may focus on different crops in a region, we also assess the specific agroecological information that is diffused and the variability of these information networks across crop type.

2. Materials and Methods

2.1. Study Sites

This study was undertaken in two regions: the transition (Brong-Ahafo) region and the humid (Ashanti) region. These regions are characterized by a high average monthly temperature between 27 °C and 31 °C as well as two rainy seasons per year; however, the transition region is located farther north within the agro-ecological deciduous forest zone and subsequently has lower average annual rainfall. Within each of the two regions, three study communities were selected based on their similar rural classification, close proximity to each other, close proximity to the district capital, similarities in terms of livelihood activities, which are predominantly agriculture-based, and high presence of agriculture-focused development institutions and organizations.
In this study, we define an institution and organization as an actor that is based outside of the study community but that promotes agricultural development within the community through interaction with the community members. This includes both government and non-government actors, which interact with community members using various methods of extension to disseminate knowledge. The Ministry of Food and Agriculture (MoFA), the Forestry Commission of Ghana (FCG) and NGOs play an important role in agricultural development through extension, which is carried out through varied approaches and support services including farmer field demonstrations, agricultural training programs, field visits, home visits and organizing farmer groups.

2.2. Data Collection

Network data was collected using the name-generator technique [25]. Within each of the six study communities across the two regions, four farmers were randomly selected as starting points for network data collection. Criteria for initial selection were based on gender and NGO project affiliation status (one male project-affiliated farmer, one female project-affiliated farmer, one male non-affiliated farmer and one female non-affiliated farmer). Project-affiliated farmers had to report attending at least one agriculture-focused training project within or outside of their community within the past five years. Criteria for initial selection was also based on type of crops produced, where the farmer had to report producing at least one species within each of three crop categories within the past five years. Crop species were categorized as timber trees, cash crops and food crops. Each category of crop production is associated with a different livelihood strategy (long-term profit, short-term profit and sustenance).
The initially selected farmers were asked to list all of the crops that they currently produce, which were categorized according to the established list of crop categories. Farmers were asked to list other farmers or individuals representing institutions from whom they receive knowledge relating to production of crops within each of the crop categories. All individuals listed were then sought and asked the same question: list individuals from whom you receive knowledge relating to production of the crops within each of the crop categories. This research received approval from the Social Sciences, Humanities and Education Research Ethics Board, University of Toronto.
The networks in this study were bounded by the community so that only farmers that reside within the same community as the initial interviewee were interviewed. In social network analysis, this nominalist strategy may be used to define a social network boundary, where the researcher imposes the boundary based on a pre-established conceptual framework [26]. In some cases, the initially selected farmers did not list any knowledge sources within their community, and therefore no further interviews were conducted with their listed sources. All institutions in this study were considered to be based outside of the study communities.
During the name generator interviews, demographic data was also collected, including respondent age and household population size. Farmers were also asked to describe the size of their farm and discuss the challenges that they experience as a farmer. Furthermore, farmers were asked about the agriculture development interventions (such as farmer field schools) within their community and why they chose to participate or not participate. Farmers that reported that they had participated in such interventions were asked how they were involved and the types of skills and knowledge that they acquired through participation. Farmers were also asked to describe the type of knowledge that they receive from their listed sources. Qualitative data was collected in order to explore the issue of environmental change and to explore adoption of practices and strategies of adaptation to environmental constraints.

2.3. Data Analysis

In total, 131 farmers were interviewed with verbal informed consent. Name generator responses were coded as binary variables, where the presence or absence of a directional knowledge tie was entered into a name-based adjacency matrix [27]. A corresponding attribute file was also created for each matrix, where farmer attributes (gender, project-affiliated or non-affiliated and community resident or not) were coded with binary variables [27]. Adjacency matrices for each individual and the corresponding attribute files were used to determine network structure values including network size, indegree, outdegree, total ties and density. Indegree refers to the number of ties that an actor receives whereas outdegree refers to the number of ties that an actor sends [27]. In this study, an actor’s indegree represents the number of other individuals that listed them as a knowledge source. An actor’s outdegree represents the number of other individuals that they listed as knowledge sources. All data was pooled and assessed for total ties including all directed ties within the network and density of the network (the proportion of all possible dyadic connections that are actually present within the network) [27].
The adjacency matrices and the attribute files were also used to determine network positionality characteristics, including betweenness, which is the likelihood that an individual falls on the shortest path between members of their network. Coordinator and gatekeeper brokerage roles were also calculated. An individual acts as a ‘coordinator’ when brokering a relation, or transferring knowledge, between members of the same group of which the individual is also a member [27,28]. An individual acts as a ‘gatekeeper’ when it is a member of a group who is at its boundary and controls flow of knowledge from outsiders to the group [27,28,29]. Values for betweenness, as well as coordinator and gatekeeper brokerage roles were normalized by dividing by the maximum possible value in a network of equal size and connectivity [27]. In the humid region, coordinator and gatekeeper values could not be determined for affiliation versus non-affiliation status. Many agrarian-related development projects have been present in the humid region communities so farmers were unsure of the affiliation status of their associates. Therefore, the affiliation status could only be determined for the farmers that were interviewed and not for those that were two steps from the initially interviewed farmer. In the transition region, fewer agrarian-related development projects have been present and affiliation status of individuals that were listed by interviewees but not interviewed was confirmed with project leaders and is therefore considered to be accurate.
The knowledge network of each of the 24 initially selected farmers was also assessed for crop-specific networks. Each of these 24 networks were broken down into a maximum of three crop-category specific knowledge networks as previously discussed (timber tree species, food crops and cash crops). For each of the two regions, the crop-category specific knowledge networks were analysed for size, indegree, outdegree, total ties, density, normalized betweenness and composition of actors (including percentage of affiliated versus non-affiliated members, percentage of female versus male members and percentage of members that reside outside of the community).

2.4. Statistical Analysis

We ran standard analysis of variance (ANOVA) but used permutation tests to generate the significance level as our network data do not meet assumptions of independence and random sampling. A permutation test assesses whether measured tie attributes are different than what occurs at random. We ran ANOVAs using N = 5000 random permutations to test significance of the independent attribute variable of crop category (three groups: food crops, timber tree species and cash crops) on network variables (i.e., network size, indegree, outdegree, total ties, density, betweenness and composition (percentages of affiliated members, female members and outsiders). We ran t-tests using N = 10,000 random permutations to derive significance levels of the effect of the independent attribute variables of gender (male vs. female) and affiliation (two groups: affiliated vs. non-affiliated) on network variables (i.e., network size, indegree, outdegree, total ties, density, betweenness, coordinator and gatekeeper brokerage scores and composition (percentage of outsiders and percentage of affiliated members). All tests were performed in UCINET [30].

3. Results

3.1. Network Structure and Positionality for Affiliated and Non-Affiliated Farmers

Network size differs between farmers affiliated with one or more regionally active development projects and farmers who are not affiliated with a project. The transition region communities exhibit significantly (p = 0.0003) larger network size for affiliated farmers (9.2 network members) than for non-affiliated farmers (5.8 network members; Table 1). Similarly, in the humid region communities, network size is significantly (p = 0.0025) larger for affiliated farmers (8.9 network members) than for non-affiliated farmers (6.2 network members; Table 1). In the transition and humid regions, farmers affiliated with development projects also exhibit higher indegree (p = 0.0049 and p = 0.0530, respectively), outdegree (p = 0.0008 and p = 0.0340, respectively) and total ties (p = 0.0002 and p = 0.0003, respectively) as compared to non-affiliated farmers (Table 1). There is no significant difference in network density between the two groups at the regional level (Table 1). Furthermore, normalized betweenness does not significantly differ between affiliated and non-affiliated farmers (Table 1).
In the transition region, the percentage of network members from outside the community is not significantly different for affiliated versus non-affiliated farmers (Table 1). This was not found in the humid region, where the percentage of network members from outside the community is significantly (p = 0.0015) higher for affiliated farmers (50.2%) than for non-affiliated farmers (30.7%; Table 1). One’s tendency to act as a ‘coordinator’ is not significantly different between these two groups but non-affiliated farmers in the transition region have an increased tendency to act as gatekeepers (Table 1).

3.2. Network Structure and Positionality for Male and Female Farmers

In the transition region, network size is significantly (p = 0.0441) larger for male farmers (7.9) than for female farmers (6.0; Table 2). In the humid region, networks also tend to be larger for male farmers (7.8) than for female farmers (6.8) but this data is not significantly different (Table 2). Values for indegree, outdegree and ties also tend to be larger for the networks of male farmers versus those of female farmers (Table 2). There is no significant difference between male and female farmers for normalized betweenness or density at the regional level (Table 2).
One’s tendency to act as both a coordinator and a gatekeeper significantly differs by farmer gender at the regional level. Male farmers tend to act as a coordinator and/or a gatekeeper more frequently than female farmers (Table 2). Further, the networks of male farmers tend to consist of a higher percentage of members that are located outside of their community than the networks of female farmers (Table 2).

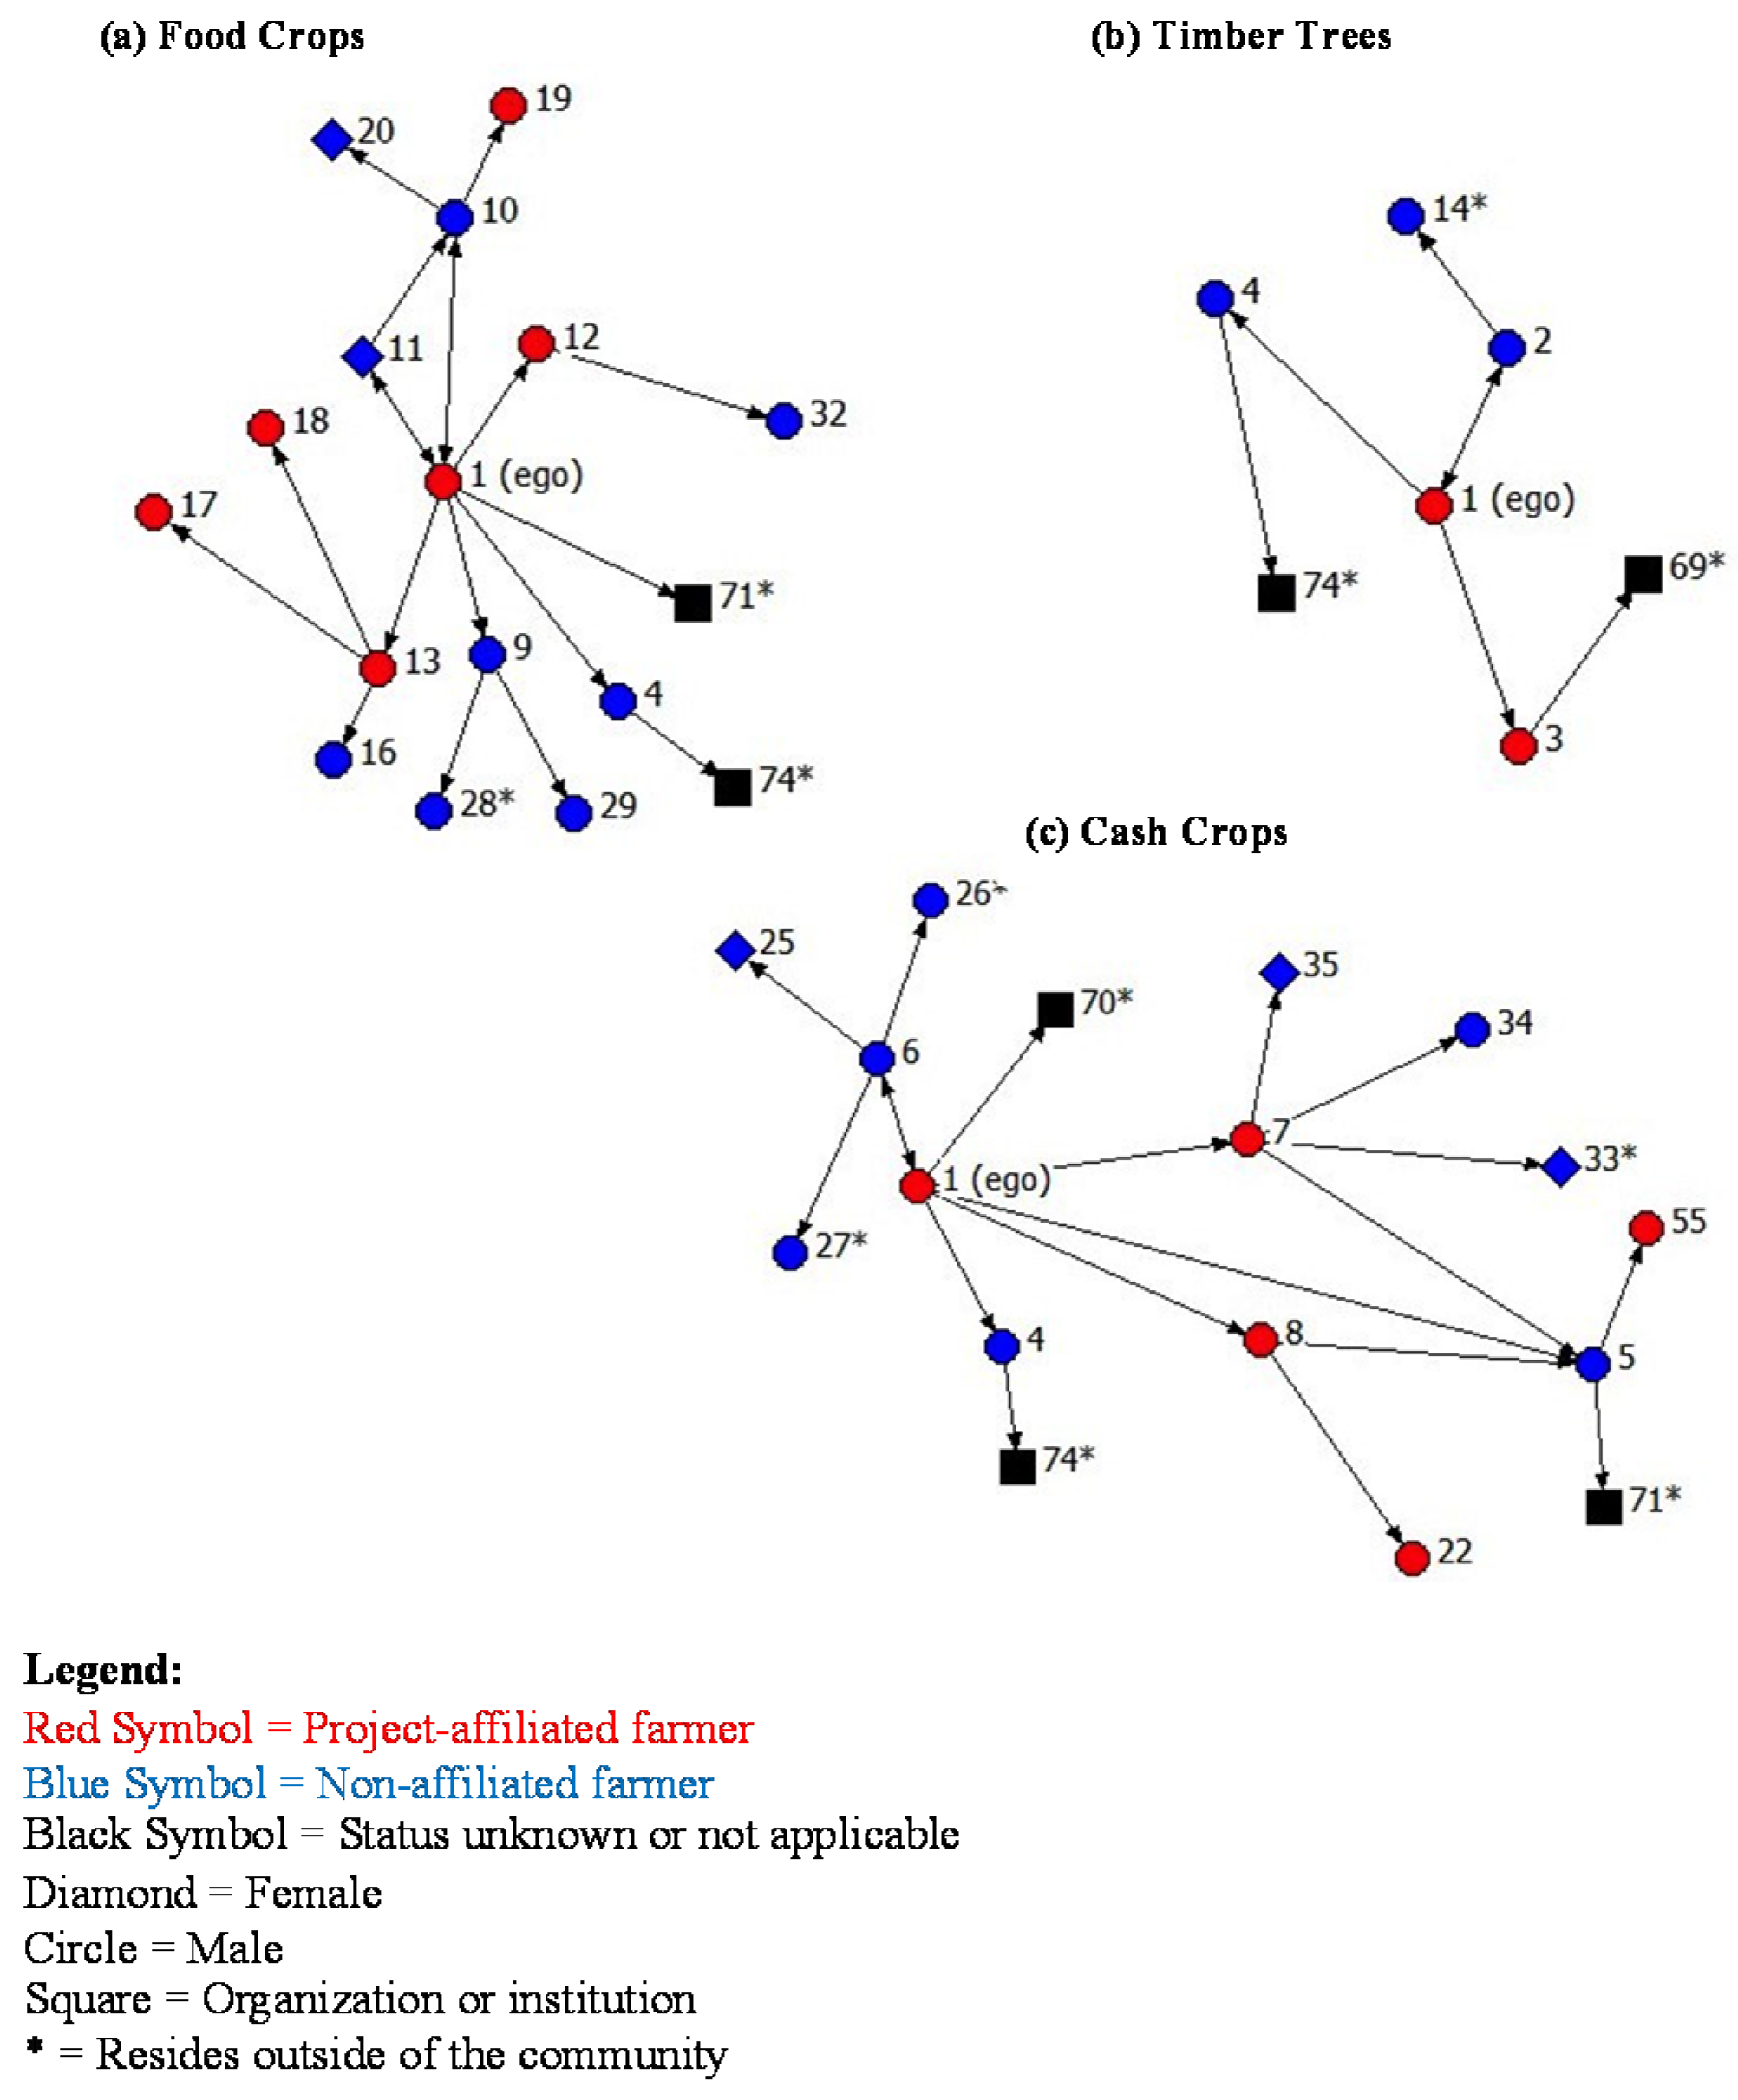
3.3. Knowledge Networks for Crop-Specific Management

When networks are pooled according to crop category (Figure 1) and also partitioned by study region, in the transition zone, food crop networks have the largest membership, whereas in the humid region, cash crop networks have the largest membership (Table 3). Indegree and outdegree values are also consistently highest for cash crop networks in the humid region and for food crop networks in transition region. In the humid region only, network density is highest for cash crop networks, followed by food crop networks and finally timber tree networks (p = 0.0142; Table 3). In the transition region, timber tree networks consist of the greatest percentage of project-affiliated members, followed by cash crop networks and finally food crop networks (36.1%, 32.6% and 20.4%, respectively; Table 3). In all network categories in both regions, crop-specific networks consist of more male farmers than female farmers, regardless of the gender of the respondent.

3.4. Key Knowledge Transferred

The most frequent type of knowledge received by farmers is information on (1) the application of agrochemicals (including pesticides and herbicides); and (2) planting techniques (Table 4). In almost all cases, a higher number of project-affiliated farmers reported receiving information across all types of knowledge. When the farmers that reported receiving each type of knowledge were partitioned by gender, a higher number of men reported receiving a more diverse array of knowledge than women. Farmers also identified agricultural challenges as low and unstable prices of crops, loss of soil fertility, fires, erratic rainfall patterns and land use change.

4. Discussion

4.1. Agricultural Project Affiliation

Although institution-based agricultural organizations often play an important role in knowledge dissemination, the effectiveness of these providers in terms of disseminating appropriate knowledge across diverse farmer groups is often questionable. Wood [31] argues that inadequate communication and collaboration among institutions in Ghana has resulted in a gap between research, education and extension, which has created significant obstacles for agricultural development and improving farmer livelihoods. We show that the knowledge networks of project-affiliated farmers have more members that reside outside of the community than the knowledge networks of non-affiliated farmers. Those with diverse connections may be in a stronger position to confront vulnerability as diversity in a social network may allow for access and incorporation of new knowledge and therefore increased innovation [21,32,33].
One’s ‘position’ within their social network may have implications in terms of influence and benefits [15,19,34,35]. The role of the ‘gatekeeper’ is important in terms of regulating the flow of information to others within their group. In our study, project-affiliated farmers act as gatekeepers of knowledge more often than non-affiliated farmers. By fulfilling these roles, these farmers may have increased ‘power’ in terms of controlling how and to whom this knowledge is transmitted since those that they are directly connected to do not have alternative information sources [15,29].
Diverse knowledge sources can improve food security through access to information on appropriate practices that result in increased productivity and environmental resilience. For instance, crop diversification increases environmental resilience by reducing environmental risks, such as the frequency of pest outbreaks, pathogen transmission and by buffering crop production from climate variation [5]. Additionally, the structure of social relationships can influence adoption of such practices [36] where for the rural poor in the Global South, diverse social connections are especially important since food insecurity often results from factors including droughts, low farm productivity and diminishing landholding sizes [37].

4.2. Gender and Agricultural Knowledge Networks

Male farmers exhibit larger social networks than female farmers. The social networks of male farmers also tend to consist of more members that reside outside of their community than those of female farmers. Male farmers also tend to act as coordinators and gatekeepers more frequently than female farmers. Despite the potential advantages of these positions and of more diverse knowledge, some networks of female farmers in this study are denser than those of male farmers. Female farmers also produce a larger number of crop species than male farmers on average but engage in fewer different agricultural livelihood strategies. These findings are supported by Thuo et al. [38] who found that male farmers in Uganda are more likely to acquire information and subsequently plant improved groundnut crop varieties. Thuo et al. [38] indicate that male-headed households with small land holdings are also more likely to acquire information from external sources [38]. Etwire et al. [39] argue that in Ghana, female farmers are more socially networked and therefore are more likely to have ties with an agricultural project. However, male farmers usually are the decision-makers and have more access and control over resources. Male farmers may, therefore, be better situated to participate in an agricultural project [39]. In the transition region, 43% of the male farmers that were interviewed declared that they were project-affiliated. Only 32% of female farmers that were interviewed in the transition region declared that they were project-affiliated.

4.3. Crop-Specific Knowledge Networks

In the transition region, timber tree networks consist of the greatest percentage of other project-affiliated members. This may be due the focus and promotion of cultivation of teak and other timber tree species in the development interventions within the transition region study communities aimed at managing this dynamic landscape and creating wealth [40], which may enable participants of these interventions to connect and share information with each other. Timber trees constitute an important long term investment or a ‘pension plan’. Although some economic risk is involved with timber tree planting due to high initial investment costs for small-scale farmers, trees may provide ecological and agricultural benefits in the short term and in the longer term act as a ‘safety net’ where the trees may be harvested and sold in times of need [41].
In the humid region, cash crop networks are larger and more dense than food crop networks or timber tree networks. These trends may be a result of the more intensive focus on cocoa production in the humid region than the transition region, where the climate is more favourable for production of this species due to the higher precipitation [42]. Cash crop production is an important livelihood strategy; these crops are an important source of income generation and often have a good economic return. Presumably, community level influences, namely cooperatives operating in this region, are also influencing the size and density of a member’s social network.
Interestingly, all networks that are categorized by specific crop category consist of more male members than female members, regardless of the gender of the respondent. This suggests that both male and female farmers seek agricultural knowledge from other male farmers more frequently than from other female farmers, which may reflect the cultural role of males as the decision-makers and household heads. Whereas female farmers tend to focus on the production of food crops, male farmers tend to be more engaged with cash crop production. Djagbletey and Adu-Bredu [43] similarly found that in Ghana the percentages of teak farms that were owned by women and men were eight percent and 92%, respectively. Although men and women may both contribute to the cultivation of trees, land ownership, and therefore the rights over planted trees, is often assigned to the man as the household head [43]. Agbenyega et al. [44] argue that gendered relations of land, labour, capital and knowledge influence the potential of male and female farmers to engage in agroforestry practices in Ghana. Women remain disadvantaged in terms of access and rights to these inputs because of cultural, sociological and economic factors [45]. This is the case even though in Ghana, females are the majority producers, processors and sellers of food and therefore the principle contributors to agricultural income generation [46]. Doss and Morris [47], similarly, found that female farmers tend to adopt improved technologies for maize production in Ghana at a lower rate than male farmers because of gender-linked differences in access to complimentary inputs.

4.4. Agricultural Interventions and Networks

In our study, the structures of knowledge networks and farmer positionality within those networks significantly differ across gender, between project-affiliated and non-affiliated farmers and according to the types of crops produced by the farmer, which represent different agrarian livelihood strategies. Farmers that participate in agrarian-related development project interventions within or near their community have larger social networks and are more centrally positioned as coordinators and gatekeepers of knowledge than those who do not participate in such interventions. Project-affiliated farmers have a higher number of sources for agricultural knowledge, including from outreach programs and other community members, than those who have not participated in such interventions. Furthermore, project-affiliated farmers produce a larger number of crops and sustain a larger diversity of agricultural livelihood strategies than non-affiliated farmers, which may reduce the vulnerability of project-affiliated farmers by enhancing their capacity to deal with or adapt to environmental or socio-political stressors, and subsequently increase their household level of food security. Project-affiliated farmers also report adaptations of agricultural practices in response to environmental constraints more frequently than non-affiliated farmers.
The most frequently reported agricultural challenge was low and unstable prices of crops. Other commonly reported challenges were the difficulty of marketing crops, high price of agrochemicals, including pesticides and herbicides, as well as access to these agrochemicals and other farming inputs including fertilizers and tools. Certain farmers also reported that support from agrarian institutions, including those led by government, as well as NGOs, is sometimes ineffective while other’s reported that agrarian-related development projects that had been implemented in their community have provided great benefits. Additional challenges that farmers listed included loss of soil fertility, bush fires, changes in rainfall patterns, land-cover change from forest to grassland and proliferation of pests and weeds. In order to mitigate some of the previously discussed challenges, farmers adopted alternate agrarian practices, ranging from integration of trees on farm, switching from random to line planting, switching away from or toward the use of pesticides and herbicides. When farmers that self-reported these adoptions of new agrarian practices were partitioned by project-affiliation or non-affiliation, all adoptions were consistently reported by a higher percentage of project-affiliated farmers than non-affiliated farmers.
The implications of these trends are important in terms of agricultural adaptation and management in a context where environmental and other socio-political challenges are affecting agricultural production. Understanding how knowledge transfers within a community, and the way in which practices are adopted, may have great implications for the effectiveness of the development institutions that focus on farmer agrarian development. The most vulnerable farmers, who may lack extensive social ties and who may not participate in agricultural programs, may still be reached indirectly. If extension providers target centrally networked farmers that are the link between these institutions and the rest of the community, then they act as knowledge ‘hubs’. These key farmers as defined by the network analysis may be equally if not more important for the dispersion of agrarian knowledge within a community than extension officers that are affiliated with outside development organizations.

5. Conclusions

In this study, a social network analysis approach was used to compare the structure of farmer knowledge networks across farmers that participated in agricultural development projects and those that do not in two regions of Ghana. As is evident from our analysis, male, project-affiliated farmers tend to have larger social networks than female, non-affiliated farmers. These highly networked farmers tend to fulfill brokerage roles (as gatekeepers and coordinators) and to act as advisors within their community, which illustrates their important role as the link between outside agricultural extension and the rest of the community. Since knowledge is often specific to the type of crop, knowledge reaches farmers differently depending on what species they produce. Knowledge networks for crop-specific management practices are distinctly variable, where farmers that engage in more diverse agricultural production tend to be positioned within multiple sub-networks and subsequently have greater access to different types of knowledge. Understanding farmer network structure is critical for effective agricultural development interventions in terms of improving the exchange of information for effective and sustainable agricultural land management practices.

Acknowledgments

We thank all participants in this research as well as the faculty members and students at the Kwame Nkrumah University of Science and Technology, Kumasi, Ghana and the University of Energy and Natural Resources, Sunyani, Ghana that provided support in the field. We thank T. Kepe and C. Abizaid for their insightful and constructive comments on earlier versions of this paper. We thank two anonymous journal reviewers for their comments on the paper. This research was supported by a Social Sciences and Humanities Research Council of Canada Grant to M.E.I.

Author Contributions

K.C. and M.E.I. conceived and designed the study; K.C. and A.K.Q. performed the data collection; K.C. and M.E.I. analyzed the data; A.K.Q. and E.D. contributed field assistance, site access, and logistical support; K.C. wrote the paper.

Conflicts of Interest

The authors declare no conflict of interest.

References

  1. Abson, D.J.; Fraser, E.D.; Benton, T.G. Landscape diversity and the resilience of agricultural returns: A portfolio analysis of land-use patterns and economic returns from lowland agriculture. Agric. Food Secur. 2013, 2, 1–15. [Google Scholar] [CrossRef]
  2. Francis, C.; Lieblein, G.; Gliessman, S.; Breland, T.A.; Creamer, N.; Harwood, R.; Salomonsson, L.; Helenius, J.; Ricker, D.; Salvador, R.; et al. Agroecology: The ecology of food systems. J. Sustain. Agric. 2003, 22, 99–118. [Google Scholar] [CrossRef]
  3. Tomich, T.P.; Brodt, S.; Ferris, H.; Galt, R.; Horwath, W.R.; Kebreab, E.; Leveau, J.H.J.; Liptzin, D.; Lubell, M.; Merel, P.; et al. Agroecology: A review from a global-change perspective. Annu. Rev. Environ. Resour. 2011, 36, 193–222. [Google Scholar] [CrossRef]
  4. Jose, S. Agroforestry for ecosystem services and environmental benefits: An overview. Agroforest. Syst. 2009, 76, 1–10. [Google Scholar] [CrossRef]
  5. Lin, B.B. Resilience in agriculture through crop diversification: Adaptive management for environmental change. BioScience 2011, 61, 183–193. [Google Scholar] [CrossRef]
  6. Kufuor, J.A. Ghana’s Transformation. International Food Policy Research Institute, 2011. Available online: http://ebrary.ifpri.org/utils/getfile/collection/p15738coll2/id/130122/filename/130333.pdf (accessed on 16 May 2016).
  7. Adjei-Nsiah, S.; Kermah, M. Climate change and shift in cropping system: From cocoa to maize based cropping system in Wenchi Area of Ghana. Br. J. Environ. Clim. Chang. 2012, 2, 137–152. [Google Scholar] [CrossRef] [PubMed]
  8. Laube, W.; Schraven, B.; Awo, M. Smallholder adaptation to climate change: Dynamics and limits in Northern Ghana. Clim. Chang. 2012, 111, 753–774. [Google Scholar] [CrossRef]
  9. Ministry of Food and Agriculture. Directorate of Agricultural Extension Services. Agricultural Extension Approaches Being Implemented in Ghana, 2011. Available online: http://mofa.gov.gh/site/wp-content/uploads/2011/03/Extension-approaches-in-Ghana-.pdf (accessed on 16 May 2016).
  10. Asante, B.O.; Afari-Sefa, V.; Sarpong, D.B. Determinants of small scale farmers’ decision to join farmer based organizations in Ghana. Afr. J. Agric. Res. 2011, 6, 2273–2279. [Google Scholar]
  11. Tittonell, P.; Scopel, E.; Andrieu, N.; Posthumus, H.; Mapfumo, P.; Corbeels, M.; van Halsema, G.E.; Lahmar, R.; Lugandu, S.; Rakotoarisoa, J.; et al. Agroecology-based aggradation-conservation agriculture (ABACO): Targeting innovations to combat soil degradation and food insecurity in semi-arid Africa. Field Crops Res. 2012, 132, 168–174. [Google Scholar] [CrossRef]
  12. Franzel, S.C.; Scherr, S.J. Introduction. In Trees on the Farm: Assessing the Adoption Potential of Agroforestry Practices in Africa; Franzel, S.C., Scherr, S.J., Eds.; CABI: Wallingford, UK, 2002; pp. 1–10. [Google Scholar]
  13. Pretty, J. Social capital and the collective management of resources. Science 2003, 302, 1912–1915. [Google Scholar] [CrossRef] [PubMed]
  14. Hoang, L.A.; Castella, J.C.; Novosad, P. Social networks and information access: Implications for agricultural extension in a rice farming community in northern Vietnam. Agric. Hum. Values 2006, 23, 513–527. [Google Scholar] [CrossRef]
  15. Bodin, Ö.; Crona, B. The role of social networks in natural resource governance: What relational patterns make a difference? Glob. Environ. Chang. 2009, 19, 366–374. [Google Scholar] [CrossRef]
  16. Bodin, Ö.; Crona, B.; Ernstson, H. Social networks in natural resource management: What is there to learn from a structural perspective. Ecol. Soc. 2006, 11, r2. [Google Scholar]
  17. Prell, C.; Hubacek, K.; Reed, M. Stakeholder analysis and social network analysis in natural resource management. Soc. Nat. Resour. 2009, 22, 501–518. [Google Scholar] [CrossRef]
  18. Folke, C.; Hahn, T.; Olsson, P.; Norberg, J. Adaptive governance of social ecological systems. Annu. Rev. Environ. Resour. 2005, 30, 441–473. [Google Scholar] [CrossRef]
  19. Udry, C.; Conley, T. Social Networks in Ghana; Yale University Economic Growth Center Discussion Paper (888): New Haven, CT, USA, 2004. [Google Scholar]
  20. Isaac, M.E.; Erickson, B.H.; Quashie-Sam, S.J.; Timmer, V.R. Transfer of knowledge on agroforestry management practices: The structure of farmer advice networks. Ecol. Soc. 2007, 12, 32. [Google Scholar]
  21. Matuschke, I. Evaluating the Impact of Social Networks in Rural Innovation Systems: An Overview; International Food Policy Research Institute: Washington, DC, USA, 2008; Volume 816. [Google Scholar]
  22. Isaac, M.E. Agricultural information exchange and organizational ties: The effect of network topology on managing agrodiversity. Agric. Syst. 2012, 109, 9–15. [Google Scholar] [CrossRef]
  23. Spielman, D.J.; Davis, K.; Negash, M.; Ayele, G. Rural innovation systems and networks: Findings from a study of Ethiopian smallholders. Agric. Hum. Values 2011, 28, 195–212. [Google Scholar] [CrossRef]
  24. Meinzen-Dick, R.; Behrman, J.A.; Pandolfelli, L.; Peterman, A.; Quisumbing, A.R. Gender and social capital for agricultural development. In Gender in Agriculture; Quisumbing, A.R., Meinzen-Dick, R., Raney, T.L., Croppenstedt, A., Behrman, J.A., Peterman, A., Eds.; Springer: Heidelberg, The Netherlands, 2014; pp. 235–266. [Google Scholar]
  25. Carrasco, J.A.; Hogan, B.; Wellman, B.; Miller, E.J. Collecting social network data to study social activity-travel behavior: An egocentric approach. Environ. Plann. B Plann. Des. 2008, 35, 961–980. [Google Scholar] [CrossRef]
  26. Knoke, D.; Yang, S.; Kuklinski, J.H. Social Network Analysis; Sage Publications: Los Angeles, LA, USA, 2008; Volume 2. [Google Scholar]
  27. Hanneman, R.A.; Riddle, M. Introduction to Social Network Methods; University of California: Riverside, CA, USA, 2005. [Google Scholar]
  28. Gould, R.V.; Fernandez, R.M. Structures of mediation: A formal approach to brokerage in transaction networks. Sociol. Methodol. 1989, 19, 89–126. [Google Scholar] [CrossRef]
  29. Isaac, M.E.; Anglaaere, L.C.N.; Akoto, D.; Dawoe, E. Migrant farmers as information brokers: Agroecosystem management in the transition zone of Ghana. Ecol. Soc. 2014, 19, 56. [Google Scholar] [CrossRef]
  30. Borgatti, S.P.; Everett, M.G.; Freeman, L.C. UCINET for Windows: Software for Social Network Analysis; Analytic Technologies: Harvard, MA, USA, 2002. [Google Scholar]
  31. Wood, T.N. Agricultural Development in the Northern Savannah of Ghana; Doctoral Documents from Doctor of Plant Health Program Paper 1; University of Nebraska-Lincoln: Lincoln, NE, USA, 2013; pp. 1–73. [Google Scholar]
  32. Woolcock, M.; Narayan, D. Social capital: Implications for development theory, research, and policy. World Bank Res. Obs. 2000, 15, 225–249. [Google Scholar] [CrossRef]
  33. Antwi-Agyei, P.; Dougill, A.J.; Fraser, E.D.; Stringer, L.C. Characterising the nature of household vulnerability to climate variability: Empirical evidence from two regions of Ghana. Environ. Dev. Sustain. 2013, 15, 903–926. [Google Scholar] [CrossRef]
  34. Burt, R.S. The network structure of social capital. Res. Organ. Behav. 2000, 22, 345–423. [Google Scholar] [CrossRef]
  35. Bodin, Ö.; Norberg, J. Information network topologies for enhanced local adaptive management. Environ. Manag. 2005, 35, 175–193. [Google Scholar] [CrossRef] [PubMed]
  36. Deroian, F. Formation of social networks and diffusion of innovations. Res. Policy 2002, 31, 835–846. [Google Scholar] [CrossRef]
  37. Dzanja, J.L.; Christie, M.; Fazey, I.; Hyde, T. The role of social capital on rural food security: The case study of Dowa and Lilongwe Districts in Central Malawi. Int. J. Agrc. Sci. 2013, 1, 46–56. [Google Scholar] [CrossRef]
  38. Thuo, M.; Bell, A.A.; Bravo-Ureta, B.E.; Lachaud, M.A.; Okello, D.K.; Okoko, E.N.; Kidula, N.L.; Deom, C.M.; Puppala, N. Effects of social network factors on information acquisition and adoption of improved groundnut varieties: The case of Uganda and Kenya. Agric. Hum. Values 2014, 31, 339–353. [Google Scholar] [CrossRef]
  39. Etwire, P.M.; Dogbe, W.; Wiredu, A.N.; Martey, E.; Etwire, E.; Owusu, R.K.; Wahaga, E. Factors Influencing Farmer’s Participation in Agricultural Projects: The case of the Agricultural Value Chain Mentorship Project in the Northern Region of Ghana. J. Econ. Sustain. Dev. 2013, 4, 36–43. [Google Scholar]
  40. Hashmiu, I. Farming Carbon in Ghana’s Transition Zone. In Carbon Conflicts and Forest Landscapes in Africa; Leach, M., Scoones, I., Eds.; Routledge: New York, NY, USA, 2015; pp. 163–179. [Google Scholar]
  41. Rosengren, L. Planted Forests and Trees Can Restore Landscapes and Alleviate Poverty. In A Goal-Oriented Approach to Forest Landscape Restoration; Springer: Dordrecht, The Netherlands, 2012; pp. 443–463. [Google Scholar]
  42. Läderach, P.; Martinez-Valle, A.; Schroth, G.; Castro, N. Predicting the future climatic suitability for cocoa farming of the world’s leading producer countries, Ghana and Côte d’Ivoire. Clim. Chang. 2013, 119, 841–854. [Google Scholar] [CrossRef]
  43. Djagbletey, G.D.; Adu-Bredu, S. Adoption of agroforestry by small scale teak farmers in Ghana-the case of Nkoranza District. Ghana J. For. 2007, 20, 1–13. [Google Scholar]
  44. Agbenyega, O.; Gyiele, L.; Odame, H.H. Enabling Innovation: Gender and Agroforestry in Sunyani, Ghana. Available online: http://www.uoguelph.ca/~ghanauog/enablinginnovation.pdf (accessed on 16 May 2016).
  45. Kiptot, E.; Franzel, S. Gender and agroforestry in Africa: Who benefits? The African perspective. In Agroforestry-The Future of Global Land Use; Ramachandran Nair, P.K., Garrity, D., Eds.; Springer: Dordrecht, The Netherlands, 2012; Volume 9, pp. 463–496. [Google Scholar]
  46. APERL (Agroforestry Practices to Enhance Resource-Poor Livelihoods) Project Implementation Plan 2007. Department of Environmental Biology: University of Guelph. Available online: http://www.uoguelph.ca/~ghanauog/workplan.pdf (accessed on 16 May 2016).
  47. Doss, C.R.; Morris, M.L. How does gender affect the adoption of agricultural innovations? Agric. Econ. 2000, 25, 27–39. [Google Scholar] [CrossRef]
Figure 1. Examples of crop-specific sociograms for a project-affiliated male ego (starting point respondent), including network members that are two steps from the ego. Knowledge network composition and size is distinctly variable across network type, where the food crop and cash crop knowledge networks ((a) and (c)) are largest, followed by the timber tree network (b), which is smaller.
Agriculture 06 00032 g001
Table 1. Mean (±SE) network structure and farmer positionality values for affiliated and non-affiliated farmers in the Transition and Humid regions.
Network and Positionality CharacteristicsRegions
TransitionHumid
Affiliated
(n = 26)
Non-Affiliated
(n = 40)
p Value ***Affiliated
(n = 32)
Non-Affiliated
(n = 33)
p Value
StructureNetwork Size (N) *9.2 ± 3.85.8 ± 3.20.00038.9 ± 4.36.2 ± 2.50.0025
Indegree3.0 ± 2.11.8 ± 1.50.00492.7 ± 2.81.7 ± 0.90.0530
Outdegree7.6 ± 3.64.9 ± 2.70.00087.3 ± 3.65.6 ± 2.40.0340
Ties9.9 ± 8.23.7 ± 4.10.00029.0 ± 9.23.0 ± 3.00.0003
Density14.7 ± 12.413.4 ± 17.50.782221.1 ± 47.212.3 ± 14.50.4060
PositionalityBetweenness **19.8 ± 10.820.8 ± 13.00.735614.1 ± 10.219.8 ± 13.70.0669
Coordinator **0.5 ± 0.80.5 ± 0.70.9725---
Gatekeeper **0.7 ± 1.12.4 ± 2.30.0004---
% of Network Members that are Project Affiliated43.7 ± 31.730.6 ± 31.80.1047---
% of Network Members that Reside outside of the Community33.6 ± 20.338.8 ± 30.90.458550.2 ± 23.330.7 ± 24.80.0015
* Respondent not included; ** Betweenness, Coordinator and Gatekeeper values are normalized (relative to the network sizes); *** All p values calculated using UCINET T-test (10,000 random permutations) with project affiliation status (affiliated or non-affiliated) considered as an independent variable and with network and positionality characteristics considered as dependent variables.
Table 2. Mean (±SE) network structure and farmer positionality values for male and female farmers in the Transition and Humid regions.
Network and Positionality CharacteristicsRegions
TransitionHumid
Female
(n = 25)
Male
(n = 41)
p Value ***Female
(n = 18)
Male
(n = 47)
p Value
StructureNetwork Size (N) *6.0 ± 3.37.9 ± 4.00.04416.8 ± 3.57.8 ± 3.80.3277
Indegree2.1 ± 2.12.4 ± 1.70.49671.6 ± 1.72.4 ± 2.20.2168
Outdegree5.3 ± 2.96.5 ± 3.50.17386.6 ± 3.36.4 ± 3.10.8623
Ties5.4 ± 7.46.6 ± 6.30.50184.2 ± 3.86.6 ± 8.30.2614
Density17.7 ± 21.911.6 ± 9.60.125115.6 ± 15.817.1 ± 39.80.9224
PositionalityBetweenness **19.7 ± 14.920.8 ± 10.20.716915.3 ± 15.917.6 ± 10.80.5115
Coordinator **0.9 ± 1.31.5 ± 1.00.06650.2 ± 0.41.4 ± 1.00.0001
Gatekeeper **0.5 ± 0.91.2 ± 1.70.05530.3 ± 1.11.2 ± 1.50.0239
% of Network Members that Reside outside of the Community30.0 ± 26.140.9 ± 27.30.112532.1 ± 27.343.4 ± 24.90.1151
* Respondent not included; ** Betweenness, Coordinator and Gatekeeper values are normalized (relative to the network sizes); *** All P values calculated using UCINET T-test (10,000 random permutations) with gender considered as an independent variable and with network and positionality characteristics considered as dependent variables.
Table 3. Mean (±SE) network structure and farmer positionality values for crop-specific management in the Transition and Humid regions *.
Network and Positionality CharacteristicsRegions
TransitionHumid
Network TypeNetwork Type
Timber Trees
(n = 10)
Food Crops
(n = 12)
Cash Crops
(n = 8)
p Value ‡Timber Trees
(n = 7)
Food Crops
(n = 12)
Cash Crops
(n = 12)
p Value
StructureNetwork Size (N, one step from respondent) **2.7 ± 1.34.0 ± 2.82.9 ± 1.60.51331.7 ± 1.13.4 ± 2.15.1 ± 2.50.0030
Network Size (N, two steps from respondent) **4.7 ± 3.310.2 ± 8.38.3 ± 8.00.27312.9 ± 1.78.8 ± 6.012.5 ± 6.60.0044
Indegree ***0.3 ± 0.51.0 ± 1.10.4 ± 0.50.11180.0 ± 0.00.5 ± 0.51.3 ± 1.20.0092
Outdegree ***2.7 ± 1.34.0 ± 2.82.9 ± 1.60.50531.7 ± 1.13.4 ± 2.15.1 ± 2.50.0030
Ties ***0.5 ± 0.91.3 ± 1.81.0 ± 1.50.70430.1 ± 0.41.1 ± 2.93.2 ± 4.20.0848
Density ***7.7 ± 16.04.0 ± 6.39.2 ± 15.10.72612.4 ± 6.33.3 ± 6.710.1 ± 7.50.0142
PositionalityNormalized Betweenness ***6.7 ± 14.118.5 ± 21.16.3 ± 12.40.15680.0 ± 0.010.3 ± 15.716.7 ± 17.70.0906
% of Project-Affiliated Network Members †36.1 ± 27.320.4 ± 17.332.6 ± 32.80.0446----
% of Female Network Members †38.6 ± 43.848.8 ± 34.323.5 ± 23.50.052045.0 ± 32.030.8 ± 18.722.9 ± 15.10.2657
% of Network Members that Reside
Outside of the Community †
39.4 ± 23.525.5 ± 21.746.3 ± 22.60.171823.6 ± 22.821.3 ± 18.634.8 ± 20.20.4239
* includes initial focal node (starting point) respondent networks only; ** Respondent not included. A one-step network includes only those that are directly connected to the respondent. A two-step network includes those that are directly connected to the respondent and those that the respondent is indirectly connected to via their direct connections (i.e., the direct connections of the direct connections of the respondent); *** Based on the 1-step network; † Based on the 2-step network; ‡ All P values calculated using UCINET ANOVA test (5000 random permutations) with crop category values considered as independent variables and with network and positionality characteristics considered as a dependent variables (Figure 1 and Table 3 here).
Table 4. Types of knowledge received by farmers across affiliation and by gender.
Type of Knowledge Received*Total Number of Farmers **% of Farmers
AffiliatedNon-AffiliatedFemaleMale
Application of pesticide and herbicide2167334357
Planting techniques (planting seedling out of bag, distance, sewing seeds, transplanting, planting on mounds…)2162381981
Variety to species1759414753
Pricing/Marketing of crops1567334753
Pests/Disease control1060406040
Crop management (weeding, pruning, managing land to avoid fallow…)989113367
Planting schedule580208020
Sourcing seedlings/seeds450502575
Farm expansion425752575
Intercropping techniques310003367
* Knowledge categories identified by farmer interviewees; ** Knowledge category only listed if it was mentioned by at least three interviewees during semi-structured interviews. Individual interviewees may have listed multiple knowledge categories.

