Article

Accurate Parcel Extraction Combined with Multi-Resolution Remote Sensing Images Based on SAM

1
Aerospace Information Research Institute, Chinese Academy of Sciences, Beijing 100101, China
2
University of Chinese Academy of Sciences, Beijing 100049, China
*
Authors to whom correspondence should be addressed.
Agriculture 2025, 15(9), 976; https://doi.org/10.3390/agriculture15090976
Submission received: 20 March 2025 / Revised: 17 April 2025 / Accepted: 27 April 2025 / Published: 30 April 2025
(This article belongs to the Topic Digital Agriculture, Smart Farming and Crop Monitoring)

Abstract

Accurately extracting parcels from satellite images is crucial in precision agriculture. Traditional edge detection fails in complex scenes with difficult post-processing, and deep learning models are time-consuming in terms of sample preparation and less transferable. Based on this, we designed a method combining multi-resolution remote sensing images based on the Segment Anything Model (SAM). Using cropland masking, overlap prediction and post-processing, we achieved 10 m-resolution parcel extraction with SAM, with performance in plain areas comparable to existing deep learning models (P: 0.89, R: 0.91, F1: 0.91, IoU: 0.87). Notably, in hilly regions with fragmented cultivated land, our approach even outperformed these models (P: 0.88, R: 0.76, F1: 0.81, IoU: 0.69). Subsequently, the 10 m parcels results were utilized to crop the high-resolution image. Based on the histogram features and internal edge features of the parcels, used to determine whether to segment downward or not, and at the same time, by setting the adaptive parameters of SAM, sub-meter parcel extraction was finally realized. Farmland boundaries extracted from high-resolution images can more accurately characterize the actual parcels, which is meaningful for farmland production and management. This study extended the application of deep learning large models in remote sensing, and provided a simple and fast method for accurate extraction of parcels boundaries.

1. Introduction

Cropland constitutes a fundamental resource and is essential for human survival and development. The advent of precision agriculture technologies facilitates personalized management for individual cropland parcels, thereby significantly augmenting their productivity [1]. In this context, the precise delineation of farmland boundaries becomes a critical task in precision agriculture. Currently, farm boundaries are divided into two categories: one is arable land boundaries, which are fixed and considered hard boundaries, such as forest networks, field ridges, and roads. The other category is crop boundaries, which change with the variation in planted crops and are classified as soft boundaries [2]. Traditional farmland mapping methods, which are reliant on ground surveys, are notably time-intensive and laborious. Currently, satellite observation can provide a vast amount of remote sensing imagery, with medium-to-high-resolution satellite imagery emerging as a primary data source for accurately extracting farmland parcels [3].
On remote sensing images, differences in spectral and textural characteristics exist between farmland boundaries and the interior of farmland, providing theoretical support for the extraction of farmland parcels. Conventional methods of parcel extraction primarily involve characteristic feature thresholds [4], region extraction [5,6], and edge detection [7,8]. While these methodologies have yielded certain advancements, their limitations are pronounced. For instance, region-based extraction requires repeated experimentation to determine the optimal threshold. Edge detection is highly sensitive to the type of filters used [9]. Additionally, these algorithms cannot generate closed parcel boundaries, necessitating post-processing for parcel generation [3]. Moreover, as the resolution of remote sensing imagery continues to increase, the complexity and uncertainty render these methods ineffective in obtaining satisfactory results.
In recent years, deep learning has made significant advances in feature extraction and image segmentation, providing a new approach for parcel extraction [10,11]. Researchers deploying deep learning models for this task generally align with two predominant paradigms. The first paradigm approaches parcel extraction from the perspective of edge detection, with the aim of delineating parcel boundaries [12,13,14]. The second paradigm describes parcel extraction as an image segmentation problem, directly characterizing boundaries by extracting farmland parcels [15,16]. Additionally, some studies have developed multi-task deep learning frameworks [17,18]. These frameworks handle the extraction of parcels and their boundaries at the same time. Then, specific post-processing techniques are used to synthesize these predictive outputs, so as to construct complete parcel representations.
At present, deep learning models have demonstrated superior performance compared to traditional parcel extraction methods. However, training such models typically requires large numbers of samples, and building a sample dataset is undoubtedly a time-consuming and labor-intensive task [19]. During the process of annotating samples, the limitations imposed by image clarity and the absence of ground references can easily lead to boundary omission, undoubtedly impacting the effectiveness of the model [20,21]. Furthermore, due to the limited training data, models trained often only apply to specific regions, or even specific temporal conditions. When applied to different regions or time periods, or when using different sensors, the predictive performance of the model will decrease [22,23]. In addition, current parcel extraction methods tend to work only with remote sensing imagery of a specific resolution, yet parcel sizes vary across landscapes, necessitating varying resolutions for accurate extraction.
In the realm of image segmentation, the Segment Anything Model (SAM), as established by Meta AI, represents a breakthrough in the field. Its architecture primarily comprises three components: an image encoder for calculating image embeddings, a hint encoder for embedding hints, and a mask decoder for predicting segmentation masks. Through a meticulously structured data engine, Meta Company has orchestrated the annotation process across three iterative phases: starting with assisted manual annotation, advancing to semi-automatic annotation, and culminating in fully automatic annotation. This process led to the creation of a large and diverse image segmentation dataset, encompassing natural scenes, urban environments, medical images, and satellite imagery. The dataset includes 11 million images and over 1 billion masks [24]. SAM’s design, combined with this expansive dataset, endows it with potent zero-shot generalization capabilities. This implies that SAM can provide reliable predictions for images not encountered in the training set. The capability of SAM in the field of medical imaging and remote sensing has already been demonstrated [25,26,27,28]. Moreover, recent studies have successfully applied SAM for parcel extraction [29,30,31].
In summary, parcel extraction using deep learning faces several significant challenges, including the need for large training datasets, poor generalization across different regions, sensors, and temporal conditions, and difficulties in adapting to the varied characteristics of farmland landscapes. To overcome these limitations, we proposed a novel approach that integrated SAM with multi-resolution remote sensing imagery to extract parcels. Our approach integrates SAM’s zero-shot segmentation capabilities, a cropland mask, and overlapping prediction techniques. This eliminates the need for labor-intensive sample creation and enables fast, accurate parcel extraction across diverse temporal, geographical, and sensor contexts. In addition, considering the diversity of farmland landscapes, we have designed a technique that integrates images of multiple resolutions for parcel extraction. Through this technique, we apply the outcomes of parcel extraction from lower-resolution images to higher-resolution datasets, and employ a threshold-based decision process to determine the necessity for additional segmentation. This approach facilitates meticulous parcel extraction even within complex agricultural settings.

2. Materials and Methods
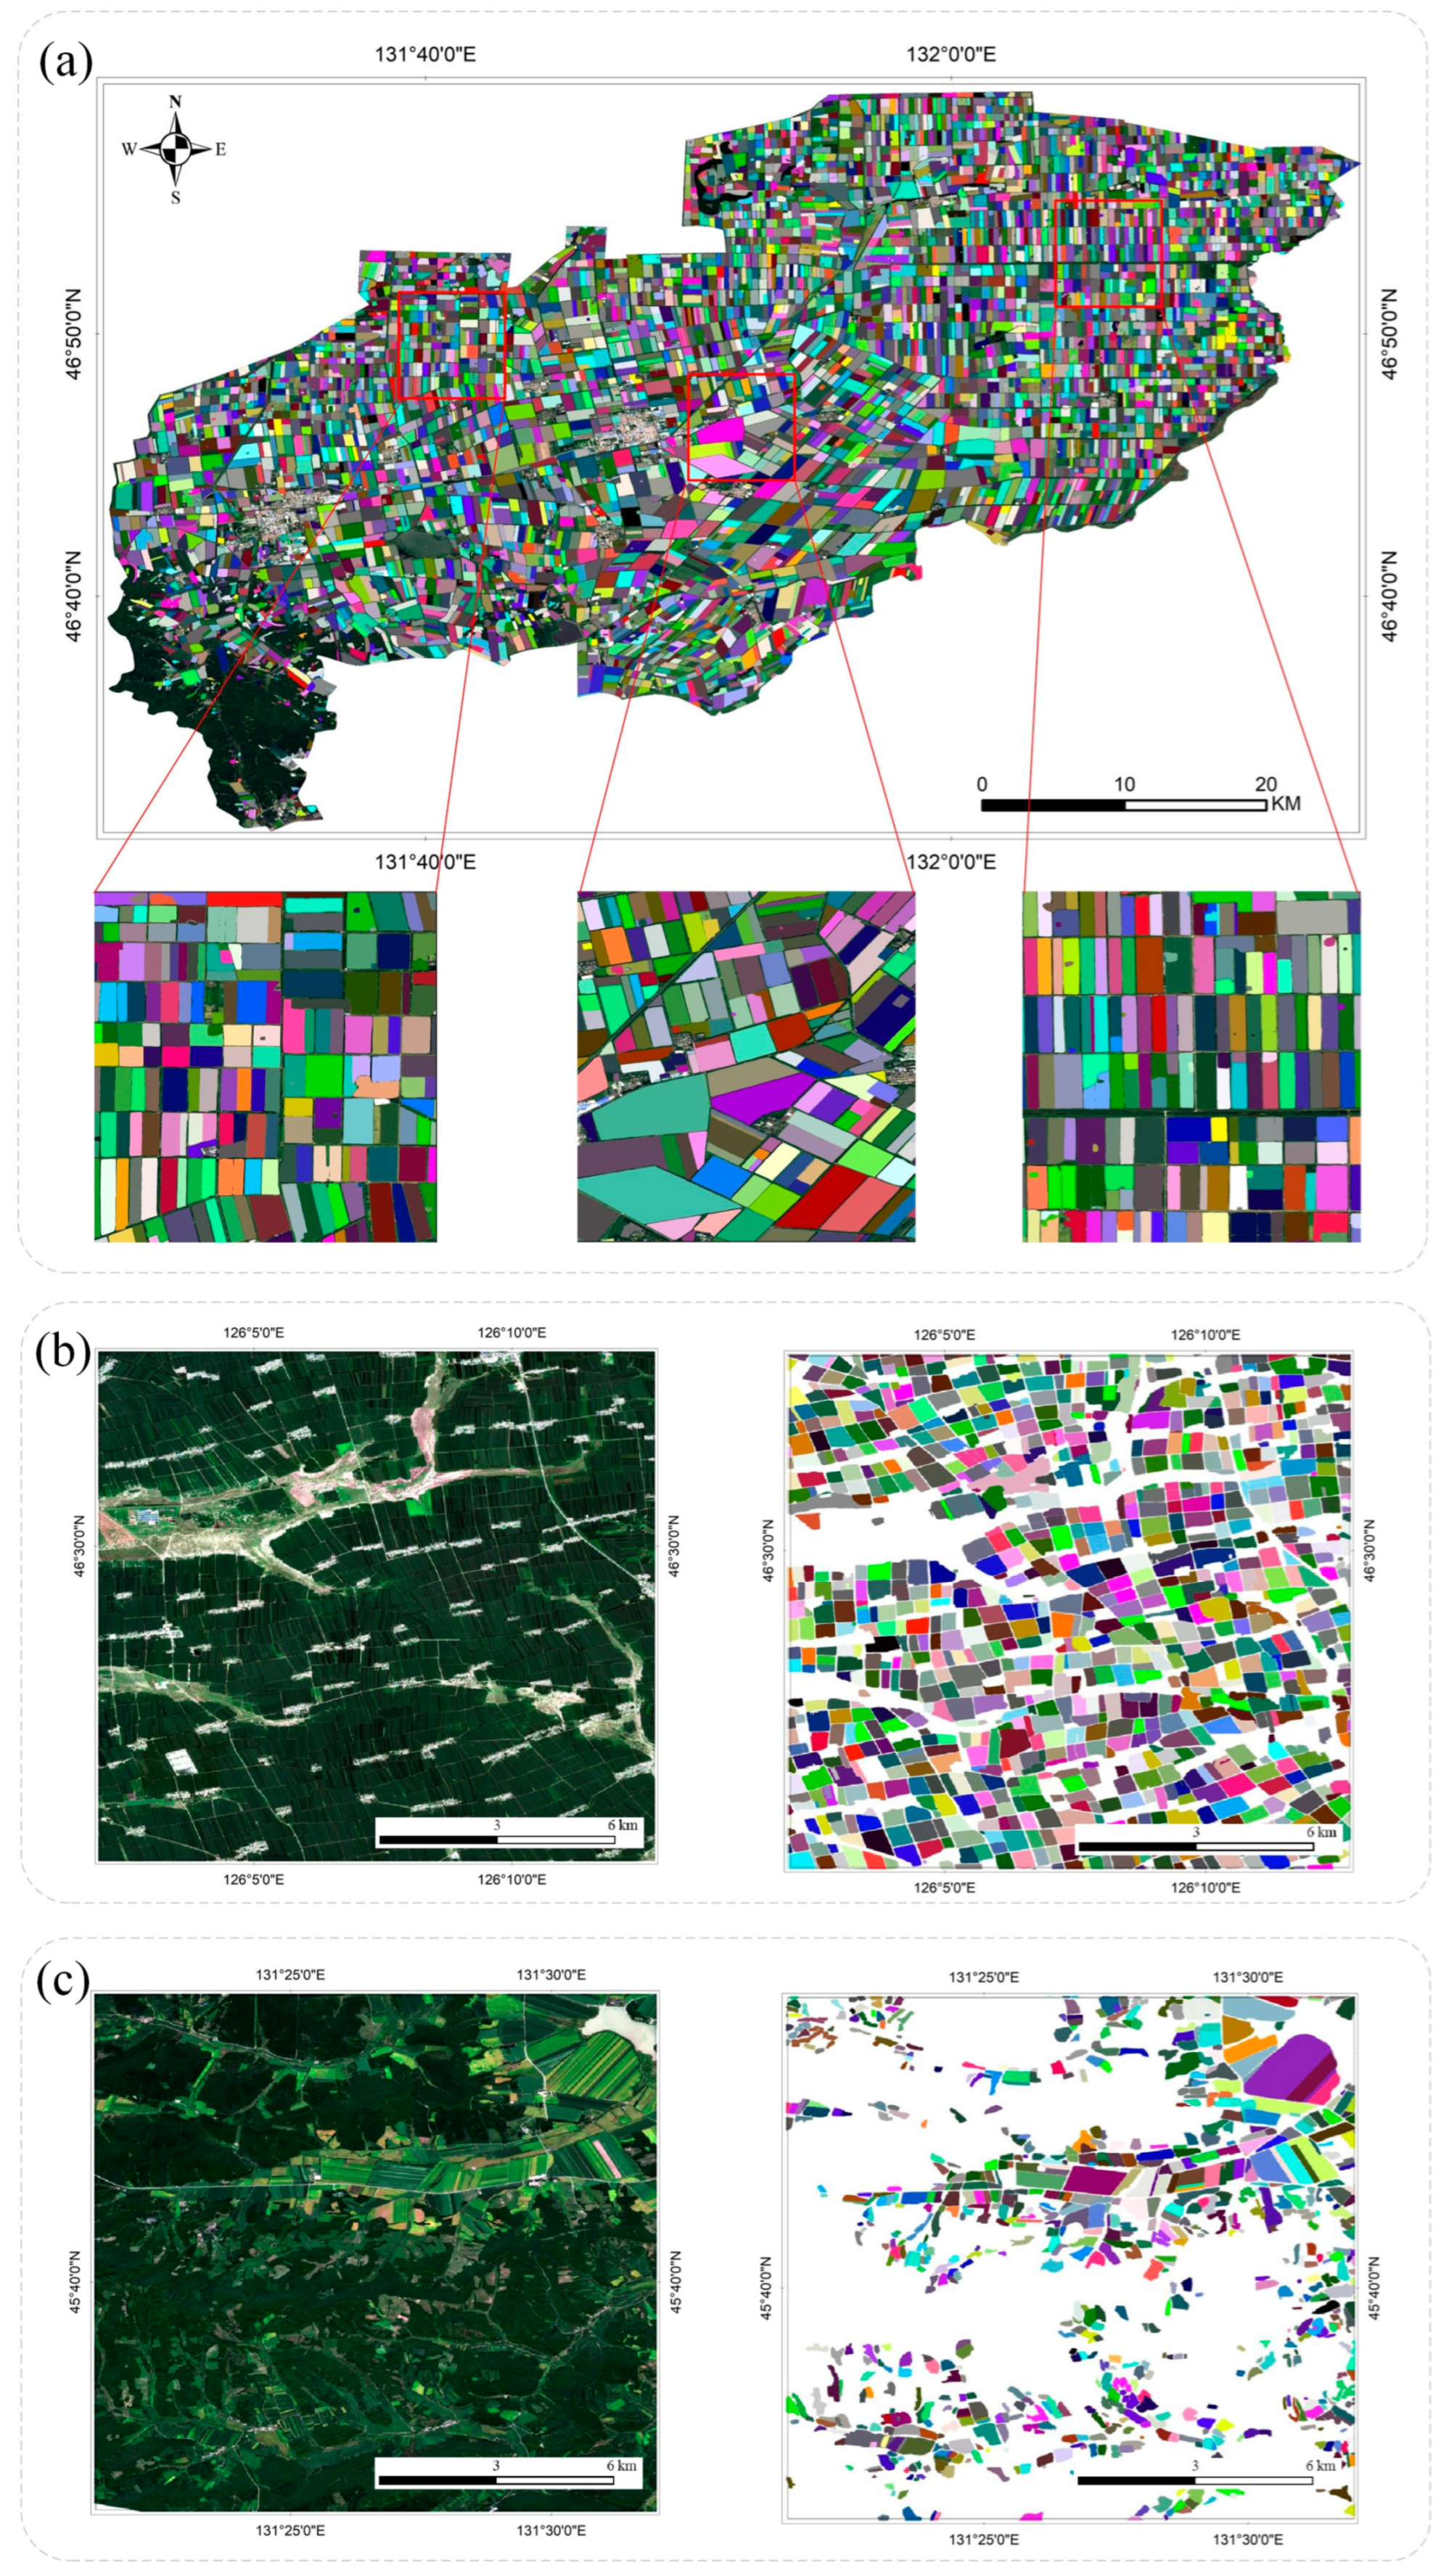
2.1. Study Areas

The main study area is in Youyi County, Heilongjiang Province. Youyi County is situated in the northeastern part of Heilongjiang Province, in the hinterland of the Sanjiang Plain. The overall terrain is relatively flat, with hills in the southwest and plains in the northeast. The region features a temperate continental climate. The unique geographical and climatic conditions make Youyi County one of the important commodity grain bases and the demonstration window of modern agriculture in China. The cultivated area of Youyi County accounts for about 78% of the county, and the main crops are corn, soybean, and rice. The large cultivated area, diverse agricultural scenes, and different parcel sizes make it a primary choice for our study area.
To demonstrate the generalizability of our method, we identified two additional study areas within Heilongjiang Province, chosen for their distinct topographical features and crop cultivation patterns in contrast to those of Youyi County. They are located in the southern part of Suihua City (A1) and the western part of Jixi City (A2), Heilongjiang Province, where the topography of A2 is dominated by hilly and mountainous terrain, with large undulations and parcels of varying sizes. The main crops planted are maize and rice, while the topography of A1 is flatter, with larger parcels, and the main crop planted is maize (the region of study areas is shown in Figure 1).

2.2. Data

2.2.1. Satellite Data and Preprocessing

Data from Sentinel-2 and GF-7 were used in this study, and the specific information is shown in Table 1.
  • Sentinel-2 data
Sentinel-2 consists of Sentinel-2A and Sentinel-2B, launched in 2015 and 2017, respectively. Both satellites carry a multispectral imaging instrument covering 13 bands from visible light to near-infrared and shortwave infrared, with a maximum spatial resolution of 10 m. After the two satellites are networked, the revisit period is shortened to 5 days. Given the rich band configuration, excellent spatial resolution, and shortened revisit period, Sentinel-2 data were selected as the data source for parcel extraction.
Google Earth Engine (GEE) was used to download Sentinel images for our study areas. A cloud-free dataset was imperative for our analysis; hence, we ensured that the selected images for Youyi County, A1, and A2 each exhibited cloud cover of less than 1%. After stitching, the images were exported as PNG images in a false color combination.
  • GF-7 data
GF-7, launched by China on 3 November 2019, is a high-resolution Earth observation satellite. The satellite is equipped with effective payloads such as a dual-line array stereo camera and a laser rangefinder. Its panchromatic and multispectral resolutions are 0.65 m and 2.65 m, respectively, enabling sub-meter-level stereo mapping. In this study, all GF-7 images had less than 1% cloudiness, and pre-processing such as geographic alignment and cropping was performed to ensure that they could be matched with the Sentinel-2 images.

2.2.2. Auxiliary Data

In conjunction with satellite imagery, this study incorporated a land use dataset provided by ESRI. This dataset was generated by ESRI using Sentinel imagery with a resolution of 10 m. It was trained using deep learning methods on images labeled by people from the National Geographic Society [32]. The dataset includes 11 land use categories. After downloading the data, preprocessing steps such as cropping and resampling were applied to convert it into binary data representing cropland and non-cropland.

2.3. Method

This study combined SAM with overlap prediction, cropland masking, and post-processing to extract 10 m parcels. Then, 0.65 m imagery was used to assess the internal complexity of each parcel through histogram and edge features, determining the need for further segmentation. The accuracy was enhanced through histogram equalization and adaptive parameter settings, ultimately yielding 0.65 m parcel results. The final parcel mapping was achieved by combining results from both resolutions. The overall experimental flow is shown in Figure 2.

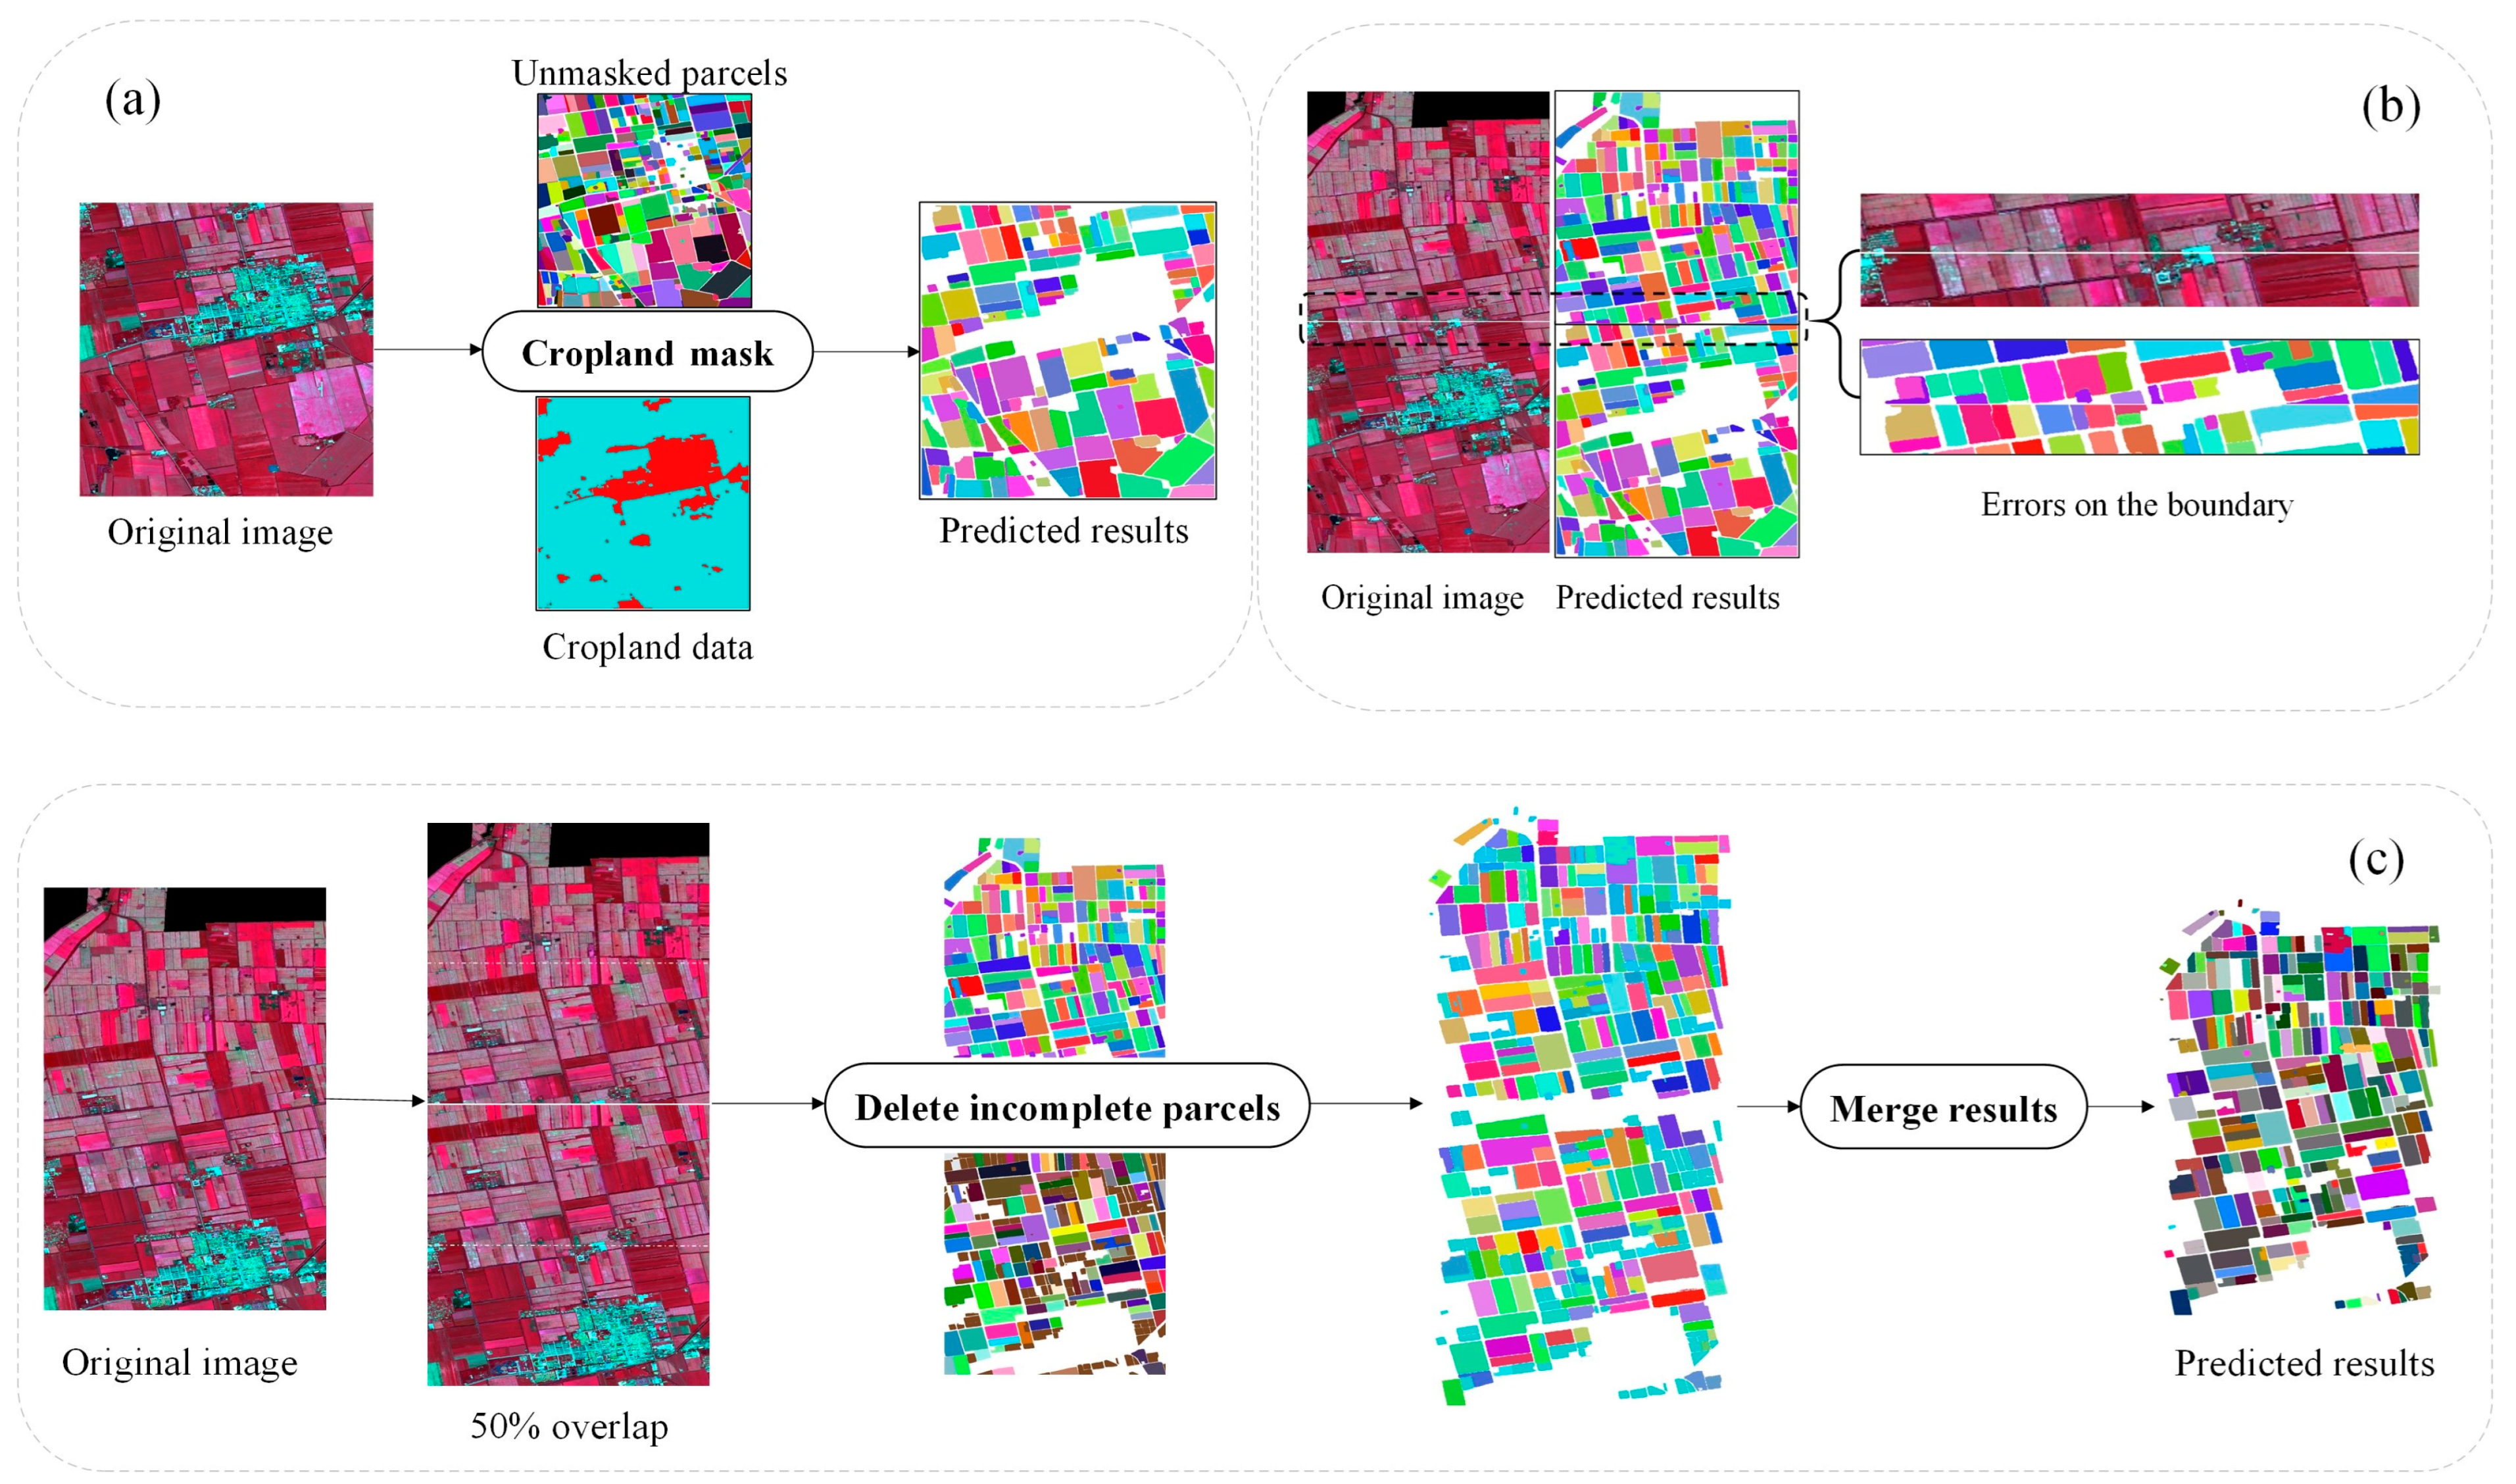
2.3.1. Sentinel-2 Image Parcel Extraction

  • Cropland mask
SAM has three versions of pre-trained models, namely vit-b, vit-l, and vit-h. In this study, the lightest vit-b model was employed for the extraction of the targets. This extraction process indiscriminately extracts and labels all identifiable objects within the imagery, which includes urban areas, water bodies, forests, and other land covers. These are not relevant to our study, which focuses on farmland parcels. To address this, we have introduced a cropland mask to filter SAM’s prediction outputs. This masking process is instrumental in excluding non-cropland areas from the segmented results, isolating the agricultural parcels of interest. The effectiveness of this technique is evident in Figure 3a, where it is shown that the application of the cropland mask successfully eliminates regions outside the scope of cropland. Consequently, this selective exclusion significantly enhances the precision of our parcel extraction, as the focus is narrowed down solely to the farmland areas.
  • Overlap prediction
Satellite images, unlike those from natural scenes, are typically of large sizes. Therefore, it is common practice to slice these images before feeding them into the model and then stitch together the predictions. As shown in Figure 3b, when images are cut and predicted without any overlap, errors tend to occur at the junction of two adjacent cut images during the result merging process. Moreover, during prediction, SAM assigns a value to each segmented object. Consequently, if the same parcel is divided into two images, it will yield two values for the same parcel, leading to errors. To tackle these challenges, this study employs an overlap prediction method.
Specifically, the Sentinel-2 images (with 10 m spatial resolution) of the study areas were set to have a 50% overlap and were cut into 1024 × 1024 pixel tiles (corresponding to 10.24 × 10.24 km) for prediction. During the prediction process, incomplete parcels located at the edges of the image were removed. It is important to note that the prediction results of SAM may exhibit subtle pixel-level differences for the same image. To address this, we merged the overlapping areas by identifying differences and removing small areas. By setting the appropriate overlap degree for cutting, predicting, and merging, we ensured the integrity of the parcels and enhanced the accuracy of the prediction results (refer to Figure 3c). Finally, the results of the 10 m parcels were obtained.

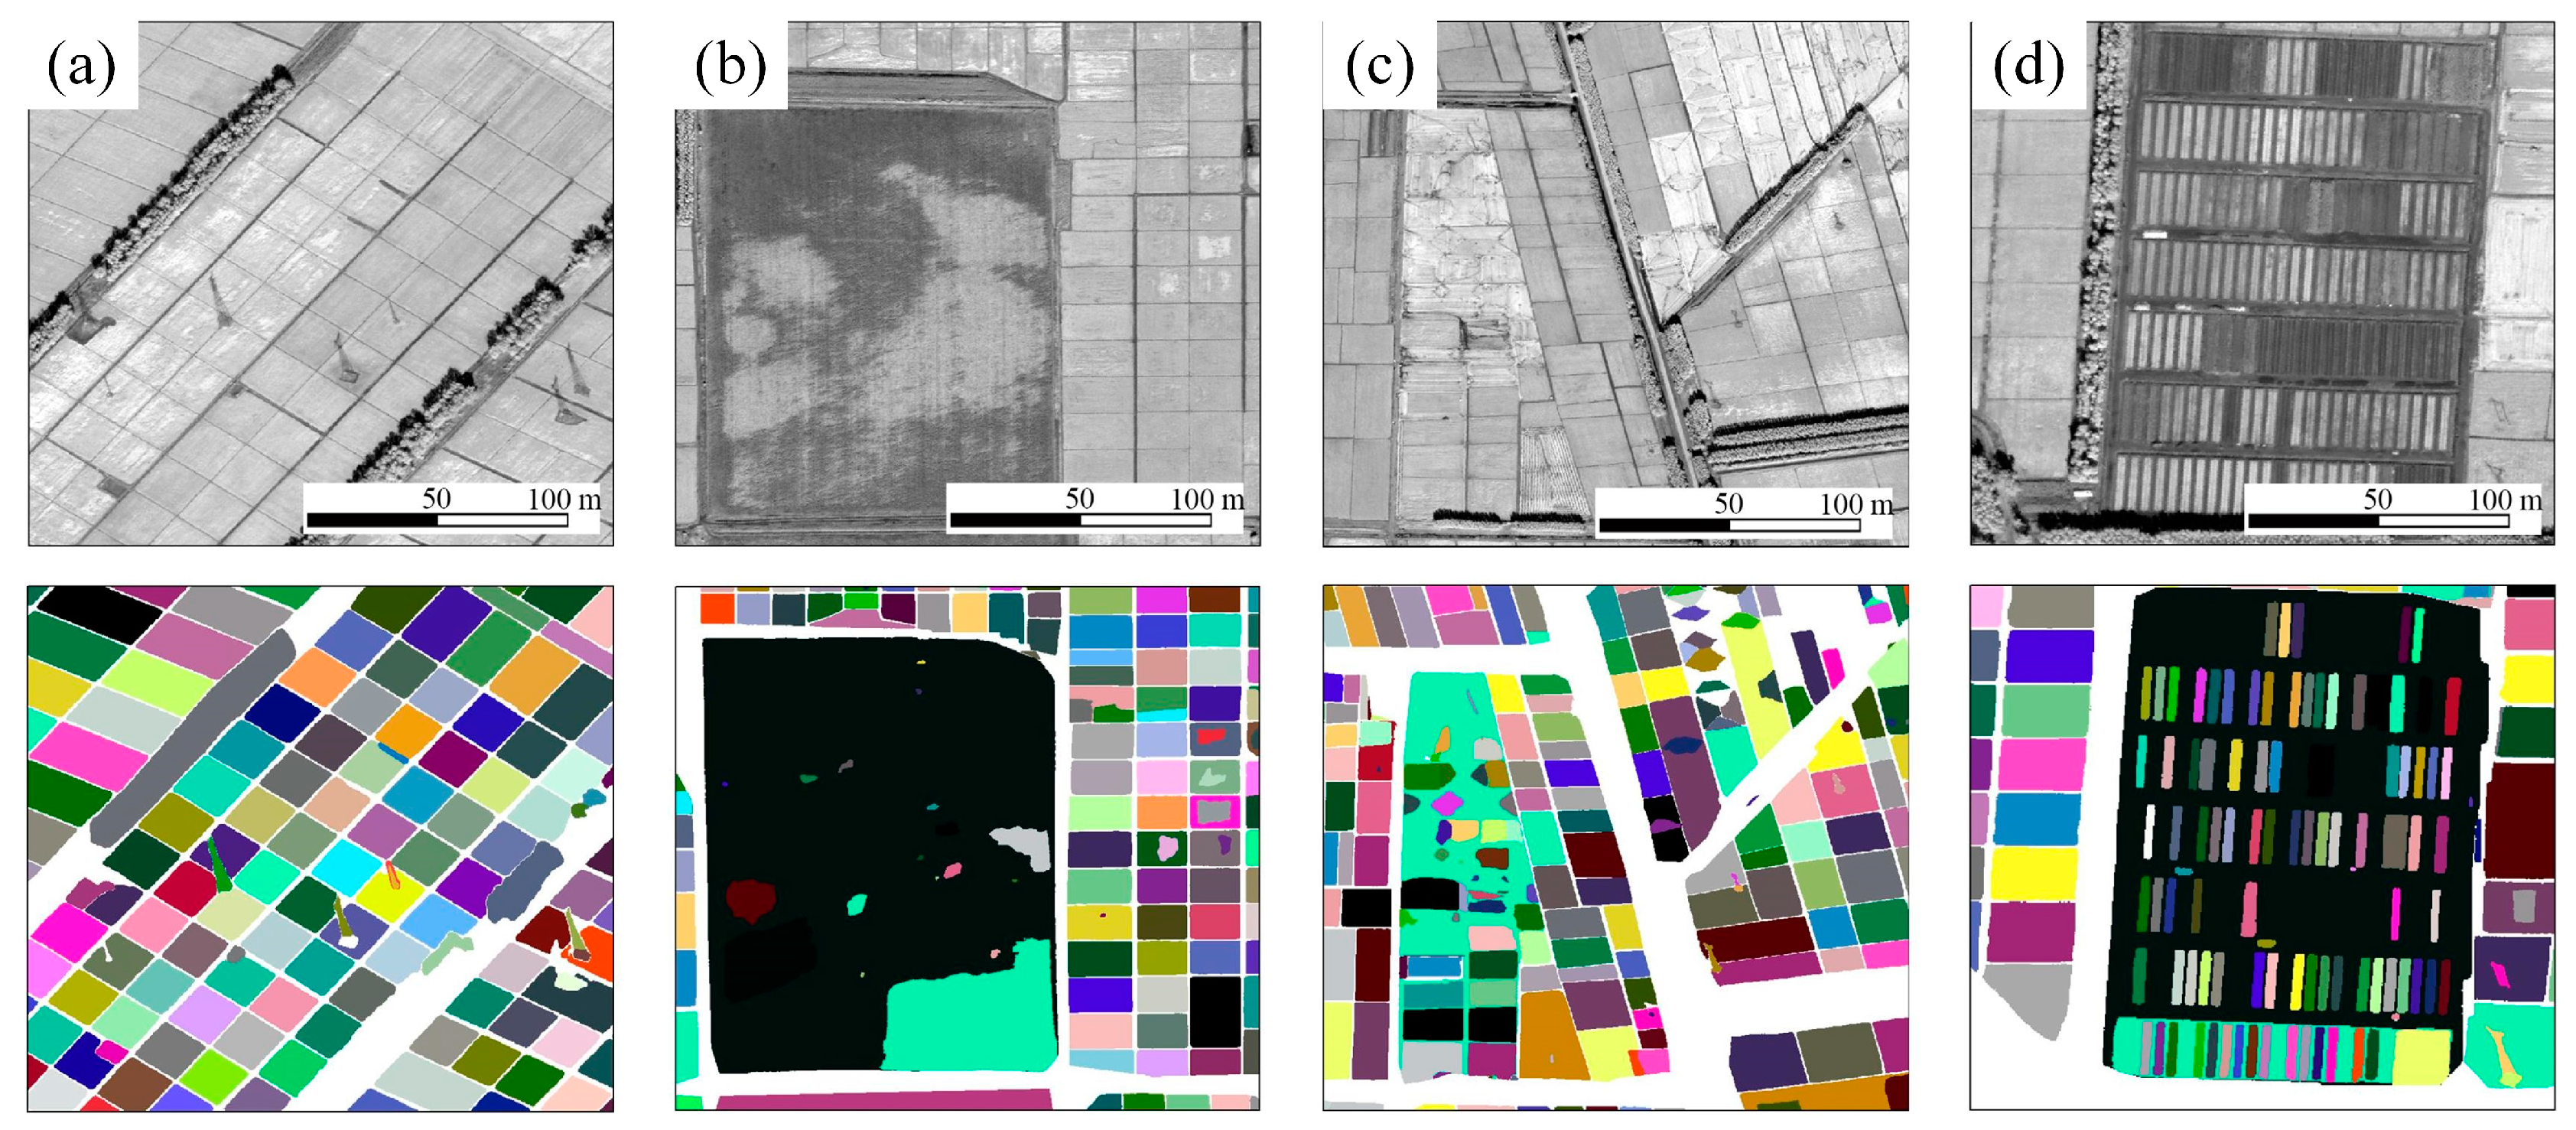
2.3.2. GF-7 Image Parcel Extraction

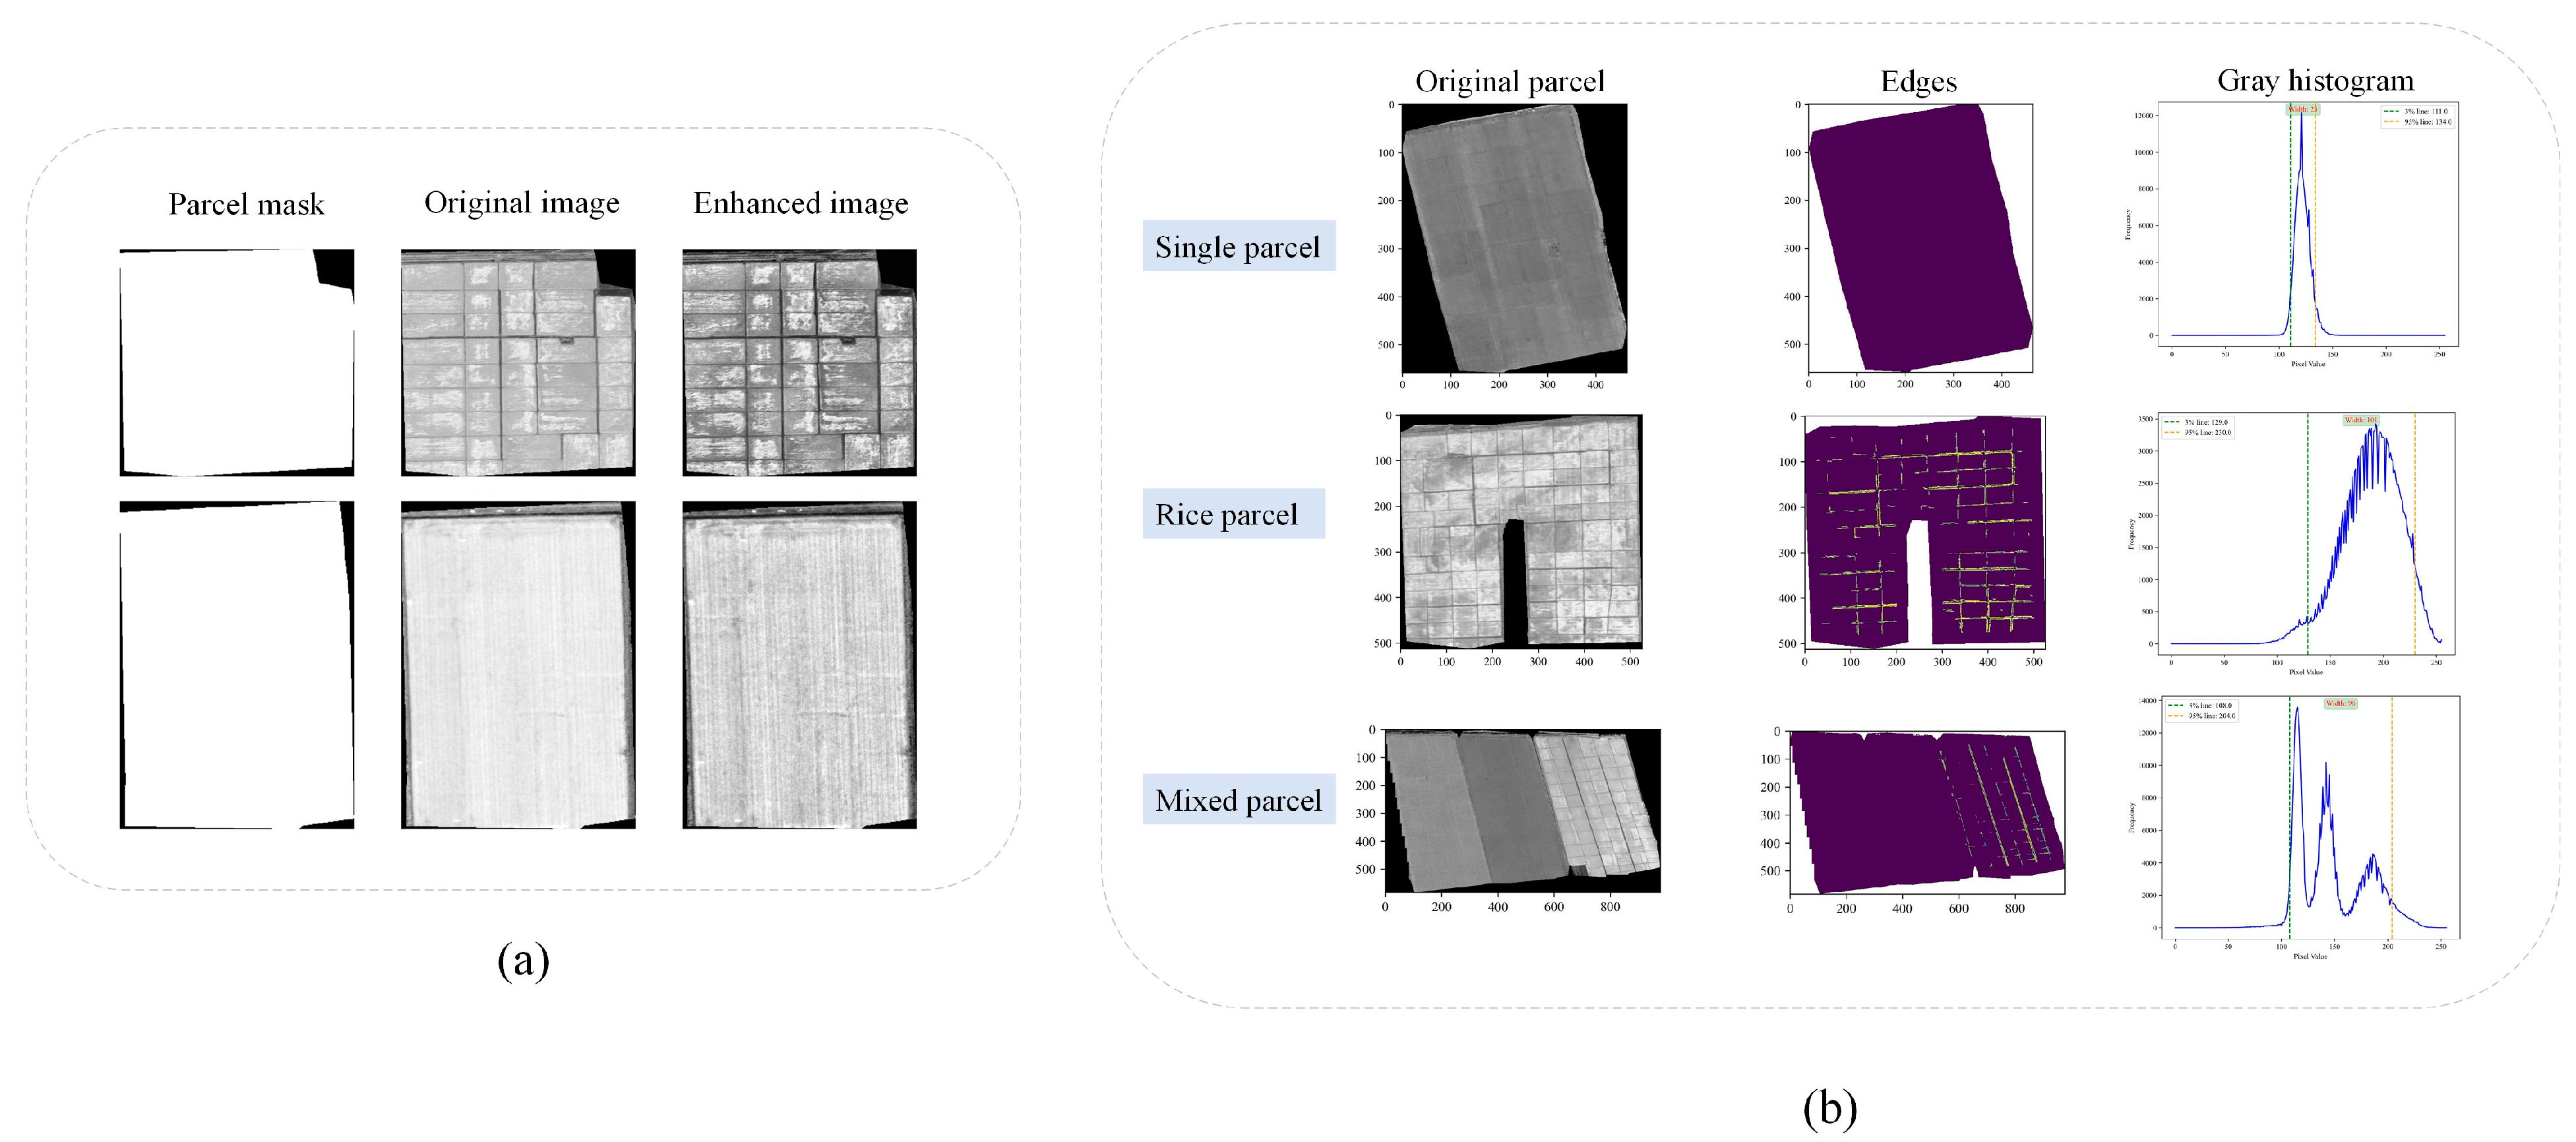
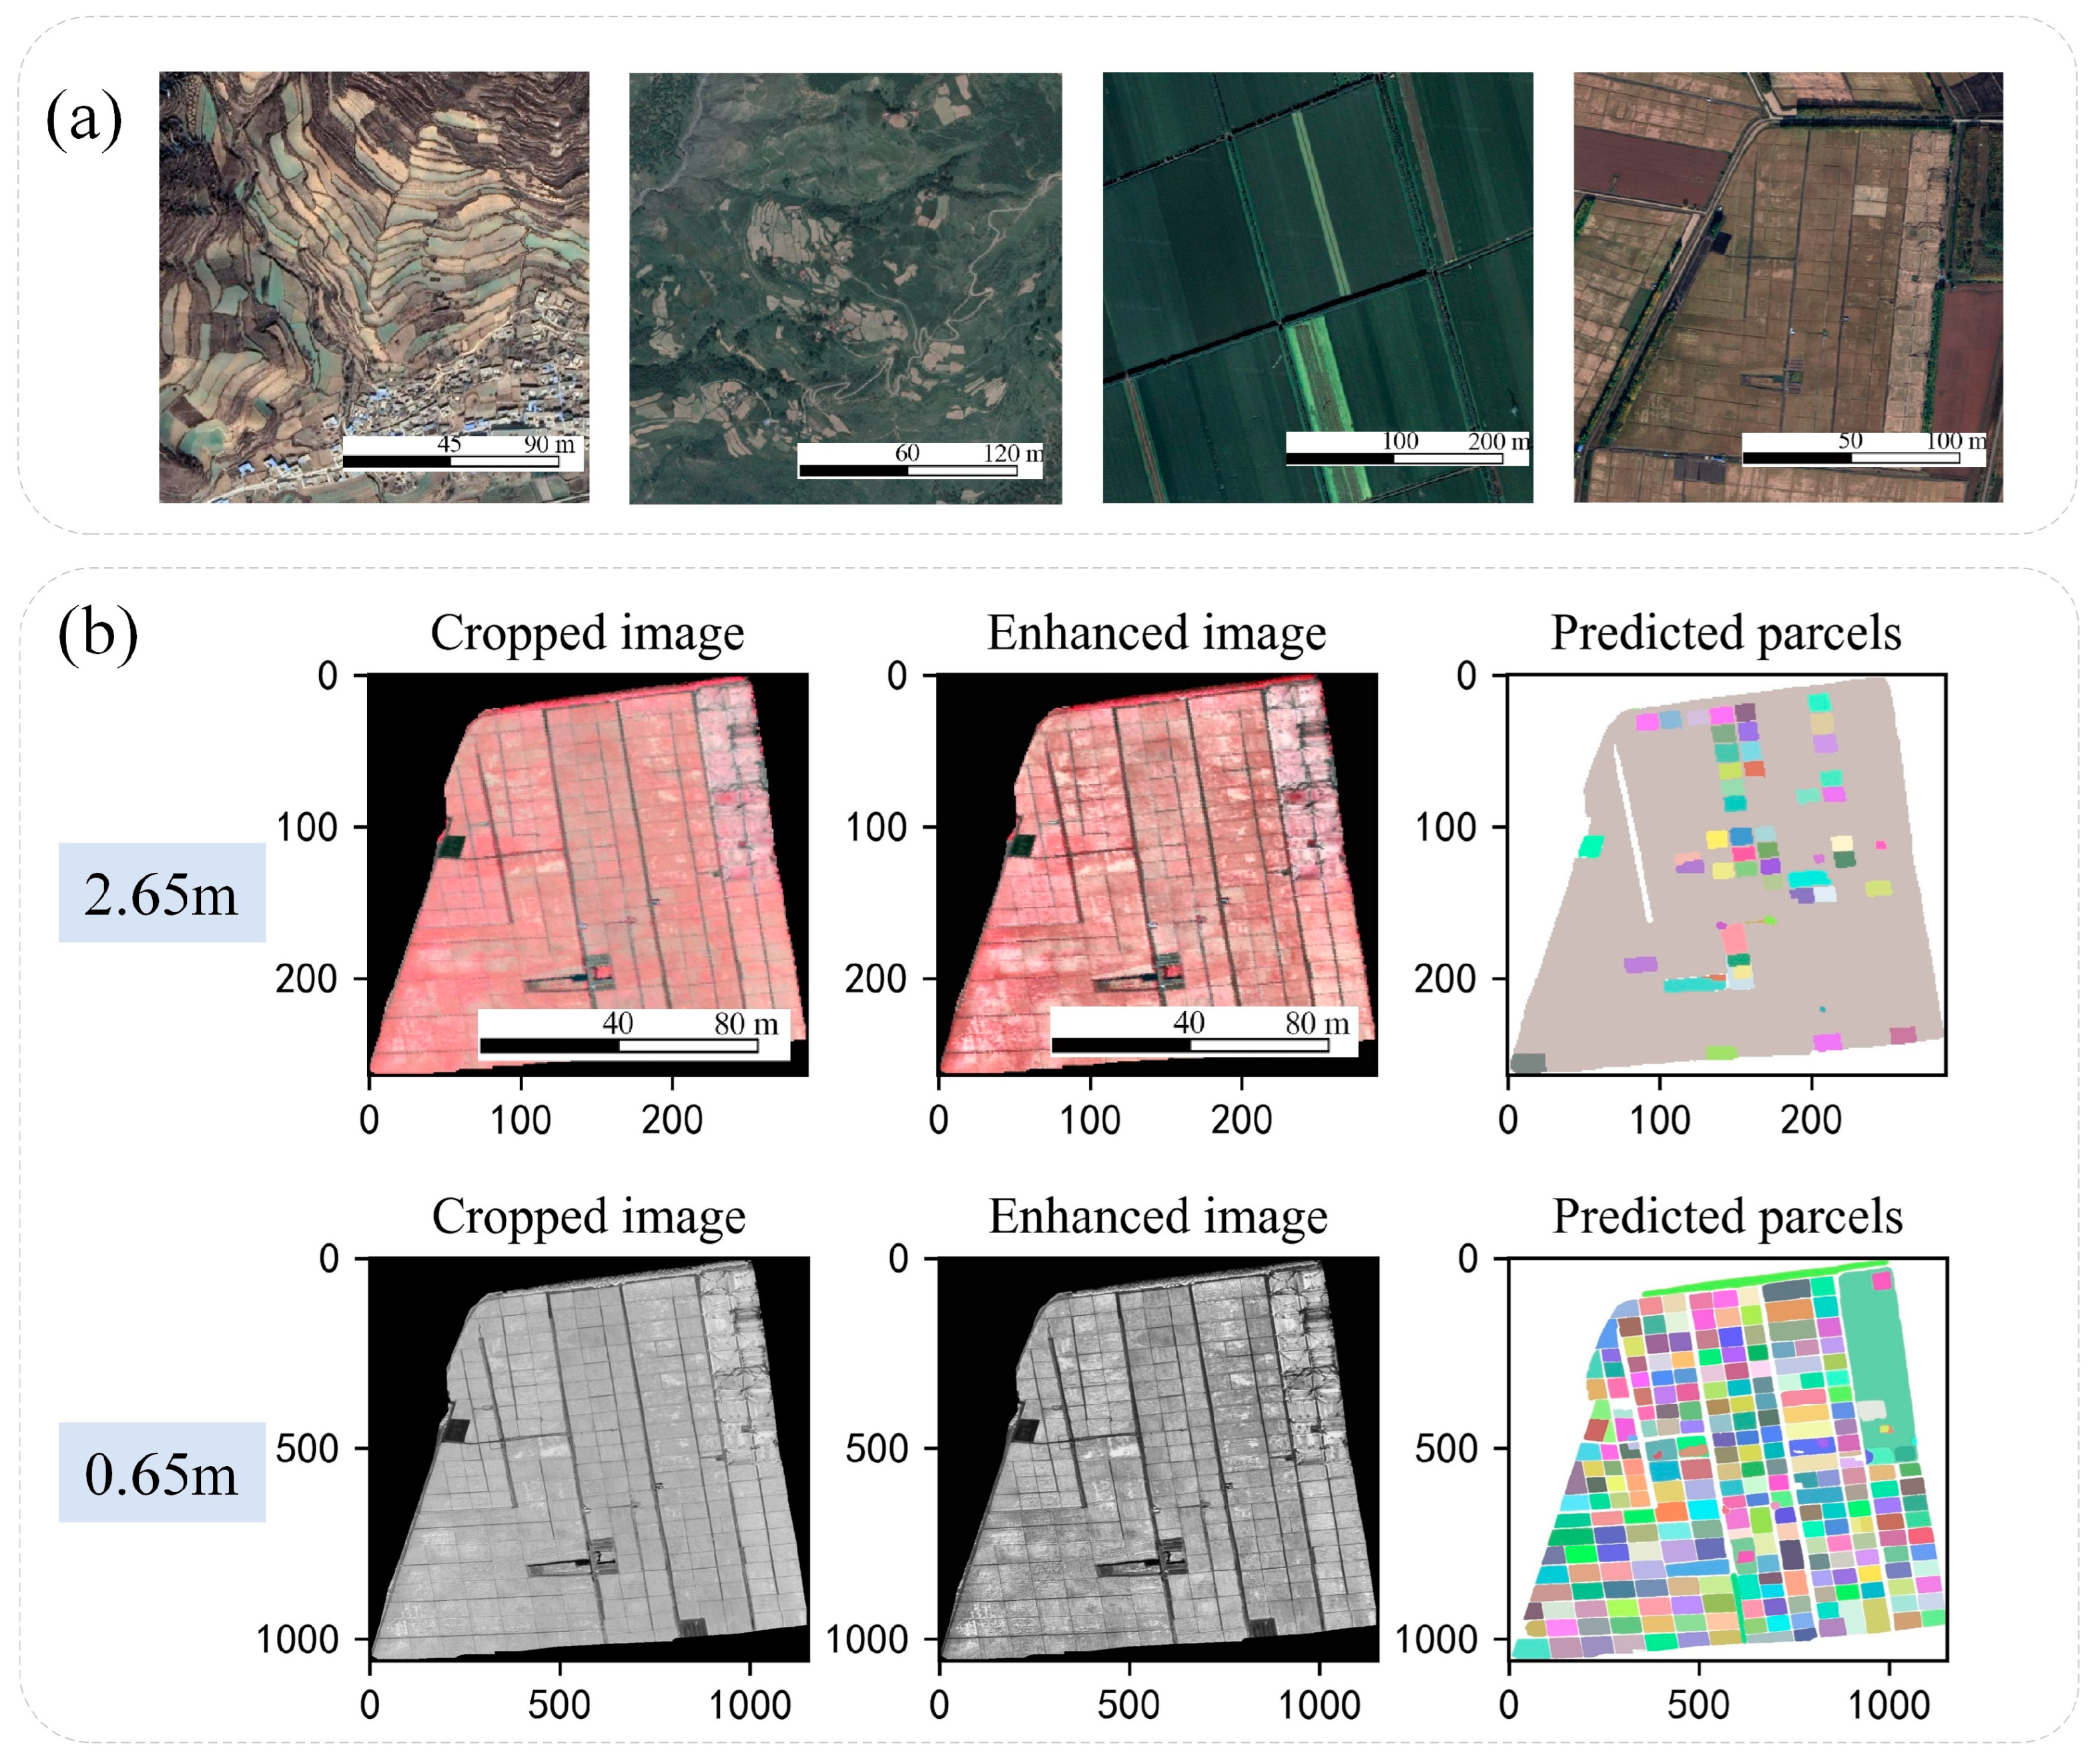
  • Image cropping and histogram equalization
Compared to the parcel extraction process using Sentinel images, the extraction of high-resolution parcels involves working with individual parcel images rather than 1024 × 1024-sized images. Thus, it is essential to utilize the preprocessed parcels to crop the high-resolution image. This is achieved by traversing the parcels and creating masks to guide the cropping process for each parcel. To mitigate edge errors and ensure internal homogeneity, morphological operations, such as dilation and hole filling, were applied to the masks. These operations help refine the masks and improve the accuracy of the cropping process.
Histogram equalization (HE) enhances images by adjusting the grayscale values of pixels based on their histogram. It is a straightforward and effective method, and is commonly used to improve the contrast of images with limited dynamic range [33]. In this study, the contrast-limited adaptive histogram equalization (CLAHE) algorithm [34] was applied to enhance the image. Figure 4a illustrates the results of cropping the parcels and histogram equalization.
  • Downward segmentation features
When using high-resolution imagery for detailed parcel extraction, it is important to decide which parcels need further subdivision. Based on the results obtained from the 10 m parcels, the parcels can be broadly categorized into three types: single parcels, rice parcels, and mixed parcels. It is evident that the latter two types require continued subdivision. For the parcels that necessitate segmentation, the vit-b model was used too. Conversely, for single parcels, the original results were retained directly. This approach significantly improves efficiency and helps prevent over-segmentation. In this study, two thresholds, namely the histogram feature and the internal edge feature of the parcels, were employed to determine whether further subdivision should be performed or not.
The gray histograms of the three types of parcels exhibit distinct characteristics. Single parcels display a single-peaked feature with a narrower range of values. Rice parcels also demonstrate a single peak but have a wider range of values due to the presence of ridges and roads within the parcels. On the other hand, mixed parcels exhibit double or multiple peaks in their gray histograms, with a larger range of values. To differentiate between these three types of parcels, the study calculated the width of their gray histograms from the 3rd percentile to the 95th percentile and established threshold values.
The histogram feature proved effective in distinguishing mixed parcels from other types of parcels. However, there was a tendency to confuse some rice parcels with single parcels. This can be attributed to the presence of a small proportion of ridges and roads within rice parcels. Additionally, some single parcels may lack internal homogeneity or contain non-cultivated factors, such as roads, at their edges. Therefore, the essential features of the parcels to be divided are considered, that is, the parcels to be divided are more complex inside and have obvious edge features. The edges inside the parcels were extracted by Sobel operator, morphological operations were performed to retain the connected areas with large areas, and the ratio of boundary pixels to the total area of the parcels was calculated as a parameter to judge whether to continue downward segmentation or not. Figure 4b illustrates these three types of parcels and their corresponding features.
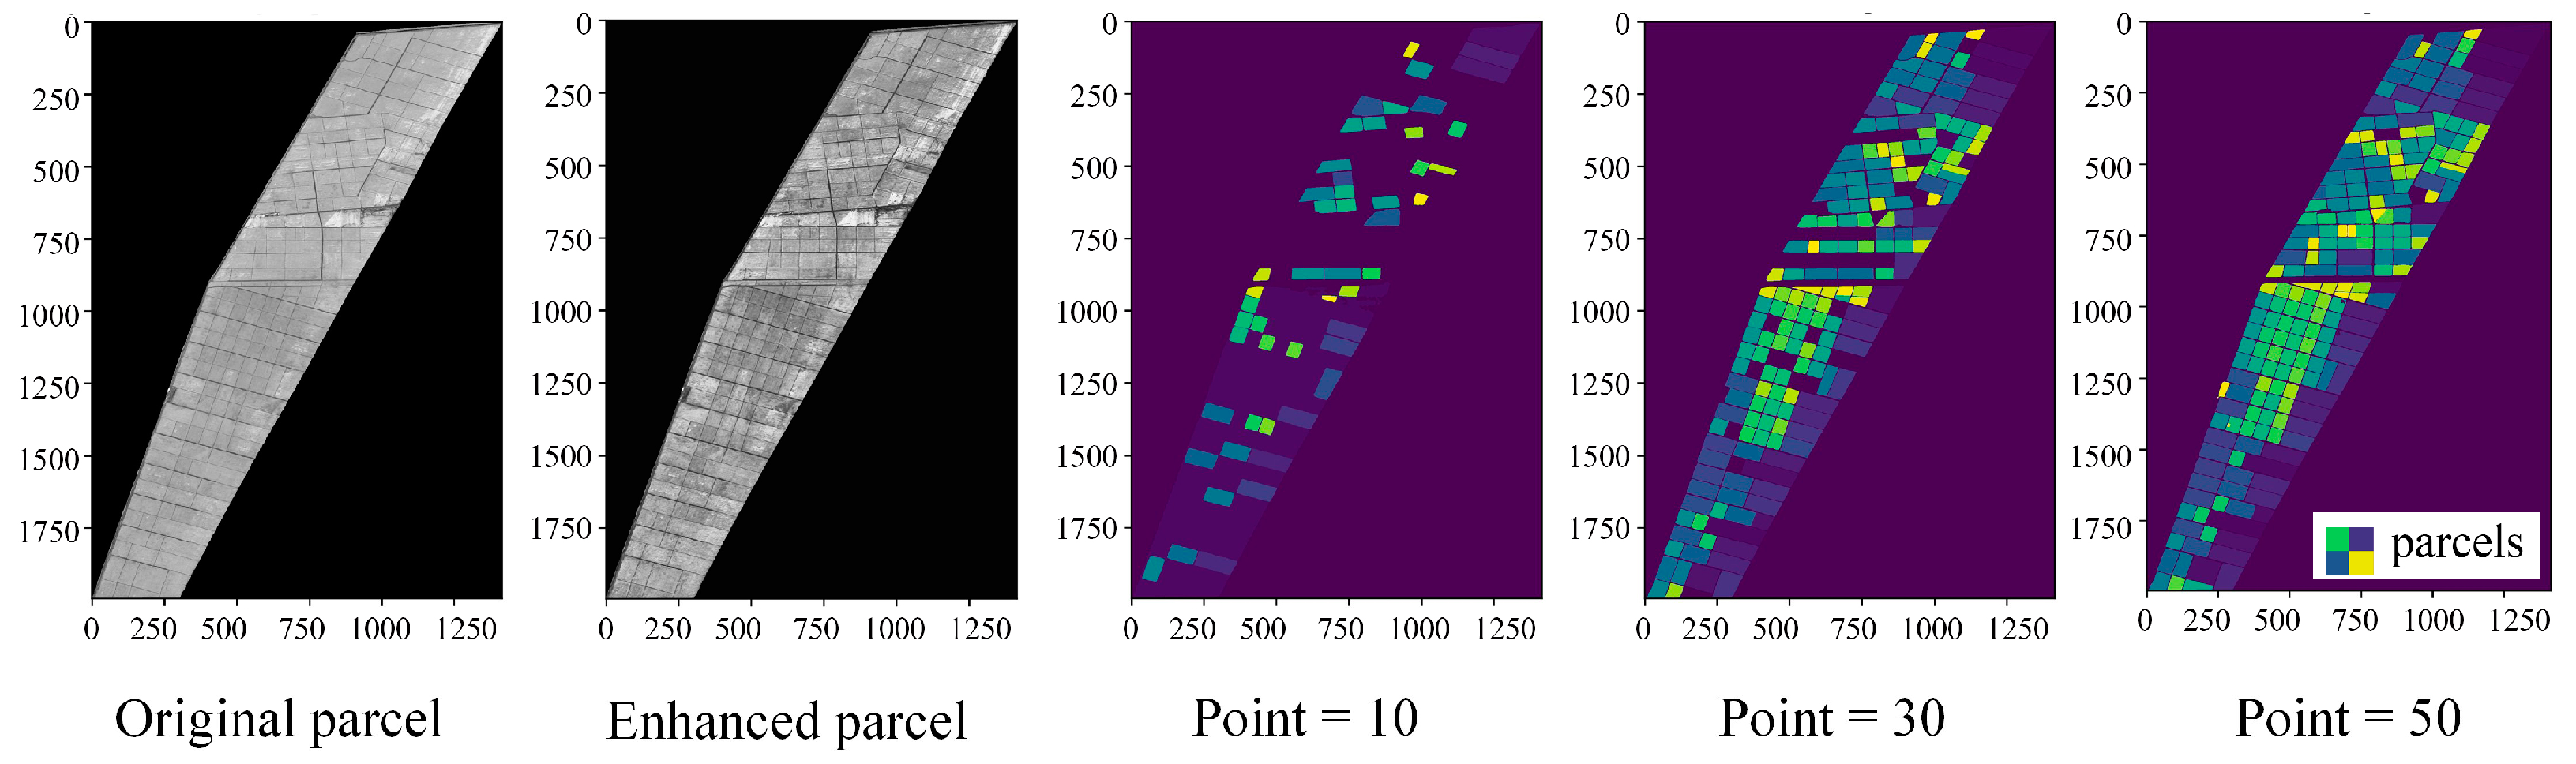
  • Parameter adaptation
During the automatic masking process of farmland parcels using SAM, the Point parameter determines the sampling density on the image, which directly affects segmentation accuracy. The square of Point represents the total number of sampling points on the image. This is similar to evenly distributing points on the image. If there is a random point distribution on the object to be detected, then it will be detected. The point density determines the minimum size of objects that can be detected and the precision of boundaries. As shown in Figure 5, a larger value for Point results in more sampling points, leading to a finer segmentation outcome.
When dealing with remote sensing images, higher resolution implies a more detailed representation of features and greater internal complexity. Additionally, the size of each parcel to be segmented may vary. Therefore, it is crucial to select an appropriate number of sampling points.
For the aforementioned reasons, this study aimed to achieve optimal segmentation results while ensuring computational efficiency. To accomplish this, we considered the internal edge features and the area of the parcels to be segmented when adaptively computing the Point parameter. The formula used for this computation is as follows:
P i = 30 + f i · g i
f i =   log 1.5 e i ( 0 < e i < 10 ) 15     e i 0   o r   e i 10
g i = a i / a m e a n
where Pi represents the number of points, ei represents the edge ratio parameters, ai represents the area of the current parcel, and amean represents the average area of all parcels. Formula (1) is used to calculate the Point parameter of a parcel, consisting of a base value plus the product of fi and gi. Here, fi is a piecewise function that, when ei is between 0 and 10, scales fi non-linearly to a smooth range through a logarithmic transformation. In other cases, fi is assigned a fixed penalty value. This design addresses situations where parcels have highly uneven internal gray levels, causing ei to fall outside a reasonable range. The penalty mechanism helps identify and handle invalid or anomalous values, ensuring that only reasonable ei values contribute positively to the Point calculation. gi represents the ratio of the area of the current parcel to the average parcel area. Combining this measure with fi allows for adjusting the final Point parameter based on the parcel’s area, leading to more accurate segmentation results.

2.3.3. Accuracy Assessment

To evaluate the results of parcel extraction, we use four metrics commonly used in the field of image segmentation, precision (P), recall (R), F1-score (F1), and Intersection over Union (IoU), and they are defined as follows:
p r e c i s i o n = T P T P + F P
r e c a l l = T P T P + F N
F 1 s c o r e = 2 · p r e c i s i o n · r e c a l l p r e c i s i o n + r e c a l l
I o U = T P T P + F P + F N
where TP is true positive, FP is false positive, and FN is false negative. P demonstrates the ability of the classifier to not label negative samples as positive, while R reflects the ability of the classifier to find all positive samples. F1 is the reconciled mean of precision and recall, and is a combination of the two. The higher F1, the more robust the model is. The IoU measures the degree of overlap between the predicted segmentation region and the true segmentation region. We used manual outlining to label ground truth samples for metrics calculations.

3. Results

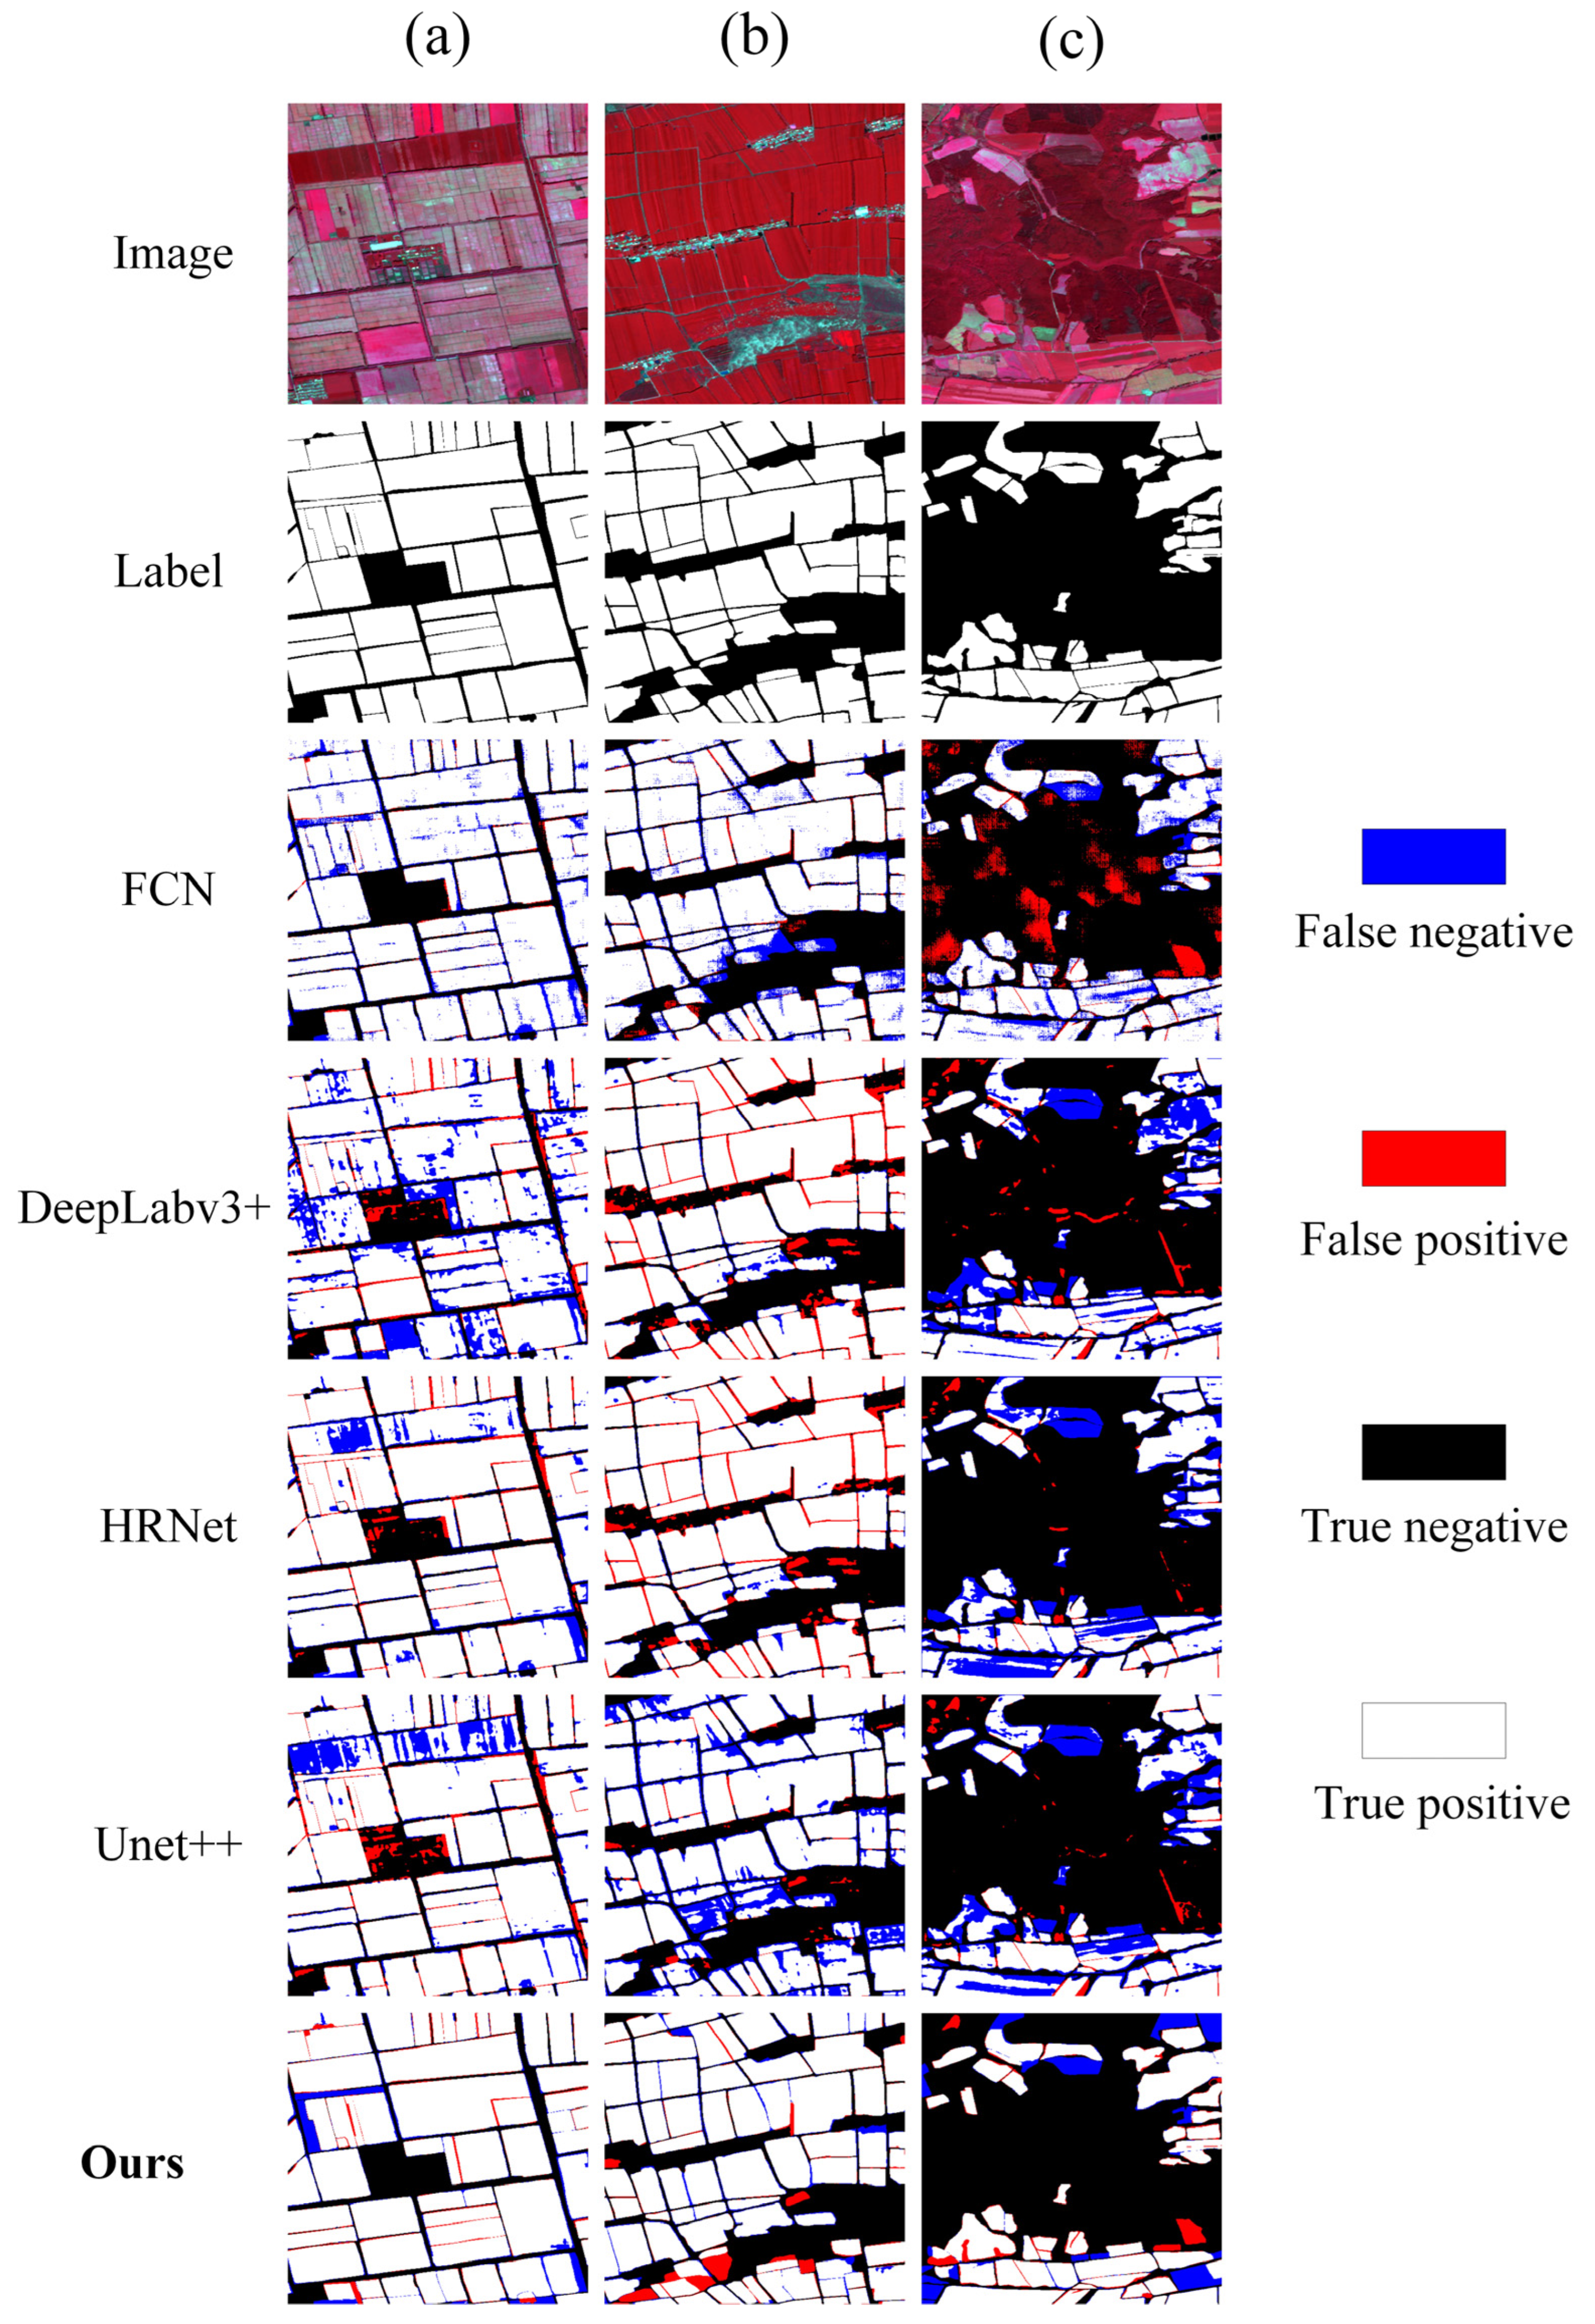
3.1. Accuracy and Spatial Distribution of 10 m Parcels

This study used FCN8s [35], DeepLabv3+ [36], HRNet [37], and UNet++ [38] as baseline models and constructed a 10 m sample set (containing 1560 images) to train these models. The experimental platform is equipped with an RTX 3090 GPU and a 13th Gen Intel(R) Core(TM) i9-13900K CPU, operating on Windows 11. The software stack includes Pytorch 2.4.1, Python 3.9, and CUDA 12.1. Each model was trained for 200 epochs.
Table 2 shows the accuracy comparison between different models. From the experimental areas, all models exhibited high prediction accuracy in Youyi County. In the A1 region, except for the poor performance of UNet++, the prediction accuracy of the models was impressive. In these two regions, although our method could not match the highest-precision method, its overall performance across various accuracy metrics was not inferior to any single model. In the A2 study area, considering various accuracy metrics, our method demonstrated more robust performance than all the baseline models (P: 0.88, R: 0.76, F1: 0.81, IoU: 0.69).
In addition, we found that regardless of which model was applied to the A2 study area, the prediction accuracy decreased, proving that accurately identifying parcels in the A2 region indeed presents certain difficulties. Previous studies have also confirmed that the accuracy of parcel extraction in plain areas is higher than in hilly regions [39,40]. Figure 6 shows a comparison of the extraction results of various models across the three study areas, further validating this point. An analysis of this phenomenon reveals several contributing factors: on one hand, farmland boundaries in plain areas are often demarcated by distinct features such as roads or ditches, which facilitate straightforward parcel extraction. In contrast, fragmented farmland regions are frequently surrounded by forests or grasslands, which may share similar spectral characteristics with farmland, leading to errors. On the other hand, 10 m imagery suffices for extracting large, regular parcels in plains, where parcel sizes and shapes are relatively uniform. However, in hilly regions, significant variability in parcel size and shape, combined with satellite imagery resolution limitations, constrains models’ extraction accuracy.
From Figure 6, it can also be observed that compared to DeepLabv3+ and HRNet, FCN8s and UNet++ provide more accurate boundary predictions with less adhesion between parcels. Meanwhile, since SAM focuses on extracting target parcels, the different parcels are independent of each other, which saves time in post-processing.
Figure 7 displays the outcomes of parcel extraction using Sentinel imagery across three study areas. The results demonstrate that a significant number of cropland parcels have been accurately extracted, showcasing the robust generalization capabilities of computer vision models like SAM on remote sensing images. Additionally, these results validate the effectiveness of employing processing techniques such as overlap prediction and cropland masking to enhance the reliability and precision of the extracted parcels.

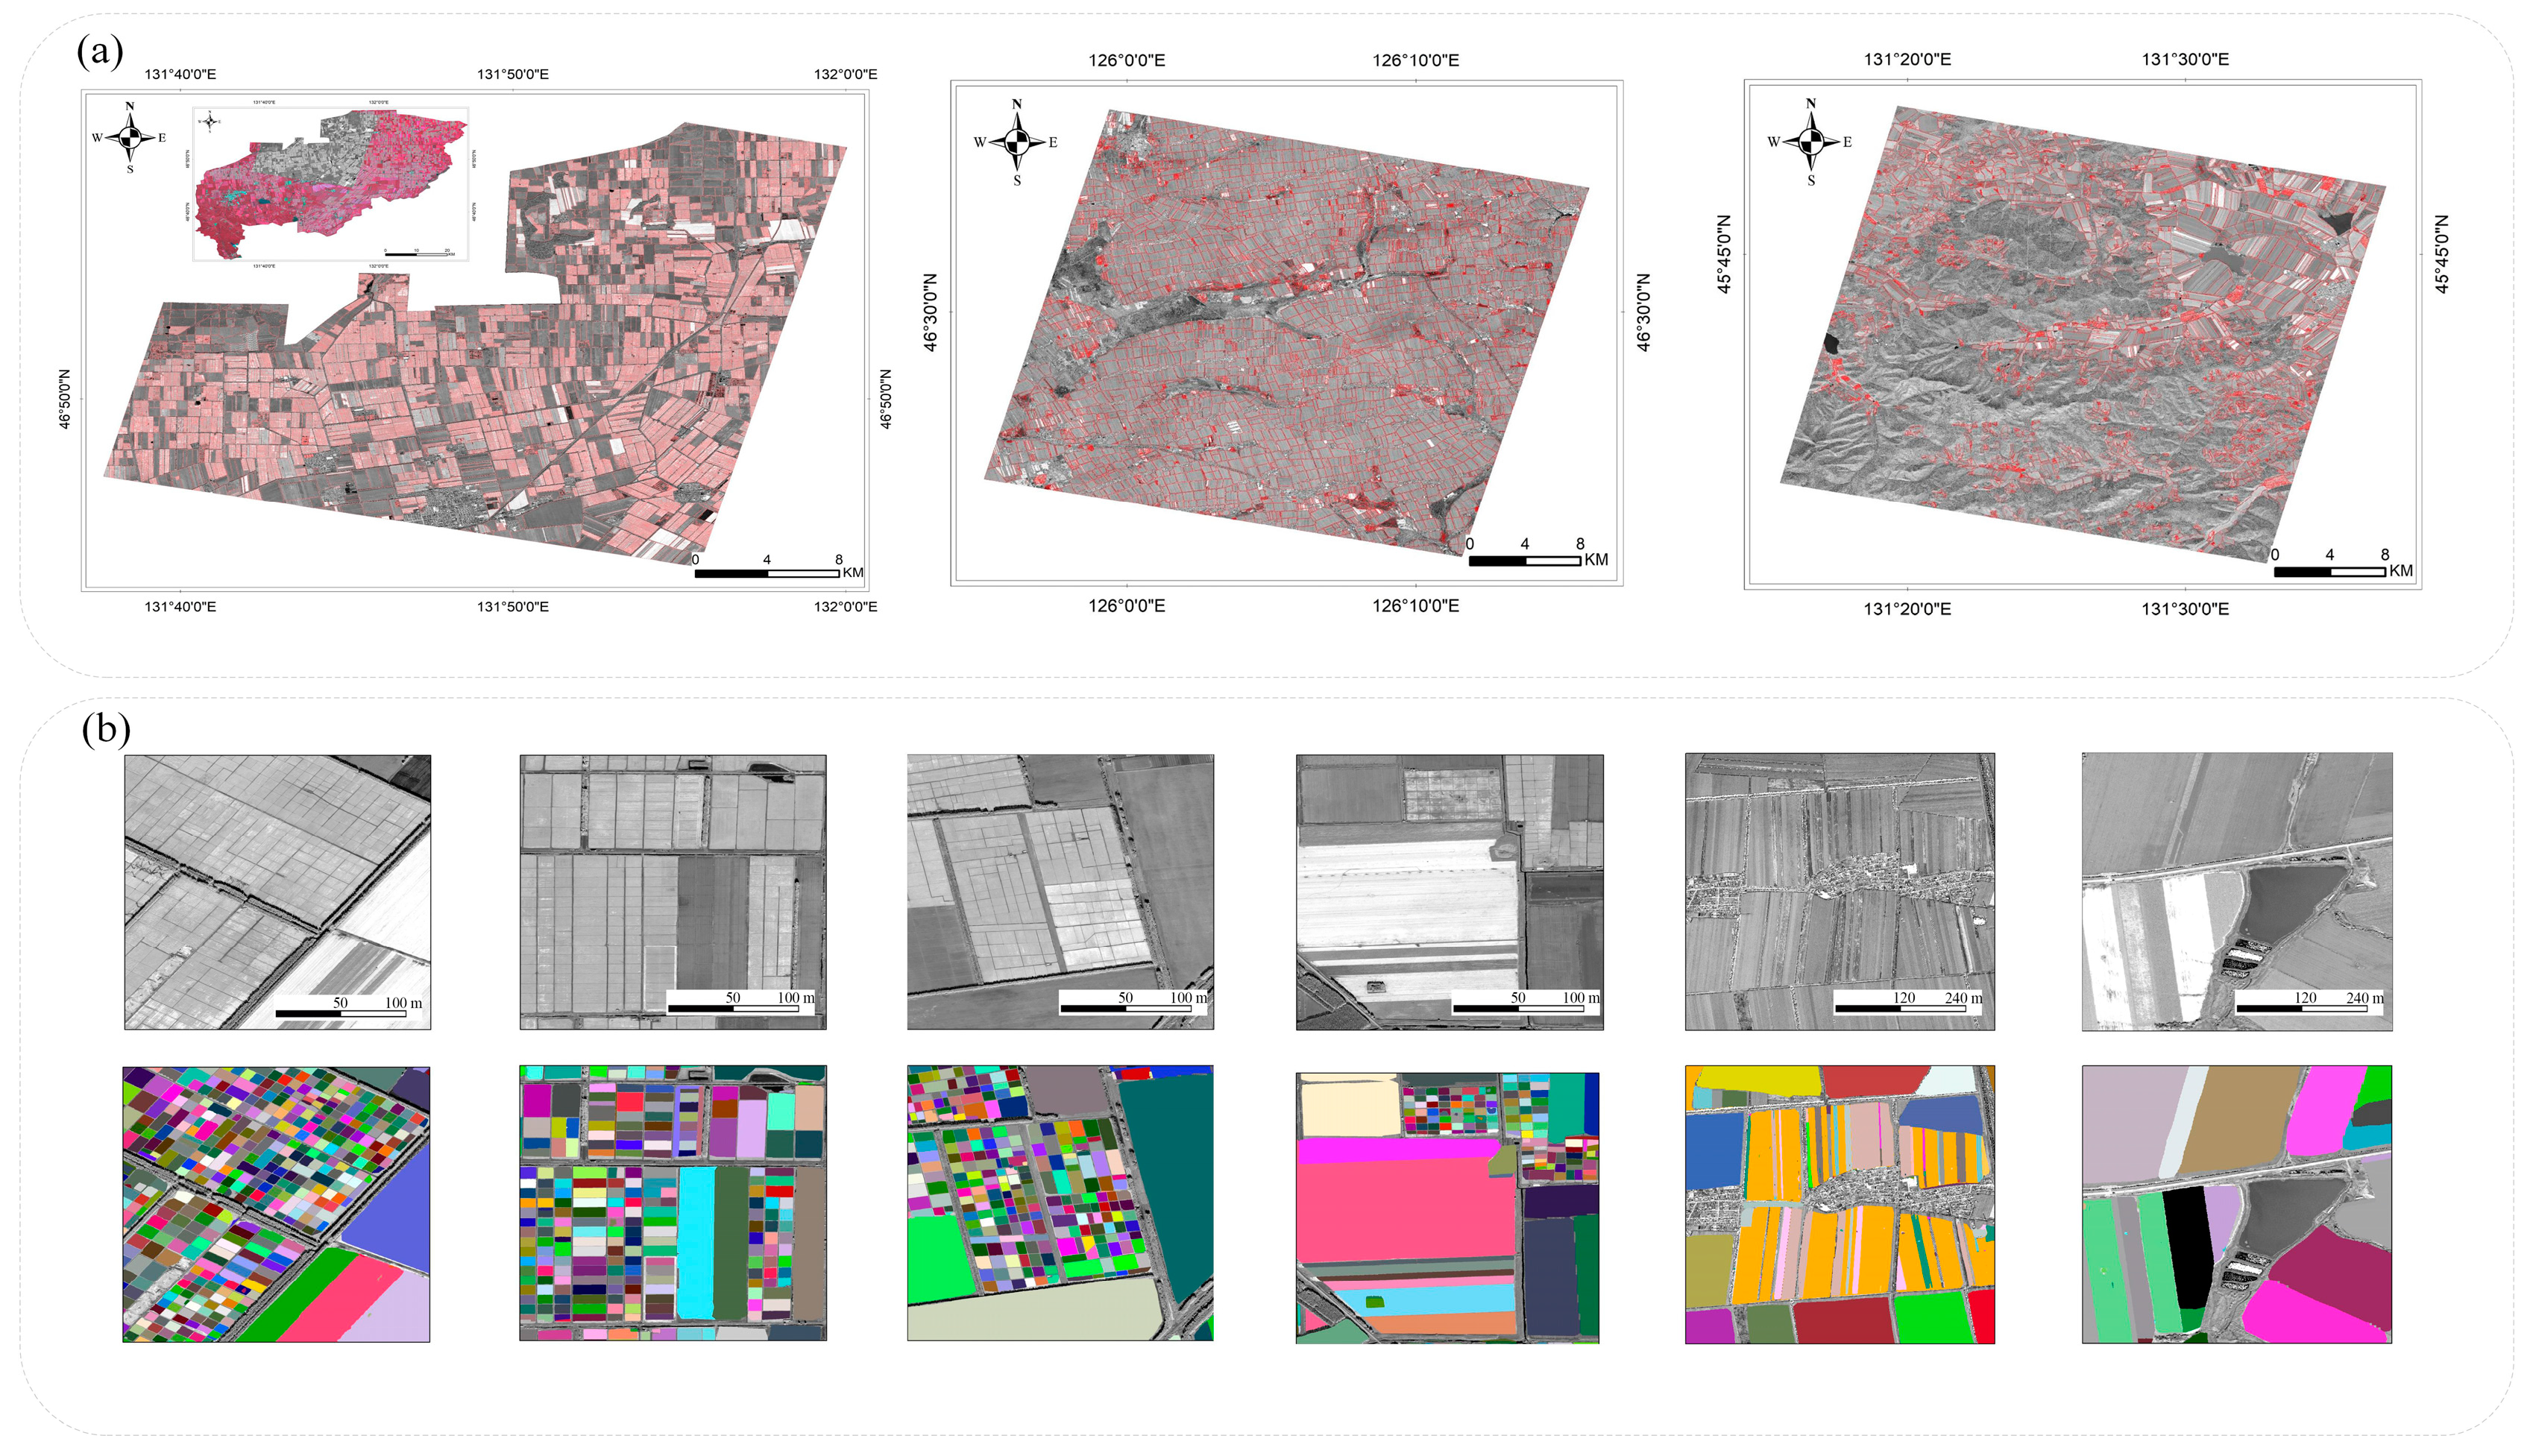
3.2. High-Resolution Parcels

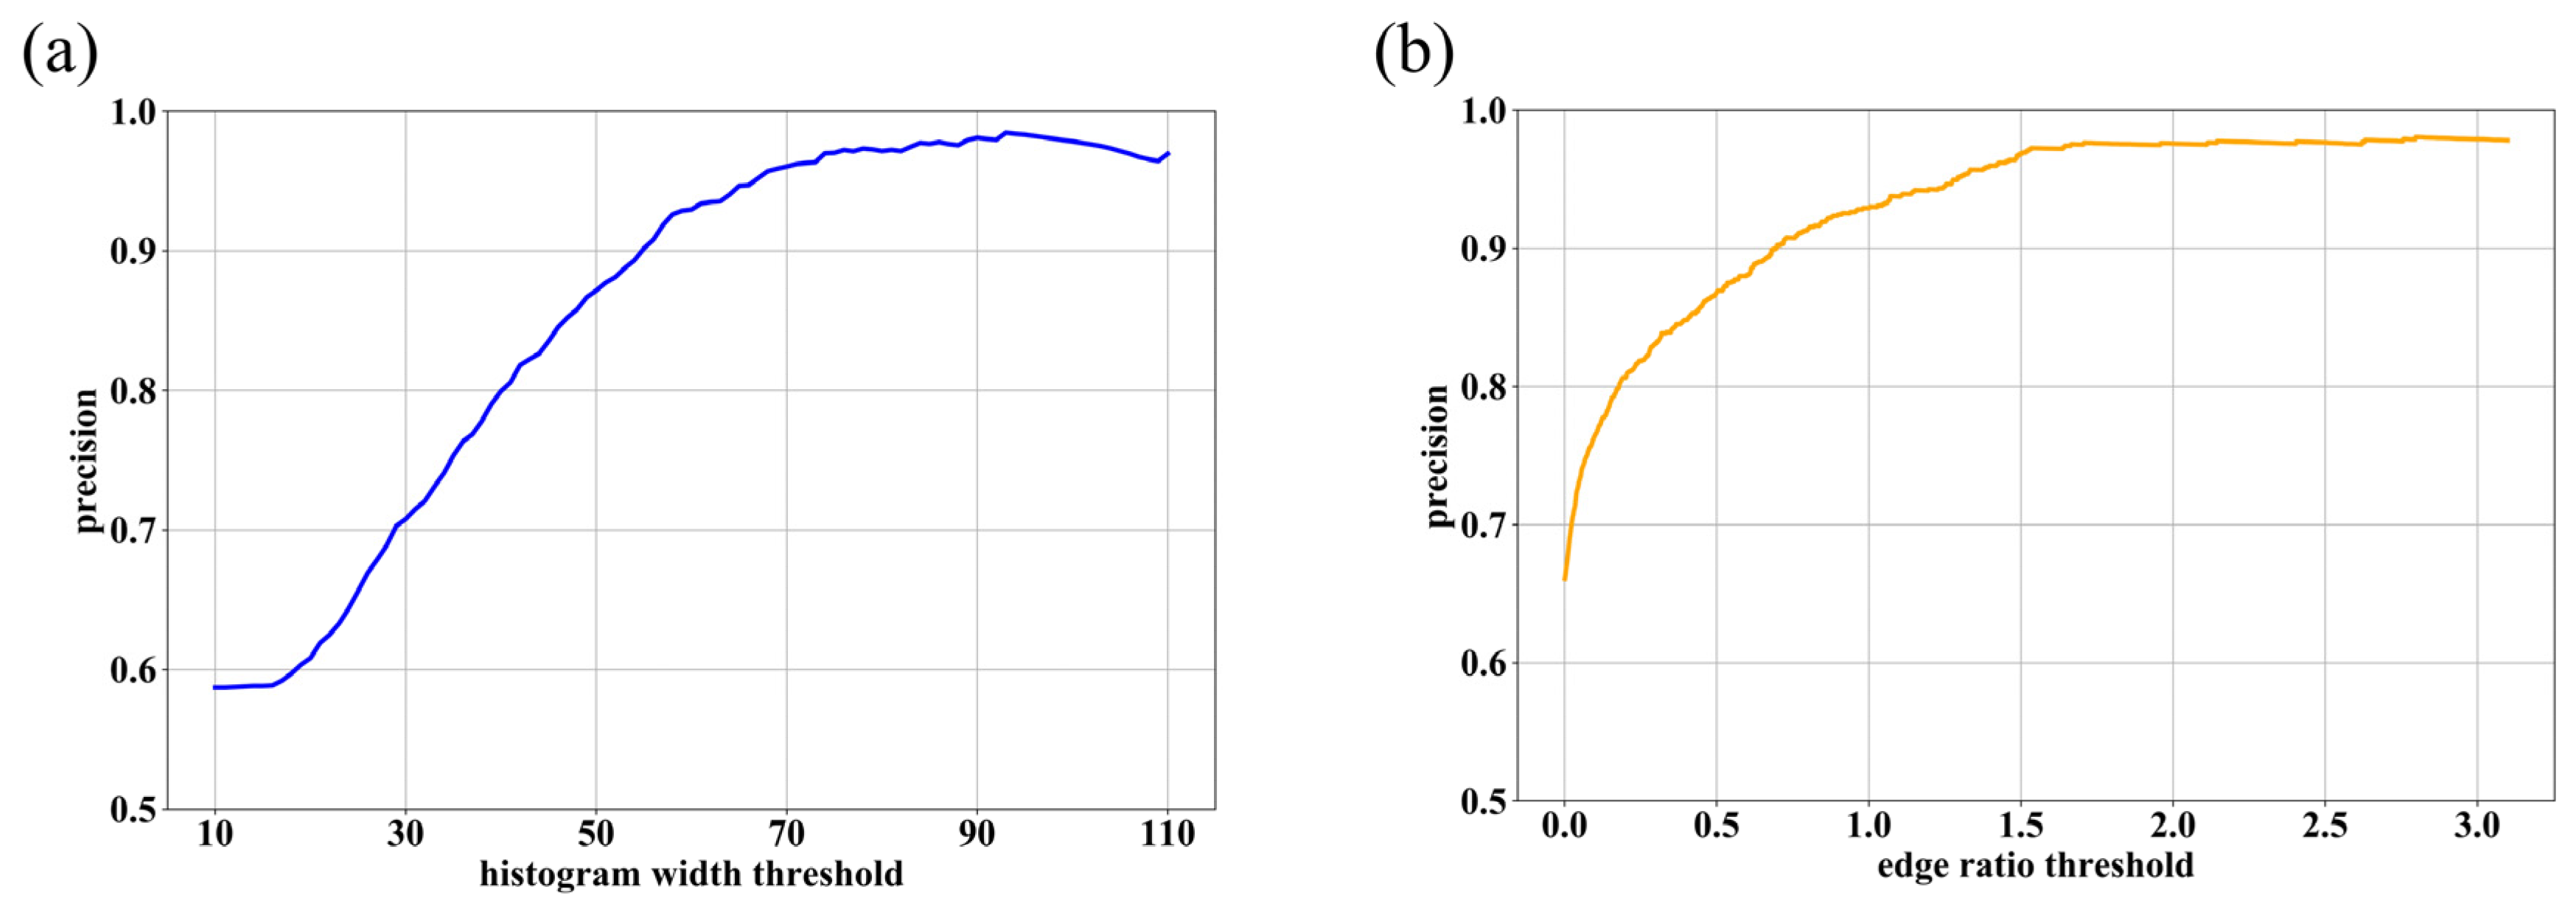
3.2.1. Results of Threshold Selection for Downward Segmentation Features

In this study, histogram features and internal edge features are utilized to determine whether a parcel should undergo further subdivision. P reflects the ability to correctly identify positive samples. Therefore, this metric was employed to assess the effectiveness of the thresholds. As shown in Figure 8, the p values of correctly classified parcels for further subdivision were calculated under different thresholds for both feature types. It was observed that, for histogram width, P increased with width expansion, stabilizing when the width approaches 70. Similarly, for internal edge features, P stabilized when the edge ratio reached 1.5%. Consequently, a histogram width of 70 and edge ratio of 1.5% were selected as thresholds for subsequent evaluations.
Additionally, the results of an ablation experiment for these two feature types are presented in Table 3. It is evident that when only one feature type was used, although a high P was achieved, R and F1 were moderate. This indicates that a certain number of positive samples were misclassified as negative, leading to omissions. When both feature types were applied, P remained relatively unchanged, but R and F1 experienced significant improvements, demonstrating that the two feature types complement each other, enhancing the robustness and stability of decision-making.

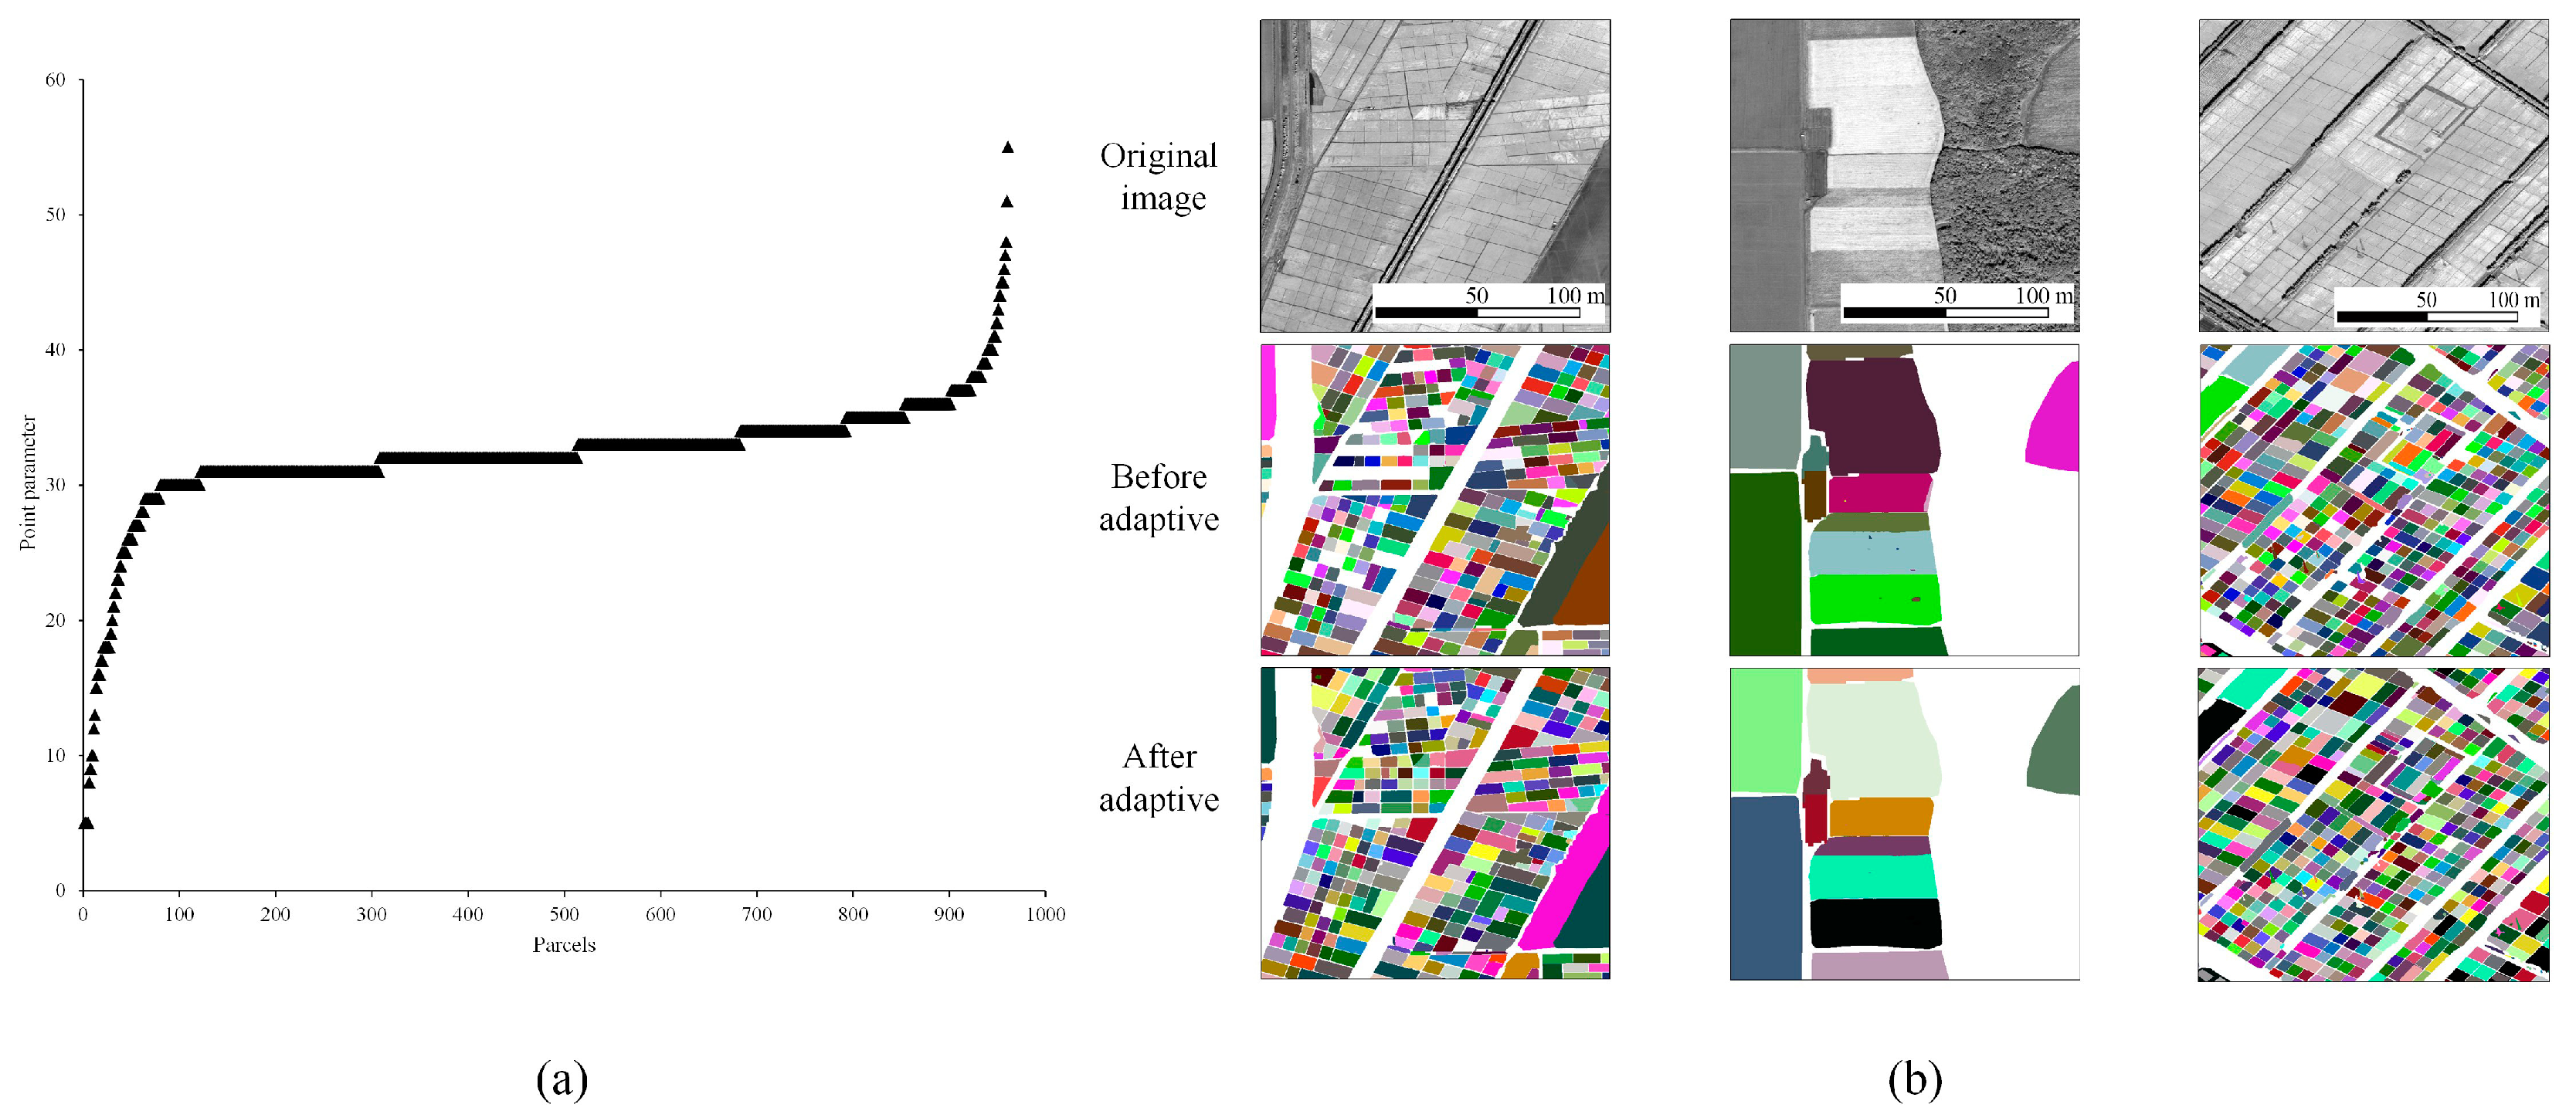
3.2.2. Parameter Adaptation Results

The Point parameters of the parcels that need to be further segmented are computed by means of the parameter adaptive formulation in Section 2.3.2. Figure 9a illustrates the distribution of the parameters in Youyi county, and it can be noticed that the Point parameter varies for each parcel due to the different area and internal edge characteristics, ranging from 5 to 55. Figure 9b demonstrates the results of the comparison between the fixed parameters and the adaptive parameters. It can be seen that the parameter adaptation can reduce false segmentation and extract the parcels that cannot be recognized under the fixed parameters efficiently.

3.2.3. Parcel Extraction Results

Parcel cropping as well as segmentation threshold judgment was performed by taking the 10 m results. To enhance the parcels to be segmented, histogram equalization was applied. Adaptive parameters were calculated for prediction, and the prediction results were merged. As depicted in Figure 10, 0.65 m parcel extraction results were obtained.
Using histogram features and internal edge features, a strong distinction was made between whether the parcels continue to be subdivided or not. Parcels that exhibited internal homogeneity and did not require further subdivision retained their original results, thereby improving computational efficiency. On the other hand, parcels that necessitated further subdivision were processed using SAM with adaptive parameters, resulting in more refined outcomes. The 0.65 m results provide precise representations of each parcel, furnishing valuable data for crop monitoring and farmland management.

4. Discussion

4.1. Advantages of This Method

In this paper, we present a method for accurate parcel extraction by combining multiple resolution images. Our approach capitalizes on the powerful generalization capability of SAM to achieve precise extraction of parcels without the need for ground samples or training. Table 4 illustrates the prediction time of different models as well as their requirements for sample sets and pre-training. It can be observed that while existing deep learning methods achieve faster inference speeds (0.0659–0.1902 s per image), they rely heavily on large annotated sample sets and lengthy training processes. In contrast, although our method has a longer prediction time (1.3645 s per image), it is entirely independent of annotated data. Moreover, in large-scale applications, this computational cost remains acceptable, particularly when acquiring training data, and adapting models poses greater challenges.
Furthermore, during the study, we found that while larger parcels can be accurately depicted using 10 m resolution images, smaller parcels remain undetectable. This indicates the need for higher-resolution images to effectively extract parcels in complex farmland landscapes. Considering this, we designed a parcel extraction method combining Sentinel-2 and GF-7 images, and used different images to extract parcels for different farmland landscapes so as to realize accurate parcel mapping in the study area. This method provides more accurate results than existing methods that use one resolution for parcel extraction, and enables large-scale parcels mapping while solving the problem of parcel extraction for complex farmland landscapes.
Some studies have applied SAM to parcel identification. For example, Vladimir [31] used SAM with Sentinel-2 data to extract farmland parcels in northern Serbia. Their results indicate that the performance of parcel extraction in complex cropland areas is mediocre, which aligns with the findings of this study. Liu [30] also designed a parcel extraction process based on SAM, similarly emphasizing the importance of sampling points for segmentation outcomes. They incorporated supplementary segmentation during full-scale inference, which improved accuracy. However, their experiments were conducted solely in plain regions, lacking a broader diversity of farmland landscapes. This study complements this aspect.

4.2. Uncertainty Analysis

SAM has strong generalization ability, gained from training on a large segmentation dataset, allowing it to segment images not seen during training. However, in remote sensing, challenges arise due to the diversity of sensors, complexity of imaging scenes, randomness of ground object distribution, and irregularity of target shapes. For instance, SAM effectively segments regular features like buildings and roads in remote sensing images but struggles with small or less distinct objects, leading to reduced performance [28]. In addition, remote sensing images contain a large amount of geographical knowledge and spatial relationships. As a segmentation model, SAM usually cannot understand this knowledge and these relationships well, resulting in false segmentation. To address this, some a priori knowledge can be applied. In this study, a cultivated land mask was used to remove some non-cropland effects when performing 10 m-resolution parcel extraction. Moreover, due to the complexity of high-resolution images, false segmentation often occurs when using SAM to extract parcels. As shown in Figure 11a–d, segmentation errors are observed under various scenarios: Figure 11a demonstrates misclassification caused by internal structures such as electric towers and trees within parcels; Figure 11b reveals false positives induced by uneven gray-scale distribution; while Figure 11c,d exhibit insufficient segmentation in more complex regions. This collectively proves that SAM’s performance is significantly affected by parcel-internal textures, gray-scale variations, and environmental complexities, which not only reduces segmentation accuracy but also increases post-processing challenges. Overall, as a basic model, SAM has shown strong application potential in remote sensing, but in specific research areas, SAM still faces many challenges. Therefore, future research should focus on how to use some constraints or adapt SAM to improve its performance in specialized fields [41,42].
In addition to the uncertainties present in SAM, the ESRI land cover data used in this study also contain potential errors. For instance, some non-agricultural areas may be misclassified as cropland, and there is incomplete extraction of cropland in certain regions. Furthermore, due to resolution limitations, a significant number of mixed pixels exist in complex areas and along cropland edges, which to some extent affects the accuracy of this study. Beyond that, this study uses 10 m parcels to crop 0.65 m imagery, introducing a degree of error, particularly in edge areas where some cropland pixels may be lost. One potential solution could be to add a buffer zone to mitigate this issue. However, the size of the buffer zone and its subsequent impact on the calculation of histogram features and edge characteristics remain topics worthy of further discussion.

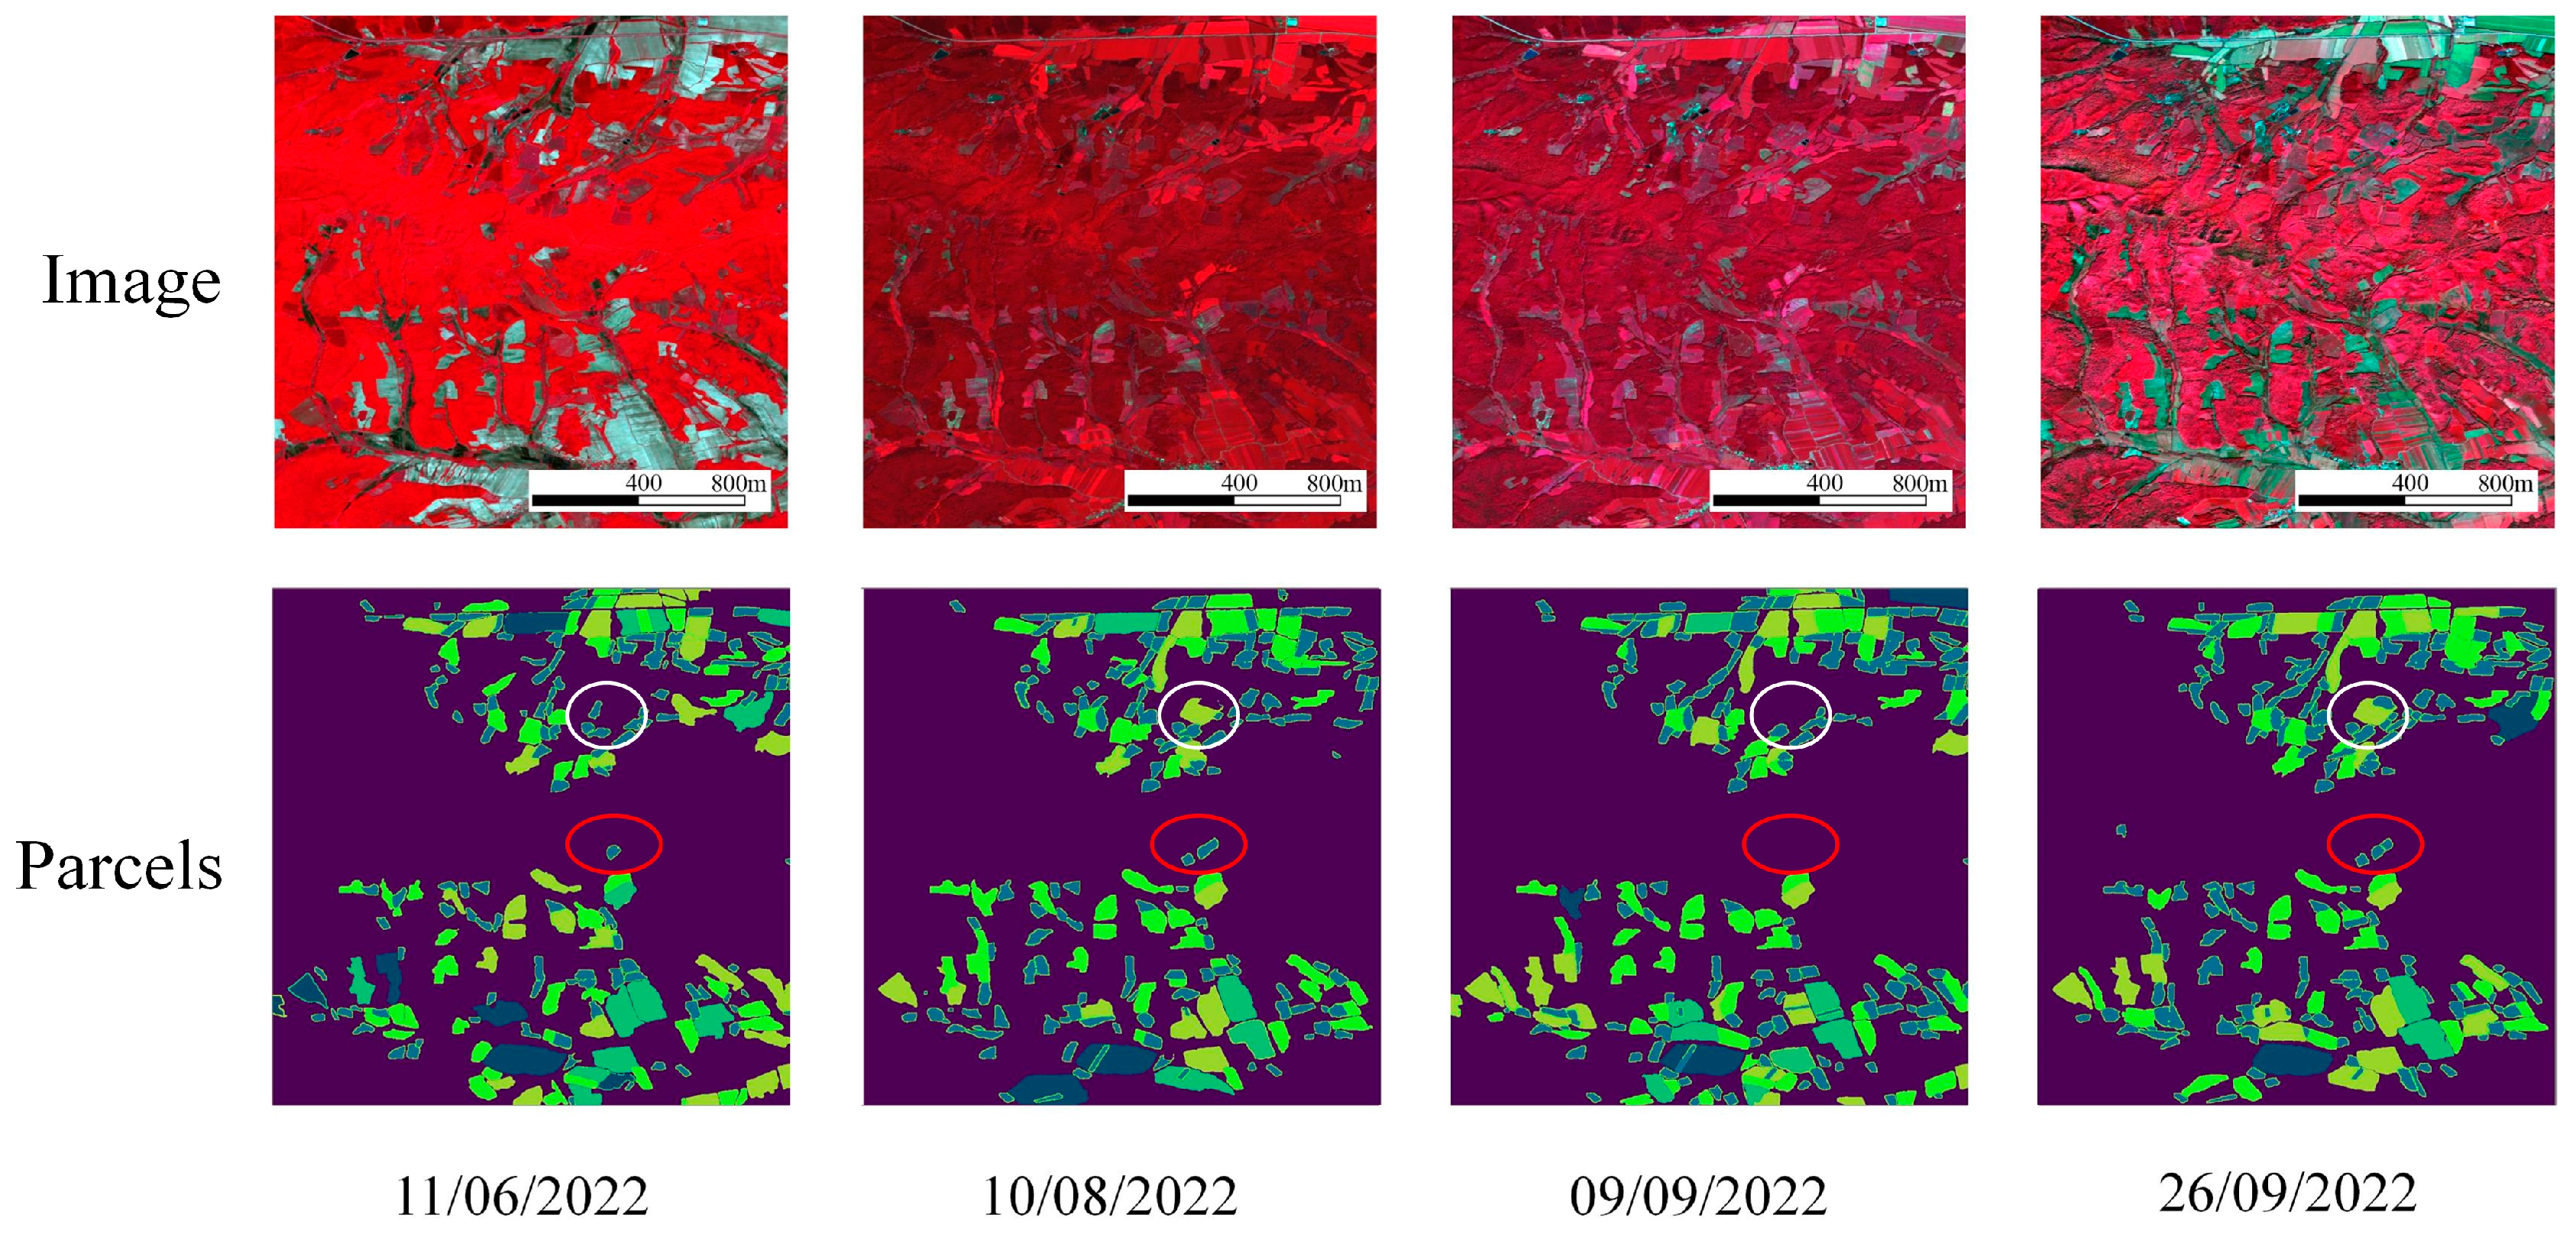
4.3. The Role of Multi-Temporal Data in Parcel Extraction

Agricultural production activities, due to significant human intervention, differ greatly from natural conditions. Consequently, time series information plays a crucial role. One notable example is the commonly used NDVI curve for crop identification [43,44,45]. In the context of parcel extraction, data collected at different time points provide varying information, which can be beneficial for accurately delineating parcel boundaries.
In this study, we conducted parcel extraction using Sentinel data captured at four different time points in the A2 study area. In Figure 12, we can observe that during the initial stages of crop growth in June, the vegetation characteristics within cultivated land were not distinct, whereas non-cultivated land exhibited obvious spectral characteristics. After the crops were harvested in late September, certain boundary information became more evident compared to the period when the vegetation was dense. It can also be seen from the parcel extraction results that there are certain differences in the extraction results of different temporal phases (the red and white circles in Figure 12). Furthermore, as shown in Table 5, the accuracy of extraction using single-temporal imagery was generally mediocre, with little variation in extraction accuracy between different temporal phases. However, merging prediction data from multiple time phases enhanced the accuracy of the extraction results, but incorporating additional input images inevitably increases computational costs. Therefore, how to effectively use multi-temporal data as a supplement in the process of parcel extraction is still a problem worth exploring. In future research, we plan to propose an approach that initially employs single-temporal images for the extraction process and subsequently incorporates suitable temporal data to supplement the extraction in areas that exhibit poorer results. This strategy aims to reduce computational costs while preserving accuracy and warrants further exploration.

4.4. Effects of Different Resolutions on Parcel Extraction

As shown in Figure 13a, due to the different conditions of precipitation, topography, humanity, and climate in each region, there are usually obvious differences in their farmland landscapes. For example, in southwest China, there are mostly hills, so the cultivated land parcels are relatively fragmented, while in northeastern China, large cultivated land is in the majority. Therefore, for different farmland landscapes, different-resolution images should be used for parcel extraction to achieve the optimal extraction accuracy and the highest extraction efficiency.
The study area in this research also contains complex agricultural landscapes, ranging from A1, which is flat and mainly planted with corn and regular parcels, to A2, which is predominantly hilly and has broken parcels; and in Youyi County, there are also large-area parcels planted with corn and soybeans as well as small-area parcels planted with rice. From the results of the study, it can be seen that the 10 m images can well extract the large parcels but cannot precisely recognize the small parcels, so there is an obvious difference in the extraction accuracy in different study areas. For the small-area rice parcels in Youyi County, this study used GF-7 2.65 m multispectral data and 0.65 m panchromatic data to perform the extraction comparison (Figure 13b), and found that the extraction result of 0.65 m resolution was significantly better than that of 2.65 m, which proves that for small-area rice parcels, sub-meter scale imagery is more useful. In this study, the effect of resolution on parcel extraction was only qualitatively analyzed in Northeast China. However, as shown in Figure 13a, more diverse geographical conditions exist. Therefore, when evaluating the performance of parcel extraction model in these complex areas, data quality, parcel shape, and boundary precision are equally critical. In future work, we will leverage richer datasets and improved experiments to quantitatively determine the optimal resolution for parcel extraction across diverse farmland landscapes. Additionally, we plan to explore hybrid approaches and constraint-guided segmentation to address SAM’s limitations in complex parcels, such as integrating semantic information with shape and boundary constraints to improve extraction accuracy in fragmented and irregular agricultural areas.

5. Conclusions

This article introduced a methodology that combined multi-resolution remote sensing images to achieve accurate parcel extraction. Based on SAM, the proposed method enables large-scale and precise extraction of parcels in complex agricultural landscapes without the need for ground samples and local training.
Initially, Sentinel images were utilized for extracting parcels at a 10 m resolution. To better focus on parcels and improve detection and stitching results, techniques such as cropland masking and overlap prediction were employed during the processing. The results demonstrated that our method achieved fast and accurate parcel extraction, performing no worse than existing deep learning models in plain areas (P: 0.89, R: 0.91, F1: 0.91, IoU: 0.87). In hilly areas, our method even outperformed existing models (P: 0.88, R: 0.76, F1: 0.81, IoU: 0.69). Meanwhile, we discarded the traditional way of using single-resolution data for parcel extraction. Instead, a method of using different-resolution data for parcel extraction for different farmland landscapes was proposed. By combining Sentinel-2 and GF-7 images, we further segmented the parcels by focusing on their histogram features and internal edge characteristics, ultimately achieving accurately delineated parcels in the three study areas. This mode of parcel extraction was more in line with human farming habits and land management patterns, and the results were more accurate and reliable, which can better provide data support for farmland management.

Author Contributions

Conceptualization, Y.D.; methodology, Y.D., H.W., Y.Z., X.D. and Q.L.; software, Y.D., Y.W., J.X. (Jingyuan Xu), S.Y., S.G. and H.H.; validation, S.Z.; formal analysis, Y.D. and Y.S.; investigation, Y.D.; resources, H.W., Y.Z., X.D. and Q.L.; data curation, J.X. (Jing Xiao); writing—original draft preparation, Y.D.; writing—review and editing, Y.D. and Y.Z.; visualization, H.W., Y.Z., X.D. and Q.L.; supervision, H.W., Y.Z., X.D. and Q.L.; project administration, H.W., Y.Z., X.D. and Q.L.; funding acquisition, X.D. and Q.L. All authors have read and agreed to the published version of the manuscript.

Funding

This study was supported by the National Key R&D Program of China (2021YFD1500103), the National Science Foundation of China (42071403 and 42371359), and the Strategic Priority Research Program of the Chinese Academy of Sciences (XDA28070504).

Institutional Review Board Statement

Not applicable.

Data Availability Statement

The data presented in this study are available on request from the corresponding author.

Conflicts of Interest

The authors declare no conflicts of interest.

Abbreviations

The following abbreviations are used in this manuscript:
SAMSegment Anything Model
GEEGoogle Earth Engine
HEhistogram equalization
CLAHEcontrast-limited adaptive histogram equalization
NDVINormalized Difference Vegetation Index

References

  1. Saiz-Rubio, V.; Rovira-Más, F. From Smart Farming towards Agriculture 5.0: A Review on Crop Data Management. Agronomy 2020, 10, 207. [Google Scholar] [CrossRef]
  2. Xia, L.; Luo, J.; Sun, Y.; Yang, H. Deep Extraction of Cropland Parcels from Very High-Resolution Remotely Sensed Imagery. In Proceedings of the 2018 7th International Conference on Agro-Geoinformatics (Agro-Geoinformatics), Hangzhou, China, 6–9 August 2018; pp. 1–5. [Google Scholar]
  3. Pan, Y.; Wang, X.; Zhang, L.; Zhong, Y. E2EVAP: End-to-End Vectorization of Smallholder Agricultural Parcel Boundaries from High-Resolution Remote Sensing Imagery. ISPRS J. Photogramm. Remote Sens. 2023, 203, 246–264. [Google Scholar] [CrossRef]
  4. Da Costa, J.P.; Michelet, F.; Germain, C.; Lavialle, O.; Grenier, G. Delineation of Vine Parcels by Segmentation of High Resolution Remote Sensed Images. Precis. Agric. 2007, 8, 95–110. [Google Scholar] [CrossRef]
  5. García-Pedrero, A.; Gonzalo-Martín, C.; Lillo-Saavedra, M. A Machine Learning Approach for Agricultural Parcel Delineation through Agglomerative Segmentation. Int. J. Remote Sens. 2017, 38, 1809–1819. [Google Scholar] [CrossRef]
  6. Yan, L.; Roy, D.P. Automated Crop Field Extraction from Multi-Temporal Web Enabled Landsat Data. Remote Sens. Environ. 2014, 144, 42–64. [Google Scholar] [CrossRef]
  7. Hong, R.; Park, J.; Jang, S.; Shin, H.; Kim, H.; Song, I. Development of a Parcel-Level Land Boundary Extraction Algorithm for Aerial Imagery of Regularly Arranged Agricultural Areas. Remote Sens. 2021, 13, 1167. [Google Scholar] [CrossRef]
  8. Turker, M.; Kok, E.H. Field-Based Sub-Boundary Extraction from Remote Sensing Imagery Using Perceptual Grouping. ISPRS J. Photogramm. Remote Sens. 2013, 79, 106–121. [Google Scholar] [CrossRef]
  9. Fu, K.S.; Mui, J.K. A Survey on Image Segmentation. Pattern Recognit. 1981, 13, 3–16. [Google Scholar] [CrossRef]
  10. Minaee, S.; Boykov, Y.; Porikli, F.; Plaza, A.; Kehtarnavaz, N.; Terzopoulos, D. Image Segmentation Using Deep Learning: A Survey. IEEE Trans. Pattern Anal. Mach. Intell. 2022, 44, 3523–3542. [Google Scholar] [CrossRef]
  11. Hadir, A.; Adjou, M.; Assainova, O.; Palka, G.; Elbouz, M. Comparative Study of Agricultural Parcel Delineation Deep Learning Methods Using Satellite Images: Validation through Parcels Complexity. Smart Agric. Technol. 2025, 10, 100833. [Google Scholar] [CrossRef]
  12. Liu, W.; Wang, J.; Luo, J.; Wu, Z.; Chen, J.; Zhou, Y.; Sun, Y.; Shen, Z.; Xu, N.; Yang, Y. Farmland Parcel Mapping in Mountain Areas Using Time-Series SAR Data and VHR Optical Images. Remote Sens. 2020, 12, 3733. [Google Scholar] [CrossRef]
  13. Lu, R.; Zhang, Y.; Huang, Q.; Zeng, P.; Shi, Z.; Ye, S. A Refined Edge-Aware Convolutional Neural Networks for Agricultural Parcel Delineation. Int. J. Appl. Earth Obs. Geoinf. 2024, 133, 104084. [Google Scholar] [CrossRef]
  14. Xie, Y.; Zheng, S.; Wang, H.; Qiu, Y.; Lin, X.; Shi, Q. Edge Detection with Direction Guided Postprocessing for Farmland Parcel Extraction. IEEE J. Sel. Top. Appl. Earth Obs. Remote Sens. 2023, 16, 3760–3770. [Google Scholar] [CrossRef]
  15. Li, M.; Long, J.; Stein, A.; Wang, X. Using a Semantic Edge-Aware Multi-Task Neural Network to Delineate Agricultural Parcels from Remote Sensing Images. ISPRS J. Photogramm. Remote Sens. 2023, 200, 24–40. [Google Scholar] [CrossRef]
  16. Song, W.; Wang, C.; Dong, T.; Wang, Z.; Wang, C.; Mu, X.; Zhang, H. Hierarchical Extraction of Cropland Boundaries Using Sentinel-2 Time-Series Data in Fragmented Agricultural Landscapes. Comput. Electron. Agric. 2023, 212, 108097. [Google Scholar] [CrossRef]
  17. Waldner, F.; Diakogiannis, F.I. Deep Learning on Edge: Extracting Field Boundaries from Satellite Images with a Convolutional Neural Network. Remote Sens. Environ. 2020, 245, 111741. [Google Scholar] [CrossRef]
  18. Wu, W.; Liu, Y.; Tang, L.; Yang, H.; Yang, L.; Li, J.; Chen, Z. SBDNet: A Scale and Edge Guided Bidecoding Network for Land Parcel Extraction. IEEE J. Sel. Top. Appl. Earth Obs. Remote Sens. 2025, 18, 8057–8070. [Google Scholar] [CrossRef]
  19. Zhang, C.; Bengio, S.; Hardt, M.; Recht, B.; Vinyals, O. Understanding Deep Learning Requires Rethinking Generalization. arXiv 2017, arXiv:1611.03530. [Google Scholar] [CrossRef]
  20. Xia, L.; Zhao, F.; Chen, J.; Yu, L.; Lu, M.; Yu, Q.; Liang, S.; Fan, L.; Sun, X.; Wu, S.; et al. A Full Resolution Deep Learning Network for Paddy Rice Mapping Using Landsat Data. ISPRS J. Photogramm. Remote Sens. 2022, 194, 91–107. [Google Scholar] [CrossRef]
  21. Guo, H.; Du, B.; Zhang, L.; Su, X. A Coarse-to-Fine Boundary Refinement Network for Building Footprint Extraction from Remote Sensing Imagery. ISPRS J. Photogramm. Remote Sens. 2022, 183, 240–252. [Google Scholar] [CrossRef]
  22. Lv, N.; Ma, H.; Chen, C.; Pei, Q.; Zhou, Y.; Xiao, F.; Li, J. Remote Sensing Data Augmentation Through Adversarial Training. IEEE J. Sel. Top. Appl. Earth Obs. Remote Sens. 2021, 14, 9318–9333. [Google Scholar] [CrossRef]
  23. Cheng, G.; Xie, X.; Han, J.; Guo, L.; Xia, G.-S. Remote Sensing Image Scene Classification Meets Deep Learning: Challenges, Methods, Benchmarks, and Opportunities. IEEE J. Sel. Top. Appl. Earth Obs. Remote Sens. 2020, 13, 3735–3756. [Google Scholar] [CrossRef]
  24. Kirillov, A.; Mintun, E.; Ravi, N.; Mao, H.; Rolland, C.; Gustafson, L.; Xiao, T.; Whitehead, S.; Berg, A.C.; Lo, W.-Y.; et al. Segment Anything. In Proceedings of the IEEE/CVF International Conference on Computer Vision, Paris, France, 1–6 October 2023; pp. 4015–4026. [Google Scholar]
  25. Mazurowski, M.A.; Dong, H.; Gu, H.; Yang, J.; Konz, N.; Zhang, Y. Segment Anything Model for Medical Image Analysis: An Experimental Study. Med. Image Anal. 2023, 89, 102918. [Google Scholar] [CrossRef] [PubMed]
  26. Wang, D.; Zhang, J.; Du, B.; Xu, M.; Liu, L.; Tao, D.; Zhang, L. SAMRS: Scaling-up Remote Sensing Segmentation Dataset with Segment Anything Model. Adv. Neural Inf. Process. Syst. 2023, 36, 8815–8827. [Google Scholar]
  27. Osco, L.P.; Wu, Q.; de Lemos, E.L.; Gonçalves, W.N.; Ramos, A.P.M.; Li, J.; Marcato, J. The Segment Anything Model (SAM) for Remote Sensing Applications: From Zero to One Shot. Int. J. Appl. Earth Obs. Geoinf. 2023, 124, 103540. [Google Scholar] [CrossRef]
  28. Ji, W.; Li, J.; Bi, Q.; Liu, T.; Li, W.; Cheng, L. Segment Anything Is Not Always Perfect: An Investigation of SAM on Different Real-World Applications. Mach. Intell. Res. 2024, 21, 617–630. [Google Scholar] [CrossRef]
  29. Huang, Z.; Jing, H.; Liu, Y.; Yang, X.; Wang, Z.; Liu, X.; Gao, K.; Luo, H. Segment Anything Model Combined with Multi-Scale Segmentation for Extracting Complex Cultivated Land Parcels in High-Resolution Remote Sensing Images. Remote Sens. 2024, 16, 3489. [Google Scholar] [CrossRef]
  30. Liu, X. A SAM-Based Method for Large-Scale Crop Field Boundary Delineation. In Proceedings of the 2023 20th Annual IEEE International Conference on Sensing, Communication, and Networking (SECON), Madrid, Spain, 11–14 September 2023; pp. 1–6. [Google Scholar]
  31. Kovačević, V.; Pejak, B.; Marko, O. Enhancing Machine Learning Crop Classification Models through SAM-Based Field Delineation Based on Satellite Imagery. In Proceedings of the 2024 12th International Conference on Agro-Geoinformatics (Agro-Geoinformatics), Novi Sad, Serbia, 15–18 July 2024; pp. 1–4. [Google Scholar]
  32. Karra, K.; Kontgis, C.; Statman-Weil, Z.; Mazzariello, J.C.; Mathis, M.; Brumby, S.P. Global Land Use/Land Cover with Sentinel 2 and Deep Learning. In Proceedings of the IEEE International Geoscience and Remote Sensing Symposium (IGARSS), Brussels, Belgium, 11–16 July 2021; pp. 4704–4707. [Google Scholar]
  33. Pizer, S.M.; Amburn, E.P.; Austin, J.D.; Cromartie, R.; Geselowitz, A.; Greer, T.; ter Haar Romeny, B.; Zimmerman, J.B.; Zuiderveld, K. Adaptive Histogram Equalization and Its Variations. Comput. Vis. Graph. Image Process. 1987, 39, 355–368. [Google Scholar] [CrossRef]
  34. Reza, A.M. Realization of the Contrast Limited Adaptive Histogram Equalization (CLAHE) for Real-Time Image Enhancement. J. VLSI Signal Process. Syst. Signal Image Video Technol. 2004, 38, 35–44. [Google Scholar] [CrossRef]
  35. Dai, J.; Li, Y.; He, K.; Sun, J. R-FCN: Object Detection via Region-Based Fully Convolutional Networks. In Proceedings of the Advances in Neural Information Processing Systems; Curran Associates, Inc.: Red Hook, NY, USA, 2016; Volume 29. [Google Scholar]
  36. Chen, L.-C.; Zhu, Y.; Papandreou, G.; Schroff, F.; Adam, H. Encoder-Decoder with Atrous Separable Convolution for Semantic Image Segmentation. In Proceedings of the European Conference on Computer Vision (ECCV), Munich, Germany, 8–14 September 2018; pp. 801–818. [Google Scholar]
  37. Sun, K.; Xiao, B.; Liu, D.; Wang, J. Deep High-Resolution Representation Learning for Human Pose Estimation. In Proceedings of the IEEE/CVF Conference on Computer Vision and Pattern Recognition, Long Beach, CA, USA, 15–20 June 2019; pp. 5693–5703. [Google Scholar]
  38. Zhou, Z.; Rahman Siddiquee, M.M.; Tajbakhsh, N.; Liang, J. Unet++: A Nested u-Net Architecture for Medical Image Segmentation. In Proceedings of the Deep Learning in Medical Image Analysis and Multimodal Learning for Clinical Decision Support: 4th International Workshop, DLMIA 2018, and 8th International Workshop, ML-CDS 2018, Held in Conjunction with MICCAI 2018, Granada, Spain, 20 September 2018; Proceedings 4; Springer: Berlin/Heidelberg, Germany, 2018; pp. 3–11. [Google Scholar]
  39. Song, W.; Wang, C.; Mu, X.; Fang, G.; Wang, H.; Zhang, H. Accurate Extraction of Fragmented Field Boundaries Using Classification-Assisted and CNN-Based Semantic Segmentation Methods. In Proceedings of the 2023 11th International Conference on Agro-Geoinformatics (Agro-Geoinformatics), Wuhan, China, 25–28 July 2023; pp. 1–4. [Google Scholar]
  40. Zhang, H.; Liu, M.; Wang, Y.; Shang, J.; Liu, X.; Li, B.; Song, A.; Li, Q. Automated Delineation of Agricultural Field Boundaries from Sentinel-2 Images Using Recurrent Residual U-Net. Int. J. Appl. Earth Obs. Geoinf. 2021, 105, 102557. [Google Scholar] [CrossRef]
  41. Cheng, J.; Ye, J.; Deng, Z.; Chen, J.; Li, T.; Wang, H.; Su, Y.; Huang, Z.; Chen, J.; Jiang, L.; et al. SAM-Med2D. arXiv 2023, arXiv:2308.16184. [Google Scholar]
  42. Pandey, S.; Chen, K.-F.; Dam, E.B. Comprehensive Multimodal Segmentation in Medical Imaging: Combining YOLOv8 with SAM and HQ-SAM Models. arXiv 2023, arXiv:2310.12995. [Google Scholar]
  43. Huang, J.; Wang, H.; Dai, Q.; Han, D. Analysis of NDVI Data for Crop Identification and Yield Estimation. IEEE J. Sel. Top. Appl. Earth Obs. Remote Sens. 2014, 7, 4374–4384. [Google Scholar] [CrossRef]
  44. Jakubauskas, M.E.; Legates, D.R.; Kastens, J.H. Crop Identification Using Harmonic Analysis of Time-Series AVHRR NDVI Data. Comput. Electron. Agric. 2002, 37, 127–139. [Google Scholar] [CrossRef]
  45. Zheng, B.; Myint, S.W.; Thenkabail, P.S.; Aggarwal, R.M. A Support Vector Machine to Identify Irrigated Crop Types Using Time-Series Landsat NDVI Data. Int. J. Appl. Earth Obs. Geoinf. 2015, 34, 103–112. [Google Scholar] [CrossRef]
Figure 1. Study areas: (a) Heilongjiang Province; (b) Youyi County; (c) southern part of Suihua City (A1); (d) western part of Jixi City (A2).
Agriculture 15 00976 g001
Figure 2. Overall experimental flow chart.
Agriculture 15 00976 g002
Figure 3. (a) Cropland masks are effective in removing impacts from non-cropland areas. (b) Errors in boundaries for non-overlapping predictions. (c) Overlapping prediction processes.
Agriculture 15 00976 g003
Figure 4. (a) Parcels were cropped using the 10 m results. (b) Three types of parcels and corresponding histogram features and interior edge features.
Agriculture 15 00976 g004
Figure 5. Different Point parameters lead to different segmentation results.
Agriculture 15 00976 g005
Figure 6. Comparison of parcel extraction results between the method of this study and other models across the three study areas. (a) Youyi county. (b) A1. (c) A2.
Agriculture 15 00976 g006
Figure 7. The 10 m parcels results obtained using Sentinel-2 images. (a) Youyi county. (b) A1. (c) A2.
Agriculture 15 00976 g007
Figure 8. The precision of classifying parcels under different thresholds for the two types of features: (a) histogram width, (b) edge ratio.
Agriculture 15 00976 g008
Figure 9. (a) The distribution of Point parameters to be divided in Youyi County after parameter adaptation. (b) Comparison before and after parameter adaptation.
Agriculture 15 00976 g009
Figure 10. Fine parcel extraction results for 0.65 m. (a) Overview of the three study areas. (b) Detailed presentation of parcel extraction results.
Agriculture 15 00976 g010
Figure 11. (a) High-voltage towers, (b) areas of uneven gray scale, (c) cluttered areas, and (d) internally complex parcels will cause SAM to produce false segmentations.
Agriculture 15 00976 g011
Figure 12. Comparison of parcels extracted from different temporal images in part of the A2 area (The red and white circles mark the significant differences in the parcel extraction results).
Agriculture 15 00976 g012
Figure 13. (a) Differences in parcels between different agricultural landscapes. (b) Comparison of rice parcel extraction performance under different resolutions in Youyi County.
Agriculture 15 00976 g013
Table 1. The satellite data used in this study.
SatelliteResolutionAreaDate
Sentinel-210 mYouyi County09/09/2022
A116/08/2022
A211/06/2022, 10/08/2022, 09/09/2022, 26/09/2022
GF-70.65 mYouyi County27/09/2022
A101/09/2022
A227/09/2022
Table 2. Comparison of accuracy metrics between the method of this study and other models across the three study areas.
ModelYouyiA1A2
PRF1IoUPRF1IoUPRF1IoU
FCN8s0.950.880.930.870.940.90.930.870.870.720.790.65
DeepLabv3+0.940.860.90.820.90.970.930.870.870.610.710.56
HRNet0.940.880.920.840.90.970.930.880.930.620.740.59
UNet++0.940.910.930.870.90.790.870.770.910.640.750.6
ours0.890.910.910.870.910.910.920.880.880.760.810.69
Table 3. Features ablation experiment.
FeaturePRF1
Histogram feature (70)0.960.80.87
Edge feature (1.5%)0.960.890.93
Histogram features + Edge features0.950.970.95
Table 4. Comparison of prediction time and training data requirements for different models.
ModelPredict Time (s)Sample SetsPre-Training
FCN8s0.0659
DeepLabv3+0.1902
HRNet0.0868
UNet++0.1263
Ours1.3645××
Note: Prediction time was obtained by averaging predictions of 100 images (1024 × 1024 pixels); √ indicates requirements while × indicates no need; the SAM Point parameter in our method is 30.
Table 5. Comparison of accuracy performance of parcel extraction for different temporal images.
DatePΔRΔF1ΔIoUΔ
6.110.87−0.020.74−0.090.8−0.040.67−0.05
8.100.88−0.010.7−0.130.78−0.060.64−0.08
9.90.88−0.010.76−0.070.81−0.030.69−0.03
9.260.87−0.020.73−0.10.79−0.050.66−0.06
6.11 + 8.10 + 9.9 + 9.260.89-0.83-0.84-0.72-
Disclaimer/Publisher’s Note: The statements, opinions and data contained in all publications are solely those of the individual author(s) and contributor(s) and not of MDPI and/or the editor(s). MDPI and/or the editor(s) disclaim responsibility for any injury to people or property resulting from any ideas, methods, instructions or products referred to in the content.

