Article

Exploring the Impact of Green Technology Innovation on Rural Habitat System Resilience

1
College of Landscape Architecture, Central South University of Forestry and Technology, Changsha 410004, China
2
School of Economics and Management, Xinjiang Agricultural University, Urumqi 830052, China
*
Author to whom correspondence should be addressed.
Agriculture 2025, 15(9), 925; https://doi.org/10.3390/agriculture15090925
Submission received: 24 March 2025 / Revised: 18 April 2025 / Accepted: 20 April 2025 / Published: 24 April 2025
(This article belongs to the Section Agricultural Economics, Policies and Rural Management)

Abstract

:
Rural areas play an important role in the energy transition process, and understanding the impact of green innovation on rural habitat system resilience is highly important. Using data from 30 provinces in China from 2011 to 2022, this study employs the entropy method to quantify rural habitat system resilience and examines the relationship between green innovation and rural habitat system resilience using a fixed-effects model. The results indicate that for every one-unit increase in green innovation, rural habitat system resilience increases by 0.012–0.018 units. Robustness tests, including replacing the core explanatory variables, introducing a one-period lag for core explanatory variables, and substituting a fixed-effects model with the system GMM model, confirm the reliability of the findings. Heterogeneity analysis reveals that green innovation has the greatest effect on enhancing rural habitat system resilience in China’s central region. Further analysis demonstrates that green innovation indirectly strengthens rural habitat system resilience by increasing public concern about environmental pollution and reinforcing environmental regulation. These findings provide a scientific basis for improving the environmental resilience of rural communities by integrating life, production, and ecological systems through technological innovation in the context of carbon neutrality. They also contribute to the advancement of sustainable development through nature-based solutions.

1. Introduction

Against the backdrop of the global sustainable development agenda, green development has become a strategic imperative for overcoming resource and environmental constraints while achieving harmony between economic growth, social progress, and ecological sustainability [1,2,3]. The Paris Agreement and other international treaties emphasize the urgency of green development strategies for sustainable economic growth. This approach prioritizes resource optimization, production innovation, industrial restructuring, and ecological economic transformation, thereby improving environmental quality and overall well-being. Among these strategies, green technologies, including sustainable agricultural practices, renewable energy solutions, and ecological restoration techniques, serve as the core driving force for translating green development goals into tangible improvements in rural resilience by addressing challenges such as climate vulnerability, resource scarcity, and ecological degradation [4].
Rural areas are crucial for green development, as they embody the intersection of rural livelihoods, production systems, and ecological processes. Their environmental resilience significantly influences the quality of life and long-term sustainability of rural communities. Rural habitat system resilience refers to the ability of these systems to maintain structural and functional stability, quickly recover from disturbances, and adapt to challenges such as natural disasters, resource shortages, and ecological degradation [5,6]. Climate change has intensified the frequency of extreme weather like heavy rain, drought, and flooding, threatening rural infrastructure, agricultural productivity, and livelihoods. Meanwhile, unsustainable rural economic models characterized by intensive resource exploitation cause ecological degradation, pollution, and habitat instability, further weakening rural resilience. Here, green technologies perform a dual function. They not only mitigate environmental pressures through pollution control and resource recycling but also directly enhance the adaptive capacity of rural systems. For instance, precision agriculture technologies improve drought resistance in croplands, while biogas and solar energy solutions reduce dependency on fossil fuels and strengthen energy security in remote areas [7,8].
Green development, a core aspect of sustainability, promotes the integrated growth of economic, social, and environmental systems. It aims to enhance development quality and efficiency while minimizing resource consumption and environmental impact [4,9]. In rural areas, this vision is realized through targeted green technological interventions. Sustainable agricultural technologies help reduce chemical inputs, mitigate surface pollution, preserve soil health, and enhance agricultural resilience. Ecological restoration efforts, guided by green engineering techniques, support the rehabilitation of degraded rural ecosystems and strengthen their resistance to natural disasters. The adoption of renewable energy sources, such as solar and wind power, mitigates rural energy shortages, reduces emissions, and creates a cleaner living environment [10,11].
However, the current literature on green development reveals a notable imbalance. Prior research has predominantly centered on urban green development, overlooking the complex challenges in rural areas. The implementation of green development in rural regions indeed faces substantial hurdles, and the role of green technologies in bolstering rural habitat resilience remains woefully underexplored. Existing studies rarely delve into how these technologies can counter climate change impacts on rural ecosystems or enhance the capacity of local communities to build resilient habitats. This lack of in-depth investigation stands in stark contrast to the extensive research on urban green space planning, sustainable urban transportation, and pollution reduction in urban settings [12,13]. Studying how green development can effectively enhance rural settlements and boost resilience is of great theoretical and practical significance. This research addresses this core issue by analyzing panel data from 30 Chinese provinces from 2011 to 2022. Using the entropy value method, it quantitatively assesses rural habitat system resilience, while fixed-effects modeling is employed to examine the relationship between technological innovation and rural environment resilience, controlling for individual and temporal effects to ensure robust findings. Theoretically, this study contributes to sustainable development theory, refining the energy–environment–socioeconomic interaction framework and introducing new interdisciplinary perspectives. Practically, the results provide empirical support for China’s rural revitalization initiatives, guiding local policy designs and rural development strategies while helping enterprises and research institutes in targeted green technology innovation. In addition, China’s experience in rural green technology adoption can serve as a reference for the global international community, aiding rural areas worldwide in addressing green development challenges, enhancing environment resilience, and advancing sustainable rural development.

2. Literature Review and Research Hypothesis

China’s rural revitalization strategy takes green development as one of its core concepts [14,15], emphasizing the reduction of resource waste, ecological protection, and the transformation of ecological value into economic benefits in agriculture and rural construction. In recent years, significant improvements in rural ecological conditions have been achieved alongside economic growth, making the application of green technological innovations a key area of interest among researchers [16].

2.1. Green Technology Innovations

Green technology innovation is an interdisciplinary approach to sustainable development that covers multiple fields. While it focuses on economic benefits and engineering technology, green technology also emphasizes reducing environmental impacts and maintaining ecological balance to support the harmonious coexistence between humanity and the natural environment. In rural areas, its application extends across sectors such as energy, agriculture, and environmental management [17]. According to technology innovation diffusion theory, new technologies are gradually adopted within a social system through specific channels [18]. As an emerging technology, the promotion of green technology innovation in rural areas follows this pattern. Once rural residents and enterprises are exposed to the benefits of green technologies, they tend to gradually adopt them based on their understanding, perceived economic advantages, and local resource conditions. For example, in the energy sector, the advancement of renewable technologies such as solar and wind power, supported by favorable policies, has led to increased clean energy adoption in rural regions. Policy support creates conditions for the introduction of green technologies, while the convenience and economic benefits of the technologies encourage continued use, thus promoting the popularization of clean energy in rural areas [19].
In the energy sector, research on renewable energy adoption in rural communities has revealed that policy support and technological innovation have led to a transition toward cleaner energy sources such as solar and wind power, improving energy efficiency and reducing environmental impacts [20]. In agricultural production, precision agriculture technology and eco-agricultural practices are key manifestations of green technology innovation. Precision agriculture technology, based on information theory and cybernetics, uses modern information technologies such as satellite positioning, geographic information systems, and remote sensing technology to enable real-time monitoring and precise control of the crop growth environment, thereby reducing input costs and minimizing environmental pollution. Eco-agricultural practices, based on the principles of material cycling and energy flow within ecosystems, aim to establish agricultural production models characterized by efficient resource utilization and ecological sustainability. For instance, certain eco-farms have implemented a “breeding–biogas–planting” cycle model, enabling the resource utilization of livestock manure, which not only reduces pollution but also provides organic fertilizers to enhance crop quality and yield [20]. In the field of environmental governance, green technology innovation is mainly applied in areas such as sewage treatment and solid waste treatment. According to pollution control theory in environmental science, these technologies use physical, chemical, and biological methods to effectively treat rural sewage and waste, thereby reducing pollutant emissions and improving the quality of the rural ecological environment [21]. In some regions, biological treatment technologies are employed to purify domestic sewage to meet discharge standards, thus protecting local water resources [22,23].
Currently, the main methods for measuring green technology include micro-level technical assessment, Data Envelopment Analysis (DEA), and evaluation based on the number of green patent grants. Micro-level technical assessment analyzes the research and development process and performance of technologies from a detailed, technology-specific perspective [24]. DEA evaluates the efficiency of green technology by analyzing the relationship between inputs and outputs [25]. The number of green patent grants serves as a direct indicator of the outcomes of green technology innovation [26].

2.2. Rural Habitat System Reliance

The concept of rural human settlement environment originates from the theory of human settlements and represents a subcategory of human-inhabited areas [27]. In the 1990s, Wu Liangyong [28] first introduced the theory of human settlements to China and constructed a theoretical framework encompassing natural, human, social, residential, and supporting systems based on China’s national conditions. Building on this theoretical foundation, Chinese scholars have further developed the concept of the rural human settlement environment through practical observations and theoretical reflections [29]. Scholars define rural habitat resilience as a system’s capacity to maintain structural and functional stability, recover from internal and external shocks, and adapt to evolving environmental conditions [30]. Building on this definition, researchers have constructed a multidimensional assessment system using the DPSIR framework and the entropy method to quantify rural habitat resilience, with findings indicating substantial regional disparities in resilience levels [31].
From the perspective of green technology innovation, practices such as green agriculture, ecological restoration, and renewable energy utilization are believed to enhance rural habitat resilience. For example, green agricultural technologies reduce the use of chemical inputs, thereby protecting soil ecosystems and increasing the stability and adaptability of agricultural production systems [21]. Expanding clean energy use in rural areas addresses energy shortages, reduces carbon emissions, and fosters a healthier living environment [32]. Based on the above theories and research status, Hypothesis 1 is proposed:
Hypothesis 1. 
The application of green technology innovation in agriculture positively affects the resilience of the rural habitat system. Promoting precision and eco-agricultural technologies is expected to improve agricultural efficiency, reduce resource waste and pollution, and enhance the stability and adaptability of the rural habitat system.
Although direct studies on the impact of green technological innovation on rural habitat resilience are limited, related research offers valuable insights. In the field of the agricultural economy, Luo et al. [33]. reported that improved agricultural production efficiency positively influences economic resilience. Since green technological innovations enhance agricultural productivity, they likely contribute to a more robust rural economic base, reinforcing overall habitat resilience. Likewise, studies on renewable energy adoption have revealed that transitioning to clean energy reduces environmental pollution and stabilizes energy supplies, thereby enhancing the resilience of rural environmental systems [32]. While research on the relationship between green technology innovation and rural habitat system resilience has advanced, the indirect pathways of influence through public perception and government action remain underexplored. Regarding public awareness of environmental pollution, the existing literature indicates that green technology implementation can trigger environmental changes in rural areas, potentially influencing public consciousness. For example, the utilization of green agricultural technologies, which reduce chemical inputs, can lead to observable environmental enhancements [34]. However, the specific mechanisms through which these changes influence public behavior and ultimately enhance rural habitat system resilience are not fully understood. In terms of environmental regulation, studies suggest that government policies can incentivize green technology adoption [35]. Nevertheless, in rural contexts, the ways in which green technology innovation contributes to regulatory change and its subsequent effects on habitat resilience require more in-depth analysis. Based on the above discussion, Hypotheses 2 and 3 are proposed:
Hypothesis 2. 
Public attention to environmental pollution positively moderates the relationship between green innovation and the resilience of the rural habitat system. Specifically, higher levels of public concern strengthen the positive impact of green innovation on habitat system resilience, while lower levels of concern weaken this effect.
Hypothesis 3. 
The strength of environmental regulation positively moderates the relationship between green innovation and the resilience of the rural habitat system. When environmental regulation is stronger, green innovation more effectively enhances rural habitat resilience; when regulation is weaker, the effect is less pronounced.

2.3. Research Contributions

Although previous studies have explored green technological innovation in rural development and the determinants of rural resilience, few have systematically analyzed the causal link between these two factors. Most existing literature either focuses on technology adoption or resilience assessment but does not integrate these perspectives. This study bridges this gap by investigating how green technological innovations influence rural habitat resilience over time. The main innovations of this study are as follows:
(1) This study examines both the intermediate and long-term effects of green technological innovation on rural habitat resilience, analyzing panel data from 30 provinces in China from 2011—2022 to capture dynamic changes over time.
(2) This study takes into account regional variations in green technology adoption, conducting heterogeneity tests across the Eastern, Central, and Western regions as well as the Yangtze River Economic Belt. This approach ensures that the results of the study are more precise and policy-relevant.
(3) By employing the entropy method to measure rural habitat resilience and utilizing a fixed-effects model to control for individual and time-specific effects, this study provides a novel analytical framework for investigating rural development issues, thereby contributing to methodological advancements in this field.

3. Model Selection and Data Sources

3.1. Empirical Framework

This study constructs a framework for the impact of green technological innovation on rural habitat system resilience (as shown in Figure 1). Green technological innovation is treated as the independent variable, and rural habitat system resilience serves as the dependent variable. The model introduces public concern about environmental pollution and environmental regulatory strength as moderating variables.
Public concern moderates the relationship positively by influencing factors such as environmental awareness, behavioral change, and technological promotion. Similarly, regulatory strength moderates the effect through mechanisms including technological application, industrial transformation, and pollution reduction. Specifically, higher levels of public concern and regulatory strength amplify the positive impact of green technological innovation on rural habitat system resilience, while lower levels diminish this effect. This study uses a fixed effects model to analyze variable relationships, clarify the mechanisms of influence, and provide theoretical and practical guidance for related fields.
To explore the impact of green technological innovation on rural habitat system resilience under energy transition, a fixed effects model is employed to analyze the relationships among variables. The model is as follows:
R H S E S i , t = α 0 + β 1   ln G P i , t + β 2 C o n t r o l i , t + δ 1 Y e a r t + θ 1 I n d u s t r y i + ε i , t
where R H S E S i , t denotes the rural habitat system resilience of province i at period t, measured using an entropy-based evaluation system, covering economic, social, ecological, infrastructure, and energy dimensions; ln G P i , t indicates the level of green innovation of the ith region at time t, obtained by taking the natural logarithm of green patent authorization; C o n t r o l i , t includes key control variables such as agricultural productivity, employment proportion in agriculture-related sectors, the primary industry’s value-added proportion, environmental protection expenditures, rural infrastructure, and the agricultural product price index; I n d u s t r y i denotes area fixed effects, controlling for invariant regional characteristics of each area; Y e a r t denotes time-fixed effects, controlling for factors common to all regions at each point in time; and ε i , t is the error term.
Green patent authorization reflects the output of green innovation results in a region [36]. A higher value indicates a greater level of green innovation, which, in the context of energy transition, is expected to enhance rural habitat system resilience by improving clean energy supply capacity and optimizing energy efficiency. These control variables affect rural habitat system resilience in different ways.
To further assess how green innovation contributes to rural habitat system resilience, we assess the roles of public attention to environmental pollution (PAEP) and intensity of environmental regulation (IER) as potential moderating factors. The corresponding mechanism models are as follows:
P A E P i , t = α 0 + β 1   ln G P i , t + β 2 C o n t r o l i , t + δ 1 Y e a r t + θ 1 I n d u s t r y i + ε i , t
I E R i , t = α 0 + β 1   ln G P i , t + β 2 C o n t r o l i , t + δ 1 Y e a r t + θ 1 I n d u s t r y i + ε i , t
where P A E P i , t denotes the public concern about environmental pollution in province i at time t, and I E R i , t denotes the strength of environmental regulation in region i at time t.

3.2. Data Measurement and Description

3.2.1. Indicator System for Evaluating Rural Habitat Resilience

In the process of constructing the evaluation index system for the rural human settlement environment in China, this study widely draws on various achievements. On the one hand, it refers closely to the “Guiding Opinions on Promoting the Construction of the Rural Human Settlement Environment Standard System”, jointly issued by seven ministries and commissions, as an important policy guide. On the other hand, it comprehensively synthesizes the existing research results [37,38,39,40] to draw on the wisdom of predecessors. Considering the vast territory of rural China, the highly complex, regionally diverse human settlement environment, and the huge differences in natural resource endowments, this study closely combines the actual situations of various regions, carefully compares the similarities and differences of relevant statistical indicators, and strictly adheres to the principles of scientific rigor, completeness, regional applicability, effectiveness, and data accessibility. Starting from the five interrelated and distinctive system dimensions of economy, society, ecology, infrastructure, and energy, through a rigorous screening process, 26 representative indicators are carefully selected to successfully establish the evaluation index system for the rural human settlement environment in China, which can accurately reflect the dynamic development trend of the quality of the rural human settlement environment. The details of specific indicators can be seen in Table 1. In addition, this study adopts the entropy weight method, an objective data-driven assignment method, to construct the evaluation index system for rural habitat resilience. It accurately determines the index weights based on the variability of data, providing a scientific and objective quantitative basis for the entire research process and effectively ensuring the reliability and accuracy of the research results.
To ensure consistency and comparability among the indicators in the evaluation system, the extreme difference method is applied. Indicators are generally categorized into positive and negative types and standardized using the following formulas:
Y i j = X i j X m i n X m a x X m i n
Y i j = X m a x X i j X m a x X m i n
where Xij and Yij are the original and standardized values of the jth indicator for the ith research unit, respectively; and Xmax and Xmin are the maximum and minimum values of the jth indicator under all research units.
After standardization, the weight of each indicator is determined. The proportion of the jth indicator for the ith research unit is computed using the following formula:
P i j = Z i j i = 1 n Z i j
Then, the entropy (e) of the jth metric is represented by the following expression:
e j = 1 ln n × i = 1 n p i j × ln ( p i j )
Finally, the weights of the entropy indicators are calculated:
w j = 1 e j j = 1 m 1 e j

3.2.2. Selection of Green Innovation Levels

This article is based on the Green List of the International Patent Classification (IPC) compiled by the World Intellectual Property Organization (WIPO). According to the United Nations Framework Convention on Climate Change (UNFCCC), this list classifies green patents into seven major categories: agriculture and forestry, waste management, nuclear energy regeneration, administrative regulation design, transportation, energy conservation, and alternative energy sources, and it assigns a classification number (IPC) for each category. If a patent matches the IPC classification number, it is considered a green patent. In this study, the natural logarithm of the total number of granted green patents (lnGI) is used as a proxy variable for green innovation [26].

3.2.3. Selection of Control Variables

Several control variables were selected to accurately analyze the relationships among core variables. Agricultural productivity (lnAP) is expressed as the logarithm of the ratio of the gross output value of agriculture, forestry, animal husbandry, and fishery to the number of people employed in these sectors. Higher agricultural productivity increases farmers’ incomes, contributes to rural environmental management, optimizes the production structure, and enhances rural areas’ ability to cope with external shocks. The proportion of employed persons in agriculture, forestry, animal husbandry, and fisheries urban units (PEU-AFHFU) represents the share of employed persons in these sectors within urban units. This factor has a complex effect on rural resilience. While labor migration to cities and subsequent returnees can bring resources for rural development, excessive outflow can lead to labor shortages, weakening the rural economy.
The proportion of added value of the primary industry (AGDP) reflects the degree of dependence of the rural economy on agriculture. Overreliance on this sector can likely lead to a single economic structure, making rural areas more vulnerable to external shocks, such as those associated with the energy transition. This vulnerability weakens resilience by limiting investment in rural development and hindering talent retention. Expenditure on environmental protection (LEP) reflects the government’s investment in rural environmental sustainability. While theoretically contributing to environmental improvement and resilience, its effectiveness may be constrained by a time lag and inefficient use of funds.
The level of rural infrastructure (lnLRI) encompasses transportation, communication, energy supply, and other essential services. Improved infrastructure facilitates agricultural product sales, enhances information exchange, ensures a stable energy supply, fosters economic development, and improves quality of life, thereby strengthening rural resilience. The production price index of agricultural products (PPIAP), standardized to 100 in the base year, reflects changes in agricultural product prices. While rising prices can increase farmers’ incomes, excessive fluctuations lead to economic instability. However, empirical evidence suggests that its overall impact on rural habitat system resilience is relatively small.

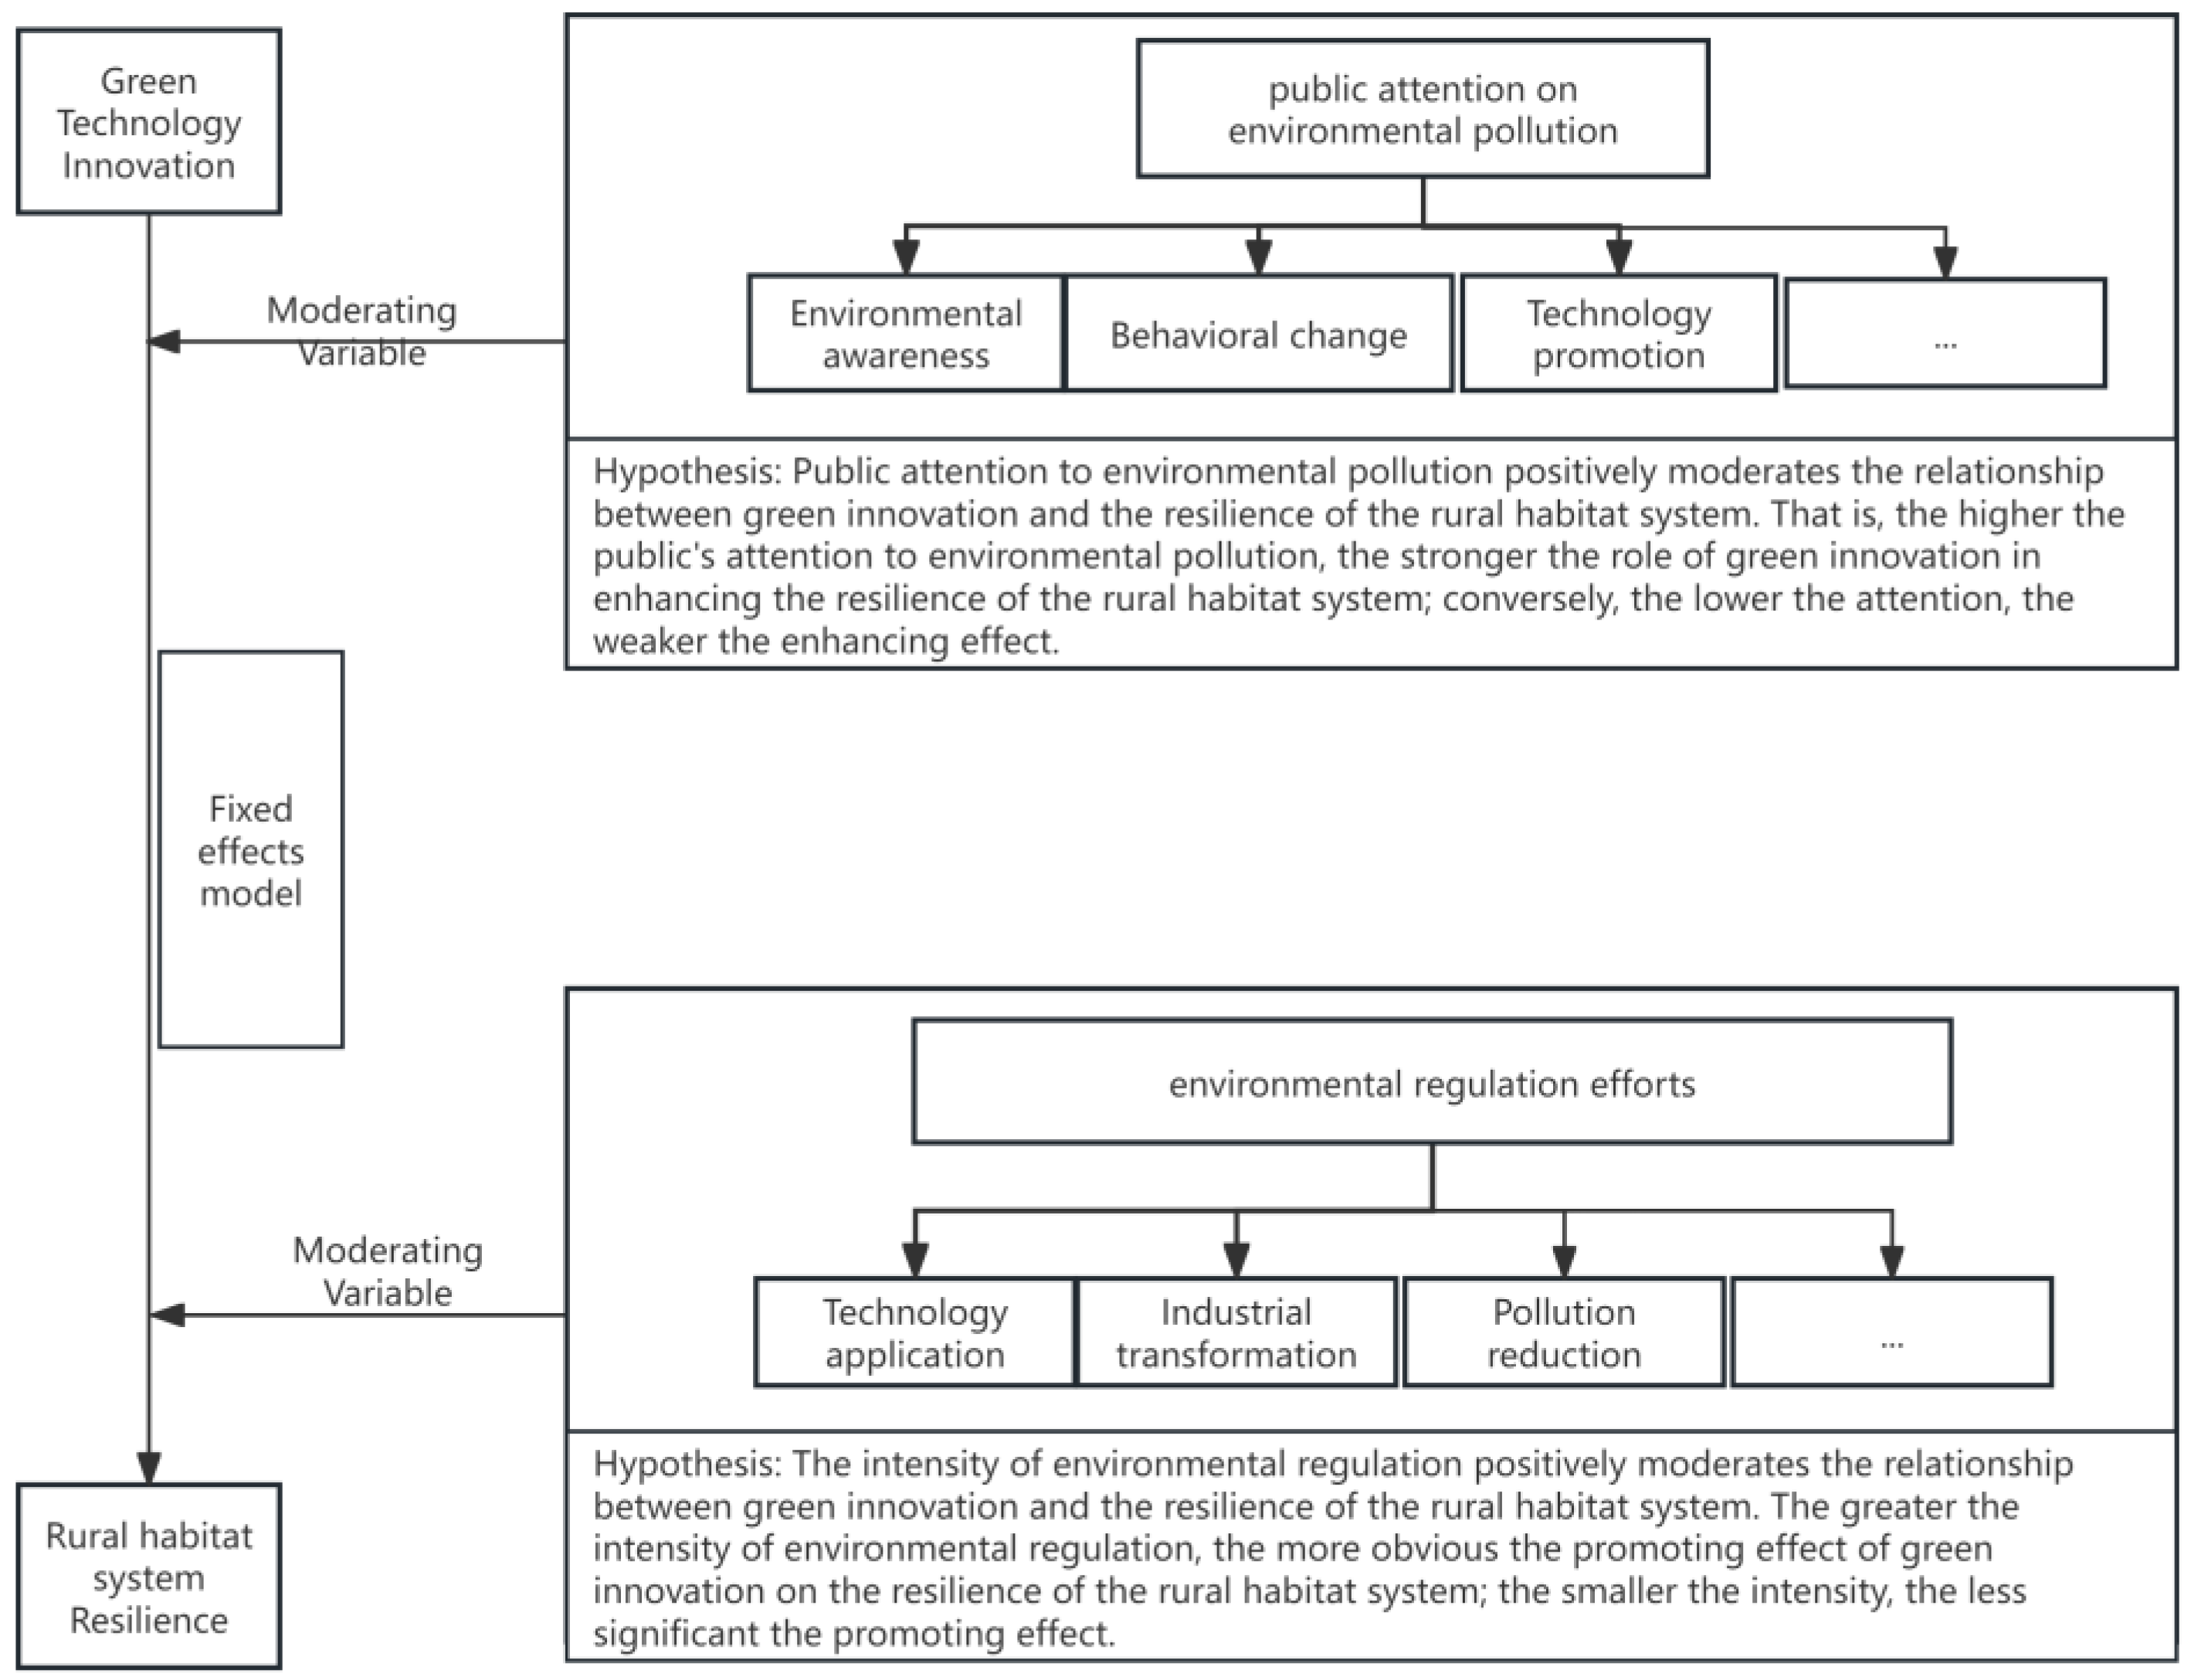
3.2.4. Selection of Moderating Variables

Public attention to environmental pollution (PAEP) and the intensity of environmental regulation (IER) were selected as moderating variables to examine their effects on the relationship between green innovation and the resilience of rural habitat systems in the context of the energy transition.
Public attention to environmental pollution (PAEP) is measured using the annual search index for environmental pollution [41]. As participants and beneficiaries of rural development, the public plays an important role in moderating the relationship between green innovation and rural habitat system resilience. Heightened public concern exerts strong social pressure, prompting the government to increase environmental regulations and encouraging enterprises and research institutions to accelerate the development and application of green innovation technologies. Moreover, greater public concern fosters increased acceptance of and participation in green innovation initiatives [42,43]. Rural residents are more likely to adopt environmentally friendly agricultural inputs and energy-efficient appliances, facilitating the promotion and diffusion of green innovations and further strengthening their positive impacts on rural habitat system resilience.
The intensity of environmental regulation (IER) is measured by the word frequency share of environmental regulation intensity [44]. Government environmental policies play an important role in guiding and regulating economic behavior. In the relationship between green innovation and rural habitat system resilience, environmental regulation serves as a critical moderating factor. Strict policies create a favorable environment for green innovation and incentivize enterprises and research institutions to invest in green technology development. Through the implementation of strict environmental standards, environmental tax policies, and subsidies for green innovation, the government encourages enterprises to increase their research and development efforts, promoting the adoption of green innovations [45,46].
Stronger environmental regulations drive rural enterprises to phase out outdated production capacities and adopt advanced clean energy technologies, as well as energy-saving and emission-reduction equipment. These measures not only improve rural energy efficiency and reduce environmental pollution but also support the green transformation of rural industries, strengthen economic resilience, and thus enhance the overall resilience of rural habitat systems [47,48].

3.3. Sources of Variables and Descriptive Statistics

The dataset comprises information from 30 provinces in China covering the period of 2011 to 2022, providing a robust foundation for the scientific validity of the analysis and the accuracy of the conclusions. Data on rural habitat system resilience were derived from a multidimensional evaluation index system, sourced from authoritative yearbooks such as the China Statistical Yearbook (http://www.stats.gov.cn/sj/ndsj/) (accessed on 1 April 2025), China Rural Statistical Yearbook (https://inds.cnki.net/knavi/yearbook/Detail/HBYY/YMCTJ?NaviID=&NO=N2023010191) (accessed on 1 April 2025), and China Science and Technology Statistical Yearbook (https://inds.cnki.net/knavi/yearbook/Detail/HBYY/YBVCX?NaviID=&NO=N2023030111) (accessed on 1 April 2025).
The level of green innovation (lnGP) was measured using green patent grants, with data obtained from the China Research Data Service Platform (CNRDS) (www.cnrds.com) (accessed on 1 April 2025). After an initial screening, minor data gaps were identified in a small number of provinces. In most cases, linear interpolation was used to address these missing values. Following comprehensive data processing, a total of 360 sample observations were obtained.
Descriptive statistics for the key variables are presented in Table 2, alongside their respective distributional characteristics. These characteristic differences provide an important foundation for the subsequent in-depth investigation of the impact of green innovation on rural habitat system resilience within the context of the energy transition, helping to reveal the underlying relationships and mechanisms among the variables.

4. Empirical Analysis

4.1. Cluster Analysis

As shown in Table 1, provinces such as Zhejiang, Jilin, and Qinghai have performed excellently in terms of the rural living environment and are categorized as the “Excellence-Preceding Category”. Zhejiang has achieved notable progress in rural environmental improvement, and the integrated development of ecological industries demonstrates strong momentum. Utilizing its low population density and excellent ecological foundation, Jilin exhibits significant rural ecological advantages. Qinghai has made substantial investments in ecological protection and has achieved notable results in grassland management.
Several provinces, including Shandong, Hebei, Jiangxi, and Jiangsu, are classified under the “Steady Development Category”, with rural living environments at a moderate level. In recent years, these regions have consistently advanced infrastructure construction and environmental governance. Supported by policy initiatives and optimization of industrial structures, their rural environments have gradually improved. For example, Shandong has increased investment in garbage and sewage treatment, while Jiangsu has promoted the construction of “beautiful countryside” initiatives, both contributing to tangible improvements.
Provinces such as Henan, Xinjiang, and Anhui are in the “Breakthrough and Improved Category”, indicating that their rural living environments require urgent improvements. As a populous province, Henan faces significant pressure in environmental governance. Restricted by its geographical conditions and ecological vulnerability, Xinjiang faces high difficulty in infrastructure construction. Anhui needs to further coordinate the relationship between ecological protection and rural development.
Municipalities directly under the Central Government, such as Chongqing and Shanghai, as well as provinces including Liaoning and Gansu, belong to the “Optimization and Transformation Category”. These areas face complex conditions characterized by a high degree of urban–rural integration, dense populations, and substantial environmental pressures, or they require more precise policy frameworks for effective ecological protection and rural development.
Provinces such as Sichuan, Fujian, and Beijing are classified under the “Consolidation and Expansion Category”, each exhibiting distinct strengths and shortcomings in improving the rural living environment. Remote areas in Sichuan still require further attention. Fujian promotes environmental enhancement through rural tourism. Beijing benefits from advanced infrastructure and public services but must strengthen its ecological protection measures (Table 3).
Overall, there are pronounced regional disparities in the quality of rural living environments across Chinese provinces. Influenced by geography, economic conditions, and policy frameworks, the development status of rural environments varies significantly among regions.

4.2. Benchmark Regression Model Analysis

To determine the appropriate model, we conducted an F-test and a Hausman test successively. First, we carried out the F-test for the null hypothesis of “the existence of a mixed effects model”, then we conducted the Hausman test for the null hypothesis of “the existence of a random effects model”. The test results are shown in Table 4.
Upon analysis, it was observed that the p-values of both the F-test and the Hausman test were less than 0.01. According to statistical principles, both null hypotheses were rejected. This indicates that the fixed effects model performed better in explaining the data, and it was more suitable for this study compared to the mixed effects model. Therefore, the panel data model of this study adopted the fixed effects model.
Table 5 shows the results of the fixed effects model assessing the impact of technological innovation and related factors on rural habitat system resilience (RHSES) during the energy transition. The coefficients of green innovation (lnGP) ranged from 0.012 to 0.018 across models (1) to (7), all of which were significant and positive. This indicates that controlling for other variables, a one-unit increase in green innovation corresponds to a 0.012–0.018 unit increase in rural habitat system resilience. Green technological innovation can optimize energy efficiency and reduce environmental pollution, thus strengthening the resilience of rural habitats in the face of energy transition challenges.
In terms of control variables, the coefficient for agricultural productivity (lnAP), fluctuating between 0.009 and 0.013 and mostly significant, indicates its positive contribution to rural habitat system resilience, as it boosts output and farmer income, enabling better environmental governance and infrastructure development. Conversely, the coefficient for the primary industry value-added ratio (AGDP), ranging from −0.002 to −0.003 and significant, shows that an increase in this ratio reduces resilience, likely due to resource dependency making rural areas vulnerable to commodity price swings (e.g., a coal mining-dependent region suffering from price drops), lack of economic diversification leaving few alternatives during industry-specific disruptions, and environmental degradation from primary industry activities like deforestation or mining pollution.

4.3. Robustness Tests

To ensure the reliability of the empirical results and mitigate potential bias from model specification and variable selection, robustness tests were conducted in three aspects, described below.

4.3.1. Replacement of Core Explanatory Variables

To test the robustness of the findings, green innovation was replaced with the natural logarithm of the number of green patent applications (lnNGPA). While granted patents represent finalized innovations, patent applications reflect the initial investment and activity levels in green technology development. As shown in Table 6, the coefficient for lnNGPA was 0.015 and was significant at the 5% level, indicating that green innovation positively influences rural habitat system resilience regardless of the explanatory variable used. These findings suggest that the relationship between green innovation and rural habitat system resilience is robust and not significantly affected by variations in the measurement of explanatory variables.

4.3.2. Core Explanatory Variables Lagged by One Period

Drawing on a study by Zhao et al., to tackle potential endogeneity issues, we utilized a one-period lag for all control variables in the regression analysis [49]. The core explanatory variable, the green innovation level (lnGP), lagged by one period (L.lnGP) and subsequently underwent regression analysis. As shown in column (2) of Table 6, the coefficient was 0.013 and was significantly positive at the 10% level. This result is consistent with the coefficient direction in the original fixed-effects model. It reveals that the positive impact of green innovation on the resilience of the rural habitat system exhibits a time lag. Put differently, the benefits of early-stage green technological innovations need time to enhance the resilience of the rural system. This finding not only validates the conclusions of the original model but also strengthens the reliability of our overall results.

4.3.3. Replacement of the Fixed Effects Model

To further test robustness, the regression was re-estimated through ordinary least squares (OLS) regression within the framework of an alternative fixed-effects model. As shown in column (3) of Table 6, the coefficient for lnGP was 0.010 and remained significantly positive at the 5% level, similar to the results of the original fixed effects model. The coefficient signs and significance levels of the control variables exhibited no significant changes, demonstrating that variations in model selection did not substantially affect the empirical findings. These results confirm the robustness of the study’s conclusions.

4.4. Endogeneity Test

In considering the stability of evaluation methods and indicators, this study focuses on the analysis of key factors. During the main effect analysis, due to the need to properly address the issues of endogeneity and weak instrumental variables, referring to the conclusions drawn by scholars such as Blundell [50] through Monte Carlo simulation experiments—that is, under the condition of a finite sample—the estimation results of the system GMM show higher effectiveness. Therefore, this study uses the system GMM for regression analysis in the main effect analysis. By observing Table 7, it can be seen that the regression coefficients and significance of the first-order lag term of rural habitat system resilience (RHSES) and green innovation (lnGP) are consistent with the models in Table 5, which provides strong evidence for verifying the stability of the main effect test results. In addition, during this test, the p-value of the AR (1) test in Table 7 is less than 0.1, and the p-value of the AR (2) test is greater than 0.1, indicating that there is first-order autocorrelation and second-order autocorrelation in the data, but no third-order autocorrelation; the p-value of the Hansen test is greater than 0.1, which means that the selected instrumental variables are valid.
This study adopts the two-way fixed-effects model and incorporates a comprehensive set of control variables to address endogeneity issues caused by omitted variables. However, the conclusions derived previously may still be affected by endogeneity resulting from two-way causal relationships. To address this, this paper follows the research method of Xu Yuming et al. [51], selects the explanatory variables lagged by one period as instrumental variables, and uses the two-stage least-squares method (2SLS) to further identify the impact of green technology innovation on the resilience of the rural habitat system. The relevant results are presented in Table 8.
Before applying the instrumental variables, it is essential to test their validity. Table 8 shows the regression results of the instrumental variables. Regarding the weak instrumental variable test, the Cragg–Donald Wald F values exceed the 10% critical value set by Stock–Yogo, indicating that the weak instrument test has been successfully passed. The K-Paark LM statistic rejects the null hypothesis at the 1% significance level, confirming the identifiability of the instrumental variables. After accounting for endogeneity, the regression coefficient of green technology innovation on the resilience of the rural habitat system is significant at the 1% level, further supporting the robustness of the benchmark model.

4.5. Heterogeneity Test

4.5.1. Regional Heterogeneity Across Eastern, Central, and Western China

Table 9 shows the results of the regional heterogeneity test, examining the impact of green innovation (lnGP) on rural habitat system resilience across Eastern, Central, and Western regions of China. The findings indicate regional variations in the effects of green innovation. In the Eastern region, the coefficient for lnGP is 0.009 and statistically insignificant, which may be due to the region’s diversified economic structure, where rural development is influenced by multiple intertwined factors. Additionally, the Eastern region has an already mature industrial base where marginal effects are weaker, further weakening the role of green innovation.
In the Central region, the coefficient for lnGP is 0.040 and significantly positive at the 1% level. This suggests that green innovation effectively promotes rural habitat system resilience, as the region undergoes industrial upgrading and rapid economic growth. Green innovations, such as sustainable agricultural technology and clean energy applications, are more readily integrated into rural life, improving the ecological environment and strengthening the countryside’s ability to adapt to energy transitions.
In the Western region, the coefficient for lnGP is −0.023 and significantly negative at the 1% level. This suggests that, in the short term, green innovation reduces rural habitat system resilience. The Western region’s weaker capacity for technological absorption and transformation, coupled with the high initial investment costs of green innovation, makes it difficult to obtain immediate benefits and adds to the economic pressures on rural areas.

4.5.2. Regional Heterogeneity in the Yangtze River Economic Belt

Table 10 shows the results of a heterogeneity test for the Yangtze River Economic Belt region, demonstrating significant variation in the impact of green innovation (lnGP) on rural habitat system resilience. In the Yangtze River Economic Belt, with a coefficient of 0.061 significant at the 1% level, green innovation strongly enhances resilience. The region’s robust economic base enables substantial investment in green technologies, like large-scale industrial parks affording advanced solar-powered agricultural equipment. Well-developed technological infrastructure facilitates the spread of sustainable farming techniques, and local governments’ favorable policies, such as subsidies and tax incentives, further promote these innovations in rural areas, thus improving the ecological environment and resilience.
Conversely, regions outside the Yangtze River Economic Belt have a coefficient of 0.011, significant at the 5% level. These areas generally have less developed economies, involve traditional resource-intensive industries that are slow to go green, and lack comprehensive technological infrastructure, like patchy broadband in rural areas. Without comparable policy support, implementing green solutions is more challenging. However, growing environmental awareness among farmers and the adoption of basic, cost-effective green tech, such as simple water-saving irrigation systems, still contribute to a positive, albeit smaller, impact on resilience.

5. Further Analysis

Table 11 shows the results when public attention on environmental pollution (PAEP) and environmental regulation efforts (IERs) are used as moderating variables. The coefficient for green innovation (lnGP) in the PAEP model is 0.106, positive and significant at the 1% level, clearly indicating that green innovation plays a crucial role in enhancing rural residents’ environmental awareness. When environmentally friendly agricultural technologies, such as those reducing pesticide and fertilizer use while improving ecological conditions, are introduced in rural areas, residents are directly exposed to environmental improvements. This exposure heightens their awareness of environmental issues, which in turn often leads to behavioral changes. Rural residents have started to participate more actively in local environmental protection initiatives and show greater support for sustainable farming practices. Moreover, the dissemination of environmental knowledge that comes with green innovations, through local training or community campaigns, further solidifies the connection between green innovation and enhanced environmental awareness.
In the IER model, the coefficient for green innovation (lnGP) is 0.162, which is positive and significant at the 1% level. This suggests that higher levels of green innovation encourage governments to strengthen environmental regulations. When green innovations are widely applied in rural areas and lead to improved environmental quality, policymakers are more likely to introduce stricter environmental policies to further incentivize the development and application of green technologies. This creates a reinforcing circle in which green innovation and environmental regulation mutually promote each other.
Overall, public attention to environmental pollution and environmental regulation exerts significant moderating effects on the relationship between green innovation and the resilience of the rural habitat system. Green innovation not only directly enhances rural system resilience but also indirectly strengthens it by increasing public awareness of environmental issues and prompting stronger regulatory measures.

6. Conclusions and Research Outlook

6.1. Conclusions

Green innovation plays a crucial role in rural energy transition, sustainable development, and the enhancement of rural habitat system resilience. This study analyzed data from 30 Chinese provinces (2011–2022), developed a model linking green innovation and rural habitat system resilience, measured resilience using the entropy method, and explored their relationship and underlying mechanisms.
The empirical analysis revealed a significant positive correlation between green innovation and rural habitat system resilience. Controlling for other variables, a one-unit increase in green innovation raises rural habitat system resilience by 0.012–0.018 units, as it optimizes rural energy use, reduces pollution, and improves adaptability to energy transitions. Robustness tests, including variable replacement, lagging, and model substitution, along with endogeneity tests using the systematic GMM approach, confirm the stability of this positive effect. Heterogeneity analysis identifies regional disparities. In the Central region, green innovation significantly enhances resilience, with a coefficient of 0.040, significant at the 1% level. In the Eastern region, its effect is weaker, with a coefficient of 0.009, which is not statistically significant. In the Western region, green innovation initially reduces rural habitat system resilience in the short term.
Based on these findings, policymakers can take several actions. Firstly, to encourage the adoption of green technologies, they should introduce incentives such as tax breaks for rural enterprises and farmers using green energy technologies like solar panels or investing in resource-recycling equipment. This will lower the cost of implementation and promote wider use. Secondly, targeted support for lagging regions is crucial. Given the weaker or even negative short-term effects in the Eastern and Western regions, policymakers can allocate special funds for research and development of green innovation tailored to local conditions. For example, in the Western region, where the initial impact is negative, research can focus on how to better integrate green innovation with local ecological restoration efforts. Finally, substantial investment in rural infrastructure is necessary. Building better-connected power grids can improve the efficiency of renewable energy distribution in rural areas. Additionally, improving waste management infrastructure will support resource recycling initiatives, further enhancing rural habitat system resilience.

6.2. Research Outlooks

This study uses advanced measurement methods to evaluate the relationship between green innovation and rural human settlement system resilience, applying the system GMM model to address endogeneity bias. However, it has limitations. First, it lacks an analysis of green innovation’s link to agricultural enterprise performance and overall agricultural activities. Although focused on rural community resilience, the study does not fully explore how green innovation drives rural economic development, such as its impact on agricultural enterprise productivity and resource allocation. Second, the resilience assessment method does not account for extreme crises. The entropy method measures normal adaptability, but tools for extreme events like the event study method and logistic regression are not employed. Moreover, relevant literature definitions and indicators have not been fully integrated, resulting in a relatively static assessment framework.
Future research should focus on two areas. First, it should more deeply investigate the connection between green innovation and agricultural enterprise performance, collecting relevant data and applying empirical models to analyze its impact on key economic indicators. Second, a more scientific and dynamic resilience assessment system should be developed. This includes incorporating the event study method to simulate extreme events and applying logistic regression models with crisis dummy variables for quantitative evaluation. Additionally, advanced rural resilience theories and methodologies from existing literature should be incorporated to improve the assessment framework from a dynamic perspective, offering better support for rural sustainable development.

Author Contributions

Conceptualization, N.X. and W.H.; methodology, C.C.; validation, C.C., N.X. and S.S.; formal analysis, C.C.; writing—original draft preparation, C.C.; writing—review and editing, N.X., W.H., S.S. and Y.S.; supervision, N.X. and W.H.; project administration, N.X. and W.H. All authors have read and agreed to the published version of the manuscript.

Funding

This research was funded by the Natural Science Foundation of Hunan Province, China, grant number 2024JJ8047.

Institutional Review Board Statement

Not applicable.

Data Availability Statement

The raw data supporting the conclusions of this article will be made available by the authors upon request.

Conflicts of Interest

The authors declare no conflicts of interest.

References

  1. Li, M.; Pelz, S.; Lamboll, R.; Wang, C.; Rogelj, J. A principle-based framework to determine countries’ fair warming contributions to the Paris Agreement. Nat. Commun. 2025, 16, 1043. [Google Scholar] [CrossRef] [PubMed]
  2. Huang, Z.; Huang, Y.; Zhang, S. The Possibility and Improvement Directions of Achieving the Paris Agreement Goals from the Perspective of Climate Policy. Sustainability 2024, 16, 4212. [Google Scholar] [CrossRef]
  3. Hulme, M. 1.5 °C and climate research after the Paris Agreement. Nat. Clim. Change 2016, 6, 222–224. [Google Scholar] [CrossRef]
  4. Huang, Y.; Gan, J.; Liu, B.; Zhao, K. Environmental policy and green development in urban and rural construction: Beggar-thy-neighbor or win-win situation? J. Clean. Prod. 2024, 446, 141201. [Google Scholar] [CrossRef]
  5. Chang, K.; Lin, C.; Bin, Y. Harmony with nature: Disentanglement the influence of ecological perception and adaptation on sustainable development and circular economy goals in country. Heliyon 2024, 10, e26034. [Google Scholar] [CrossRef]
  6. Tayyab Ayaz, M.; Prodromou, T.; Le, T.; Nepal, R. Energy security dimensions and economic growth in Non-OECD Asia: An analysis on the role of institutional quality with energy policy implications. Energy Policy 2024, 188, 114090. [Google Scholar] [CrossRef]
  7. Antončič, J.A.; Hojnik, J.; Ruzzier, M.; Ruzzier, M.K.; Soltwisch, B. The Role of Demographic Changes and Digitalization in Eco-Innovations and Their Effects on the Growth of Companies. Sustainability 2024, 16, 6203. [Google Scholar] [CrossRef]
  8. Niu, J.; Xin, B.; Xin, B.; Zhang, Y.; Wang, M. Research on the coordinated development of provincial urbanization and carbon emission efficiency of construction industry in China. Carbon Balance Manag. 2024, 19, 12. [Google Scholar] [CrossRef]
  9. Ma, Q.; Shi, F. New urbanization and high-quality urban and rural development: Based on the interactive coupling analysis of industrial green transformation. Ecol. Indic. 2023, 156, 111044. [Google Scholar] [CrossRef]
  10. Zhang, Q.; Qu, Y.; Zhan, L. Great transition and new pattern: Agriculture and rural area green development and its coordinated relationship with economic growth in China. J. Environ. Manag. 2023, 344, 118563. [Google Scholar] [CrossRef]
  11. Zhou, L.; Azam, S.M.F. The impact of green-listed companies on rural ecological environments in China: A spatial heterogeneity and empirical analysis. J. Environ. Manag. 2024, 356, 120687. [Google Scholar] [CrossRef] [PubMed]
  12. Michalewska-Pawlak, M. Evolution of the European Union’s policy for development of rural communities in the context of the European Green Deal strategy implementation. Przegląd Eur. 2024, 3, 46–58. [Google Scholar] [CrossRef]
  13. Qi, Z.; You, Y. The Impact of the Rural Digital Economy on Agricultural Green Development and Its Mechanism: Empirical Evidence from China. Sustainability 2024, 16, 3594. [Google Scholar] [CrossRef]
  14. Yang, J.; Xiong, M.; Li, X. Energy transition policy and rural revitalization of Chinese ethnic regions. Financ. Res. Lett. 2025, 71, 106439. [Google Scholar] [CrossRef]
  15. Ying, X. Research on Auditing of Special Agricultural Funds under the Background of Rural Revitalization—Taking S City in Yunnan Province as an Example. Sustain. Dev. 2023, 13, 951–957. [Google Scholar] [CrossRef]
  16. Huang, Y.; Huang, X.; Li, R.; Cheng, W. Assessing the effectiveness of targeted poverty alleviation policies in Xinjiang, China. Humanit. Soc. Sci. Commun. 2023, 10, 389. [Google Scholar] [CrossRef]
  17. Chen, Q.; Yang, H.; Su, L.; Pei, H. Household residential energy choices in green transition: Insights from a household survey in rural China. Environ. Sci. Pollut. Res. 2024, 31, 60539–60554. [Google Scholar] [CrossRef]
  18. Zhu, K.; Dong, S.; Xu, S.X.; Kraemer, K.L. Innovation diffusion in global contexts: Determinants of post-adoption digital transformation of European companies. Eur. J. Inform. Syst. 2017, 15, 601–616. [Google Scholar] [CrossRef]
  19. Alola, A.A. Global urbanization and ruralization lessons of clean energy access gap. Energ. Policy 2024, 188, 114101. [Google Scholar] [CrossRef]
  20. Brahmi, M.; Bruno, B.; Dhayal, K.S.; Esposito, L.; Parziale, A. From manure to megawatts: Navigating the sustainable innovation solution through biogas production from livestock waste for harnessing green energy for green economy. Heliyon 2024, 10, e34504. [Google Scholar] [CrossRef]
  21. Wang, X.; Cui, C.; Xu, M.; Cheng, B.; Zhuang, M. Key technologies improvements promote the economic-environmental sustainability in wheat production of China. J. Clean. Prod. 2024, 443, 141230. [Google Scholar] [CrossRef]
  22. Sun, L.; Xie, C.; Qin, Y.; Zhou, R.; Wu, H.; Che, S. Study on temperature regulation function of green spaces at community scale in high-density urban areas and planning design strategies. Urban For. Urban Green. 2024, 101, 128511. [Google Scholar] [CrossRef]
  23. Huang, Y.; Huang, X.; Xie, M.; Cheng, W.; Shu, Q. A study on the effects of regional differences on agricultural water resource utilization efficiency using super-efficiency SBM model. Sci. Rep. 2021, 11, 9953. [Google Scholar] [CrossRef] [PubMed]
  24. Kim, J.W.; Rhee, J.H.; Park, C.H. How Does Digital Transformation Improve Supply Chain Performance: A Manufacturer’s Perspective. Sustainability 2024, 16, 3046. [Google Scholar] [CrossRef]
  25. Yang, C.; Huang, J.; Jiao, M.; Yang, Q. The Effects of Urbanization on Urban Land Green Use Efficiency of Yangtze River Delta Urban Agglomeration: Mechanism from the Technological Innovation. Sustainability 2024, 16, 2812. [Google Scholar] [CrossRef]
  26. Zhang, X.; Ji, M.; Wang, S. Can Environmental, Social, and Governance Ratings Promote Green Innovation in Chinese Heavy Polluters? Perspectives from “Greening” Behaviors. Sustainability 2024, 16, 2842. [Google Scholar] [CrossRef]
  27. Wu, C.; Chen, C.; Du, P.; Song, L.; Zhang, Y. Evaluation of Rural Human Settlement Environment in the Middle and Lower Reaches of the Yellow River. Pol. J. Environ. Stud. 2023, 32, 321–330. [Google Scholar] [CrossRef]
  28. Wu, L. Overall Thoughts on the Planning and Construction of Beijing. Beijing Plan. Rev. 1996, 1–3. [Google Scholar]
  29. Huang, X.; Li, H.; Zhang, X.; Zhang, X. Land use policy as an instrument of rural resilience—The case of land withdrawal mechanism for rural homesteads in China. Ecol. Indic. 2018, 87, 47–55. [Google Scholar] [CrossRef]
  30. Ge, D.; Zheng, Y.; Zhang, S.; Fu, J.; Su, F. Spatio-Temporal Pattern and Influence Mechanism of Rural Human Settlements System Resilience: Case from China. Sustainability 2022, 14, 14533. [Google Scholar] [CrossRef]
  31. Chen, X.; Rong, F.; Li, S. Driving Force–Pressure–State–Impact–Response-Based Evaluation of Rural Human Settlements’ Resilience and Their Influencing Factors: Evidence from Guangdong, China. Sustainability 2024, 16, 813. [Google Scholar] [CrossRef]
  32. Streimikiene, D.; Baležentis, T.; Volkov, A.; Morkūnas, M.; Žičkienė, A.; Streimikis, J. Barriers and Drivers of Renewable Energy Penetration in Rural Areas. Energies 2021, 14, 6452. [Google Scholar] [CrossRef]
  33. Luo, L.; Nie, Q.; Jiang, Y.; Luo, F.; Wei, J.; Cui, Y. Spatiotemporal Dynamics and Spatial Spillover Effects of Resilience in China’s Agricultural Economy. Agriculture 2024, 14, 1522. [Google Scholar] [CrossRef]
  34. Zhang, L.; Yan, C.; Guo, Q.; Zhang, J.; Ruiz-Menjivar, J. The impact of agricultural chemical inputs on environment: Global evidence from informetrics analysis and visualization. Int. J. Low-Carbon Technol. 2018, 13, 338–352. [Google Scholar] [CrossRef]
  35. Kong, D.; Feng, Q.; Zhou, Y.; Xue, L. Local implementation for green-manufacturing technology diffusion policy in China: From the user firms’ perspectives. J. Clean. Prod. 2016, 129, 113–124. [Google Scholar] [CrossRef]
  36. Block, J.; Lambrecht, D.; Willeke, T.; Cucculelli, M.; Meloni, D. Green patents and green trademarks as indicators of green innovation. Res. Policy 2025, 54, 105138. [Google Scholar] [CrossRef]
  37. Liu, M.; Liu, X.; Yang, Z. An integrated indicator on regional ecological civilization construction in China. Int. J. Sustain. Dev. World Ecol. 2015, 23, 53–60. [Google Scholar] [CrossRef]
  38. Wainger, L.A.; Secor, D.H.; Gurbisz, C.; Kemp, W.M.; Glibert, P.M.; Houde, E.D.; Richkus, J.; Barber, M.C. Resilience indicators support valuation of estuarine ecosystem restoration under climate change. Ecosyst. Health Sustain. 2017, 3, e01268. [Google Scholar] [CrossRef]
  39. Bizikova, L.; Larkin, P.; Mitchell, S.; Waldick, R. An indicator set to track resilience to climate change in agriculture: A policy-maker’s perspective. Land Use Policy 2019, 82, 444–456. [Google Scholar] [CrossRef]
  40. Fang, Y.; Zhu, F.; Qiu, X.; Zhao, S. Effects of natural disasters on livelihood resilience of rural residents in Sichuan. Habitat Int. 2018, 76, 19–28. [Google Scholar] [CrossRef]
  41. Li, X.; Hu, Z.; Cao, J.; Xu, X. The impact of environmental accountability on air pollution: A public attention perspective. Energ. Policy 2022, 161, 112733. [Google Scholar] [CrossRef]
  42. Wang, S.; Zhou, H.; Hua, G.; Wu, Q. What is the relationship among environmental pollution, environmental behavior, and public health in China? A study based on CGSS. Environ. Sci. Pollut. Res. 2021, 28, 20299–20312. [Google Scholar] [CrossRef] [PubMed]
  43. Wei, T.; Chen, M.; Wang, F.; Cheng, S. The impact of public demands on local environmental governance performance: Evidence from civil environmental complaints placed on leaders at different government levels in China. J. Environ. Manag. 2024, 360, 121216. [Google Scholar] [CrossRef] [PubMed]
  44. Deng, W.; Zhang, Z. Environmental regulation intensity, green finance, and environmental sustainability: Empirical evidence from China based on spatial metrology. Environ. Sci. Pollut. Res. 2023, 30, 66228–66253. [Google Scholar] [CrossRef]
  45. Wu, L.; Yang, M.; Wang, C. Strategic interaction of environmental regulation and its influencing mechanism: Evidence of spatial effects among Chinese cities. J. Clean. Prod. 2021, 312, 127668. [Google Scholar] [CrossRef]
  46. Huang, X.; Tian, P. How does heterogeneous environmental regulation affect net carbon emissions: Spatial and threshold analysis for China. J. Environ. Manag. 2023, 330, 117161. [Google Scholar] [CrossRef]
  47. Hu, W.; Wang, D. How does environmental regulation influence China’s carbon productivity? An empirical analysis based on the spatial spillover effect. J. Clean. Prod. 2020, 257, 120484. [Google Scholar] [CrossRef]
  48. Zhao, J.; Zhang, C.; Wu, Y.; Zhu, J. Dual driving forces for corporate environmental responsibility performance: The synergistic effects of government environmental regulation and market multi-agent green supervision. Sci. Total Environ. 2024, 949, 174790. [Google Scholar] [CrossRef]
  49. Zhao, P.; Li, J.; Luo, X. How Top-Down Water Regulation Affects the Financial Performance of Enterprises: The River Chief System in China as an Example. Water 2024, 16, 2827. [Google Scholar] [CrossRef]
  50. Blundell, R.; Bond, S. Initial Conditions and Moment Restrictions in Dynamic Panel Data Models. J. Econom. 1998, 87, 115–143. [Google Scholar] [CrossRef]
  51. Xu, Y.; Zhou, H. The Impact of Rural Industrial Revitalization on the Consumption Upgrade of Rural Residents. J. Jiangxi Univ. Financ. Econ. 2022, 103–115. [Google Scholar]
Figure 1. Research methodology framework.
Agriculture 15 00925 g001
Table 1. Rural habitat resilience evaluation indicator system.
SubsystemsFactor LayerIndicator LayerUnit of MeasureInterpretation of IndicatorsIndicator Properties
Economic
systems
Production conditionsCropland water intensityThousands of hectares/billion cubic metersReservoir capacity/cultivated land areaForward
Economic developmentPer capita production of agriculture, forestry, animal husbandry, and fisheriesMillion dollars per personGross value of agricultural, forestry, livestock, and fisheries production/rural populationForward
Rural disposable income per capitaYuan/r personDisposable income/rural populationForward
Agricultural efficiencyLevel of agricultural mechanizationMillion kilowatts/thousand hectaresTotal power of agricultural machinery/area of agricultural landForward
Grain production per unit areaTons/thousand hectaresTotal grain production/total area sown to grainForward
Society
systems
Demographic composition of the populationPercentage of rural population%Rural population/total populationForward
Elderly dependency ratio (population sample survey) %Ratio of the old-age component of the non-working-age population to the working-age populationNegative direction
Social securityMinimum living standard for rural residentsTen thousand dollarsDirect access to the yearbookForward
Grass-roots organizationNumber of village committees for 10,000 peoplePer 10,000 personsNumber of village committees/village populationForward
Ecological
systems
Resource endowmentWater resources per capitam3Water resources per capitaForward
Cultivated land area per capitaThousands of hectares/ten thousand peopleCultivated land area/rural populationForward
Ecological preservationPesticide application intensityTons/thousand hectaresPesticide application/total sown area of cropsNegative direction
Film use strengthTons/thousand hectaresFilm use/total sown area of cropsNegative direction
Intensity of fertilizer useTons/thousand hectaresFertilizer use/total sown area of cropsNegative direction
Environmental governancePublic toilets per 10,000 populationCollarsPublic toilets per 10,000 populationForward
Soil and water management loss intensity%Soil erosion control area/total arable land areaForward
Infrastructure systemsTransportationTransportation and communication expendituresYuan/personConsumption expenditure on cash transportation and communications by rural residents in the Urban–Rural Integration Household Income, Expenditure and Living Conditions Survey (URBIS) Forward
ResidenceExpenditure on housing for rural residentsYuan/personCash residential consumption expenditures of rural residents from the Urban–Rural Integration Household Income, Expenditure and Living Conditions Survey (URBIS) Forward
EducationExpenditures on education, culture, and recreationYuan/personRural residents’ cash expenditure on education, culture, and recreation from the Urban–Rural Integration Household Income, Expenditure, and Living Conditions Survey (URBIS) Forward
Health careNumber of beds in medical institutions per 10,000 persons in rural areasSheet of paperNumber of beds in medical institutions per 10,000 persons in rural areas (beds) Forward
Village health center personnel per 1000 agricultural populationManVillage health center personnel per 1000 agricultural populationForward
Informatization levelRural internet penetration%Number of rural internet access users/internet access usersForward
Rural cable broadcasting and television penetration rate/%%Number of rural cable radio and television subscribers as a percentage of total householdsForward
Energy systemRural energy useMechanization of agriculturekWh/haTotal power of agricultural machinery/total sown area of cropsForward
Rural social electricity consumptionMillion kWhDirect access to the yearbookForward
Rural electricity generationMillion kWhDirect access to the yearbookForward
Table 2. Descriptive statistics.
VarNameFull FormObsMeanSDP5MedianP95
RHSESRural Human Settlements Environmental Resilience System3600.2870.0730.1900.2830.416
lnGPNatural Logarithm of Green Patent Grants3607.5321.4095.0347.6049.655
lnAPNatural Logarithm of Agricultural Productivity3606.6661.2954.4746.6678.640
PEUAFHFUProportion of Employed in Agricultural, Forestry, Animal Husbandry, and Fishery in Urban Units3600.0210.0380.0010.0060.109
AGDPAgricultural GDP Proportion3609.6515.1770.6009.25018.000
LEPLocal Environmental Protection Expenditure Ratio3600.0290.0090.0170.0270.048
lnLRINatural Logarithm of Rural Infrastructure Index3495.9862.1661.0996.2638.785
PPIAPProducer Price Index for Agricultural Products360104.0596.33595.850102.900116.650
PAEPPublic Attention to Environmental Pollution360105.79538.22640.708105.599168.943
IERIntensity of Environmental Regulation3600.9510.2720.5680.9151.388
Table 3. Classification of Chinese provinces by rural habitat system resilience.
Rural Habitat System Resilience CategoryProvinces
Demonstration and leading categoryZhejiang Province, Jilin Province, Qinghai Province
Key enhancement categoryChongqing Municipality, Liaoning Province, Gansu Province, Ningxia Hui Autonomous Region, Shanghai Municipality
Actively promoting categoryShandong Province, Hebei Province, Jiangxi Province, Guangxi Zhuang Autonomous Region, Jiangsu Province, Heilongjiang Province, Tianjin Municipality, Guizhou Province, Shanxi Province
Basic consolidation categorySichuan Province, Fujian Province, Beijing Municipality, Hunan Province, Guangdong Province, Yunnan Province, Hubei Province, Inner Mongolia Autonomous Region
To-be-breakthrough-and-improved categoryHenan Province, Xinjiang Uygur Autonomous Region, Anhui Province, Hainan Province, Shaanxi Province
Table 4. Hausman test.
Test Typep-Value
F-test0
Hausman test0.000
Table 5. Fixed effects model results.
(1)(2)(3)(4)(5)(6)(7)
RHSESRHSESRHSESRHSESRHSESRHSESRHSES
lnGP0.018 **0.014 *0.014 *0.012 *0.012 *0.012 **0.012 **
(2.521)(1.936)(1.940)(1.658)(1.660)(2.023)(2.087)
lnAP 0.010 **0.013 ***0.012 **0.012 **0.009 *0.009 *
(2.578)(2.726)(2.521)(2.490)(1.872)(1.806)
PEUAFHFU 0.1060.0850.0880.0980.098
(1.091)(0.871)(0.899)(1.059)(1.052)
AGDP −0.002 *−0.002 *−0.003 ***−0.003 ***
(−1.861)(−1.897)(−2.727)(−2.777)
LEP −0.133−0.017−0.016
(−0.520)(−0.069)(−0.065)
lnLRI 0.004 *0.004 *
(1.771)(1.738)
PPIAP 0.000
(0.159)
_cons0.183 ***0.151 ***0.130 **0.171 ***0.176 ***0.174 ***0.169 ***
(4.086)(3.281)(2.590)(3.130)(3.170)(3.574)(2.698)
N360360360360360360360
Note: *, **, and *** represent significance levels of p < 0.05, p < 0.01, and p < 0.001, respectively.
Table 6. Robustness test results.
(1)(2)(3)
RHSESRHSESRHSES
lnNGPA0.015 **
(2.145)
L.lnGP 0.013 *
(1.696)
lnGP 0.010 **
(2.516)
lnAP0.012 **0.011 **−0.010 **
(2.275)(2.049)(−2.067)
PEUAFHFU0.1200.1100.362 **
(1.243)(1.021)(2.416)
AGDP−0.002 *−0.003 **−0.007 ***
(−1.925)(−2.050)(−6.393)
LEP−0.0200.079−0.264
(−0.082)(0.303)(−0.672)
lnLRI0.005 **0.004 *0.007 ***
(2.115)(1.797)(3.745)
PPIAP0.0000.000−0.001 ***
(0.048)(1.256)(−2.759)
_cons0.117 *0.1040.464 ***
(1.679)(1.517)(6.840)
N349320349
Note: *, **, and *** represent significance levels of p < 0.05, p < 0.01, and p < 0.001, respectively.
Table 7. Endogeneity test results.
RHSES
L.RHSES0.191 **
(2.24)
lnGP0.01 **
(2.20)
Control VariableY
_cons0.603 ***
(9.90)
N349
AR (1)0.000
AR (2)0.560
Hansen Test0.180
Note: **, and *** represent significance levels of p < 0.01, and p < 0.001, respectively.
Table 8. Instrumental variable test.
VarNameFirst StepSecond Step
L.lnGP0.963 ***-
(65.96)
lnGP-0.189 ***
(11)
lnAP0.003−0.002
(0.26)(−0.79)
PEUAFHFU−0.4390.421 ***
(−1.49)(4.34)
AGDP−0.004−0.005 ***
(−0.10)(−5.86)
LEP−0.3130.336
(−0.35)(1.10)
lnLRI0.0010.005
(0.07) (3.95)
PPIAP−0.0010.001 *
(0.13)(1.75)
Weak Instrument Variable (IV) test-12943.10 (16.38)
Test for identifiability (p-value) -10.76 (0.001)
Note: The weak IV test uses the Cragg–Donald Wald F statistic (the critical value set by Stock–Yogo at the 10% significance level is shown in parentheses). The K-Paark LM statistic is employed for the identifiability test, and the corresponding p-value is provided in parentheses. *, and *** represent significance levels of p < 0.05, and p < 0.001, respectively.
Table 9. Results of regional heterogeneity in the East–Midwest region.
(1)(2)(3)
EasternCentralWestern
lnGP0.0090.040 ***−0.023 ***
(0.743)(2.699)(−3.475)
lnAP0.009−0.0060.017 ***
(1.357)(−0.752)(2.766)
PEUAFHFU−0.673 ***0.0950.478 ***
(−3.033)(0.613)(4.498)
AGDP−0.004 *−0.001−0.003 *
(−1.708)(−0.510)(−1.890)
LEP0.358−1.430 ***0.099
(1.070)(−3.918)(0.276)
lnLRI0.0040.0030.003
(1.324)(0.773)(1.610)
PPIAP0.002 ***−0.000−0.000
(2.665)(−0.533)(−0.651)
(−2.141)(−0.839)(2.571)
_cons0.0060.0940.312 ***
(0.050)(0.896)(4.664)
N12196132
Note: *, and *** represent significance levels of p < 0.05, and p < 0.001, respectively.
Table 10. Results of regional heterogeneity in the Yangtze River Economic Belt.
(1)(2)
RHSESRHSES
lnGP0.061 ***0.011 **
(5.632)(1.967)
lnAP0.030 **−0.003
(2.459)(−0.658)
PEUAFHFU2.989 **−0.066
(1.974)(−0.719)
AGDP−0.002−0.003 ***
(−0.847)(−2.604)
LEP−1.397−0.238
(−1.390)(−1.036)
lnLRI0.0070.002
(1.560)(1.016)
PPIAP−0.0000.000
(−0.229)(0.710)
(−3.904)(−1.150)
_cons−0.3090.245 ***
(−1.535)(3.610)
N121228
Note: **, and *** represent significance levels of p < 0.01, and p < 0.001, respectively.
Table 11. Results of moderating effects.
(1)(2)(3)
RHSESlnPAEPIER
lnGP0.012 **0.106 ***0.162 ***
(2.087)(6.951)(3.066)
lnAP0.009 *0.046 ***0.020
(1.806)(3.622)(0.508)
PEUAFHFU0.0980.760 ***0.228
(1.052)(3.053)(0.310)
AGDP−0.003 ***−0.006 **0.009
(−2.777)(−2.187)(1.069)
LEP−0.016−0.494−0.174
(−0.065)(−0.764)(−0.093)
lnLRI0.004 *0.003−0.024
(1.738)(0.506)(−1.284)
PPIAP0.000−0.0000.002
(0.159)(−0.396)(0.733)
_cons0.169 ***3.357 ***−0.524
(2.698)(19.989)(−1.010)
N349349349
Note: *, **, and *** represent significance levels of p < 0.05, p < 0.01, and p < 0.001, respectively.
Disclaimer/Publisher’s Note: The statements, opinions and data contained in all publications are solely those of the individual author(s) and contributor(s) and not of MDPI and/or the editor(s). MDPI and/or the editor(s) disclaim responsibility for any injury to people or property resulting from any ideas, methods, instructions or products referred to in the content.

