Article

Effects of Auricularia heimuer Residue Amendment on Soil Quality, Microbial Communities, and Maize Growth in the Black Soil Region of Northeast China

1
College of Agriculture, Jilin Agricultural University, Changchun 130118, China
2
Engineering Research Center of Edible and Medicinal Fungi, Chinese Ministry of Education, Jilin Agricultural University, Changchun 130118, China
3
Industrial Development Institute for Plants, Animals and Fungi Integration of Biyang County, Zhumadian 463700, China
4
Sanjiang Fungal Industry Collaborative Innovation Center, Changchun 130118, China
*
Authors to whom correspondence should be addressed.
These authors have contributed equally to this work.
Agriculture 2025, 15(8), 879; https://doi.org/10.3390/agriculture15080879
Submission received: 18 March 2025 / Revised: 12 April 2025 / Accepted: 14 April 2025 / Published: 17 April 2025
(This article belongs to the Section Agricultural Soils)

Abstract

:
This study reveals how microbial diversity relates to soil properties in Auricularia heimuer residue–chicken manure composting, presenting sustainable waste recycling solutions. These microbial-straw strategies are adaptable to various agroecological regions, offering flexible residue valorization approaches for local conditions, crops, and resources. This study examined the effects of composting Auricularia heimuer residue and chicken manure at three ratios (6:4, 7:3, 8:2) on soil properties, lignocellulose content, enzyme activity, microbial diversity, and maize growth. The compost was mixed into potting soil at different proportions (0:10 to 10:0). During composting, the temperature remained above 50 °C for more than 14 days, meeting safety and sanitation requirements. The composting process resulted in a pH range of 7–8, a stable moisture content of 60%, a color change from brown to gray-brown, the elimination of unpleasant odors, and the formation of loose aggregates. Lignocellulose content steadily decreased, while lignocellulosic enzyme activity and actinomycete abundance increased, indicating suitability for field application. Compared with the control (CK), total nitrogen, total phosphorus, and total potassium in the soil increased by 57.81–77.91%, 4.5–19.28%, and 301.09–577.2%, respectively. Lignin, cellulose, and hemicellulose increased 50.6–83.49%, 59.6–340.33%, and 150.86–310.5%, respectively. The activities of lignin peroxidase, cellulase, and hemicellulase increased by 9.05–36.31%, 6.7–36.66%, and 37.39–52.16%, respectively. Maize root weight, plant biomass, and root number increased by 120.87–138.59%, 117.83–152.86%, and 29.03–75.81%, respectively. In addition, composting increased the relative abundance of actinomycetes while decreasing the abundance of ascomycetes and ascomycetes. The relative abundance of Sphingomonas and Gemmatimonas increased, whereas pathogenic fungi such as Cladosporium and Fusarium decreased. Compost application also enhanced bacterial and fungal diversity, with bacterial diversity indices ranging from 6.744 to 9.491 (B1), 5.122 to 9.420 (B2), 8.221 to 9.552 (B3), and 6.970 to 9.273 (CK). Fungal diversity indices ranged from 4.811 to 8.583 (B1), 1.964 to 9.160 (B2), 5.170 to 9.022 (B3), and 5.893 to 7.583 (CK). Correlation analysis of soil physicochemical properties, lignocellulose content, enzymes, microbial community composition, and diversity revealed that total nitrogen, total phosphorus, total potassium, and lignocellulose content were the primary drivers of rhizosphere microbial community dynamics. These factors exhibited significant correlations with the dominant bacterial and fungal taxa. Additionally, bacterial and fungal diversity increased with the incorporation of Auricularia heimuer residue. In conclusion, this study elucidates the relationships between microbial diversity and soil properties across different proportions of Auricularia heimuer residue and chicken manure composting, offering alternative strategies for waste recycling and sustainable agricultural development. At present, the production of biobiotics using waste culture microorganisms is still in the laboratory research stage, and no expanded experiments have been carried out. Therefore, how to apply waste bacterial bran to the production of biocontrol biotics on a large scale needs further research.

1. Introduction

The intensification of crop and livestock production has led to the generation of substantial agricultural waste, including crop residues and animal manure. With the increasing global population, the volume of waste produced by cultivation and aquaculture continues to rise annually. Corn, one of the world’s most widely cultivated crops, requires significant nutrient input to maintain high yields. However, excessive reliance on chemical fertilizers has raised concerns about soil degradation, environmental pollution, and sustainability.
China, the world’s largest producer of agricultural waste, generates approximately 3.8 billion tons of livestock and poultry manure each year, with a comprehensive utilization rate of less than 60% [1]. Additionally, nearly 900 million tons of straw are produced annually [2]. Improper disposal of these residues leads to resource wastage and environmental pollution, including water contamination, greenhouse gas emissions, and soil quality deterioration. Furthermore, China, a major producer of edible mushrooms, has exceeded 43.25 million tons of mushroom production since 2023, accounting for 75% of global production [3]. However, large quantities of Auricularia heimuer residue, a valuable agricultural resource, are often discarded as waste. Direct application of this residue to soil is problematic due to its high lignocellulose content and potential to harbor plant pathogens, leading to environmental contamination. Compared to biostimulants, Auricularia heimuer residue and chicken manure composting greatly reduce input costs and are particularly suitable for resource-cycling agriculture.
To address these challenges, several approaches have been explored: aerobic composting, which is widely used for treating livestock and poultry manure, effectively converts organic waste into nutrient-rich fertilizer [4]. Incorporating spent Auricularia heimuer and livestock manure into agricultural fields, recycling nutrients, and enhancing soil fertility [5,6]. Auricularia heimuer residues and chicken manure compost fermentation can accelerate compost decay and solve the problem of slow degradation at low temperatures. Under the low-temperature environment, the microbial activity is reduced, the traditional composting speed is slow, and the decomposition is incomplete. Changes in enzyme activity can significantly improve the composting process, cellulase, and hemicellulase promote the degradation of lignocellulose in the Auricularia heimuer residues and chicken manure, shortening the composting cycle, improving the degree of decomposition of compost, and preventing the incompletely decomposed organic matter from returning to the field to cause soil pests and diseases or burn seedlings. The use of Auricularia heimuer residue in soil conditioning and microbial fertilizers contributes to soil remediation and nutrient enrichment [7].
Despite these solutions, several challenges remain: the direct application of Auricularia heimuer residue requires a long weathering period (1–2 years) to prevent environmental and health risks [8]. The high lignocellulose content in the residue reduces its decomposition rate and nutrient availability. Traditional composting studies have mainly focused on livestock manure or other crop residues, with limited research on the combined composting of Auricularia heimuer residue and chicken manure (CM) in maize production.
Auricularia heimuer residue contains various bioactive compounds and organic substances, such as lignocellulose, protease, cellulase, hemicellulase, lignin peroxidase (LiP), manganese peroxidase (MnP), and laccase [9]. It is also rich in proteins, sugars, organic acids, and essential nutrients (nitrogen, phosphorus, potassium, iron, calcium, zinc, magnesium) [10]. Similarly, chicken manure (CM) is a nutrient-rich organic material containing nitrogen, phosphorus, potassium, and various trace elements beneficial to agriculture. When composted together, these materials enhance soil organic matter, improve structure, and enrich microbial activity. The Auricularia heimuer residue dynamically regulates soil carbon and nitrogen cycle through microbial decomposition, reshapes the structure of nitrification/denitrification flora, and changes the diversity of microorganisms, bacteria, and fungi [11,12,13]. With the compost of Auricularia heimuer residues and chicken manure back to the field, a high amount of fungus bran can promote saprophytic fungi (such as Trichoderma) to degrade stubborn organic matter, enhance soil carbon storage, increase the abundance of arbuscular mycorrhizal fungi, and help plants absorb phosphorus. However, it may also increase the risk of pathogenic fungi (such as Fusarium).
A high fungal bran ratio (e.g., Auricularia heimuer residue to chicken manure at 8:2 or 7:3) ensures a balanced C/N ratio, promoting microbial decomposition. The Auricularia heimuer residue’s loose structure enhances aeration, reducing anaerobic odors, while its high lignin and cellulose content supports oxygen retention. This mix also boosts humus formation due to abundant polysaccharides and mycelium, enhancing humic acid production. Additionally, the lower proportion of chicken manure minimizes heavy metal contamination (e.g., Cu, Zn), making it ideal for improving sandy/clay soils or soils degraded by long-term chemical fertilizer use [14,15,16]. A medium ratio (6:4) offers a more balanced nutrient profile, with chicken manure providing fast-available nitrogen and Auricularia heimuer residue supplying a slow-release carbon source. This results in moderate decomposition—faster than pure chicken manure but slower than high fungal bran ratios. The higher nitrogen content stimulates robust microbial activity, making it well-suited for high-demand crops (vegetables, fruit trees) and short-term fertility management, such as greenhouse cultivation or crop rotation [17,18,19,20]. Several studies have explored the benefits of mushroom substrate compost (SMS) in agriculture: substituting 20–40% of chemical fertilizers with SMS compost significantly enhances crop yields [21]. Ji et al. [21] found that replacing chemical fertilizer with mushroom substrate compost improved the yields of Chinese cabbage and black sweet cabbage. Jiang et al. [22] reported that applying a mixture of mushroom substrate compost and compound fertilizer enhanced plant growth, leaf chlorophyll content, and soluble protein levels in Chinese cabbage. Wang [23] demonstrated that SMS compost increased rice yield by 6.2% to 8.3% compared to conventional organic fertilizers. Chen et al. [24] found that supplementing conventional fertilization with SMS-based bio-organic fertilizer significantly enhanced potato yields.
Despite these advancements, limited research has been conducted on the combined application of Auricularia heimuer residue and CM compost in maize cultivation. This study is necessary to explore the microbial mechanisms involved in composting Auricularia heimuer residue and CM; assess the impact on maize growth, soil improvement, and environmental sustainability; provide a scientific basis for the reuse of Auricularia heimuer residue compost in large-scale agricultural applications.
This study investigates the use of Auricularia heimuer residue and CM compost as an organic fertilizer for maize. The objectives are to analyze bacterial and fungal community structures using 16S rRNA and ITS high-throughput sequencing technology; evaluate changes in compost and soil properties under different Auricularia heimuer residue and CM treatments; assess the effects of compost application on soil improvement and maize growth; determine the optimal Auricularia heimuer residue and CM compost ratio for sustainable maize production. This study hypothesizes that composting Auricularia heimuer residue with CM will enhance compost quality, improve soil fertility, and promote maize growth by accelerating organic matter decomposition through microbial activity; enhancing nutrient availability in composted materials; increasing soil microbial diversity and enzymatic activity.
Despite extensive research, significant gaps remain in understanding how microbial communities in black soil regions respond to Auricularia heimuer residues. Their enzymatic activities and roles in nutrient cycling and plant growth promotion are not well understood, which hampers the development of effective management strategies for these soils.

2. Materials and Methods

2.1. Experimental Design and Sample Collection

The experiment was conducted from 20 May 2023 to 21 October 2024, in the modern solar greenhouse of Jilin Agricultural University, Changchun City, Jilin Province, and the Auricularia heimuer residues used in the experiment were obtained from Qiaoluhe Town, Yongji County, Jilin City, Jilin Province. The Auricularia heimuer residue was obtained from the bags of local farmers after picking black fungus, after de-bagging and sterilizing. The test soil type was black soil, which was taken from Jilin Agricultural University, and the fresh soil samples were air-dried and finely ground to remove stubble and then sieved for 2 mm for storage. The physical and chemical properties of the test soil were as follows: total nitrogen 1.41 g/kg, total phosphorus 1.31 g/kg, total potassium 16.54 g/kg, pH 8.17, Cd 0.04 mg/L. The physical and chemical properties of the test chicken manure were as follows: total nitrogen 26.63 g/kg, total phosphorus 19.36 g/kg, total potassium 17.71 g/kg, pH 8.27 (Table 1).
The Auricularia heimuer residue was formulated using 80% wood chips, 15% wheat bran, 2% soybean meal, 1% gypsum, and 1% white ash. In compost production, the volume ratios of Auricularia heimuer residue to chicken manure were 6:4, 7:3, and 8:2, respectively. The mixture was then stacked and fermented [25]. This mixture was then piled for fermentation, with moisture content adjusted to 60%. For the preparation of the cultivation substrate, different proportions of bacterial manure were mixed with the soil in volume ratios of 0:10, 2:8, 4:6, 5:5, 6:4, 8:2, and 10:0. Each pot was allocated 30 kg of cultivation substrate. Ten maize plants were planted in each treatment and three maize plants were randomly selected at maturity. The test corn was Dr. Jin 825 (Henan Dr. Jin Seed Industry Co.).
Temperature humidity and samples were taken using the five-point sampling method. Five sampling points were established, with one at the center and four around the periphery of the SMS pile, each sampling point was located at half the pile height. A 200 g compost sample was collected from each sampling point daily [26]. Compost temperature was monitored using an alcohol thermometer inserted 20 cm into the center of the compost pile. Temperature readings were recorded twice daily at 9:00 a.m. and 4:00 p.m.
Inter-root soil sampling was carried out at seedling, nodulation, stamen, flowering, silking, and maturity stages of maize using the five-point sampling method. Three maize plants were randomly selected at maturity for whole plant sampling. Whole maize plants were sampled at maturity. The collected samples were combined and subsequently divided into two portions. One portion was placed in an electric blast drying oven and dried at a temperature range of 80–90 °C for 20 min. Following this initial drying, the temperature was adjusted to 60 °C and maintained until a constant weight was achieved. The dried samples were then ground, passed through a 0.5 mm sieve, and stored in a light-protected environment for the analysis of physicochemical properties and lignocellulose content. The second portion was stored in a −80 °C freezer for the assessment of enzyme activity and microbial diversity. Data analysis for microbial diversity and physicochemical parameters was performed in the same sample pool. During the composting period, the sample size consisted of 27 biological replicates, while in the growth period, it included 60 biological replicates. Each treatment was biologically repeated three times.
During the experimental period, the ambient temperature was 16–20 °C from the seedling stage to the jointing stage, 18–26 °C from the jointing stage to the staminate stage, 23–28 °C from the staminate stage to the flowering and silk extraction stage, and 15–20 °C from the flowering and silk extraction stage to the maturity stage during the growth of maize. At the same time, watering was conducted once every three days, with 10 L each time.

2.2. Physicochemical Properties, Lignocellulose Content and Lignocellulase Activity

Soil samples were crushed, weighed, and sieved before undergoing digestion with a mixture of sulfuric acid (H2SO4) and hydrogen peroxide (H2O2). The digested samples were then fixed, filtered, and analyzed for total phosphorus (TP) using the molybdenum-antimony colorimetric method, total nitrogen (TN) using the Kjeldahl method, and total potassium (TK) using perchloric acid and sulfuric acid digestion methods. Soil pH was determined using the co-potentiometric method, with a water-to-soil ratio of 2.5:1. The cellulose, hemicellulose and lignin contents were determined by cellulose, hemicellulose, and lignin content assay kits (Suzhou Dream Rhinoceros Biomedical Technology Co., Ltd., Suzhou, China), the cellulose content was determined by mossy black phenol colorimetric method, the hemicellulose content was determined by anthrone colorimetric method, and the lignin content was determined by the Klason method [27,28,29]. For enzyme activity analysis, the activities of cellulase, hemicellulase, and lignin peroxidase were determined using a specific activity detection kit (Suzhou Dream Rhinoceros Biomedical Technology Co., Ltd., Suzhou, China). Cellulase and hemicellulase activities were determined by (DNS) colorimetric method. Lignin peroxidase activity was determined by quinolinol assay [30,31,32]. The kit numbers are Cellulose (M1733B), Hemicellulose (M1719B), Lignin (M1711B), Cellulase (1733B), hemicellulase (M1732B), Lignin peroxidase (M1716B). Each treatment was biologically repeated three times.

2.3. High-Throughput Sequencing 16S and ITS Microbial Diversity Analysis

A total of 12,646,257 pair-end reads were obtained from the sequencing of 159 samples. After quality control and splicing, 11,465,711 clean reads were generated, with a minimum of 38,029 clean reads per sample and an average of 72,111 clean reads per sample. Bacterial amplicon sequencing targeted the 16s rRNA gene (v3 + v4 + b regions), using the following primer sequences: Forward (F) prime: ACTCCTACGGGGAGGCAGCA and Reverse (R) prime: GGACTACHVGGGGTWTCTAAT. Similarly, a total of 12,542,192 paired-end reads were obtained from sequencing the 159 samples for fungal community analysis. Following quality control and splicing, 10,070,160 clean reads were retained, with a minimum of 31,090 clean reads per sample and an average of 63,334 clean reads per sample. Fungal amplicon sequencing targeted the ITS1 region, with the following primer sequences: Forward (F) prime: CTTGGTCATTTAGAGGAAGTAA and Reverse (R) prime: GCTGCGTTCTTCATCGATGC.
Principal Component Analysis (PCA) is a method that utilizes a series of eigenvalues and eigenvectors sorted by significance. By selecting the top few principal eigenvalues, it employs a dimensionality reduction approach. PCA can identify the most significant coordinates in a distance matrix, thereby revealing differences between individuals or groups.

2.4. Statistical Analysis

Statistical analyses were conducted using SPSS version 27.0.1, which was employed to calculate the mean and standard error (SE) of lignocellulose and soil chemical properties across different treatment groups. Differences in operational taxonomic units (OTUs) between control and treatment groups were assessed using statistical analysis for taxonomy and functional profiling (STAMP), based on Illumina sequencing of 16S rRNA and internal transcribed region (ITS) amplicons. The linear discriminant analysis (LDA) effect size (LEfSe) was performed to identify biomarkers, using the Kruskall–Wallis test with a threshold of LDA > 4.0 and p < 0.05. Redundancy analysis (RDA) was conducted using the Canoco 4.5 software package (Microcomputer Power, Redmond, WA, USA). One-way ANOVA and Duncan’s multiple comparisons were performed using SPSS 27.0.1, with significance levels set at p < 0.01(denoted as **) and p < 0.05 (denoted as *). Pearson correlation analyses were conducted in Origin 2021, and correlation heat maps were generated using the same software, significant correlations were indicated as “*” for p < 0.05 and “**” p < 0.01.

3. Results

3.1. Changes in Compost Fermentation Temperature and Water Content

During the initial fermentation phase, the temperature decreased at 7 and 14 days, reaching its peak of 60.15 °C on day 11 (Figure 1a). In the middle fermentation stage (days 7–21), the temperature remained consistently high before beginning to decline as the process transitioned into the late stage. The lowest recorded temperature, 46.5 °C, occurred on day 14 during this transition. After 22 days, the temperature stabilized and gradually declined, marking the onset of the late fermentation stage. Significant differences were observed in temperature variation trends and amplitudes among different fungal fertilizer proportions. Specifically, the 6:4 ratio exhibited higher temperatures during the early and middle stages compared to other treatments, while the 8:2 ratio maintained higher temperatures in the late stage. Throughout the compost fermentation process, the moisture content of the pile continuously decreased (Figure 1b). To maintain moisture within the 55–65% range, water replenishment was applied during pile turning. The greatest decrease in moisture content (6.5%) was observed in the 7:3 ratio, whereas the 6:4 ratio exhibited the least decrease (3.4%).

3.2. pH Changes

The pH levels across different composting treatments exhibited an upward trend (Figure 1c), ranging from 7.2 to 7.8, indicating a slightly alkaline environment conducive to microbial growth and metabolic activities during the composting process. By the end of composting, the pH stabilized between 7.6 and 7.8. During maize cultivation, soil pH initially decreased before gradually increasing (Figure 1d). A sharp decline was observed at the jointing stage, followed by a progressive recovery. By maturity, soil pH in plots treated with fungal fertilizer ranged from 6.96 and 7.00, which was significantly higher than the CK value of 6.79. This result indicates that the application of fungal fertilizer helps regulate the soil acidity and alkalinity, ultimately bringing soil pH closer to a neutral range.

3.3. Maize Growth Indicators

According to the experimental results (Figure 1e–i), varying proportions of fungal fertilizer treatments significantly influenced multiple maize growth parameters, including 100-grain weight, yield per plant, single root weight, above-ground dry matter weight, and number of fibrous roots. All these parameters were notably higher in the treated plots compared to the CK. Specifically, the 6:4 (2:8) treatment achieved an above-ground dry matter weight of 0.95 kg and a yield per plant of 180.61 g. The 7:3 (4:6) treatment demonstrated the highest performance, with an above-ground dry matter weight of 1.05 kg, yield per plant of 181.15 g, root weight per plant of 43.24 g, 100-grain weight of 43.24 g, and fibrous root number of 21.80. The 8:2 (4:6) treatment exhibited comparable results to the 7:3 (4:6) treatment, with a yield per plant of 180.46 g, root weight of 42.69 g, and 100-grain weight of 42.69 g.
Evaluation of maize growth parameters, including 100-grain weight, yield per plant, single root weight, above-ground dry matter weight, and number of fibrous roots, demonstrated that maize growth was significantly higher after adding CM fungal fertilizer compared to the CK. These results indicate that the incorporation of CM fungal fertilizer effectively improves maize yield. Based on maize growth indices, the fungal fertilizer-to-soil ratios were designated as follows: 6:4 as A1, 6:4 (2:8) as B1; 7:3 as A2, 7:3 (4:6) as B2; 8:2 as A3, 8:2 (4:6) as B3.

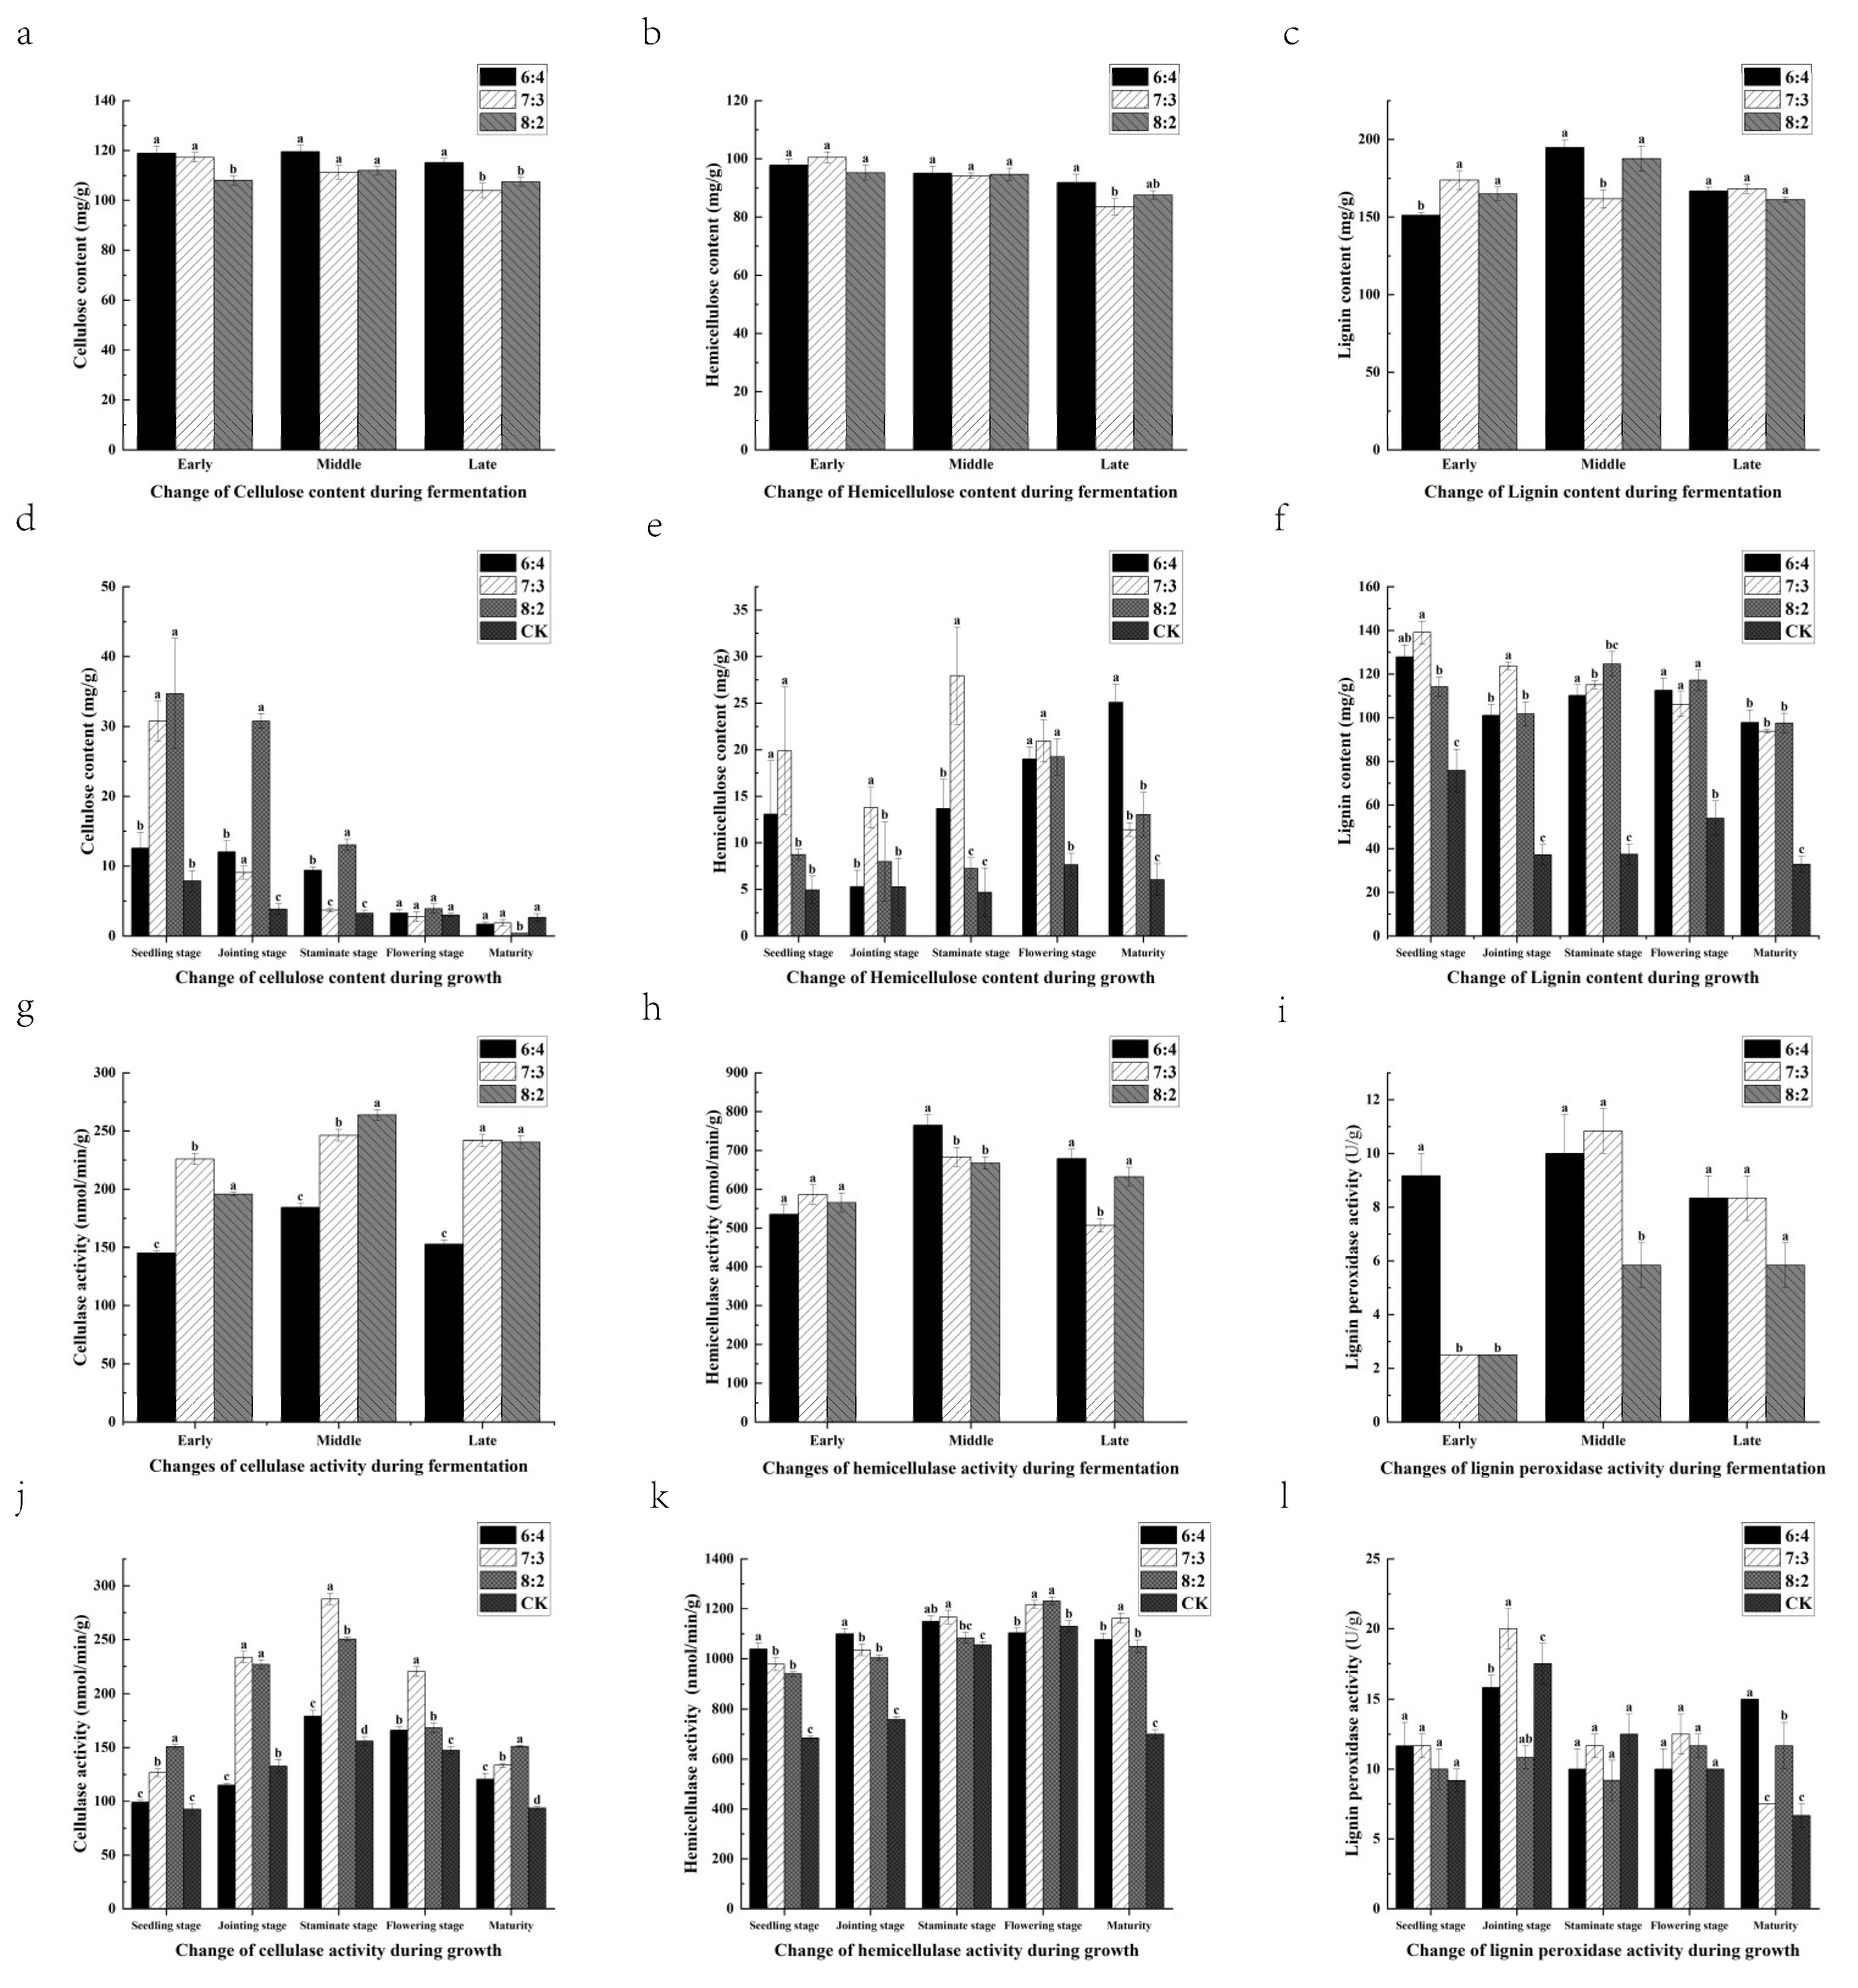
3.4. Changes in Lignocellulose Content

During the composting process, lignocellulose content gradually decreased, demonstrating a significant degradation effect (Figure 2a–c). The highest lignin degradation rate was observed in the 6:4 treatment, reaching 19.62%. The maximum cellulose degradation rate occurred in the 7:3 ratio (11.38%), while hemicellulose degradation was highest in the 8:2 ratio (16.86%). The substantial presence of lignin in the Auricularia heimuer residue contributed to its gradual reduction in the 8:2 treatment. Across all three treatments, lignocellulose content declined consistently throughout the composting process. Notably, cellulose and hemicellulose degradation rates increased significantly during the early and middle fermentation stages, whereas most lignin degradation occurred during the cooling stage. During maize growth (Figure 2d–f), lignin content exhibited a fluctuating trend characterized by a down-up-down pattern, reaching its lowest point at maturity in the B2 treatment, where it decreased by 36.59%. In contrast, cellulose and hemicellulose contents declined sharply during early maize growth and continued to decrease at a slower rate after flowering, reaching their lowest levels at maturity. Specifically, cellulose content in B3 treatment diminished by an impressive 98.9%, while hemicellulose showed its greatest reduction in B2 treatment, decreasing by 63.71%. Furthermore, hemicellulose levels in B2-treated soil were significantly higher than those in other treatments (p < 0.05).

3.5. Changes in Lignocellulose Activity

Lignocellulosic enzyme activity followed a trend of increasing and then decreasing throughout the composting process, with enzyme activity in the late fermentation stage being significantly higher than that in the early stage (Figure 2g–i). Among the treatments, lignin peroxidase activity increased most notably in the 7:3 treatment, with an increase of 233.2%. Cellulase activity exhibited the greatest increase in the 8:2 treatment (22.79%), while hemicellulase activity was highest in the 6:4 treatment, increasing by 26.8%. These results indicate significant differences in enzyme activity dynamics among the treatments. During maize growth (Figure 2j–l), lignocellulosic enzyme activity exhibited a general increase followed by a decrease. Cellulase activity increased dramatically in the B2 treatment, reaching its peak at the tasseling stage (2871.72 nmol/min/g). Hemicellulase activity was highest during the flowering and silking stage in the B3 treatment, reaching 1231.58 nmol/min/g. Lignin peroxidase activity peaked at the jointing stage in the B2 treatment, with a maximum value of 19.17 U/g−1. In the mature stage, cellulase activity of B3 treatment was the highest and increased by 61.27%. The hemicellulase activity of B2 treatment was the highest and increased by 53.83%. The lignin peroxidase in B1 treatment was the highest, with an increase of 49.93%. Among the treatments, cellulase activity in the B2 treatment was significantly higher than in the other ratios, while lignin peroxidase and hemicellulase activities showed minimal variation across treatments (p < 0.05).

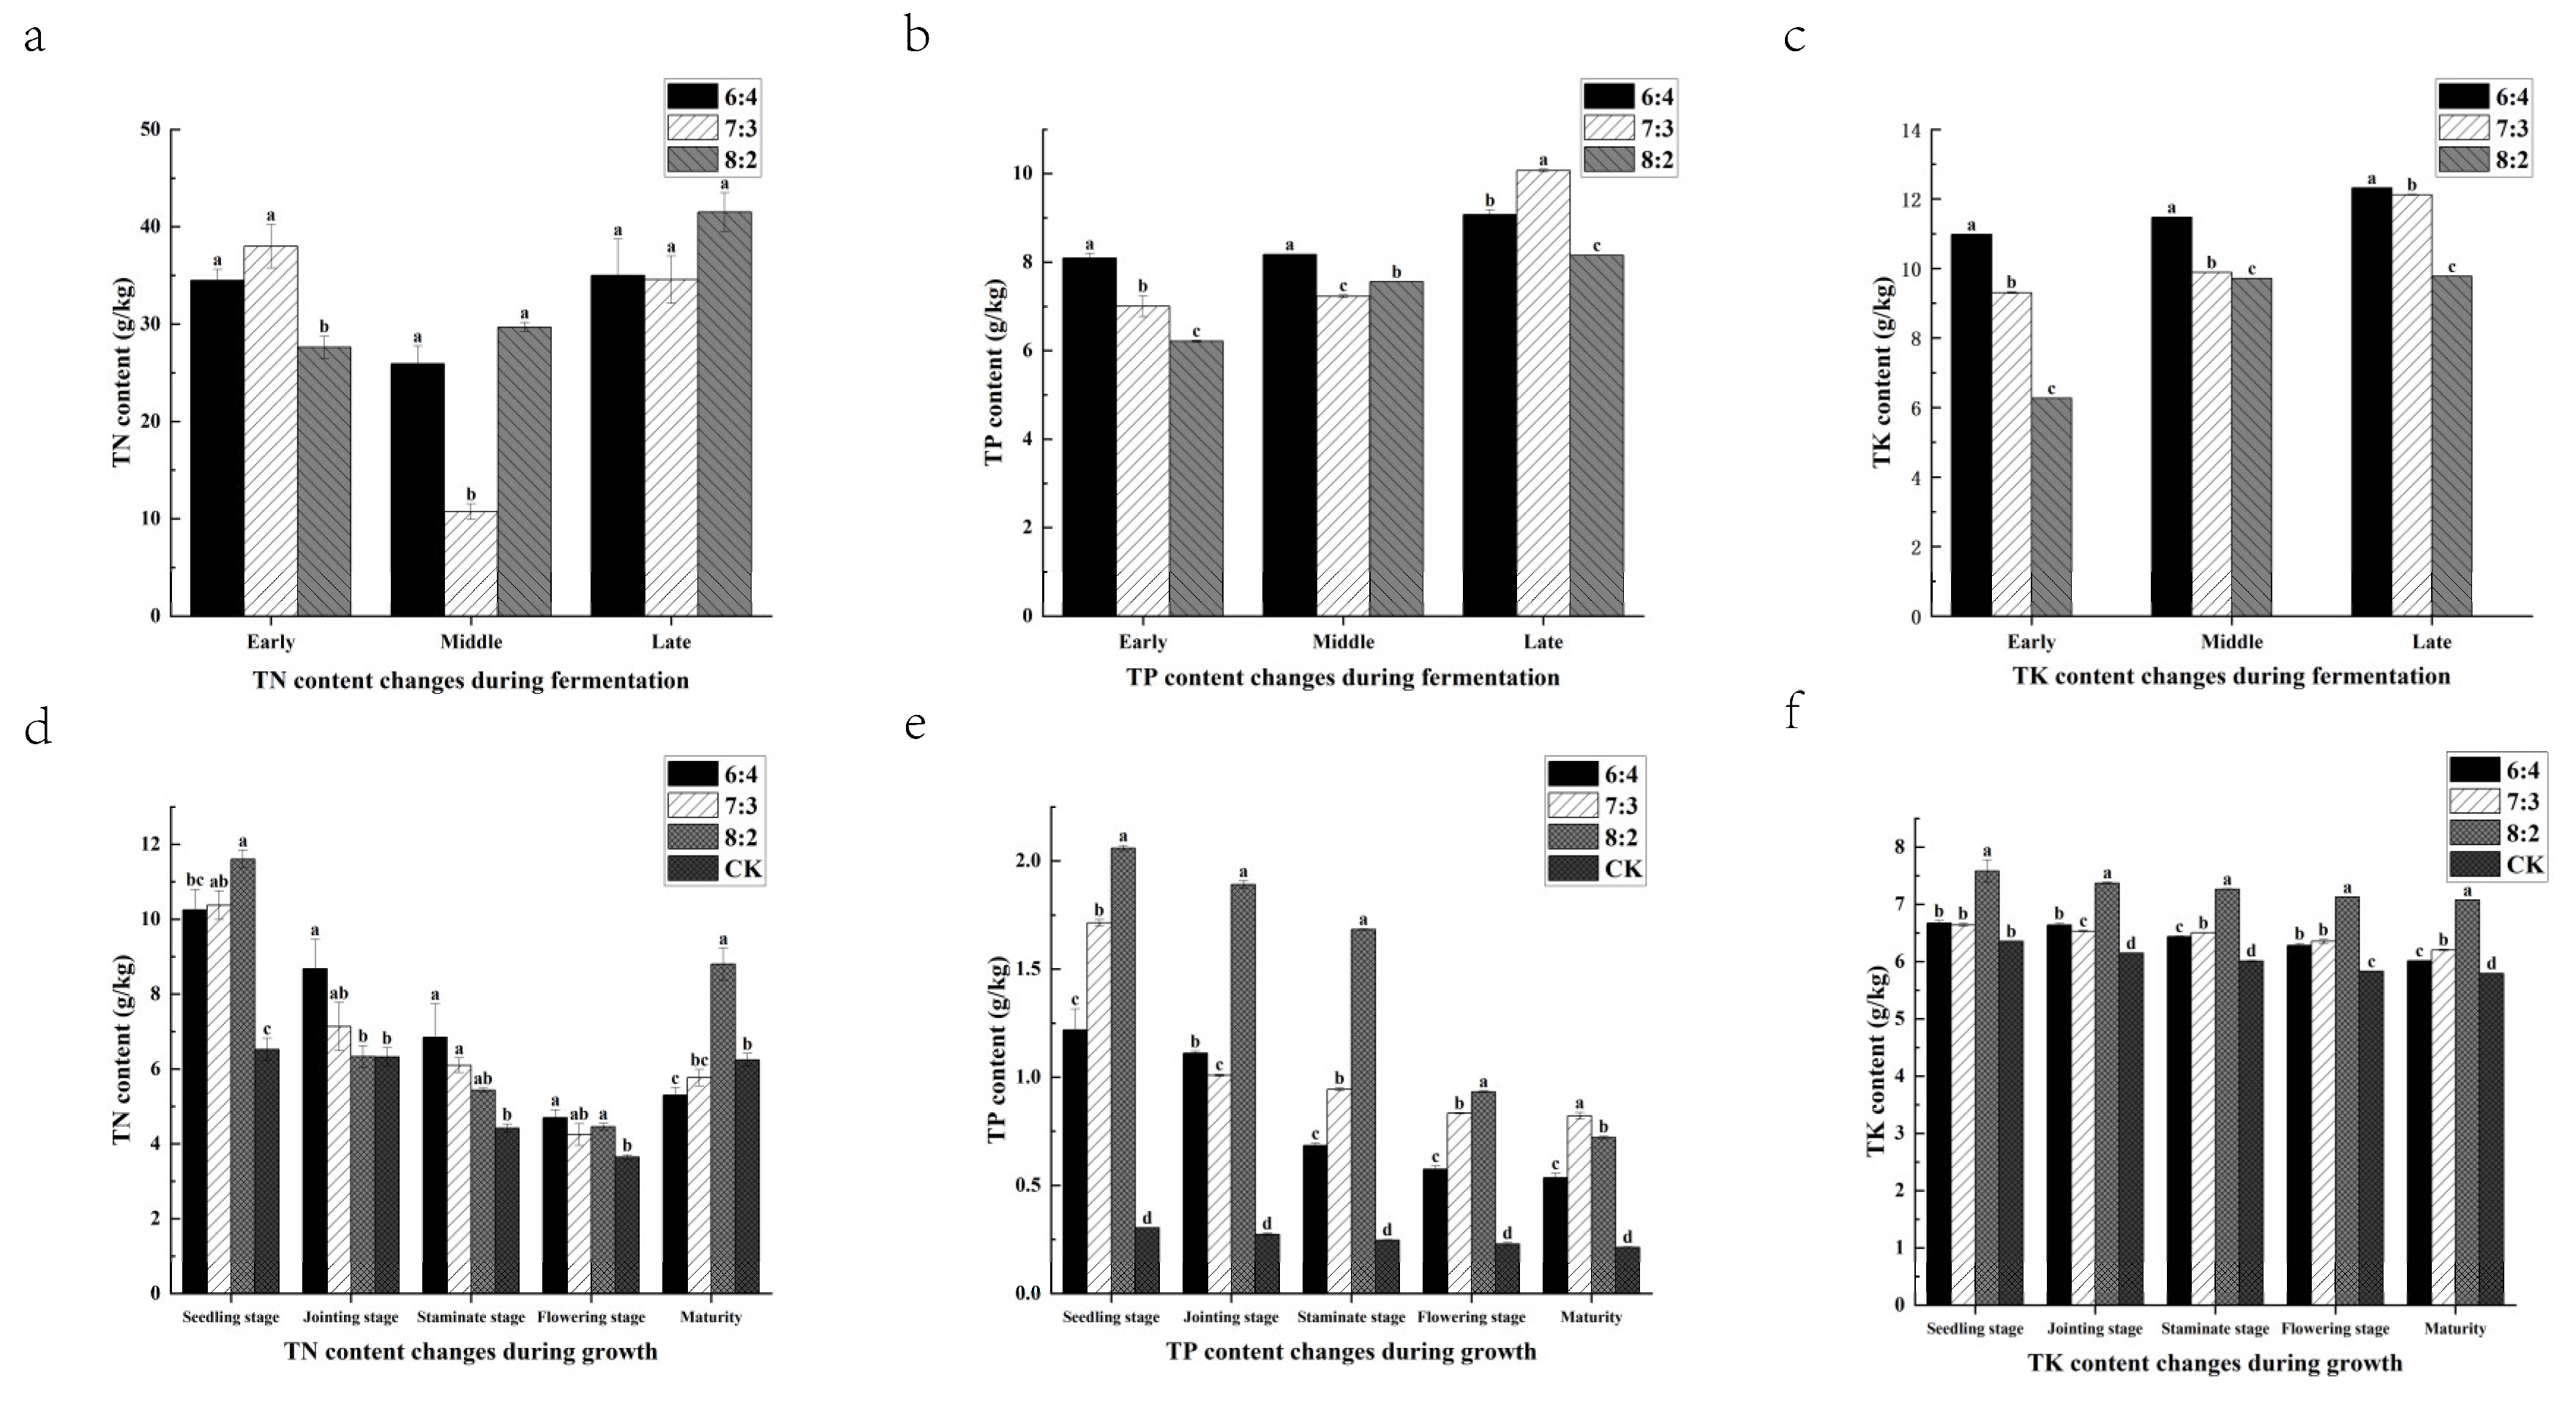
3.6. Changes in Total Nitrogen, Total Phosphorus, and Total Potassium Content

During the composting process (Figure 3a–c), TN followed a trend of initial decline followed by an increase. The decrease in TN during the early fermentation stage was attributed to microbial ammonification, whereas the subsequent increase in the later stage resulted from the activity of nitrifying bacteria. By the end of composting, TN was highest in the 8:2 treatment, reaching 41.5 g/kg. Both TP and TK exhibited a continuous increase through composting. The TP reached its highest level in the 7:3 treatment at 10.07 g/kg, while TK was highest in the 6:4 treatment, at 12.32 g/kg. These findings indicate that different fermentation treatments significantly influenced the accumulation patterns of TN, TP, and TK.
During maize growth (Figure 3d–f), soil TN gradually decreased before increasing again at maturity. TN was significantly higher in B3 than in other treatments at maturity, while B1 exhibited the greatest TN reduction (48.31%). No significant differences in TN were observed among treatments during the growth period. Soil TP and TK showed a decreasing trend throughout maize growth. Before the flowering stage, TP was significantly higher in B3 than in other treatments, but it also experienced the greatest decline (65%) by maturity. Throughout the maize growth period, soil TK was significantly higher in B3 compared to other treatments, whereas B1 exhibited the largest TK reduction (9.9%) (p < 0.05).

3.7. Changes in Microbial Community Diversity

3.7.1. OTU Analysis

During the compost fermentation process (Figure S1), the A1 treatment exhibited a total of 182 OTU features, while A2 had 180, and A3 had 250. In the early fermentation stage, A3 contained the highest number of OTU features (1943). For fungal OTU features (Figure S2), A1 had the lowest OTU count, with 609 features. At specific stages of fermentation, A1 displayed 259 OTU features, A2 had 66, and A3 had 70. Notably, A1 reached its peak OTU count of 4054 in the late fermentation stage, whereas A2 exhibited the lowest OTU count (707) during the mid-fermentation phase.
During the Auricularia heimuer residue field application process (Figure S3), the bacterial OTU features varied across treatments. The B1 and B2 treatments each exhibited a total of 82 OTU features, while B3 had 245, and the CK had 301. Throughout maize growth, the OTU count in the B1 treatment was highest during the flowering and silking stage (2051) and lowest during the seedling stage (714). In the B2 treatment, the OTU count peaked at 2281 during flowering and was lowest at 653 during the seedling stage. The B3 treatment exhibited the highest OTU count in the staminate stage (2351) and the lowest in the seedling stage (1400). The CK treatment had the highest OTU count at the jointing stage (1789) and the lowest at the seedling stage (1319). For fungal OTU features (Figure S4), B1 and B2 treatments had 34 OTU features each, whereas B3 had 70, and CK had 41. In the B1 treatment, fungal OTU counts were highest during the seedling stage (3946) and the lowest at the flowering and silking stage (821). The B2 treatment had the highest OTU count at the jointing stage (4493) and the lowest at the seedling stage (541). In the B3 treatment, fungal OTU counts were the highest at the flowering and silking stage (2772) and were the lowest during the staminate stage (1095). For the CK treatment, the highest OUT count was recorded at the seedling stage (2117), while the lowers were observed at maturity (969).

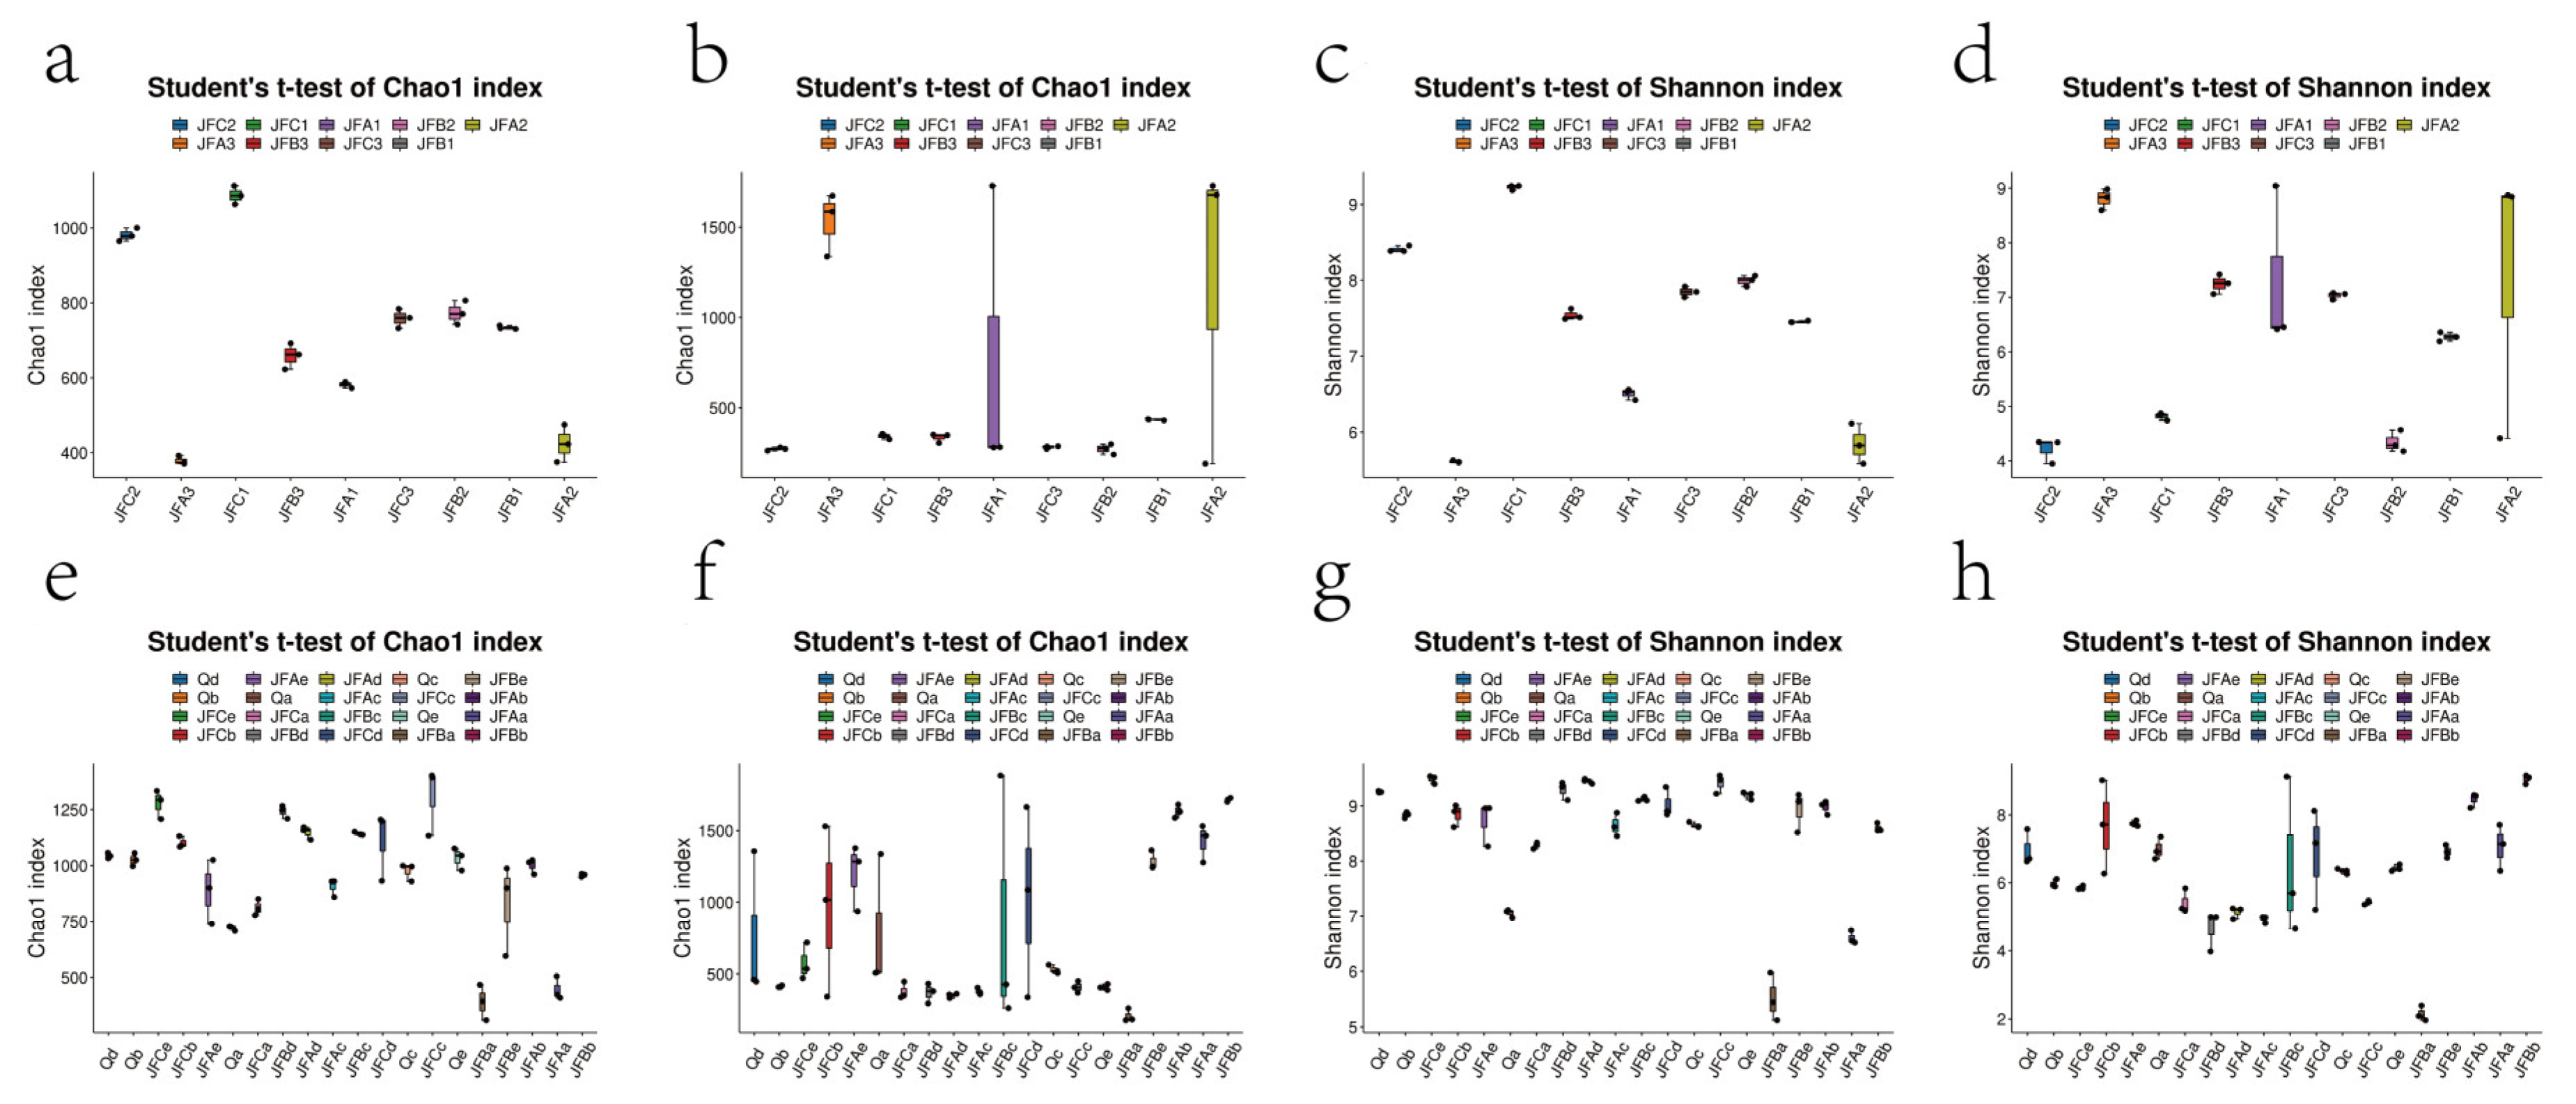
3.7.2. Effects of Microbial Alpha Diversity on Bacterial and Fungal Communities

Chao1 and Shannon indices were used to assess the richness and diversity of microbial communities (Figure 4). A higher microbial diversity index and richness index indicate greater species complexity. In alpha diversity analysis, the sequencing coverage was ≥99.9%, confirming that the microbial sequences in all samples were fully captured. During the composting process, bacterial richness in the A3 treatment was higher than in A1 and A2, with A3 exhibiting the highest richness during the pre-fermentation period. Conversely, fungal abundance was highest in the A1 treatment, particularly during the late fermentation period. During maize growth, bacterial abundance in the B3 treatment was higher than in other treatments, with the highest bacterial abundance recorded during the staminate stage of B2 treatment. Meanwhile, fungal abundance was highest in the B1 treatment, reaching its peak during the jointing stage.
The bacterial community diversity indices during composting ranged from 5.584 to 6.559 in the A1 treatment, 7.4488 to 8.063 in the A2 treatment, and 7.778 to 9.247 in the A3 treatment. During maize growth, bacterial diversity indices ranged from 6.744 to 9.491 in the B1 treatment, 5.122 to 9.420 in the B2 treatment, 8.221 to 9.552 in the B3 treatment, and 6.970 to 9.273 in the CK treatment. The fungal community diversity indices during composting ranged from 4.414 to 9.043 in the A1 treatment, 4.177 to 7.419 in the A2 treatment, and 3.949 to 7.076 in the A3 treatment. During maize growth, fungal diversity indices ranged from 4.811 to 8.583 in the B1 treatment, 1.964 to 9.160 in the B2 treatment, 5.170 to 9.022 in the B3 treatment, and 5.893 to 7.583 in the CK treatment. Among treatments, bacterial diversity was highest in the A3 treatment during composting and in the B3 treatment during maize growth. Fungal diversity was also highest in the A3 treatment, particularly during the pre-fermentation period. During maize growth, fungal diversity was highest in the B1 treatment, whereas B2 and B3 treatments exhibited lower fungal diversity than the CK treatment.
The bacterial Chao1 and Shannon indices were highest in A3 treatment during composting, while the fungal Chao1 and Shannon indices were highest in A1 treatment. During maize growth, the bacterial Chao1 and Shannon indices reached their highest levels in the B3 treatment, whereas the fungal Chao1 and Shannon indices were highest in B1 treatment. Overall, soil bacterial and fungal diversity exhibited significant variations in species richness and diversity across treatments.

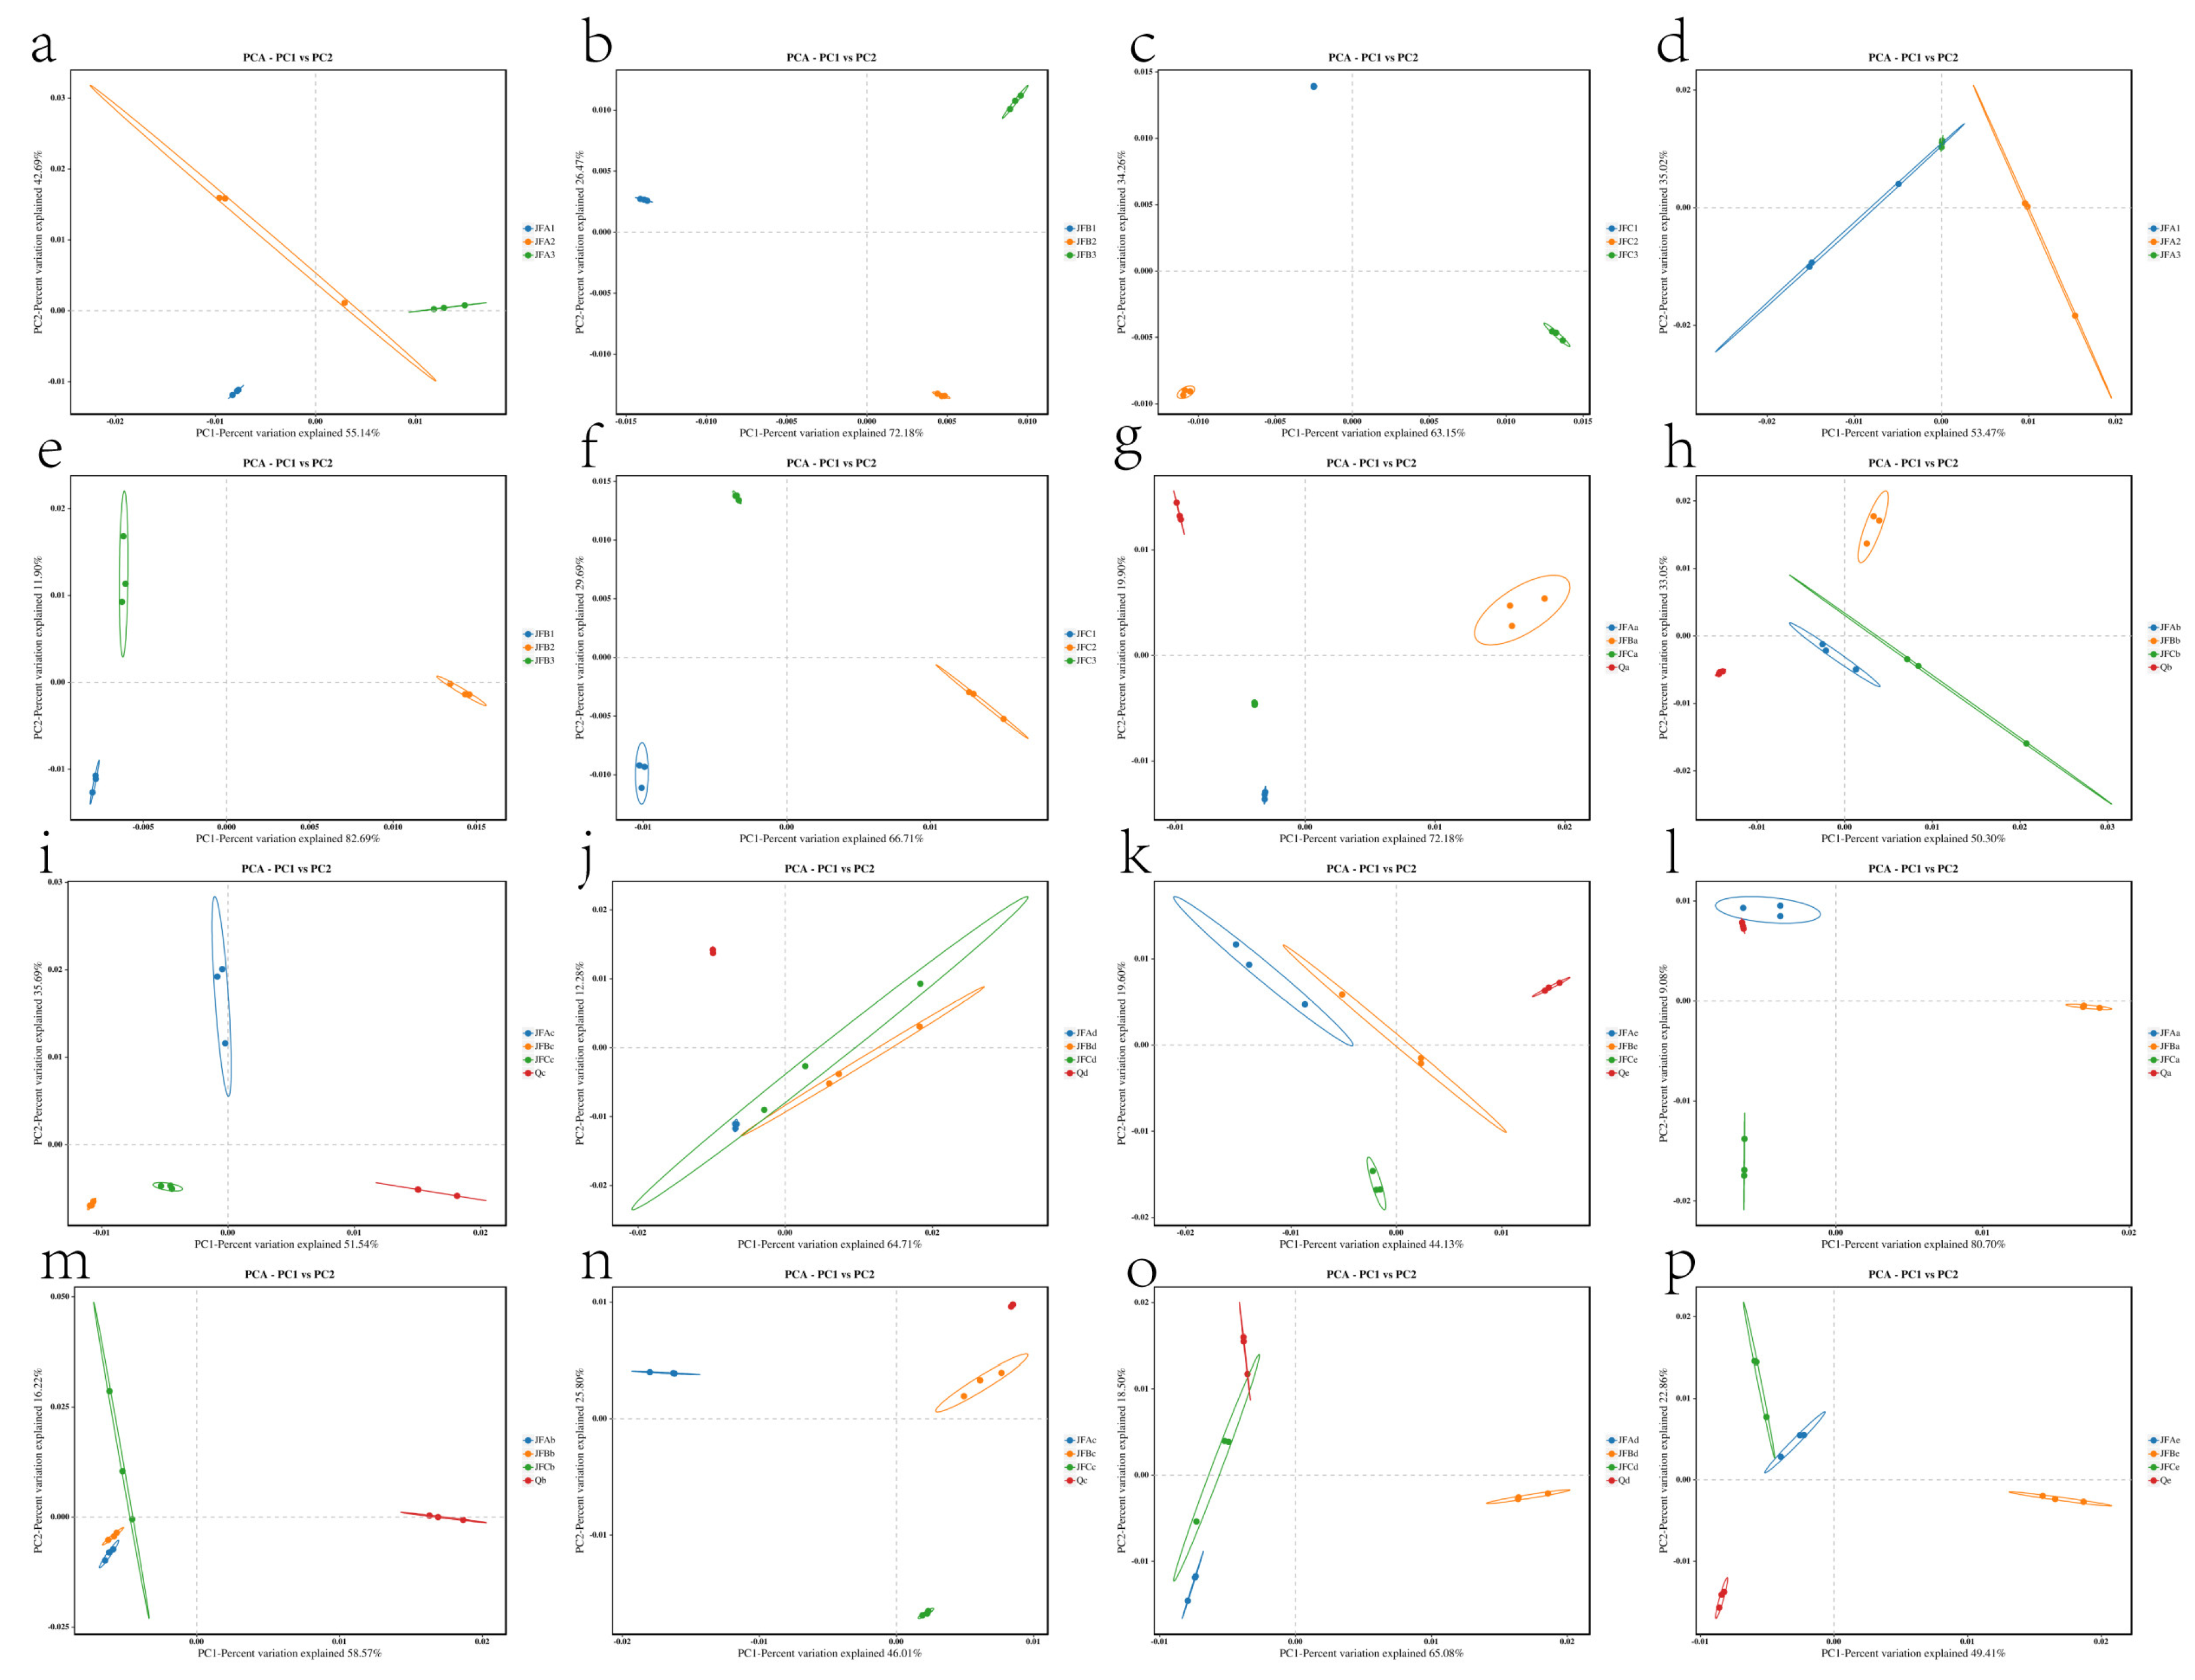
3.7.3. Effects of Beta Diversity of Microbial Bacterial and Fungal Communities

The effects of different composting treatments on the beta diversity of bacterial communities PCA demonstrated that different composting treatments influenced the bacteria community composition (Figure 5). For the bacterial community structure (Figure 5a–c), in the A1 treatment, the first and second principal coordinates explained 55.14% and 42.69% of the variation during fermentation, respectively. In the A2 treatment, these coordinates explained 72.18% and 26.47%, while in the A3 treatment, they explained 63.15% and 34.26% of the variation. In the A1 treatment, bacterial communities in the pre-, mid-, and post-fermentation stages were significantly separated, although the middle and late stages communities were more closely clustered, indicating greater similarity. In contrast, in both the A2 and A3 treatments, bacterial communities were distinctly separated across the early, middle, and late fermentation stages. For fungal community structure (Figure 5d–f), in the A1 treatment, the first and second principal coordinates explained 53.47% and 35.02% of the variation during fermentation, respectively. In the A2 treatment, they explained 82.69% and 11.90%, while in the A3 treatment, they explained 66.91% and 29.69% of the variation. The fungal communities in all three treatments were significantly separated in the pre-, mid-, and post-fermentation stages.
In the soil bacterial community structure, PCA revealed distinct variations among the four treatments at different growth stages (Figure 5g–k). At the seedling stage, the first and second principal coordinates explained 72.18% and 19.90% of the variation, respectively. At the nodulation stage, they accounted for 50.30% and 33.05% of the variation, while at the staminate extraction stage, they explained 51.54% and 35.69% of the differences. During the anthesis and silking stage, the variation was 64.71% and 12.28%, and at maturity, the bacterial community variation among the four treatments was explained by 44.13% and 19.60% of the principal coordinates, respectively. The bacterial communities of all four treatments were distinctly separated, with the B1 and B2 treatments clustering more closely together, indicating greater similarity in their bacterial community structures. For the fungal community structure (Figure 5l–p), the first and second principal coordinates at the seedling stage explained 80.70% and 9.08% of the differences among the four treatments, respectively. At the nodulation stage, these accounted for 58.57% and 16.22% of the variation, while at the staminate stage, they explained 46.01% and 25.80% of the differences. During the flowering and silking stage, the variation was 65.08% and 18.50%. At maturity, the fungal community variation among the four treatments was explained by 49.41% and 22.86% of the principal coordinates. The fungal communities across all four treatments were clearly separated. The bacterial community structures of the B1 and B2 treatments were more closely related, suggesting greater similarity in their microbial composition. Similarly, the bacterial community structures of the B3 and CK treatments clustered together, indicating a more similar microbial structure between these treatments.

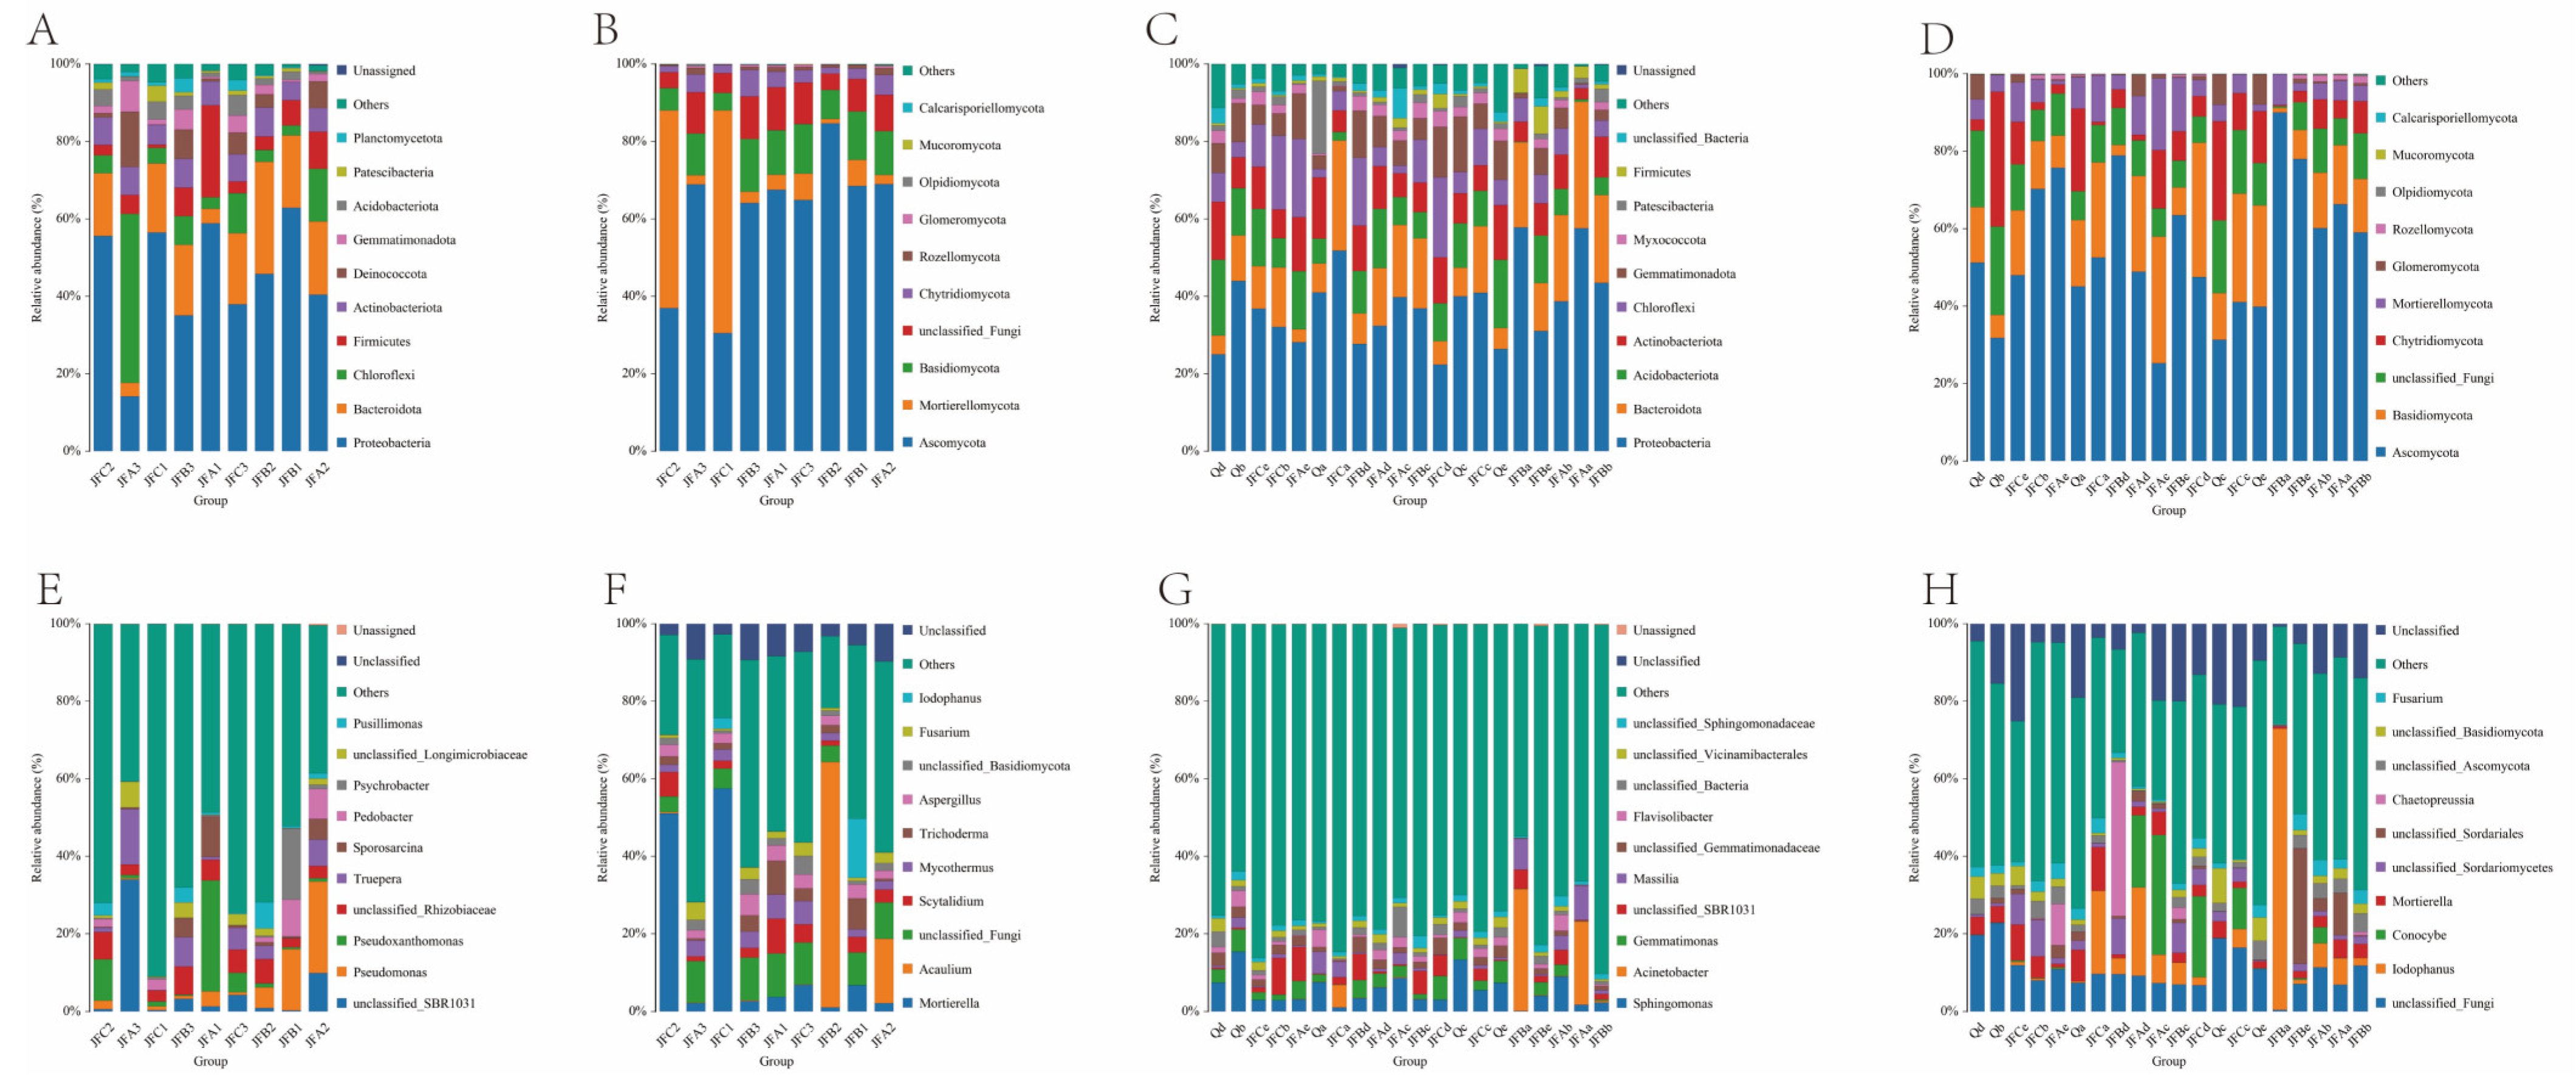
3.7.4. Composition and Relative Abundance at the Phylum Level of Microbial Bacteria and Fungi

The five most dominant phyla across all samples were Proteobacteria, Bacteroidota, Chloroflexi, Firmicutes, and Actinobacteria, collectively accounting for more than 85% of the bacterial community’ s relative abundance (Figure 6A). Among these, the highest relative abundances of Proteobacteria (62.9%) and Bacteroidota (28.9%) were observed in the A2 treatment. The A1 treatment exhibited the highest abundance of Chloroflexi (43.63%) and Firmicutes (23.78%), while Actinobacteria reached its highest abundance (7.51%) in the A2 treatment. The dominant fungal phyla affected by bacterial fertilizer application were Ascomycota, Basidiomycota, Mortierellomycota, unclassified-Fungi, and Chytridiomycota, together constituting more than 85% of the fungal community’s relative abundance (Figure 6B). Among these, Ascomycota (85%) and Basidiomycota (13.6%) were most abundant in the A2 treatment. Mortierellomycota exhibited its highest abundance (64.9%) in the A3 treatment, while unclassified-Fungi were most prevalent in the 6:4 treatment (11.11%). The highest abundance of Chytridiomycota (6.9%) was recorded in the A2 treatment.
From Figure 6C, at the seedling stage, the relative abundance of Proteobacteria and Bacteroidota was highest in the B1 treatment, increasing by 16.59% and 25.12%, respectively, compared to the CK treatment. Additionally, the relative abundance of Chloroflexi in the B2 treatment increased by 3.99% compared to the CK treatment. At the jointing stage, Proteobacteria and Acidobacteriota exhibited the highest relative abundance in CK. In contrast, in the B3 treatment, the relative abundance of Chloroflexi and Bacteroidota increased by 15.04% and 10.98%, respectively, compared to CK. At the staminate stage, Proteobacteria increased by 0.9% in B3 compared to CK, while Bacteroidota increased by 1.45% in B1. The highest relative abundance of Acidobacteriota was observed in CK, whereas Chloroflexi in B2 was 5.55% higher than in CK. At the flowering and silking stage, Proteobacteria and Bacteroidota had the highest relative abundance in B1, increasing by 7.29% and 10.05%, respectively. Meanwhile, Acidobacteriota remained the highest in CK, and Chloroflexi in B3 was 13.16% higher than in CK. At the mature stage, Proteobacteria increased by 10.47% in B3 compared to CK, while Bacteroidota in B2 increased by 6.97% relative to CK. Acidobacteriota was most abundant in CK, and the B1 treatment exhibited a 13.67% increase in its relative abundance compared to CK.
From Figure 6D, at the seedling stage, the relative abundance of Basidiomycota and Mortierellomycota was highest in the B3 treatment, increasing by 7.33% and 3.91%, respectively, compared to the CK treatment. The relative abundance of Ascomycota in the B2 treatment was 44.92% higher than in CK, while Chytridiomycota exhibited the highest relative abundance in CK. At the jointing stage, Ascomycota and Basidiomycota reached their highest relative abundance in B1, increasing by 28.37% and 8.38%, respectively. Mortierellomycota abundance in B3 increased by 1.62% compared to CK, whereas Chytridiomycota remained the most abundant in CK. At the staminate stage, Basidiomycota and Mortierellomycota were most abundant in B1, with increases of 20.43% and 14.21%, respectively, compared to CK treatment. Ascomycota abundance in B2 increased by 32.18% relative to CK, while Chytridiomycota remained the most abundant in CK. At the flowering and silking stage, Ascomycota abundance in B2 increased by 27.63% compared to CK, while Basidiomycota abundance in B3 increased by 34.7%. Mortierellomycota in B1 increased by 4.75% compared to CK, whereas Chytridiomycota remained the most abundant in CK. At the mature stage, Mortierellomycota and Chytridiomycota exhibited the highest relative abundance in B3, increasing by 8.44% and 8.08%, respectively, compared to CK. In B2 treatment, Ascomycota increased by 38.11%, while Basidiomycota remained most abundant in CK.

3.7.5. Genus-Level Composition and Relative Abundance of Microbial Bacteria and Fungi

The relative abundance of known bacterial taxa detected at the genus level during composting treatments A1, A2, and A3 varied across treatments (Figure 6E). In the A1 treatment, Pseudomonas ranged from 28.63 to 0.83%, unclassified-SBR1031 from 34.02 to 1.34%, Pseudoxanthomonas from 23.61 to 0.29%, Truepera from 14.29 to 0.72%, Sporosarcina from 10.35 to 0.48%, and Pedobacter from 7.69–0%. In the A2 treatment, Pseudomonas ranged from 15.72 to 0.75%, unclassified-SBR1031 from 3.33 to 0.28%, Pseudoxanthomonas from 1.05 to 0.26%, Truepera from 7.55 to 0.02%, Sporosarcina from 5.03 to 0.51%, and Pedobacter from 9.48 to 0%. In the A3 treatment, Pseudomonas ranged from 2.16 to 0.73%, unclassified-SBR1031 from 4.26 to 0.38%, Pseudoxanthomonas from 10.63 to 1.25%, Truepera from 5.62 to 0.11%, and Sporosarcina from 0.63 to 0.01%, and Pedobacter from 2.74 to 0.06%. The highest relative abundances of Pseudomonas, unclassified-SBR1031, Pseudoxanthomonas, Truepera, and Sporosarcina were observed in the A1 treatment, whereas Pedobacter was most abundant in the A2 treatment. The relative abundance of known fungal taxa at the genus level also varied among treatments (Figure 6F). In the A1 treatment, Mortierella ranged from 3.79% to 2.11%, Acaulium from 16.53% to 0.01%, unclassified-Fungi from 11.11% to 9.38%, unidentified fungi from 9.57% to 8.10%, Scytalidium from 8.98% to 1.24%, and Mycothermus from 6.21% to 2.25%. In the A2 treatment, Mortierella ranged from 6.74% to 1.07%, Acaulium from 63.26% to 0.21%, unclassified-Fungi from 11.02% to 4.24%, unidentified fungi from 9.19% to 3.09%, and Scytalidium from 3.98% to 1.32%. In the A3 treatment, Mortierella ranged from 57.50% to 6.82%, Acaulium from 0.34% to 0%, unclassified-Fungi from 10.75% to 4.06%, unidentified fungi from 7.03% to 2.64%, Scytalidium from 6.27% to 2.06%, and Mycothermus from 5.96% to 1.88%. The highest relative abundance of Mortierella was observed in the A3 treatment, while Acaulium was most abundant in A2. The highest relative abundances of unclassified-Fungi, unidentified fungi, Scytalidium, and Mycothermus were found in the A1 treatment.
The relative abundance of known bacterial taxa detected at the genus level in the inter-root soil during growth varied across treatments (Figure 6G). In the B1 treatment, Sphingomonas ranged from 8.99 to 1.78%, Acinetobacter from 21.41 to 0.01%, Gemmatimonas from 4.71 to 0.093%, unclassified- SBR1031 from 8.68 to 0.31%, Massilia from 8.70 to 0.3%. In the B2 treatment, Sphingomonas ranged from 4.06 to 0.14%, Acinetobacter from 31.44 to 0.05%, Gemmatimonas from 4.57 to 0.06%, unclassified-SBR1031 from 6.67 to 1.47%, and Massilia from 7.95 to 0.42%. In the B3 treatment, Sphingomonas ranged from 5.54 to 1.07%, Acinetobacter from 5.76 to 0%, Gemmatimonas from 6.03% –0.12%, unclassified-SBR1031 from 9.46 to 1.25%, and Massilia from 3.95 to 0.19%. In the CK treatment, Sphingomonas ranged from 15.37 to 7.37%, Acinetobacter from 0.07 to 0%, Gemmatimonas from 5.75 to 1.95%, unclassified-SBR1031 was 0%, and Massilia from 5.66 to 0.48%. The relative abundance of Sphingomonas and Gemmatimonas was highest in the CK treatment, Acinetobacter was most abundant in B2, Massilia was highest in B1, and unclassified-SBR1031 was most abundant in B3. The relative abundance of fungal taxa at the genus level also varied among treatments (Figure 6H). In the B1 treatment, unidentified fungi ranged from 19.72 to 2.27%, unclassified-fungi from 11.37 to 6.89%, Iodophanus from 22.82 to 0.11%, Conocybe from 30.85 to 0.05%, and Mortierella from 6.10 to 0.89%. In the B2 treatment, unidentified fungi ranged from 19.86 to 0.64%, unclassified-fungi from 11.81 to 0.46%, Iodophanus from 72.59 to 1.01%, Conocybe from 0.40% to 0%, and Mortierella from 3.57 to 0.47%. In the B3 treatment, unidentified fungi ranged from 25.06 to 3.48%, unclassified-fungi from 16.40 to 6.79%, Iodophanus from 21.47 to 0.47%, Conocybe from 20.88 to 0.01%, and Mortierella from 11.24 to 1.62%. In the CK treatment, unidentified fungi ranged from 20.71 to 4.41%, unclassified-fungi from 22.81 to 7.42%, Iodophanus from 0.01 to 0.002%, Conocybe from 0.1 to 0.004%, and Mortierella from 8.06 to 1.73%. The relative abundance of unidentified fungi and unclassified-Fungi was highest in CK, Iodophanus was most abundant in B2, Conocybe in B1, and Mortierella in B3. The addition of fungal fertilizer significantly influenced the composition and structure of the microbial community.

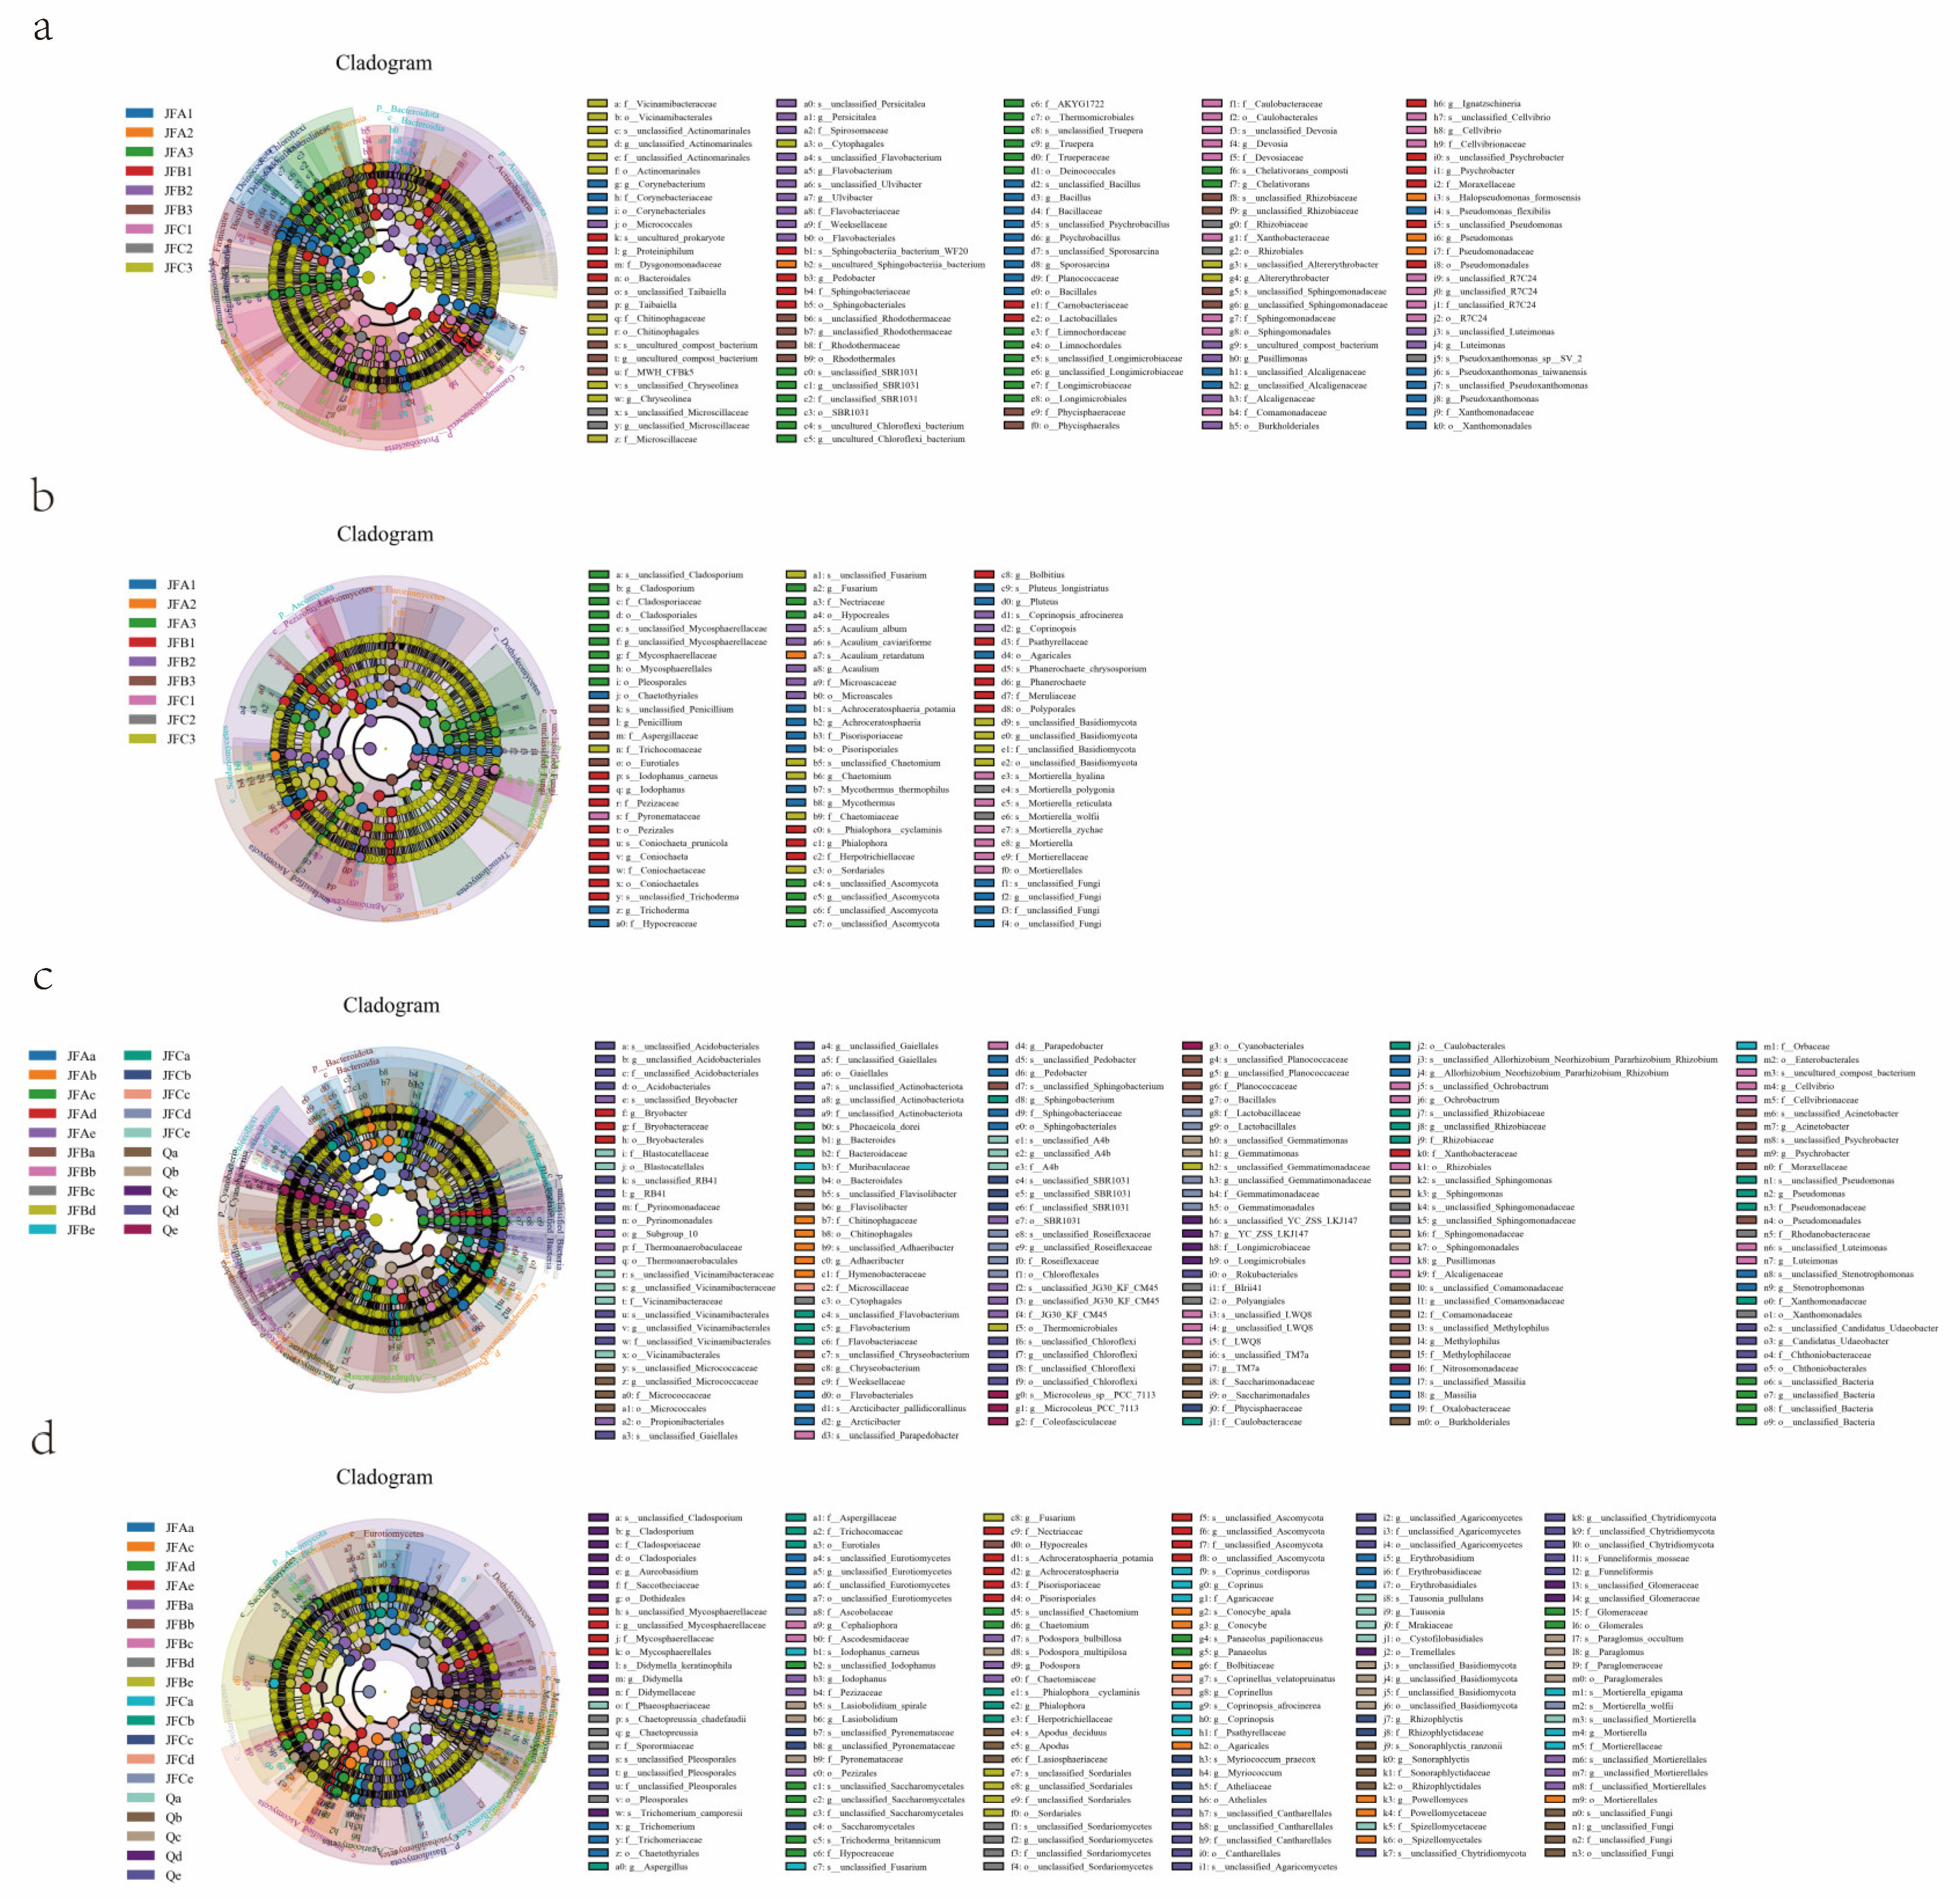
3.7.6. Differential Species Analysis of Soil Microbial Communities by Different Composting Treatments

Each circle in the evolutionary diagram represents a taxonomic classification at a given level. As shown in the figure, 44 bacterial branches exhibited statistically significant differences. In terms of bacterial classification (Figure 7a), the JFA1 treatment contained a higher number of bacterial taxa during the composting process, with 19 phyla, 0 orders, 5 orders, 5 families, and 9 genera, including Coryncbacteriales (order to genus), Conella (genus), unclassified-Bacillus (genus), Psychrobacillus (genus), Sporosarcina (genus), and Pseudomonas-flexible (genus). The JFB3 treatment exhibited a greater diversity of bacterial species, comprising 10 orders, 10 families, and 18 genera, including Rhodothermales (order to genus), unclassified-SBR1031 (genus), Trueperaceae (family to genus), Sporosarcina (genus), and Sphingomonadales (order to family). The JFC3 treatment contained 8 orders, 5 families, and 12 genera, with dominant taxa including Rhodothermales (order to genus), SBR1031 (genus), Trueperaceae (family to genus), Longimicrobiales (order to family), and Altereythrobacter (genus). In terms of fungal classification (Figure 7b), the JFA3 treatment exhibited the highest fungal diversity, containing 1 order, 3 families, and 4 genera, including Mycosphaerellaceae (order to family) and unclassified-Ascomycota (genus). The JFB3 treatment had 2 orders, 2 families, and 13 genera, including Aspergillaceae (family), Fusarium (genus), Chaetomiaceae (family to genus), unclassified-Basidiomycota (genus), and unclassified-Fungi (genus). The JFC1 treatment exhibited 3 orders, 5 families, and 11 genera, including Pseudeurotiaceae (family), Chaetomium (genus), unclassified-Basidiomycota (genus), and unclassified-Fungi (genus).
From Figure 7c, during the seedling stage, the Qa treatment contained the highest number of bacterial species, with 7 orders, 11 families, and 10 genera, including Pseudoarthrobacter (genus), Flavisolibacter (genus), Gemmatimonadales (order to family), TM7a (genus) and Sphingomonadales (order to genus). At the jointing stage, theJFBb treatment exhibited the highest bacterial diversity, with 6 orders, 5 families, and 13 genera, including Chryseobacterium (genus), Flavobacteriales (order), Paraperpedobacter (genus), Pusillimonas (genus), and Luteimonas (genus). During the staminate stage, the Qc treatment contained 5 orders, 3 families, and 6 genera, including Acidobacteriales (order), Cyanobacteriales (order), Gemmatimonadales (order to genus), and Sphingomonadales (order to genus). At the flowering and silking stage, the Qd treatment had the highest bacterial diversity, with 13 orders, 2 families, and 11 genera, including Acidobacteriales (order), RB41 (genus), Gaiellales (order), Sphingomonadales (order to genus), Xanthomonadales (order), and unclassified-Bacteria (genus). At the maturity stage, the JFCe treatment contained the greatest number of bacterial species, with 6 orders, 8 genera, and 6 families, including Vicinamibacterales (order to family), Chitinophagales (order to family), A4b (genus), Pseudomonadales (order to genus), and Luteimonas (genus). Fungal species diversity also varies across treatments.
From Figure 7d, during the seedling stage, the JFCa treatment exhibited the highest fungal diversity, with 2 orders, 4 families, and 11 genera, including Iodophanus-carneus (genus), Botryotrichum (genus), Myriococcum (genus), and Mortierellaceae (family to genus). At the jointing stage, the Qb treatment contained the highest fungal diversity, with 1 order, 3 families, and 9 genera, including Sonoraphlyctidaceae (family to genus), Powellomycetaceae (family to genus), and unclassified-fungi (genus). During the staminate stage, the Qc treatment contained 2 orders, 2 families, and 11 genera, including Podospora (genus), unclassified-Basidiomycota (genus), Paraglomerales (order to genus), and unclassified-fungi (genus). At the flowering and silking stage, the JFAd treatment exhibited the highest fungal diversity, with 2 phyla, 12 orders, 4 families, and 8 genera, including Iodophanus (genus), Chaetomium (genus), unclassified-Sordariales (order), and unclassified-Mortierellomycota (phylum and order). At the maturity stage, the Qe treatment had the highest fungal diversity, with 8 phyla, 4 orders, 3 families, and 4 genera, including Cladosporiales (order to genus), Cantharellales (order), unclassified-Basidiomycota (phylum), and Funneliformis (genus).

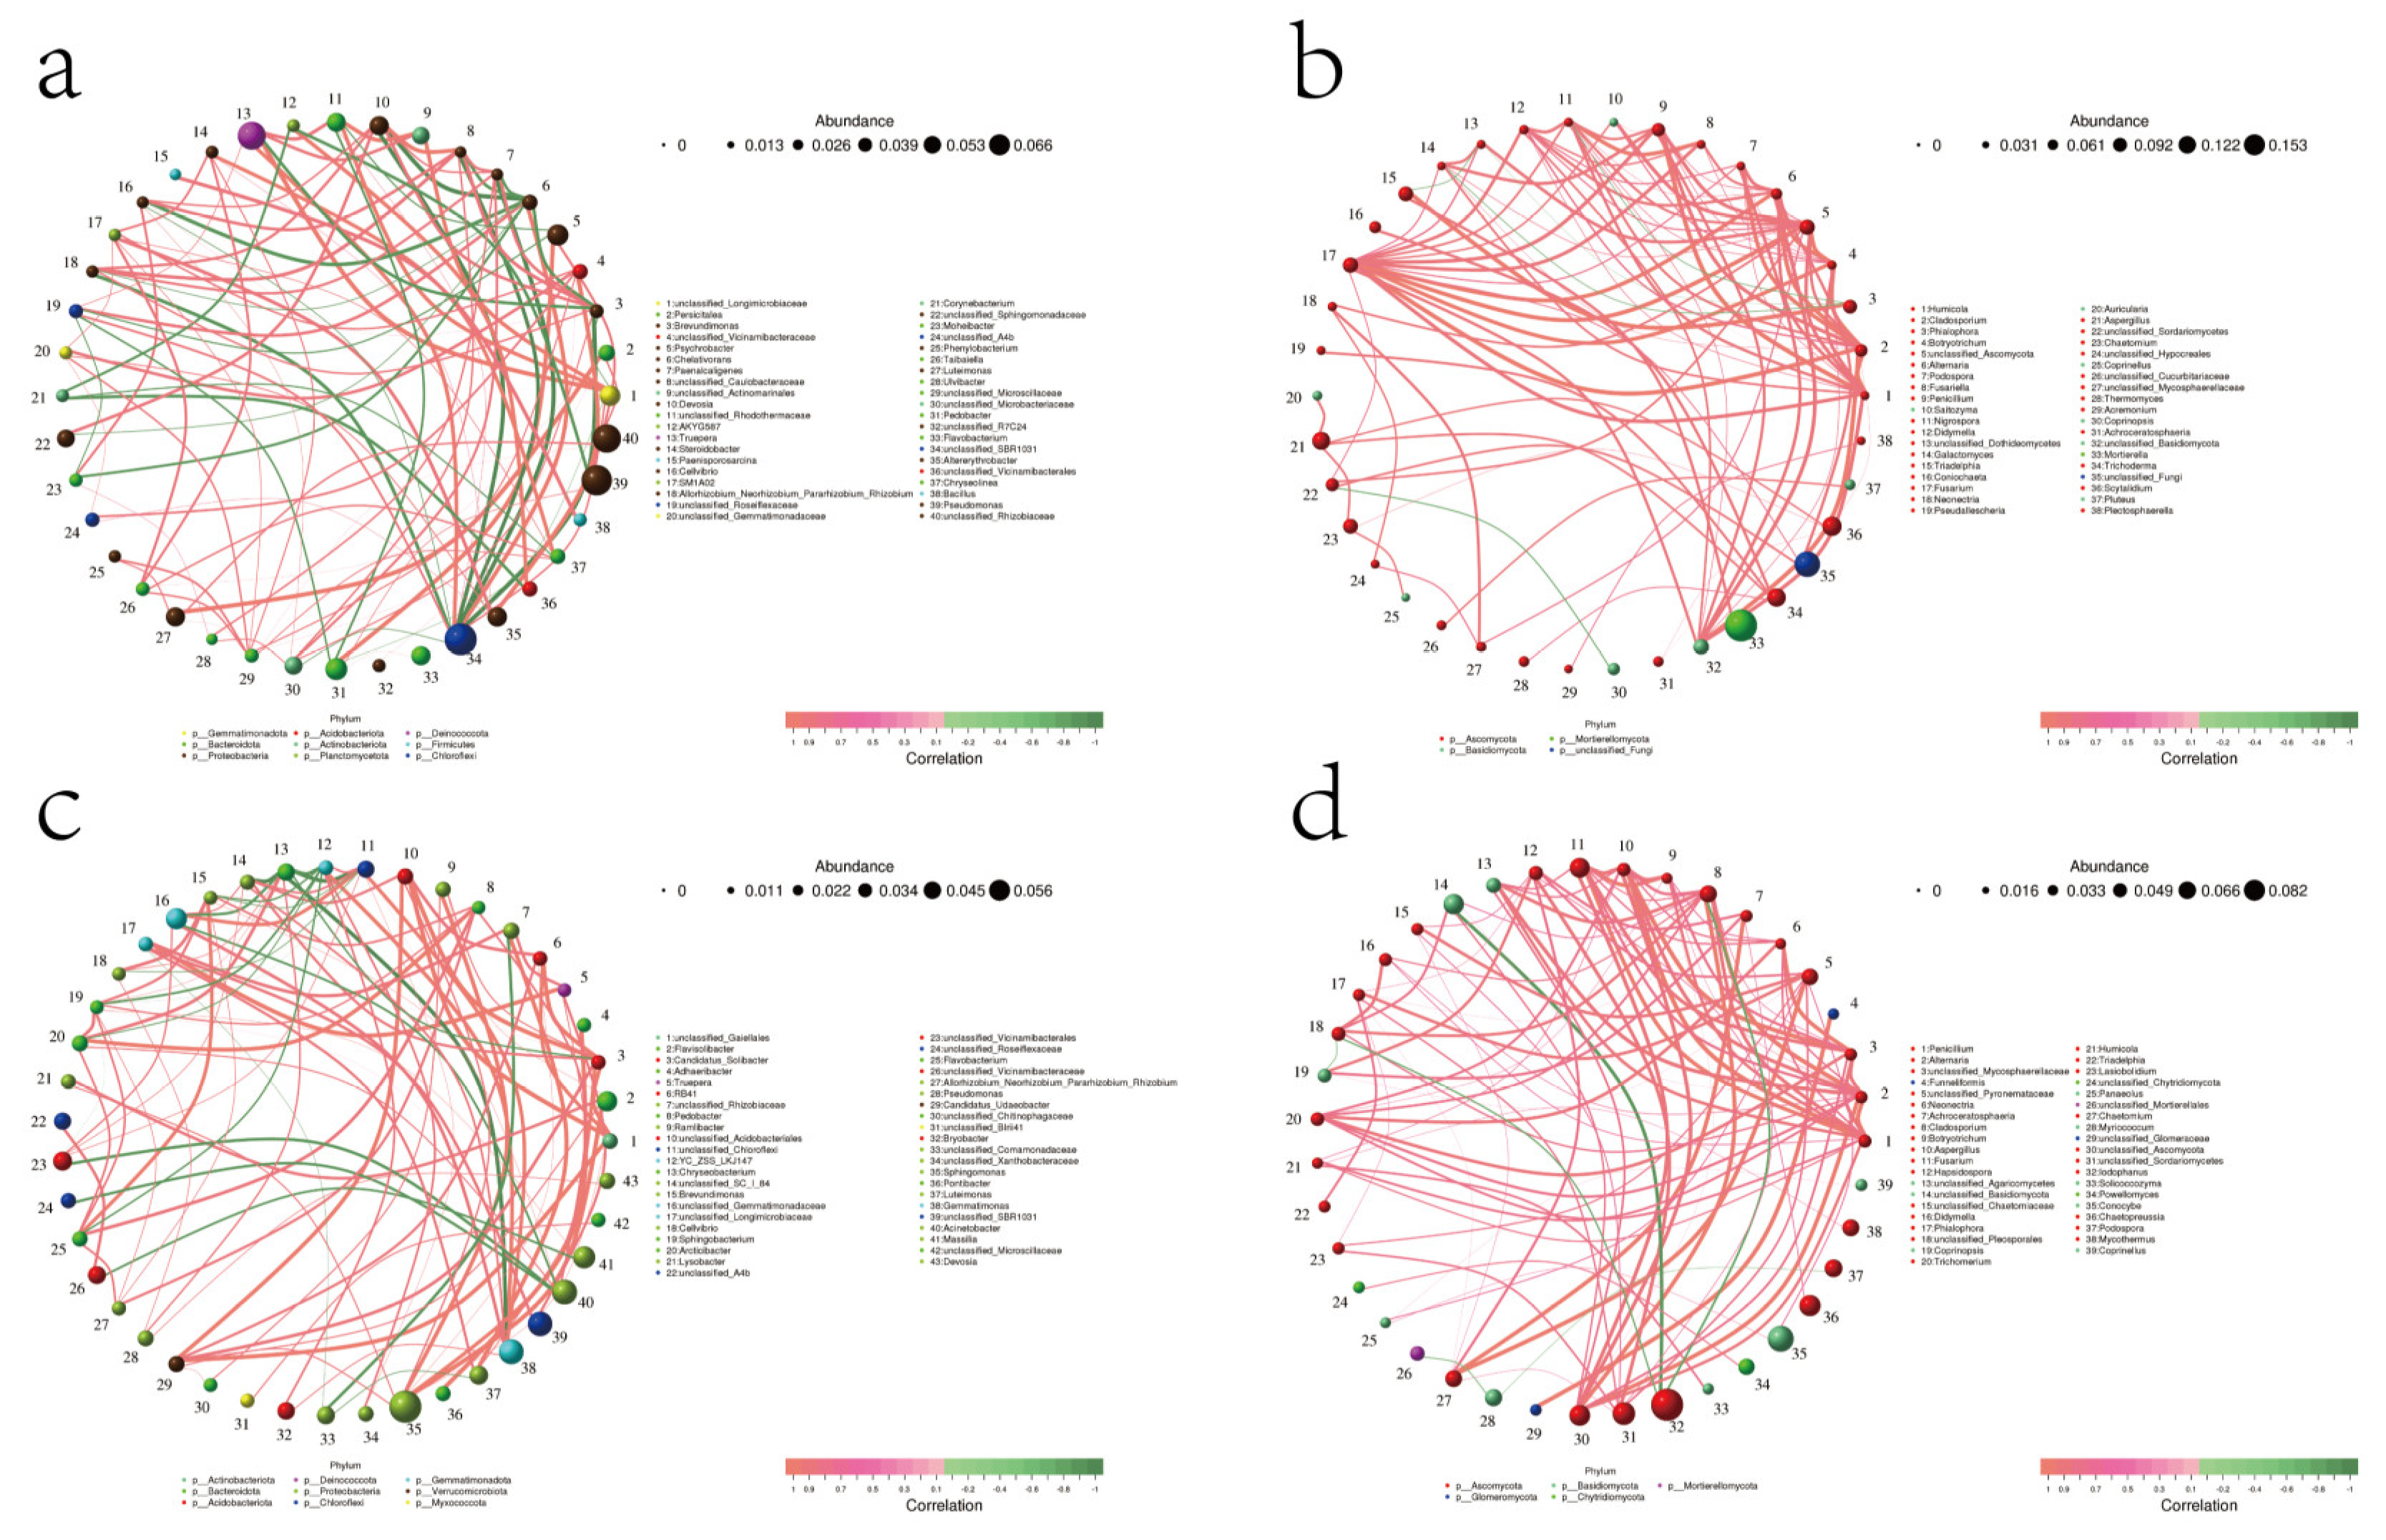
3.7.7. Microbial Interaction Network Diagrams

Co-occurrence network analysis is a valuable approach for examining the interconnections among microorganisms within samples and identifying correlations between them. This study investigates the construction of symbiotic networks by analyzing the top 40 and 38 most abundant bacterial and fungal genera, respectively, during the composting process, and the top 43 and 39 genera during plant growth. In the co-occurrence network, red edges indicate positive correlations, while green edges indicate negative correlations, with thicker edges representing stronger correlations. From Figure 8, The majority of bacterial and fungal genera in composting exhibited positive correlations. Within the bacterial community, Chelativorans was positively correlated with Brevundimonas, Paenalcaligenes, unclassified-Caulobacteraceae, Devosia, and Celivibrio, whereas Moheibacter exhibited significant negative correlations. Unclassified-SBR1031 was significantly negatively correlated with Brevundimonas, Paenalcaligenes, unclassified-Caulobacteraceae, AKYG587, Allorhizobium- Neorhizobiun-Pararhizobium, and Rhizobium. Corynebacterium displayed significant negative correlations with Brevundimonas, Chelativorans, and AKYG587. During the plant growth phase, Chryseobacterium exhibited significant negative correlations with YC- ZSS-LK147, unclassified-SC-l-84, and Gemmatiomonas. Acinetobacter was negatively correlated with unclassified-Gemmatiomonas, unclassified-Vicinamibacterales, and unclassified-Roseiflexaceae, while unclassified-Rhizobiaceae showed a significant negative correlation with unclassified-Comamonadaceae. Additionally, the fungal genus Iodophanus was significantly negatively correlated with unclassified-Basidiomycota during plant growth. Network analysis showed that fungal fertilizer increased the correlation and complexity among members of bacterial and fungal communities. Furthermore, the application of fungal fertilizer altered the composition of the bacterial community while contributing to greater stability within the fungal community.

3.8. Relationship Between Microbial Bacterial and Fungal Communities and Soil Environmental Factors

During the composting process (Figure 9a), Chloroflexi, Firmicutes, and Actinobacteriota were positively correlated with pH, TN, TP, and TK. Proteobacteria exhibited a positive correlation with TN but a negative correlation with pH, TP, and TK. Acidobacteriota was positively correlated with TN and pH, while negatively correlated with TP and TK. Bacteroidota showed a positive correlation with TK and a negative with pH, TP, and TN. Bacteroidota showed a positive correlation with TK and a negative correlation with pH, TP, and TN. Among fungal taxa (Figure 9b), Mortierellomycota was negatively correlated with pH, TN, TP, and TK, while Ascomycota was positively correlated with TK, TP, and pH but negatively correlated with TN. Basidiomycota, unclassified-fungi, and Chytridiomycota were all positively correlated with pH, TN, TP, and TK.
During plant growth (Figure 9c,d), Proteobacteria, Bacteroidota, and Firmicutes were positively correlated with TN, TP, and TK while negatively correlated with pH, whereas Actinobacteriota showed the opposite pattern. Chloroflexi was positively correlated with pH, TK, and TP, but negatively correlated with TN. Ascomycota and Mortierellomycota were positively correlated with TN, TP, and TK, and negatively correlated with pH. Basidiomycota was positively correlated with TP, TK, and positively correlated with pH; while unclassified-fungi were positively correlated with pH but negatively correlated with TN, TP, and TK. These findings indicate that TP, TK, and TN were the primary environmental factors influencing the distribution of bacterial community structure. The relative contributions of these factors to variations in soil bacterial communities followed the order: TP > TK > TN > pH.

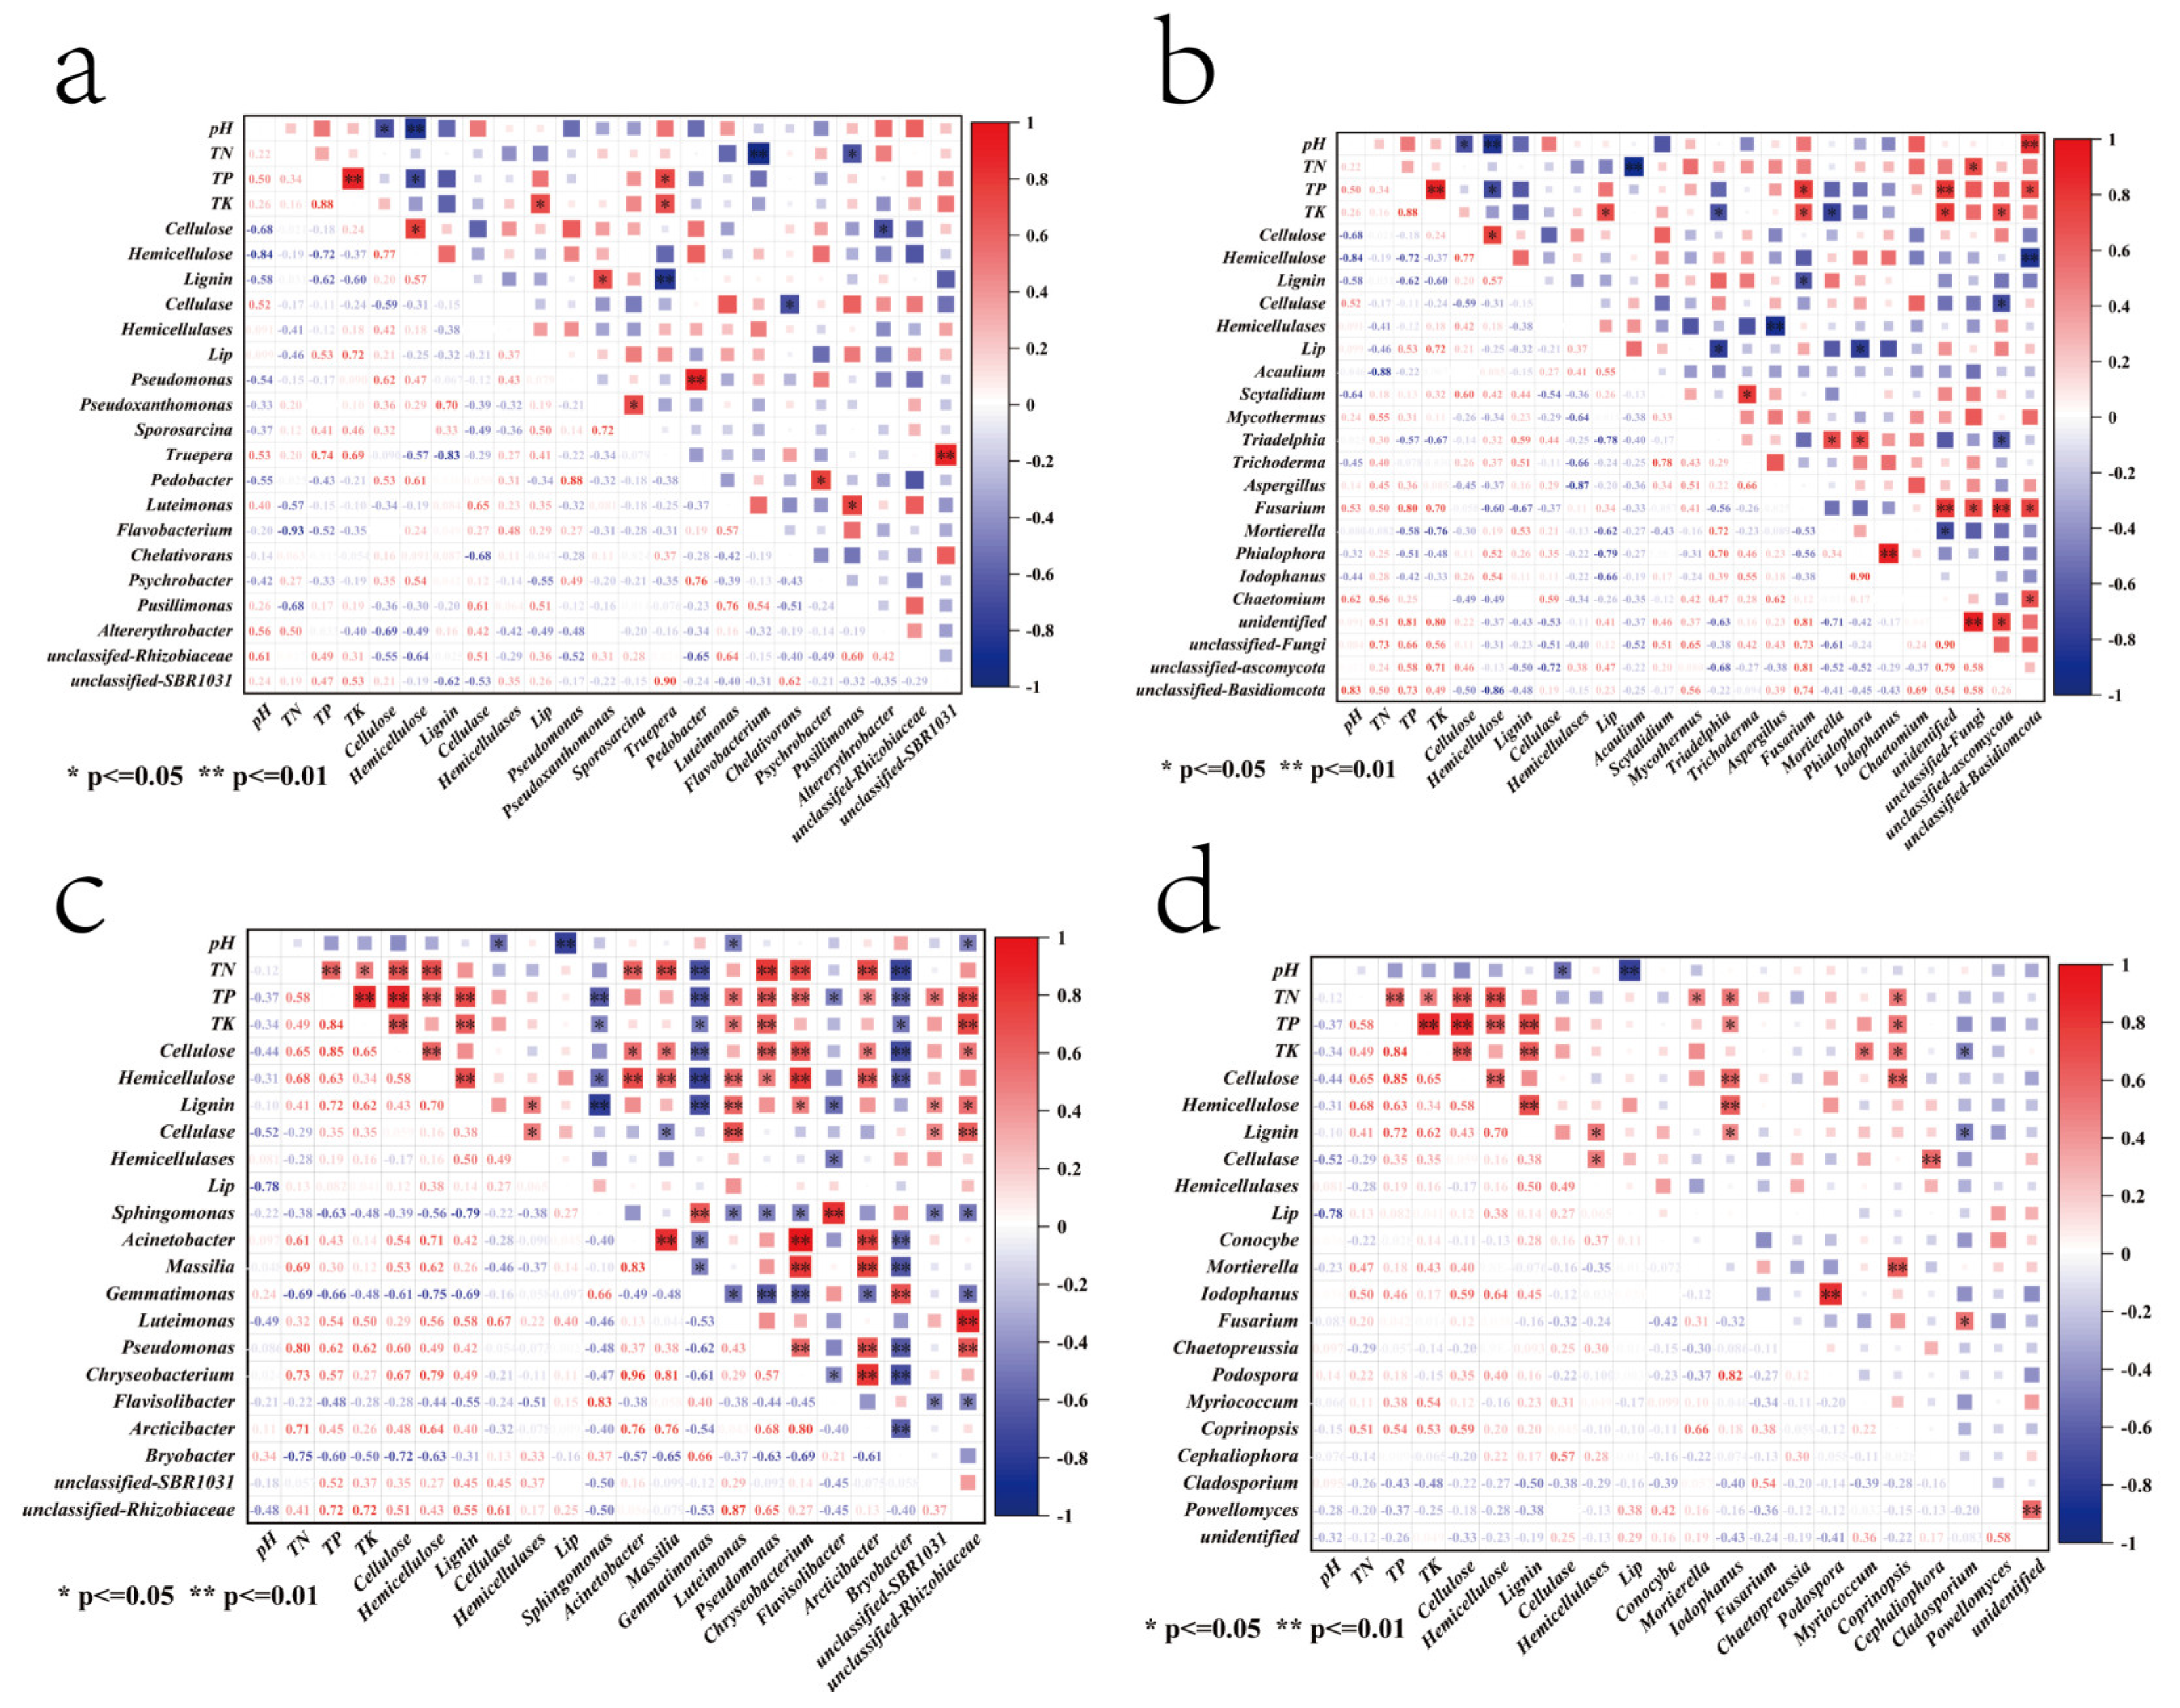
3.9. Relationships Between Genus Levels of Microbial Bacterial and Fungal Communities and Lignocellulose, Lignocellulase, and Environmental Factors

During composting (Figure 10a), pH exhibited a significant negative correlation with cellulose and a highly significant negative correlation with hemicellulose. TP was highly significantly positively correlated with TK significantly negatively correlated with hemicellulose. TK showed a significant positive correlation with ligninase, while cellulose was significantly positively correlated with hemicellulose. Among bacterial taxa, TN exhibited a highly significant negative correlation with Flavobacterium and a significant negative correlation with Pusillimonas. TP and TK were significantly positively correlated with Truepera. Cellulose showed a significant negative correlation with Altererythrobacter, whereas lignin exhibited a highly significant negative correlation with Truepera and a significant negative correlation with Pseudoxanthomonas, which was significantly positively correlated with Sporosarcina. Cellulase was significantly negatively correlated with Chelativorans. Pseudomonas exhibited a significant positive correlation with Pedobacter and Psychrobacter, while Truepera was significantly positively correlated with unclassified-SBR1031. Additionally, Luteimonas exhibited a significant positive correlation with Pusillimonas. Among fungal taxa (Figure 10b), pH showed a highly significant negative correlation with unclassified-Basidiomycota. TN was highly significantly negatively correlated with Acaulium and significantly negatively correlated with unclassified-Fungi. TP exhibited a significant positive correlation with Fusarium and unclassified-Basidiomycota and a highly significant positive correlation with unidentified fungi. Fusarium was highly significantly positively correlated with unidentified fungi, unclassified-Ascomycota, unclassified-Basidiomycota, and unclassified-Fungi. Hemicellulose showed a highly significant negative correlation with unclassified-Basidiomycota. Cellulase was significantly negatively correlated with unclassified-Ascomycota, while hemicellulase exhibited a highly significant negative correlation with Aspergillus. Lignin peroxidase was significantly negatively correlated with Triadelphia and Phialophora. Scytalidium showed a significant negative correlation with Trichoderma, which was significantly positively correlated with Triadelphia, Mortierella, and Phialophora. Mortierella exhibited a significant negative correlation with unidentified fungi, while Phialophora was highly significantly positively correlated with Iodophanus. Chaetomium was significantly positively correlated with unclassified-Basidiomycota. Additionally, unidentified fungi were significantly positively correlated with unclassified-Fungi and unclassified-Ascomycota.
During the growth period (Figure 10c), TN exhibited a highly significant positive correlation with TP, cellulose, hemicellulose, and a significant positive correlation with TK. TP showed a highly significant positive correlation with TK, cellulose, hemicellulose, and lignin, while TK showed a highly significant positive correlation with cellulose and lignin. Cellulose was highly significantly positively correlated with hemicellulose, while hemicellulose exhibited a highly significant positive correlation with lignin. Lignin was significantly positively correlated with hemicellulase, and cellulase showed a significant positive correlation with hemicellulase. pH was significantly negatively correlated with cellulase and highly significantly negatively correlated with lignin peroxidase. Additionally, pH exhibited a significant negative correlation with Luteimonas and unclassified-Rhizobiaceae. TN was significantly negatively correlated with Acinetobacter, Massilia, and Pseudomonas, while Chryseobacterium and Arcticibacter exhibited a highly significant positive correlation with TN and a highly significant negative correlation with Gemmatimonas and Bryobacter. TP was highly significantly positively correlated with Pseudomonas, Chryseobacterium, and unclassified-Rhizobiaceae, as well as significantly positively correlated with Luteimonas, Arcticibacter, and unclassified-SBR1031, while exhibiting a highly significant negative correlation with Sphingomonas, Gemmatimonas, and Bryobacter. TK was significantly positively correlated with Pseudomonas and unclassified-Rhizobiaceae, significantly positively correlated with Luteimonas, and significantly negatively correlated with Sphingomonas, Gemmatimonas, and Bryobacter. Cellulose was highly significantly positively correlated with Pseudomonas and Chryseobacterium and significantly positively correlated with Acinetobacter, Massilia, Arcticibacter, and unclassified-Rhizobiaceae, while highly significantly negatively correlated with Gemmatimonas and Bryobacter. Hemicellulose was significantly positively correlated with Acinetobacter, Massilia, Luteimonas, Chryseobacterium, and Arcticibacter, while Pseudomonas exhibited a highly significant positive correlation and Gemmatimonas and Bryobacter showed a highly significant negative correlation. Lignin was highly significantly positively correlated with Luteimonas and significantly positively correlated with Chryseobacterium, unclassified-SBR1031, and unclassified-Rhizobiaceae. Gemmatimonas, Sphingomonas, and Flavisolibacter were also highly significantly positively correlated with lignin. Cellulase exhibited a highly significant positive correlation with Luteimonas and unclassified-Rhizobiaceae, while significantly positively correlated with unclassified-SBR1031 and significantly negatively correlated with Flavisolibacter. Hemicellulase was significantly positively correlated with Flavisolibacter but significantly negatively correlated with Sphingomonas. Sphingomonas showed a highly significant positive correlation with Gemmatimonas and Flavisolibacter, while significantly positively correlated with Luteimonas, Pseudomonas, Chryseobacterium, unclassified-SBR1031, and unclassified-Rhizobiaceae. Acinetobacter exhibited a highly significant positive correlation with Massilia, Chryseobacterium, and Arcticibacter while showing a highly significant negative correlation with Bryobacter and a significant negative correlation with Gemmatimonas. Massilia was highly significantly positively correlated with Chryseobacterium and Arcticibacter and highly significantly negatively correlated with Bryobacter and Gemmatimonas. It also showed a highly significant negative correlation with Pseudomonas, Chryseobacterium, Luteimonas, Arcticibacter, and unclassified-SBR1031. Luteimonas was highly significantly positively correlated with unclassified-Rhizobiaceae. Pseudomonas exhibited a highly significant positive correlation with Chryseobacterium, Arcticibacter, and unclassified-Rhizobiaceae, while Chryseobacterium showed a highly significant positive correlation with Arcticibacter and a highly significant negative correlation with Bryobacter. Flavisolibacter was significantly negatively correlated with unclassified-SBR1031 and unclassified-Rhizobiaceae, while Arcticibacter was significantly negatively correlated with Bryobacter. For fungal communities (Figure 10d), TN was significantly positively correlated with Mortierella, Iodophanus, and Coprinopsis. TP was significantly positively correlated with Iodophanus and Coprinopsis. TK exhibited a significant positive correlation with Myriococcum and Coprinopsis but a significant negative correlation with Cladosporium. Cellulose showed a highly significant positive correlation with Iodophanus and Coprinopsis, while hemicellulose was highly significantly positively correlated with Iodophanus. Lignin exhibited a significant negative correlation with Iodophanus and Cladosporium. Cellulase was highly significantly positively correlated with Cephaliophora, while Mortierella exhibited a highly significant positive correlation with Cephaliophora. Iodophanus showed a highly significant positive correlation with Podospora. Fusarium was significantly positively correlated with Cladosporium. Powellomyces exhibited a highly significant positive correlation with unidentified fungi.

4. Discussion

4.1. Effect of Composting of Different Proportions of Mycorrhizal Residues to the Field on Soil Parameters

The judicious application of compost has been shown to enhance soil physicochemical properties, enriching nutrient content and fostering a conducive environment for crop growth and development [33]. The co-fermentation of Auricularia heimuer residue and CM extends the duration of the high-temperature phase, while the presence of Auricularia heimuer residue modifies the internal compost structure, maintaining sufficient porosity to ensure adequate oxygen supply, thereby promoting organic matter decomposition and heat release [34]. The optimal temperature range for this high-temperature decomposition process is reported as 52~60 °C [35,36], with heap turning identified as an effective method for regulating temperature and enhancing the oxygen content in Auricularia heimuer residue and CM compost [37]. The pH variations during composting are influenced by multiple factors, including organic matter and microbial nitrification reactions, which can lower pH [38,39], as well as ammonia production and accumulation, which can increase pH [40]. The application of Auricularia heimuer residue and CM introduced substantial organic matter into the soil, enhancing microbial and enzymatic activity related to nutrient cycling, thus increasing soil nutrient content [41]. Additionally, research indicates that Auricularia heimuer residue and CM incorporation can lower soil pH, contributing to the mitigation of soil salinization [42]. Furthermore, Auricularia heimuer residue and CM have been shown to alleviate soil compaction and collapse, primarily due to their humus content, which improves soil pore structure, reduces soil bulk density, and enhances overall soil structure [43]. Among the treatments, B3 exhibited the greatest increase in TN, TP, and TK concentrations, followed by B2 and B1. The observed increase in soil nutrient content has been directly linked to higher crop yields [44,45], consistent with the findings of Chen et al. [46]. This study is a pot experiment, and further field trials and long-term monitoring are needed to verify the long-term effects of compost on soil nutrients, microbial ecology and crop yield, and to provide theoretical support for large-scale dissemination.

4.2. The Impact of Varying Proportions of Composting Fungus Bran on the Composition and Diversity of Microbial Communities

The incorporation of varying proportions of Auricularia heimuer residue and CM into the soil has been shown to promote the enrichment of specific bacterial and fungal taxa, thereby modifying the composition of the microbial community. The analysis of soil microbial taxa at the phylum level provides insight into the ecological consistency of microbial communities [47]. In this study, the predominant bacterial taxa phyla identified during composting with Auricularia heimuer residue and CM included Proteobacteria, Bacteroidota, Chloroflexi, Firmicutes, and Actinobacteria while the dominant fungal phyla were Ascomycota, Mortierellomycota, Basidiomycota, unclassified fungi, and Chytridiomycota. In the rhizosphere soil of maize, the prevalent bacterial phyla included Proteobacteria, Bacteroidota, Actinobacteria, Chloroflexi, and Firmicutes, whereas the dominant fungal phyla were Ascomycota, Basidiomycota, Mortierellomycota, unclassified fungi, and Chytridiomycota. The application of compost derived from Auricularia heimuer residue and CM resulted in a significant increase in the relative abundance of Actinobacteriota and Chloroflexi, along with a reduction in Proteobacteria and Bacteroidota. Similarly, compost application led to a decrease in the relative abundance of Ascomycota and Mortierellomycota, while increasing the relative abundance of Basidiomycota and Chytridiomycota.
Bacteria play a major role in the early stages of organic matter degradation, whereas fungi are more dominant in the later stages of degradation. In this study, Proteobacteria played an important role in the degradation of cellulose and lignin. The high lignocellulosic content of Auricularia heimuer residue facilitated the breakdown of refractory organic matter, thereby enhancing soil nutrient availability. Among treatments, Proteobacteria abundance was highest in A3 during composting and in B2 during plant growth. Certain members of the phylum Chloromyces are facultative anaerobes capable of cellulose degradation [48]. Actinomycetes and Bacteroidetes are involved in the final stages of fermentation, breaking down cellulose, lignin, and polysaccharides into smaller molecules. These bacteria specialize in polymeric compound degradation and play a key role in organic matter decomposition. Actinomyces dominate lignocellulose degradation during the high-temperature phase of composting, determining the rate and extent of cellulose decomposition. Their high cellulase activity contributes to the natural nitrogen cycle, accelerating soil nutrient cycling and promoting plant growth. Additionally, some Actinomycetes possess symbiotic nitrogen-fixation and phosphorus-solubilization abilities [49]. During composting, Actinomycetes were most abundant in A2, while during plant growth, their relative abundance was highest in CK. Bacteroidetes, being adapted to nutrient-rich environments, showed an increasing abundance trend [50]. Ascomycetes dominate the middle and late stages of composting, producing cellulose- and hemicellulose-degrading enzymes that facilitate the decomposition of organic matter in Auricularia heimuer residue and CM compost [51]. Their increased relative abundance during plant growth is attributed to a soil pH favorable for saprophytic fungi, which correlates with enhanced organic matter content, improved soil fertility, and increased lignocellulose degradation capacity. The highest Ascomycota abundance was observed in A2 and B2 treatments [52]. Basidiomycetes contribute to the biodegradation of lignocellulose and the formation of humic substances, playing a crucial role in soil organic matter transformation [53]. Their relative abundance was highest in A1 and B2 treatments, indicating their active role in soil stabilization and nutrient cycling.
The dominant bacterial genera in Auricularia heimuer residue and CM compost were Pseudomonas, unclassified-SBR1031, Pseudoxanthomonas, Truepera, Sporosarcina, and Pedobacter. The dominant fungal genera in composting included Morterella, Acaulium, unclassified-fungi, unidentified, Scytalidium, and Mycothermus. In maize rhizosphere soil during plant growth, the dominant bacterial genera were Sphingomonas, Acinetobacter, Gemmatimonas, Massila, and unclassified-SBR1031, while the dominant fungal genera included unidentified fungi, unclassified fungi, Iodophanus, Conocybe, and Mortierella. Among these, Pseudomonas has cellulase-producing activity, which promotes the degradation of cellulose. A high abundance of Pseudomonas was detected in the early stage of composting, but its relative abundance gradually declined after the high temperature phase. Studies have shown that many beneficial Pseudomonas species inhibit the growth and reproduction of pathogenic bacteria by secreting antimicrobial metabolites, including cellulases [54,55]. Additionally, Pseudoxanthomonas has been identified as a cellulose-degrading bacterium, playing a crucial role in organic matter decomposition during composting [56]. During plant growth, the relative abundance of Sphingomonas and Gemmatimonas increased compared to the CK treatment. Sphingomonas is among the most effective microorganisms for degrading toxic soil contaminants, promoting nutrient uptake, and suppressing multiple pathogens. Previous studies have reported several strains of Sphingomonas with nitrogen-fixing properties, contributing to soil nitrogen balance [57]. Compared with CK, the relative abundance of Cladosporium and Fusarium decreased, suggesting a higher proportion of beneficial microorganisms that favor crop growth, while the abundance of potentially pathogenic bacteria declined. These results indicate that the application of Auricularia heimuer residue and CM altered the microbial community structure of maize rhizosphere soil, leading to an increase in beneficial microorganisms and a decrease in pathogenic bacteria, thereby enhancing soil quality and promoting crop growth. Comments have been added to the manuscript, adding that fungi (e.g., Aspergillus) are responsible for initial lignin depolymerization and bacteria (e.g., Pseudomonas putida) further mineralize small molecular aromatic compounds. For example, vanillin produced by fungi is metabolized by bacteria via the beta-ketoadipic acid pathway. Despite the identification of dominant fungal genera, a substantial proportion of unclassified fungi remained in soils amended with Auricularia heimuer residue and CM. Further research is needed to elucidate the ecological roles and functional contributions of these unclassified fungi in maize soils under long-term Auricularia heimuer residue and CM application.
Soil microbial communities play a pivotal role in promoting crop growth and maintaining soil health [58]. The Chao1 and Shannon diversity indices of soil bacteria communities increased under different fertilization treatments, with the B3 treatment exhibiting the highest values. During composting, the bacterial Chao1 and Shannon indices were highest in A3, while the fungal Chao1 and Shannon indices were highest in A1. Additionally, the bacterial diversity indices in A3 were significantly higher than those in CK, and the fungal diversity indices in A1 were also significantly higher than in CK. The addition of Auricularia heimuer residue and CM led to an increase in bacterial Chao1 and Shannon indices, whereas fungal diversity indices decreased following Auricularia heimuer residue and CM applications. It is generally accepted that higher bacterial diversity correlated with improved soil ecosystem stability and health [59,60]. This study found that compared to unfertilized soil, the incorporation of Auricularia heimuer residue and CM significantly increased soil bacterial diversity, with B3 treatment producing the most pronounced effects on both bacterial and fungal richness and diversity. However, bacterial communities exhibited more significant compositional shifts than fungal communities, suggesting that bacteria are more sensitive to compost amendments during plant growth. The B3 treatment not only enhanced bacterial diversity but also contributed to greater fungal diversity, indicating that compost formulations with higher Auricularia heimuer residue content promote microbial diversity in soil. The observed increase in fungal diversity is particularly important, as fungi facilitate the decomposition of macromolecular organic matter, enhance nutrient cycling, and contribute to the prevention of soil-borne pests and diseases. Compost with a high proportion of Auricularia heimuer residue provides an abundant nutrient supply for soil microorganisms, supporting microbial growth and reproduction [61]. Different composting treatments improved both alpha and beta diversity of soil bacterial communities, with B3 treatment producing the most significant changes in both bacterial and fungal diversity. These findings suggest that high-Auricularia heimuer residue compost formulations can effectively enrich soil microbial diversity, enhancing soil health and fertility.

4.3. Relationship Between Microbial Communities and Soil Parameters

Experimental studies have shown that different compost treatments influence soil parameters with microbial community dynamics in the compost pile significantly impacting soil properties. For example, Jin et al. [62] reported that TN, TP, TK, and pH were the primary drivers of microbial community structure, findings that align with this study. In this study, RDA identified TN, TP, and TK as the key factors shaping microbial community differences among treatments, with TP exhibiting the strongest correlation. Proteobacteria and Bacteroidota were positively correlated with soil factors such as pH, TN, TP, and TK, indicating that these dominant phyla play a crucial role in organic matter degradation and thrive in nutrient rich soils [63]. However, their abundance significantly decreased following Auricularia heimuer residue and CM application, suggesting that appropriate Auricularia heimuer residue and CM amendments can reduce the relative abundance of these phyla. In contrast, Actinobacteriota exhibited an opposite trend, likely due to variations in Auricularia heimuer residue and CM application rates, which influenced soil nutrient availability and consequently microbial growth, reproduction, and community structure [64]. Among fungi, Ascomycota had the highest relative abundance, primarily consisting of saprophytic species that preferentially utilize readily decomposable carbon compounds. Ascomycota was positively correlated with TN, TP, and TK, but negatively correlated with pH. While soil pH influences Ascomycota growth, most fungi do not require a specific pH range to establish and proliferate. Thus, the pH reduction induced by Auricularia heimuer residue and CM treatments may partially explain the decline in Ascomycota abundance across treatments [65,66]. Ascomycota and Mortierellomycota showed a significant positive correlation with most soil environmental factors except pH, and their increased relative abundance further suggested improved soil fertility [67]. Additionally, TN, TP, and TK were positively correlated with Pseudomonas, a genus that plays a critical role in nitrogen cycling and agricultural productivity. Sphingomonas, known for its ability to degrade recalcitrant pollutants, exhibited an increased relative abundance, indicating enhanced soil pollutant degradation capacity [68]. Conversely, TP and TK were negatively correlated with Cladosporium, leading to a decrease in Cladosporium abundance, which may be associated with a reduction in soilborne plant diseases. Soil pH decline was correlated with an increase in bacterial abundance and a decrease in fungal abundance, as lower pH conditions are generally more favorable for bacterial proliferation. Furthermore, TN significantly influenced both bacterial and fungal community composition, highlighting their key role in nitrogen transformation during composting and reinforcing the concept that microbial activity drives the composting process [69]. Across all treatments, correlations between environmental factors and microbial community dynamics suggest that changes in soil properties due to Auricularia heimuer residue and CM amendments directly impact microbial composition, while microbial activity, in turn, modifies soil environmental conditions. This reflects a complex, bidirectional interaction between soil parameters and microbial communities. Ultimately, Auricularia heimuer residue and CM composting altered soil physicochemical properties, leading to shifts in microbial diversity and community structure, thereby enhancing soil fertility and improving overall soil health.
The compost of fungus bran and chicken manure can be widely applied to all kinds of soil and crops, such as field crops (wheat, corn, rice), vegetables (leafy vegetables, fruit vegetables), fruit trees (citrus, apples, grapes), cash crops (tea, tobacco), etc. However, it is necessary to adjust the dosage and method according to the soil properties and crop needs, maturity and heavy metal control are the key, and the combination of biological bacteria or amendments can further improve the effect. Composting efficiency and risks vary by climate: In cold seasons/regions (winter/high altitude), low microbial activity slows decomposition (2–3× longer), increasing risks of pathogens or insect eggs if applied prematurely. Hot climates (summer/tropics) face rapid moisture loss and nutrient leaching from heavy rain. Arid zones (e.g., NW China) require extra irrigation, while uncovered compost risks mineralization. In rainy areas (e.g., S China), waterlogging causes odors and nutrient loss, necessitating small-batch application.
Our research highlights the potential of integrating edible fungi and livestock manure into organic fertilizers to improve soil health and promote sustainable agriculture while revealing functional networks of black soil microbial communities that provide a scientific basis for the conservation and sustainable management of black soil in the context of global change.

5. Conclusions

Recycling edible mushroom waste into agriculture reduces non-point source pollution and enhances soil productivity, supporting sustainable farming. However, using Auricularia heimuer residue and chicken manure (CM) separately has limitations. Co-composting optimizes decomposition, enriches soil fertility, and enhances microbial diversity.
During composting, N, P, and K levels increased, while lignocellulose content decreased. Among treatments, A3 performed best. Compared to CK, B3 treatment increased TN by 77.91%, TP by 577.2%, and TK by 19.28%. Lignin, cellulose, and hemicellulose contents rose by 50.6%, 340.33%, and 150.86%, respectively. Enzymatic activities of lignin peroxidase, cellulase, and hemicellulase improved by 62.9%, 62.9%, and 37.39%. Microbial diversity increased, with beneficial bacteria like Sphingomonas (1.07–3.05%) and Gemmatimonas (0.12–1.93%) thriving, while pathogenic fungi like Cladosporium (2.31–0.50%) and Fusarium (3.87–1.10%) declined. Soil improvements enhanced maize growth, with dry matter weight up 108%, single root weight 145%, corn weight 151%, and root number 64%.
The optimal compost ratio was Auricularia heimuer residue: CM = 8:2, with the best bacterial fertilizer-to-soil ratio at 4:6. This study highlights the potential of integrating edible fungi and livestock waste into organic fertilizers, improving soil health and advancing sustainable agriculture. Integrating the strategy of fungus bran return into the circular agriculture method can realize the closed-loop cycle of “agricultural waste—soil improvement—crop production”, reduce the dependence on external resources, and improve the sustainability of the system.
In the future, macro-genomics and functional pathway analysis can be used to prevent and control environmental risks, integrate and validate multi-omics, conduct field trials, and predict models. The use of macroeconomics and functional pathway analysis can be used to optimize the composting process and regulate composting conditions based on functional genes (e.g., adjusting aeration to promote nitrification); to conduct precision agriculture and customize functional composts to address soil deficiencies (e.g., low phosphorus); and to assess ecological risks and provide a basis for the control and management of ARGs and heavy metal pollution. Through the above strategies, macroeconomics can systematically analyze the microbial functional mechanism of mycorrhizal chaff-chicken manure composting to return to the field and provide a scientific basis for agricultural waste resource utilization and soil improvement.

Supplementary Materials

The following supporting information can be downloaded at: https://www.mdpi.com/article/10.3390/agriculture15080879/s1, Figure S1: OTU characteristics of bacteria during compost fermentation; Figure S2: OTU characteristics of fungi during compost fermentation; Figure S3: OTU characteristics of bacteria during growth; Figure S4: OTU characteristics of fungi during growth period.

Author Contributions

Conceptualization, B.Z. and Y.L.; methodology, B.Z. and X.L.; software, Y.W. and J.W.; validation, K.Q. and B.Z.; formal analysis, K.Q. and X.L.; investigation, Y.F. and J.A.; resources, Y.Z. and J.W.; data curation, Y.W. and J.W.; writing—original draft preparation, Y.W. and J.W.; writing—review and editing, Y.W. and K.Q.; visualization, X.L.; supervision, B.Z.; project administration, H.Y. and B.Z.; funding acquisition, H.Y. All authors have read and agreed to the published version of the manuscript.

Funding

This study is funded by the Jilin Province Science and Technology Development Plan Project (No. 20230202114NC) and Changchun Science and Technology Talent Project (23JQ09). The pilot selection projects in higher education institutions (No. 24GXYSZZ15).

Institutional Review Board Statement

Not applicable.

Data Availability Statement

Data are available on request due to restrictions, e.g., privacy or ethical. The data presented in this study are available upon request from the corresponding author.

Conflicts of Interest

The authors declare no conflicts of interest.

References

  1. Van Tam, N.; Wang, C.H. Use of Spent Mushroom Substrate and Manure Compost for Honeydew Melon Seedlings. J. Plant Growth Regul. 2015, 34, 417–424. [Google Scholar] [CrossRef]
  2. Okuda, Y. Sustainability perspectives for future continuity of mushroom production: The bright and dark sides. Front. Sustain. Food Syst. 2022, 6, 1026508. [Google Scholar] [CrossRef]
  3. Patel, S.S.; Bains, A.; Sridhar, K. Approaches and challenges for a sustainable low-carbon mushroom industry. Renew. Sustain. Energy Rev. 2025, 212, 115338. [Google Scholar] [CrossRef]
  4. He, T.; Zhang, W.; Zhang, H.; Sheng, J. Estimation of Manure Emissions Issued from Different Chinese Livestock Species: Potential of Future Production. Agriculture 2023, 13, 2143. [Google Scholar] [CrossRef]
  5. Zeng, Q.; Shi, G.Y.; Su, L. Organic Fertilizer Production with Fermentation and Composting of Chicken Manure Promoted by Flammulina Chaff. Chin. Agric. Sci. Bull. 2022, 38, 44–50. [Google Scholar]
  6. Dong, Q.; Cheng, H.Y.; Zhang, J.G.; Oh Kokyo Meng, L.J.; Wang, T.; Wang, Q.; Tian, Y. Effect of fungus chaff on soil microbe population and enzyme activity of three crop soils. Chin. J. Eco-Agric. 2016, 24, 1655–1662. [Google Scholar] [CrossRef]
  7. Ma, Y.; Liu, L.; Zhou, X.; Tian, T.; Xu, S.; Li, D.; Li, C.; Li, Y. Optimizing Straw-Rotting Cultivation for Sustainable Edible Mushroom Production: Composting Spent Mushroom Substrate with Straw Additions. J. Fungi 2023, 9, 925. [Google Scholar] [CrossRef] [PubMed]
  8. Wang, S.; Du, X.; Yin, R.; Sun, H.; Song, B.; Han, Q.; Wang, J.; Huang, Y. Performance of co-composting Pholiota nameko spent mushroom substrate and pig manure at different proportions: Chemical properties and humification process. J. Environ. Manag. 2024, 372, 123325. [Google Scholar] [CrossRef] [PubMed]
  9. Mahato, D.; Khamari, B.; Sahoo, J. Valorization of spent Oyster mushroom substrate with Trichoderma asperellum for suppression of sesame root rot in vitro. Waste Biomass Valorization 2024, 15, 755–769. [Google Scholar] [CrossRef]
  10. Lu, L.; Li, W.; Wu, X. Status of comprehensive utilization of Spent mushroom substrate. Edible Fungi 2022, 44, 1000–8357. [Google Scholar]
  11. Zhang, X.; Wang, Y.; Li, H. Response of soil microbial network complexity to mushroom residue amendment in black soils of Northeast China. Appl. Soil Ecol. 2023, 185, 104812. [Google Scholar] [CrossRef]
  12. Chen, X.; Zhang, Y.; Liu, H. Mushroom residue amendment reduces N2O emissions by altering nitrifier and denitrifier communities in a maize field. Sci. Total Environ. 2023, 856, 159102. [Google Scholar] [CrossRef]
  13. Liu, J.; Chen, Z.; Sun, K. Co-application of mushroom residue and biochar improves nitrogen retention and microbial network stability in degraded soils of Northeast China. Agric. Ecosyst. Environ. 2022, 324, 107715. [Google Scholar] [CrossRef]
  14. Bernal, M.P. Composting of animal manures and chemical criteria for compost maturity assessment. Bioresour. Technol. 2009, 100, 5444–5453. [Google Scholar] [CrossRef]
  15. Wang, X. Reducing heavy metal bioavailability in chicken manure compost by adding biochar and spent mushroom substrate. Environ. Pollut. 2021, 268, 115845. [Google Scholar]
  16. Zhang, L. Effects of spent mushroom substrate compost on soil fertility and crop yield. J. Clean. Prod. 2018, 172, 2012–2020. [Google Scholar]
  17. Chen, Y. Composting of spent mushroom substrate and chicken manure: Effects on microbial community and nutrient transformation. Bioresour. Technol. 2022, 297, 122473. [Google Scholar]
  18. Li, R. Effects of different ratios of spent mushroom substrate to chicken manure on compost quality and soil properties. Agric. Ecosyst. Environ. 2019, 279, 1–10. [Google Scholar]
  19. Zhou, H. Spent mushroom substrate compost enhances tomato growth by improving rhizosphere microbiome. Front. Microbiol. 2022, 13, 825394. [Google Scholar]
  20. Yang, F. Integrated use of spent mushroom substrate and chicken manure improves soil fertility and crop yield in a wheat-maize rotation system. Soil Tillage Res. 2022, 199, 104592. [Google Scholar]
  21. Ji, Q.; Wu, Y.; Zhang, D. Effects of the fungi chaff of Pleurotus geesteranus on vegetable and soil quality in greenhouse. J. Hubei Agric. Sci. 2020, 59, 42–48. [Google Scholar] [CrossRef]
  22. Jiang, Q.; Lu, Z.; Ren, C. Analysis and evaluation of fertilizer fermented from spent mushroom substrate of Pleurotus eryngii Pholiotanameko. J. Hubei Agric. Sci. 2020, 59, 64–67. [Google Scholar] [CrossRef]
  23. Wang, M. Effect of edible fungus residue on rice yield increase. China Rice 2006, 2, 44–45. [Google Scholar]
  24. Chen, Z.; Zhang, X.; Yan, F. Effects of fungus bran bio-organic fertilizer on yield and quality of potato. Vegetables 2020, 11, 20–23. [Google Scholar]
  25. Cely-Vargas L, Y.; Zhang, W.; Cheema A, I. Effects of Compost-based Amendments from Sewage Sludge and Food Waste on Sandy Soil and Rosette Bok Choy’s Growth. Water Air Soil Pollut. 2024, 235, 1–14. [Google Scholar] [CrossRef]
  26. Lin, Y. A soil sampling method based on representativeness gradeof sampling points. Acta Pedol. Sin. 2011, 48, 938–946. [Google Scholar]
  27. Zech, W.; Guggenberger, G.; Haumaier, L. Lignin biogeochemistry of forest humus layers. Sci. Total Environ. 1994, 152, 191–198. [Google Scholar]
  28. Scott, R.W. Colorimetric determination of hexuronic acids in plant materials. Anal. Biochem. 1979, 99, 320–326. [Google Scholar] [CrossRef]
  29. Sun, R.; Lawther, J.; Banks, W.B. Fractional characterization of wheat straw lignin and cellulose. J. Agric. Food Chem. 1996, 44, 3724–3729. [Google Scholar]
  30. Yadav, M.; Singh, S.K.; Yadava, S. Purification, characterisation and coal depolymerisation activity of lignin peroxidase from Lenzitus betulina MTCC-1183. Appl. Biochem. Microbiol. 2012, 48, 583–589. [Google Scholar] [CrossRef]
  31. Ghose, T.K. Measurement of cellulase activities. Pure Appl. Chem. 1987, 59, 257–268. [Google Scholar] [CrossRef]
  32. Six, J.; Elliott, E.; Paustian, K. Response of soil microbial biomass, urease, and xylanase within particle size fractions to long-term soil management. Soil Biol. Biochem. 1999, 31, 1567–1574. [Google Scholar] [CrossRef]
  33. Cui, X.; Zhang, Y.; Gao, J.; Peng, F.; Gao, P. Long-term combined application of manure and chemical fertilizer sustained higher nutrient status and rhizospheric bacterial diversity in reddish paddy soil of Central South China. Sci. Rep. 2018, 8, 16554. [Google Scholar] [CrossRef] [PubMed]
  34. Kulcu, R.; Yaldiz, O. Composting of goat manure and wheat straw using pine cones as a bulking agent. Bioresour. Technol. 2007, 98, 2700–2704. [Google Scholar] [CrossRef]
  35. Song, Y.; Wang, Y.; Li, R. Effects of common microplastics on aerobic composting of cow manure: Physiochemical characteristics, humification, and microbial community. J. Environ. Chem. Eng. 2022, 10, 108681. [Google Scholar] [CrossRef]
  36. Wang, M.; Wang, X.; Wu, Y.; Wang, X.; Zhao, J.; Liu, Y.; Chen, Z.; Jiang, Z.; Tian, W.; Zhang, J. Effects of thermophiles inoculation on the efficiency and maturity of rice straw composting. Bioresour. Technol. 2022, 354, 127195. [Google Scholar] [CrossRef]
  37. Ge, M.; Zhou, H.; Shen, Y.; Meng, H.; Li, R.; Zhou, J.; Cheng, H.; Zhang, X.; Ding, J.; Wang, J.; et al. Effect of aeration rates on enzymatic activity and bacterial community succession during cattle manure composting. Bioresour. Technol. 2020, 304, 122928. [Google Scholar] [CrossRef]
  38. Sánchez-Monedero, M.A.; Roig, A.; Paredes, C.; Bernal, M.P. Nitrogen transformation during organic waste composting by the Rutgers system and its effects on pH, EC and maturity of the composting mixtures. Bioresour. Technol. 2001, 78, 301–308. [Google Scholar] [CrossRef]
  39. Mao, H.; Zhang, H.; Fu, Q.; Zhong, M.; Li, R.; Zhai, B.; Wang, Z.; Zhou, L. Effects of four additives in pig manure composting on greenhouse gas emission reduction and bacterial community change. Bioresour. Technol. 2019, 292, 121896. [Google Scholar] [CrossRef]
  40. Roca-Pérez, L.; Martínez, C.; Marcilla, P.; Boluda, R. Composting rice straw with sewage sludge and compost effects on the soil-plant system. Chemosphere 2009, 75, 781–787. [Google Scholar] [CrossRef]
  41. Gmach, M.R.; Cherubin, M.R.; Kaiser, K.; Cerri, C.E.P. Processes that influence dissolved organic matter in the soil: A review. Sci. Agric. 2019, 77, e20180164. [Google Scholar] [CrossRef]
  42. Afreh, D.; Zhang, J.; Guan, D.; Liu, K.; Song, Z.; Zheng, C.; Deng, A.; Feng, X.; Zhang, X.; Wu, Y. Long-term fertilization on nitrogen use efficiency and greenhouse gas emissions in a double maize cropping system in subtropical China. Soil Tillage Res. 2018, 180, 259–267. [Google Scholar] [CrossRef]
  43. Amini, S.; Asoodar, M.A. The effect of conservation tillage on crop yield production (The Review). N. Y. Sci. J. 2015, 8, 25–29. [Google Scholar] [CrossRef]
  44. Tesfay, T.; Godifey, T.; Mesfin, R.; Kalayu, G. Evaluation of waste paper for cultivation of oyster mushroom (Pleurotus ostreatus) with some added supplementary materials. AMB Express 2020, 10, 15. [Google Scholar] [CrossRef]
  45. Yang, C.; Du, W.; Zhang, L.; Dong, Z. Effects of sheep manure combined with chemical fertilizers on maize yield and quality and spatial and temporal distribution of soil inorganic nitrogen. Complexity 2021, 2021, 4330666. [Google Scholar] [CrossRef]
  46. Chen, X.; Opoku-Kwanowaa, Y.; Li, J.; Wu, J. Application of organic wastes to primary saline-alkali soil in Northeast China: Effects on soil available nutrients and salt ions. Commun. Soil. Sci. Plant Anal. 2020, 51, 1238–1252. [Google Scholar] [CrossRef]
  47. Guo, J.; Liu, W.; Zhu, C. Bacterial rather than fungal community composition is associated with microbial activities and nutrient-use efficiencies in a paddy soil with short-term organic amendments. Plant Soil 2018, 424, 335–349. [Google Scholar] [CrossRef]
  48. Shang, L.; Wan, L.; Zhou, X.; Li, S.; Li, X. Effects of organic fertilizer on soil nutrient status, enzyme activity, and bacterial community diversity in Leymus chinensis steppe in Inner Mongolia, China. PLoS ONE 2020, 15, e0240559. [Google Scholar] [CrossRef]
  49. Zhang, L.; Guan, J. Im pact of Tourism Disturbance on Vegetation and Soil Microecological Environment of Jiulongshan Park. J. Southwest Univ. (Nat. Sci. Ed.) 2024, 46, 117–126. [Google Scholar] [CrossRef]
  50. Qiao, C.; Penton, C.R.; Xiong, W. Reshaping the rhizosphere microbiome by bio-organic amendment to enhance crop yield in a maize-cabbage rotation system. Appl. Soil. Ecol. 2019, 142, 136–146. [Google Scholar] [CrossRef]
  51. Wang, J.; Lu, T.; Liang, Z. Effects of Microorganisms from Different Sources on the Composting Process of Grape Branches and Pig Manure. J. Agric. Sci. Technol. 2024, 26, 224–233. [Google Scholar] [CrossRef]
  52. Kang, E.; Li, Y.; Zhang, X.; Yan, Z.; Wu, H.; Li, M.; Yan, L.; Zhang, K.; Wang, J.; Kang, X. Soil pH and nutrients shape the vertical distribution of microbial communities in an alpine wetland. Sci. Total Environ. 2021, 774, 145780. [Google Scholar] [CrossRef]
  53. Wang, Q.; Wang, Y.; Ma, Y. Research progress on the evolution of humic acid and the effect of composting process on HA. Appl. Chem. Ind. 2023, 52, 2865–2869. [Google Scholar]
  54. Koechli, C.; Campbell, A.N.; Pepe-Ranney, C.; Buckley, D.H. Aesesing fumgal contributiona to cellulose degradation in soil by using high-through put 487stable isotope probing. Soil. Biol. Biochem. 2019, 130, 150–158. [Google Scholar] [CrossRef]
  55. Lin, P.; Yan, Z.F.; Li, C.T. Luteimonas cellulosilyticus sp. nov., Cellulose-Degrading Bacterium Isolated from Soil in Changguangxi National Wetland Park, China. Curr. Microbiol. 2020, 77, 1341–1347. [Google Scholar] [CrossRef] [PubMed]
  56. Zhao, M.; Zhao, J.; Yuan, J.; Hale, L.; Wen, T.; Huang, Q.; Vivanco, J.M.; Zhou, J.; Kowalchuk, G.A.; Shen, Q. Root exudates drive soil-microbe-nutrient feedbacks in response to plant growth. Plant Cell Environ. 2021, 44, 613–628. [Google Scholar] [CrossRef]
  57. Liu, Z.; Zhou, H.; Xie, W.; Yang, Z.; Lv, Q. Long-term effects of maize straw return and manure on the microbial community in cinnamon soil in Northern China using 16S rRNA sequencing. PLoS ONE 2021, 16, e0249884. [Google Scholar] [CrossRef]
  58. Pan, M.; Gan, X.; Mei, C.; Liang, Y. Structural analysis and transformation of biosilica during lignocellulose fractionation of rice straw. J. Mol. Struct. 2017, 1127, 575–582. [Google Scholar] [CrossRef]
  59. Zhang, X.; Dou, S.; Ndzelu, B.S.; Guan, X.W.; Zhang, B.Y.; Bai, Y. Effects of different corn straw amendments on humus composition and structural characteristics of humic acid in black soil. Commun. Soil. Sci. Plant Anal. 2020, 51, 107–117. [Google Scholar] [CrossRef]
  60. Wang, P. Effects of long-term different straw returning combinations on soil physical and chemical properties and bacterial community. Master’s Thesis, Jilin University, Changchun, China, 2024. [Google Scholar] [CrossRef]
  61. Jin, L.; Lyu, J.; Jin, N.; Xie, J.; Wu, Y.; Zhang, G.; Feng, Z.; Tang, Z.; Liu, Z.; Luo, S. Effects of different vegetable rotations on the rhizosphere bacterial community and tomato growth in a continuous tomato cropping substrate. PLoS ONE 2021, 16, e257432. [Google Scholar] [CrossRef]
  62. Tie, J.; Qiao, Y.; Jin, N.; Gao, X.; Liu, Y.; Lyu, J.; Zhang, G.; Hu, L.; Yu, J. Yield and Rhizosphere Soil Environment of Greenhouse Zucchini in Response to Different Planting and Breeding Waste Composts. Microorganisms 2023, 11, 1026. [Google Scholar] [CrossRef] [PubMed]
  63. Li, K.; Sun, T.; Sun, T. Effects of application of chicken manure on soil microbial community structure diversity of young rapeseed. J. Agric. Environ. Sci. 2019, 39, 2316–2324. [Google Scholar]
  64. Chen, L.; Zhou, W.; Luo, L.; Li, Y.; Chen, Z.; Gu, Y.; Chen, Q.; Deng, O.; Xu, X.; Lan, T.; et al. Short-term responses of soil nutrients, heavy metals, and microbial community to partial substitution of chemical fertilizer with spent mushroom substrates (SMS). Sci. Total Environ. 2022, 844, 157064. [Google Scholar] [CrossRef]
  65. Yang, Y.; Qiu, K.; Xie, Y.; Li, X.; Zhang, S.; Liu, W.; Huang, Y.; Cui, L.; Wang, S.; Bao, P. Geographical, climatic, and soil factors control the altitudinal pattern of rhizosphere microbial diversity and its driving effect on root zone soil multifunctionality in mountain ecosystems. Sci. Total Environ. 2023, 904, 166932. [Google Scholar] [CrossRef] [PubMed]
  66. Luan, H.; Gao, W.; Huang, S.; Tang, J.; Li, M.; Zhang, H.; Chen, X. Partial substitution of chemical fertilizer with organic amendments affects soil organic carbon composition and stability in a greenhouse vegetable production system. Soil Tillage Res. 2019, 191, 185–196. [Google Scholar] [CrossRef]
  67. Xue, G.; Bai, H.; Du, J. Effects of Different Treatments on Structure and Diversity of Soil Bacterial Community in Pepper Continuous Cropping Soil. China Veg. 2023, 3, 78–84. [Google Scholar] [CrossRef]
  68. Yang, Y.; Li, H.; Ma, K. Effect of Continuous Cropping on the Physicochemical Properties, Microbial Activity, and Community Characteristics of the Rhizosphere Soil of Codonopsis pilosula. China Environ. Sci. 2023, 44, 6387–6398. [Google Scholar] [CrossRef]
  69. Meng, Q.; Yang, W.; Men, M.; Bello, A.; Xu, X.; Xu, B.; Deng, L.; Jiang, X.; Sheng, S.; Wu, X.; et al. Microbial Community Succession and Response to Environmental Variables During Cow Manure and Corn Straw Composting. Front. Microbiol. 2019, 10, 529. [Google Scholar] [CrossRef]
Figure 1. Physicochemical parameters of compost and maize growth indicators following field application: (a) temperature dynamics during composting; (b) moisture content; (c) compost pH; (d) soil pH changes during the maize growing period; (e) 100-grain weight; (f) yield per plant; (g) single root weight; (h) aboveground dry matter weight; and (i) number of fibrous roots. Different lowercase letters are expressed as the same period at the 0.05 level.
Agriculture 15 00879 g001
Figure 2. Changes in soil lignocellulose and lignocellulase across different composting treatments. (ac) Lignocellulose content during composting; (df) lignocellulose content during the maize growing period; (gi) lignocellulase enzyme activity during composting; (jl) lignocellulase enzyme activity during the maize growing period. Different lowercase letters are expressed as the same period at the 0.05 level.
Agriculture 15 00879 g002
Figure 3. Changes in soil total nitrogen (TN), total phosphorus (TP), and total potassium (TK) under different composting treatments. (ac) Changes in TN, TP, and TK contents during composting; (df) changes in TN, TP, and TK contents during maize growth. Statistical analysis was performed using one-way ANOVA (Duncan’s test, p < 0.05). Different lowercase letters are expressed as the same period at the 0.05 level.
Agriculture 15 00879 g003
Figure 4. Effects of different composting treatments on the alpha diversity of the soil microbial community. (a,b) Bacterial and fungal Chao1 indices during composting; (c,d) bacterial and fungal Shannon indices during composting; (e,f) bacterial and fungal Chao1 indices during maize growth; (g,h) bacterial and fungal Shannon indices during maize growth. The composting periods for the different treatments are labeled as JFA1, JFA2, and JFA3 for the A1 treatment, JFB1, JFB2, and JFB3 for the A2 treatment, and JFC1, JFC2, and JFC3 for the A3 treatment. The maize growth periods are denoted as JFAa, JFAb, JFAc, JFAd, and JFAe for the B1 treatment, JFBa, JFBb, JFBc, JFBd, and JFBe for the B2 treatment, and JFCa, JFCb, JFCc, JFCd, and JFCe for the B3 treatment. The control (CK treatment) growth periods are labeled Qa, Qb, Qc, Qd, and Qe.
Agriculture 15 00879 g004
Figure 5. Effect of different composting treatments on beta diversity of soil microbial communities, as shown by Principal Coordinate Analysis (PCA) plots. Panels (ac) represent the beta diversity of the bacterial community during composting, while (df) illustrate the beta diversity of the fungal community during composting. Panels (gk) depict the beta diversity of the soil bacterial community during maize growth, and (lp) show the beta diversity of the soil fungal community during maize growth. The compost fermentation periods for the different treatments are labeled as follows: JFA1, JFA2, and JFA3 correspond to the A1 treatment, JFB1, JFB2, and JFB3 correspond to the A2 treatment, and JFC1, JFC2, and JFC3 correspond to the A3 treatment. The maize growth periods are labeled as JFAa, JFAb, JFAc, JFAd, and JFAe for the B1 treatment, JFBa, JFBb, JFBc, JFBd, and JFBe for the B2 treatment, and JFCa, JFCb, JFCc, JFCd, and JFCe for the B3 treatment. The control (CK treatment) growth periods are labeled as Qa, Qb, Qc, Qd, and Qe.
Agriculture 15 00879 g005
Figure 6. Composition and relative abundance of microbial bacterial and fungal communities across different treatments. Panels (A,B) show the relative abundance of bacterial and fungal communities, respectively, during the composting process, while panels (C,D) display the relative abundance of soil bacterial and fungal communities, respectively, during plant growth. Panels (E,F) illustrate the relative abundance of bacterial and fungal taxa at the genus level during composting, whereas panels (G,H) present the relative abundance of bacterial and fungal taxa at the genus level during plant growth. The compost fermentation periods for each treatment are labeled as JFA1, JFA2, and JFA3 for the A1 treatment, JFB1, JFB2, and JFB3 for the A2 treatment, and JFC1, JFC2, and JFC3 for the A3 treatment. The plant growth periods are denoted as JFAa, JFAb, JFAc, JFAd, and JFAe for the B1 treatment; JFBa, JFBb, JFBc, JFBd, and JFBe for the B2 treatment; and JFCa, JFCb, JFCc, JFCd, and JFCe for the B3 treatment. The CK treatment growth periods are labeled as Qa, Qb, Qc, Qd, and Qe.
Agriculture 15 00879 g006
Figure 7. Differential species analysis of the soil microbial community under different composting treatments. Panels (a,b) present the differential species analysis of microbial communities during composting, while panels (c,d) illustrate the differential species analysis of microbial communities during plant growth. Each circle in the evolutionary diagram represents a taxon at a specific taxonomic level, with the yellow color indicating no significant change in abundance. The diameter of each circle corresponds to the relative abundance of the taxon, which was statistically analyzed from the phylum to the genus level. The compost fermentation periods for each treatment are labeled as JFA1, JFA2, and JFA3 for the A1 treatment; JFB1, JFB2, and JFB3 for the A2 treatment; and JFC1, JFC2, and JFC3 for the A3 treatment. The plant growth periods are denoted as JFAa, JFAb, JFAc, JFAd, and JFAe for the B1 treatment; JFBa, JFBb, JFBc, JFBd, and JFBe for the B2 treatment; and JFCa, JFCb, JFCc, JFCd, and JFCe for the B3 treatment. The CK treatment growth periods are labeled as Qa, Qb, Qc, Qd, and Qe, corresponding to the five distinct growth stages of maize, which are further denoted as a, b, c, d, and e.
Agriculture 15 00879 g007
Figure 8. Network analysis of microbial associations at the genus level. Panels (a,b) represent bacterial and fungal communities during composting, respectively, while panels (c,d) depict bacterial and fungal communities during the growth period. Each node represents a microorganism, with different colors indicating different taxa and node size corresponding to relative abundance. Connecting lines between the nodes represent interaction relationships, where red lines indicate positive correlations, green lines indicate a negative correlation, and the thickness of the line indicates the strength of the interaction according to Pearson’s correlation coefficient.
Agriculture 15 00879 g008
Figure 9. Redundancy analysis (RDA) between soil environmental factor pairs and microbial communities. (a) composting bacteria; (b) composting fungi; (c) growth period bacteria; (d) growth period fungi.
Agriculture 15 00879 g009
Figure 10. Heatmap of correlations between soil environmental factors, lignocellulose content, enzymes, and microbial communities. (a) Composting bacteria; (b) composting fungi; (c) bacteria during the growth period; (d) fungi during the growth period. Correlations were determined using Pearson correlation analysis, where “*” indicates statistical significance at p < 0.05 and “indicates highly significant correlations at p < 0.01 **”.
Agriculture 15 00879 g010
Table 1. Basic physical property.
Basic Physical PropertyCMAuricularia heimuer ResidueSoil
pH7.878.278.17
TN (g/kg)26.6784.3081.413
TP (g/kg)19.521.851.3
TK (g/kg)17.4711.716.55
Disclaimer/Publisher’s Note: The statements, opinions and data contained in all publications are solely those of the individual author(s) and contributor(s) and not of MDPI and/or the editor(s). MDPI and/or the editor(s) disclaim responsibility for any injury to people or property resulting from any ideas, methods, instructions or products referred to in the content.

