Article

Study on the Coupling Coordination Relationship Between Rural Tourism and Agricultural Green Development Level: A Case Study of Jiangxi Province

1
School of Economics and Management, Jiangxi Agricultural University, No. 888 Lushan Middle Avenue, Nanchang 330045, China
2
School of Land Resources and Environment, Jiangxi Agricultural University, No. 1101 Zhimin Avenue, Nanchang 330045, China
3
School of Digital Economy, Jiangxi University of Finance and Economics, Nanchang 330013, China
*
Author to whom correspondence should be addressed.
Agriculture 2025, 15(8), 874; https://doi.org/10.3390/agriculture15080874
Submission received: 14 March 2025 / Revised: 8 April 2025 / Accepted: 15 April 2025 / Published: 16 April 2025
(This article belongs to the Special Issue Leveraging Agritourism for Rural Development)

Abstract

:
Against the background of global climate change, agricultural ecosystems face extreme weather, resource shortages, and carbon emission pressures, necessitating green transitions. Rural tourism, a key driver of rural revitalization, injects momentum into green agriculture through ecological resource monetization, low-carbon technology adoption, and industrial restructuring. This study evaluates rural tourism and agricultural green development levels in Jiangxi Province (2008–2022) using the entropy weight method and explores their spatiotemporal coordination via a coupling coordination degree model and spatial autocorrelation analysis. The study reveals the following: (1) Rural tourism and agricultural green development in Jiangxi Province demonstrate an upward trend overall, though with significant regional disparities. Regions such as Nanchang and Jiujiang exhibit higher coordination levels, while areas like Pingxiang and Xinyu persistently cluster in low-value agglomerations. (2) The coupling coordination degree transitions from “marginal imbalance” to “intermediate coordination”, with Nanchang City achieving “good coordination” status in 2022, forming a high-value radiation zone encompassing Nanchang, Jiujiang, and Yichun. Low-value regions remain constrained by inadequate resource exploitation and technological lag. (3) Global spatial autocorrelation analysis reveals significant positive agglomeration effects (Moran’s I values range from 0.148 to 0.312). Local spatial associations show coexisting patterns of ‘high-high’ synergy and ‘low-low’ lock-in”. The study proposes targeted policy interventions, industrial convergence enhancement, and regional coordination mechanism optimization to mitigate spatial disparities and foster high-quality synergetic development. This study establishes theoretical foundations for agricultural green transition integrated with rural tourism development while offering referential pathways for analogous regions confronting climate change challenges.

1. Introduction

Against the pressing backdrop of global climate change mitigation, China’s strategic “carbon peaking and carbon neutrality” objectives chart a course for low-carbon development across sectors. As a major greenhouse gas emitter (contributing 17–21% of global totals), agricultural green transition proves pivotal for achieving dual-carbon targets [1]. Conventional farming practices reliant on intensive chemical inputs accelerate soil degradation, biodiversity loss, and carbon emissions, heightening climate vulnerability [2]. Green agricultural development mitigates resource consumption and carbon footprints through water-efficient irrigation, organic cultivation, and circular agricultural technologies, offering critical solutions to the climate-agriculture paradox [3]. FAO research demonstrates that climate-smart agriculture could boost crop yields by 20–30% while cutting emissions by 10–15% in developing countries [4], highlighting its eco-economic synergistic benefits. Agricultural green development pursues low-carbon production, circular economy, and ecological equilibrium to ensure food security, enhance product quality, increase farmer income, and rehabilitate agro-ecosystems [5,6]. Agricultural green development prioritizes environmental and ecological compatibility beyond yield enhancement, emphasizing efficient resource utilization and sustainability [7]. As a critical pathway to agricultural sustainability, this paradigm encompasses multidimensional aspects including resource conservation, environmental protection, ecological preservation, and high-quality industrialization. Scholars have conducted empirical studies through methodologies like entropy weight method [8], entropy-weighted TOPSIS [9], and GIS [6], examining perspectives ranging from carbon emissions [10] to green production targets [11] and development indices [12].
Concurrently, the deepening implementation of the Rural Revitalization Strategy presents historic opportunities for restructuring rural industrial systems. Characterized by low resource consumption and high industrial convergence, rural tourism emerges as a pivotal pathway for advancing sustainable economic development and comprehensive rural revitalization [13]. On one hand, it reinforces public recognition of sustainable agricultural practices through ecological landscape preservation, cultural heritage revitalization, and green consumption guidance [14]; On the other hand, tourism revenue reciprocally fuels agricultural innovation, as evidenced by Wuyuan County’s 30% fertilizer reduction through tourism-funded organic tea plantations, establishing a virtuous cycle of tourism-driven agricultural advancement. Furthermore, as a catalyst for rural landscape development and functional transformation, rural tourism effectively narrows urban–rural disparities by energizing rural economies through income growth, industrial integration, and labor mobility, thereby mitigating dual-structure contradictions [15]. Its development substantially enhances local livelihoods [16], elevates income levels [17], reconfigures rural socio-spatial relationships, and strengthens comprehensive competitiveness alongside sustainable development capacity [18].
Simultaneously, agricultural green development reciprocally propels rural tourism through multidimensional pathways. By enhancing rural ecological conditions, preserving agro-landscapes, and conserving biodiversity, it cultivates more appealing natural-cultural attractions for rural tourism [19], thereby accelerating its development. Within sustainable development frameworks, circular resource utilization reduces operational costs, endowing rural tourism with enhanced competitiveness and sectoral viability. Green transformation in agriculture and rural territories constitutes a vital component of China’s rural revitalization and high-quality development [20], making its advancement imperative for achieving agricultural and rural modernization [21].
Consequently, integrated development of rural tourism and agricultural green transition generates significant eco-economic synergies. Economically, it diversifies farmers’ income streams [22] through tourism-driven agricultural value addition and service sector expansion that creates employment and economic growth poles. Environmentally, green agricultural practices construct premium ecological landscapes for tourism, while tourism development enhances public environmental awareness [23], establishing a virtuous economy–environment interaction [24]. Empirical studies confirm that agriculture–tourism integration significantly enhances agricultural green total factor productivity (GTFP) [25,26,27], while also improving agro-ecological efficiency. The marginal effects intensify with higher integration levels [28]. Nevertheless, the coupling mechanisms and spatial heterogeneity demand deeper exploration.
In summary, this study constructs a theoretical framework diagram for the coupling and coordination of rural tourism development and agricultural green development, as shown in Figure 1:

2. Research Methodology and Data Sources
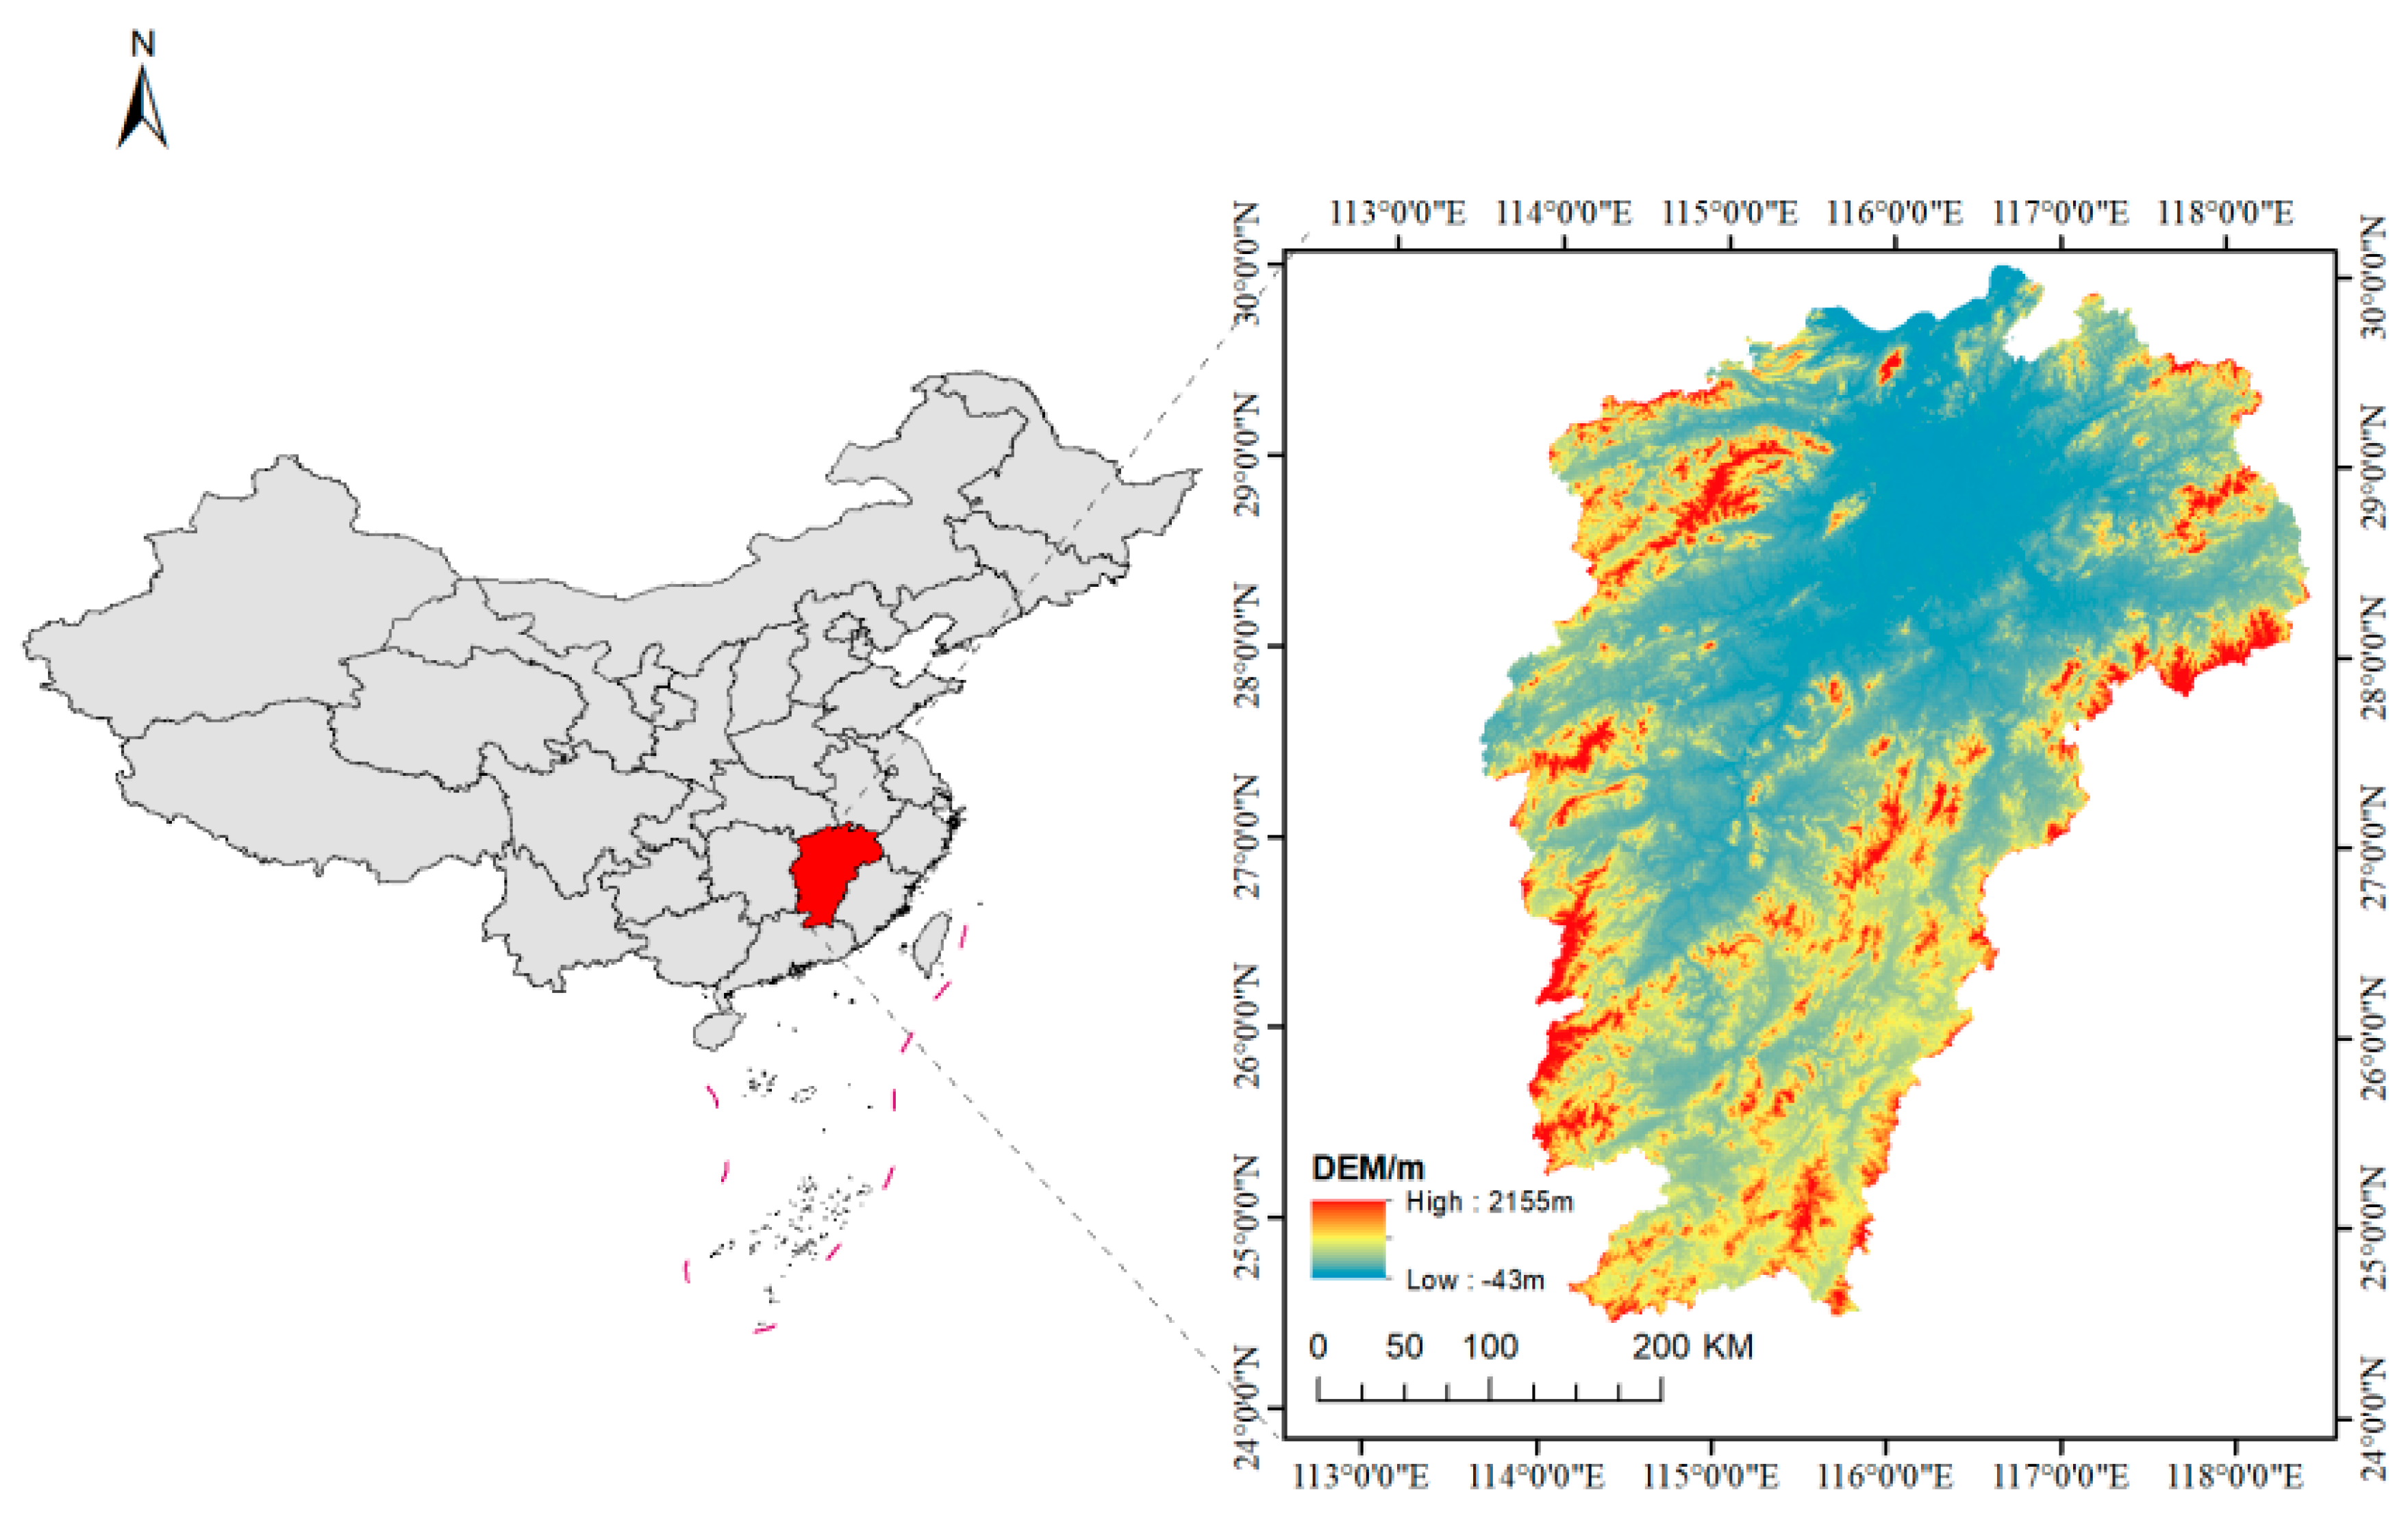
2.1. Study Area

Jiangxi Province is situated on the south bank of the middle-lower Yangtze River in southeastern-central China, bordering Zhejiang and Fujian to the east, Guangdong to the south, Hunan to the west, and Hubei with Anhui to the north. It encompasses a total area of 166,900 km2 (Figure 2). The province possesses abundant and distinctive rural tourism resources alongside agricultural assets. In rural tourism, the renowned Wuyuan ancient villages exemplify cultural–landscape integration through well-preserved Huizhou-style architecture and rapeseed flower terraces that attract global visitors. Revolutionary bases like Jinggangshan synergize red tourism resources with rural folklore to create distinctive experiential products. Agriculturally, Gannan navel oranges demonstrate large-scale cultivation with geographical indication recognition, while the Poyang Lake Basin showcases green agricultural models through fisheries and wetland agriculture systems. These diversified resources epitomize the coupled coordination between rural tourism and agricultural green development across multiple formats and regional characteristics. Jiangxi is actively implementing the national Rural Revitalization Strategy and Ecological Civilization Construction strategic framework. Regional development plans prioritize rural tourism for rural economic restructuring and farmer income growth, while positioning agricultural green development as the cornerstone for sustainable development and constructing “Beautiful Jiangxi”. Investigating this coupling coordination mechanism will strengthen theoretical underpinnings for regional strategy implementation, facilitate Jiangxi’s distinctive development model exploration in rural revitalization and ecological civilization, and establish a reference framework for other regions’ sustainable development practices.

2.2. Data Sources and Processing

The data for this study mainly come from the data of Jiangxi Province from 2008 to 2022 on the China Economic and Social Big Data Research Platform, the Statistical Yearbooks of Jiangxi Province from 2008 to 2022, statistical data from the agricultural and rural departments, statistical data from the tourism departments, relevant industry reports, literature materials, etc. The collected raw data were sorted, filtered, and normalized to eliminate the influence of units on the data. At the same time, abnormal data were removed to ensure the accuracy and reliability of the data. For some data that are difficult to obtain directly, linear interpolation was used to meet the data requirements of the evaluation index system.
In order to eliminate the effects of dimensionality and magnitude, it is necessary to normalize the raw data, which can be represented as the matrix X = x i j n × m , where x i j represents the value of i indicator of the j sample ( i = 1 , 2 , , n ; j = 1 , 2 , , m ) . The standardized formula for positive indicators (the larger the value, the better) is as follows:
y i j = x i j min i x i j max i x i j min i x i j
For negative indicators (the smaller the value, the better), the standardized processing formula is as follows:
y i j = max i x i j x i j max i x i j min i x i j
where y i j and x i j are the normalized and original values of the indicator i in the j year, respectively; max x i j and min x i j are the maximum and minimum values of the indicator i in the j year, respectively.

2.3. Determination of Indicator Weights

This study employs the entropy weight method for indicator weighting, an objective weighting approach grounded in information theory. Within the multi-criteria evaluation framework, information entropy quantifies uncertainty measures. The entropy weight method calculates weights based on the information content (measured by entropy values) inherent in each indicator. Specifically, lower entropy values indicate greater information utility, warranting higher weight allocation, whereas elevated entropy corresponds to diminished informational value and reduced weighting significance. This study prioritizes the entropy weight method due to two key advantages: First, it ensures data-driven objectivity. Unlike subjective methods such as the Analytic Hierarchy Process (AHP) or Delphi method that rely on expert judgments and may introduce cognitive biases, the entropy weight method assigns weights based on data variability. For instance, indicators with higher information entropy (e.g., “forest coverage rate” with stable regional variations) receive lower weights, reflecting their limited discriminative power, whereas more volatile indicators (e.g., “tourism revenue” with significant interannual fluctuations) are assigned greater weights. This characteristic aligns well with the requirements for rigor and replicability in policy evaluation. Second, it preserves multidimensional indicators. Unlike Principal Component Analysis (PCA), which reduces dimensionality by constructing composite variables, the entropy weight method retains all original indicators, ensuring no information loss. This is particularly critical for our study as both rural tourism and agricultural green development indicators require nuanced evaluation across different dimensions.
First, calculate the entropy value e j of each indicator i using the following formula:
e j = k i = 1 n p i j ln p i j
where k = 1 ln ( n ) , p i j = y i j i = 1 n y i j , p i j represents the probability distribution of each sample under each indicator.
Then, calculate the indicator weight using the following formula:
w j = 1 e j j = 1 m 1 e j

2.4. Calculation of Rural Tourism and Agricultural Green Development Levels

Let the comprehensive indicator of rural tourism development level be RTDL (Rural Tourism Development Level). There are m measurement indicators (such as rural tourism income, the number of rural tourism tourists received, the number of rural tourism attractions, and the number of rural tourism employees), and the indicator weights are w 1 , w 2 , , w m . The standardized values of each indicator in the year i and city j are y i 1 j , y i 2 j , , y i m j . Then, the calculation formula of the rural tourism development level comprehensive indicator is as follows:
R T D L i j = k = 1 m w k × y i k j
In the above formula, i represents the year (i = 2008, 2009, 2010, … 2022), and j represents the number of cities in Jiangxi Province (j = 1, 2, 3, … 11).
Similarly, let the comprehensive indicator of agricultural green development level in Jiangxi Province be (Agricultural Green Development Level). There are p measurement indicators (such as the proportion of green agricultural product planting area, the utilization rate of agricultural waste resources, the amount of chemical fertilizers applied per unit area, and the amount of pesticides used per unit area), and the indicator weights are w 1 , w 2 , , w p . The standardized values of each indicator in the year and prefecture-level city are y i 1 j , y i 2 j , , y i p j . Then, the agricultural green development level is as follows:
A G D L i j = k = 1 p w k × y i k j

2.5. Construction of Coupling Coordination Degree Model

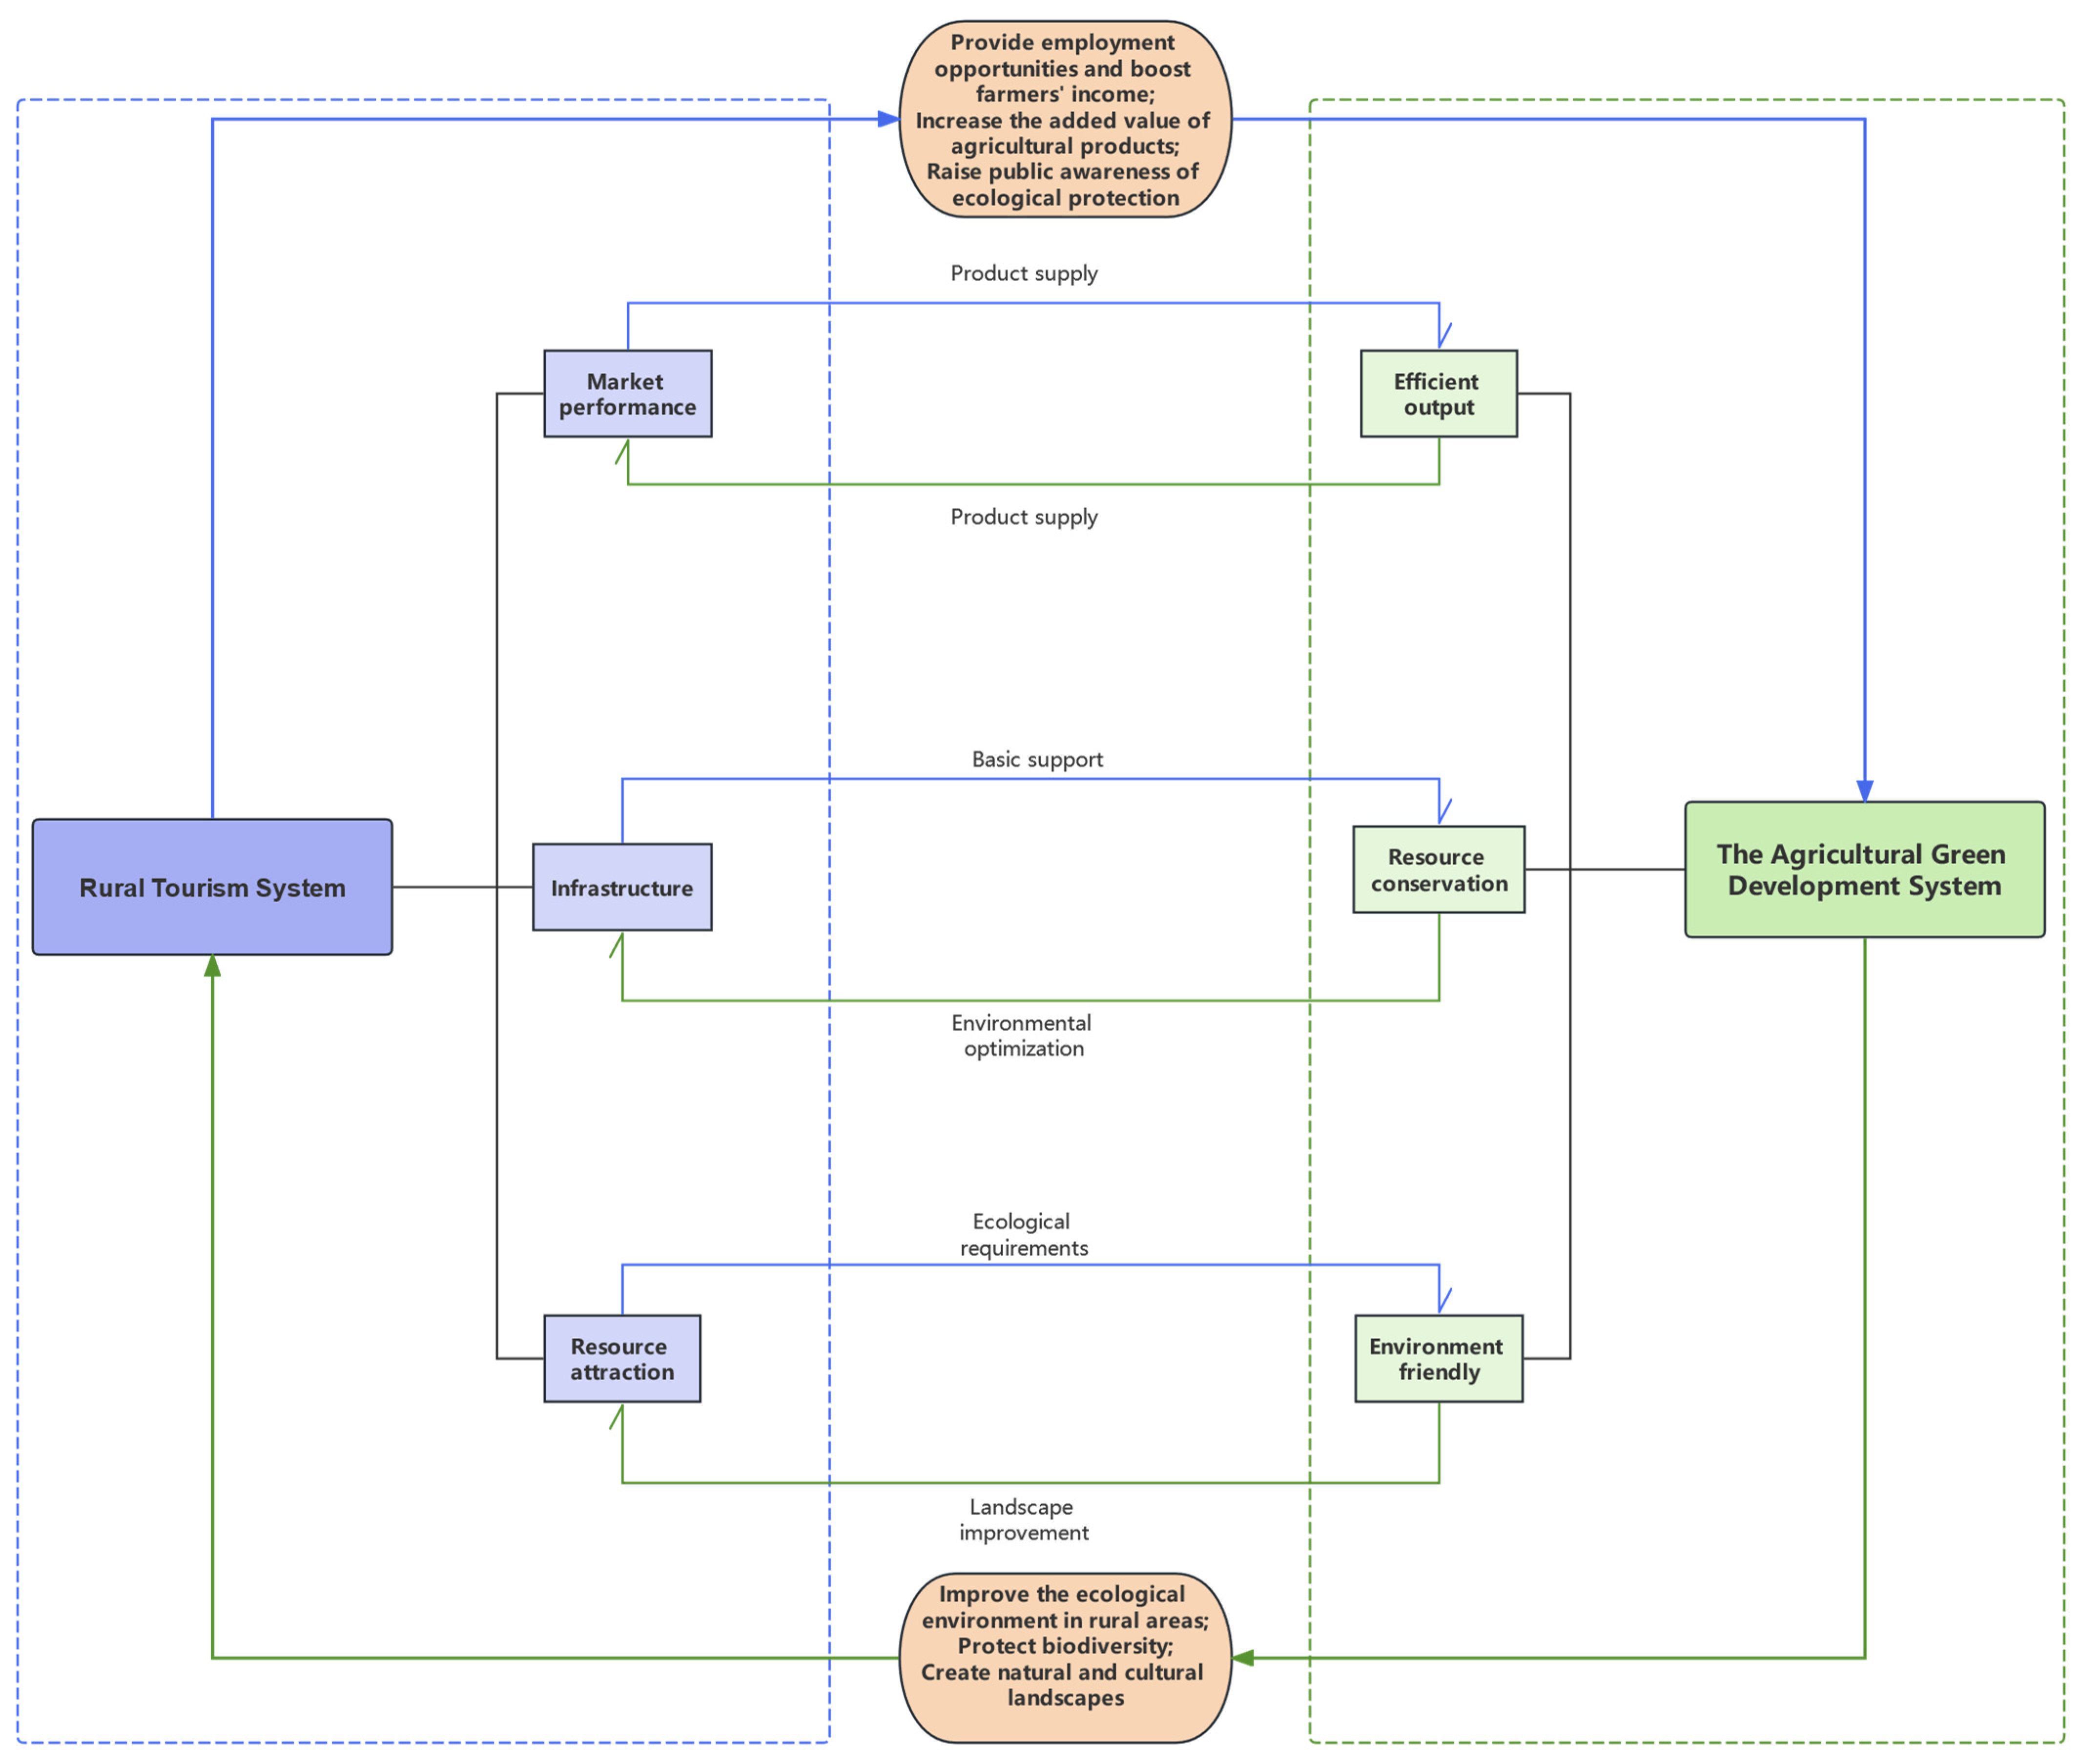
2.5.1. Conceptual Foundations

The Coupling Coordination Degree (CCD) model serves as a quantitative analytical framework for investigating interaction dynamics and developmental synchronization between complex systems. Originating from physics, coupling describes energy/matter exchange phenomena between physical systems through interactive forces. In social science applications, this concept extends to characterize interdependency patterns among socio-economic subsystems.
The coupling degree is calculated by constructing a coupling function. The coupling degree calculation formula is as follows:
C = 2 × R T D L i j × A G D L i j R T D L i j + A G D L i j
Within the formula framework, when the rural tourism development level R T D L i j and agricultural green development level A G D L i j evaluation functions (with i denoting temporal indices and j spatial coordinates) exhibit proximate values, the coupling intensity coefficient C demonstrates elevated magnitude, indicating strong inter-system synergy. This dimensionless parameter C ∈ [0, 1] quantifies coupling states: null interaction at C = 0 and optimal synergy at C = 1.

2.5.2. Coupling Coordination Degree Calculation

The coupling degree measures the interaction intensity between rural tourism and agricultural green development. A high coupling degree means strong interaction, like when rural tourism boosts local green agricultural product sales and green agriculture attracts more tourists. However, a high coupling degree does not guarantee harmonious development. Interdependent systems may rely on each other but still be at suboptimal stages. For example, rural tourism could be just basic farm stays with limited experiences, and agricultural green development might have low resource-use efficiency. Thus, solely relying on coupling degree metrics is insufficient to assess system coordination. Therefore, coordination degree computation becomes essential, incorporating comprehensive development indices with coupling parameters. The CCD reflects not only the absolute development levels of rural tourism and green agriculture but also their reciprocal influences. The calculation protocol requires prior determination of the comprehensive evaluation index T, as shown in the following formula:
T = α × R T D L i j + β × A G D L i j
In the above formula, ɑ and β are weights. Based on the documents of the rural revitalization promotion plan issued by Jiangxi Province, which mention promoting the coordinated development of the agricultural and tourism industries, and drawing on the research of relevant scholars, in this paper, we believe that the development level of rural tourism and the level of green agricultural development are equally important, that is, ɑ = β = 0.5. The comprehensive evaluation index T considers the development levels of the two systems respectively and is used to calculate the coupling coordination degree in the following formula:
D = C × T
The coupling coordination index D ∈ [0, 1] demonstrates positive correlation with system harmonization, where elevated values signify enhanced synergistic equilibrium between rural tourism development and agricultural green transition. Building upon established research frameworks [29,30,31], this study implements a decile ordinal classification scheme to stratify coordination states, as detailed below (Table 1):

2.6. Spatial Autocorrelation Analysis

2.6.1. Global Spatial Autocorrelation Analysis

Global spatial autocorrelation analysis constitutes a geostatistical methodology that integrates geospatial units’ (e.g., regions, points) attribute values with their spatial coordinates to quantify interdependency patterns across the study domain. This technique operationalizes Moran’s Index to measure spatial association intensity, discerning whether variables exhibit spatial clustering patterns (homogeneous aggregation), stochastic distribution, or dispersion characteristics (heterogeneous segregation). The computational formula for Moran’s Index is mathematically expressed as follows:
I = n i = 1 n j = 1 , j i n w i j x i x ¯ x j x ¯ i = 1 n j = 1 , j i n w i j i = 1 n x i x ¯ 2
In the above formula, n represents the number of spatial units. x i and x j denote the attribute values of spatial units i and j, respectively. x ¯ is the mean of the attribute values; w i j is the spatial weight matrix, indicating the spatial relationship between spatial units i and j. The value range of Moran’s Index typically falls between [−1, 1]. When I > 0, it indicates positive spatial autocorrelation, meaning similar attribute values tend to cluster spatially; when I < 0, it represents negative spatial autocorrelation, i.e., similar attribute values tend to disperse spatially; when I = 0, it signifies a random spatial distribution with no obvious spatial autocorrelation.

2.6.2. Local Spatial Autocorrelation Analysis

Local spatial autocorrelation analysis examines spatial dependency between individual units and their neighbors through Local Indicators of Spatial Association (LISA), detecting localized clusters (hotspots/coldspots) or spatial outliers. This approach reveals subregional spatial heterogeneities and atypical patterns masked in global analyses, enabling granular interpretation of spatial dynamics. The Local Moran’s I statistic operationalizes this methodology as follows:
I i = x i x ¯ j = 1 n x j x ¯ 2 / n j = 1 n w i j x j x ¯
Among them, x i denotes the attribute value of spatial unit i, x j represents the attribute value of spatial unit j, x ¯ is the mean of the attribute values for all spatial units, w i j is the spatial weight matrix reflecting the spatial relationship between unit i and j, and n is the number of spatial units. I i measures the degree of local spatial autocorrelation between spatial unit i and its adjacent units. If the I i value is relatively high and positive, it indicates that the attribute values of unit i and its surrounding units exhibit high-value aggregation. If the I i value is relatively low and negative, it signifies a significant difference in attribute values between unit i and its surrounding units, suggesting that it may be a local outlier.

3. Evaluation Index System and Index Weights

3.1. Rural Tourism Development Evaluation Indicator System

This study adopts three primary indicators: tourism market performance, infrastructure and services, and tourism resource attractiveness. Tourism market performance comprises three sub-indicators: tourism revenue, visitor numbers, and tourism spatial density. Infrastructure and services include four components: number of accommodation enterprises, quantity of star-rated hotels, per capita road cleaning area, and employment in accommodation and catering sectors. Tourism resource attractiveness encompasses five metrics: number of key rural tourism villages, count of A-grade tourist attractions, quantity of cultural relic protection units, proportion of nature reserve area to jurisdiction area, and forest coverage rate. The specific rationale and operational definitions for each indicator are detailed below:
(1)
Tourism revenue: As a core metric for evaluating destination development, tourism revenue serves as a vital indicator of economic vitality and market competitiveness in the tourism industry. Closely associated with resource development, service quality, and marketing effectiveness, it comprehensively reflects the economic performance of tourism activities [29,30].
(2)
Visitor numbers: Increased visitation enhances destination visibility, with popular rural attractions driving local governments to augment infrastructure investments in transportation, catering, and accommodation to meet tourist demands [31].
(3)
Tourism spatial density: This metric quantifies tourism activity intensity per unit area by integrating resource distribution with visitor flows, enabling evaluation of resource utilization efficiency and spatial allocation rationality [32].
(4)
Accommodation enterprises: The quantity of lodging businesses indicates reception capacity, with thriving homestays and agritourism facilities in hotspot areas diversifying accommodation options and enhancing destination appeal [33].
(5)
Star-rated hotels: The presence of classified hotels signifies service quality tiers, where establishments meeting standardized rating criteria cater to premium markets while elevating destination image [34].
(6)
Per capita road maintenance: This sanitation metric reflects governmental commitment to tourism infrastructure and environmental governance, contributing to destination value through improved hygiene and comfort [35,36].
(7)
Hospitality employment: Workforce size in accommodation and catering sectors demonstrates labor inputs and job creation capacity, with ecosystem-based tourism evaluation requiring precise economic impact assessment [37].
(8)
Key rural tourism villages: The concentration of designated villages highlights resource agglomeration and quality advantages, where higher densities signal market competitiveness through diversified rural experiences [38].
(9)
A-graded attractions: Quantifying quality-certified sites, this indicator reflects development standards encompassing landscape quality, facilities, environmental management, and visitor satisfaction, with 5A sites representing premium destinations [39].
(10)
Protected heritage sites: The inventory of officially recognized cultural relics demonstrates historical legacy and heritage resource abundance, acknowledging cultural assets as fundamental societal components [40].
(11)
Nature reserve ratio: This proportion indicates ecological conservation intensity and resource advantages, with protected areas globally recognized as premier tourism destinations [41].
(12)
Forest coverage rate: As a prime ecological quality indicator, forest-based tourism demonstrates enhanced positive impacts on livelihoods, biodiversity conservation, and nature preservation [42].
In summary, this evaluation index system comprehensively and systematically captures the developmental status of rural tourism in Jiangxi Province through multi-dimensional indicators, establishing a robust empirical foundation for scientific assessment and targeted promotional strategies. Moreover, indicator weights were objectively quantified using the entropy weight method (see Table 2), ensuring methodological rigor in the evaluation framework.

3.2. Agricultural Green Development Evaluation Indicator System

This study establishes a tripartite indicator framework for Jiangxi’s agricultural green development:
Regarding the assessment indicators for agricultural green development in Jiangxi Province, this study examines three dimensions: resource conservation, environmental friendliness, and efficient output. The resource conservation dimension incorporates two indicators: the proportion of effectively irrigated area and water consumption per unit of farmland. The environmental friendliness dimension comprises three metrics: fertilizer application rate per unit area, pesticide usage per unit area, and agricultural plastic film consumption per unit area. The efficient output dimension evaluates three indicators: grain yield per unit area, agricultural output value per unit area, and gross agricultural output value per agricultural laborer. The specific selection criteria and operational definitions of each indicator are as follows:
(1)
Proportion of effectively irrigated area: Improving agricultural water-use efficiency constitutes a pivotal approach to water conservation in China [43]. This indicator reflects the fundamental safeguard level of agricultural water resource utilization.
(2)
Irrigation water consumption per unit farmland area: Water serves as the source of life and a vital factor for social and economic development [44]. Although China’s total water resources are abundant, its per capita availability reaches only one-third of the world average [45]. This indicator constitutes a critical metric for assessing agricultural irrigation water-use efficiency.
(3)
Fertilizer application rate per unit area: Excessive application of chemical fertilizers and pesticides elevates nutrient and toxin levels in both groundwater and surface water, consequently increasing public health expenditures and water purification costs while diminishing fishery productivity and recreational value [46].
(4)
Pesticide application rate per unit area: The use of pesticides exerts consistent negative impacts on biodiversity, diminishes biological control potential [47], and disrupts ecological equilibrium.
(5)
Agricultural plastic film usage per unit area: While widely adopted in agricultural production for thermal insulation, moisture retention, and weed control, residual plastic film significantly reduces soil microbial biomass carbon/nitrogen, enzyme activity, and microbial diversity [48], leading to persistent “white pollution”.
(6)
Grain yield per unit area: Future trends in grain prices, food security, and cropland expansion are intrinsically linked to projected crop yields per unit area in the world’s major agricultural zones [49]. This metric directly reflects land productivity and agricultural production efficiency.
(7)
Agricultural output value per unit area: This indicator comprehensively evaluates the economic value creation capacity of diverse crops and agricultural activities. Higher values denote more rational industrial structures, greater added value of agricultural products [50], and more integrated supply chains. It not only manifests the economic performance of agricultural production but also demonstrates optimal resource allocation and utilization efficiency [51], representing a crucial economic dimension of agricultural green development.
(8)
Gross agricultural output value per laborer: This metric highlights both the productivity and value-creation capacity of agricultural labor [52]. Within agricultural green development, enhancing this output value necessitates leveraging agricultural technical training, mechanization and smart farming adoption [53], and innovative production organization models. These approaches optimize labor potential, enable efficient and sustainable agricultural operations, minimize human resource waste, and ultimately enhance sectoral competitiveness.
The comprehensive indicator system, objectively weighted through the entropy weight method (Table 3), provides a scientifically robust framework for assessing agricultural green transition.

4. Empirical Analyses

4.1. Analysis of Development Level Evaluation Results

After determining the weights of evaluation indicators using the entropy method, comprehensive scores for rural tourism and agricultural green development levels in various regions of Jiangxi Province were calculated, followed by ranking and analysis of the scoring results. By comparing the disparities in development levels across different regions, this study reveals the spatial patterns and regional imbalances in rural tourism and agricultural green development within Jiangxi Province, and explores key factors influencing developmental outcomes.

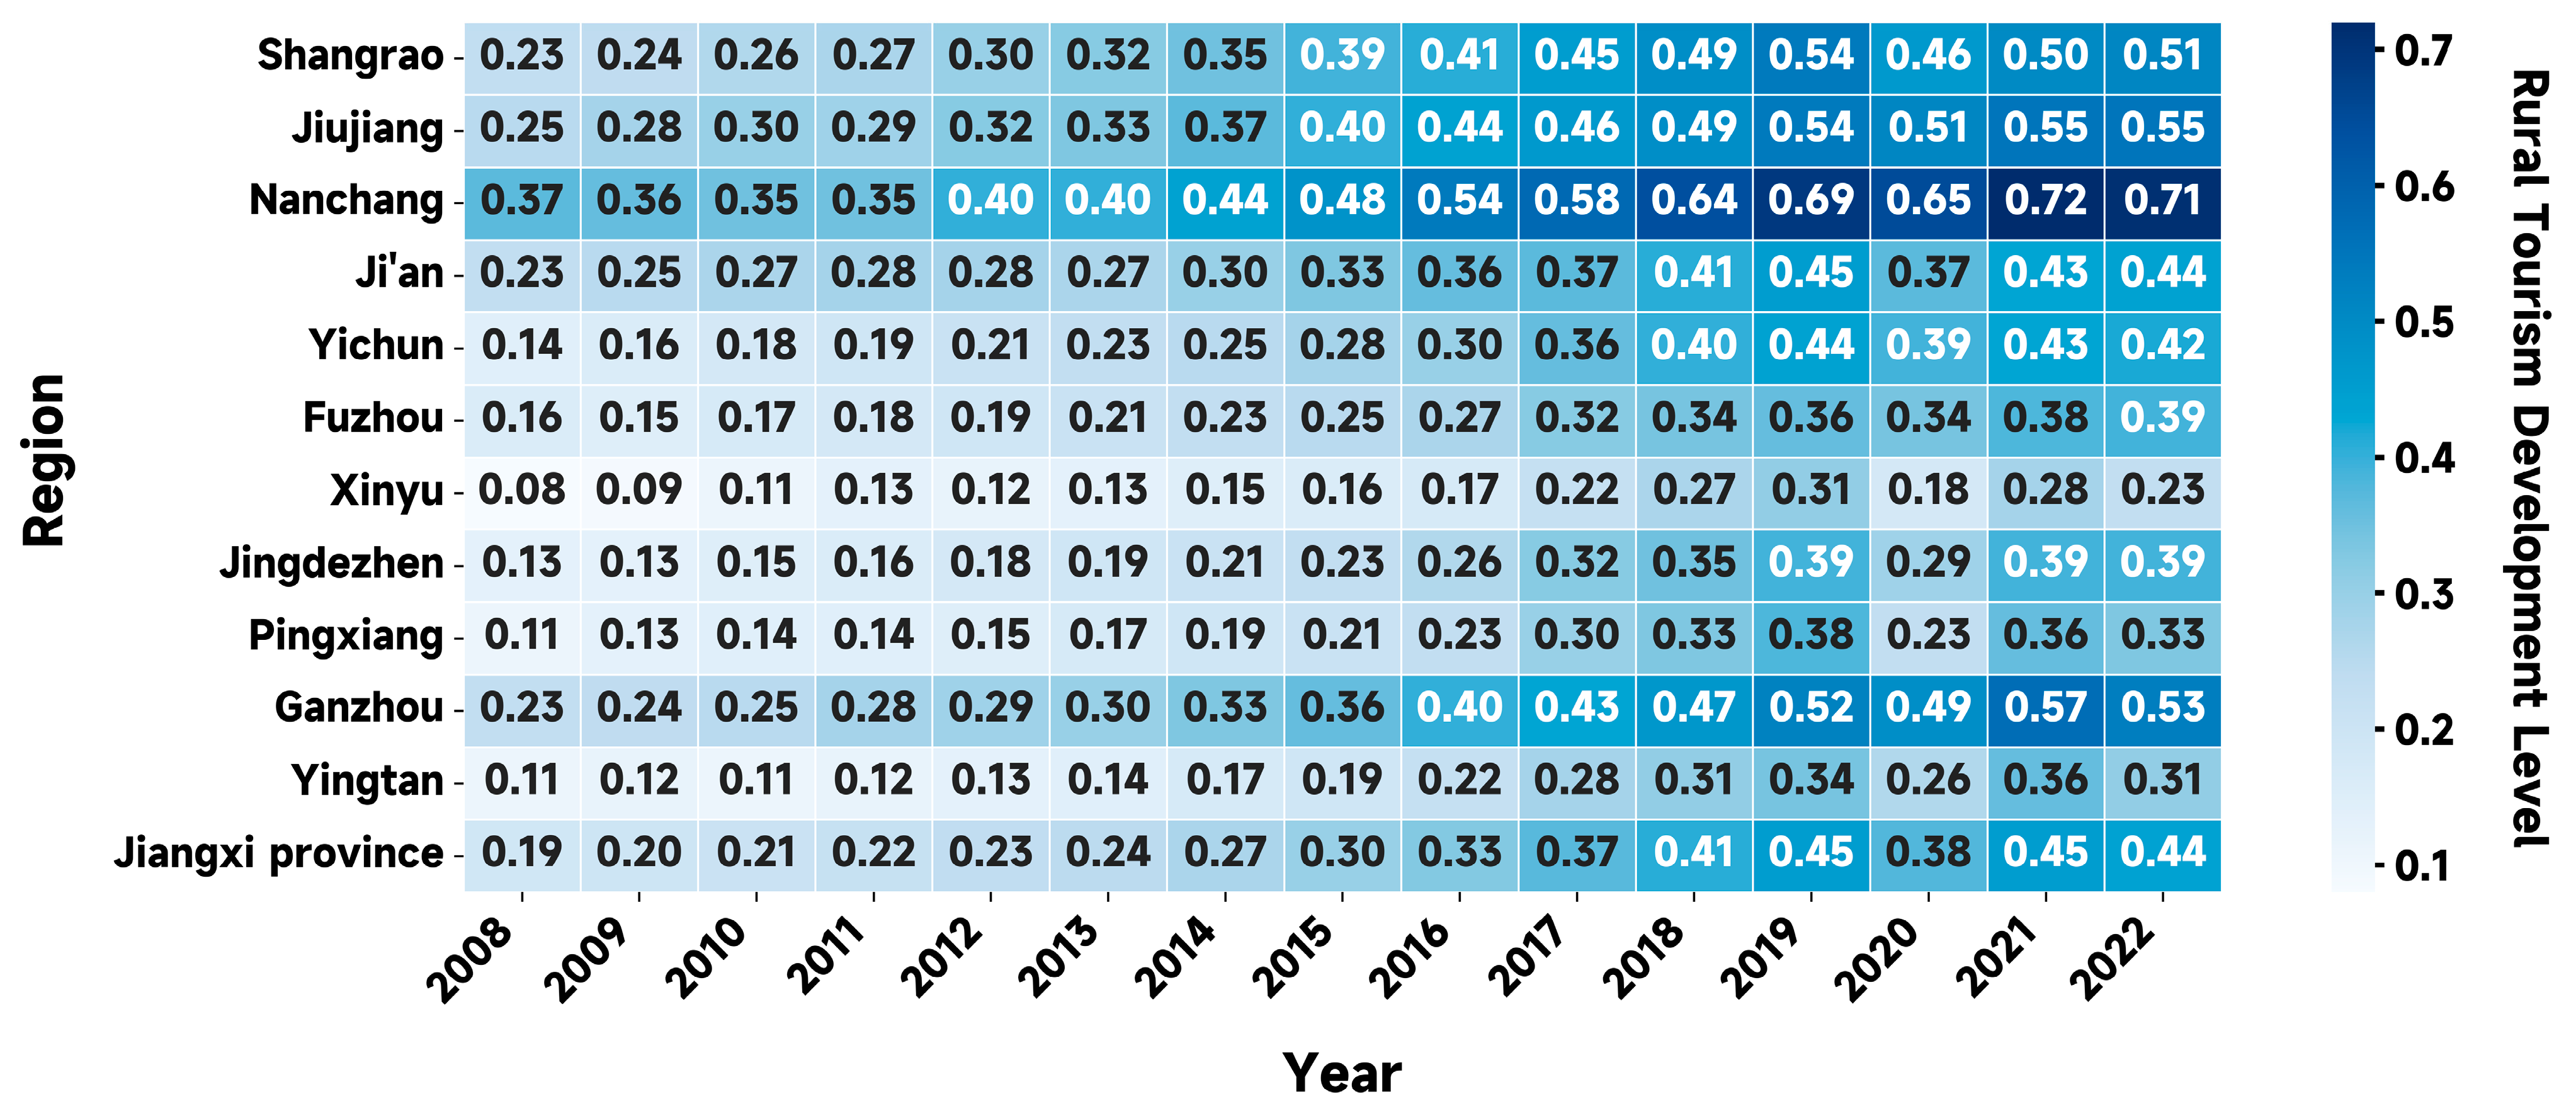
4.1.1. Rural Tourism Development Level

The calculated rural tourism development levels of prefecture-level regions in Jiangxi Province from 2008 to 2022 are illustrated in the following figure:
As shown in Figure 3, the average rural tourism development level in Jiangxi Province increased from 0.19 in 2008 to 0.45 in 2019, demonstrating an overall upward trend. However, due to the COVID-19 pandemic in 2020, the development index dropped to 0.38, rebounded in 2021, but slightly decreased to 0.44 in 2022. The regional rural tourism development indices expanded from the range of 0.08 (Xinyu) to 0.37 (Nanchang) in 2008 to 0.23 (Xinyu) to 0.71 (Nanchang) in 2022, achieving 2–3 fold growth over the 15-year period. Notably, a rapid growth phase from 2015 to 2019 was observed, with cities like Nanchang and Jiujiang exhibiting annual growth rates exceeding 7%, which closely aligns with Jiangxi Province’s policy cycle for “quality enhancement and upgrading of rural tourism”.
As the capital city of Jiangxi Province, Nanchang has a significantly higher rural tourism development level (reaching 0.71 in 2022) compared to Xinyu City (0.23). The gap between the two regions reflects the differential impacts of resource endowments and policy effectiveness. Relying on cultural landmarks such as Tengwang Pavilion and natural landscapes like Meiling Mountain, the number of A-level scenic spots in Nanchang increased to 34 in 2019, forming a diversified foundation for rural tourism. The government, through special policies such as the “Nanchang Rural Tourism Quality Improvement and Upgrade Action Plan”, established a rural tourism development fund, with an average annual investment growth of 12%. Moreover, it has built an efficient transportation network leveraging the advantages of the high-speed rail hub.
In contrast, Xinyu City suffers from inherent deficiencies in tourism resources, lacking iconic landscapes. Its rural tourism products have long been dominated by agritainment, with serious product homogenization (the number of key rural tourism villages remained stagnant at 5 from 2008 to 2019). In terms of infrastructure, the number of accommodation enterprises in Nanchang (265) is 17 times that of Xinyu (16), reflecting a huge disparity in capital agglomeration and scale effects. In terms of brand building, Nanchang has enhanced its popularity through activities such as the “Rural Tourism Culture Month”, while Xinyu, due to limited marketing investment (with the average annual tourism promotion funds being less than 15% of Nanchang’s), has difficulty breaking through the limitations of the regional market.
The difference in policy-driven factors is even more significant. Nanchang has incorporated rural tourism into the core of its “14th Five-Year Plan” for culture and tourism, forming a joint-action model of “scenic spots + farmers + cooperatives”. Xinyu, due to its vague industrial positioning, has failed to effectively integrate agricultural and tourism resources, resulting in insufficient momentum for collaborative development. Data comparison shows that Nanchang’s tourism revenue surged from CNY 7.403 billion in 2008 to CNY 124.415 billion in 2019, while Xinyu’s only increased from CNY 0.32 billion to CNY 2.85 billion during the same period. The gap in growth rates reflects the crucial role of policy precision and implementation.
To visually analyze the spatial evolution of rural tourism development in Jiangxi Province, building upon existing research findings [54,55], the development levels are categorized into four phases: budding stage (0–0.25), primary stage (0.25–0.5), intermediate stage (0.5–0.75), and advanced stage (0.75–1.0), as illustrated in Figure 4.
Figure 4 reveals that in 2008, most regions of Jiangxi Province were in the germination stage of rural tourism development. Southern Jiangxi (Ganzhou), northern Jiangxi (Jiujiang, Jingdezhen), eastern Jiangxi (Shangrao, Yingtan, Fuzhou), central Jiangxi (Ji’an, Yichun), and western Jiangxi (Pingxiang, Xinyu) were all in the initial phase of exploring rural tourism development models. Despite varying resource endowments across regions, developmental potentials remained underutilized. By 2012, northern Jiangxi (Nanchang, Jiujiang, Shangrao) along with central and southern regions progressed to the primary stage, while areas like Jingdezhen, Yingtan, Fuzhou (east), Yichun, Xinyu, and Pingxiang (west) continued accumulating foundational elements for tourism development within the germination stage. By 2015, most regions advanced to the primary and intermediate stages, except Pingxiang and Xinyu (west), Yingtan and Fuzhou (east), and Jingdezhen (north). This progression indicates measurable achievements in province-wide rural tourism advancement during this period. The provincial government likely implemented policies promoting rural tourism development, increased infrastructure investments, and enhanced regional efforts in resource integration and exploitation. By 2018, rural tourism development in Jiangxi Province entered a new phase. The Nanchang region in northern Jiangxi reached the intermediate stage, emerging as the provincial leader in rural tourism development. All other regions advanced to the primary stage, demonstrating enhanced development efforts and substantial achievements during this period. Xinyu also attained the primary developmental tier. By 2022, the province witnessed significant improvement in rural tourism development, with Jiujiang, Nanchang, Shangrao (north), and Ganzhou (south) attaining intermediate status, while other regions (except Xinyu in western Jiangxi) maintained primary stage development. This progression signifies the maturation of rural tourism as an industrial form through sustained development. Regional entities have accumulated substantial expertise in development models, tourism product innovation, and marketing strategies, establishing a robust industrial ecosystem for rural tourism. Notably, regional disparities narrowed compared to 2008 levels. This reflects Jiangxi’s commitment to coordinated regional development through policy guidance and resource sharing mechanisms, effectively boosting underdeveloped areas and achieving balanced provincial growth.

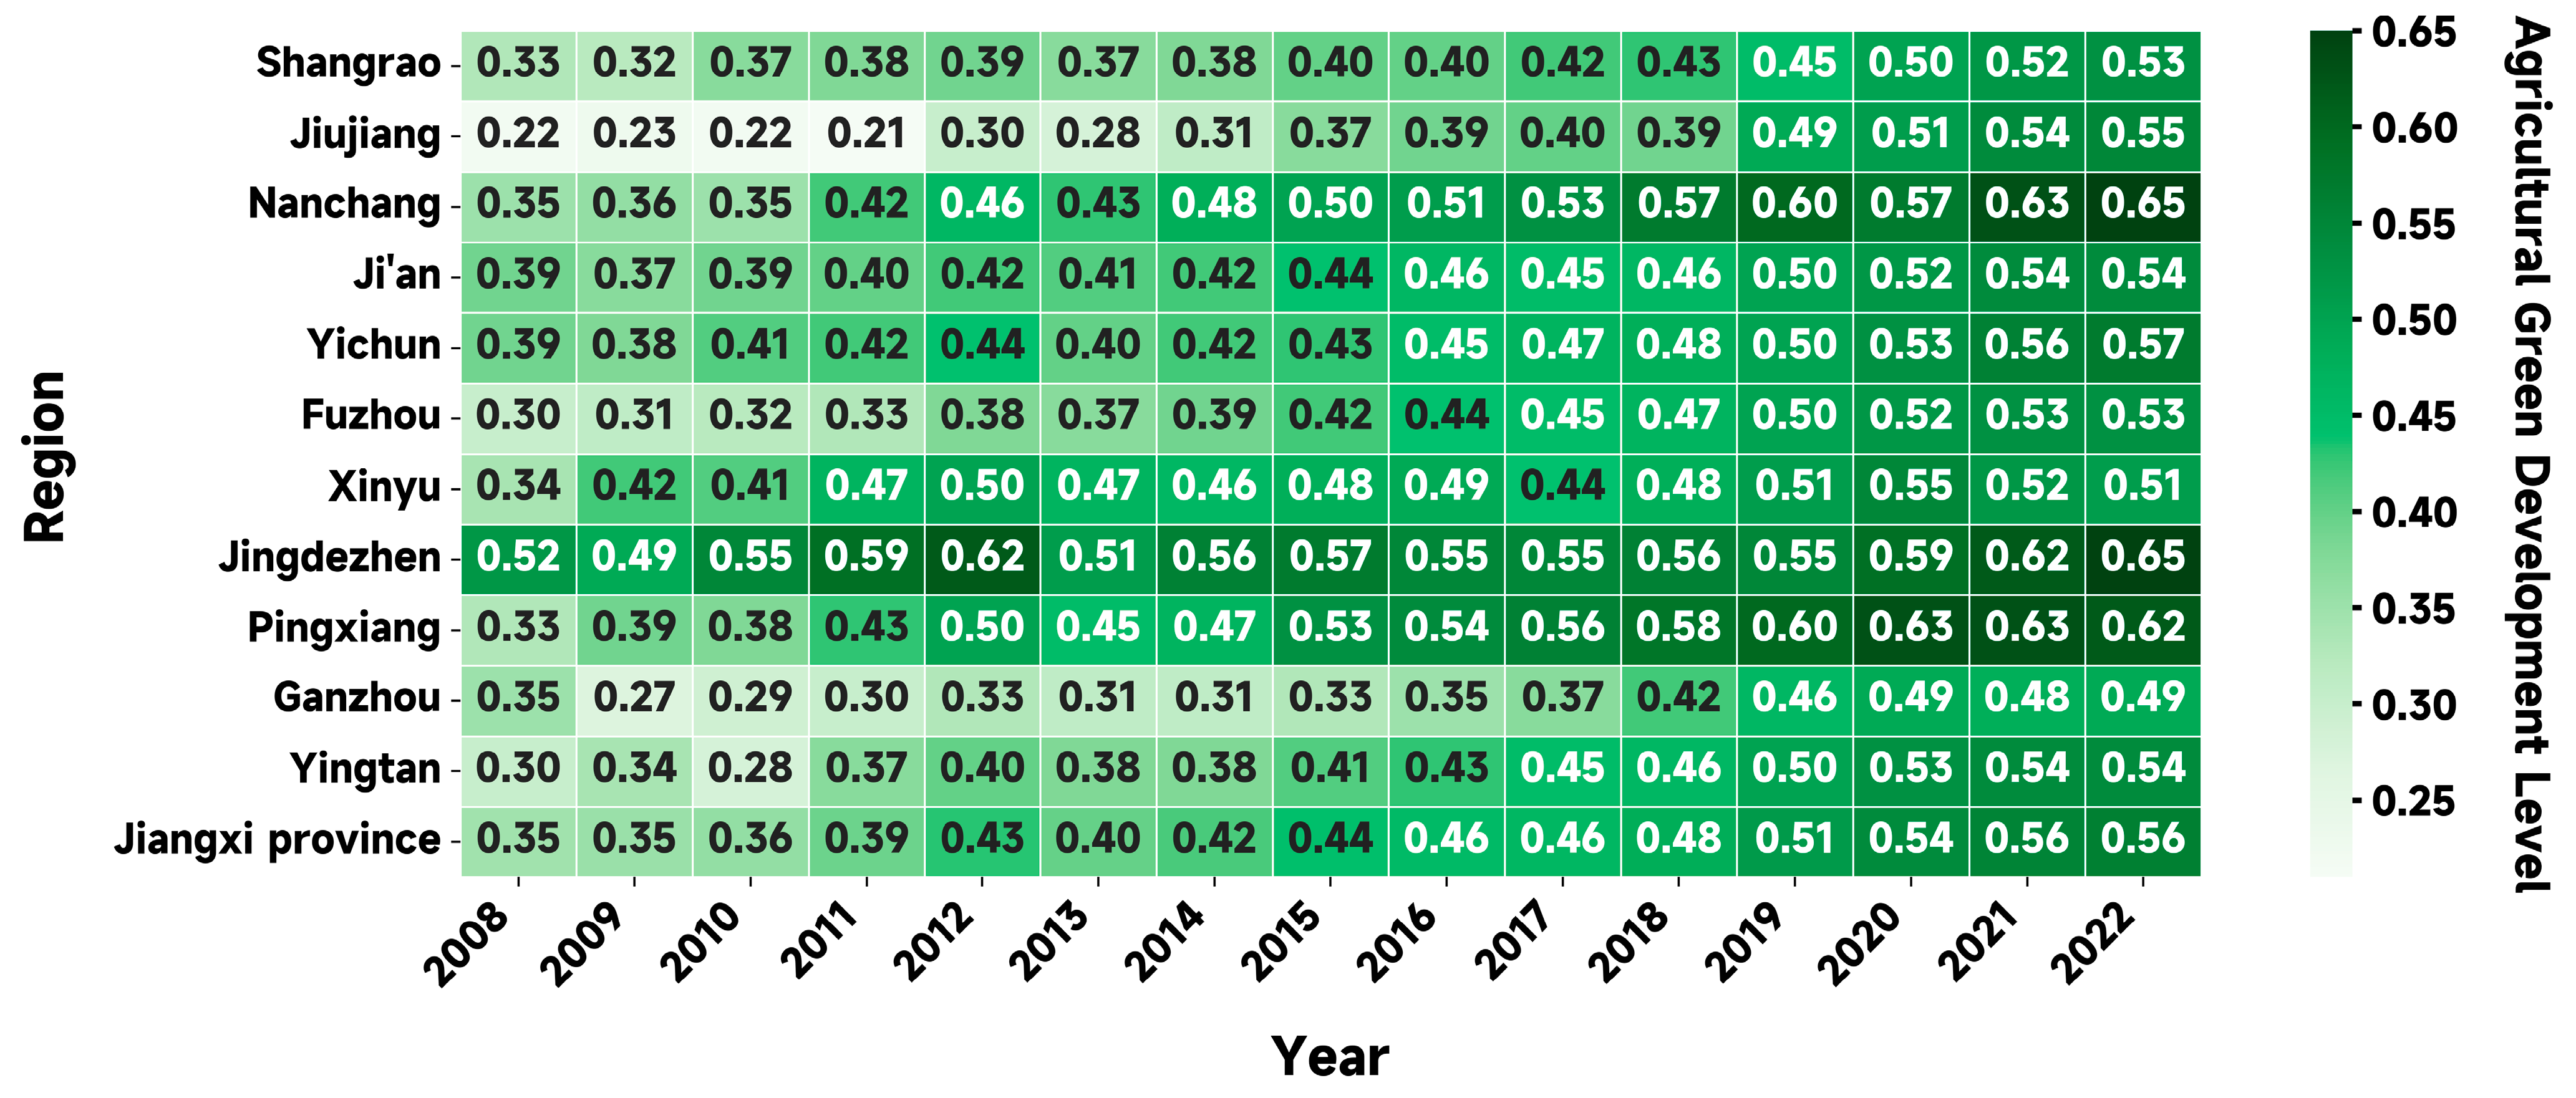
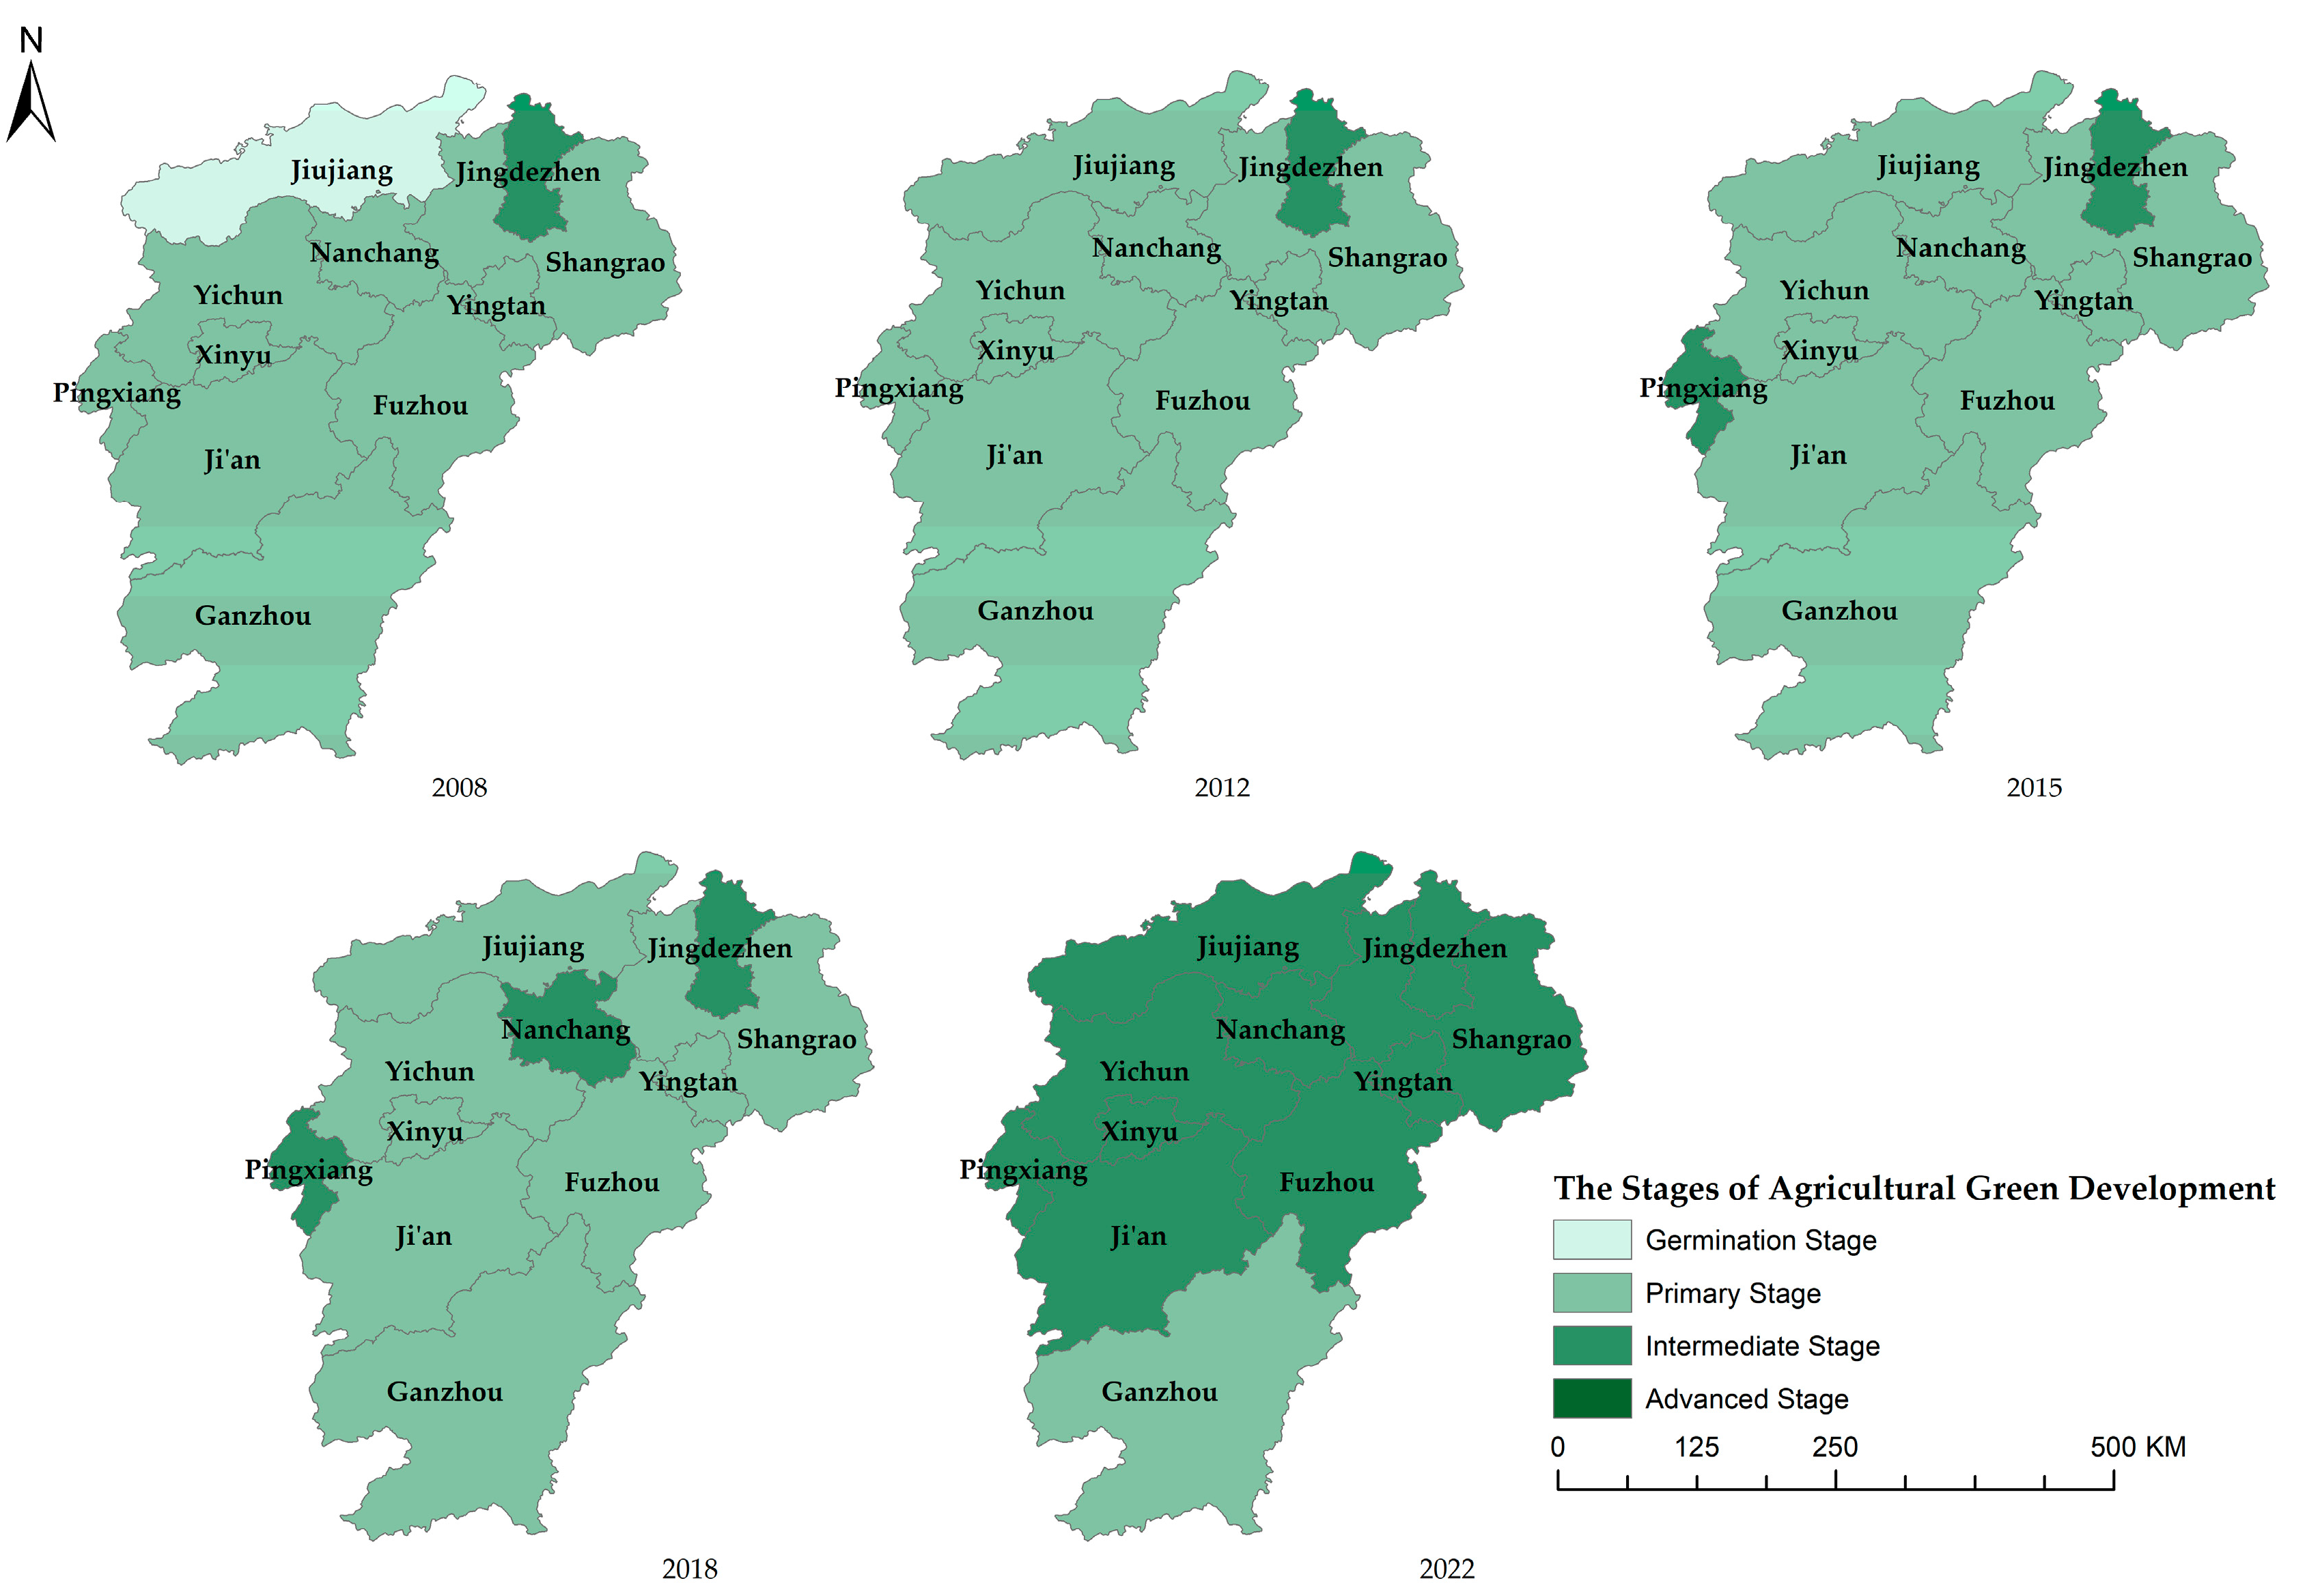
4.1.2. Agricultural Green Development Level

The calculated agricultural green development levels across prefecture-level regions in Jiangxi Province from 2008 to 2022 are shown in Figure 5.
Figure 5 demonstrates that the provincial average development index increased from 0.35 in 2008 to 0.56 in 2022, representing 62.1% growth over 15 years with a 3.4% compound annual growth rate (CAGR). All prefectural cities achieved positive growth, with Jiujiang (150%), Pingxiang (87.9%), and Nanchang (85.7%) exhibiting the highest growth rates. Quality metrics showed the provincial standard deviation decreasing from 0.070 in 2008 to 0.052 in 2022 (25.7% reduction in regional disparity), while the coefficient of variation (standard deviation/mean) declined from 0.20 to 0.09, indicating 55% improvement in developmental stability. The agricultural green development process can be divided into two phases:
Phase I: Policy-Driven Period (2008–2015) with 4.2% annual growth. During this phase, Jiangxi implemented policies including the Poyang Lake Ecological Economic Zone Plan (2009), Ecological Agriculture Demonstration Project (2010), and Regulations on Prevention of Livestock Pollution (2011). Policy effectiveness was evidenced by a 437% increase in green-certified agricultural products (127 to 682 units), 34% reduction in pesticide application intensity (3.2 to 2.1 kg/ha), and 25% improvement in crop straw utilization rate (58% to 83%). Phase II: Quality Enhancement Period (2016–2022) with 2.8% annual growth. Regional analysis revealed Jingdezhen and Nanchang achieving the highest development level (0.65), while Ganzhou trailed at 0.49. This disparity reflects superior policy support, resource allocation, and endogenous advantages (e.g., specialty agriculture industries, environmental technology adoption) in Nanchang and Jingdezhen compared to Ganzhou. Regional variations in development levels stem from differential economic structures, agricultural industry scales, geographical characteristics, and resource endowments. Environmentally conscious regions with higher agricultural productivity demonstrate comparative advantages in green development initiatives.
Similarly, to visually analyze the spatial dynamics of agricultural green development in Jiangxi Province, the development levels are categorized into four stages: germination stage (0–0.25), primary stage (0.25–0.5), intermediate stage (0.5–0.75), and advanced stage (0.75–1.0).
As depicted in Figure 6, initial disparities in agricultural green development levels emerged across Jiangxi Province in 2008. Jingdezhen in northern Jiangxi reached the intermediate stage, demonstrating pioneering advantages in green agricultural development. All regions except Jiujiang were in the primary stage, while Jiujiang remained in the germination stage. By 2012, developmental patterns stabilized, with most regions maintaining their 2008 stages, though Jiujiang in northern Jiangxi advanced to the primary stage. No regions achieved leapfrog progress, with development primarily focused on incremental improvements. In 2015, Pingxiang (western Jiangxi) progressed from primary to the intermediate stage, reflecting targeted policy interventions and accelerated efforts in green agricultural practices. Other regions maintained previous developmental tiers. By 2018, Nanchang (northern Jiangxi) entered the intermediate stage, marking technological and industrial planning advancements that established foundations for future growth. The 2022 landscape witnessed transformative changes, with multiple regions (northern, central, eastern, western Jiangxi) advancing to the intermediate stage, demonstrating province-wide progress driven by sustained policy implementation, technological innovation, and putting sustainable agricultural concepts into practice” in the description of the development process in different regions. Southern Jiangxi (Ganzhou) retained primary stage status, necessitating intensified investments and innovative approaches to accelerate green agricultural development.

4.2. Analysis of Coupling Coordination Degree Results

Based on the constructed coupling coordination degree model, the coordination level between rural tourism and agricultural green development in Jiangxi Province was calculated, as illustrated in the figure below.
As shown in Figure 7, the coupling coordination degree in most regions exhibited an upward trajectory during 2008–2022, indicating measurable progress in Jiangxi Province’s efforts to promote synergistic development between rural tourism and green agriculture.

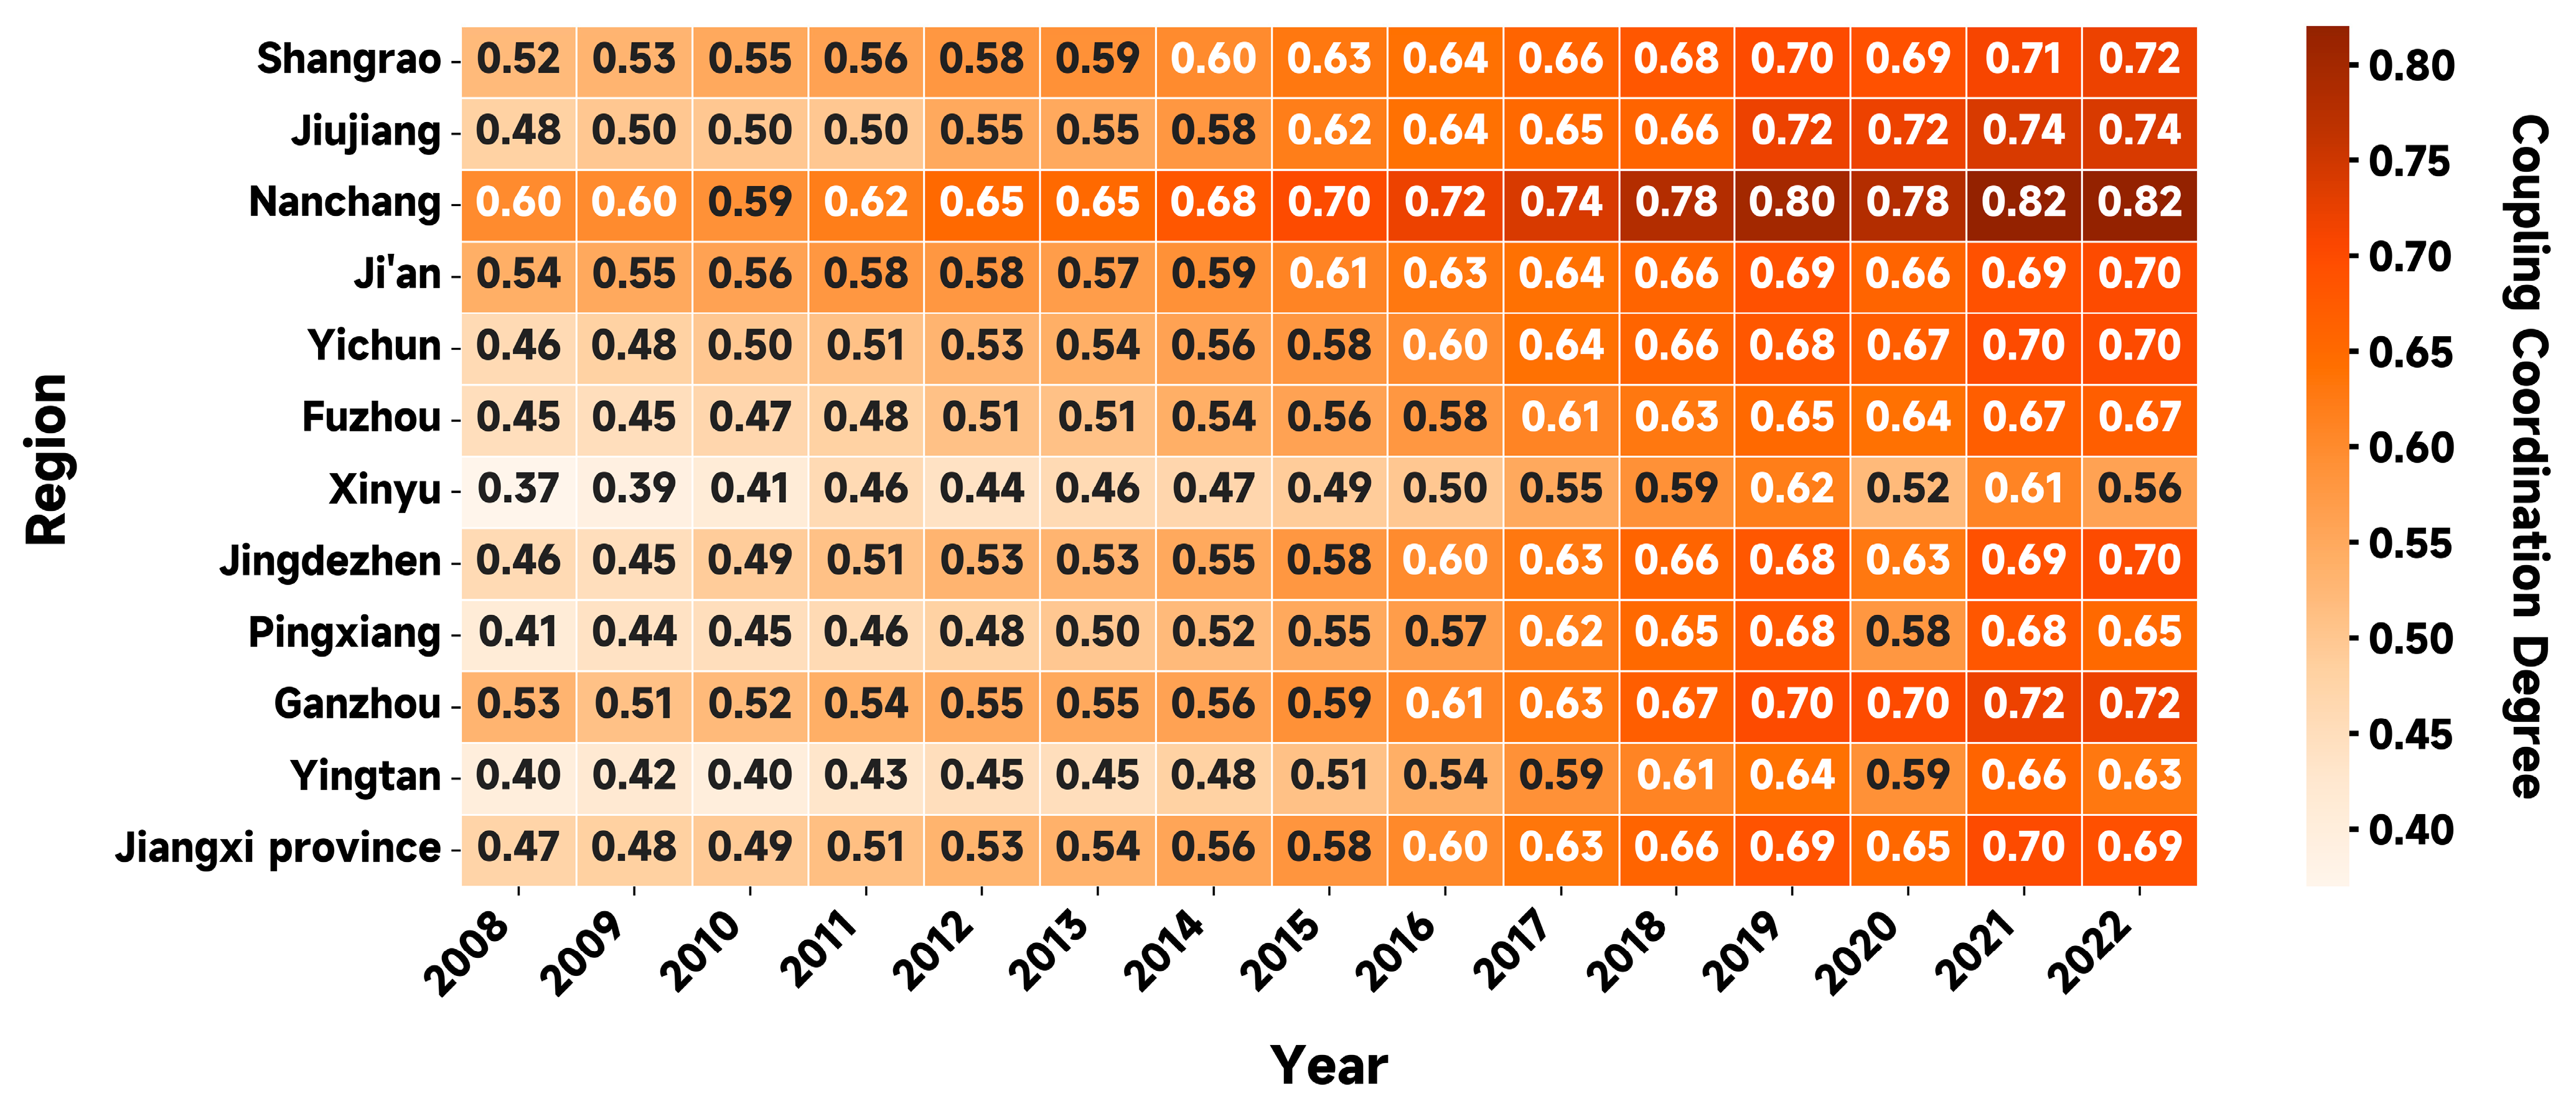
4.2.1. Analysis of the Overall Trend

As shown in Figure 7, the coupling coordination degree in most regions exhibited an upward trajectory during 2008–2022, indicating measurable progress in Jiangxi Province’s efforts to promote synergistic development between rural tourism and green agriculture. This upward trend can be attributed to the combined effects of multiple factors, including continued guidance and support from government policies, increasing societal recognition of the concepts of rural tourism and green agriculture, and stimulus from market demand dynamics.
Figure 7 visually demonstrates the evolutionary pattern of coupling coordination degree between rural tourism and green agricultural development in Jiangxi Province. The 2008–2022 period manifested a general upward trajectory with periodic fluctuations in the coupling coordination degree, which can be delineated into three distinct phases:
(1)
Initial Development Phase (2008–2012): The coupling coordination degree increased from 0.47 in 2008 to 0.53 in 2012. During this exploratory phase of rural tourism and green agricultural development, enhanced awareness of rural resource utilization prompted initial attempts to integrate these sectors in selected regions. The emergence of foundational eco-agricultural tourism initiatives and agritourism services drove synergistic development, resulting in progressive enhancement of the coupling coordination degree.
(2)
Rapid Growth Phase (2013–2019): The coupling coordination degree exhibited accelerated growth from 0.54 to 0.69 during this period. This acceleration was driven by substantial policy support, including governmental initiatives promoting eco-agricultural industries and enhanced rural infrastructure development. Concurrently, market demand dynamics proved pivotal—driven by rising disposable incomes, escalating eco-tourism demand stimulated intensified investments in rural tourism resource development and agricultural green transition, thereby optimizing the coupling coordination mechanism.
(3)
Fluctuation Adjustment Phase (2020–2022): The coupling coordination degree declined to 0.65 in 2020, primarily attributed to the disruptive impact of the COVID-19 pandemic, which severely affected rural tourism through tourist arrival reductions and substantial revenue losses. The stagnation of numerous rural tourism projects weakened the synergistic linkage between agricultural green development and tourism, thereby diminishing their coordination efficacy. A recovery to 0.70 occurred in 2021, followed by a marginal decline to 0.69 in 2022. The 2021 rebound stemmed from tourism market revitalization under normalized epidemic prevention measures, coupled with local governments’ tourism consumption stimulus policies that enhanced sectoral reintegration. The 2022 dip may reflect dual constraints: financial bottlenecks and market competition intensification during tourism recovery, compounded by technological diffusion barriers and industrial upgrading challenges in green agriculture, collectively inducing coordination volatility.
In conclusion, Jiangxi Province’s coupling coordination degree between rural tourism and agricultural green development has demonstrated positive developmental momentum, though persistent challenges require strategic interventions. Future priorities include enhancing policy support mechanisms and increasing fiscal allocations for integrated rural tourism-agriculture initiatives. Furthermore, accelerating technological diffusion in green agriculture through scientific innovation will enhance the service quality and market competitiveness of rural tourism. Concurrently, workforce development initiatives incorporating talent retention strategies must establish institutional safeguards for sectoral convergence, ultimately promoting coordinated and sustainable development trajectories.

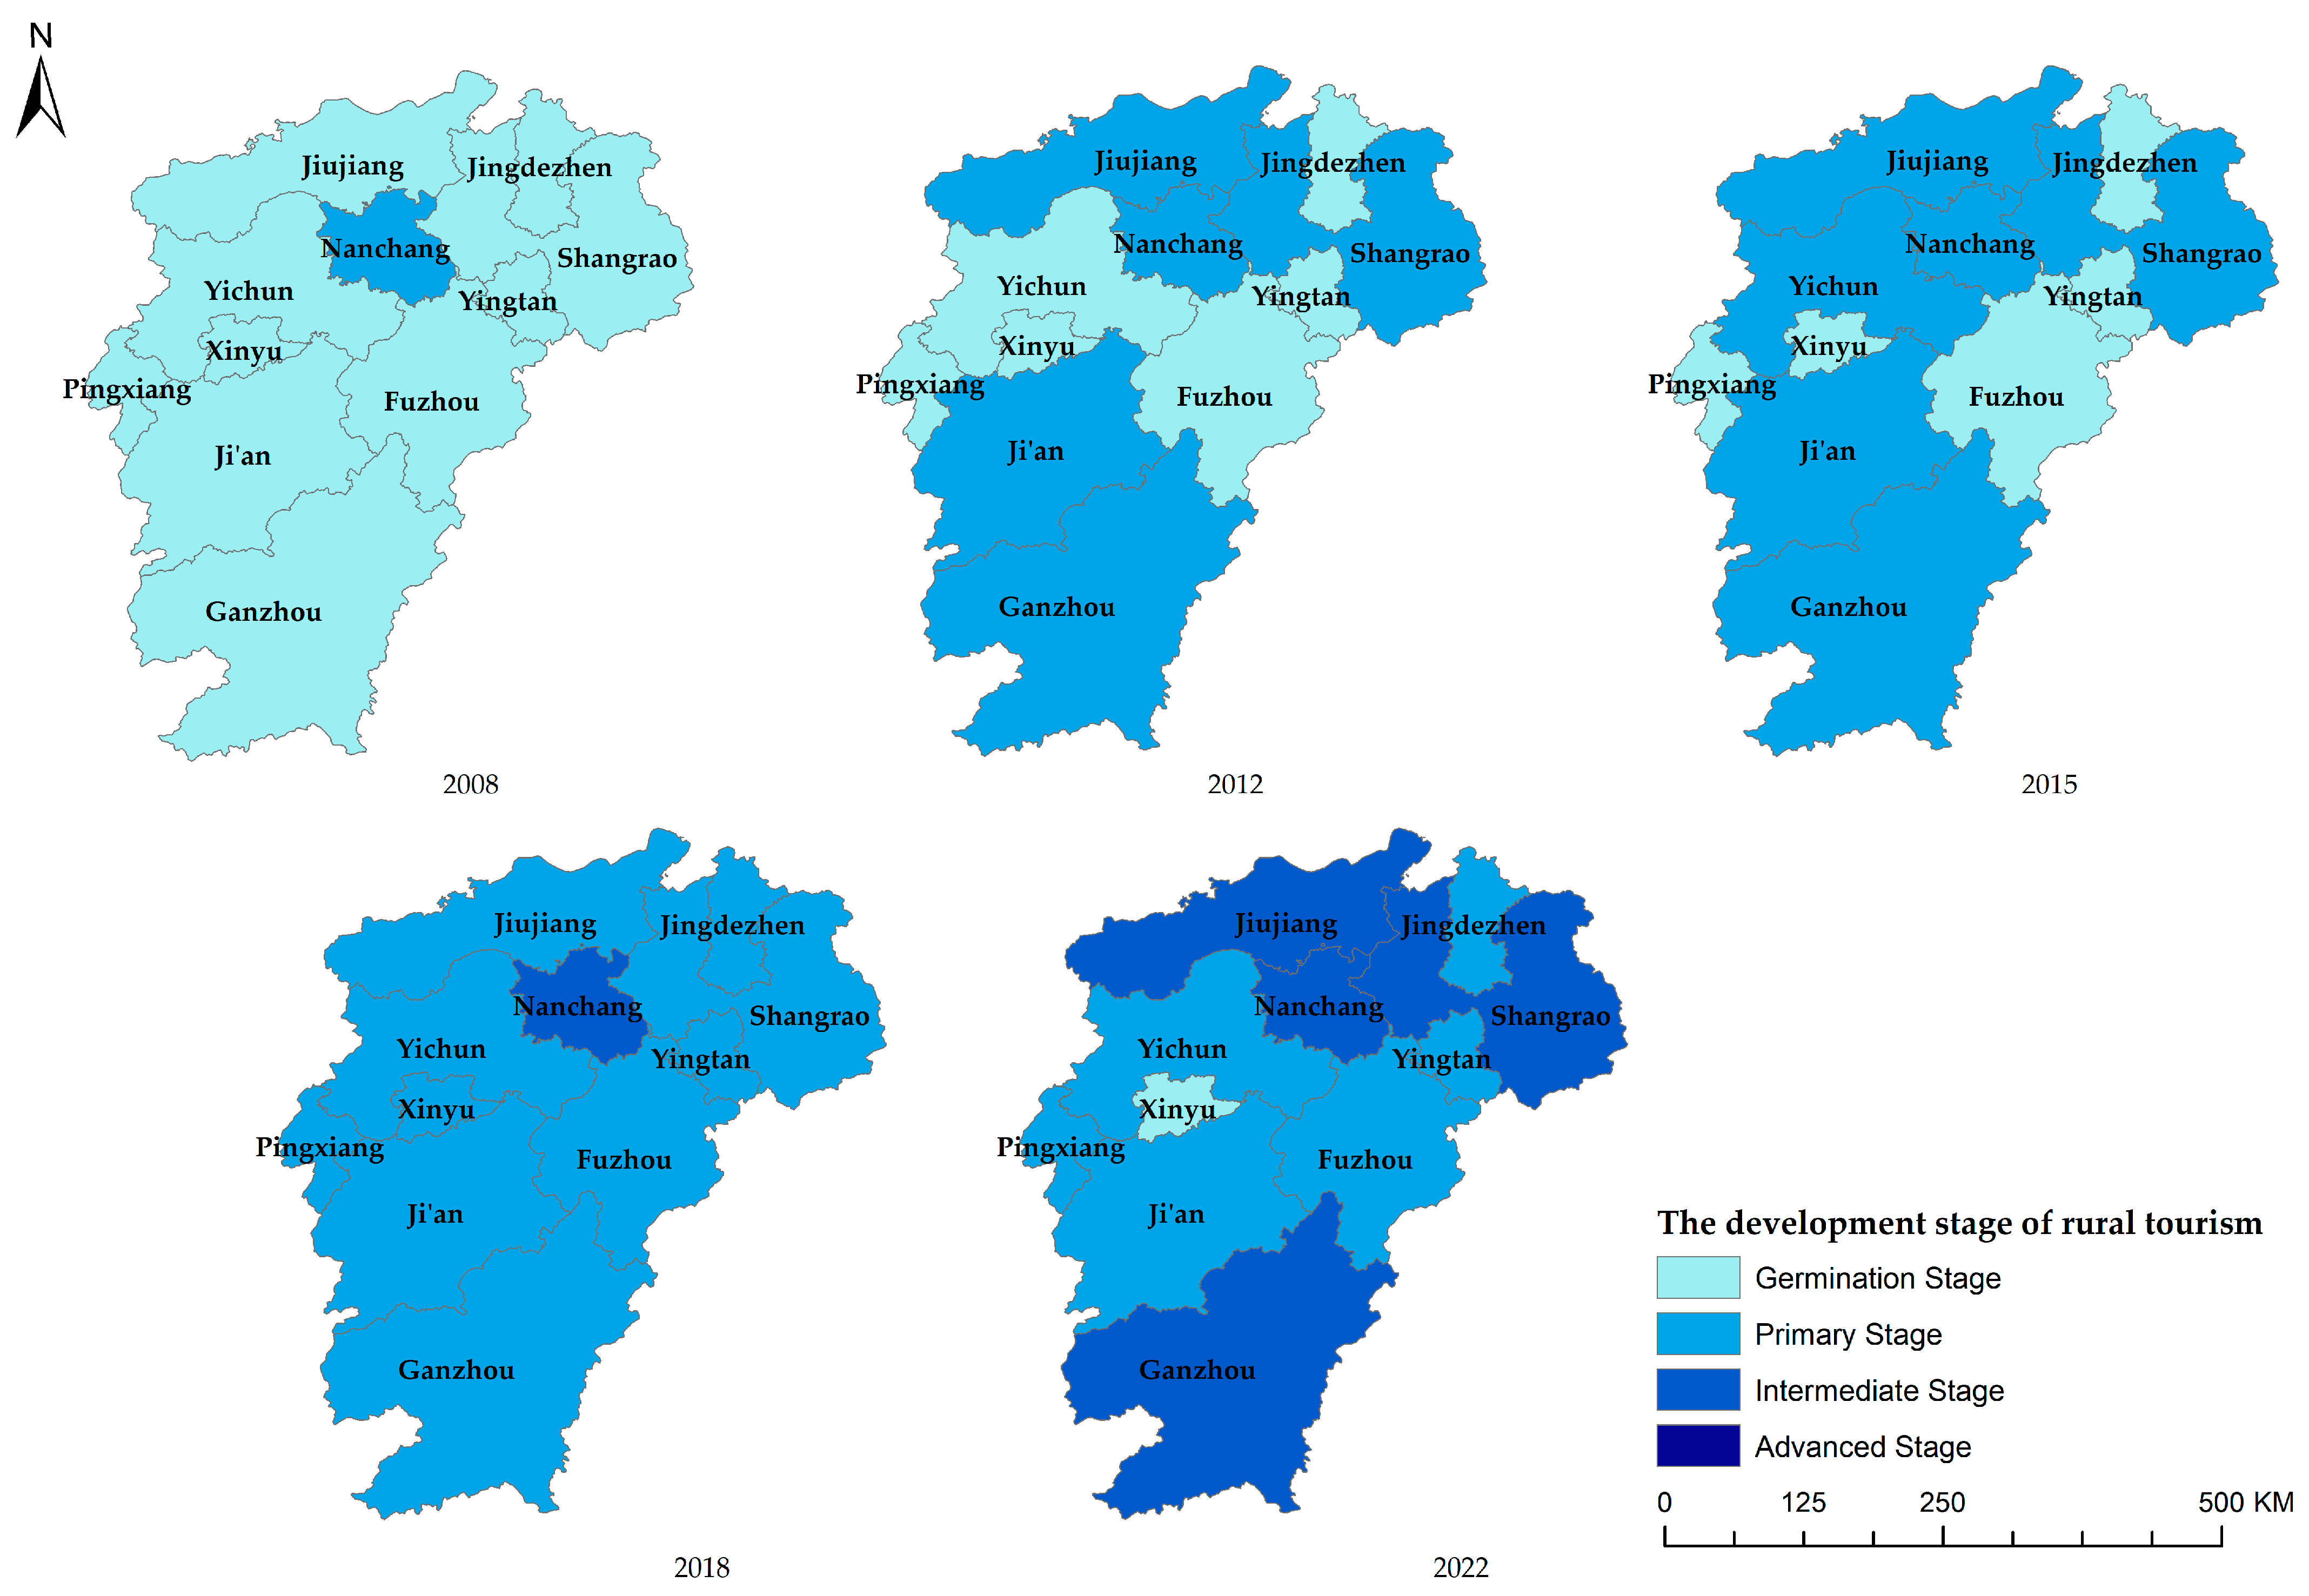
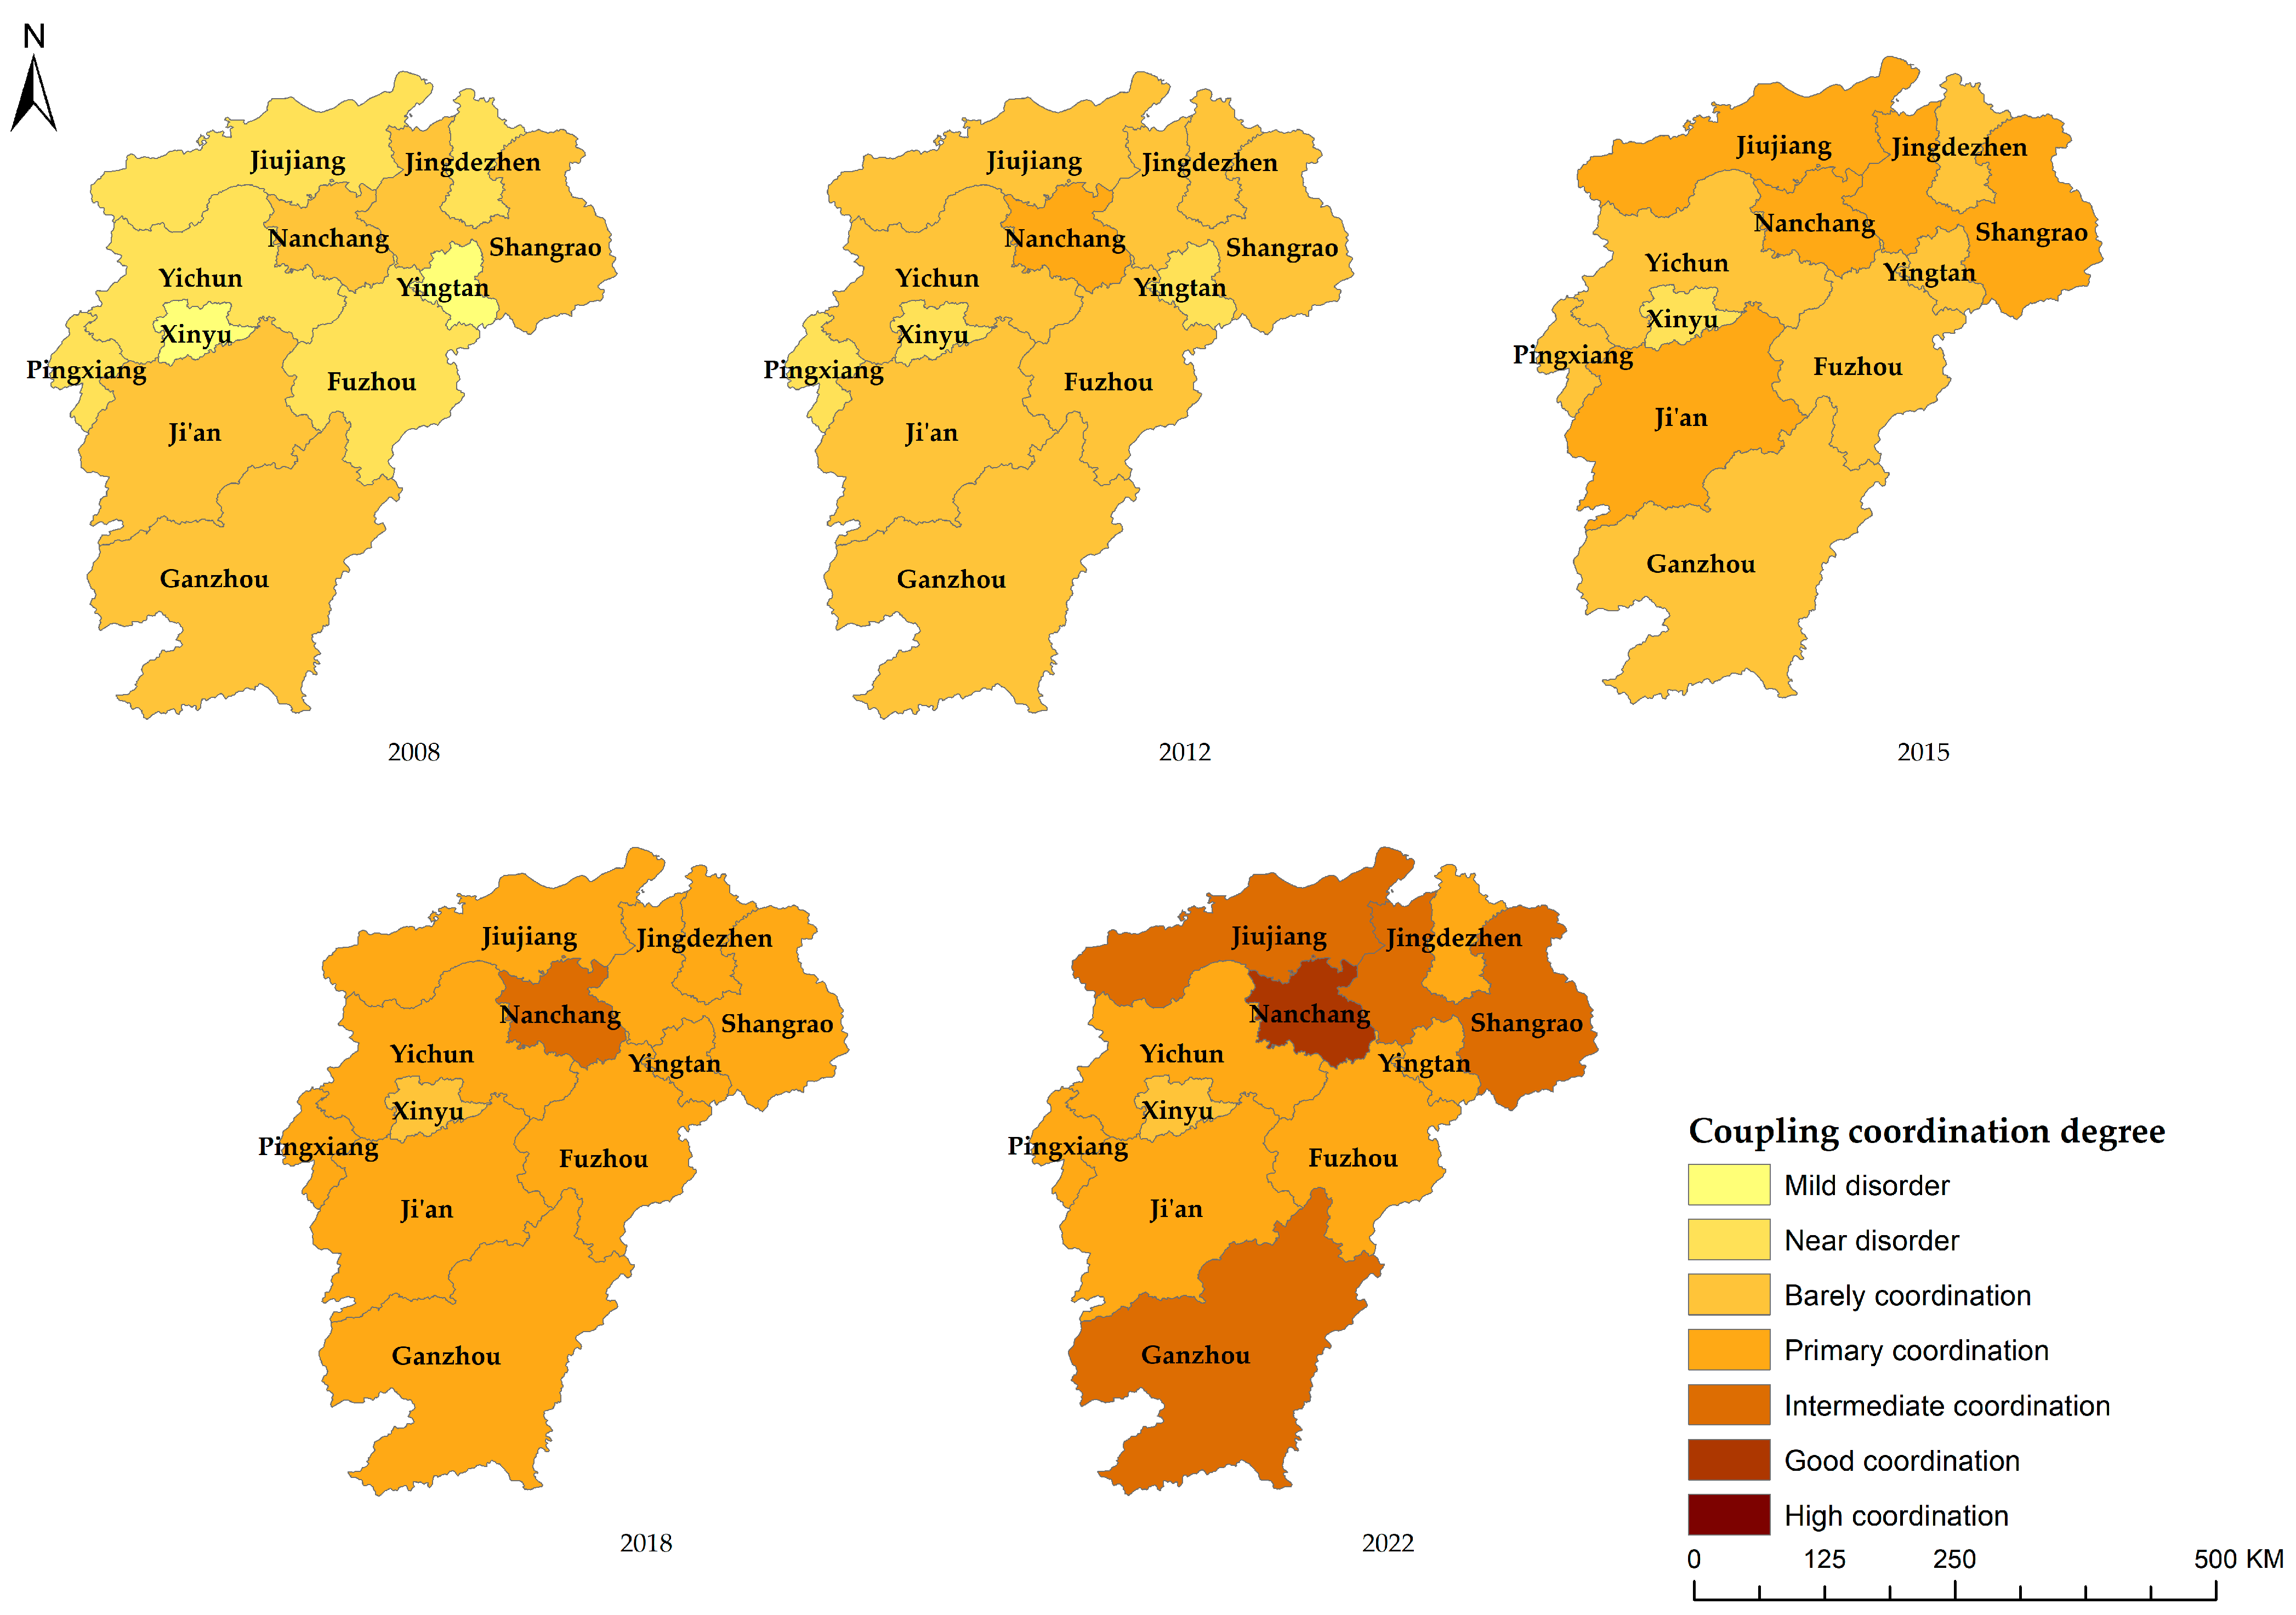
4.2.2. Regional Disparity Analysis

Utilizing the calculated coupling coordination degree values, regional systems in Jiangxi Province were categorized into distinct coordination types based on the classification framework established in Table 1. The spatial visualization (Figure 8) displays seven coordination tiers: mild imbalance, near imbalance, marginal coordination, primary coordination, intermediate coordination, substantial coordination, and advanced coordination. This selection excludes extreme, severe, and moderate imbalance categories, as evidenced by Xinyu City’s baseline coordination degree of 0.37 in 2008 representing the lowest observed value.
From the spatial changes in the coupling coordination degree in Jiangxi Province, it can be seen that there is a gradient differentiation feature of “higher in the north, second-highest in the south, lower in the west, and gently changing in the east”. Regional differences are driven by multiple factors such as resource endowment, policy radiation and spatial lock-in effect. The urban agglomeration around Poyang Lake in the north (Nanchang, Jiujiang, Jingdezhen), relying on the advantages of rich ecological resources and early start policies, has formed a high-value radiation core. As a growth pole, Nanchang’s coupling coordination degree has leaped from primary coordination in 2008 to good coordination in 2022. Through the “scenic-area-driving-village” model, it deeply integrates ecological agriculture with red tourism, driving Jiujiang and Yichun to form a high-value synergy belt.
The Ganzhou-Ji’an plate in the south is restricted by hilly terrain and industrial foundation, showing a “mid-section collapse” feature. Although the former Central Soviet Area in southern Jiangxi is rich in red resources, the penetration rate of agricultural green technology is insufficient (in 2022, the amount of pesticides used per unit area was 18% higher than the provincial average), resulting in a tourism-income-feeding-back-to-agriculture rate of only 32%, and the coordination degree has long hovered at barely coordination. The Xinyu-Pingxiang-Yingtan corridor in the west has fallen into the “low-level equilibrium trap”, with the average value of the coupling coordination degree hovering between mild disorder and barely coordination (0.37–0.56), less than 65% of that in the northern core area. Xinyu shows typical “double lag”. Rural tourism has long remained in the embryonic stage (the number of A-level scenic spots has not exceeded 5 in 15 years), and the green transformation of agriculture is restricted by the shortage of financial investment, forming a negative cycle of “insufficient resource development → weak market attractiveness → difficult capital accumulation”.
This spatial differentiation reveals the deep-seated interaction between geographical capital and institutional supply. Location-hub cities amplify policy dividends through the externality of transportation networks, while marginal areas are trapped in a negative cycle of “low resource density-weak policy response”. To analyze this spatial correlation mechanism more deeply, this paper will use a spatial econometric model to further deconstruct the agglomeration effect and spillover paths (see Section 4.3 for details).

4.3. Spatial Correlation Analysis

To investigate spatial interdependencies between rural tourism and green agricultural development coordination in Jiangxi Province, this study conducted global spatial autocorrelation analysis across all observation years, complemented by local spatial correlation examination of 2022’s coupling coordination degree data at regional level.

4.3.1. Global Correlation Analysis

As delineated in Table 4, the global analysis reveals statistically significant positive Moran’s I values throughout the 2008–2022 study period (I-statistic: 0.15→0.31), confirming persistent spatial autocorrelation. The spatial agglomeration effects exhibited progressive intensification, though post-2018 fluctuations occurred due to convergence of low-value clusters, while maintaining overall high-level spatial dependence.

4.3.2. Local Spatial Correlation Analysis

The LISA analysis of coupling coordination degrees across Jiangxi’s regions (2022) in Table 5 reveals the following: HH (High-High clustering) indicates core areas with high values surrounded by high-value neighbors; LL (Low-Low) denotes underdeveloped zones with mutual low values; LH (Low-High) signals value depressions amidst high-value peripheries; HL (High-Low) represents development poles encircled by low-value regions; NS (Not Significant) denotes insignificant spatial associations. Nanchang, Jiujiang, and Yichun emerged as core growth poles propelling regional synergistic development. This regions exhibit convergent patterns in transport infrastructure and sectoral indicators. Nanchang’s high-speed rail network (e.g., Fuzhou–Nanchang intercity line) reduced travel time to rural tourism clusters by 40%, while Jiujiang’s Yangtze River port logistics hub enabled cold-chain transportation of green agricultural products (e.g., Poyang Lake freshwater fish). In green agriculture, Yichun achieved 89% agricultural plastic film recovery rate and 32% organic crop coverage, facilitated by EU-funded precision irrigation projects. The “Low-Low” (LL) agglomeration areas centered around Pingxiang, Xinyu, and Yingtan, constrained by weak infrastructure and lagging green technologies, find it difficult to benefit from the development dividends of neighboring high-coordination regions, thus forming a “development lock-in” effect. In addition, these regions have long been faced with the problem of weak policy connectivity, and the lack of a unified regional development plan has led to insufficient resource integration.
Pingxiang, Xinyu, and Yingtan constituted “developmental depressions” requiring targeted policy interventions. For example, the low CCD in Xinyu City is attributed to the triple-overlapping effects of regression in rural tourism (being locked in the germination stage), weak agricultural green transformation, and lack of spatial synergy. In essence, it is a systematic blockage of “insufficient resource development-technological lag-weak policy support-lack of regional linkage”, which has caused the two major systems to develop in isolation at a low level for a long time.
Concurrently, spatial anomalies were observed: Ji’an (LH) exhibited low coordination despite high-value surroundings, likely attributable to its mono-industrial structure; Fuzhou (HL) maintained high internal values yet suffered from low-value neighborhood effects, necessitating enhanced cross-regional cooperation mechanisms.
The spatial agglomeration effects peaked in 2018 (Moran’s I = 0.312), followed by marginal attenuation due to catch-up effects in low-value regions, while maintaining persistent positive spatial dependence. Regionally, high-value clusters demonstrated diffusion dynamics, with the Nanchang-Jiujiang-Yichun triangle exhibiting annually expanding developmental radiation, driving coordinated growth in Shangrao and Fuzhou post-2015. Concurrently, persistent low-value clustering emerged in the Pingxiang-Xinyu-Yingtan corridor, demanding institutional innovation to overcome path-dependent developmental constraints.

5. Conclusions and Recommendations

5.1. Principal Conclusions

This study systematically reveals the spatiotemporal evolution patterns of coupling coordination between rural tourism and agricultural green development in Jiangxi Province through constructing a three-dimensional rural tourism evaluation system (market performance-facility services-resource endowment) and a trinity agricultural green development index system (resource conservation-environmental friendliness-high efficiency output). Methodologically, we develop a multi-scale spatiotemporal analytical framework integrating entropy method, coupling coordination degree model, and spatial autocorrelation analysis, overcoming the limitations of conventional static cross-sectional approaches. Empirically, we identify the radiation effects in high-value synergistic zones (Nanchang-Jiujiang-Yichun triangle) and spatial viscosity effects in low-value locked zones (Pingxiang-Xinyu-Yingtan corridor), confirming the interaction mechanisms between geographical capital and institutional supply. The findings provide theoretical references for major agricultural provinces to resolve the synergistic dilemma between agricultural green transition and rural tourism revitalization.
This study is constrained by prefecture-level panel data (2008–2022), thus failing to capture the dynamic impact mechanisms of micro-agent behaviors on coupling coordination. Future research should establish a multi-source heterogeneous data fusion framework to analyze the coupling coordination mechanisms between rural tourism and green agriculture at both macro and micro levels.

5.2. Policy Recommendations

5.2.1. Policy Optimization Framework

Policy instruments play a pivotal role in orchestrating the coupled coordination between rural tourism and green agricultural development. Governments should formulate differentiated, targeted, and sustainable policies aligned with regional developmental gradients and localized demands. For low-coordination regions (e.g., Xinyu, Yingtan, Pingxiang), infrastructure deficits and technological gaps constitute critical constraints. Governments should establish special development funds to amplify fiscal allocations, prioritizing [56] rural tourism infrastructure upgrades in Xinyu, including road networks and utility systems (water/electricity) to enhance accessibility and visitor experience and green agricultural modernization in Yingtan through advanced integrated pest management technologies to reduce agrochemical inputs and improve product quality [46]. These interventions will establish foundational support systems for industrial upgrading.
Moderately coordinated regions (e.g., Yichun, Fuzhou, Ji’an, Jingdezhen) require policy focus on industrial innovation catalysis. Yichun’s geothermal resources could be leveraged to develop hot spring wellness-agritourism hybrids, expanding tourism value chains. Jingdezhen, as a ceramic cultural hub, should integrate porcelain heritage with agricultural creative industries through ceramic-themed agritourism, experiential farming programs, and artisanal product packaging design to enhance value-added dimensions. High-coordination clusters (Nanchang, Shangrao, Jiujiang, Ganzhou) should be propelled towards brand internationalization and smart development paradigms. Nanchang could establish smart rural tourism platforms utilizing big data analytics and AI-driven solutions for intelligent resource management and precision marketing. Shangrao’s unique natural-cultural assets should be harnessed to develop UNESCO-standard rural tourism destinations, enhancing global competitiveness through strategic international visitor attraction programs.

5.2.2. Deepening Industrial Convergence

Industrial convergence constitutes the core pathway for enhancing rural tourism-agriculture coupling coordination. Region-specific resource endowments should drive innovative integration models. Industrial convergence constitutes the core pathway for enhancing rural tourism-agriculture coupling coordination. Region-specific resource endowments should drive innovative integration models. This model enables visitors to explore industrial relics while engaging in pastoral landscapes and agrarian experiences, creating distinctive tourism value propositions [24]. Yingtan City, leveraging its strategic transportation hub status, should establish integrated logistics-tourism complexes. These facilities would allow tourists to observe modern agricultural supply chain operations in logistics parks, participate in farm-to-market experiential programs, and access fresh specialty produce, achieving logistics-tourism symbiosis. Pingxiang City’s ecological advantages and cultural richness warrant the development of forest therapy resorts and immersive folk culture experiences. Initiatives include constructing forest therapy bases offering shinrin-yoku (forest bathing) and wellness cuisine, alongside cultural festivals showcasing traditional handicraft production processes for authentic folk immersion. Yichun should expand beyond geothermal tourism to agricultural therapy and value-added processing sectors, cultivating geothermal-irrigated specialty crops and implementing agro-processing workshops enabling tourists to create artisanal food products. Jingdezhen City should pioneer ceramic-agricultural convergence through interactive porcelain crafting and agrarian-themed art workshops and STEM-focused study programs integrating ceramic heritage with agricultural innovation systems [57].

5.2.3. Enhancing Inter-Regional Coordination

Coordinated regional development serves as a critical mechanism for narrowing developmental gradients while fostering holistic synergy between rural tourism and green agricultural systems.
(1)
Enhancing high-value clusters’ developmental radiation: The Nanchang-Jiujiang-Yichun core cluster should maximize its spatial spillover effects through constructing collaborative development networks, establishing cross-regional collaboration platforms to integrate tourism routes and enable resource co-sharing mechanisms [15]. Specific interventions include establishing model rural tourism zones, jointly promoting tourism portfolios, and creating unified destination branding systems [41]. Digital governance platforms should be implemented for real-time monitoring of resource flows and coordination dynamics, employing big data analytics to optimize allocation efficiency and enhance collaborative governance performance. As the provincial capital, Nanchang must strengthen its hub functionality by upgrading integrated service capabilities. Strategic support should be directed towards developing Shangrao and Fuzhou as logistical hubs, intensifying connectivity with high-value clusters to facilitate interregional resource circulation, thereby empowering secondary nodal regions and stimulating peripheral development.
(2)
Overcoming developmental bottlenecks in low-value clusters: Regions including Pingxiang, Xinyu, and Yingtan confront infrastructural deficiencies and green technology gaps requiring targeted interventions. Strategic prioritization should be given to constructing high-speed rail networks and cold-chain logistics systems for agricultural products, effectively reducing spatiotemporal barriers with high-value clusters while enhancing preservation capacity and logistics efficiency [58,59]. Yingtan should establish smart agriculture demonstration zones deploying water-efficient irrigation and organic cultivation technologies to model sustainable agricultural practices. Instituting the Western Jiangxi Green Development Fund would provide tax incentives and technological subsidies to enterprises in low-value clusters, catalyzing industrial revitalization. Implementing market-based ecological compensation mechanisms would financially reward villages adopting conservation-oriented development models, incentivizing synergistic economic-ecological progress.
(3)
Resolving spatial mismatches: Ji’an and Fuzhou, as spatial outliers, need optimized inter-regional linkages to improve coordinated development. Ji’an should co-develop red tourism-ecoagriculture industrial chains with Ganzhou, leveraging Ganzhou’s high-coordination assets like Hakka cultural IP to create distinctive integrated products, thereby augmenting value-added potential. University-enterprise partnerships between Nanchang’s academic institutions and Ji’an’s industries should be encouraged to advance green agritech R&D and talent pipelines. Fuzhou should capitalize on its comparative advantages by collaborating with Nanchang to establish the Fuhe Ecological Corridor, cultivating water-based tourism and leisure agriculture [19]. Cross-regional coordination should mitigate drag effects from low-value adjacent areas like Yingtan and Ganzhou. Concurrently, geographical indication (GI) brands (e.g., Fuzhou White Tea, Guangchang Lotus Seeds) should be established through intensified marketing campaigns to boost product premiumization and regional competitiveness. These strategies are projected to progressively narrow regional disparities, actualizing pan-provincial high-quality synergy between rural tourism and green agricultural systems in Jiangxi.

Author Contributions

Conceptualization, L.W. and F.L.; methodology F.L. and J.G.; software, F.L.; validation, F.L.; formal analysis, F.L.; investigation, F.L.; resources, F.L.; data curation, F.L.; writing—original draft preparation, F.L.; writing—review and editing, F.L.; visualization, J.G.; supervision, L.W.; project administration, J.G.; funding acquisition, L.W. and Y.L. All authors have read and agreed to the published version of the manuscript.

Funding

This research was funded by the National Science Foundation of China, the Humanities and Social Sciences Planning Project of the Ministry of Education and Social Sciences in Jiangxi Province’s Universities under Grant Nos. 42261038, 21YJAZH085 and SZZX24099.

Institutional Review Board Statement

Not applicable.

Data Availability Statement

The raw data supporting the conclusions of this article will be made available by the authors on request.

Conflicts of Interest

The authors declare no conflicts of interest.

References

  1. Intergovernmental Panel on Climate Change (IPCC) (Ed.) Climate Change 2022—Mitigation of Climate Change: Working Group III Contribution to the Sixth Assessment Report of the Intergovernmental Panel on Climate Change; Cambridge University Press: Cambridge, UK, 2023. [Google Scholar]
  2. Reganold, J.P.; Glover, J.D.; Andrews, P.K.; Hinman, H.R. Sustainability of Three Apple Production Systems. Nature 2001, 410, 926–930. [Google Scholar] [CrossRef]
  3. Springmann, M.; Clark, M.; Mason-D’Croz, D.; Wiebe, K.; Bodirsky, B.L.; Lassaletta, L.; de Vries, W.; Vermeulen, S.J.; Herrero, M.; Carlson, K.M.; et al. Options for Keeping the Food System within Environmental Limits. Nature 2018, 562, 519–525. [Google Scholar] [CrossRef]
  4. Lipper, L.; Thornton, P.; Campbell, B.M.; Baedeker, T.; Braimoh, A.; Bwalya, M.; Caron, P.; Cattaneo, A.; Garrity, D.; Henry, K.; et al. Climate-Smart Agriculture for Food Security. Nat. Clim. Chang. 2014, 4, 1068–1072. [Google Scholar] [CrossRef]
  5. Zhang, Q.; Qu, Y.; Zhan, L. Great Transition and New Pattern: Agriculture and Rural Area Green Development and Its Coordinated Relationship with Economic Growth in China. J. Environ. Manag. 2023, 344, 118563. [Google Scholar] [CrossRef] [PubMed]
  6. Cheng, L.; Gao, Y.; Dai, X. Spatio-Temporal Comprehensive Measurement of China’s Agricultural Green Development Level and Associated Influencing Factors. PLoS ONE 2023, 18, e0288599. [Google Scholar] [CrossRef]
  7. Struik, P.C.; Kuyper, T.W. Sustainable Intensification in Agriculture: The Richer Shade of Green. A Review. Agron. Sustain. Dev. 2017, 37, 39. [Google Scholar] [CrossRef]
  8. Wang, S. The Positive Effect of Green Agriculture Development on Environmental Optimization: Measurement and Impact Mechanism. Front. Environ. Sci. 2022, 10, 1035867. [Google Scholar] [CrossRef]
  9. Li, Z.; Hu, K.; Shi, Q. The Influence of Digital Village Construction on Agricultural Green Development-Based on the Mediate Role of Industrial Structure Upgrading. Front. Sustain. Food Syst. 2025, 8, 1538845. [Google Scholar] [CrossRef]
  10. Liu, D.; Zhu, X.; Wang, Y. China’s Agricultural Green Total Factor Productivity Based on Carbon Emission: An Analysis of Evolution Trend and Influencing Factors. J. Clean. Prod. 2021, 278, 123692. [Google Scholar] [CrossRef]
  11. Liu, Y.; Sun, D.; Wang, H.; Wang, X.; Yu, G.; Zhao, X. An Evaluation of China’s Agricultural Green Production: 1978–2017. J. Clean. Prod. 2020, 243, 118483. [Google Scholar] [CrossRef]
  12. Chen, Z.; Li, X.; Xia, X. Measurement and Spatial Convergence Analysis of China’s Agricultural Green Development Index. Environ. Sci. Pollut. Res. Int. 2021, 28, 19694–19709. [Google Scholar] [CrossRef] [PubMed]
  13. Li, C.; Fang, Y.; Wang, Y.; Xu, Y.; Zong, Z.; Yang, Y.; Wang, C.; Ou, Z.; Wang, M. How Can Tourism Help to Revitalize the Countryside? Content Analysis Based on the Case of Tourism Enabling Rural Revitalization. Environ. Dev. Sustain. 2024, 26, 20333–20354. [Google Scholar] [CrossRef]
  14. Hall, C.M. Constructing Sustainable Tourism Development: The 2030 Agenda and the Managerial Ecology of Sustainable Tourism. J. Sustain. Tour. 2019, 27, 1044–1060. [Google Scholar] [CrossRef]
  15. Liu, J.; Nijkamp, P.; Lin, D. Urban-Rural Imbalance and Tourism-Led Growth in China. Ann. Tour. Res. 2017, 64, 24–36. [Google Scholar] [CrossRef]
  16. Chu, L.; Oloo, F.; Chen, B.; Xie, M.; Blaschke, T. Assessing the Influence of Tourism-Driven Activities on Environmental Variables on Hainan Island, China. Remote Sens. 2020, 12, 2813. [Google Scholar] [CrossRef]
  17. Gao, J.; Wu, B. Revitalizing Traditional Villages through Rural Tourism: A Case Study of Yuanjia Village, Shaanxi Province, China. Tour. Manag. 2017, 63, 223–233. [Google Scholar] [CrossRef]
  18. Xu, H.; Huang, X.; Zhang, Q. Tourism Development and Local Borders in Ancient Villages in China. J. Destin. Mark. Manag. 2018, 9, 330–339. [Google Scholar] [CrossRef]
  19. Bürgi, M.; Verburg, P.H.; Kuemmerle, T.; Plieninger, T. Analyzing Dynamics and Values of Cultural Landscapes. Landsc. Ecol. 2017, 32, 2077–2081. [Google Scholar] [CrossRef]
  20. Wang, L.; Li, N.; Xie, Q. Dynamic Evolution and Obstacle Factor Analysis of Green Development in China’s Agriculture and Rural Areas Based on Entropy-Based TOPSIS Model. Heliyon 2024, 10, e27248. [Google Scholar] [CrossRef]
  21. Shao, J.; Zhang, L.; Cai, C. Dynamic Evolution and Spatial Spillover Effect of Agricultural Green Development on Eight Economic Regions in China. Heliyon 2024, 10, e33188. [Google Scholar] [CrossRef]
  22. Nurlaela, S.; Mursito, B.; Shodiq, M.F.; Hadi, P.; Rahmawati, R. Economic Empowerment of Agro Tourism. J. Asian Financ. Econ. Bus. 2021, 8, 741–748. [Google Scholar] [CrossRef]
  23. Pan, S.-Y.; Gao, M.; Kim, H.; Shah, K.J.; Pei, S.-L.; Chiang, P.-C. Advances and Challenges in Sustainable Tourism toward a Green Economy. Sci. Total Environ. 2018, 635, 452–469. [Google Scholar] [CrossRef]
  24. Khanal, A.; Khanal, A.; Basnet, F.; Joshi, S.; Giri, S. Agro-Tourism in Nepal: Assessment of Economic, Cultural, and Environmental Impact. Humanit. J. 2024, 1, e2024007. [Google Scholar] [CrossRef]
  25. Wang, Y.; Zhao, Z.; Xu, M.; Tan, Z.; Han, J.; Zhang, L.; Chen, S. Agriculture–Tourism Integration’s Impact on Agricultural Green Productivity in China. Agriculture 2023, 13, 1941. [Google Scholar] [CrossRef]
  26. Yang, B.; Li, Y.; Wang, M.; Liu, J. Nonlinear Nexus between Agricultural Tourism Integration and Agricultural Green Total Factor Productivity in China. Agriculture 2024, 14, 1386. [Google Scholar] [CrossRef]
  27. Jiang, G. How Does Agro-Tourism Integration Influence the Rebound Effect of China’s Agricultural Eco-Efficiency? An Economic Development Perspective. Front. Environ. Sci. 2022, 10, 921103. [Google Scholar] [CrossRef]
  28. Wang, J.; Zhou, F.; Xie, A.; Shi, J. Impacts of the Integral Development of Agriculture and Tourism on Agricultural Eco-Efficiency: A Case Study of Two River Basins in China. Environ. Dev. Sustain. 2024, 26, 1701–1730. [Google Scholar] [CrossRef]
  29. Jimura, T. The Impact of World Heritage Site Designation on Local Communities—A Case Study of Ogimachi, Shirakawa-Mura, Japan. Tour. Manag. 2011, 32, 288–296. [Google Scholar] [CrossRef]
  30. Nunkoo, R.; Seetanah, B.; Jaffur, Z.R.K.; Moraghen, P.G.W.; Sannassee, R.V. Tourism and Economic Growth: A Meta-Regression Analysis. J. Travel Res. 2020, 59, 404–423. [Google Scholar] [CrossRef]
  31. Bornhorst, T.; Brent Ritchie, J.R.; Sheehan, L. Determinants of Tourism Success for DMOs & Destinations: An Empirical Examination of Stakeholders’ Perspectives. Tour. Manag. 2010, 31, 572–589. [Google Scholar] [CrossRef]
  32. Dwyer, L.; Kim, C. Destination Competitiveness: Determinants and Indicators. Curr. Issues Tour. 2003, 6, 369–414. [Google Scholar] [CrossRef]
  33. Shen, S.; Wang, H.; Quan, Q.; Xu, J. Rurality and Rural Tourism Development in China. Tour. Manag. Perspect. 2019, 30, 98–106. [Google Scholar] [CrossRef]
  34. Israeli, A.A. Star Rating and Corporate Affiliation: Their Influence on Room Price and Performance of Hotels in Israel. Int. J. Hosp. Manag. 2002, 21, 405–424. [Google Scholar] [CrossRef]
  35. Loehr, J.; Dwipayanti, N.M.U.; Nastiti, A.; Powell, B.; Hadwen, W.; Johnson, H. Safer Destinations, Healthier Staff and Happier Tourists: Opportunities for Inclusive Water, Sanitation and Hygiene in Tourism. Tour. Manag. Perspect. 2021, 40, 100883. [Google Scholar] [CrossRef]
  36. Hall, C.M.; Page, S.J. The Geography of Tourism and Recreation: Environment, Place and Space, 3rd ed.; Routledge: London, UK, 2006; ISBN 978-0-203-42024-9. [Google Scholar]
  37. Wagner, J.E. Estimating the Economic Impacts of Tourism. Ann. Tour. Res. 1997, 24, 592–608. [Google Scholar] [CrossRef]
  38. Vanhove, N. Tourism as a Strategic Option for Development of Less Developed Regions. In Tourism and Leisure: Current Issues and Perspectives of Development; Pechlaner, H., Smeral, E., Eds.; Springer Fachmedien: Wiesbaden, Germany, 2015; pp. 95–113. ISBN 978-3-658-06660-4. [Google Scholar]
  39. Hu, H.; Lu, H. Revisiting Tourism in the Post-Pandemic Era: An Evaluation Study of China’s 5A-Class Scenic Spots. Heliyon 2024, 10, e25411. [Google Scholar] [CrossRef] [PubMed]
  40. Ivona, A. Sustainability of Rural Tourism and Promotion of Local Development. Sustainability 2021, 13, 8854. [Google Scholar] [CrossRef]
  41. Catibog-Sinha, C.; Wen, J. Sustainable Tourism Planning and Management Model for Protected Natural Areas: Xishuangbanna Biosphere Reserve, South China. Asia Pac. J. Tour. Res. 2008, 13, 145–162. [Google Scholar] [CrossRef]
  42. Kausar, R.; Mirza, S.N.; Akhtar, S. Effect of Forest Ecotourism on Socioeconmic Conditions of Local Community. Asian J. Agric. Rural Dev. 2015, 5, 21–29. [Google Scholar] [CrossRef]
  43. Yuyi, L.; Huancheng, P.; Tianyi, Y.; Hua, L.; Yibing, L.; Tianzhi, R. Evaluation of Agricultural Water Use Efficiency and Regional Irrigation Strategies in China Based on GIS. In Software Engineering and Knowledge Engineering: Theory and Practice; Wu, Y., Ed.; Springer: Berlin/Heidelberg, Germany, 2012; pp. 473–481. [Google Scholar]
  44. Hu, Y.; Yao, L.; Hu, Q. Evaluation of Water Resources Carrying Capacity in Jiangxi Province Based on Principal Component Analysis. J. Coast. Res. 2020, 105, 147–150. [Google Scholar] [CrossRef]
  45. Ju, Y.; Xing, Y.; Dong, A.; Qi, F.; Hou, M.; Zhang, W. An Analysis on Influencing Factors of Irrigation Water Effective Utilization Coefficient—A Case Study of Jiangsu Province, China. Water Supply 2022, 22, 8233–8252. [Google Scholar] [CrossRef]
  46. Tilman, D.; Cassman, K.G.; Matson, P.A.; Naylor, R.; Polasky, S. Agricultural Sustainability and Intensive Production Practices. Nature 2002, 418, 671–677. [Google Scholar] [CrossRef] [PubMed]
  47. Geiger, F.; Bengtsson, J.; Berendse, F.; Weisser, W.W.; Emmerson, M.; Morales, M.B.; Ceryngier, P.; Liira, J.; Tscharntke, T.; Winqvist, C.; et al. Persistent Negative Effects of Pesticides on Biodiversity and Biological Control Potential on European Farmland. Basic Appl. Ecol. 2010, 11, 97–105. [Google Scholar] [CrossRef]
  48. Wang, J.; Lv, S.; Zhang, M.; Chen, G.; Zhu, T.; Zhang, S.; Teng, Y.; Christie, P.; Luo, Y. Effects of Plastic Film Residues on Occurrence of Phthalates and Microbial Activity in Soils. Chemosphere 2016, 151, 171–177. [Google Scholar] [CrossRef]
  49. Lobell, D.B.; Cassman, K.G.; Field, C.B. Crop Yield Gaps: Their Importance, Magnitudes, and Causes. Annu. Rev. Environ. Resour. 2009, 34, 179–204. [Google Scholar] [CrossRef]
  50. Gereffi, G. International Trade and Industrial Upgrading in the Apparel Commodity Chain. J. Int. Econ. 1999, 48, 37–70. [Google Scholar] [CrossRef]
  51. Fan, S. Effects of Technological Change and Institutional Reform on Production Growth in Chinese Agriculture. Am. J. Agric. Econ. 1991, 73, 266–275. [Google Scholar] [CrossRef]
  52. Balogh, T. Transforming Traditional Agriculture. Econ. J. 1964, 74, 996–999. [Google Scholar] [CrossRef]
  53. Huang, J.; Rozelle, S. Technological Change: Rediscovering the Engine of Productivity Growth in China’s Rural Economy. J. Dev. Econ. 1996, 49, 337–369. [Google Scholar] [CrossRef]
  54. Sharpley, R.; Roberts, L. Rural Tourism—10 Years On. Int. J. Tour. Res. 2004, 6, 119–124. [Google Scholar] [CrossRef]
  55. Gao, S.; Huang, S.; Huang, Y. Rural Tourism Development in China. Int. J. Tour. Res. 2009, 11, 439–450. [Google Scholar] [CrossRef]
  56. Briedenhann, J.; Wickens, E. Tourism Routes as a Tool for the Economic Development of Rural Areas—Vibrant Hope or Impossible Dream? Tour. Manag. 2004, 25, 71–79. [Google Scholar] [CrossRef]
  57. Hall, C.M. Constructing Sustainable Tourism Development: The 2030 Agenda and the Managerial Ecology of Sustainable Tourism. In Activating Critical Thinking to Advance the Sustainable Development Goals in Tourism Systems; Routledge: London, UK, 2021; ISBN 978-1-003-14054-2. [Google Scholar]
  58. Shen, Q.; Pan, Y.; Feng, Y. The Impacts of High-Speed Railway on Environmental Sustainability: Quasi-Experimental Evidence from China. Humanit. Soc. Sci. Commun. 2023, 10, 719. [Google Scholar] [CrossRef]
  59. He, Z.; Chen, Z.; Feng, X. How Does High-Speed Railway Affect Green Technology Innovation? A Perspective of High-Quality Human Capital. Environ. Sci. Eur. 2023, 35, 97. [Google Scholar] [CrossRef]
Figure 1. The coupling and coordination relationship between rural tourism and agricultural green development.
Agriculture 15 00874 g001
Figure 2. Location map of the study area.
Agriculture 15 00874 g002
Figure 3. The development level of rural tourism in each city of Jiangxi Province.
Agriculture 15 00874 g003
Figure 4. The development stages of rural tourism in Jiangxi Province.
Agriculture 15 00874 g004
Figure 5. The level of agricultural green development of each region in Jiangxi Province.
Agriculture 15 00874 g005
Figure 6. The stages of agricultural green development in various regions of Jiangxi Province.
Agriculture 15 00874 g006
Figure 7. The situation of coupling coordination degree of rural tourism and agricultural green development level in various regions of Jiangxi Province.
Agriculture 15 00874 g007
Figure 8. Division of coupling coordination degree of rural tourism and agricultural green development level in various regions of Jiangxi Province.
Agriculture 15 00874 g008
Table 1. Classification of coupling coordination degree levels.
GradeCoupling Coordination Degree RangeClassification
10–0.1Extremely uncoordinated
20.1–0.2Seriously uncoordinated
30.2–0.3Moderate disorder
40.3–0.4Mild disorder
50.4–0.5Near disorder
60.5–0.6Barely coordination
70.6–0.7Primary coordination
80.7–0.8Intermediate coordination
90.8–0.9Good coordination
100.9–1.0Highly coordinated
Table 2. Evaluation system and index weights of rural tourism development level.
Target LayerFirst-Level IndicatorSecond-Level IndicatorUnitNatureWeight
Rural Tourism Development LevelTourism Market PerformanceTourism Income10,000 yuan+10.95%
Number of Touristsperson+8.49%
Tourism Space Densityperson/km2+12.48%
Infrastructure and ServiceNumber of Accommodation Enterprisesunit+9.52%
Number of Star-rated Hotelsunit+7.07%
Per Capita Road Cleaning and Sanitation Aream2+9.49%
Number of Employees in Accommodation and Catering Industryperson+9.52%
Tourism Resource AttractionNumber of Key Rural Tourism Villagesunit+8.13%
Number of A-level Scenic Spotsunit+9.24%
Number of Cultural Relics Protection Unitsunit+6.30%
Proportion of Nature Reserve Area to Jurisdictional Area%+6.69%
Forest Coverage Rate%+1.97%
Note: “+” indicates positive indicators, where higher values contribute more to rural tourism development.
Table 3. Evaluation system and index weights of agricultural green development level.
Target LayerFirst-Level IndicatorSecond-Level IndicatorUnitNatureWeight
Agricultural Green Development LevelResource ConservationProportion of Effective Irrigation Area%+5.17%
Amount of Water Used for Irrigation per Unit Area of Farmlandm3/ha5.78%
Environmental FriendlinessAmount of Chemical Fertilizers Used per Unit Areakg/ha8.66%
Amount of Pesticides Used per Unit Areakg/ha10.39%
Amount of Agricultural Film Used per Unit Areakg/ha6.11%
High-efficiency OutputYield of Grain per Unit Areakg/ha+10.90%
Agricultural Output Value per Unit Areaten thousand CNY per hectare+20.61%
Total Output Value of Agriculture, Forestry, Animal Husbandry and Fishery Created by Each Agricultural LaborerCNY+18.78%
Note: “+” indicates positive indicators, meaning the higher the value, the greater the contribution to the green development of agriculture. “−” indicates negative indicators, meaning the lower the value, the smaller the contribution to the green development of agriculture.
Table 4. Global Moran’s index statistics.
YearMoran’s IEIsd (I)Zp-Value
20080.148−0.1000.0252.2800.015
20090.173−0.1000.0222.6100.007
20100.198−0.1000.0202.9500.003
20110.211−0.1000.0193.1000.001
20120.227−0.1000.0183.2600.001
20130.241−0.1000.0173.3900.000
20140.254−0.1000.0163.5300.000
20150.268−0.1000.0153.6800.000
20160.286−0.1000.0143.8500.000
20170.298−0.1000.0133.9700.000
20180.312−0.1000.0124.1100.000
20190.294−0.1000.0133.9200.000
20200.281−0.1000.0143.7800.000
20210.305−0.1000.0134.0700.000
20220.293−0.1000.0143.9000.000
Table 5. Local indicators of spatial association.
RegionLISA TypeMoran’s Ip-ValueSpatial Association Pattern Explanation
NanchangHH0.4470.001High-value core clusters exerting developmental spillover effects on Jiujiang, Yichun, and Fuzhou.
JiujiangHH0.4080.002Forming a high-value synergistic belt with Nanchang and Yichun.
YichunHH0.3810.003Subjected to intensive developmental spillover effects emanating from Nanchang and Jiujiang.
PingxiangLL−0.3780.008Low-value clusters characterized by mutually inhibitory effects among Xinyu, Ji’an, and adjacent underdeveloped areas.
XinyuLL−0.3420.010Low-value agglomeration exhibiting spatial spillback effects from Pingxiang and Ji’an.
YingtanLL−0.3170.015Low-value development enclaves maintaining tenuous spatial connectivity solely with Shangrao and Fuzhou.
Ji’anLH−0.2710.032Exhibiting intrinsic low-value attributes while encircled by high-value clusters encompassing Ganzhou and Nanchang.
FuzhouHL0.3050.021Manifesting endogenous high-value attributes while embedded within low-value peripheries comprising adjacent municipalities of Yingtan and Ganzhou.
GanzhouNS0.0980.130Exhibiting statistically insignificant spatial autocorrelation.
JingdezhenNS−0.0850.215Exhibiting statistically insignificant spatial autocorrelation.
ShangraoNS0.1490.095Exhibiting statistically insignificant spatial autocorrelation.
Disclaimer/Publisher’s Note: The statements, opinions and data contained in all publications are solely those of the individual author(s) and contributor(s) and not of MDPI and/or the editor(s). MDPI and/or the editor(s) disclaim responsibility for any injury to people or property resulting from any ideas, methods, instructions or products referred to in the content.

