Article

Regional Differences and Dynamic Evolution of Agricultural Product Market Integration in China

1
Business School, Huaiyin Normal University, Huaian 223001, China
2
College of Economics and Management, Huazhong Agriculture University, Wuhan 430070, China
3
Institute of Horticultural Economics, Huazhong Agriculture University, Wuhan 430070, China
4
Hubei Rural Development Research Center, Wuhan 430070, China
5
Academy of the Zhonghuaminzu Community, Yangtze Normal University, Chongqing 408100, China
*
Author to whom correspondence should be addressed.
Agriculture 2025, 15(8), 861; https://doi.org/10.3390/agriculture15080861
Submission received: 26 February 2025 / Revised: 3 April 2025 / Accepted: 14 April 2025 / Published: 15 April 2025
(This article belongs to the Section Agricultural Economics, Policies and Rural Management)

Abstract

:
The integration of the agricultural product market is of great significance to reducing price fluctuations and improving social welfare. In this study, we employ the relative price method to measure the integration of the agricultural product market in 31 Chinese provinces from 2003 to 2022. We use the Dagum–Gini coefficient and its decomposition and the σ convergence and β convergence models to analyze regional variations, time trends, and convergence. It is found that the degree of integration of the Chinese agricultural product market did not increase continuously but fluctuated with increasing intensity. The spatial differentiation degree of agricultural market integration fluctuated. The integration degree of the agricultural product market has σ convergence, absolute β convergence, and conditional β convergence. The marginal contribution of this study is the systematic analysis of the dynamic evolution and convergence of the integration of the Chinese agricultural product market. In order to improve the integration degree of the agricultural product market, in this paper, we put forward policy suggestions from three aspects: strengthening policy support, optimizing resource allocation, and building agricultural product market information centers.

1. Introduction

The segmentation of agricultural product markets can hinder specialization, resulting in mismatched agricultural resources and efficiency losses [1], which is not conducive to food security in China. Market segmentation leads to trade barriers between different regions, which means that agricultural products are difficult to freely circulate and sell over long distances, and consumers far from their origin have to bear high prices [2], which is a resource waste for the entire market and consumers.
In recent years, the Chinese government has made a lot of effort to break down market segmentation. For example, in April 2022, the Central Committee of the Communist Party of China and the State Council issued the Opinions on Accelerating the Construction of China’s Unified Large Market to “accelerate the construction of China’s unified large market that is highly efficient, standardized, fairly competitive, and fully open”. China’s unified market relies on the integration of its agricultural products market to promote their circulation, increase farmers’ incomes, improve consumers’ welfare, and maximize domestic demand [3].
However, recent years have borne witness to conspicuous irregularities in the agricultural product sector that have elicited significant societal concern. Notably, a substantial surplus of agricultural produce stales in the production stage and is sometimes even left decaying in the fields, while end consumers grapple with profound apprehension regarding the soaring prices of agricultural commodities. In efforts to safeguard their individual agricultural markets, diverse provinces frequently impose trade barriers during agricultural product transactions. Consequently, the realization of a highly agricultural market integration has proven to be a formidable challenge, and the need to delineate the trajectory of agricultural market integration and accelerate its implementation has never been more pressing. Therefore, this paper aims to measure the degree of agricultural product market integration in China and analyze the status, spatial differentiation and convergence of agricultural product market integration in different regions. This is of great significance for promoting the integration of agricultural products market in China, and it also provides a reference for the construction of agricultural products markets in developing countries.
Agricultural product market integration is a process of market interrelation, which is evidenced by the resultant co-movement of agricultural product prices [4]. The issue of agricultural product market integration has been a research hotspot for academics, and there has been a wealth of research in the literature, which has investigated three main aspects. Firstly, there are the measuring methods of agricultural product market integration. The primary methods include specialized indexes, trade, prices, economic cycles, and production [5,6,7,8,9]. Among them, the price method, based on the “law of one price”, has a solid theoretical foundation and high data availability, and it has been widely used [10]. Most of the literature uses co-integration, the error correction model, the Granger causality test and other methods to test the market integration hypothesis. Secondly, there is the state of agricultural products market integration. Based on the price method, many scholars have analyzed the integration state of the agricultural products market, mainly including vertical market integration and spatial market integration. Among them, vertical market integration refers to the price transfer relationship between the upstream and downstream of the agricultural product chain. For example, Zhang et al. (2018) analyzed the market integration of China’s wheat industry chain and found that the fluctuation of flour price had a greater impact on wheat under the non-linear system [11]. Loy et al. (2016) analyze vertical price transmission for up to 90 brands of milk sold in 327 German retail stores [12]. Spatial market integration refers to the relationship between price passing between markets in different locations. For example, Abay et al. (2023) found that there was a spatial integration of grain market prices in Darfur but not in other regions of Sudan [13]. The spatial market integration of China’s agricultural products is mainly carried out from inter-regional, inter-provincial and domestic and foreign markets [14], investigating mutton [15], corn [16], rice [17], wheat [18], and other crops. Thirdly, scholars have investigated the factors affecting the integration of the agricultural products market. The existing literature can be divided into two categories, including institutional factors and non-institutional factors. Among them, the institutional factors mainly include market reforms [19,20], local protectionism [21], border impact [22], currency rate policy [23], and subsidy policy [24]. Non-institutional factors mainly include infrastructure development [25], financial development [26], sales strategy [27], product supply [28], and so on.
In summary, current research on the integration of the agricultural product market has achieved valuable results. However, there are still shortcomings in the following aspects. On the one hand, the existing literature mainly focuses on the comprehensive commodity market, service market and labor market. There are few studies using the relative price method to measure the agricultural products market integration in China. On the other hand, there is a lack of systematic analysis of the development status, regional differences and convergence of agricultural product market integration from a dynamic point of view.
In view of this, the marginal contribution of this paper mainly has two points. First, based on various commodity consumer price indexes of food (oil; meat, poultry, and their products; eggs; aquatic products; vegetables; and dried and fresh melons and fruits) during 2003–2022, the relative price method is used to measure the integration of the regional agricultural product market. Second, we analyze the time and space characteristics of the dynamics and convergence of agricultural product market integration for an all-round explanation.
The structure of this paper is as follows. In Section 2, we describe the study materials and methods, including the data sources and the construction of the econometric model. In Section 3, we report the results and analysis. In Section 4, we present a discussion of the research results. Section 5 includes the conclusions and policy implications.

2. Materials and Methods

2.1. Materials

The original data sources used in this study included the China Statistical Yearbook, the China Population and Employment Statistical Yearbook, the official EPS data website, and provincial (municipal and autonomous region levels) statistical yearbooks. Data concerning regional land area were obtained from the China Administrative Region Information Query Platform, while exchange rates were retrieved from the People’s Bank of China. Missing data for specific regions were filled by using methods such as moving average or trend projection.
To measure the degree of agricultural product market integration, in this study, we used the relative price method. Considering the availability and representativeness of the data, we collected seven types of agricultural consumer price index, including grain; oil and fat; meat, poultry, and their products; eggs; aquatic products; vegetables; and dried and fresh fruits. In order to further explore the influencing factors of the convergence of agricultural product market integration, we selected eight closely related control variables, including openness to the outside world, fiscal decentralization, the level of financial development, traffic conditions, market size, gross domestic product, industrial structure, and the level of information development.
Openness to the outside world (open) is measured by dividing the import and export volume by the gross regional product. Opening to the outside world will crowd out domestic inter-provincial trade, resulting in weaker demand for domestic market integration, thus intensifying market segmentation. Fiscal decentralization (fiscal) is calculated by dividing the fiscal expenditure by its fiscal revenue. According to the studies of Lv and He [29], fiscal decentralization can stimulate local protection, intensify market segmentation, and thus inhibit market integration. The level of financial development (finance) is calculated by dividing the balance of loans from financial institutions by GDP. According to Ma et al. [30], financial development can reduce transaction costs and thus promote market integration. Traffic conditions (transport) are measured by the ratio of the total mileage of roads to the land area. According to the research of Wang and Kong [31], transportation infrastructure construction can break the geographical constraints and closely connect markets in different regions, thus promoting market integration. The market size is measured by the ratio of the gross regional product to the land area of the region. According to the research of Zhou and Feng [32], the expansion of market size and the reduction in transaction costs brought about by economies of scale can promote market integration. Gross domestic product (GDP) is measured by the gross regional product per capita. According to the study of Tuo and Kong [33], the constraint targeting economic growth will intensify local market segmentation and is not conducive to market integration. Industrial structure (structure) is calculated according to the proportion of the primary industry in the gross regional product. According to the study of Xie et al. [34], the convergence of industrial structure intensifies the vicious competition among regions, leading to the loss of resource allocation efficiency, thus inhibiting market integration. The level of information development (internet) is measured by the ratio of the number of internet users to the number of permanent residents. The higher level of information development can reduce the cost of information search, thus promoting market integration. Descriptive statistics are shown in Table 1.

2.2. Methods

2.2.1. Relative Price Method

Using the relative price method to measure the market integration of agricultural products is put forward based on the glacier cost theory under the market arbitrage mechanism. The glacier cost theory is an improvement and extension of the law of one price. According to the glacier cost theory, the transaction cost of the two places in the trade process will not be zero, and there will be a certain “loss” in the theoretical arbitrage income. Suppose there are two markets, i and j . If 1 unit of the i market is shipped to the j market, the goods that eventually reach the market are only 1 τ , and τ is the part that “wears out” like an iceberg during transportation, specially 0 < τ < 1. When the two markets reach equilibrium, the selling price of the commodity in the j market is p j = p i + τ p i . Here, p i indicates the local price of the commodity in the i market, p j indicates the sale price of the commodity in the j market, and τ p i indicates the loss cost during transportation between the two places. It can be seen from this expression that when τ infinity tends to 0, the market prices of the two places also tend to be infinitely the same, which means that the degree of market integration continues to rise. Hence, to gauge the degree of agricultural product market integration, we employed the relative price method, which is a technique elucidated by Samuelson [35]. The procedure unfolds as reported below.
Firstly, relative prices are calculated. The three-dimensional data of year, region, and agricultural product price indexes are constructed, and the relative prices are measured by using the first-order difference form of the price index ratio:
Δ Q i j t k = ln ( p i t k p j t k ) ln ( p i t 1 k p j t 1 k ) = ln ( p i t k p i t 1 k ) ln ( p j t k p j t 1 k ) ,
where p is the price index, i and j are regions, t is time, and k denotes the type of agricultural product. Considering that regional location swapping yields relative prices Δ Q i j t k in opposite directions, Δ Q i j t k indicates the equivalent price index fluctuations. Therefore, the relative price Δ Q i j t k is treated as an absolute value.
The 31 provinces in the sample were paired two by two, forming a total of 465 pairs of regional combinations. Considering the availability and reasonableness of agricultural price data, we collected seven types of agricultural consumer price index (including grain; oil and fat; meat, poultry, and their products; eggs; aquatic products; vegetables; and dried and fresh fruits) as samples from 2003–2022 and obtained a total of 65,100 (20 × 465 × 7) absolute values of relative prices in the form of differentials | Δ Q i j t k | .
Secondly, by referring to the research work by Parsley and Wei [36], we used the de-mean treatment method to eliminate non-additive effects stemming from various types of agricultural products. We assume that | Δ Q i j t k | = α k + ε i j t k , where α k is related to the characteristics of agricultural products in category k and ε i j t k is related to special market conditions or other random factors in i and j. In order to eliminate the fixed effects related to the characteristics of agricultural products ( ε i j t k ), we calculated the average of relative prices among the 465 province combinations involving agricultural products k in year t and then deducted this average: q i t j k = | Δ Q i j t k | | Δ Q t k ¯ | = ε i j t k ε i j t k ¯ , where q i j t k is the relative price change component of the final variance calculation.
Thirdly, by calculating the variance of the relative price fluctuations of the seven types of agricultural products in each of the region pairs ( var ( q i j t k ) ) and aggregating by region, the agricultural product market segmentation was calculated for each province through weighted combination.
var ( q n t ) = 1 / N i j var ( q i j t k ) ,
where N is the number of district combinations merged.
Finally, the opposite of market segmentation is market integration, and there is a reverse relationship between them, so we took the inverse of the above-obtained market segmentation of agricultural products and opened the square root to obtain the integration of the agricultural product market:
i n t e g r a t i o n i t = [ 1 / var ( q n t ) ] .

2.2.2. Dagum–Gini Coefficient and Decomposition

The Dagum–Gini coefficient and its decomposition method can effectively solve the problem of cross-overlap between the data and the source of spatial differences. Therefore, in order to analyze the regional differences in the degree of integration of agricultural markets and determine their sources, the Dagum–Gini coefficient and its decomposition were used [37], as shown in Equation (4), where y j h ( y i r ) is the degree of integration of the agricultural markets in a province in region j(i), y ¯ is the mean value of the integration of the agricultural product market in each province, n is the number of provinces, k is the number of regions, and n j ( n k ) is the number of provinces in region j(i). In performing the decomposition, the regions need to be ranked based on the mean value of the integration of the agricultural market, as shown in Equation (5).
G = j = 1 k i = 1 k h = 1 n j r = 1 n k | y j h y i r | / 2 n 2 y ¯
Y i ¯ Y j ¯ Y k ¯ .
Further, the Dagum–Gini coefficient can be decomposed into three components: intra-regional variance contribution ( G w ), net inter-regional variance contribution ( G n b ), and inter-regional hypervariance density contribution ( G t ), that is, G = G w + G n b + G t .
G w = j = 1 k G j j P j S j
The intra-regional Gini coefficient, G j j , measures the differences in the degree of agricultural market integration within different regions and is calculated using the following formula:
G j j = 1 2 y j ¯ h = 1 n j r = 1 n j | y j h y j r | / n j 2
The inter-regional Gini coefficient, G j i , measures the differences in the degree of agricultural market integration between regions and is calculated using the following formula:
G j i = h = 1 n j r = 1 n i | y j h y i r | n j n i ( y j ¯ + y i ¯ )
The formulae for the contribution of intra-regional variance ( G w ), the net contribution of inter-regional variance ( G n b ), and the contribution of inter-regional hypervariable density ( G t ) are given below:
G w = j = 1 k G j j P j S j
G n b = j = 2 k i = 1 j 1 G j i ( P j S i + P i S j ) D j i
G t = j = 2 k i = 1 j 1 G j i ( P j S i + P i S j ) ( 1 D j i )
In the above equation, p j = n j / n is the number of provinces in region j as a proportion of the country, S j = n j y j ¯ / n y ¯ , j = 1, 2, …, k. D i j will be defined as the relative impact of the degree of agricultural market integration between regions j and i. The calculation formula is as follows:
D j i = d j i p j i d j i + p j i
where d j i represents the difference between regions in the degree of agricultural market integration, i.e., the expectation of the sum of all the sample values y j h y j r > 0 in regions j and i, and p j i represents the hypervariable first-order moments, the formulas for d j i and p j i are as follows:
d j i = 0 d F j ( y ) y 0 ( y x ) d F i ( x )
P j i = 0 d F i ( y ) y 0 ( y x ) d F j ( x )
where F j and F i are cumulative density distribution functions for regions j and i.

2.2.3. σ Converge Model

In this paper, σ convergence refers to the process in which the deviation of the degree of integration of agricultural markets decreases over time. By comprehensively comparing the standard deviation, coefficient of variation, Theil index and other indicators of σ convergence, this paper finally adopts coefficient of variation method. The formula for calculation is as follows:
σ t = n = 1 N ( i n t e g r a t i o n i t - i n t e g r a t i o n t ¯ ) 2 / N i n t e g r a t i o n t ¯ ,
where i n t e g r a t i o n i t is the integration of the agricultural product market in region i in year t, i n t e g r a t i o n t ¯ is the average of the integration of the agricultural product market in all regions in year t, and N is the number of regions.

2.2.4. β Convergence Model

The β convergence means that with the passage of time, regions with lower degrees of integration in the agricultural products market will gradually catch up with regions with higher degrees of integration in the agricultural products market due to their higher growth rates, and they will finally reach a convergence state with the same growth rate of integration in the agricultural products market, including absolute β convergence and conditional β convergence. The main difference between the two is that conditional β convergence is the convergence trend of inter-regional agricultural market integration after controlling a series of influential factors, while absolute β convergence is the convergence trend of inter-regional agricultural market integration even if these factors are not controlled. The absolute β convergence model can be expressed as follows:
ln ( i n t e g r a t i o n i , t + 1 i n t e g r a t i o n i , t ) = α + β ln ( i n t e g r a t i o n i , t ) + ε i , t ,
where i n t e g r a t i o n i , t + 1 is the agricultural product market integration in region i in year t + 1, i n t e g r a t i o n i , t is the agricultural product market integration in region i in year t, and ln ( i n t e g r a t i o n i , t + 1 i n t e g r a t i o n i , t ) is the growth rate of agricultural product market integration in region i in year t + 1. β is the convergence coefficient, which indicates convergence tendencies in the inter-regional integration of agricultural markets. When β < 0, it signifies convergence and vice versa; when it is positive, it means that there is a tendency of divergence in the degree of integration of inter-regional agricultural markets.
Conditional β convergence, which is an extension of the absolute β convergence model, introduces control variables that impact the degree of agricultural product market integration. It aims to assess whether regional agricultural product market integration tends to converge while considering a range of significant influencing factors. The conditional β convergence model is expressed as follows:
ln ( i n t e g r a t i o n i , t + 1 i n t e g r a t i o n i , t ) = α + β ln ( i n t e g r a t i o n i , t ) + δ X i , t + 1 + ε i , t ,
where X is a set of control variables that influences the level of agricultural market integration with δ representing the parameter vector.

3. Results

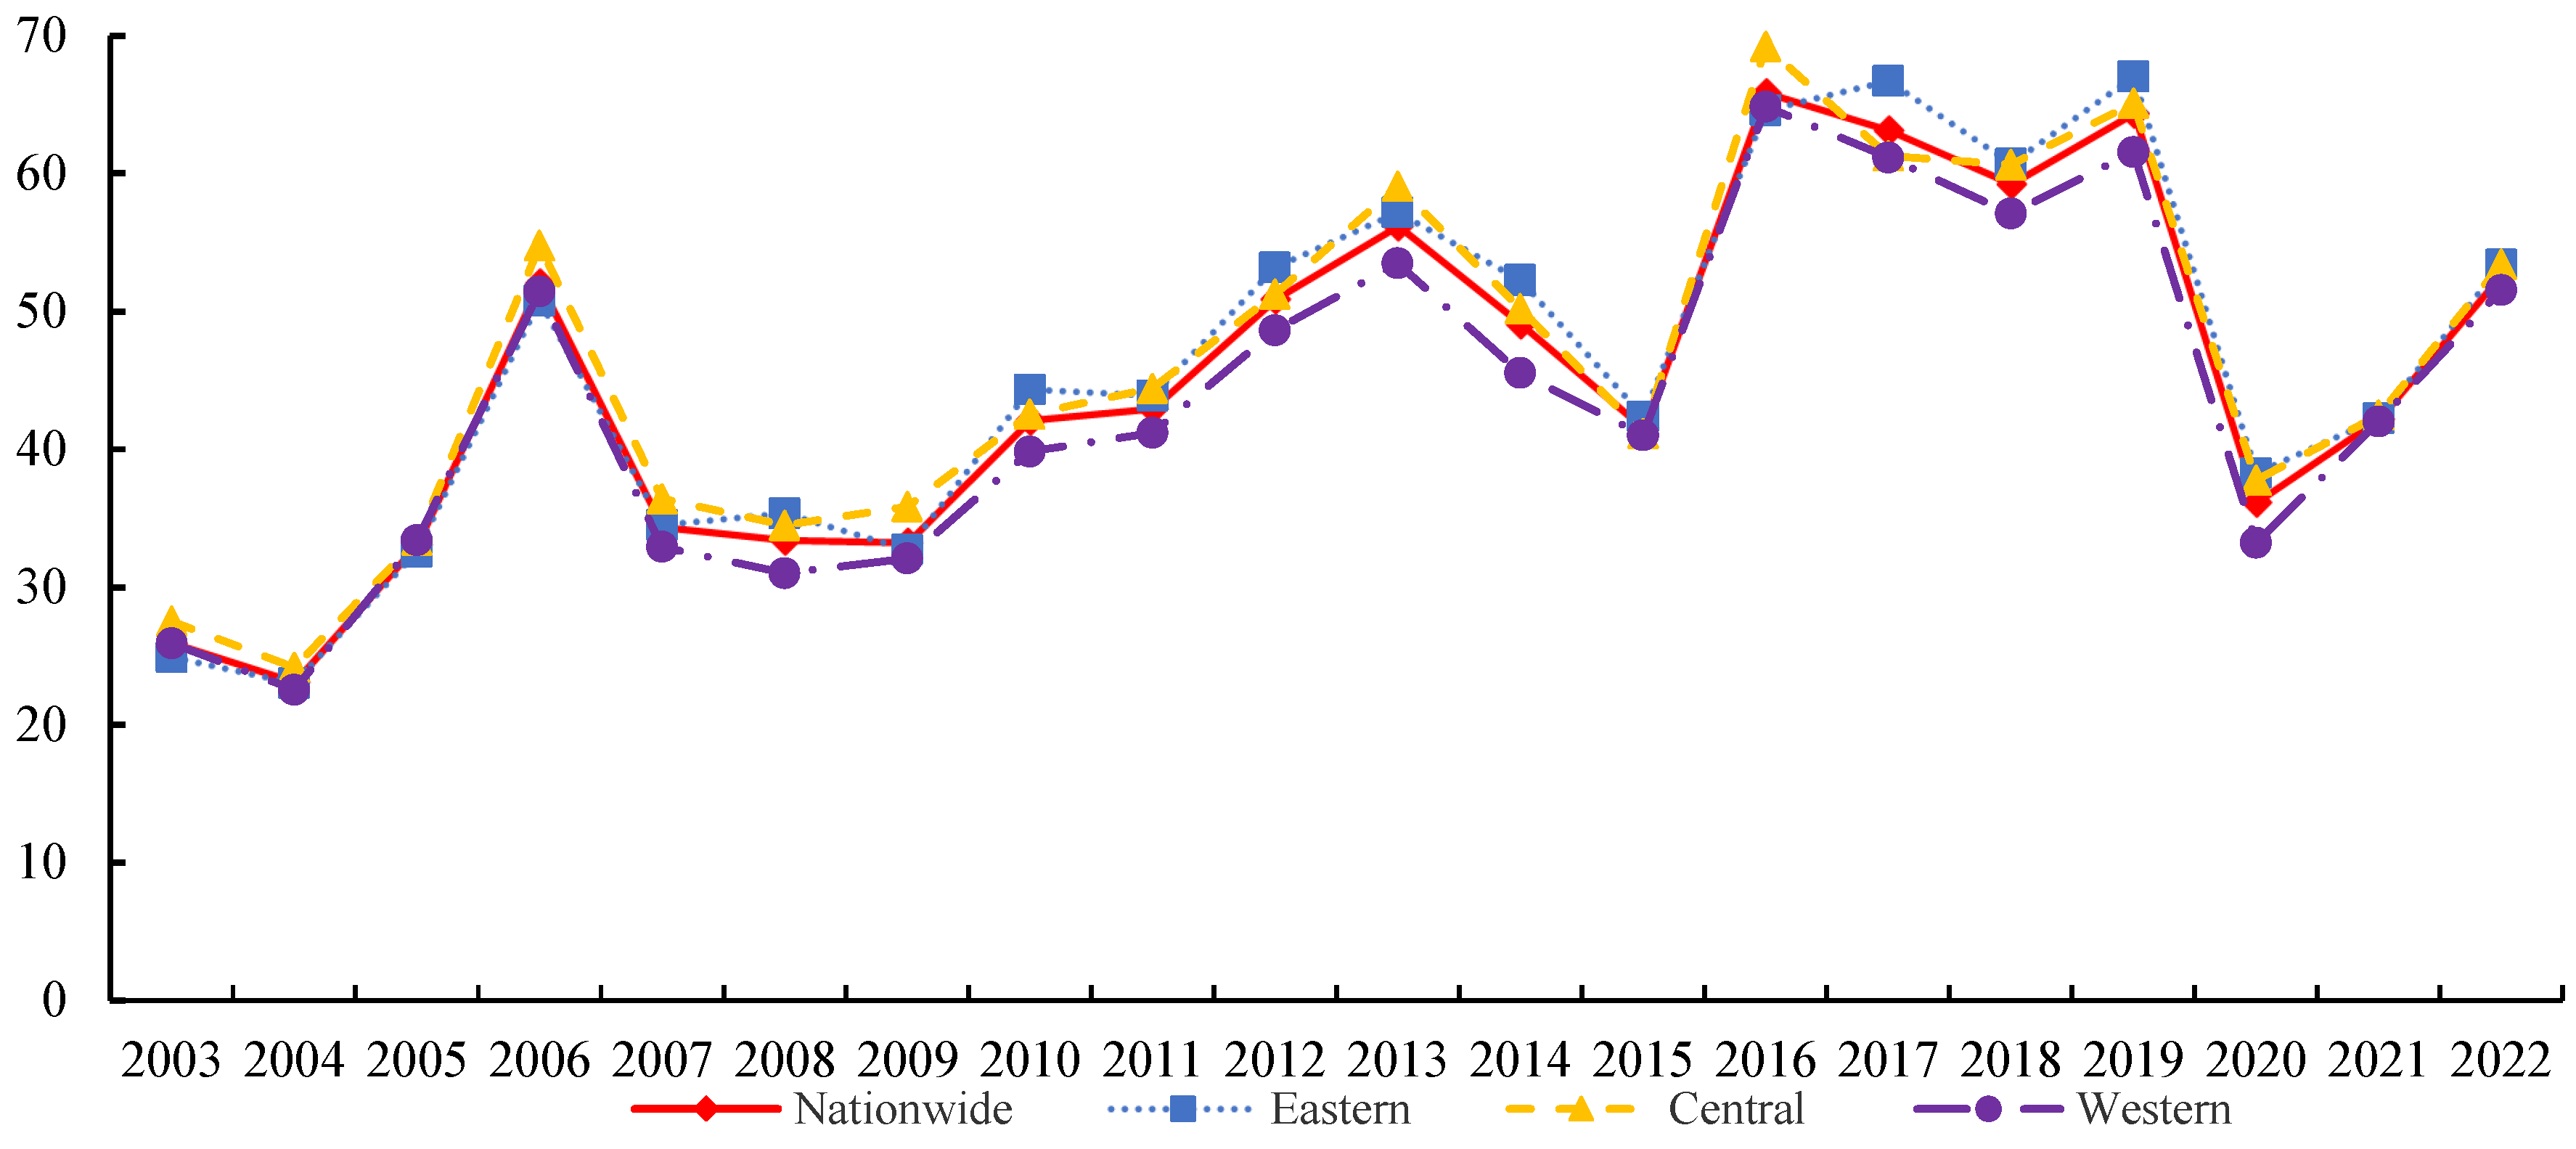
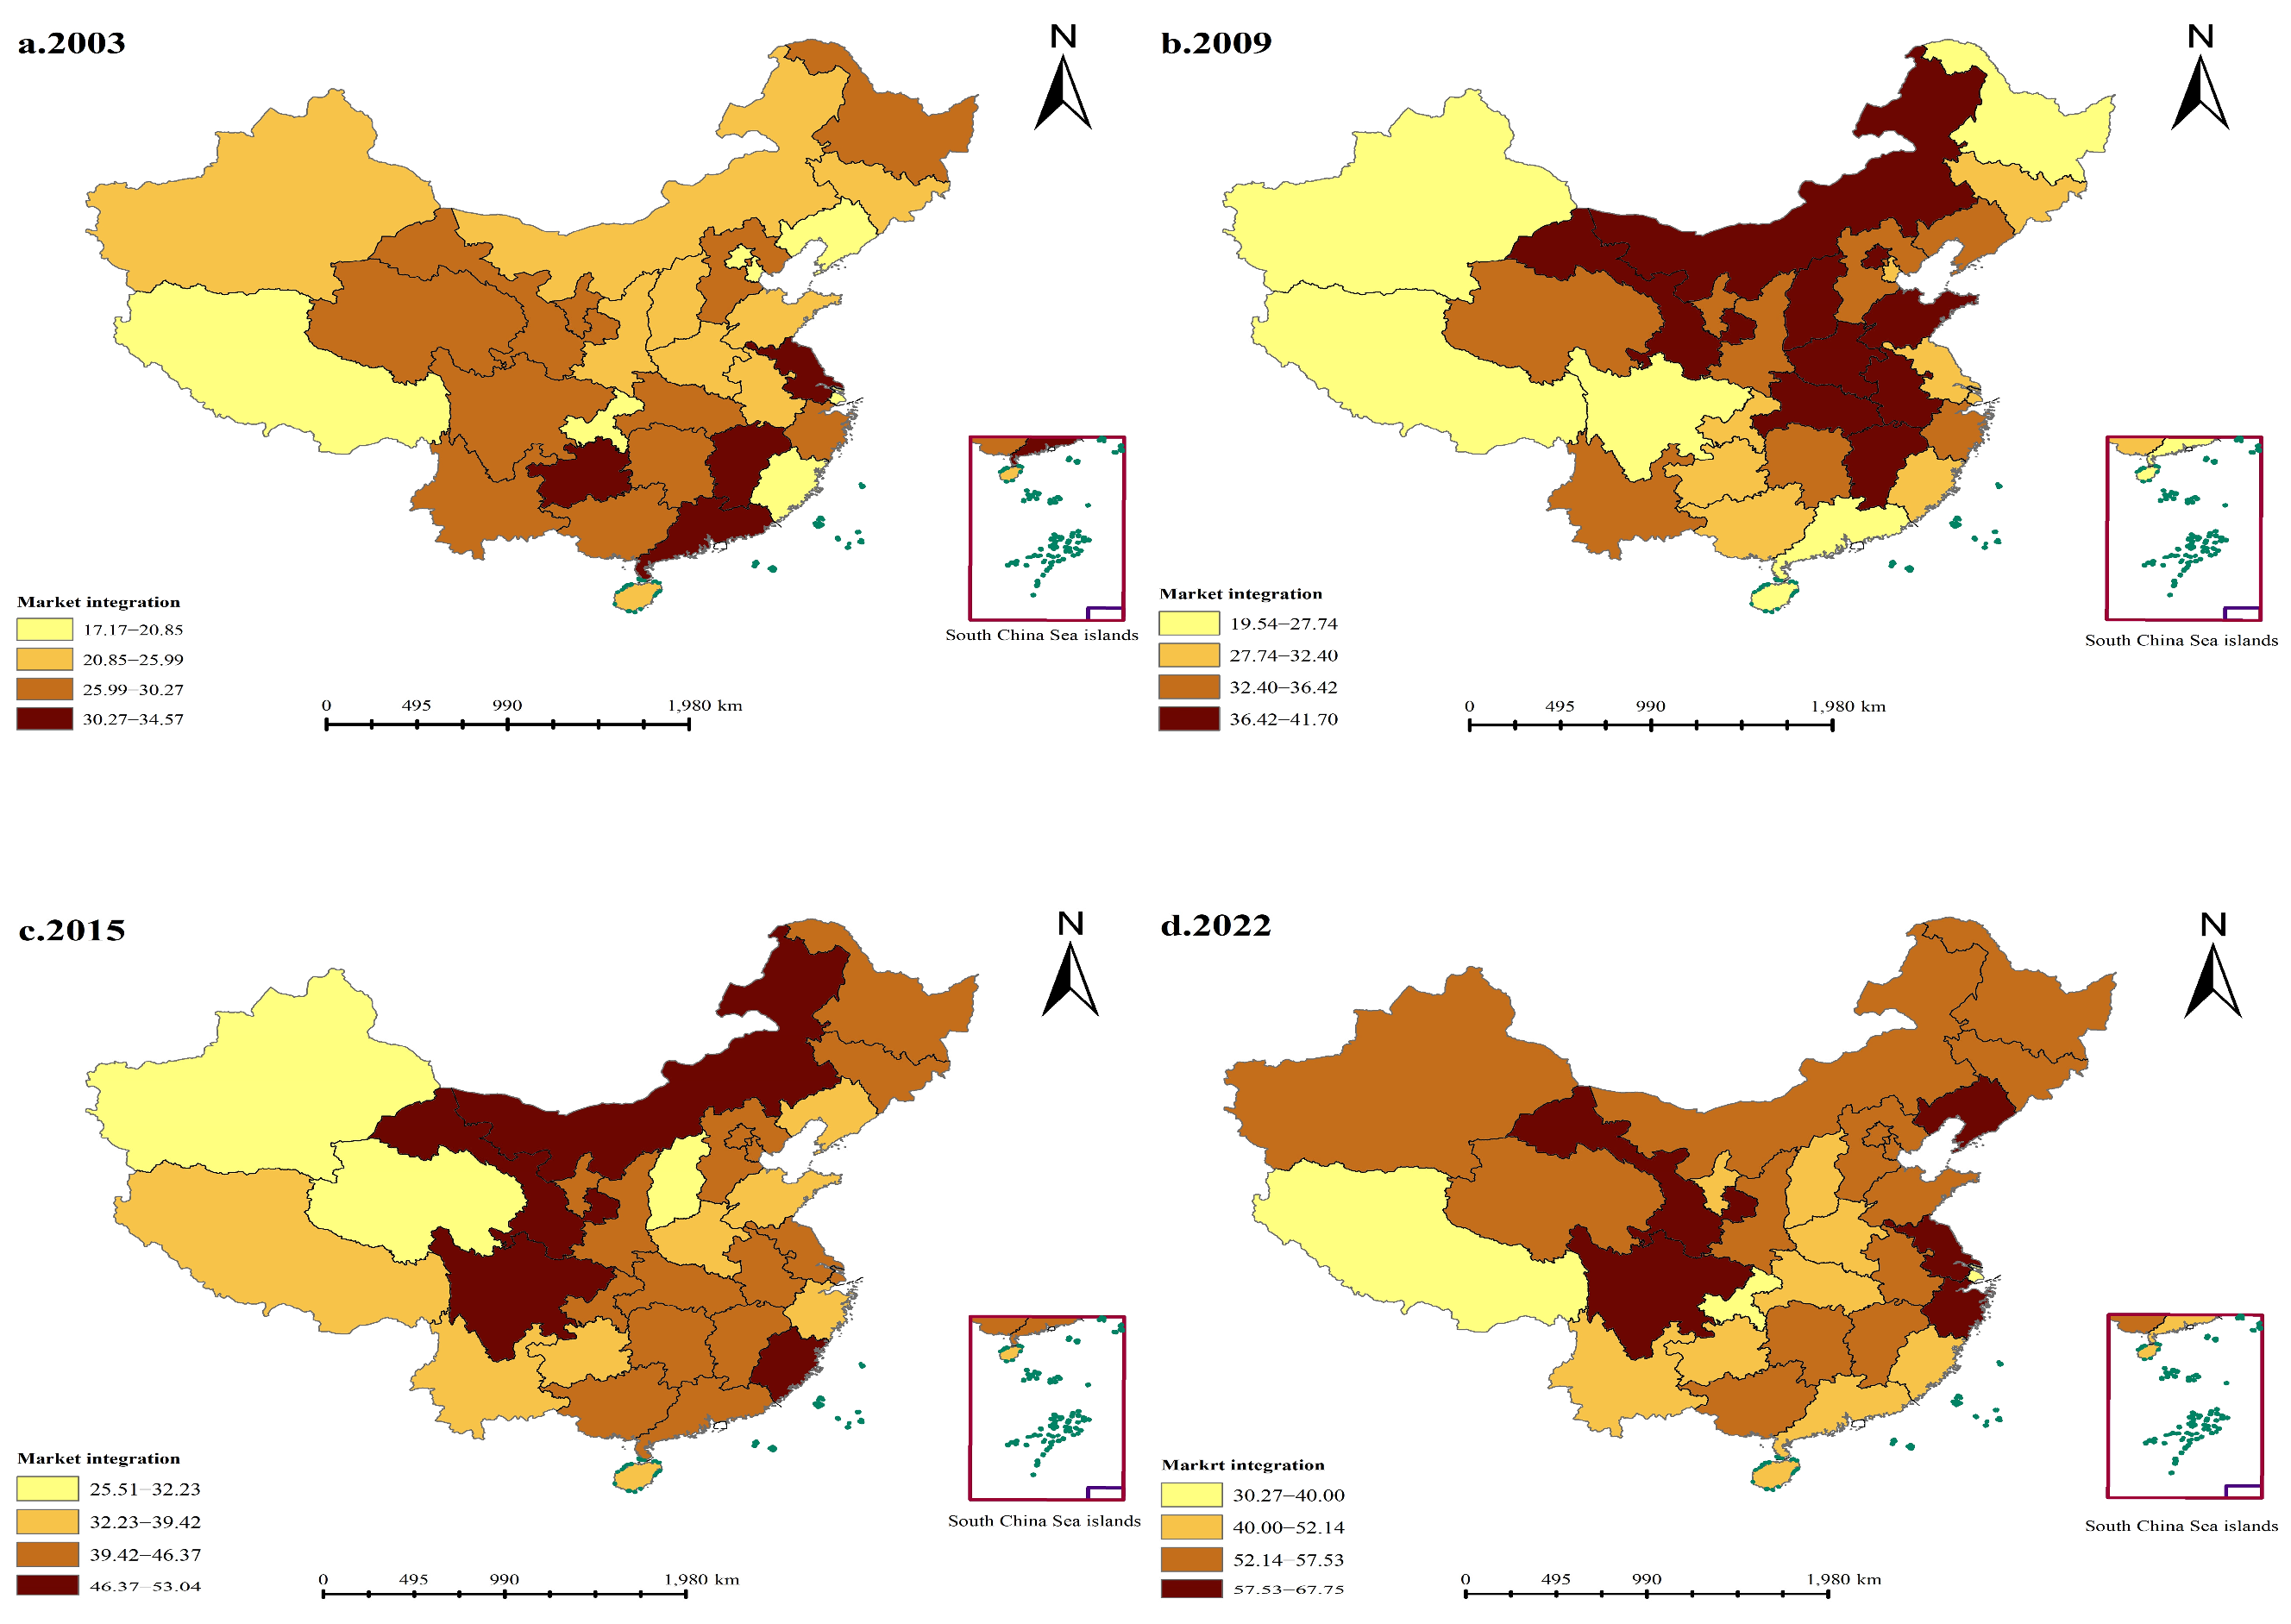
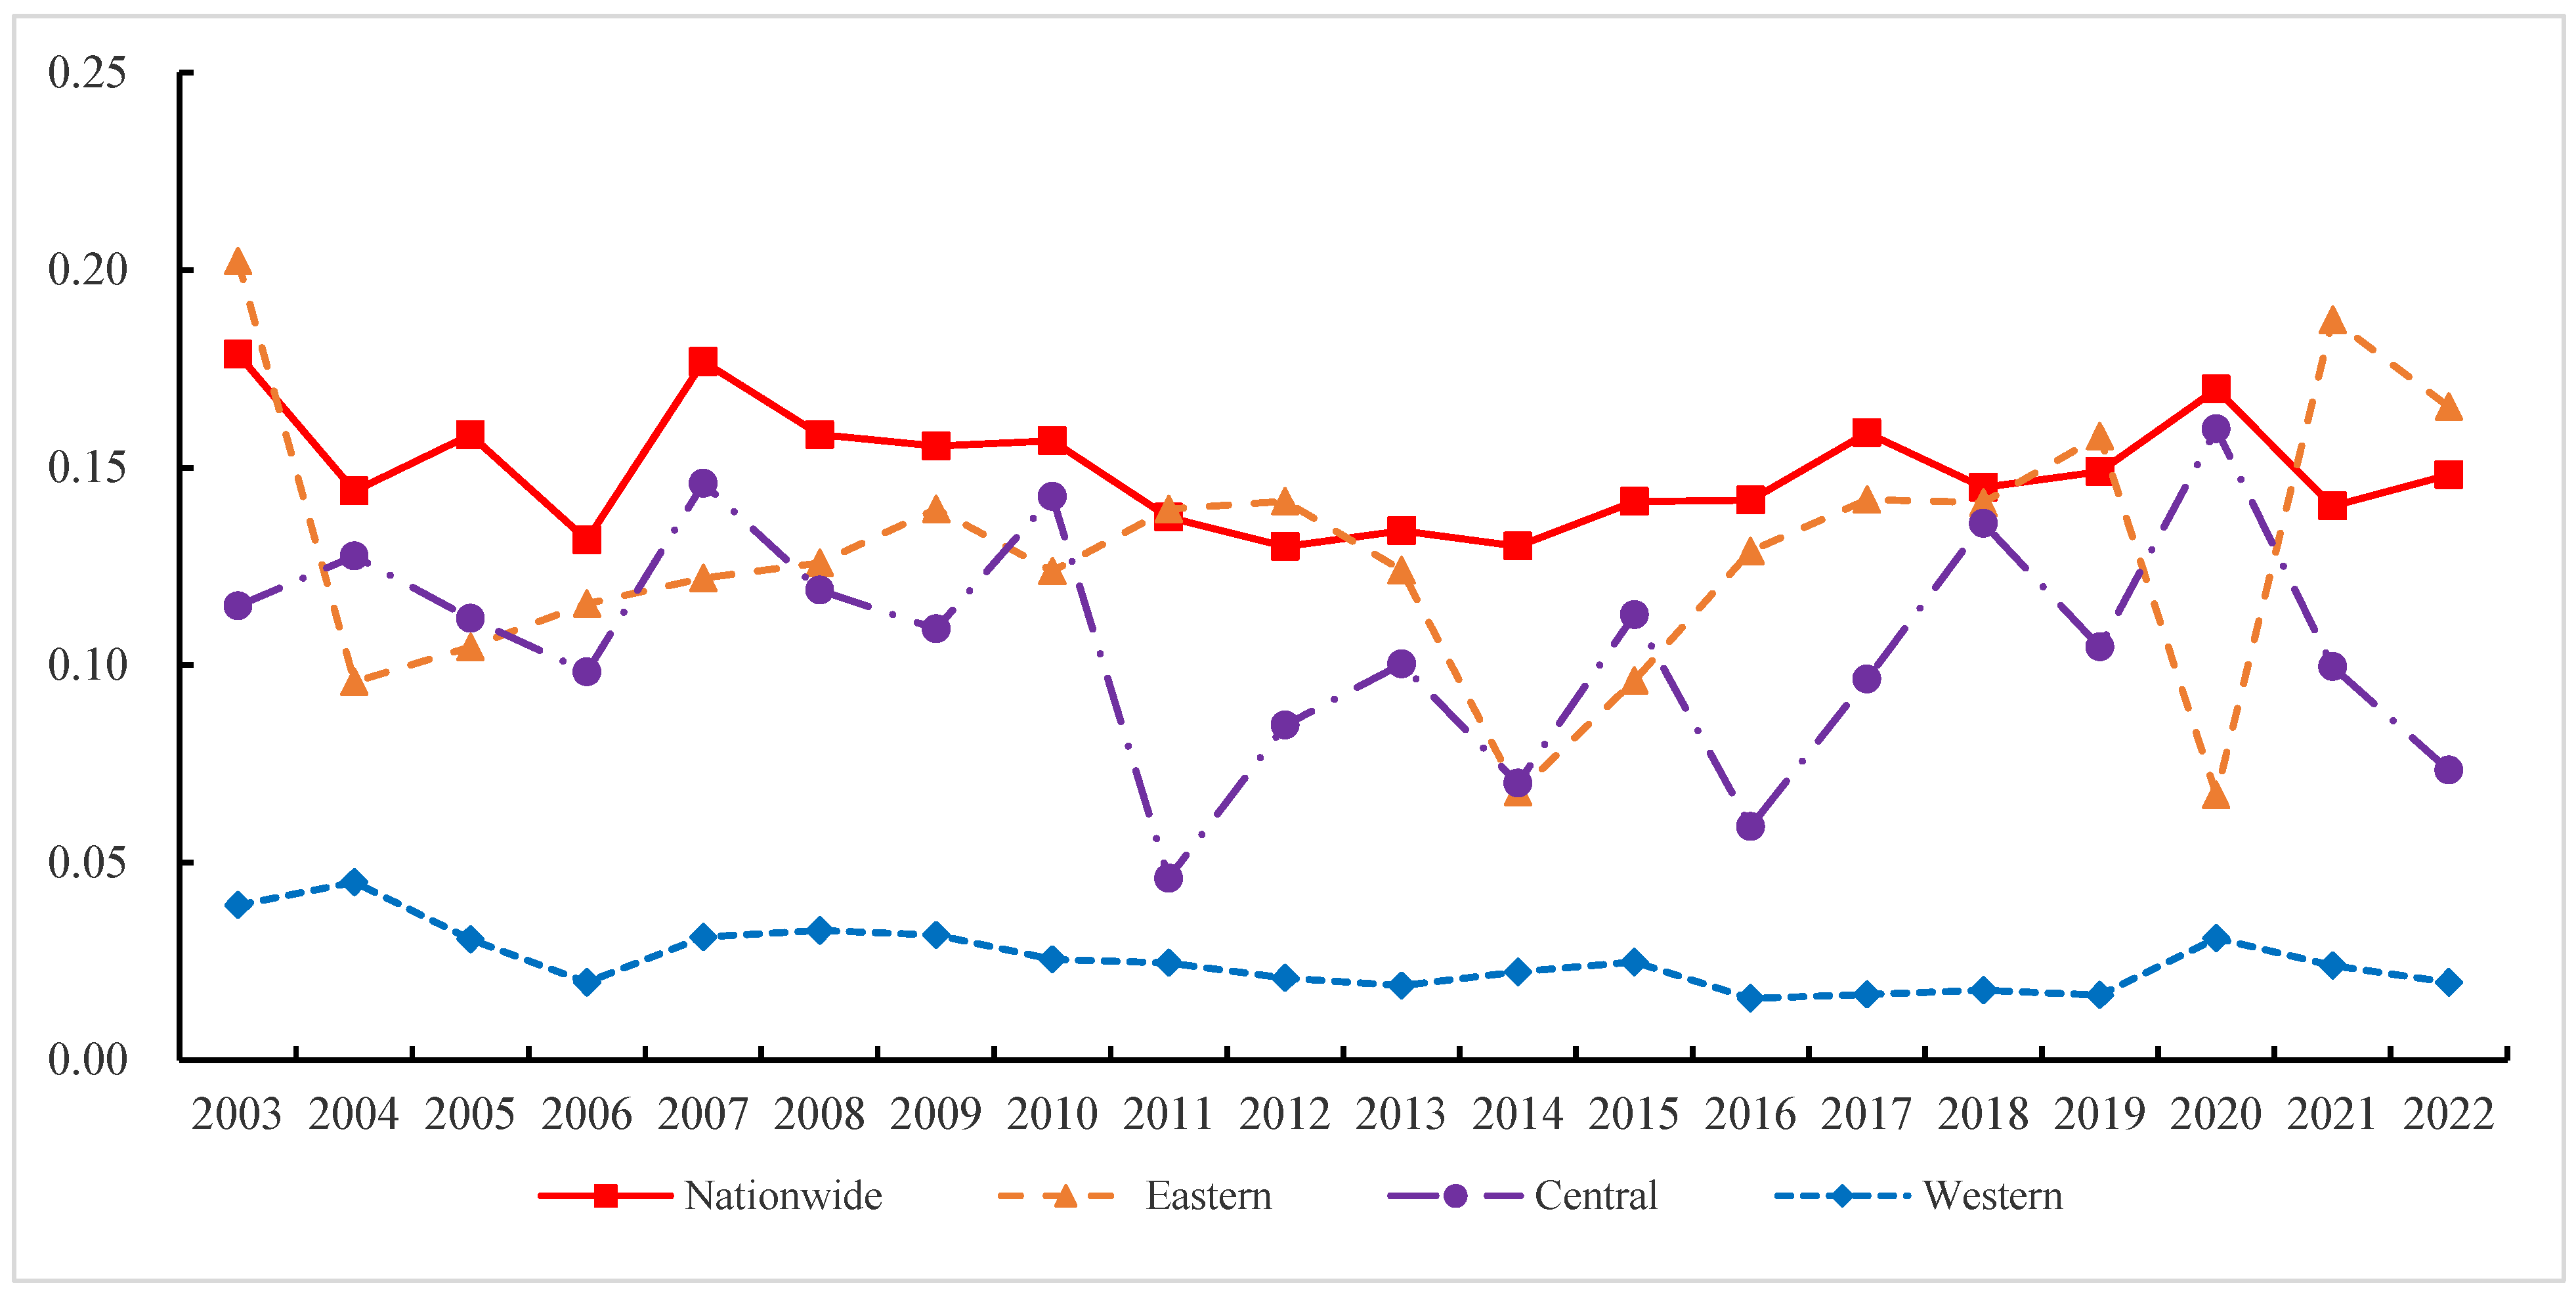
3.1. Status of the Integration of the Agricultural Product Market in China

The relative price method was employed to assess the progress of agricultural market integration in China as well as its three regions. Detailed findings from this analysis are presented in Figure 1 below.
Overall, the degree of integration of the national agricultural product market is not sustained growth but shows a certain increase in volatility. The integration degree of the national agricultural product market increased from 25.9722 in 2003 to 52.6879 in 2022 with an average annual growth rate of 5.14%. From 2003 to 2006, the degree of integration of the national agricultural product market increased from 25.9722 to 52.0806, which was approximately a twofold increase. The possible reason is that in 2003, the Chinese government issued the Decision of the Central Committee of the Communist Party of China on Several Issues concerning the Improvement of the Socialist Market Economic System, adopted a series of reform measures to speed up the construction of a national unified market, and abolished some administrative barriers and various provisions on market segmentation that excluded foreign agricultural products. At the same time, the Chinese government promoted the free circulation of agricultural products nationwide by accelerating the market-oriented reform of factor prices and actively developing modern distribution methods, such as chain operation and logistics distribution. Therefore, during this period, the degree of integration of China’s agricultural product market increased significantly.
From 2007 to 2009, the integration degree of the national agricultural product market declined from 34.3715 in 2007 to 33.2724 in 2009, and in 2007, it decreased by about 34% compared with 2006. The possible reason is that the outbreak of the international financial crisis in 2007–2008 forced some regions to return to the economic policy of market segmentation with the introduction of relevant measures to encourage, guide, and even require local consumers to buy local agricultural products first. As a result, the degree of market integration in agricultural products declined significantly during this period. From 2010 to 2013, the degree of integration of the national agricultural product market continued to rise, increasing from 42.1307 in 2010 to 56.2461 in 2013, which was an increase of about 33.50%. The likely reason is that China was gradually recovering from the negative effects of the financial crisis as its economy continued to grow. In 2012, the 18th National Congress of the Communist Party of China made it clear that we should comprehensively deepen the economic structural reform to improve the modern market system. The economic policy of regional segmentation of the market was gradually abandoned, and agricultural products were freely circulated between regions. Therefore, during this period, the degree of integration of the Chinese agricultural market increased. From 2014 to 2015, the degree of integration of the national agricultural product market continued to decline, and in 2015, it was about 26.15% lower than that in 2013. The possible reason is that there was a structural surplus in the agricultural market, and the supply side and the demand side were separated, resulting in increased market segmentation. For example, in 2015, there were fruit shortages; the levels of nectarines were significantly low, and new nectarines in the same producing area were in short supply. The same happened with ice sugar oranges, where “orange” was promoted by major e-commerce platforms, while the price of other varieties of ice sugar orange plummeted. From 2016 to 2020, the degree of integration of the national agricultural product market fluctuated from 65.8945 in 2016 to 36.1786 in 2020 with an average annual decline of 9.02%. In 2020, it was 43.84% lower than in 2019. The possible reason is that in 2020, the major public health event of the novel coronavirus outbreak occurred in China, and the Chinese government actively adopted quarantine measures to protect people’s health. However, to some extent, the isolation policy led to the poor circulation of agricultural products among regions, which led to the intensification of the segmentation of the agricultural product market. From 2021 to 2022, the degree of integration of the national agricultural product market continued to rise, increasing from 42.2277 in 2021 to 52.6879 in 2022, which was an increase of 24.77%. A possible reason for this is that with the improvement in China’s epidemic prevention and control measures, as well as the joint efforts of the central and local governments, the smooth circulation of agricultural products among regions was ensured, alleviating the inter-regional market segmentation caused by the COVID-19 quarantine measures and ensuring the degree of integration of the agricultural product market continued to rise.
From the perspective of sub-regions, the trends in the integration degree of the eastern and western regions and the national agricultural product market were mostly the same and showed some overlap. The eastern region had the highest degree of agricultural product market integration, and most sub-regions were above the national average level. The reasons may be that the eastern region has a dense transportation network with the most developed highways, railways and ports in the country, forming an efficient logistics system, and the agricultural products market in the region is closely linked. At the same time, the internet penetration rate in the eastern rural areas is high, and the regional coordination policy is perfect, which effectively improves the integration of the agricultural products market. The degree of integration of the agricultural product market in the central region was the closest to the national average level. The reasons may be that most of the provinces in the central region are the main grain producing areas, which occupy a very important position in the national agricultural product market. The supply capacity of the agricultural product market in the central region affects the price fluctuation of the national agricultural product market. Therefore, the degree of integration of the agricultural products market in central China is basically the same as that of the whole country. The integration degree of the agricultural product market in the western region was the lowest, and those of most of the sub-regions were lower than the national average level with the fluctuation range being large. The reasons may be that the economic level of the western region is low; the traffic conditions are poor given the vast area and sparse population; the costs of logistics and transportation among regions are high; and the integration degree of the agricultural product market is low.
From the perspective of each province, in order to more intuitively display the spatiotemporal dynamic changes of agricultural product market integration, the degree of agricultural product market integration is divided into four categories according to the quartile classification. Due to space constraints, we select four time sections in 2003, 2009, 2015 and 2022. The visual analysis was carried out by using ArcGIS10.8 software (Figure 2). The integration degree of the agricultural products market in 31 provinces was different at different times, but it basically showed a spatial pattern of “middle, high in the east and low in the west”. As can be seen from Figure 2, in 2003, there were four provinces with a high degree of agricultural product market integration, namely Jiangsu, Guizhou, Jiangxi and Guangdong. In 2005, there were three provinces with a high degree of agricultural market integration, namely Liaoning, Xizang and Fujian. In 2009, there were nine provinces with a high degree of agricultural market integration, namely Inner Mongolia, Gansu, Shanxi, Henan, Hebei, Beijing, Shandong, Anhui and Jiangxi. In 2015, there were four provinces with a high degree of agricultural market integration, namely Inner Mongolia, Gansu, Sichuan and Fujian. In 2022, there were five provinces with a high degree of agricultural market integration, namely Shandong, Gansu, Sichuan, Jiangsu and Zhejiang.

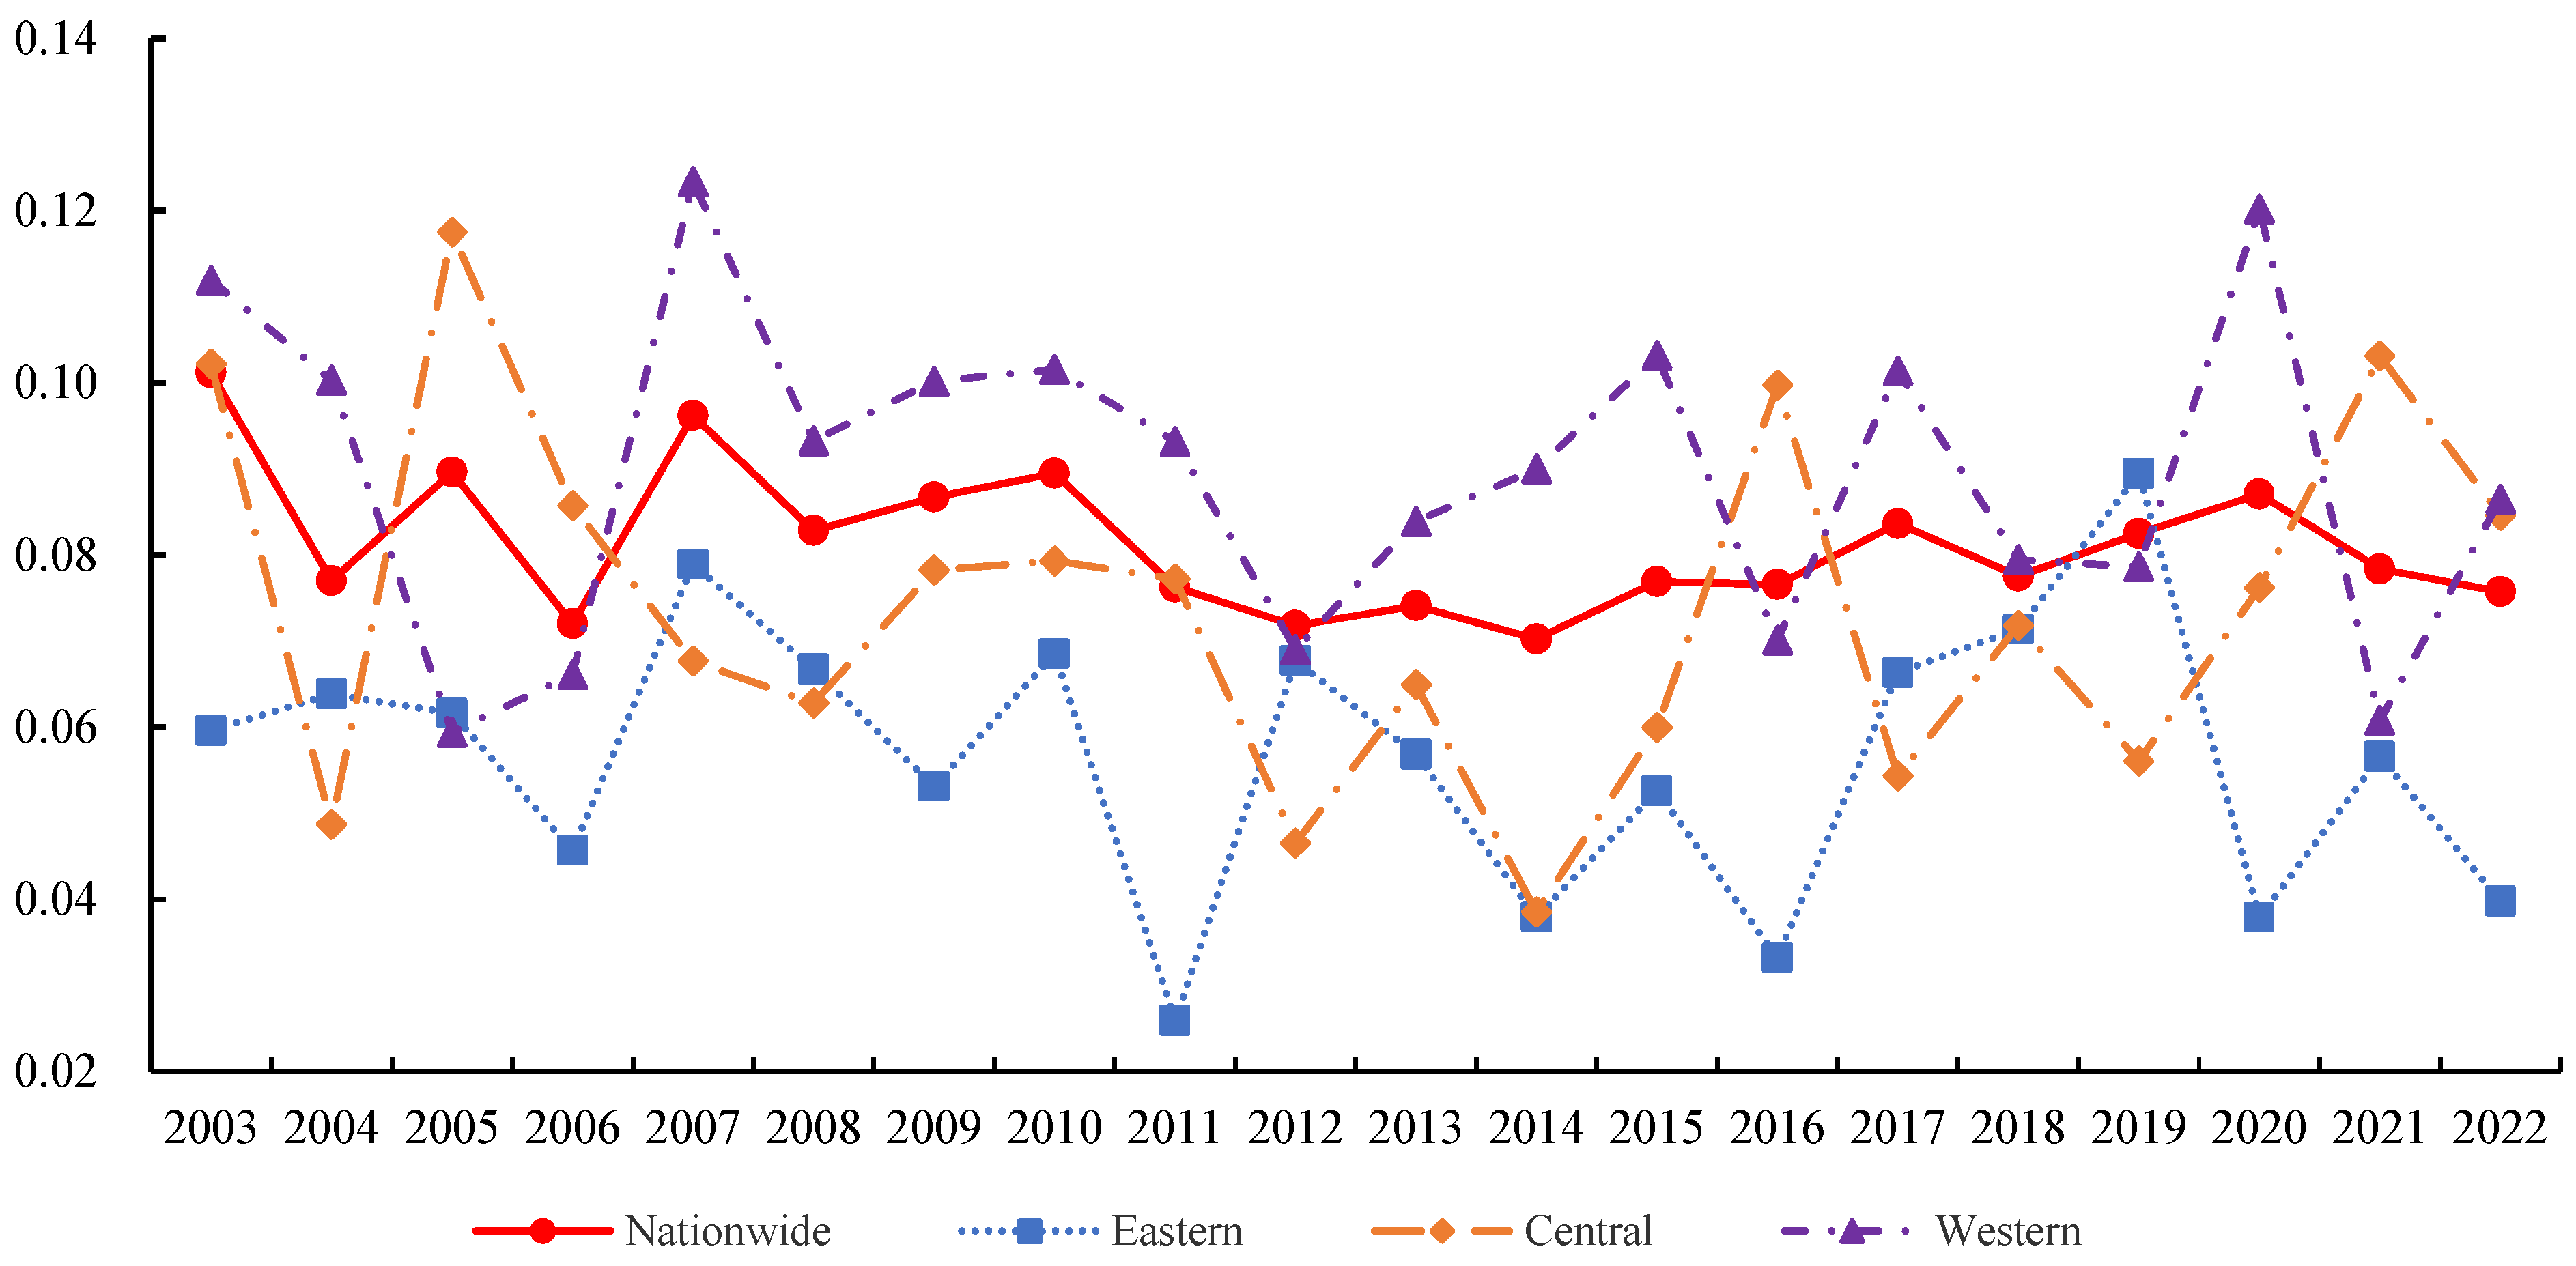
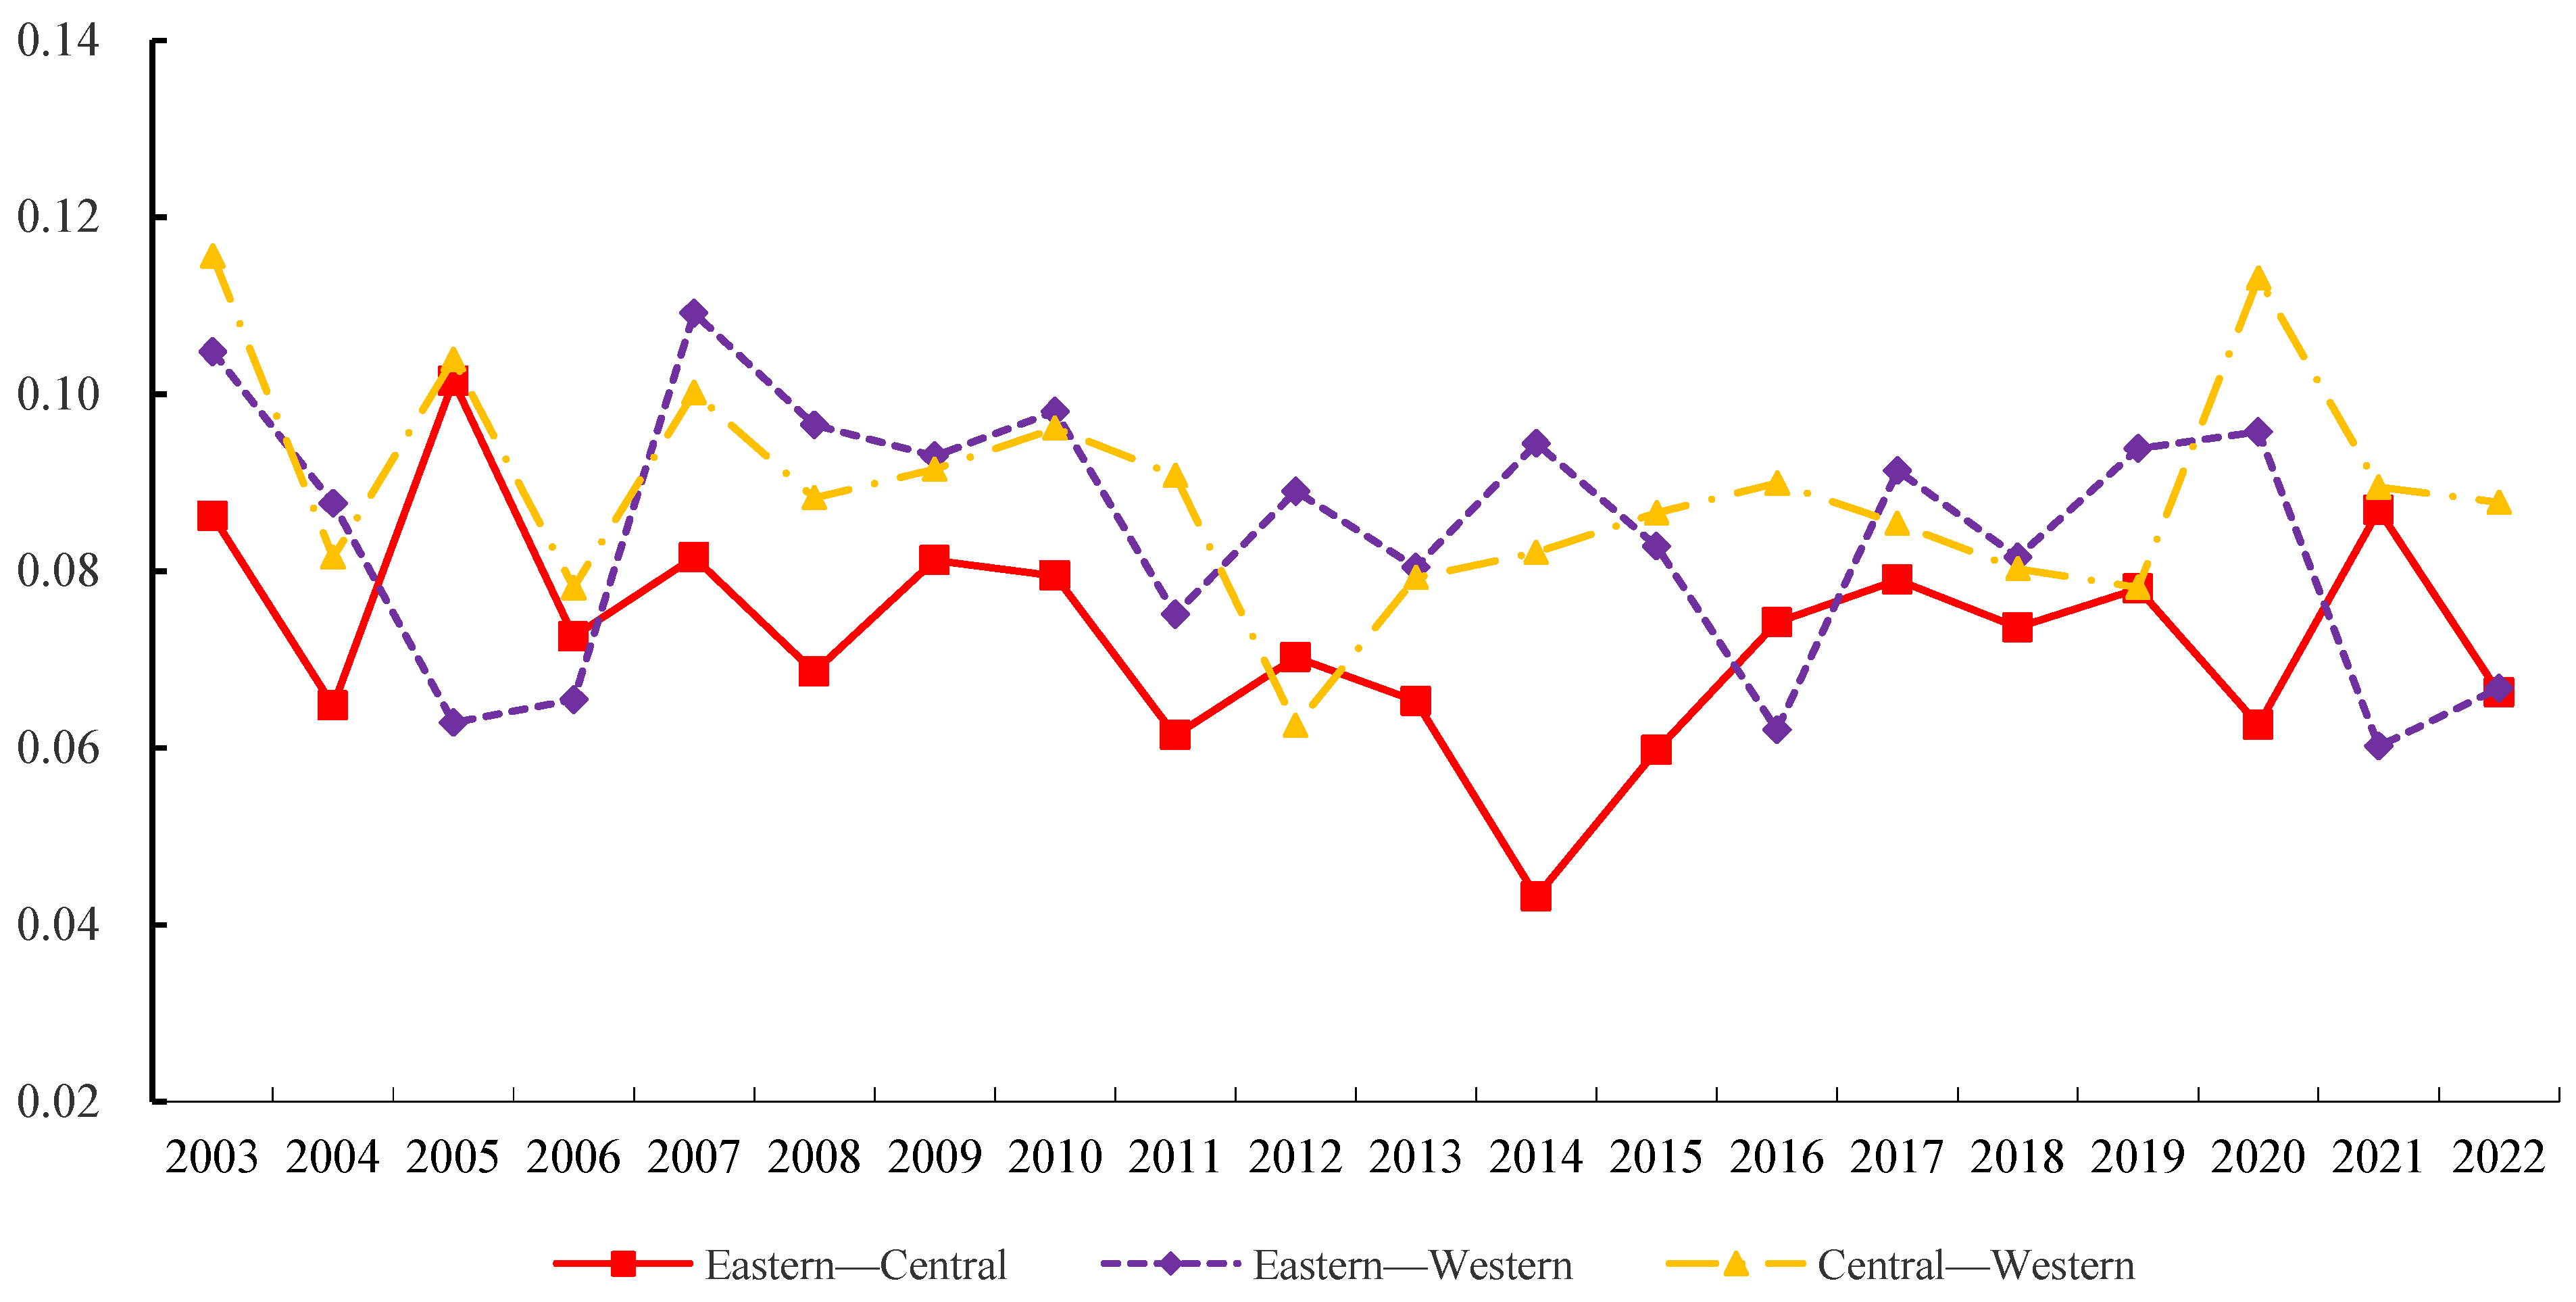
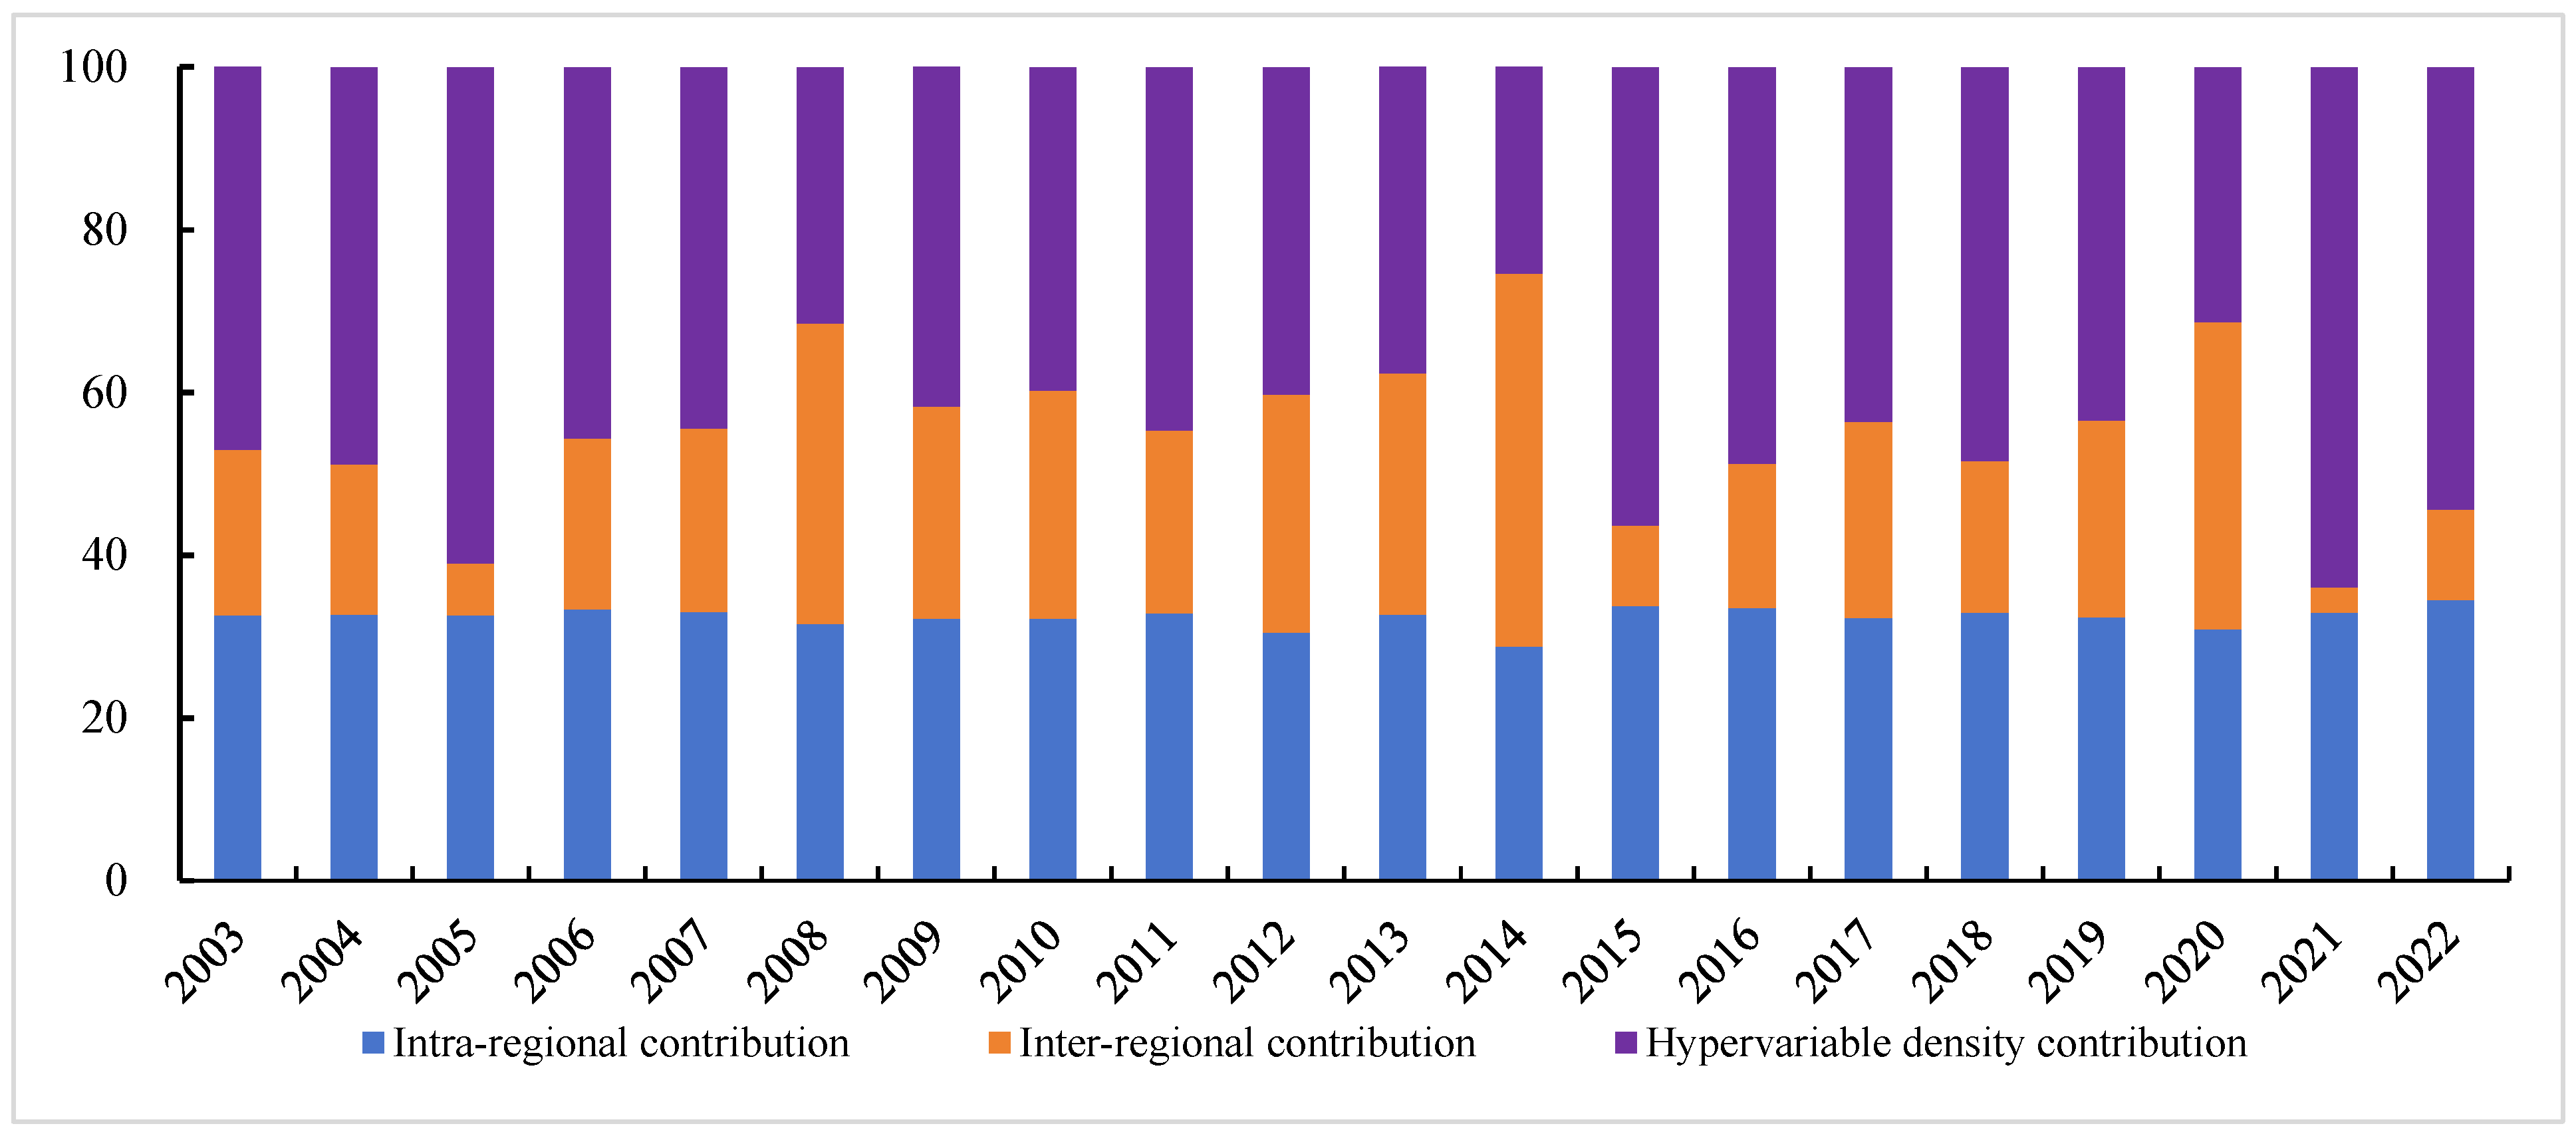
3.2. Characteristics and Sources of Spatial Differentiation

The overall Gini coefficient, the intra-regional Gini coefficient, the inter-regional Gini coefficient, and the contribution rates of agricultural product market integration in the country as a whole and in the eastern, central, and western regions during the period 2003–2022 were measured. Figure 3 depicts the change characteristics of the Gini coefficient of the integration degree of the agricultural product market in China and in the eastern, central, and western regions. On the whole, the Gini coefficient of the integration degree of the national agricultural market during 2003–2022 fluctuated from 0.101 to 0.076 with an average annual decline of 1.26%. This means that the spatial differentiation of the integration degree of the national agricultural product market generally shows a fluctuating downward trend. From the perspective of intra-regional differentiation, the western region had the largest value (the average Gini coefficient during the sample period was 0.090); the central region followed (the average Gini coefficient during the sample period was 0.074), and the western region had a small degree of intra-regional differentiation (the average Gini coefficient during the sample period was 0.057). The Gini coefficients of the eastern, central, and western regions showed trends of fluctuation and decline, and the intra-regional differentiation showed a decreasing trend. Among them, the Gini coefficient fluctuated greatly in the west and relatively less in the eastern and central regions.
Figure 4 depicts the inter-regional Gini coefficient variation characteristics of national agricultural product market integration. From the perspective of the average Gini coefficient, the average value between the eastern and central regions in the sample period is 0.073 with the smallest spatial differentiation. The mean values of east–west and center–west are 0.085 and 0.089, respectively, and the spatial differences between them are relatively large. From the variation characteristics of the Gini coefficient, the spatial differentiation degree of the three regions showed a trend of decreasing fluctuation, but the fluctuation amplitude of the eastern–western regions was the largest, followed by the western–central regions, and finally the eastern–central regions. The Gini coefficient between east and west decreased the most with an average annual decline of 1.81%. The Gini coefficient in the central and western regions followed behind with an average annual decline of 1.21%. The Gini coefficient in the eastern–central regions decreased the least with an average annual decline of 1.16%.
Figure 5 shows the changing characteristics of the contribution rate of each decomposition term of the Gini coefficient to the overall Gini coefficient. The intra-regional contribution of the difference in the integration degree of the national agricultural product market was flat and did not fluctuate significantly, rising from 32.62% in 2003 to 34.54% in 2022, which was an increase of 1.92 percentage points. The inter-regional contribution showed a downward trend and fluctuated greatly, decreasing from 20.34% in 2003 to 11.06% in 2022, with an average annual decline of 0.46 percentage points. The contribution of supervariable density fluctuated from 47.04% in 2003 to 54.19% in 2022, with an average annual increase of 0.37 percentage points. From the perspective of difference sources, the contribution rate of supervariable density is the largest, which was followed by the contribution rate within the region and the smallest contribution rate among regions: 44.88%, 32.44% and 22.68%, respectively. This means that the distribution of the degree of integration of the national agricultural product market is not uniform.

3.3. Trend in Development over Time

We utilized the Dagum–Gini coefficient to scrutinize the features and origins of spatial disparities in China’s agricultural market integration and delineate the changing relative distinctions among the three major regions. However, it is essential to note that our analysis did not encompass an exploration of the temporal evolution trends in the absolute differentiation of agricultural market integration. To address this gap, we conducted a convergence analysis to elucidate the dynamic transformations in this aspect.

3.3.1. σ Convergence Analysis

Figure 6 shows the results of σ convergence of the integration degree of the national agricultural product market. From the perspective of the country as a whole, the coefficient of variation in the integration degree of the national agricultural product market from 2003 to 2022 showed a trend of fluctuation and decline. The σ value decreased from 0.1787 in 2003 to 0.1482 in 2022, which was a decline of 17.07%. The final value was smaller than the initial value of the period, indicating that there was a characteristic of σ convergence. The σ value showed a continuous decline from 2003 to 2006, a sudden rise in 2007, a continuous decline from 2008 to 2012, a fluctuating rise from 2013 to 2020, and a decline after 2021.
The variation coefficients of the integration degree of the agricultural product market in the eastern, central, and western regions showed a downward trend on the whole. Among them, the fluctuation amplitude in the eastern region was the largest, where the σ value dropped sharply in 2004, a decrease of 52.62% compared with the previous year, and showed a trend of fluctuation rising from 2005 to 2021, which was followed by a decline in 2022. The σ value decreased from 0.2023 in 2002 to 0.1655 in 2022, which was a decline of 18.21%. The coefficient of variation for the market integration of agricultural products in the eastern region has the highest degree of volatility among the three regions. The possible explanation is due to the large differences in the development of the agricultural market in the provinces within the eastern region. This shows that at the beginning of the COVID-19 period, the eastern region strictly implemented the centralized policy. Although the degree of market integration has declined, there is little difference in the degree of integration of the agricultural market among the provinces. With policy adjustments, the degree of agricultural market integration is rising. However, there are differences in the adjustment capacity of agricultural markets in different provinces. This leads to a widening of the differences in the market integration of agricultural products within the region. The coefficient of variation also tends to increase.
The central region had the second highest degree of volatility with σ being relatively stable from 2002 to 2010, rising from 2011 to 2020, and declining after 2021. The σ value decreased from 0.1150 in 2002 to 0.0734 in 2022, which was a decrease of 36.17%. The coefficient of variation in agricultural market integration in the central region shows a fluctuating downward trend. The possible explanation is that the vast majority of the central region is a major food-producing region, and agricultural markets are highly influenced by policy and climate. As a result, there are also more pronounced year-to-year fluctuations in differences in the degree of integration of agricultural markets within regions. Among them, the highest point appeared in 2020, and then it continued to decline. This suggests that at the beginning of the COVID-19 period, a series of measures were taken in the central region in order to rapidly control the outbreak. These measures have, to some extent, widened the differences in the integration of agricultural markets. With the control of the COVID-19 pandemic, the central region, with the advantages of the major food-producing areas, has rapidly adjusted the agricultural product market, making the differences in the integration of agricultural products in the region continue to narrow.
The fluctuation range of the western region was the smallest, and the fluctuation trend saw a decrease from 2002 to 2022. The σ value decreased from 0.0392 in 2002 to 0.0197 in 2022, which was a decrease of 49.88%. The coefficient of variation of the integration of the agricultural products market in the western region remains at a low level. At the same time, the above results show that the degree of integration of the agricultural products market in the western region is relatively low. The possible explanations are that first of all, the transportation infrastructure in the western region is relatively poor, and the development of infrastructure such as railways, roads and airports is lower than that in the eastern and central regions, and the higher transportation cost limits the efficiency of agricultural products circulation within the region. Secondly, the information construction in the western region is also relatively poor, the coverage rate of agricultural product market information system is low, and the problem of information asymmetry also affects the integration of agricultural product market. The transportation and information infrastructure construction restricts the development of the agricultural products market in western China, resulting in there being little difference in the integration degree of the agricultural products market within the region. On the whole, the final values of σ in China and in the eastern, central, and western regions were smaller than the initial values, indicating that there was σ convergence generally.

3.3.2. Absolute β Convergence Analysis

Table 2 shows the absolute β convergence results of the integration degree of the agricultural product market in China and the three regions. From a national perspective, the absolute β convergence coefficient of the country is −0.5496, which is statistically significant at the 1% level. From the perspective of the sub-regions, the absolute β convergence coefficient in the eastern region is −0.4863, that in the central region is −0.5407, and that in the western region is −0.6107, which are also statistically significant at the 1% level. This shows that without considering other influencing factors, in the long run, the integration degree of the agricultural product market in the country and eastern, central, and western regions will converge to its own steady-state level, and there is absolute β convergence. In addition, combined with the fact that the fluctuation in the unity degree of the agricultural product market increased (Figure 1) and the fluctuation in the coefficient of variation decreased (Figure 5), it can be seen that the integration degree of the agricultural product market generally increased and a trend of long-term convergence appeared.
Moreover, the speed of convergence is different. The convergence rate of nationwide is 0.0399, and that in the eastern and central regions is lower than this value. The western region has the fastest rate of convergence, 0.0472; the central region is the second fastest, 0.0389; and the eastern region is the slowest, 0.0333. It can be seen that the western region, with the lowest degree of integration of the agricultural product market, has the fastest convergence rate, while the central region, with the highest degree of integration of the agricultural product market, has the slowest convergence rate. This is consistent with the characteristics of the coefficient of variation in the eastern, central, and western regions in Figure 5. A possible explanation is that the western region, with a lower degree of integration of the agricultural product market, has a larger latecomer advantage, and it can achieve a faster degree of integration at a lower cost by imitating, learning from, and drawing on the successful experience of the eastern region with a higher degree of integration of the agricultural product market. This latecomer advantage helps to narrow the distance from advanced areas, thus resulting in a faster convergence rate.

3.3.3. Conditional β Convergence Analysis

The fact that only the initial value is included in the absolute β convergence test results in a large difference from reality and affects the accuracy of the estimated results. Therefore, factors such as the degree of openness to the outside world, fiscal decentralization, the financial development level, traffic conditions, market size, GDP, industrial structure, and the information development level with regional heterogeneity are included as control variables for further testing, and the results are shown in Table 3. Table 3 shows the conditional β convergence results of the integration degree of the agricultural product market in China and the three regions.
Firstly, from a national perspective, the national conditional β convergence coefficient is −0.8567, which is statistically significant at the 1% level. For the three regions, the conditional β convergence coefficient of the eastern region is −0.7808, that of the central region is −0.9328, and that of the western region is −0.9653, which all are statistically significant at the 1% level. This shows that after considering a series of social and economic factors, the integration degrees of the agricultural product market in the country and various regions will converge to their own steady-state level, indicating the existence of conditional β convergence.
Secondly, in terms of the rate of convergence, the national and regional convergence rates increased relatively to the absolute β convergence. The national convergence rate increased to 0.0971, and the convergence rate in the central and western regions was higher than this value. The convergence rate in the western region was the highest, and that in the eastern region was the lowest, which is consistent with the results of absolute β convergence. This shows that after considering a series of social and economic factors, the latecomer advantage of the western region can still maintain a high rate of convergence.
Thirdly, there are differences in the factors influencing the degree of integration of agricultural product markets across the country and various regions. Specifically, fiscal decentralization has a significant negative impact on the degree of integration of agricultural product markets nationwide and in most regions. This indicates that fiscal decentralization is detrimental to the integration of agricultural product markets. A possible reason is that fiscal decentralization leads local governments to adopt protectionist policies in their own self-interest, restricting the inflow of agricultural products from other regions into the local market, thereby exacerbating market segmentation. The level of financial development has a significant positive impact on the degree of integration of agricultural product markets nationwide but not a significant impact in the eastern, central, and western regions. This suggests that financial development contributes to promoting the integration of agricultural product markets nationwide. A possible reason is that the integration of agricultural product markets involves multiple links, including production, processing, circulation, and sales. These links all require substantial capital investment. Financial development can provide financial support for each link of the agricultural product market, reduce the financing costs for market entities, and ultimately enhance the degree of integration of agricultural product markets. Regionally, the level of financial development still needs to be improved, so the positive effect is not pronounced. Transportation conditions have a significant positive impact on the degree of integration of agricultural product markets nationwide and in most regions. This suggests that improved transportation conditions can enhance the degree of integration of agricultural product markets. A possible reason is that better transportation conditions reduce transportation costs and time, improve the accessibility of agricultural product markets, expand their scope of circulation, and thereby increase their integration overall. The industrial structure has a significant negative impact on the degree of integration of agricultural product markets nationwide and in the western region. A possible reason is that an increase in the proportion of the primary industry concentrates resources in traditional agricultural production areas, while the development of supporting processing industries and service industries lags behind. This irrational industrial structure intensifies the homogenization of competition on the market. This limits the depth and breadth of agricultural product markets and hinders the improvement in their integration. The level of information development has a significant positive impact on the degree of integration of agricultural product markets nationwide and in the western region. This suggests that improved information development contributes to the integration of agricultural product markets. A possible reason is that enhanced information development can substantially reduce information search costs and improve market circulation efficiency, thereby increasing the degree of integration of agricultural product markets.

4. Discussion

China has a large population but extremely few agricultural land resources per capita. Food security has always been a top priority for the Chinese government. To secure food security in segmented agricultural markets, additional policy costs will be higher [38,39]. However, highly integrated agricultural markets contribute to inter-regional trade liberalization [40] and improve potential gains in food security at lower costs [41]. Increased food availability is very important for China, which has a large population. Free trade in agricultural products among regions can help increase production efficiency and thus increase food supply [42]. At the same time, for consumers, highly integrated markets for agricultural products can reduce transaction costs, thereby lowering the price of agricultural products, as well as increase the level of consumer welfare. For farmers, highly integrated agricultural markets can reduce price volatility for agricultural products and market risks, thereby increasing income levels [43].
Based on the consumer price indexes of seven kinds of agricultural products, in this study, to measure the integration degree of the Chinese agricultural product market, we use the relative price method. In contrast, Antwiago et al. and Ahmed et al. [44,45] used the monthly price data of a single agricultural product and only investigated the issue of whether there was integration in the agricultural market. On the other hand, we measure the fluctuation in agricultural price differentials among different regions and focus on the trend in agricultural market integration over time. In addition, our research conclusions show that the integration degree of the national agricultural product market did not increase continuously during 2003–2022 but showed a certain increase in fluctuation. This conclusion is not consistent with that of Heerman et al. [46]. The reason for this is that our sample set includes data from the period of the epidemic, and the results are more time-sensitive. Our conclusions can provide practical guidance for developing countries to stabilize agricultural prices and ensure an effective supply of agricultural products in the face of major public health emergencies.
From the perspective of spatial differentiation characteristics, the spatial differentiation degree of national agricultural product market integration from 2003 to 2022 shows a trend of fluctuation and decline. However, there are regional differences in the integration of agricultural markets among the eastern, central, and western regions. This conclusion is consistent with that of Lai et al. [47]. China has a large land area, and the social and economic characteristics of the three regions are quite different. The eastern region is more densely populated with better transport infrastructure and a more developed agricultural market. The population of the western region is scattered, the transportation infrastructure is underdeveloped, and the agricultural product market is poorly developed. The difference in these characteristics leads to regional differences in the integration of China’s agricultural product market, but its spatial differentiation is decreasing. Therefore, for developing countries, it is possible to determine the characteristics of the domestic agricultural product market and adopt different strategies to promote its integration at the national level.
Agricultural product market integration exhibits σ convergence and β convergence. This conclusion is not consistent with Sekhar [48]. Sekhar’s research shows that Indian rice is subject to inter-state movement restrictions. In contrast, the integration of the agricultural product market in China will eventually converge to a stable level. The reason is that the Chinese government continues to invest in transport infrastructure, making different regional markets increasingly interconnected. Therefore, for developing countries, governments can continuously reduce transportation costs and promote inter-regional agricultural trade by strengthening infrastructure construction. Meanwhile, Olper and Raimondi found a process of strong integration in all the country–trade combinations involving CEECs [49]. This conclusion is beneficial to the integration of China’s agricultural products market. This means that the Chinese government can adopt uniform market rules to continuously promote the integration of the agricultural market.
By studying the development status, dynamic evolution, and convergence of Chinese agricultural product market integration, this study extends the existing literature and makes some marginal contributions. However, due to the availability of the data and the limitations of the researchers, there are still some limitations and deficiencies in this study, and these gaps need to be further studied and filled in the future. First, we use province-level data. Due to the large number of missing values in the data at the city and county levels (city-level and county-level samples are not used in this study), the statistical caliber is also different. Therefore, in the future research, we need to obtain a wider range of materials and data for analysis [50]. Second, the data used in this study include the consumer price indexes of seven categories of agricultural products. Since there are no more detailed consumer price indexes of other agricultural products published in the open authoritative database, we do not analyze the changing trend of market integration of other types of agricultural products. Therefore, in the future, we can collect more price data of agricultural products based on this study to observe the price differences of different types of agricultural products [51] so as to enrich the research on the integration of agricultural products market.

5. Conclusions and Policy Implications

5.1. Conclusions

In this study, we utilize the consumer price indexes of seven categories of agricultural products (including grain; oil and fats; meat, poultry, and their products; eggs; aquatic products; vegetables; and fresh and dried fruits) from 31 Chinese provinces from 2003 to 2022. Based on the measurement of agricultural product market integration indicators using the relative price method, the Dagum–Gini coefficient and the σ convergence and β convergence models are used to systematically analyze the development status, dynamic evolution, and convergence of agricultural product market integration in China. The main research conclusions are as follows.
First, from the perspective of the development level, the integration of the national agricultural product market does not show continuous growth but a certain increase in volatility. There are differences in the integration of the agricultural product market in different regions, with the highest integration being observed in the east, which was followed by the central and western regions.
Second, from the perspective of the spatial differentiation characteristics, the spatial differentiation degree of the integration of agricultural product markets throughout the country and in the three regions fluctuates and declines. The fluctuation range between east and west is the largest, which is followed by the central and western regions and finally the eastern and central regions. From the perspective of difference sources, the contribution rate of supervariable density is the largest, which is followed by the contribution rate within the region and finally the contribution rate among regions.
Third, from the perspective of convergence, the final value of the coefficient of variation in the country and the three regions is much smaller than the initial value of the period, indicating that there is σ convergence. Moreover, absolute β convergence and conditional β convergence exist in the country as a whole and in the three regions. The degree of integration of the agricultural product market will converge to its own steady-state level.

5.2. Policy Implications

First, we should increase policy support for the integration and construction of agricultural markets. On the one hand, we should build a modern market system for agricultural products. Under the leadership of accelerating market innovation, we should promote changes and innovations in the organization of the agricultural products market, circulation methods, and business models in various ways and at a deeper level, speed up the construction of a modern market system for agricultural products, build a high-standard market system, reduce market transaction costs, and promote the free circulation of agricultural products in a broader and deeper. On the other hand, we should establish unified agricultural products market rules, effectively restrict local market segmentation, and promote system-level market integration and construction.
Second, we need to optimize resource allocation and narrow the development gaps among regions. Firstly, we should pay attention to the differences in the integration of agricultural markets between regions, adopt a targeted fiscal policy for underdeveloped areas in the central and western regions, and improve infrastructure development. Secondly, we should establish regional cooperation mechanisms to promote information sharing, resource complementarity, and market interoperability.
Third, we should promote the construction of local and national agricultural product market information centers; strengthen the collection and management of information in the production, transportation, and marketing of agricultural products; optimize the construction of public information platforms; build a professional information-sharing platform around the agricultural product market; promote the interconnection of platforms at all levels; and enhance the effective connection between supply- and demand-side information.

Author Contributions

Conceptualization, F.L.; methodology, F.L.; software, F.L.; validation, F.L.; formal analysis, Y.G.; resources, F.L.; data curation, Y.G. and F.L.; writing—original draft preparation, F.L.; writing—review and editing, F.L.; visualization, Y.G.; supervision, Y.G.; project administration, Q.L.; and funding acquisition, Q.L. All authors have read and agreed to the published version of the manuscript.

Funding

This research study was funded by the National Social Science Planning Project “Research on Digitally Empowering the Integrated Development of Rural Three Industries in Wuling Mountain Ethnic Areas” (24CMZ042).

Institutional Review Board Statement

Not applicable.

Data Availability Statement

The data presented in this study are available from the first author upon request.

Conflicts of Interest

The authors declare no conflicts of interest.

References

  1. Bian, Y.; Song, K.; Bai, J. Market segmentation, resource misallocation and environmental pollution. J. Clean. Prod. 2019, 228, 376–387. [Google Scholar] [CrossRef]
  2. Borsellino, V.; Schimmenti, E.; El Bilali, H. Agri-food markets towards sustainable patterns. Sustainability 2020, 12, 2193. [Google Scholar] [CrossRef]
  3. Miao, X.; Han, J.; Wang, S.; Li, X. Spatial effects of market integration on the industrial agglomeration of agricultural products: Evidence from China. Environ. Sci. Pollut. Res. 2023, 30, 84949–84971. [Google Scholar] [CrossRef] [PubMed]
  4. Kabbiri, R.; Dora, M.; Elepu, G.; Gellynck, X. A global perspective of food market integration: A review. Agrekon 2016, 55, 62–80. [Google Scholar] [CrossRef]
  5. Kim, S. Expansion of markets and the geographic distribution of economic activities: The trends in US regional manufacturing structure, 1860–1987. Q. J. Econ. 1995, 110, 881–908. [Google Scholar] [CrossRef]
  6. Naughton, B. How much can regional integration do to unify China’s markets? In How Far Across the River; Stanford University Press: Redwood City, CA, USA, 2003; pp. 204–232. [Google Scholar]
  7. Parsley, D.C.; Wei, S.J. Convergence to the law of one price without trade barriers or currency fluctuations. Q. J. Econ. 1996, 111, 1211–1236. [Google Scholar] [CrossRef]
  8. Xu, X. Have the Chinese provinces become integrated under reform? China Econ. Rev. 2002, 13, 116–133. [Google Scholar] [CrossRef]
  9. Young, A. The razor’s edge: Distortions and incremental reform in the People’s Republic of China. Q. J. Econ. 2000, 115, 1091–1135. [Google Scholar] [CrossRef]
  10. Ke, S. Domestic market integration and regional economic growth—China’s recent experience from 1995–2011. World Dev. 2015, 66, 588–597. [Google Scholar] [CrossRef]
  11. Zhang, Y.; Hao, X.Y.; Han, Y.J. Analysis on vertical price transmission and market integration of wheat industry chain in China. Econ. Probl. 2018, 65–70. [Google Scholar]
  12. Loy, J.P.; Weiss, C.R.; Glauben, T. Asymmetric cost pass-through? Empirical evidence on the role of market power, search and menu costs. J. Econ. Behav. Organ. 2016, 123, 184–192. [Google Scholar] [CrossRef]
  13. Abay, K.A.; Abdelfattah, L.; Breisinger, C.; Siddig, K. Evaluating cereal market (dis) integration in less developed and fragile markets: The case of Sudan. Food Policy 2023, 114, 102399. [Google Scholar] [CrossRef]
  14. Wu, L.P. Study on the relationship between domestic and foreign grain markets. Chin. Rural. Obs. 2001, 01, 24–32. [Google Scholar] [CrossRef]
  15. Li, Z.; Diao, G.; Zhao, H.F. Dynamic Analysis of Chinese mutton price market integration: Granger Causality Test based on spectrum. Agric. Tech. Econ. 2020, 11, 122–134. [Google Scholar] [CrossRef]
  16. Nigatu, G.; Adjemian, M. A wavelet analysis of price integration in major agricultural markets. J. Agric. Appl. Econ. 2020, 52, 117–134. [Google Scholar] [CrossRef]
  17. Zhou, Z.Y.; Wan, G.H.; Chen, L.B. Integration of rice markets: The case of southern China. Contemp. Econ. Policy 2000, 18, 95–106. [Google Scholar] [CrossRef]
  18. Latham, A.J.H.; Neal, L. The international market in rice and wheat, 1868–1914. Econ. Hist. Rev. 1983, 36, 260–280. [Google Scholar] [CrossRef]
  19. Awokuse, T.O. Market reforms, spatial price dynamics, and China’s rice market integration: A causal analysis with directed acyclic graphs. J. Agric. Resour. Econ. 2007, 32, 58–76. [Google Scholar]
  20. Rozelle, S.; Park, A.; Huang, J.; Jin, H. Liberalization and rural market integration in China. Am. J. Agric. Econ. 1997, 79, 635–642. [Google Scholar] [CrossRef]
  21. Zhou, W. The role of the state in making a national market: The evolution of the grain market in China (1978–2000). China Agric. Econ. Rev. 2010, 2, 276–297. [Google Scholar] [CrossRef]
  22. Huang, X.; Chen, S.; Li, T. Price differences, market segmentation and border effect: Based on empirical analysis of 15 cities in Yangtze River Delta province. Econ. Res. J. 2014, 49, 18–32. [Google Scholar]
  23. Ge, Y.; Wang, H.H.; Ahn, S.K. Cotton market integration and the impact of China’s new exchange rate regime. Agric. Econ. 2010, 41, 443–451. [Google Scholar] [CrossRef]
  24. Liu, R.; Liu, R. SOEs, Invisible Subsidy and Market Segmentation: Mechanism III. In How State-Owned Enterprises Drag on Economic Growth: Theory and Evidence from China; Springer: Berlin/Heidelberg, Germany, 2019; pp. 73–95. [Google Scholar]
  25. Zheng, S.; Kahn, M.E. China’s bullet trains facilitate market integration and mitigate the cost of megacity growth. Proc. Natl. Acad. Sci. USA 2013, 110, E1248–E1253. [Google Scholar] [CrossRef] [PubMed]
  26. Yang, Z.; Ye, Z. Domestic market integration in China: The role of the financial sector. Chin. Econ. 2016, 49, 343–358. [Google Scholar] [CrossRef]
  27. Liu, H.B.; McCarthy, B.; Chen, T.; Guo, S.; Song, X. The Chinese wine market: A market segmentation study. Asia Pac. J. Mark. Logist. 2014, 26, 450–471. [Google Scholar] [CrossRef]
  28. Aruga, K.; Li, R. Testing market integration for Japanese retail seafood markets. Aust. J. Agric. Resour. Econ. 2016, 60, 212–226. [Google Scholar] [CrossRef]
  29. Lv, B.; He, Y. Decentralization, tax division and market segmentation. J. Peking Univ. Philos. Soc. Sci. 2019, 56, 54–66. [Google Scholar]
  30. Ma, Z.; Li, W.; Wang, Q. Does financial development promote regional economic integration?—Empirical evidence from Yangtze River Delta region. J. Harbin Univ. Commer. Soc. Sci. Ed. 2022, 2, 43–57. [Google Scholar]
  31. Wang, W.; Kong, F. Study on the impact of transportation infrastructure construction and Internet Development on regional market segmentation. J. Yunnan Univ. Financ. Econ. 2019, 36, 3–16. [Google Scholar]
  32. Zhou, L.; Feng, D. Structural decomposition and integration of market size: A Study based on China’s inter-regional Input-output table. J. Xiangtan Univ. Philos. Soc. Sci. Ed. 2016, 40, 80–84. [Google Scholar]
  33. Tuo, Y.; Kong, L. Will target constraints on economic growth exacerbate beggar-thy-neighbor policies? Mod. Econ. Res. 2022, 8, 25–39. [Google Scholar]
  34. Xie, F.; Yuan, L.; Fu, W. How can the Yangtze River Delta achieve high-quality market integration?—Based on the perspective of opening up, upgrading of industrial structure and financial development. Reform 2021, 6, 112–124. [Google Scholar]
  35. Samuelson, P.A. Theoretical notes on trade problems. Rev. Econ. Stat. 1964, 46, 145–154. [Google Scholar] [CrossRef]
  36. Parsley, D.C.; Wei, S.J. Explaining the border effect: The role of exchange rate variability, shipping costs, and geography. J. Int. Econ. 2001, 55, 87–105. [Google Scholar] [CrossRef]
  37. Dagum, C. A new approach to the decomposition of the Gini income inequality ratio. Empir. Econ. 1997, 22, 515–531. [Google Scholar] [CrossRef]
  38. Shahzad, M.A.; Razzaq, A.; Qing, P.; Rizwan, M.; Faisal, M. Food availability and shopping channels during the disasters: Has the COVID-19 pandemic changed peoples’ online food purchasing behavior? Int. J. Disaster Risk Reduct. 2022, 83, 103443. [Google Scholar] [CrossRef]
  39. Shahzad, M.A.; Qing, P.; Rizwan, M.; Razzaq, A.; Faisal, M. COVID-19 Pandemic, Determinants of Food Insecurity, and Household Mitigation Measures: A Case Study of Punjab, Pakistan. Healthcare 2021, 9, 621. [Google Scholar] [CrossRef]
  40. Bagnied, M.A.; Speece, M. Marketing and regional integration for food security in the Arab world. J. Macromarket. 2019, 39, 115–135. [Google Scholar] [CrossRef]
  41. Simola, A.; Boysen, O.; Ferrari, E.; Nechifor, V.; Boulanger, P. Economic integration and food security—The case of the AfCFTA. Glob. Food Secur. 2022, 35, 100651. [Google Scholar] [CrossRef]
  42. Sanogo, I.; Amadou, M.M. Rice market integration and food security in Nepal: The role of cross-border trade with India. Food Policy 2010, 35, 312–322. [Google Scholar] [CrossRef]
  43. Caliendo, L.; Opromolla, L.D.; Parro, F.; Sforza, A. Goods and factor market integration: A quantitative assessment of the EU enlargement. J. Political Econ. 2021, 129, 3491–3545. [Google Scholar] [CrossRef]
  44. Antwiago Amarchey, C.; Adjei Kwakwa, P. Spatial market integration analysis of plantain markets in mid Ghana. Cogent Bus. Manag. 2024, 11, 2311222. [Google Scholar] [CrossRef]
  45. Ahmed, M.; Singla, N.; Singh, K. Market integration and price transmission in wheat markets of India: A transaction cost approach. J. Agribus. Dev. Emerg. Econ. 2024, 14, 552–569. [Google Scholar] [CrossRef]
  46. Heerman, K.E.R.; Arita, S.; Gopinath, M. Asia-Pacific Integration with China versus the United States: Examining Trade Patterns under Heterogeneous Agricultural Sectors. Am. J. Agric. Econ. 2015, 97, 1324–1344. [Google Scholar] [CrossRef]
  47. Lai, J.T.; McNelis, P.D.; Yan, I.K.M. Regional capital mobility in China: Economic reform with limited financial integration. J. Int. Money Financ. 2013, 37, 493–503. [Google Scholar] [CrossRef]
  48. Sekhar, C. Agricultural market integration in India: An analysis of select commodities. Food Policy 2012, 37, 309–322. [Google Scholar] [CrossRef]
  49. Olper, A.; Raimondi, V. Agricultural market integration in the OECD: A gravity-border effect approach. Food Policy 2008, 33, 165–175. [Google Scholar] [CrossRef]
  50. d’Amato, M.; Cucuzza, G. Cyclical capitalization: Basic models. Aestimum 2022, 80, 45–54. [Google Scholar] [CrossRef]
  51. Deaconu, A.; Oprean, V.B.; Buiga, A. Trends in real estate appraisal: An emerging context. Afr. J. Bus. Manag. 2015, 9, 478–489. [Google Scholar]
Figure 1. The development of agricultural product market integration.
Agriculture 15 00861 g001
Figure 2. Spatial distribution of the development of agricultural product integration in China. Note: Produced on the basis of the standard base map of the Standard Map Service System of the State Administration of Surveying, Mapping and Geographic Information (Review No. GS(2023)2767), with no modifications to the base map.
Agriculture 15 00861 g002
Figure 3. Degree of differentiation overall and within regions.
Agriculture 15 00861 g003
Figure 4. Degree of inter-regional differentiation.
Agriculture 15 00861 g004
Figure 5. Contribution of sources of spatial differentiation.
Agriculture 15 00861 g005
Figure 6. The results of σ convergence.
Agriculture 15 00861 g006
Table 1. Results of descriptive statistics.
VariableObservationsMeanStandard Deviation
Market integration62045.110914.2471
Openness to outside world6200.30220.3549
Fiscal decentralization 6202.64722.0733
Level of financial development6200.06010.0321
Traffic conditions 62013.08947.9663
Market size6200.29960.7859
Gross domestic product 6201.85941.3063
Industrial structure6200.11050.0595
Level of information development6200.38810.2211
Table 2. Absolute β convergence results.
VariableNationwideEastern CentralWestern
β−0.5496 ***−0.4863 ***−0.5407 ***−0.6107 ***
(0.0348)(0.0544)(0.0687)(0.0590)
constant2.0958 ***1.8267 ***2.0732 ***2.2359 ***
(0.1309)(0.2098)(0.2653)(0.2240)
v0.0399 0.03330.03890.0472
N589209152228
R20.3090.2900.3030.333
Note: Standard deviations are presented in parentheses (), while *** denote significance levels of 1%, respectively.
Table 3. Conditional β convergence results.
VariableNationwideEastern CentralWestern
β−0.8567 ***−0.7808 ***−0.9328 ***−0.9653 ***
(0.0428)(0.0726)(0.0853)(0.0685)
Openness to outside world−0.1618−0.0413−0.7104−0.2534
(0.1187)(0.1558)(0.7903)(0.4876)
Fiscal decentralization−0.0403 *−0.3311 **−0.1835 **−0.0120
(0.0212)(0.1543)(0.0765)(0.0247)
Level of financial development 2.2757 *0.51904.32892.0206
(1.3213)(2.3657)(3.5086)(2.1179)
Traffic conditions 0.0119 **0.0175 *0.0318 ***−0.0044
(0.0049)(0.0096)(0.0086)(0.0091)
Market size0.0197−0.0313−2.13760.4790
(0.0465)(0.0611)(0.9099)(0.8900)
Gross domestic product −0.03620.04470.0105−0.1141
(0.0274)(0.0373)(0.1672)(0.0705)
Industrial structure−1.5055 **−0.0283−1.1071−5.1934 ***
(0.6775)(1.6648)(0.9744)(1.6677)
Level of information 0.3637 **0.32480.40550.7656 **
(0.1439)(0.2024)(0.5800)(0.3509)
constant3.1809 ***2.9868 ***3.7382 ***4.2686 ***
(0.1976)(0.4564)(0.4030)(0.4927)
v0.0971 0.07590.13500.1681
N589209152228
R20.4340.4100.4860.497
Note: Standard deviations are presented in parentheses (), while *, **, and *** denote significance levels of 10%, 5%, and 1%, respectively.
Disclaimer/Publisher’s Note: The statements, opinions and data contained in all publications are solely those of the individual author(s) and contributor(s) and not of MDPI and/or the editor(s). MDPI and/or the editor(s) disclaim responsibility for any injury to people or property resulting from any ideas, methods, instructions or products referred to in the content.

