Article

Risk Perception and Management Strategies Among Ecuadorian Cocoa Farmers: A Comprehensive Analysis of Attitudes and Decisions

by
José Díaz-Montenegro
1,*,
Raúl Minchala-Santander
1 and
Marco Faytong-Haro
2,3
1
Facultad de Ciencias Sociales, Educación Comercial y Derecho, Universidad Estatal de Milagro, Milagro 091050, Ecuador
2
Facultad de Investigación, Universidad Estatal de Milagro, Milagro 091050, Ecuador
3
Ecuadorian Development Research Lab, Daule 090656, Ecuador
*
Author to whom correspondence should be addressed.
Agriculture 2025, 15(8), 843; https://doi.org/10.3390/agriculture15080843
Submission received: 23 October 2024 / Revised: 14 November 2024 / Accepted: 18 November 2024 / Published: 14 April 2025
(This article belongs to the Section Agricultural Economics, Policies and Rural Management)

Abstract

:
Cocoa farming in Ecuador faces significant challenges due to market volatility and climate-related risks, necessitating effective risk management strategies. This study investigates the interplay between risk attitudes (RAs), risk perceptions (RPs), and risk management strategies (RMSs) among Ecuadorian cocoa farmers, examining how these factors influence decision-making under uncertainty. Combining experimental lotteries to assess risk and loss aversion, with partial least squares structural equation modeling (PLS-SEM) to analyze survey data, we explore how farmers prioritize perceived impacts over probabilities in their risk assessments. The findings reveal that farmers focus more on mitigating severe perceived impacts, such as price drops and production losses due to adverse weather, than on probability-based strategies, commonly opting for diversification and nonagricultural activities. These results highlight the importance of designing policies and tools that address the perceived impacts of risks, align support with farmers’ needs, and improve access to financial resources and tailored insurances. This approach offers valuable insights for policymakers aiming to enhance cocoa farmers’ resilience in volatile agricultural environments.

1. Introduction

Cacao is a vital cash crop in Ecuador that occupies the largest agricultural area among permanent crops, playing a crucial role in both the country’s economy and the livelihoods of small-scale farmers [1]. Ecuador is one of the world’s leading cocoa-producing countries; it is often ranked in the top five and has maintained its position as the top fine-flavor cacao producer, supplying 63% of worldwide production through the commercialization of the Arriba Nacional variety [2]. In recent years, cacao cultivation has expanded significantly, covering approximately 25% of Ecuador’s total agricultural land by 2021, reflecting consistent growth in response to market demand [3]. However, Ecuadorian cacao farmers face considerable risks and uncertainties, including severe market volatility and climate-related hazards, which impact production stability and farmer livelihoods. The volatility of cocoa prices often surpasses that of other crops, such as maize and soybean, as output fluctuations from various regions contribute to price instability [4]. Ecuador’s cocoa supply chain also grapples with sustainability issues, particularly for small-scale farmers who face restricted access to tangible assets, financial support, and global markets. These limitations hinder their capacity to make substantial improvements and maximize productivity [5]. Nevertheless, Ecuadorian cocoa farming generally exerts minimal input pressure and helps mitigate climate change through significant carbon capture in biomass [6].
Agricultural risk management is a critical component of contemporary farming practices, encompassing diverse strategies that address the inherent uncertainties and vulnerabilities in agricultural production. Farmers encounter numerous challenges, including production, price, commercialization, and institutional constraints, which collectively add complexity to farming operations [1,2]. To manage these challenges effectively, farmers implement risk management strategies that are adapted to their specific circumstances, resources, and risk preferences [3,4]. These strategies may include crop diversification to mitigate production risks, participation in insurance programs to safeguard against financial losses, and the adoption of innovative technologies to enhance productivity and resilience [5,6]. Furthermore, farmers frequently engage in off-farm activities or participate in cooperatives to distribute risk and increase their capacity to withstand market volatility and environmental uncertainty [1]. The efficacy of these risk-management approaches is influenced by factors such as farm size, financial capacity, and access to information, underscoring the need for tailored solutions that address the diverse needs of agricultural communities [7].
While it is commonly acknowledged that decision-makers’ risk perceptions influence their decision-making processes [8], few studies have explored the complex interplay between risk perception and risk attitudes in determining risk management strategies among small-scale farmers in high-risk settings [9]. Risk perception (RP) is shaped by both the perceived likelihood and impact of an event on an individual [10,11]. Consequently, farmers evaluate both the probability of an uncertain event and its potential negative consequences during their decision-making processes [12]. Risk attitude (RA), also known as risk aversion or propensity, is defined as an individual’s inclination towards risk-taking, which can range from risk-averse to risk-seeking behaviors [13,14]. Since people have varying attitudes toward risk, they react differently regardless of their individual risk perception [15,16].
Although the existing body of research extensively explores the importance of RP and RA in understanding how individuals manage risk, these concepts have rarely been comprehensively studied to clarify their combined impact on farmers’ decision-making processes [1,8]. Moreover, previous studies often fail to examine how these psychological constructs interact with farmers’ actual management strategies in the context of specific crops and regions, leaving a gap in understanding the role of perceived risk and risk aversion in decision-making among cocoa farmers in Ecuador. In addition, the potential mediating roles of RP and RA in relation to risk management strategies (RMS) have not been thoroughly investigated [17]. Risk attitudes and multidimensional risk perception constructs may collectively have significant direct and indirect effects on farmers’ decisions regarding the implementation of specific risk-management strategies [18].
This study builds on previous research by employing an innovative combination of experimental lotteries and Partial Least Squares Structural Equation Modeling (PLS-SEM) to provide a comprehensive analysis of how Ecuadorian cocoa farmers perceive and respond to agricultural risks. The use of experimental lotteries allows for a precise measurement of farmers’ risk and loss aversion [19], while PLS-SEM provides insight into how these psychological constructs interact with farmers’ chosen risk management strategies [20]. In this study, the interaction between RP and RA was explored in the context of Ecuadorian cacao farmers who face significant risks due to climate variability and market volatility. By examining how RP and RA influence decision-making, this study seeks to contribute to a broader understanding of how internal strategies such as diversification and debt management are employed to mitigate perceived risks. These findings have significant implications for the development of adaptive risk management tools that address both the perceived impact of risks and farmers’ attitudes toward uncertainty, thereby enhancing their capacity to withstand external shocks [21].
This research aims to provide insights that can inform policy design and the development of tailored risk management tools for Ecuadorian cocoa farmers. By examining how these farmers perceive risk exposure, particularly in terms of price volatility and climate-related challenges, the findings offer practical guidance for industry stakeholders, policymakers, and agricultural advisors seeking to enhance resilience in Ecuador’s cocoa sector. The structure of this paper is as follows. The theoretical model is introduced in Section 2, followed by a description of the materials and methods in Section 3. Section 4 presents the primary findings, and Section 5 concludes the paper with a discussion and final remarks.

2. Building a Theoretical Model

Traditionally, studies on risk attitude (RA), risk perception (RP), and risk management strategies (RMS) in agriculture have examined these elements in isolation, thereby hindering a comprehensive understanding of their interrelationships. For Ecuadorian cocoa farmers who face a wide array of risks, from climate-related challenges to global market volatility, an integrated analysis of these factors is crucial [22,23]. Research has demonstrated that farmers’ risk-management choices are significantly shaped by their perceptions of risks, such as climate change and price instability [24]. Furthermore, the implementation of risk-reduction measures, including crop diversification and agricultural insurance, is strongly associated with both risk attitudes and perceived risks [1]. This holistic approach, combining risk attitudes, perceptions, and management strategies, offers a more thorough insight into how Ecuadorian cocoa farmers confront their diverse risk landscapes, enabling a more in-depth examination of the elements influencing their decision-making processes [18].
The Organisation for Economic Co-operation and Development (OECD) framework offers a more comprehensive perspective on RA, RP, and RMS in agriculture, unlike traditional methods, which examine these elements separately. This integrated approach recognizes the dynamic and evolving nature of interactions between risks, farmers’ strategies, and public policies, enabling the concurrent evaluation of these factors [25]. Contemporary studies utilizing this framework have underscored the significance of understanding farmers’ perceptions and attitudes in crafting more effective risk management strategies [8,17,26,27]. Additionally, research has shown that the fluid relationship between risk perceptions and management strategies shapes farmers’ responses to challenges, such as climate change and market instability [1,18]. Consequently, our investigation examined how the incorporation of these elements promotes more coherent decision-making processes when confronting agricultural risks.
Although research has examined farmers’ decision-making in risky situations through separate lenses of risk attitude (RA) and risk perception (RP) [28,29], these two aspects have seldom been studied in conjunction [8]. Furthermore, the application of multidimensional constructs to analyze these variables remains scarce [27]. Contemporary studies have highlighted the necessity for a more comprehensive approach that encompasses the dynamic interplay between risk perception, attitudes, and management strategies [18,26]. To bridge this knowledge gap, our study conceptualizes risk perception (RP) and risk management strategies (RMS) as reflective, multidimensional, and second-order constructs.

2.1. Risk Management Strategies

Agricultural risk management encompasses intentional measures aimed at altering the likelihood and consequences of unfavorable events [30]. To address various risk sources, including climate, market, and production uncertainties, farmers typically concurrently employ multiple strategies [22]. While past studies have concentrated on specific risk management tools, such as crop diversification or agricultural insurance [31], contemporary approaches stress the need for a comprehensive risk assessment, recognizing the intricate interrelationships among different strategies [32].
Risk management approaches can be classified into three primary categories: (1) risk reduction strategies, which seek to decrease the probability of adverse occurrences; (2) risk mitigation strategies, which reduce the impact of these events when they occur; and (3) risk coping strategies designed to re-establish stability after a risk has materialized [22]. In developing nations such as Ecuador, cacao farmers encounter significant obstacles due to climate variability and market fluctuations, making the incorporation of multiple risk strategies crucial for long-term viability [23].

2.2. Risk Perception and Risk Attitude
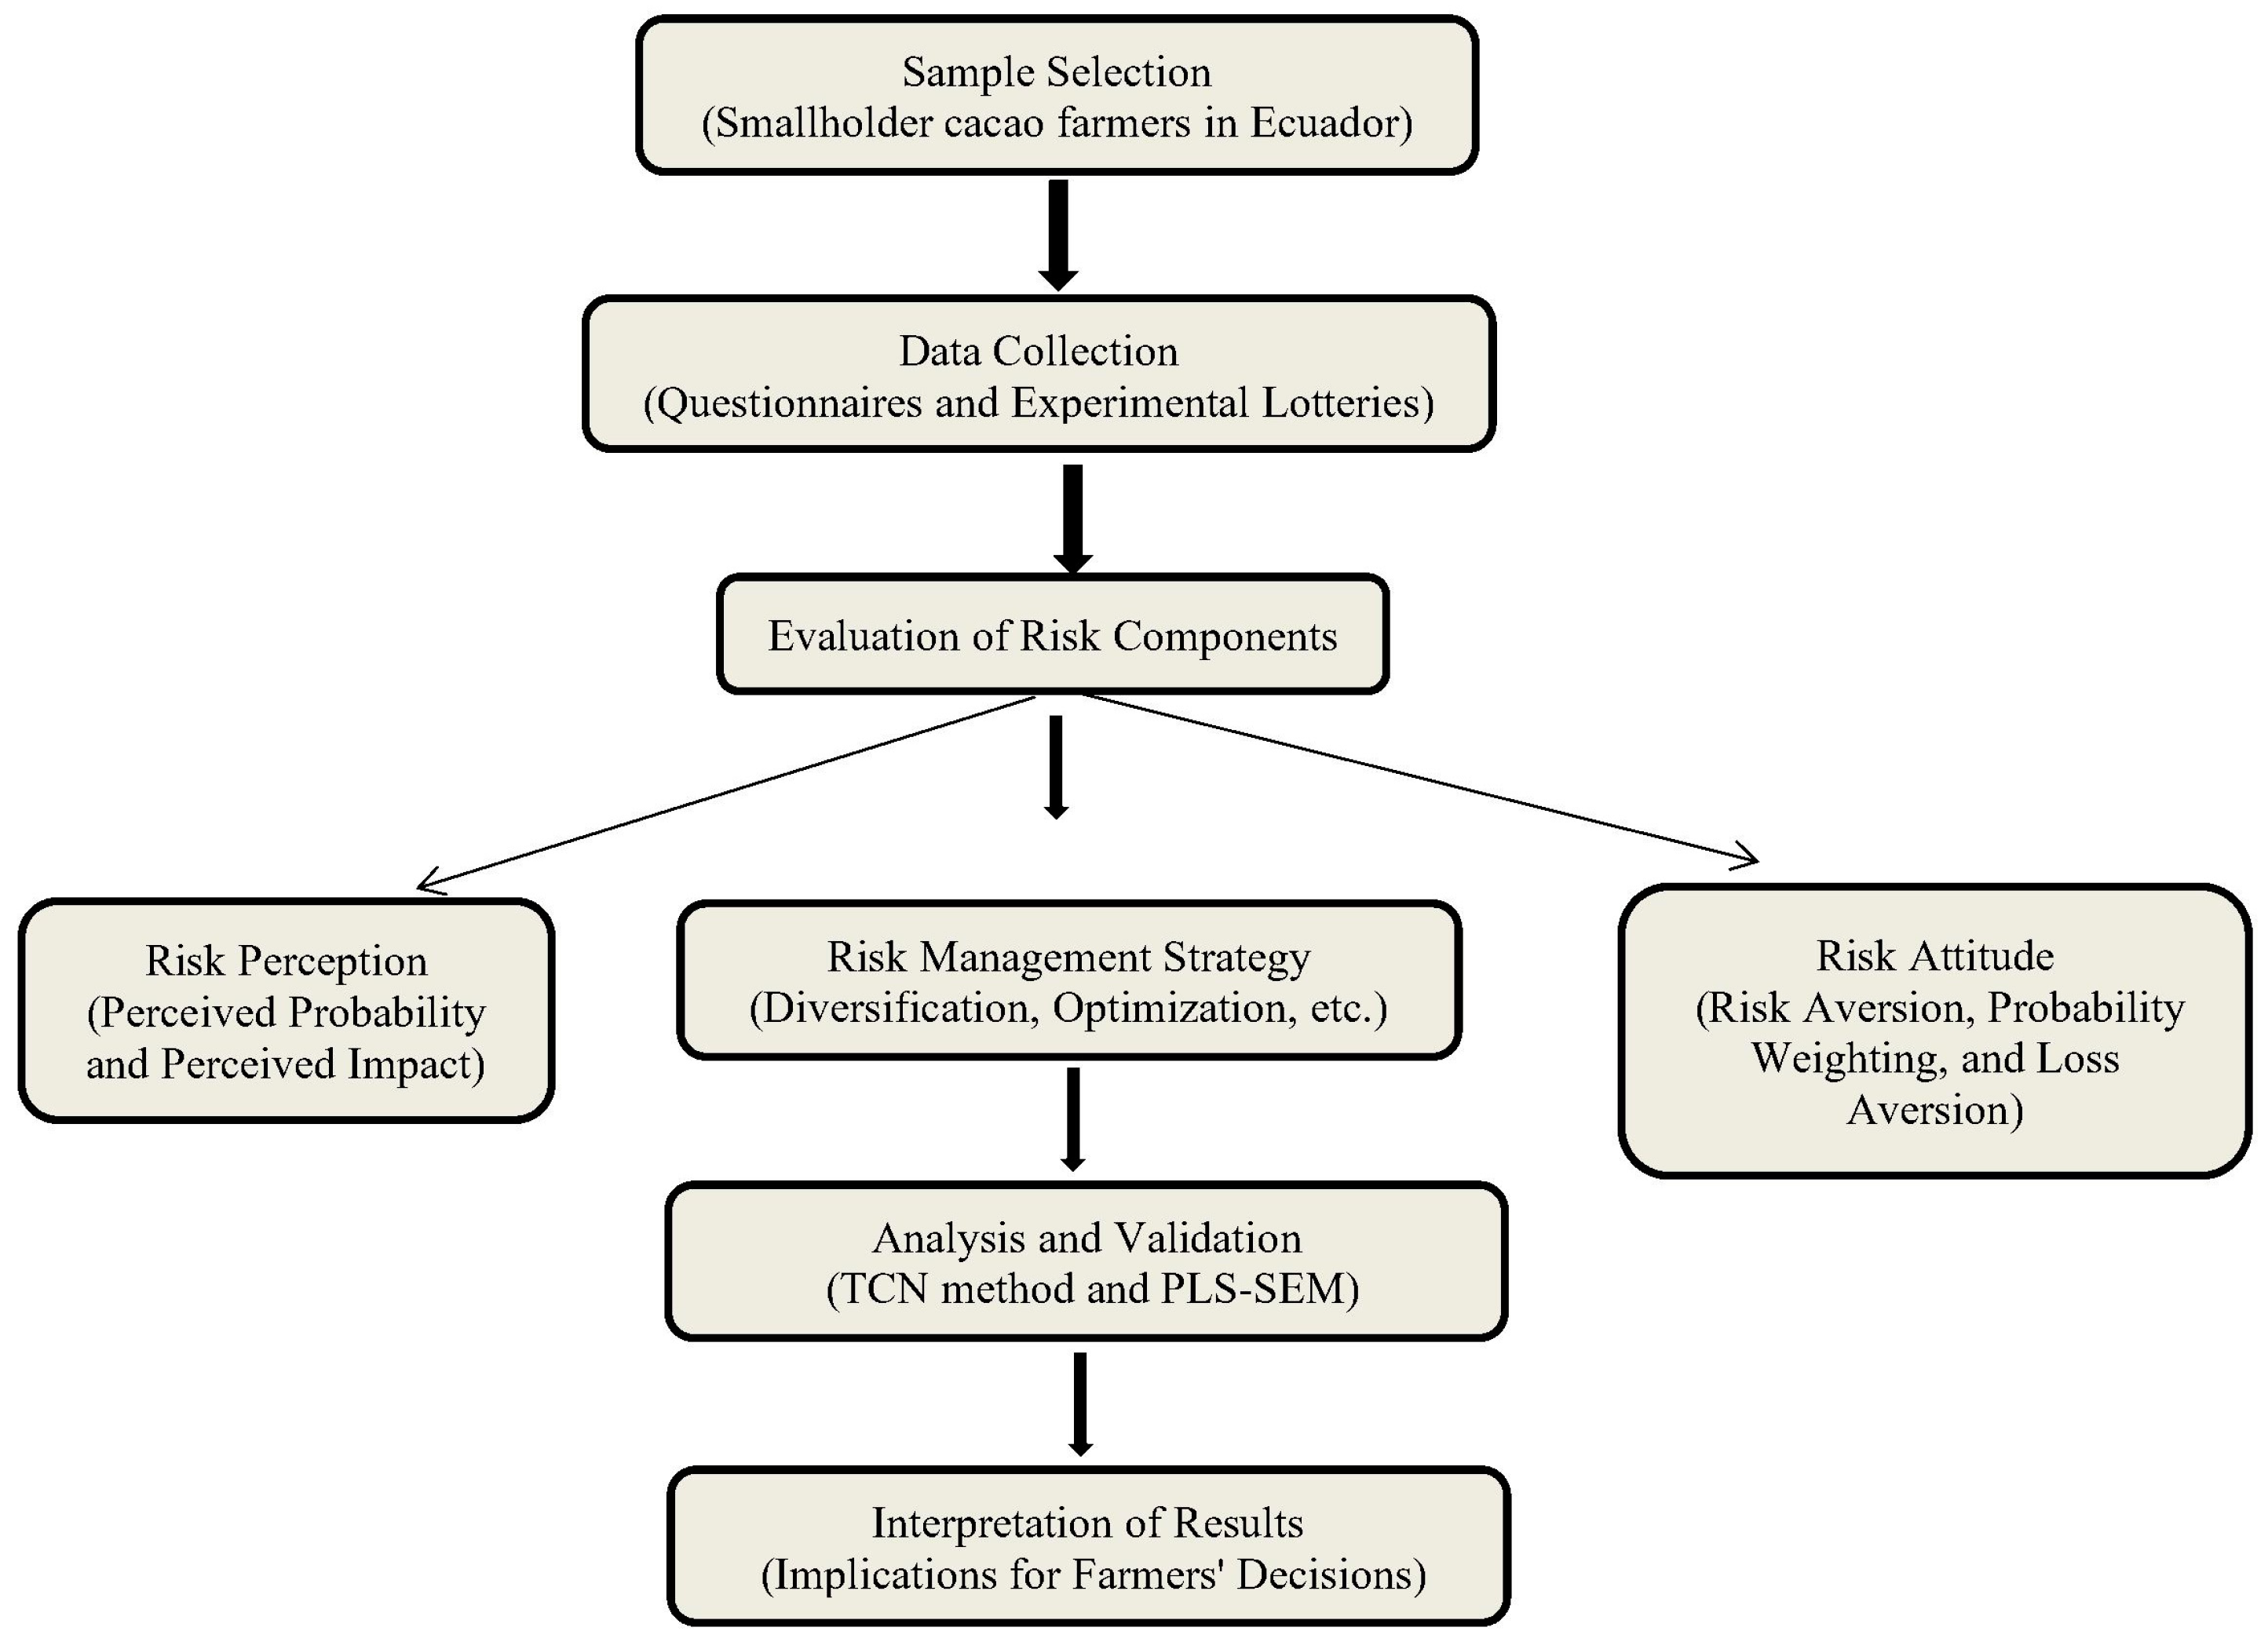
In the agricultural sector, risk perception is commonly viewed as comprising two primary components: the estimated likelihood of a negative event occurring and the anticipated magnitude of its effects [17,33]. These perceptions play a vital role in guiding farmers’ decision-making, influencing how they evaluate potential threats, and selecting appropriate risk management tactics. Research has shown that farmers who perceive higher levels of risk are more inclined to implement preventive measures, such as diversifying their operations or obtaining insurance, to reduce the potential negative impacts [30]. Significantly, the perceived magnitude of potential outcomes may exert a stronger influence on the need for risk management strategies than assessments of likelihood alone [34]. This concept is particularly relevant in agricultural settings, where the repercussions of climate-related or market risks can significantly impact the long-term viability of farms.
Based on these considerations, we propose the following hypotheses:
H1. 
The perceived probability of different risk sources significantly influences the intention to implement risk-management strategies.
H2. 
The perceived impact of different risk sources significantly influences the intention to implement risk-management strategies.
Understanding the role of risk perception is essential for predicting how farmers engage in risk management and adjust their strategies in response to perceived threats [23].
Farmers’ decision-making under uncertainty is significantly influenced by their risk attitude, also known as risk aversion, preference, or propensity. Traditional economic literature views this concept through the lens of expected utility theory, which measures risk attitude by examining the curvature of the utility function. This approach reflects how individuals perceive value increases in relation to utility gains [35]. However, groundbreaking prospect theory, introduced by [36], suggests that people tend to avoid risks when dealing with potential gains but become more risk-seeking when facing potential losses. This theory continues to play a crucial role in understanding risk-based decision-making, particularly in agricultural settings [37].
Research in the field of agriculture has shown that attitudes toward risk are not fixed and can change depending on the situation and the area of concern [37,38]. For example, farmers might exhibit risk-averse behavior when making decisions about input usage but display greater risk tolerance when confronted with production or market uncertainties [17]. Furthermore, risk attitudes can be shaped by numerous elements, such as socioeconomic factors, previous experiences, and anticipation of future risks [39].
Our research defines risk attitude as a persistent, yet dynamic, personal inclinations toward taking risks shaped by personal experiences and environmental factors. We anticipate that farmers who are more comfortable with risk (i.e., those with lower risk aversion) are less likely to implement risk-reduction strategies. Conversely, we expect that farmers who are more averse to losses will favor approaches that minimize potential negative outcomes. Based on these assumptions, we propose the following hypothesis:
H3. 
Risk aversion has a significant and negative relationship with intention to implement risk management strategies.
H4. 
Loss aversion has a significant and negative relationship with the intention to implement risk management strategies.
This study also examines how individuals’ attitudes toward uncertainty shape their perception of risk, specifically distinguishing risk aversion from loss aversion, and their effects on the perceived likelihood and impact of risk sources. In behavioral economics, risk aversion reflects a preference for certainty, avoiding uncertainty about whether it involves gains or losses, whereas loss aversion describes the tendency to prioritize potential losses over equivalent gains. Prior research suggests that both attitudes significantly influence individuals’ risk perceptions [34,38]; those with high risk or loss aversion often overestimate negative outcomes, elevating their perception of risk, whereas those with lower aversion levels tend to see potential benefits and thus perceive less risk [40]. Notably, these attitudes can coexist and interact in complex ways to influence decision-making behavior. Based on these distinctions, we propose the following hypotheses to be tested in our context:
H5. 
Individuals with high risk aversion perceive a higher probability of encountering various sources of risk.
H6. 
Individuals with high risk aversion perceive a greater potential impact from various sources of risk.
H7. 
Individuals with high loss aversion perceive a higher probability of encountering losses from various sources of risk.
H8. 
Individuals with high loss aversion perceive a greater potential impact of losses from various sources of risk.
Our investigation examines how risk attitude and risk perception interact to influence the adoption of risk management strategies. An individual’s perception of risk can vary and their inherent risk attitudes significantly shape their decisions regarding risk management. Changes in behavior in response to perceived risk occur only when risk is acknowledged [26,38]. Consequently, both risk attitude and risk perception directly affect the selection of risk-management strategies, with a potential interplay between these aspects. We suggest that elements of risk perception, namely perceived probability and perceived impact, act as mediators in the relationship between risk attitudes (including risk aversion and loss aversion) and risk management strategies.
In this context, ‘positively mediated’ refers to the idea that a higher perception of risk—whether in terms of probability or impact—strengthens the relationship between risk aversion or loss aversion and the intention to implement risk management strategies.
Based on this, we propose the following hypothesis:
H9. 
The perceived probability of risk positively mediates the relationship between risk aversion and intention to implement risk management strategies.
H10. 
The perceived impact of risk positively mediates the relationship between risk aversion and the intention to implement risk management strategies.
H11. 
The perceived probability of risk positively mediates the relationship between loss aversion and the intention to implement risk management strategies.
H12. 
The perceived impact of risk positively mediates the relationship between loss aversion and the intention to implement risk management strategies.
To summarize the proposed hypotheses and clarify the relationships explored in this study, Table 1 presents each hypothesis, along with a brief description and the type of relationship examined. This summary provides a concise overview of how the different constructs interact within our theoretical model.

3. Methodology

3.1. Target Sample

This study focuses on small-scale farmers in rural Naranjito, a canton in Ecuador’s coastal Guayas province. Eight rural areas within the cacao-producing region were included in this study [41]. The study involved 257 farmers chosen through stratified convenience sampling, structured to capture participants with diverse characteristics, such as farm size and resource availability, providing a range of attitudes and risk perceptions within Ecuador’s varied agricultural population [42]. Given the total rural population of approximately 1258 individuals in the study area, this sample size achieves a confidence level of 95% with a margin of error close to 5%, ensuring the representativeness of the data collected.
Risk attitudes were assessed using experimental lotteries, following the method developed by Tanaka et al. [43]. These lotteries presented participants with binary choices between options with varying risk levels, offering real payoffs to ensure genuine responses. Some choices can result in actual losses to participants [44]. Data collection was conducted through face-to-face interviews by trained field researchers familiar with the local context, enhancing data quality and minimizing potential biases in participant responses. For detailed information on lottery design, including rounds and decision structures, refer to Section 3.2.
A structured questionnaire, based on the form created by van Wisen et al. [8], was employed to evaluate risk perceptions and risk management strategies. This tool assesses the perceived likelihood and impact of various risk sources, including prices, production, and institutions. The questionnaire was initially tested on a pilot group of 50 farmers to allow for refinement and adaptation to the local context. Each participant spent approximately 90 min completing both the experimental lotteries and the structured questionnaire. This field study was conducted between November 2023 and February 2024, ensuring a comprehensive approach to capture a diversity of risk attitudes and perceptions among cacao farmers in Ecuador.
The questionnaire used to gather information on risk perceptions and risk management strategies is presented in Supplementary Material (Supplementary S1).

3.2. Data Collection and Variables

This study examines three fundamental latent constructs: strategies for managing risk, perceptions of risk, and attitudes toward risk. These constructs were utilized to evaluate how small-scale cacao farmers in Ecuador view the risks they encounter, their inclination to embrace or shun risks, and how these factors shape the approaches they employ to handle such risks.
Based on in-depth interviews and previous research [22,45], we evaluated smallholder cacao farmers’ willingness to adopt various risk management strategies in the future. Rather than measuring actual behavior, we employed an approach from previous studies, focusing on intended behavior—specifically, the extent to which farmers consider different risk strategies as viable options for their farms. Risk management strategies were categorized into four groups: diversification (risk reduction), optimization and off-farm activities (risk mitigation), and coping (reactive risk management) [46]. To assess these components, six indicator variables were evaluated using a 7-point Likert scale ranging from 1 (definitely would not apply) to 7 (definitely would apply). Table 2 presents the variables used in this study.
To capture a comprehensive view of farmers’ risk perceptions, certain variables in this study were measured both in terms of their perceived probability and their perceived impact. For instance, events such as ‘disrespect for contract conditions are included under both perceived probability (COMPP) and perceived impact (PIMPCOM) indicators. This dual approach allows us to analyze not only how likely farmers believe certain risks are, but also the extent to which they perceive these risks as potentially impactful to their operations.
Rather than measuring the actual behavior of farmers, we employed an approach that focused on their intended behavior. This methodology assesses the extent to which farmers consider various risk management strategies as viable options for agricultural operations in the future [26,47]. Table 2 presents the specific variables included in this study.
The diversification dimension encompasses strategies aimed at mitigating risk through diversification of income sources and production, both quantified by two key indicators. The optimization dimension focuses on managing risk through the optimization of the production process, assessed via indicators related to farm modernization and scale expansion. Coping, conversely, refers to farmers’ methods of addressing the aftermath of adverse events, measured by an indicator that captures the propensity to increase labor efforts during financial hardship. Finally, the off-farm strategy evaluates reliance on income generated externally to the farm, assessed through a single item measuring household-level off-farm income dependence [8,22,48].
We employed a second-order reflective latent variable model to measure farmers’ risk perception by integrating two fundamental components: the perceived probability of uncertain events occurring and the perceived impact of various risk sources. Using the framework proposed by Jarvis et al. [49], both the observable and first-order latent variables were structured in alignment with reflective measurement theory. Farmers were asked to evaluate four categories of risk—price, production, institutional, and commercialization—using two 7-point Likert scales. One scale measured perceived probability (from 1 = “very unlikely” to 7 = “very likely”) and the other assessed perceived impact (from 1 = “very small impact” to 7 = “very large impact”). Although the production aspect of perceived probability was initially tested, it did not perform adequately within the measurement model and was therefore excluded from the final analysis.
The four categories of risk perception assessed in this study—price, production, institutional, and commercialization—reflect critical factors that shape decision-making among Ecuadorian smallholder cacao farmers. Price risk examines concerns related to fluctuations in cacao market prices, which directly impact financial stability because volatile prices can reduce profitability and increase vulnerability. This category captures how likely farmers perceive price drops and how impactful they believe these changes are on their livelihoods. Production risk was initially tested for perceived probability, but was excluded from this aspect in the final model due to inadequate performance; however, it remains a central dimension in terms of perceived impact. This captures farmers’ concerns over the potential damage from adverse weather conditions and pest infestations, which can severely disrupt productivity [8].
Institutional risk considers farmers’ concerns regarding potential changes in government policies and agricultural subsidies, which are often critical for maintaining operational stability in rural Ecuador. Farmers evaluate both the likelihood of regulatory shifts and their potential effects on farming practices. Finally, commercialization risk encompasses uncertainties in market access, where logistical challenges and fluctuating demand can limit income stability. Together, these categories provide a comprehensive framework aligned with the socioeconomic realities of Ecuadorian cacao farming, offering insights into how farmers perceive, anticipate, and respond to sources of uncertainty impacting their agricultural activities [8].
This approach aligns with recent studies emphasizing the value of a multidimensional approach to risk perception (Kipato et al., 2023 [50]; Mohsin et al., 2024 [51]). To ensure the robustness of the model, we validated it through confirmatory tetrad analysis (CTA) following the theoretical recommendations of García-Machado et al. [52].
To assess risk attitudes, this study employed a widely utilized methodology to evaluate risk attitudes among farmers in developing countries through lottery-based experiments. These experiments are particularly effective in capturing individuals’ risk preferences by presenting a series of choices that involve uncertain outcomes. Specifically, we applied the Tanaka, Camerer, and Nguyen (TCN) method developed by Tanaka et al. [43], which employs independent binary choices presented in a multiple price list (MPL) format. This elicitation technique has been validated in various agricultural contexts, wherein farmers are asked to choose between safer and riskier lotteries in order to reveal their risk tolerance. Previous studies have successfully utilized this method to measure risk attitudes in similar settings [22,53,54].
The study involved participants making 35 decisions across three sets of binary choices to assess risk-taking behavior. The initial two sets each contained 14 rounds, whereas the final set had seven rounds. Each round required choosing between a low-risk option (lottery A) with consistent payouts, and a higher-risk option (lottery B) with escalating potential rewards. Opting for lottery B could yield greater gains if the outcome is favorable. Unlike the first two sets, the third set introduced uncertainty to both options, allowing researchers to examine how participants reacted when faced with potential gains and losses in both choices. This experimental design is crucial for understanding participants’ risk attitudes under various uncertain conditions.
In the experiment, farmers were restricted to changing their preference between the conservative lottery (A) and the more adventurous lottery (B) only once per series, a method known as “monotonic switching.” This constraint on preference changes was essential for determining the underlying behavioral parameters, as pointed out when participants shifted their risk tolerance [55,56]. Series 1 and 2, which contrasted a fixed payout option with a gradually increasing payout option, utilized the switching point to determine the risk aversion (σ) and probability weighting (α). Series 3, which introduced uncertainty in both lotteries, was used to assess loss aversion (λ). By employing the midpoint method to examine these preference shifts, researchers can accurately gauge farmers’ risk attitudes under various levels of uncertainty. Supplementary S2 provides comprehensive information on the experimental design and its mathematical implications.

3.3. Analytical Procedures

We employed variance-based structural equation modeling (SEM) using partial least squares (PLS-SEM) to examine the connections between risk attitudes, perceptions, and management strategies among cacao farmers in Ecuador. This technique was chosen because of its adaptability in handling intricate relationships between latent constructs, such as risk perceptions and management strategies, and its capacity to estimate associations between variables that cannot be directly observed. Combining principal component analysis with path analysis, PLS-SEM provides a solid framework for evaluating the interactions of these variables in the context of risk behavior [57,58]. This methodology is especially valuable for research in agricultural contexts, where the factors influencing risk perceptions and management strategies are often complex and interrelated [59].
PLS-SEM methodology was implemented in two phases. Initially, a structural model was established outlining the connections between risk attitudes, perceptions, and management strategies, which were based on the study’s hypotheses. These connections reflect the theoretical underpinnings of the present study. Subsequently, a measurement model was constructed to connect latent constructs (including attitudes and perceptions) with their respective indicators. Notably, all the measurement models were reflective in nature, ensuring that the observed variables accurately represented each construct [60].
We used Confirmatory Tetrad Analysis (CTA-PLS) to assess the validity of our measurement model. This technique examines whether the data support the model specification chosen based on theoretical foundations. CTA-PLS is particularly useful in avoiding measurement model misspecification errors, thus ensuring the accurate estimation of construct relationships. This validation step is essential for comprehending how farmers’ risk attitudes shape their perceptions and how these perceptions influence their chosen risk-management strategies [61,62].
PLS-SEM not only validates the model but also allows for the examination of mediating effects. This approach was employed to assess whether risk perceptions act as mediators between risk attitudes and management strategy adoption. Mediating relationships are crucial in this study, as shifts in risk attitudes may influence perceptions, which in turn affect farmers’ risk management practices. By exploring these indirect connections, we obtain a more comprehensive understanding of how these constructs interact within a dynamic agricultural setting [61,63].
Finally, the ability of PLS-SEM to model hierarchical component models (HCMs) allowed us to operationalize higher-order constructs, such as overall risk attitudes, using a combination of first-order indicators, such as specific risk management strategies. This approach enhances the parsimony of the model while capturing a broad range of behaviors and perceptions. Previous studies have shown the effectiveness of HCMs in managing complex constructs in various fields, including education, CSR [64], and SME competitiveness [65]. Despite its advantages, PLS-SEM has rarely been applied to analyze agricultural risk behavior in developing countries [23,66], making this study a novel contribution to understanding how Ecuadorian cacao farmers navigate risk in complex environments.
Figure 1 illustrates the methodology employed in this study, detailing each step from sample selection to data analysis and interpretation of the results.

4. Results

Figure 2 illustrates the PLS-SEM model used in this study, comprising a measurement model and a structural model. The measurement model defines the relationships between latent constructs (risk management strategy, perceived probability, and perceived impact) and their observable indicators, such as coping, diversify, off-farm, and optimization for risk management strategy, ensuring construct validity. The structural model represents the hypothesized paths between risk perception, risk attitude, and risk management strategy, allowing for the evaluation of causal relationships and explained variance (R2). Risk aversion and loss aversion are single-item indicators (ra1 and ra3) that capture decision-making tendencies under uncertainty, following Sarstedt et al. (2024) [62], to minimize measurement errors. The probability weighting function was omitted because it does not directly measure risk or loss aversion. This model visually summarizes the key constructs and paths relevant to understanding farmers’ risk-related perceptions, attitudes, and strategies.
To ensure a thorough understanding of farmers’ risk perceptions and management, the researchers first evaluated the parameters of the first-order measurement model before analyzing the higher-order construct.

4.1. Estimation of Risk Attitude Parameters

Research on Ecuadorian cacao producers reveals a pronounced aversion to losses, with a coefficient of 3.721, indicating that they respond approximately 3.7 times more intensely to losses than to gains. This observation, which is consistent with the findings of Liu [67] and Cerroni et al. [55], demonstrates that these farmers prioritize loss avoidance over profit maximization in uncertain situations. Furthermore, the probability weighting parameter (α = 0.856), which is slightly below 1, indicates that farmers tend to overestimate the occurrence of rare, extreme events, a behavior noted by [68,69]. This finding suggests that farmers attribute disproportionate significance to low-probability, high-impact risks (Table 3).
This study also confirms that Ecuadorian farmers exhibit risk aversion, as evidenced by the risk aversion coefficient (σ = 0.529), which indicates a cautious approach to uncertainty. This behavior aligns with the previous research by Harrison et al. [70] and Finger et al. [35]. Collectively, these findings underscore the complex interrelationship between risk attitudes and perceptions, which ultimately shapes the risk-management strategies employed by Ecuadorian cacao farmers.
In this study, risk aversion and loss aversion are modeled as single-item constructs within the PLS-SEM framework. The parameter Σ (coefficient of risk aversion) is used to represent risk aversion, as it directly measures producers’ aversion to risk based on experimental lotteries, while Λ (coefficient of loss aversion) represents loss aversion, capturing the sensitivity of producers to losses relative to gains. The probability weighting parameter (A) was excluded because it does not directly reflect risk or loss aversion. According to [62], single-item constructs in SEM can be assigned a fixed loading of 1, allowing the model to robustly incorporate these experimentally derived parameters as single indicators for each construct.

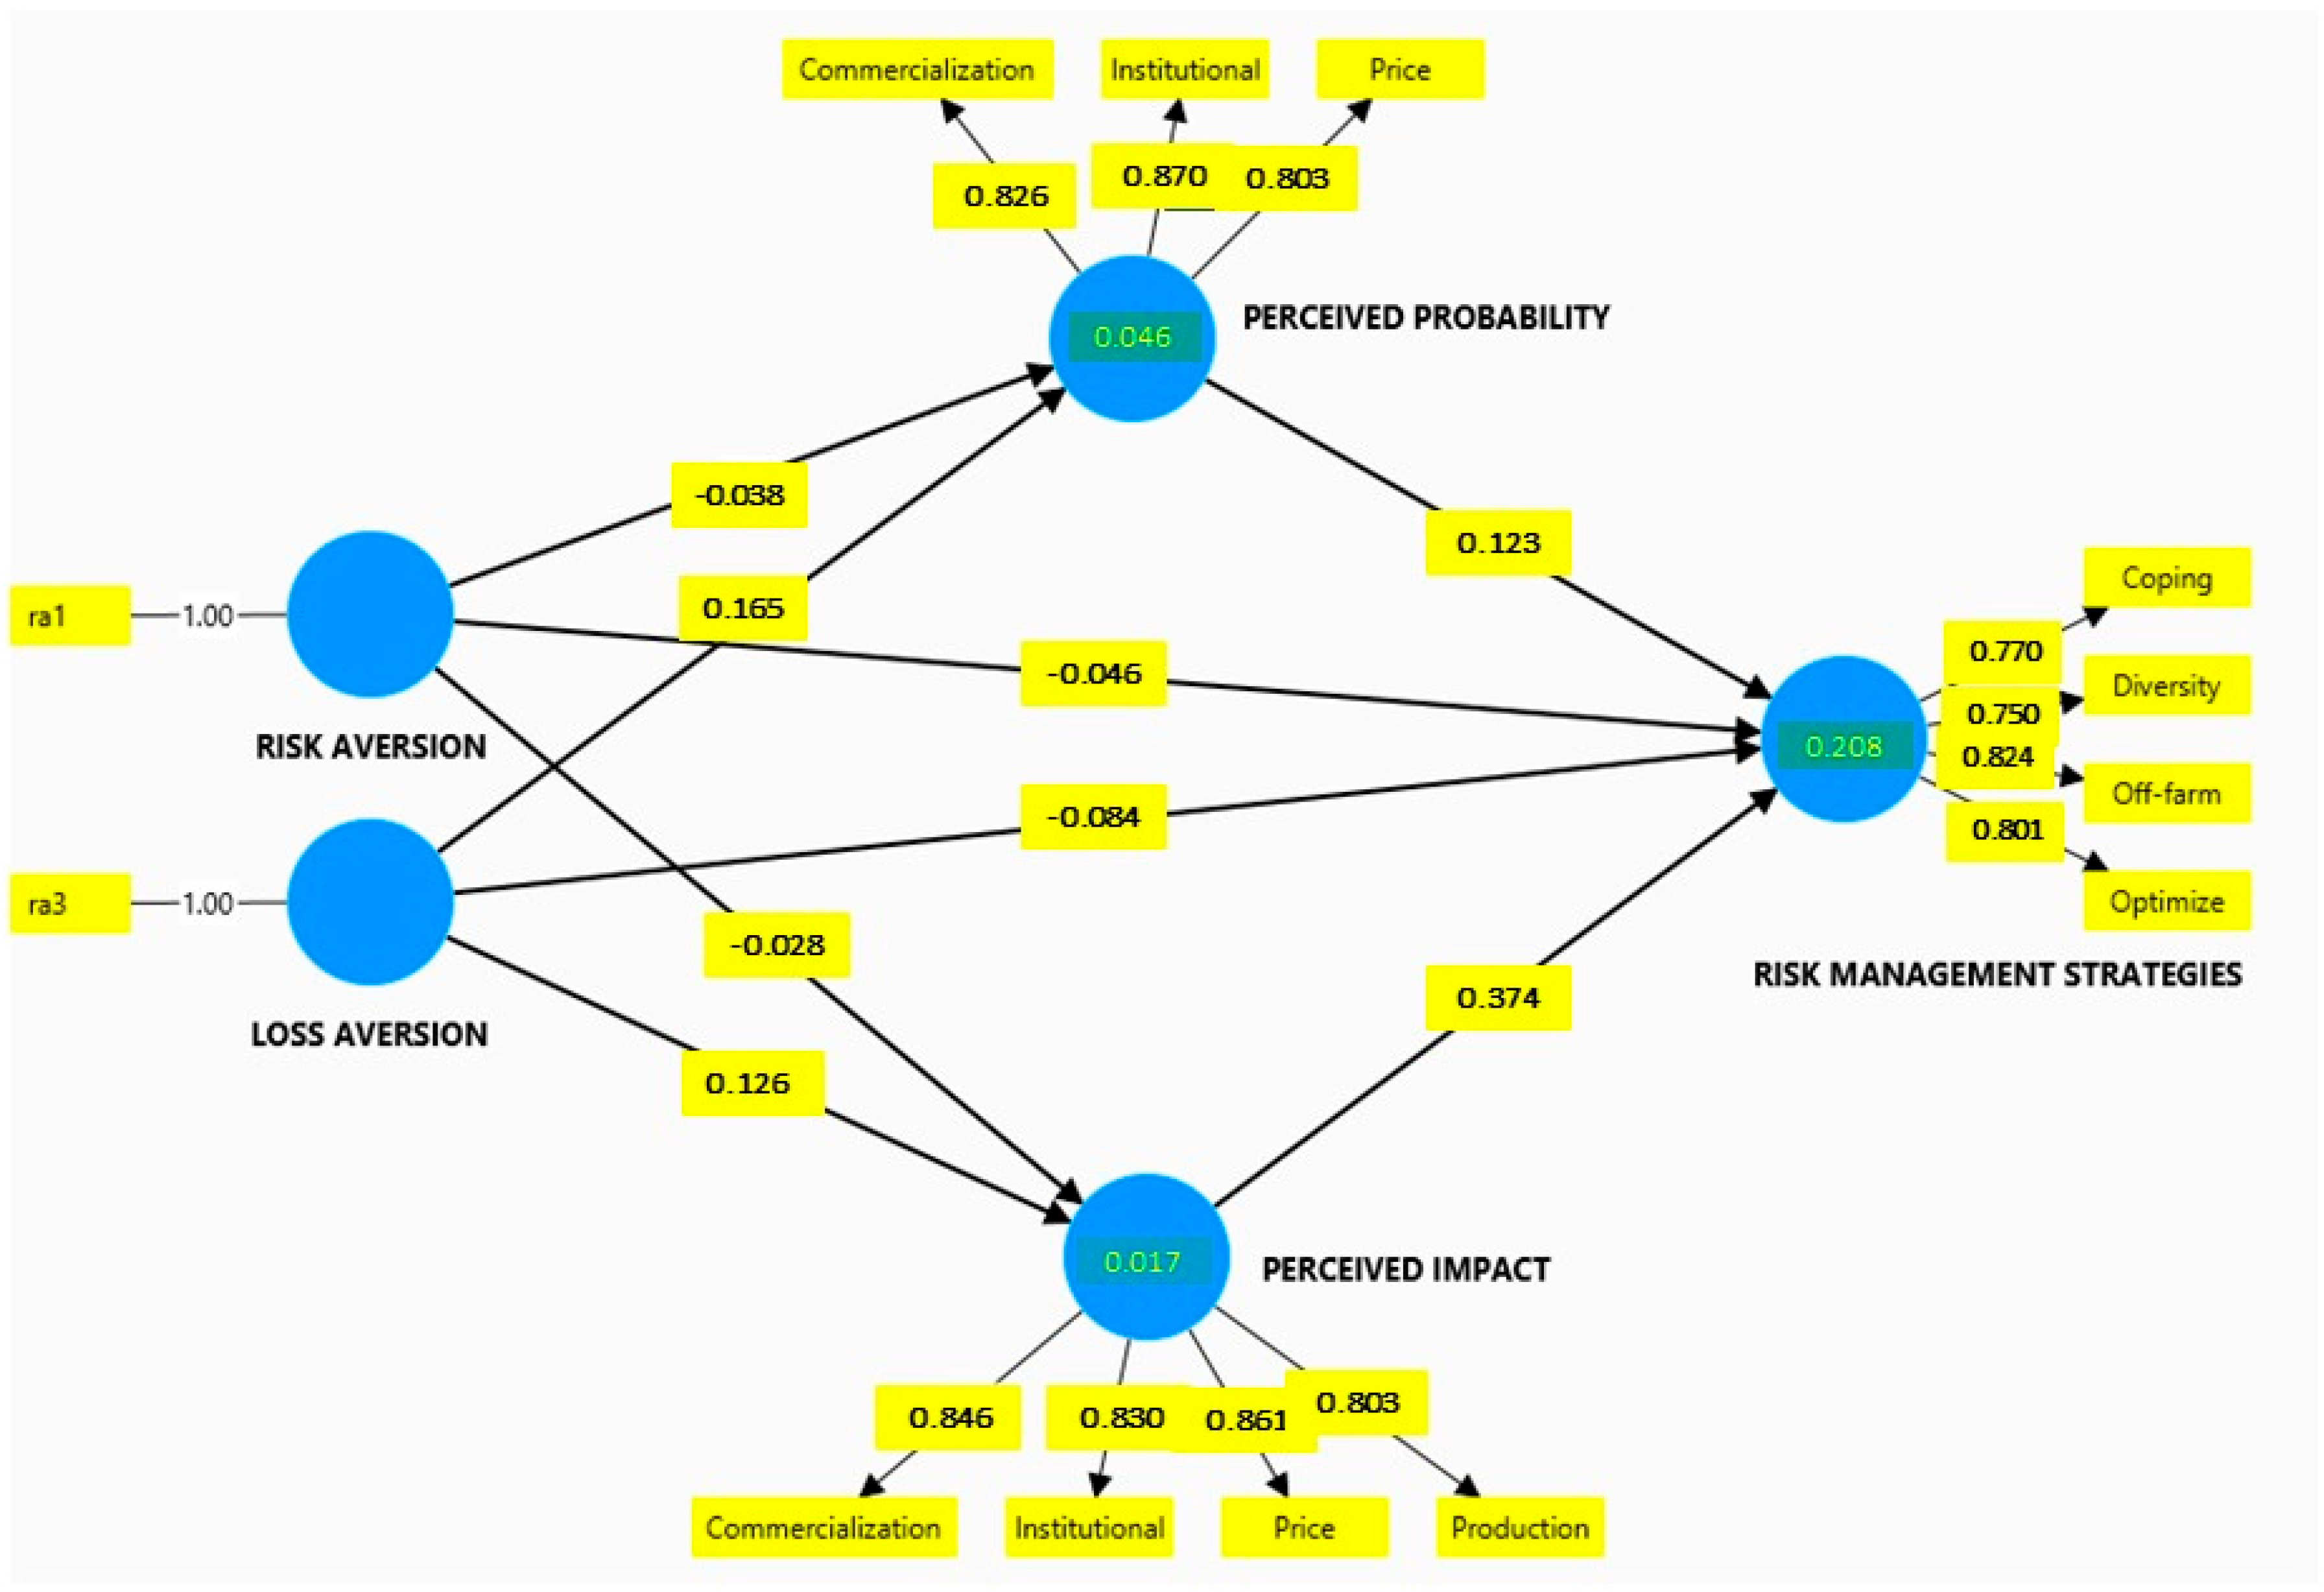
4.2. The Structural Equation Model

Figure 2 illustrates a structural equation model designed to empirically test the proposed hypotheses. This model examines the direct effects of the first-order constructs, risk aversion and loss aversion, as well as the direct and indirect impacts of the second-order constructs, perceived probability (PP), and perceived impact (PI) on the risk management strategy (RMS) construct. The subsequent sections evaluate the measurement model followed by an analysis of the structural model outcomes. Additionally, this study investigated the mediating roles of perceived probability and perceived impact.

4.3. Measurement Model Assessment

To avoid scrutiny, second-order latent variables must meet specific measurement criteria [58,63] using confirmatory tetrad analysis for PLS-SEM (CTA-PLS) to verify the suitability of the reflective measurement model specifications. Additionally, reference [71] proposes evaluating reflective or common factor measurement variables based on internal consistency reliability, convergent validity, and discriminant validity. Reliability testing employed Cronbach’s α, composite reliability (CR), and Dijkstra–Henseler’s rho (ρA), whereas convergent validity was assessed using indicator reliability and average extracted variance (AVE). The Fornell and Larcker cross-loading and heterotrait–monotrait ratio of correlations (HTMT) were utilized to examine discriminant validity [60,72]. These measures were not applied to the risk attitude variables because of their one-dimensional nature. Table 4 presents a summary of the statistics used to confirm the validity of second-order latent variables.
Researchers typically assess convergent validity by using the average variance extracted (AVE) method. This approach requires that the latent variable explains over 50% of the reflective indicators’ variance [73]. A recommended threshold for acceptable validity is an AVE value exceeding 0.50 [74]. In this study, the constructs PP, PI, and RMS demonstrated AVE values above this threshold (Table 4), indicating that the indicators adequately represented their respective constructs. It is worth noting that convergent validity is not evaluated for single-item constructs, such as risk aversion and loss aversion [75].
To evaluate the internal consistency reliability, researchers employed multiple measures, including Cronbach’s alpha, composite reliability (CR), and rho_A ( ρ A ). For both Cronbach’s alpha and CR, values ranging from 0.70 to 0.90 are considered optimal to ensure sufficient reliability [76]. These measures complement each other because Cronbach’s alpha tends to underestimate reliability, whereas CR often overestimates it. Moreover, ρA provides a nearly exact reliability estimate for PLS-SEM composites [77]. In this study, all reliability measures for the PP, PI, and RMS constructs fell within the recommended ranges, confirming that the respective indicators measured these constructs appropriately [75].
In reflective measurement models, it is essential to ensure that the relationships between the constructs and their indicators align with the underlying theory. In this study, a confirmatory tetrad analysis (CTA) was used to verify whether second-order constructs, such as PI and RMS, followed a reflective pattern. This analysis requires at least four items per construct, and is based on the null hypothesis that the covariances between indicator pairs (tetrads) should be zero. If the confidence intervals include zero, the null hypothesis is supported, confirming the reflective direction of the relationships in the measurement model [78]. The results of this study show that all non-redundant tetrads validate the measurement models, reinforcing their reflective specifications [79]. This approach is particularly relevant for avoiding model specification errors that could affect the validity of the conclusions. The results show that all non-redundant tetrads of PI and RMS support the measurement specifications, as shown in Table 5.
The HTMT results of this study, all falling under the stringent 0.85 threshold, demonstrate the distinctiveness of the model’s constructs in terms of their correlations and representative indicators. This outcome substantiates discriminant validity, which is a key element for ensuring construct differentiation. The HTMT is preferred for assessing this validity because of its enhanced performance over conventional methods such as the Fornell–Larcker criterion and cross-loadings. It is computed by dividing the average correlations between the indicators of separate constructs by the geometric mean of the correlations among indicators within the same construct. HTMT thresholds were set at 0.85 for a conservative approach and 0.90 for conceptually similar constructs, offering adaptability in the model evaluation. These findings are consistent with recent research confirming HTMT’s efficacy of HTMT in PLS-SEM contexts [60,80]. Table 6 shows the HTMT values for all pairs of constructs in the matrix form.

4.4. Structural Model Assessment

Assessing the structural model primarily involves evaluating its explanatory and predictive capabilities [60]. This assessment utilizes crucial metrics, such as the R2 value (coefficient of determination), f2 (effect size), and Q2 (Stone–Geisser criterion), to gauge the model’s predictive quality. Furthermore, the analysis encompasses an examination of the model’s path coefficients, including an assessment of collinearity among latent variables through the variance inflation factor (VIF) as well as an evaluation of the relevance and significance [81].
In structural models, the accepted benchmark for assessing multicollinearity is a variance inflation factor (VIF) under 5, with more rigorous standards proposing a limit of 3.3. The current analysis revealed a maximum VIF of 1.73, which was significantly lower than both the thresholds. This provides strong evidence that the independent variables in the structural model are free from multicollinearity concerns [61]. Table 7 provides additional information that corroborates these findings with specific numerical data.
As PLS-SEM does not require normally distributed data, traditional parametric tests may yield inaccurate results. Consequently, researchers are advised to employ bias-corrected and accelerated (BCa) bootstrap confidence intervals to determine the significance of the path coefficients. This method, which has gained support from contemporary research, offers a more precise assessment of the structural model relationships. The null hypothesis is rejected, indicating a significant path coefficient when the bootstrap-derived confidence interval excludes zero [60,61]. Table 8 provides detailed information on the confidence intervals of the path coefficients in this model.
The model’s predictions were not entirely accurate, as some hypothesized connections, such as those between perceived risk probability and risk management approaches or between risk aversion and perceived risk impact, were not validated. Nevertheless, hypotheses H2, H7, and H8 were substantiated, revealing strong positive correlations between perceived risk impact and management tactics as well as between loss aversion and both perceived risk likelihood and impact. Interestingly, Hypothesis H5 yielded unexpected results, showing a significant but inverse relationship between risk aversion and perceived risk probability, contrary to the initial prediction. These outcomes underscore the significance of loss aversion in shaping risk perception while also indicating that certain key aspects of risk management require more in-depth investigation to gain a comprehensive understanding.
The coefficient of determination (R2) serves as a crucial indicator for assessing the predictive accuracy of a structural model, revealing how exogenous variables affect endogenous variables. In this study, the explanatory power for behavioral risk was 20.2% (R2 = 0.202), indicating a moderate level of predictive capability. [61] proposed that R2 values of 0.25, 0.50, and 0.75 represent weak, moderate, and substantial predictive powers, respectively, although these benchmarks may vary based on model complexity. Given that R2 can be skewed in models with numerous exogenous variables, the adjusted coefficient of determination (R_adj2) was computed to address this potential bias. The similarity between the R2 and R_adj2 values in this instance further supported the validity of the model.
The findings indicate that the Q2 values for the endogenous constructs PI, PP, and RMS exceeded zero, demonstrating the model’s predictive relevance in analyzing risk behavior. Q2 serves as a crucial metric for evaluating a model’s out-of-sample predictive capability, with positive values signifying the predictive relevance for the construct under examination. This metric is derived using the blindfolding technique, which deliberately excludes data points from endogenous constructs to estimate parameters using the remaining information (Table 9). Experts recommend applying this method to constructs using reflective measurement models [63,78].
This study identified loss aversion and the perceived impact of risk as the most influential predictors. Loss aversion had the greatest effect on perceived probability, while the perceived impact of risk was the strongest predictor of risk management strategies. The study employed the effect size ( f 2 ) to evaluate how excluding a construct affected the model’s R 2 . Both constructs demonstrated small, but noteworthy effects. Loss aversion exhibited a minor influence on perceived probability ( f 2 = 0.027), and the perceived impact had a slight effect on the risk management strategy ( f 2 = 0.098) (Table 10). These effects, although small, are considered relevant according to Cohen’s criteria [82]. The findings corroborate the bootstrap test results, which validated the significant effects for Hypotheses H2 and H7. The study concluded that removing these constructs would decrease the R 2 values for the corresponding endogenous variables, highlighting their substantial impact on the model [83].

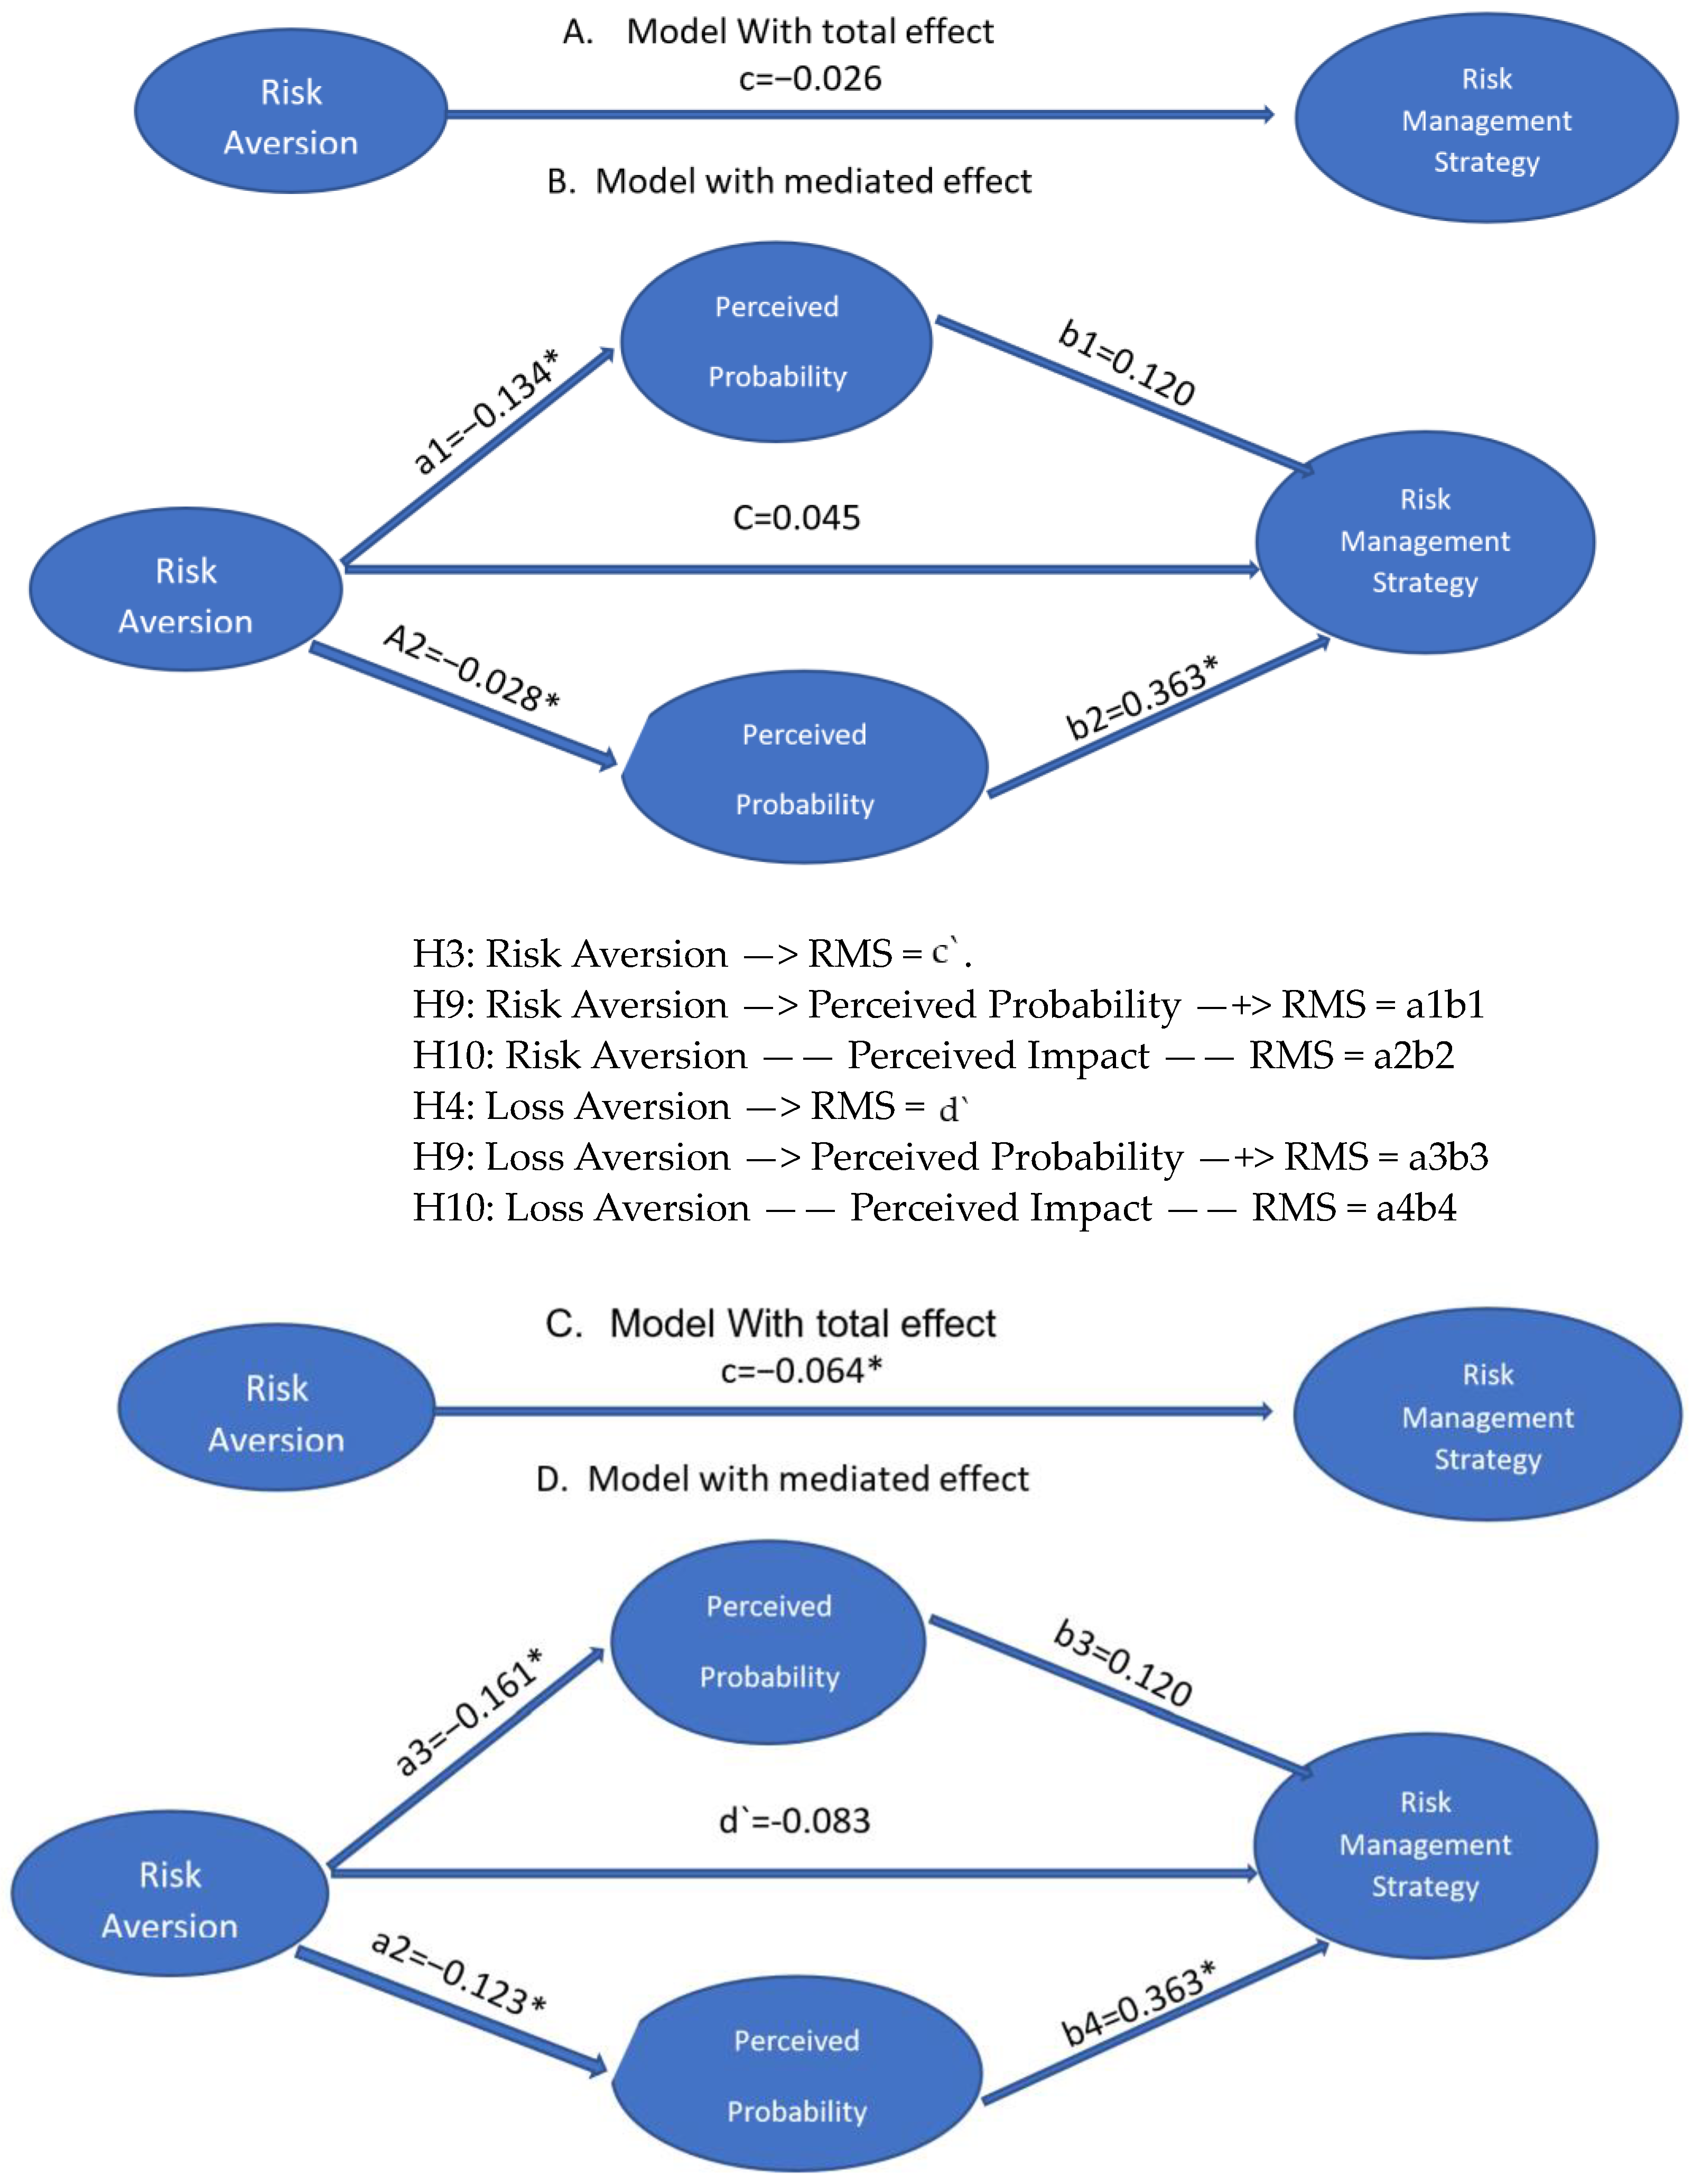
4.5. Mediation Analysis

This study investigates how attitudes toward risk, particularly risk and loss aversion, influence risk management approaches, both directly and indirectly. The indirect influence is facilitated through key intermediary factors: the perceived likelihood and impact of risks, which help to elucidate how these attitudes affect decision-making processes. Hypotheses H9–H12 specifically address this mediation, explaining the mechanisms through which the independent variables (risk and loss aversion) affect the dependent variable (risk-management strategy). By examining these dual pathways—direct and mediated—this study provides insights into how risk perceptions drive strategic choices, especially among Ecuadorian cacao farmers facing various agricultural challenges.
The significance of indirect effects was evaluated using bootstrap resampling by determining 95% confidence intervals (CIs). An indirect effect is considered significant if the interval calculated from the product of its direct paths does not include zero. The model examines various indirect effects, including how risk attitude and loss aversion impact risk management strategy (RMS) through multiple mediating pathways (a1b1, a2b2, a3b3, etc.). The analysis incorporated both direct and indirect effects, with the total effects calculated by summing these components. This thorough methodology ensures that the influence of risk attitudes on RMS is assessed by considering both the direct and mediated routes [75,78].
Hypotheses H9, H10, and H11 regarding the mediation effects were not validated, indicating the absence of significant indirect relationships. Nevertheless, H4 was supported, as perceived risk probability completely mediated the connection between loss aversion and risk management strategy (RMS). Furthermore, H12 was confirmed because of the significant total effect of loss aversion on RMS through the perceived impact. This examination demonstrates the distinct mediating functions of perceived risk probability and impact in relation to risk attitudes [60].
The analysis shows that the perceived impact of risk fully mediates the relationship between loss aversion and risk management strategy (RMS), since the direct effect is not significant, but both the indirect and total effects are. This indicates that the effect of loss aversion on RMS occurs entirely through the mediator. After establishing the significance of the mediation effects, the type and magnitude of the mediation were assessed, confirming full mediation.
Figure 3 illustrates both the total and mediated effects of risk perceptions on risk management strategies, highlighting the different pathways of influence.

5. Discussion

Smallholder cocoa farmers in Ecuador operate in an environment of considerable uncertainty driven by price volatility in global markets and exposure to adverse climate events [16]. These risks challenge farmers’ economic stability, often creating conditions in which even small changes in market prices or weather patterns can have significant financial impacts [3]. As these farmers typically have limited access to formal risk management tools such as insurance or credit, they rely heavily on adaptive strategies to mitigate potential losses [6]. Understanding how farmers perceive risk, their attitudes toward uncertainty, and the strategies they employ to manage these risks is critical for both theoretical insights and practical interventions [8]. Insights into these factors can support the development of policies that address the unique vulnerabilities of smallholder farmers, enhance their resilience to external shocks, and contribute to sustainable agricultural practices.
This study was conducted in the Naranjito canton of Ecuador, a region in the coastal Guayas province known for its cocoa production. This area presents a unique set of challenges for smallholder farmers, including fluctuating market conditions and exposure to adverse weather events that affect crop yields and profitability. By focusing on this region, the study captures the specific risk-management behaviors and perceptions of Ecuadorian cocoa farmers in a high-risk environment, providing insights that may be particularly relevant for similar agricultural settings characterized by economic and climatic uncertainties.
The results confirm that Ecuadorian farmers place greater importance on the perceived impact of risks than on their perceived probability, thus validating H2. Farmers prioritize strategies to mitigate events perceived as devastating, such as price drops and production losses due to climate change. However, H1 was not validated, as perceived probability did not significantly influence the adoption of risk management strategies. This differs from studies, such as Mase et al. [24], which found that among U.S. farmers, the probability of occurrence had a greater influence on mitigation strategies. The differences in findings could be attributed to socioeconomic or cultural factors affecting how Ecuadorian farmers perceive risk, a phenomenon explored in vulnerable contexts [22].
The findings indicate that Ecuadorian cocoa farmers display strong loss aversion, which significantly impacts their choices regarding risk management strategy adoption. This tendency leads farmers to shun strategies that might result in substantial losses even when such events have a low probability of occurrence. Moreover, farmers place greater emphasis on the perceived impact of risks, such as price declines and adverse weather events, rather than the likelihood of these risks materializing. This suggests that fear of severe consequences plays a more significant role in decision-making than the estimated frequency of adverse events.
The perceived impact of risks related to commercialization, prices, and production plays a more decisive role than perceived probability. Farmers identified price drops (PIMPRIC1) and production losses due to intense rains (PIMPRO1) and droughts (PIMPRO2) as urgent risks. These risks have led farmers to adopt strategies such as diversification (RMSDI1 and RMSDI2) and off-farm employment (RMSOF1). Adnan et al. [22] also note that diversification is a common response in contexts where climate vulnerability and market volatility are prevalent. In other studies, such as Bonjean [84], the adaptation of more sophisticated strategies, such as insurance, also depended on the perception of risk probability, highlighting the importance of adjusting risk management tools in the local context.
Further analysis of the mediating hypotheses revealed that the perceived impact of risk serves as a significant mediator between risk attitude and the adoption of risk management strategies. Specifically, loss aversion strengthens the influence of perceived impact on farmers’ decision-making, amplifying their tendency to adopt conservative strategies in response to potential adverse outcomes. However, the perceived probability of risk did not demonstrate a mediating effect, reinforcing the idea that farmers prioritize the severity of outcomes over the likelihood of occurrence when evaluating risk management options. This finding supports H12 and emphasizes the critical role of perceived impact in shaping risk management behavior.
Regarding the relationship between risk aversion and the adoption of management strategies, H3 and H4 were not validated. More risk-averse farmers tend to overestimate the probability of extreme events, but this attitude does not lead them to adopt proactive preventive strategies such as optimization (RMSOP1 and RMSOP2). Villacis et al. [85] observed in other contexts that risk aversion was directly associated with adopting strategies such as modernization, suggesting that in Ecuador, financial barriers prevent farmers from implementing these strategies despite their awareness of risks. This is consistent with previous studies linking the lack of access to credit and insurance with limitations in adopting more advanced strategies [86].
Hypotheses H7 and H8 were validated, confirming that farmers with greater loss aversion perceive both the probability and impact of risks to be higher. These results align with those of Cerroni et al. [55] and Menepace et al. [87], who show that loss-averse farmers tend to overestimate risk, making them more conservative when adopting new strategies. This behavior could explain why many farmers prioritize loss mitigation by taking advantage of opportunities for innovation or diversification.
These results have important implications for the design of risk-management tools in Ecuador. Instead of focusing solely on the probability of events, policies should target the risks that farmers perceive as the most devastating and provide solutions that reduce the impact of these risks. Promoting agricultural insurance or tools that protect against severe climate events would be a valuable strategy to improve farmers’ resilience to climate change and global market fluctuations [88,89]. Diversification has emerged as an effective strategy, but it is necessary to promote access to more stable markets and support insurance programs that cover losses from extreme events [20]. Additionally, changing farmers’ perceptions of probability through financial incentives and technical training could encourage greater willingness to take calculated risks, facilitating the adoption of technologies and risk-mitigation strategies [90].
This study had certain limitations that warrant acknowledgment. The study focused exclusively on cocoa farmers in a particular area of Ecuador, potentially limiting the applicability of the results to other agricultural settings. Additionally, the data rely on self-reported information, which may be subject to biases such as over- or underestimation of risks. Finally, the cross-sectional nature of this study captures perceptions and behaviors at a single point in time, preventing an analysis of how these factors might change over time or in response to shifting circumstances.
Future studies could explore various areas to complement and expand these findings. Longitudinal research could examine how farmers’ risk perceptions and management strategies evolve over time, particularly in response to changing environmental, market, or institutional conditions. Additionally, investigating the influence of socioeconomic factors such as access to credit and education on farmers’ risk attitudes and the adoption of advanced risk management strategies would be valuable. Comparative studies across different regions or crops could provide insights into the generalizability of the findings and offer a broader understanding of risk management in agriculture. Finally, exploring the impact of policy interventions designed to mitigate perceived risks could yield practical insights into the effectiveness of risk-management tools and programs.

Supplementary Materials

The following supporting information can be downloaded at: https://www.mdpi.com/article/10.3390/agriculture15080843/s1, Supplementary S1: Risk Perception and Management Survey; Supplementary S2: Analyzing Risk Attitudes of Cacao Producers.

Author Contributions

J.D.-M.: Writing—original draft preparation, writing—review and editing, conceptualization, methodology, validation, formal analysis, investigation, resources, data curation, visualization, supervision, and project administration. R.M.-S.: Supervision and investigation. M.F.-H.: Writing—original draft preparation, writing—review, and editing. All authors have read and agreed to the published version of the manuscript.

Funding

This research was funded by the Universidad Estatal de Milagro (grant number: C20-DL-09).

Institutional Review Board Statement

Ethics approval was granted by the Human Research Ethics Committee of Ecuador (approval number: HCK-CEISH-2022-006).

Informed Consent Statement

Informed consent was obtained from all the subjects involved in the study.

Data Availability Statement

The data presented in this study are available on request from the corresponding author, José Díaz-Montenegro, owing to privacy restrictions related to the confidentiality of the respondents. The data contain sensitive information that could potentially identify individual farmers; thus, access is restricted to ensure privacy.

Acknowledgments

The authors would like to express their sincere gratitude to the Universidad Estatal de Milagro for their invaluable support throughout this research. Special thanks are extended to all the farmers who participated in the study, whose cooperation and insights were essential for the success of this research.

Conflicts of Interest

The authors declare no conflict of interest.

References

  1. Ullah, R.; Shivakoti, G.P. Adoption of On-Farm and Off-Farm Diversification to Manage Agricultural Risks: Are These Decisions Correlated? Outlook Agric. 2014, 43, 265–271. [Google Scholar] [CrossRef]
  2. van Asseldonk, M.; Tzouramani, I.; Ge, L.; Vrolijk, H. Adoption of Risk Management Strategies in European Agriculture. Stud. Agric. Econ. 2016, 118, 154–162. [Google Scholar] [CrossRef]
  3. Akhtar, S.; Li, G.; Nazir, A.; Razzaq, A.; Ullah, R.; Faisal, M.; Naseer, M.A.U.R.; Raza, M.H. Maize Production under Risk: The Simultaneous Adoption of off-Farm Income Diversification and Agricultural Credit to Manage Risk. J. Integr. Agric. 2019, 18, 460–470. [Google Scholar] [CrossRef]
  4. Knapp, L.; Wuepper, D.; Dalhaus, T.; Finger, R. Revisiting the Diversification and Insurance Relationship: Differences between on–and off-Farm Strategies. Clim. Risk Manag. 2021, 32, 100315. [Google Scholar] [CrossRef]
  5. Ali, J. Adoption of Diversification for Risk Management in Vegetable Cultivation. Int. J. Veg. Sci. 2015, 21, 9–20. [Google Scholar] [CrossRef]
  6. Falco, S.D.; Adinolfi, F.; Bozzola, M.; Capitanio, F. Crop Insurance as a Strategy for Adapting to Climate Change. J. Agric. Econ. 2014, 65, 485–504. [Google Scholar] [CrossRef]
  7. Bezabih, M.; Sarr, M. Risk Preferences and Environmental Uncertainty: Implications for Crop Diversification Decisions in Ethiopia. Environ. Resour. Econ. 2012, 53, 483–505. [Google Scholar] [CrossRef]
  8. van Winsen, F.; de Mey, Y.; Lauwers, L.; Van Passel, S.; Vancauteren, M.; Wauters, E. Determinants of Risk Behaviour: Effects of Perceived Risks and Risk Attitude on Farmer’s Adoption of Risk Management Strategies. J. Risk Res. 2016, 19, 56–78. [Google Scholar] [CrossRef]
  9. Thompson, N.M.; Bir, C.; Widmar, N.J.O. Farmer Perceptions of Risk in 2017. Agribusiness 2019, 35, 182–199. [Google Scholar] [CrossRef]
  10. Meraner, M.; Finger, R. Risk Perceptions, Preferences and Management Strategies: Evidence from a Case Study Using German Livestock Farmers. J. Risk Res. 2017, 22, 110–135. [Google Scholar] [CrossRef]
  11. McRoberts, N.; Hall, C.; Madden, L.V.; Hughes, G. Perceptions of Disease Risk: From Social Construction of Subjective Judgments to Rational Decision Making. Phytopathology 2011, 101, 654–665. [Google Scholar] [CrossRef] [PubMed]
  12. JianJun, J.J.; YiWei, G.; XiaoMin, W.X.; Nam, P.K. Farmers’ Risk Preferences and Their Climate Change Adaptation Strategies in the Yongqiao District, China. Land Use Policy 2015, 47, 365–372. [Google Scholar] [CrossRef]
  13. Avadí, A. Environmental Assessment of the Ecuadorian Cocoa Value Chain with Statistics-Based LCA. Int. J. Life Cycle Assess. 2023, 28, 1495–1515. [Google Scholar] [CrossRef]
  14. Caicedo-Vargas, C.; Pérez-Neira, D.; Abad-González, J.; Gallar, D. Agroecology as a Means to Improve Energy Metabolism and Economic Management in Smallholder Cocoa Farmers in the Ecuadorian Amazon. Sustain. Prod. Consum. 2023, 41, 201–212. [Google Scholar] [CrossRef]
  15. Mihai, R.A.; Landazuri Abarca, P.A.; Tinizaray Romero, B.A.; Florescu, L.I.; Catană, R.; Kosakyan, A. Abiotic Factors from Different Ecuadorian Regions and Their Contribution to Antioxidant, Metabolomic and Organoleptic Quality of Theobroma Cacao L. Beans, Variety “Arriba Nacional”. Plants 2022, 11, 976. [Google Scholar] [CrossRef]
  16. Villacis, A.H.; Alwang, J.R.; Barrera, V.; Dominguez, J. Prices, Specialty Varieties, and Postharvest Practices: Insights from Cacao Value Chains in Ecuador. Agribusiness 2022, 38, 426–458. [Google Scholar] [CrossRef]
  17. Ahmad, D.; Afzal, M.; Rauf, A. Analysis of Wheat Farmers’ Risk Perceptions and Attitudes: Evidence from Punjab, Pakistan. Nat. Hazards 2019, 95, 845–861. [Google Scholar] [CrossRef]
  18. Pham, T.T.; Dang, H.L.; Pham, N.T.A.; Dang, H.D. Adoption of Contract Farming for Managing Agricultural Risks: A Case Study in Rice Production in the Mekong Delta, Vietnam. J. Agribus. Dev. Emerg. Econ. 2021. ahead-of-print. [Google Scholar] [CrossRef]
  19. Zelingher, R.; Makowski, D. Investigating and Forecasting the Impact of Crop Production Shocks on Global Commodity Prices. Environ. Res. Lett. 2023, 19, 014026. [Google Scholar] [CrossRef]
  20. Salazar, O.V.; Latorre, S.; Godoy, M.Z.; Quelal-Vásconez, M.A. The Challenges of a Sustainable Cocoa Value Chain: A Study of Traditional and “Fine or Flavour” Cocoa Produced by the Kichwas in the Ecuadorian Amazon Region. J. Rural Stud. 2023, 98, 92–100. [Google Scholar] [CrossRef]
  21. Hansson, H.; Lagerkvist, C.J. Decision Making for Animal Health and Welfare: Integrating Risk-Benefit Analysis with Prospect Theory. Risk Anal. 2014, 34, 1149–1159. [Google Scholar] [CrossRef] [PubMed]
  22. Adnan, K.M.M.; Ying, L.; Ayoub, Z.; Sarker, S.A.; Menhas, R.; Chen, F.; Yu, M. Risk Management Strategies to Cope Catastrophic Risks in Agriculture: The Case of Contract Farming, Diversification and Precautionary Savings. Agriculture 2020, 10, 351. [Google Scholar] [CrossRef]
  23. Komarek, A.M.; De Pinto, A.; Smith, V.H. A Review of Types of Risks in Agriculture: What We Know and What We Need to Know. Agric. Syst. 2020, 178, 102738. [Google Scholar] [CrossRef]
  24. Mase, A.S.; Gramig, B.M.; Prokopy, L.S. Climate Change Beliefs, Risk Perceptions, and Adaptation Behavior among Midwestern U.S. Crop Farmers. Clim. Risk Manag. 2017, 15, 8–17. [Google Scholar] [CrossRef]
  25. Antón, J. Managing Risk in Agriculture: A Holistic Approach; OECD: Paris, France, 2009. [Google Scholar]
  26. Shah, J.; Alharthi, M. The Association between Farmers’ Psychological Factors and Their Choice to Adopt Risk Management Strategies: The Case of Pakistan. Agriculture 2022, 12, 412. [Google Scholar] [CrossRef]
  27. Wauters, E.; van Winsen, F.; de Mey, Y.; Lauwers, L. Risk Perception, Attitudes towards Risk and Risk Management: Evidence and Implications. Agric. Econ. (Zemědělská Ekon.) 2014, 60, 389–405. [Google Scholar] [CrossRef]
  28. Iqbal, M.A.; Ping, Q.; Abid, M.; Kazmi, S.M.M.; Rizwan, M. Assessing Risk Perceptions and Attitude among Cotton Farmers: A Case of Punjab Province, Pakistan. Int. J. Disaster Risk Reduct. 2016, 16, 68–74. [Google Scholar] [CrossRef]
  29. Lucas, M.P.; Pabuayon, I.M. Risk Perceptions, Attitudes, and Influential Factors of Rainfed Lowland Rice Farmers in Ilocos Norte, Philippines. Asian J. Agric. Dev. 2011, 8, 61–77. [Google Scholar] [CrossRef]
  30. Duong, T.T.; Brewer, T.; Luck, J.; Zander, K. A Global Review of Farmers’ Perceptions of Agricultural Risks and Risk Management Strategies. Agriculture 2019, 9, 10. [Google Scholar] [CrossRef]
  31. Tedesco, I. A Holistic Approach to Agricultural Risk Management for Improving Resilience. Platf. Agric. Risk Manag. Work. Pap. 2018, 5. [Google Scholar]
  32. Novickytė, L. Income Risk Management in Agriculture Using Financial Support. Eur. J. Sustain. Dev. 2018, 7, 191. [Google Scholar] [CrossRef]
  33. Śmiglak-Krajewska, M. Agricultural Risk and Its Perception among Protein Plant Farmers. Roczniki 2019, 2019, 191. [Google Scholar] [CrossRef]
  34. Iqbal, M.A.; Abbas, A.; Naqvi, S.A.A.; Rizwan, M.; Samie, A.; Ahmed, U.I. Drivers of Farm Households’ Perceived Risk Sources and Factors Affecting Uptake of Mitigation Strategies in Punjab Pakistan: Implications for Sustainable Agriculture. Sustainability 2020, 12, 9895. [Google Scholar] [CrossRef]
  35. Finger, R.; Garcia, V.; McCallum, C.; Rommel, J. A Note on European Farmers’ Preferences under Cumulative Prospect Theory. J. Agric. Econ. 2023, 75, 465–472. [Google Scholar] [CrossRef]
  36. Kahneman, D.; Tversky, A. Prospect Theory: An Analysis of Decision under Risk. Econometrica 1979, 47, 263–291. [Google Scholar] [CrossRef]
  37. Spiegel, A.; Britz, W.; Finger, R. Risk, Risk Aversion, and Agricultural Technology Adoption—A Novel Valuation Method Based on Real Options and Inverse Stochastic Dominance. Q Open 2021, 1, qoab016. [Google Scholar] [CrossRef]
  38. Girma, Y.; Kuma, B.; Bedemo, A. Risk Aversion and Perception of Farmers about Endogenous Risks: An Empirical Study for Maize Producers in Awi Zone, Amhara Region of Ethiopia. J. Risk Financ. Manag. 2023, 16, 87. [Google Scholar] [CrossRef]
  39. Sulewski, P.; Wąs, A.; Kobus, P.; Pogodzińska, K.; Szymańska, M.; Sosulski, T. Farmers’ Attitudes towards Risk—An Empirical Study from Poland. Agronomy 2020, 10, 1555. [Google Scholar] [CrossRef]
  40. Lee, C.K.; Foo, M.Y. Risk Attitudes and the Big Five Personality Traits: A Study on Construction Project Practitioners in Malaysia. Int. J. Constr. Manag. 2022, 22, 2435–2445. [Google Scholar] [CrossRef]
  41. Coll, E.P.C.; Dilas-Jiménez, J.O. Producción y Exportación Del Cacao Ecuatoriano y El Potencial Del Cacao Fino de Aroma. Qantu Yachay 2022, 2, 08–15. [Google Scholar] [CrossRef]
  42. Barragán-Landy, M.; Sousa, S.; Romero, F.; Leão, C. A Proposed Representative Sampling Methodology. In Proceedings of the 20th European Conference on Research Methodology for Business and Management Studies: ECRM, Aveiro, Portugal, 17–18 June 2021; p. 8. [Google Scholar]
  43. Tanaka, T.; Camerer, C.F.; Nguyen, Q. Risk and Time Preferences: Linking Experimental and Household Survey Data from Vietnam. Am. Econ. Rev. 2010, 100, 557–571. [Google Scholar] [CrossRef]
  44. Rommel, J.; Hermann, D.; Müller, M.; Mußhoff, O. Contextual Framing and Monetary Incentives in Field Experiments on Risk Preferences: Evidence from German Farmers. J. Agric. Econ. 2019, 70, 408–425. [Google Scholar] [CrossRef]
  45. Praveen, K.V.; Suresh, A.; Reddy, A.A.; Singh, D.R. Risks and Adaptation Strategies in Rainfed Agriculture in India: An Analysis. Indian J. Agric. Sci. 2018, 88, 958–963. [Google Scholar] [CrossRef]
  46. Asravor, R.K. Farmers’ Risk Preference and the Adoption of Risk Management Strategies in Northern Ghana. J. Environ. Plan. Manag. 2019, 62, 881–900. [Google Scholar] [CrossRef]
  47. Damalas, C.A. Farmers’ Intention to Reduce Pesticide Use: The Role of Perceived Risk of Loss in the Model of the Planned Behavior Theory. Environ. Sci. Pollut. Res. 2021, 28, 35278–35285. [Google Scholar] [CrossRef]
  48. Antonelli, C.; Coromaldi, M.; Pallante, G. Crop and Income Diversification for Rural Adaptation: Insights from Ugandan Panel Data. Ecol. Econ. 2022, 195, 107390. [Google Scholar] [CrossRef]
  49. Jarvis, C.B.; MacKenzie, S.B.; Podsakoff, P.M. A Critical Review of Construct Indicators and Measurement Model Misspecification in Marketing and Consumer Research. J. Consum. Res. 2003, 30, 199–218. [Google Scholar] [CrossRef]
  50. Kipato, N.; Dorward, P.; Clarkson, G. A lower threat than I thought: How the analysis of the interdependence between risks influences smallholder farmers’ perceptions. Sustainability 2023, 15, 14467. [Google Scholar] [CrossRef]
  51. Mohsin, M.; Yin, H.; Mehak, A. Sustainable solutions: Exploring risks and strategies in Pakistan’s seafood trade for marine conservation. Front. Mar. Sci. 2024, 11, 1420755. [Google Scholar] [CrossRef]
  52. García-Machado, J.J.; Sroka, W.; Nowak, M. PLS-SEM Model on Business Demand for Technological Services and R&D and Innovation Activities. Technol. Econ. Dev. Econ. 2023, 29, 1–22. [Google Scholar]
  53. Alexis, H. Villacis Inconsistent Choices over Prospect Theory Lottery Games: Evidence from Field Experiments. J. Behav. Exp. Econ. 2023, 103, 101989. [Google Scholar] [CrossRef]
  54. Feyisa, A.D.; Maertens, M.; de Mey, Y. Relating Risk Preferences and Risk Perceptions over Different Agricultural Risk Domains: Insights from Ethiopia. World Dev. 2023, 162, 106137. [Google Scholar] [CrossRef]
  55. Cerroni, S.; Bozzola, M.; Rippo, R. Eliciting Farmers? Risk and Uncertainty Preferences Using Contextualized Field Experiments in Developing Countries: A Pilot Study. In Managing Risk in Agriculture: A Development Perspective; CABI: Wallingford, UK, 2023; pp. 85–100. [Google Scholar] [CrossRef]
  56. Ihli, H.J.; Chiputwa, B.; Winter, E.; Gassner, A. Risk and Time Preferences for Participating in Forest Landscape Restoration: The Case of Coffee Farmers in Uganda. World Dev. 2022, 150, 105713. [Google Scholar] [CrossRef]
  57. Edeh, E.; Lo, W.-J.; Khojasteh, J. Review of Partial Least Squares Structural Equation Modeling (PLS-SEM) Using R: A Workbook: By Joseph F. Hair Jr., G. Tomas M. Hult, Christian M. Ringle, Marko Sarstedt, Nicholas P. Danks, Soumya Ray. Cham, Switzerland: Springer, (2021). 197 Pp. $0, Open Access; $59.99, Hardcover Book. Struct. Equ. Model. A Multidiscip. J. 2023, 30, 165–167. [Google Scholar] [CrossRef]
  58. Sarstedt, M.; Ringle, C.M.; Cheah, J.-H.; Ting, H.; Moisescu, O.I.; Radomir, L. Structural Model Robustness Checks in PLS-SEM. Tour. Econ. 2020, 26, 531–554. [Google Scholar] [CrossRef]
  59. Wang, S.; Cheah, J.-H.; Wong, C.Y.; Ramayah, T. Progress in Partial Least Squares Structural Equation Modeling Use in Logistics and Supply Chain Management in the Last Decade: A Structured Literature Review. Int. J. Phys. Distrib. Logist. Manag. 2023, 54, 673–704. [Google Scholar] [CrossRef]
  60. Ringle, C.M.; Sarstedt, M.; Sinkovics, N.; Sinkovics, R.R. A Perspective on Using Partial Least Squares Structural Equation Modelling in Data Articles. Data Brief 2023, 48, 109074. [Google Scholar] [CrossRef] [PubMed]
  61. Hair, J.F.; Sarstedt, M.; Ringle, C.M.; Sharma, P.N.; Liengaard, B.D. Going beyond the Untold Facts in PLS–SEM and Moving Forward. Eur. J. Mark. 2024, 58, 81–106. [Google Scholar] [CrossRef]
  62. Sarstedt, M.; Adler, S.J.; Ringle, C.M.; Cho, G.; Diamantopoulos, A.; Hwang, H.; Liengaard, B.D. Same Model, Same Data, but Different Outcomes: Evaluating the Impact of Method Choices in Structural Equation Modeling. J. Prod. Innov. Manag. 2024, 41, 1100–1117. [Google Scholar] [CrossRef]
  63. Cepeda, G.; Roldán, J.L.; Sabol, M.; Hair, J.; Chong, A.Y.L. Emerging Opportunities for Information Systems Researchers to Expand Their PLS-SEM Analytical Toolbox. Ind. Manag. Data Syst. 2024, 124, 2230–2250. [Google Scholar] [CrossRef]
  64. Wentzel, L.; Fapohunda, J.; Haldenwang, R. Challenges in Implementing Corporate Social Responsibility: A Study of SMEs in South Africa’s Construction Industry. Acta Structilia 2024, 31, 159–193. [Google Scholar]
  65. Chitakasempornkul, K.; Rosa, G.J.M.; Jager, A.; Bello, N.M. Hierarchical Modeling of Structural Coefficients for Heterogeneous Networks with an Application to Animal Production Systems. J. Agric. Biol. Environ. Stat. 2020, 25, 1–22. [Google Scholar] [CrossRef]
  66. Waldman, K.B.; Todd, P.M.; Omar, S.; Blekking, J.P.; Giroux, S.A.; Attari, S.Z.; Baylis, K.; Evans, T.P. Agricultural Decision Making and Climate Uncertainty in Developing Countries. Environ. Res. Lett. 2020, 15, 113004. [Google Scholar] [CrossRef]
  67. Liu, E.M. Time to Change What to Sow: Risk Preferences and Technology Adoption Decisions of Cotton Farmers in China. Rev. Econ. Stat. 2013, 95, 1386–1403. [Google Scholar] [CrossRef]
  68. Cárcamo, J.; Cramon-Taubadel, S.V. Assessing Small-Scale Raspberry Producers’ Risk and Ambiguity Preferences: Evidence from Field-Experiment Data in Rural Chile; Georg-August-Universität Göttingen, Department für Agrarökonomie und Rurale Entwicklung (DARE): Göttingen, Germany, 2016. [Google Scholar]
  69. Hasibuan, A.M.; Wulandari, S.; Ardana, I.K.; Wahyudi, A. Understanding Climate Adaptation Practices among Small-Scale Sugarcane Farmers in Indonesia: The Role of Climate Risk Behaviors, Farmers’ Support Systems, and Crop-Cattle Integration. Resour. Environ. Sustain. 2023, 13, 100129. [Google Scholar] [CrossRef]
  70. Harrison, G.W.; Humphrey, S.J.; Verschoor, A. Choice under Uncertainty: Evidence from Ethiopia, India and Uganda. Econ. J. 2010, 120, 80–104. [Google Scholar] [CrossRef]
  71. Cheung, G.W.; Cooper-Thomas, H.D.; Lau, R.S.; Wang, L.C. Reporting Reliability, Convergent and Discriminant Validity with Structural Equation Modeling: A Review and Best-Practice Recommendations. Asia Pac. J. Manag. 2024, 41, 745–783. [Google Scholar] [CrossRef]
  72. Belay, S.; Melese, S.; Seifu, A. Primary School Climate Measurement: Examining Factorial Validity and Reliability from Teachers’ Perspective. Cogent Educ. 2021, 8, 1929039. [Google Scholar] [CrossRef]
  73. Youssef, N.; Saleeb, M.; Gebreal, A.; Ghazy, R.M. The Internal Reliability and Construct Validity of the Evidence-Based Practice Questionnaire (EBPQ): Evidence from Healthcare Professionals in the Eastern Mediterranean Region. Healthcare 2023, 11, 2168. [Google Scholar] [CrossRef]
  74. Nabilla, N.F.A.; Afifi, S. Pengaruh Komunikasi Persuasif Dan Personal Branding Celebrity Endorser Terhadap Kesadaran Vaksinasi Covid-19 (Analisis Structural Equation Modeling Partial Least Squares). J. Mhs. Komun. Cantrik 2023, 3. [Google Scholar] [CrossRef]
  75. Hair, J.F.; Risher, J.J.; Sarstedt, M.; Ringle, C.M. When to Use and How to Report the Results of PLS-SEM. Eur. Bus. Rev. 2019, 31, 2–24. [Google Scholar] [CrossRef]
  76. Abd Wahab, S.R.H.; Sahri, N.N.M.; Muhammad, F.; Ismail, B.; Akbar, A.R.N. The Validity and Reliability of the Theory Behind BIM Adoption in The Facility Management Using PLS-SEM. Online J. TVET Pract. 2023, 8, 51–64. [Google Scholar] [CrossRef]
  77. Li, W.; Lay, Y.F. Examining the Reliability and Validity of Measuring Scales Related to Informatization and Instructional Leadership Using the PLS-SEM Approach. Humanit. Soc. Sci. Lett. 2024, 12, 461–480. [Google Scholar] [CrossRef]
  78. Hair, J.F.; Howard, M.C.; Nitzl, C. Assessing Measurement Model Quality in PLS-SEM Using Confirmatory Composite Analysis. J. Bus. Res. 2020, 109, 101–110. [Google Scholar] [CrossRef]
  79. Tabet, S.M.; Lambie, G.W.; Jahani, S.; Rasoolimanesh, S.M. The Factor Structure of Outcome Questionnaire–45.2 Scores Using Confirmatory Tetrad Analysis–Partial Least Squares. J. Psychoeduc. Assess. 2020, 38, 350–368. [Google Scholar] [CrossRef]
  80. Mohd Dzin, N.H.; Lay, Y.F. Validity and Reliability of Adapted Self-Efficacy Scales in Malaysian Context Using PLS-SEM Approach. Educ. Sci. 2021, 11, 676. [Google Scholar] [CrossRef]
  81. Hair, J.F.; Sarstedt, M. Explanation Plus Prediction—The Logical Focus of Project Management Research. Proj. Manag. J. 2021, 54, 319–322. [Google Scholar] [CrossRef]
  82. Cohen, J. Statistical Power Analysis for the Behavioral Sciences, 2nd ed.; Routledge: New York, NY, USA, 1988; ISBN 978-0-203-77158-7. [Google Scholar]
  83. Chandra, S.R.; Bhat, A.; Shenoy, S.S.; Shenoy, R.U. Measuring the Effect Size of Coefficient of Determination and Predictive Relevance of External Dormant Variables on Internal Dormant Variables through PLS-SEM at Zuese Gym, Mangalore. Int. J. Econ. Res. 2017, 14, 559–565. [Google Scholar]
  84. Bonjean, I. Who Are the Loss-Averse Farmers? Experimental Evidence from Structurally Estimated Risk Preferences. Eur. Rev. Agric. Econ. 2023, 50, 421–456. [Google Scholar] [CrossRef]
  85. Villacis, A.; Alwang, J.; Barrera, V. Cacao Value Chains and Credence Attributes: Lessons from Ecuador. J. Agribus. Dev. Emerg. Econ. 2022, 12, 549–566. [Google Scholar] [CrossRef]
  86. Rahman, T.; Gasbarro, D.; Alam, K. Financial Risk Protection from Out-of-Pocket Health Spending in Low- and Middle-Income Countries: A Scoping Review of the Literature. Health Res. Policy Sys. 2022, 20, 83. [Google Scholar] [CrossRef] [PubMed]
  87. Menapace, L.; Colson, G.; Raffaelli, R. Risk Aversion, Subjective Beliefs, and Farmer Risk Management Strategies. Am. J. Agric. Econ. 2013, 95, 384–389. [Google Scholar] [CrossRef]
  88. Peng, R.; Zhao, Y.; Elahi, E.; Peng, B. Does Disaster Shocks Affect Farmers’ Willingness for Insurance? Mediating Effect of Risk Perception and Survey Data from Risk-Prone Areas in East China. Nat. Hazards 2021, 106, 2883–2899. [Google Scholar] [CrossRef]
  89. Perlin, L.; Leguizamón, A. Agriculture-Driven Deforestation in Ecuador’s Mache-Chindul Ecological Reserve: The Farmers’ Perspective. J. Rural. Stud. 2024, 107, 103263. [Google Scholar] [CrossRef]
  90. Sun, Y.; Yu, R.; Cheng, T.C.E. Incentives for Promoting Climate Change Adaptation Technologies in Agriculture: An Evolutionary Game Approach. Environ. Sci. Pollut. Res. 2023, 30, 97025–97039. [Google Scholar] [CrossRef]
Figure 1. Flowchart of the Methodology Employed in the Study.
Agriculture 15 00843 g001
Figure 2. Conceptual model for determine the small cacao producers’ risk behavior.
Agriculture 15 00843 g002
Figure 3. Path mediation model. * p < 0.05.
Agriculture 15 00843 g003
Table 1. Summary of Hypotheses and Relationships.
HypothesisDescriptionType of Relationship
H1The perceived probability of different risk sources significantly influences the intention to implement risk management strategies.Direct Effect
H2The perceived impact of different risk sources significantly influences the intention to implement risk management strategies.Direct Effect
H3Risk aversion has a significant and negative relationship with the intention to implement risk management strategies.Direct Effect
H4Loss aversion has a significant and negative relationship with the intention to implement risk management strategies.Direct Effect
H5Individuals with high risk aversion perceive a higher probability of encountering various risk sources.Direct Effect
H6Individuals with high risk aversion perceive a greater potential impact of various risk sources.Direct Effect
H7Individuals with high loss aversion perceive a higher probability of encountering losses from various risk sources.Direct Effect
H8Individuals with high loss aversion perceive a greater potential impact of losses from various risk sources.Direct Effect
H9The perceived probability of risk positively mediates the relationship between risk aversion and the intention to implement risk management strategies.Mediated Effect
H10The perceived impact of risk positively mediates the relationship between risk aversion and the intention to implement risk management strategies.Mediated Effect
H11The perceived probability of risk positively mediates the relationship between loss aversion and the intention to implement risk management strategies.Mediated Effect
H12The perceived impact of risk positively mediates the relationship between loss aversion and the intention to implement risk management strategies.Mediated Effect
Table 2. Latent variables assessed and description of their indicators.
Latent
Variable
IndicatorsCodeDescriptionMeanStandard
Deviation
MinimumMaximum
Risk Management Strategies (RMS)DiversifyRMSDI1Plant different products at the same time4.51.217
RMSDI2Maintain different income sources5.01.517
OptimizeRMSOP1Invest in technical improvements on the farm3.81.317
RMSOP2Invest in expanding farmland3.91.417
CopingRMSCO1Work harder in tough times4.21.417
Off-farmRMSOF1Obtain off-farm income4.11.317
Perceived Probability (PP) Risk Perception (RP)Perceived Probability (PP)
Commercialization
(COMPP)
PPCOM1Lack of policies to improve marketing conditions4.84.84.84.8
PPCOM2Disrespect for contract conditions4.64.64.64.6
PPCOM3Mixing of National Cacao with CCN-51 at sale.4.74.74.74.7
Institutional
(INSPP)
PPINST1Unexpected policy changes negatively affecting farms.4.94.94.94.9
PPINST2End of government support program for National Cacao.4.64.64.64.6
PPINST3Discrimination in seed and supply distribution.4.54.54.54.5
Price
(PRIPP)
PPPRIC1Excessive drop in product prices4.91.617
PPPRIC2Excessive increase in input costs4.71.417
PPPRIC3Low income relative to costs over time4.61.517
Perceived Impact (PI)
Commercialization
(COMPI)
PIMPCOM1Increase in intermediaries profiting most4.81.217
PIMPCOM2Disrespect for contract conditions by companies4.61.417
PIMPCOM3Mixing National Cacao with CCN-51 at sale4.71.317
Institutional
(INSPI)
PIMPINST1Unexpected policy changes harming farms4.91.317
PIMPINST2End of government agricultural aid programs4.61.417
PIMPINST3Disappearance of agricultural associations4.51.517
Price
(PRIPI)
PIMPRIC1Excessive drop in product prices4.91.617
PIMPRIC2Excessive increase in input costs4.71.417
PIMPRIC3Low income relative to costs over time4.61.517
Production
(PROPI)
PIMPRO1Production loss due to excess rainfall4.71.417
PIMPRO2Production loss due to severe drought4.61.317
PIMPRO3Production loss due to pests and diseases4.51.517
Farmers’ socio-demographic characteristics
Age (years)-50.215.01886
Gender (% female)-21.8---
Education (years)-5.334.01015
Household size-2.751.4617
Land size (ha)-5.793.080.3847.5
Married or live together-71.3---
Table 3. Estimates of risk attitude parameters.
ParameterDescriptionMeanStandard Deviation
σCoefficient of risk aversion0.529 ***0.258
αProbability weighting function parameter0.856 ***0.420
λCoefficient of loss aversion3.721 ***2.556
*** p < 0.001.
Table 4. Summary results for convergent validity and internal consistency reliability of the three reflective measurement models.
Latent VariableIndicatorsConvergent
Validity
Internal Consistency Reliability
LoadingsAVEDijkstra– Henseler’s rho (ρA)Composite ReliabilityCronbach’s Alpha
>0.70>0.50>0.700.70–0.900.70–0.90
Risk AttitudeRisk Aversion-----
Loss Aversion-----
Risk PerceptionPerceived
Probability
0.6790.7670.8790.763
COMPP
(Commercialization)
0.826 ***
INSPP
(Institutional)
0.870 ***
PRIPP
(Price)
0.803 ***
Perceived Impact 0.6770.8510.9110.851
COMPI
(Commercialization)
0.846 ***
INSPI
(Institutional)
0.830 ***
PRIPI
(Price)
0.861 ***
PROPI
(Production)
0.803 ***
Risk Management StrategiesCoping0.770 ***0.6020.8030.8750.788
Diversify0.750 ***
Off-farm0.824 ***
Optimize0.801 ***
*** p < 0.01 based on a two-tailed t-test for t (4999).
Table 5. Confirmatory tetrad analysis results for perceived impact and risk management strategy.
Latent VariablesModel-Implied Non-Redundant Vanishing TetradTetrad ValueBoostrap
SD
Boostrap t Valuep ValueCIadj a
Perceived1: COMPI, INSPI, PRIPI, PROPI0.0650.0441.4970.135[−0.018;0.153]
impact2: COMPI, INSPI, PRIPI, PROPI0.0160.0490.3310.741[−0.079;0.114]
Risk Management Strategy1: Coping, Diversify, Off-farm, Optimize−0.0220.0360.5950.552[−0.094;0.048]
2: Coping, Diversify, Optimize, Off-farm−0.1390.0821.6960.09[−0.303;0.019]
a CIadj = 90% CIadj bias-corrected and Bonferroni-adjusted boostrap confidence intervals.
Table 6. Discriminant validity results following the heterotrait-monotrait ratio of correlations (HTMT criterion).
Latent VariableLoss AversionPIPBRisk AversionRMS
Loss Aversion
Perceives Impact0.136
Perceived Probability0.1900.816
Risk Aversion0.0350.0510.161
Risk Management Strategy0.0280.5230.4500.089
Table 7. Variance inflation factor (VIF) values in the structural model.
Loss AversionPerceived ImpactPerceived ProbabilityRisk AversionRisk Management Strategy
Loss Aversion 1.0011.001 1.029
Perceived Impact 1.677
Perceived Probability 1.728
Risk Aversion 1.0011.001 1.026
Risk Management Strategy
Table 8. Results of the significance test for the structural model paths.
HypothesesPathPath Coefficients95% Confidence IntervalsHypothesis Results a
H1PP à RMS0.123[0.004, 0.260]Not supported
H2PI à RMS0.374[0.203, 0.561]Supported
H3Risk Aversion à RMS−0.046[−0.158, 0.065]Not supported
H4Loss Aversion à RMS−0.084[0.190, 0.026]Not supported
H5Risk Aversion à PP−0.138[−0.249, −0.027]Opposite to supported
H6Risk Aversion à PI−0.028[−0.153, 0.091]Not supported
H7Loss Aversion à PP0.165[0.041, 0.276]Supported
H8Loss Aversion à PI0.126[0.002, 0.239]Supported
a Significance level of p < 0.05 with 5000 sub-samples bootstrapping.
Table 9. Indicators of the model in-sample and out-of-sample predictive power.
R2R2
adj
Q2
Perceived Impact0.0170.0050.003
Perceived Probability0.0460.0350.021
Risk Management Strategy0.2080.1840.093
Table 10. The effect size (f2) of exogenous constructs on the endogenous constructs.
Loss AversionPIPPRisk AversionRMS
Loss Aversion 0.0150.027 0.008
PI 0.098
PP 0.010
Risk Aversion 0.0010.019 0.002
RMS
Disclaimer/Publisher’s Note: The statements, opinions and data contained in all publications are solely those of the individual author(s) and contributor(s) and not of MDPI and/or the editor(s). MDPI and/or the editor(s) disclaim responsibility for any injury to people or property resulting from any ideas, methods, instructions or products referred to in the content.

