Article

Progress and Trends in Coupled Model Intercomparison Project (CMIP) Research: A Bibliometric Analysis

1
College of Natural Resources and Environment, Northwest A&F University, Yangling 712100, China
2
Department of Water Engineering, Faculty of Water and Soil Engineering, Gorgan University of Agricultural Sciences and Natural Resources, Gorgan 4913815739, Iran
3
Department of Soil Science, University of Manitoba, Winnipeg, MB R3T 2N2, Canada
*
Author to whom correspondence should be addressed.
Agriculture 2025, 15(8), 826; https://doi.org/10.3390/agriculture15080826
Submission received: 24 February 2025 / Revised: 7 April 2025 / Accepted: 9 April 2025 / Published: 10 April 2025
(This article belongs to the Section Ecosystem, Environment and Climate Change in Agriculture)

Abstract

:
Understanding of the Coupled Model Intercomparison Project (CMIP) and its research progress and applications is critical to answer scientific questions related to climate change. While numerous scientific papers based on CMIP have been published, there is no quantitative study examining scientific research on climate variability, predictability, and change supported by CMIP. Therefore, the statistical characteristics of CMIP-related publications, including journals, disciplines, co-occurrence and burst detection of keywords, and bibliographic coupling, were analyzed using bibliometric analysis. The results show that research based on CMIP has increased exponentially from 2000 to 2023. About 20% of the research was published in the Journal of Climate and Climate Dynamics. CMIP-related research spanned several disciplines, including meteorology, atmospheric science, geosciences, and environmental sciences. The United States, China, and the United Kingdom ranked top three for CMIP publications. The prominent focus of related research involved the whole climate system, including climate change and variability, climate behavior, the carbon cycle, sea surface temperature, sea ice, modeling, bias correction, simulations, climate sensitivity, extreme events, soil moisture, hydrology, and future change. This study can help relevant scientists better understand the developments and trends of CMIP research, thereby facilitating the use of CMIP data.

1. Introduction

Agriculture is among the most vulnerable systems to climate change [1]. Enhancing research on the interactions between agriculture and climate modelling is critical for exploring agricultural production strategies and technical means of adapting them to climate change, ensuring global food security, and promoting sustainable agricultural development [2]. To address the risks and challenges to agriculture posed by climate change, numerous efforts have been made, including the establishment of various organizations and actions over the past decades, e.g., the World Meteorological Organization (WMO, 1950), the United Nations Environment Programme (UNEP, 1972), and the Intergovernmental Panel on Climate Change (IPCC, 1988 [3]), the construction of research and observational frameworks (the World Climate Research Programme (WCRP, 1979 [4]), the International Geosphere–Biosphere Programme (IGBP [5]), and the Global Climate Observing System (GCOS, 1992 [6]), and the coming agreements (the United Nations Framework Convention on Climate Change (UNFCCC, 1992), the Kyoto Protocol in 1997, and the Paris Agreement in 2015 [7].
However, agricultural production with more resilience and sustainability requires detailed climate and weather information, especially large-scale and high-resolution climate predictions, which are often difficult to obtain due to existing challenges including a lack of technological expertise, inadequate funding, or limited data availability. Fortunately, under the auspices of the WCRP, researchers have progressively improved atmospheric models into climate system models and Earth system models [8]. Climate simulations and projections are freely accessible to investigate climate change and its fundamental processes, which benefited from the execution of the Coupled Model Intercomparison Project (CMIP) [9] and model archives publicly accessible for non-commercial purposes through the Earth System Grid Federation (ESGF) at https://aims2.llnl.gov/search (accessed on 12 September 2024).
Launched in 1995, CMIP’s primary objective is to enhance our comprehension of climate changes—both historical and prospective—attributable to natural variability or alterations in radiative forcing, all within a multi-model context. Over the past three decades, CMIP has progressed from its initial phase, CMIP1, in 1995 to CMIP6 in 2013, with CMIP4 being omitted and CMIP7 currently in development [10], and with improved experimental design, advanced models, and model outputs. Utilizing these multi-model data, many investigations on global or regional climate change have been undertaken. For example, the introduction and overview of the experimental design and organization of every phase of CMIP [11,12], as well as the historical development and advancements associated with CMIP [9,13,14]. Assessments of the performance of CMIP6 models have been conducted in relation to the tropical Atlantic [15] and extratropical storm tracks [16]. Comparative analyses of simulation outcomes between CMIP3 and CMIP6 have also been performed, focusing on variables such as cloud ice, surface wind stress, radiation fields, sea surface temperature, the El Niño–Southern Oscillation (ENSO), and precipitation patterns over tropical and subtropical oceans [17,18,19,20]. Additionally, CMIP data were also utilized in many fields such as agriculture [21], ecosystem [22], and population health [23], etc. These scientific contributions provide essential support for IPCC and other international and national reports, which are vital for informing policy development pertinent to real-world applications and for enhancing public awareness and concern regarding global change [24,25,26].
While a full understanding of CMIP’s potential applications could impact research innovation and practicality in global change research, currently there is a lack of a statistical-based reviews to know what scientific questions could be supported by CMIP. Bibliometrics is a well-established and reliable research method employed extensively by researchers to explore research foci, evaluate trends, and screen out high-quality articles and outstanding authors relevant to their research interests [27]. Its applications include research in carbon neutrality [28], remote sensing [29], soil science [30], wastewater treatment [31], etc. To better understand developments and trends in CMIP research, a bibliometric analysis was performed using CMIP-related articles from the Web of Science.

2. Materials and Methods

In this paper, bibliometrics was conducted on CMIP research through the following four steps: scientific database selection, search formulation design, literature quality control, and bibliometric parameters calculation [32]. Here, query sets “TS = (“Couple Model Intercomparison Project” OR (“CMIP1” OR “CMIP2” OR “CMIP3” OR “CMIP5” OR “CMIP6” NOT (gene OR coated or material)))” were used to retrieve the literature documents archived in the Web of Science Core Collection (WoSCC) before 1 January 2024 (acquired on 7 March 2024). After filtering the records, 10,655 documents in English were finally obtained. The detailed article filtering criteria can be found in Appendix A.
Table 1 illustrates the tools and their uses in quantificationally analyzing the literature records and visualizing results [33]. To track CMIP’s applications, the annual production and scientific categories of publications were obtained with the visualization function of the Web of Science platform. A clustering technique was applied to visualize the collaboration networks of organizations and keywords in VOSviewer (version 1.6.19) [34,35]. In the process of clustering, a full counting method was employed, with the limitation that each publication was restricted to a maximum of 25 organizations, and a minimum threshold of 100 each for the number of publications for each organization and the keyword co-occurrence frequency. Using HistCite Pro (version 2.1), the top 15 journals based on ranking by a number of published papers were extracted, and a historiographical map was drawn to illustrate the citation relationships among the most significant works based on the 15 most cited papers [36]. Moreover, the number of publications in each country was extracted and visualized for their contributions. Additionally, keyword bursts were extracted and analyzed through CiteSpace (version 6.2.6), using a default threshold in the “Burstness” control panel.

3. Results

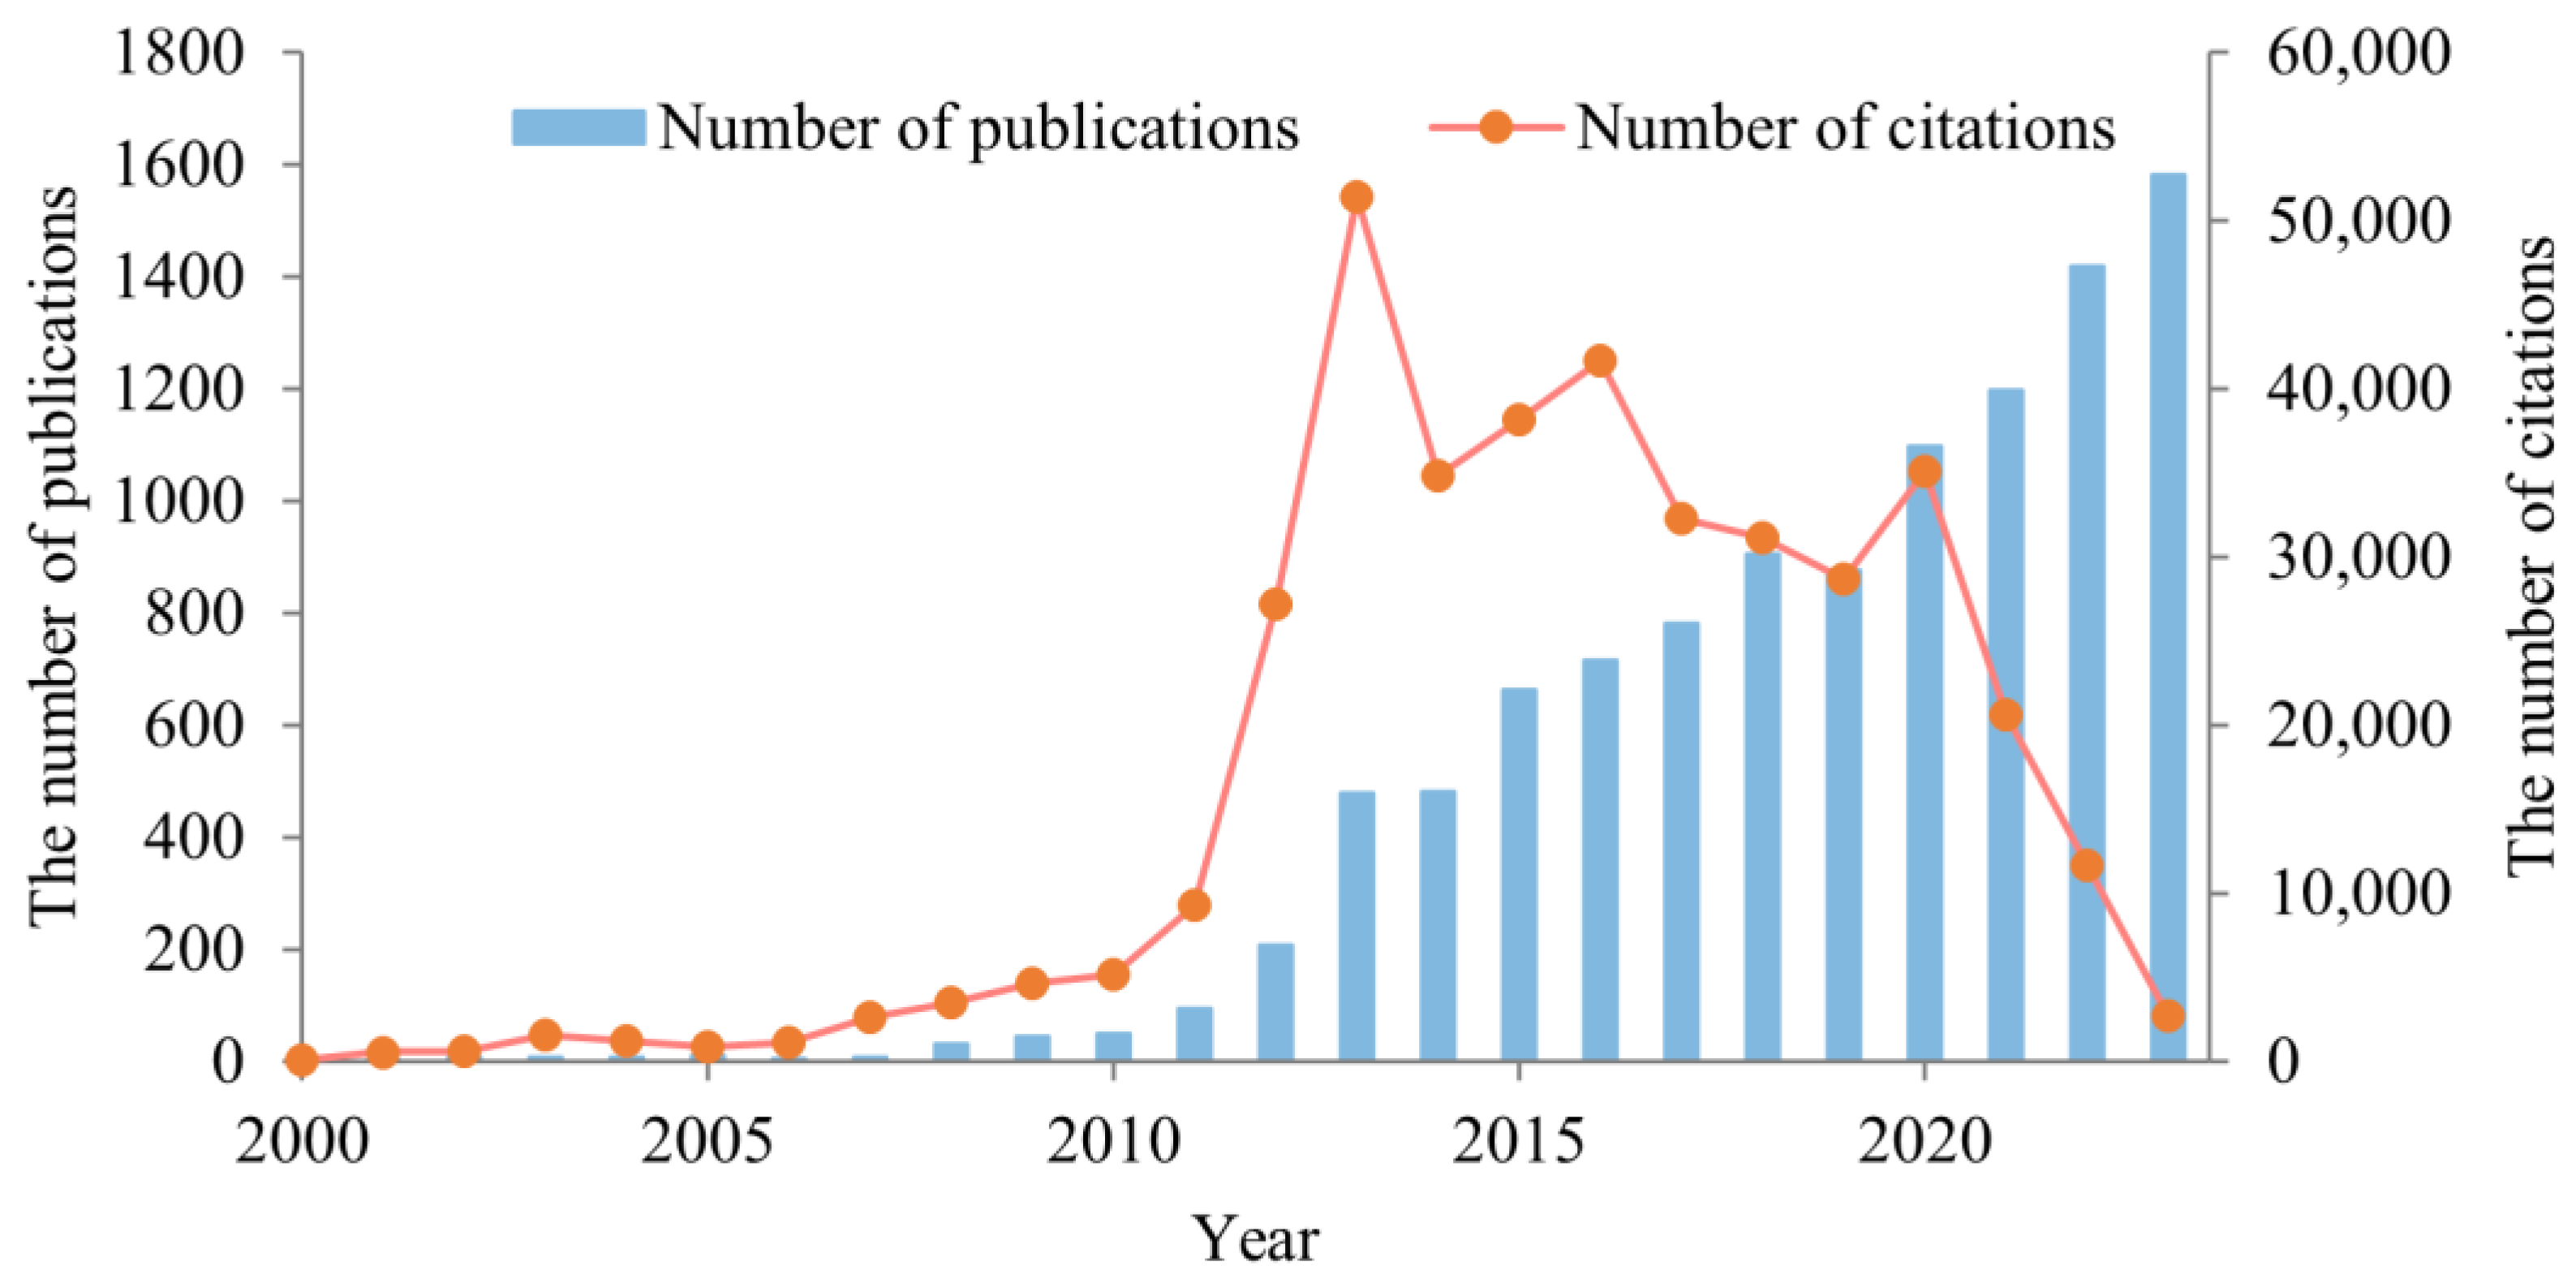
3.1. Annual Number of Publications

The quantity of publications and citations serves as an indicator of the impact of CMIP and its data. After relevant searching and quality control, 10,665 papers with 386,202 total global citations were gathered from WoSCC from 2000 to 2023 (Figure 1). The number of annual publications has grown exponentially, from less than 10 publications per year between 2000 and 2007 to more than 1000 publications per year between 2020 and 2023. The total number of citations in the literature gradually increased until 2013 followed by a fluctuating downward trend. The total number of citations was lower than 30,000 per year between 2021 and 2023.
Based on the number of publications, the trend of CMIP and its dataset applications can be categorized into the following three phases:
(i)
The first phase (2000–2007) was the initial stage, with 46 published articles accumulating 8477 citations. Notably, a study conducted by Meehl et al. (2007) [37] received 2233 citations. This research provided a systematic description of the WCRP CMIP3 multi-model datasets on experiments of climate change and climate variability, the organization of the CMIP3 analysis phase, and some case studies with this dataset. Other representative studies included uncertainty [38] or a comparison of different model outputs [39], atmosphere–ocean general circulation models [40], prediction and attribution analysis (e.g., global ocean circulation [41], ENSO [39], and sea ice variability [42]), and climate sensitivity effects on the Earth climate system [43].
(ii)
The second phase (2008–2014) was a period of slow development, with 1384 articles (12.98% of the total) and 135,912 citations. Although there were fewer than 100 publications per year between 2008 and 2011, the annual number of publications increased rapidly in the following three years. The most cited article in this phase (10,727 citations) was a technical report of CMIP5 and its experimental design [11]. The research in this phase not only included the research contents of the previous phase but also introduced some new aspects such as the uncertainties of climate models [44], the hydrology cycle [45], global warming [46], snow cover change [47], atmosphere feedback [48], El Niño [49], soil carbon change [50] and the carbon cycle [51], an evaluation of the models [52], glaciers [53], experiment design [11], and scenario models [54].
(iii)
The third phase (2015–2023) marked a period of fast development, featuring 9235 publications (86.59% of the total) and 241,813 citations. The most cited study in this phase was a review of the CMIP6 experimental design and organization with 4796 citations [12]. Scientists mostly focused on the large initial-condition ensembles [55], dryland [56], shared socioeconomic pathway [57], forcing scenarios [58], extreme events [59,60], and variability [61].

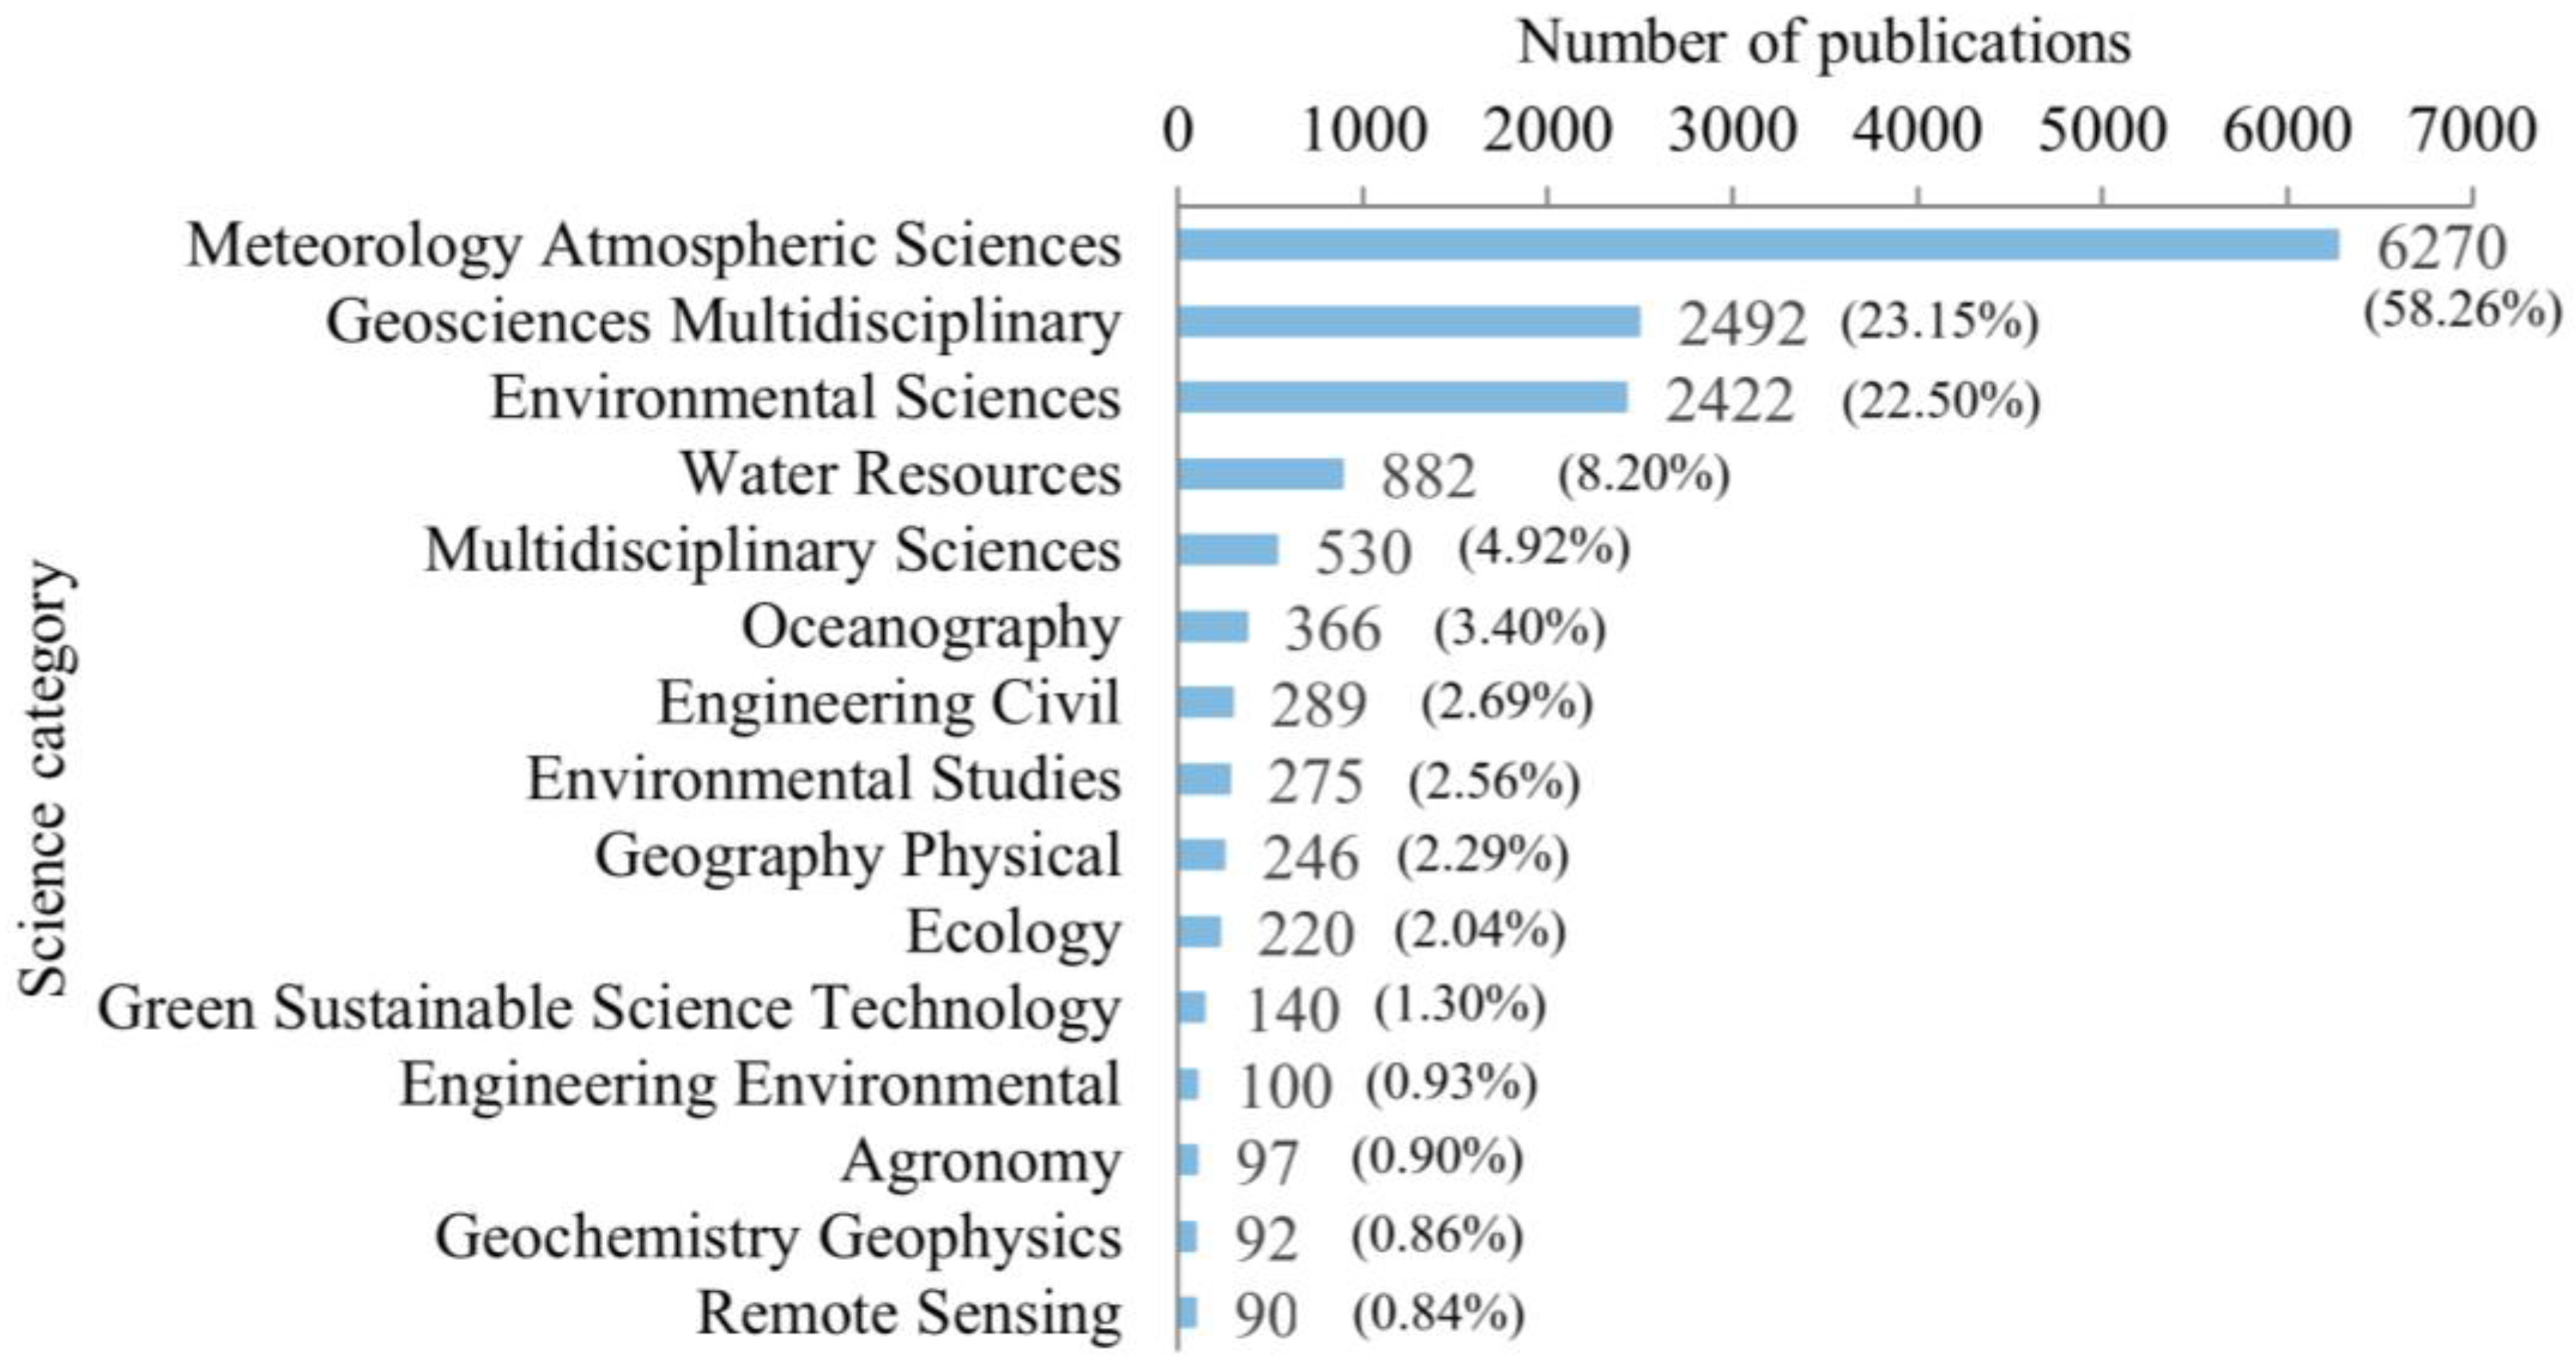
3.2. Journals Performance and Science Categories

Distinguishing research fields and published journals helps to identify the application potential of CMIP data. Statistical analysis shows that a total of 527 journals published 10,665 papers related to CMIP and its multi-modal archival applications, with a total of 386,202 citations. Metrics on the top 15 journals by publication volume are shown in Table 2. Among these highly ranked journals, the majority are from the United States and the United Kingdom. Approximately 70% of these journals focus on meteorology and atmospheric sciences, as well as environmental sciences, while others focus on geosciences and multidisciplinary fields. The Journal of Climate and Climate Dynamics, distinguish themselves with their substantial number of articles and citations. Additionally, Geoscientific Model Development stands out due to its high C/A ratio, indicating its high impact.
The CMIP multi-model archive has applications spanning over 100 scientific subject areas. Among the top 15 research categories by the number of publications in Figure 2, meteorology and atmospheric sciences (approximately two-thirds of the total publication volume) ranked first, followed by multidisciplinary geosciences and environment sciences, which was consistent with the fields of published journals. Furthermore, multiple scientific disciplines, including but not limited to agronomy, geochemistry, geophysics, and remote sensing, have also been found to be extensively involved in CMIP data applications. This means that CMIP data have the potential to support research in multiple fields. Given the possibility of some published articles belonging to multiple domains simultaneously, the number of articles in all fields may exceed the total number of publications.

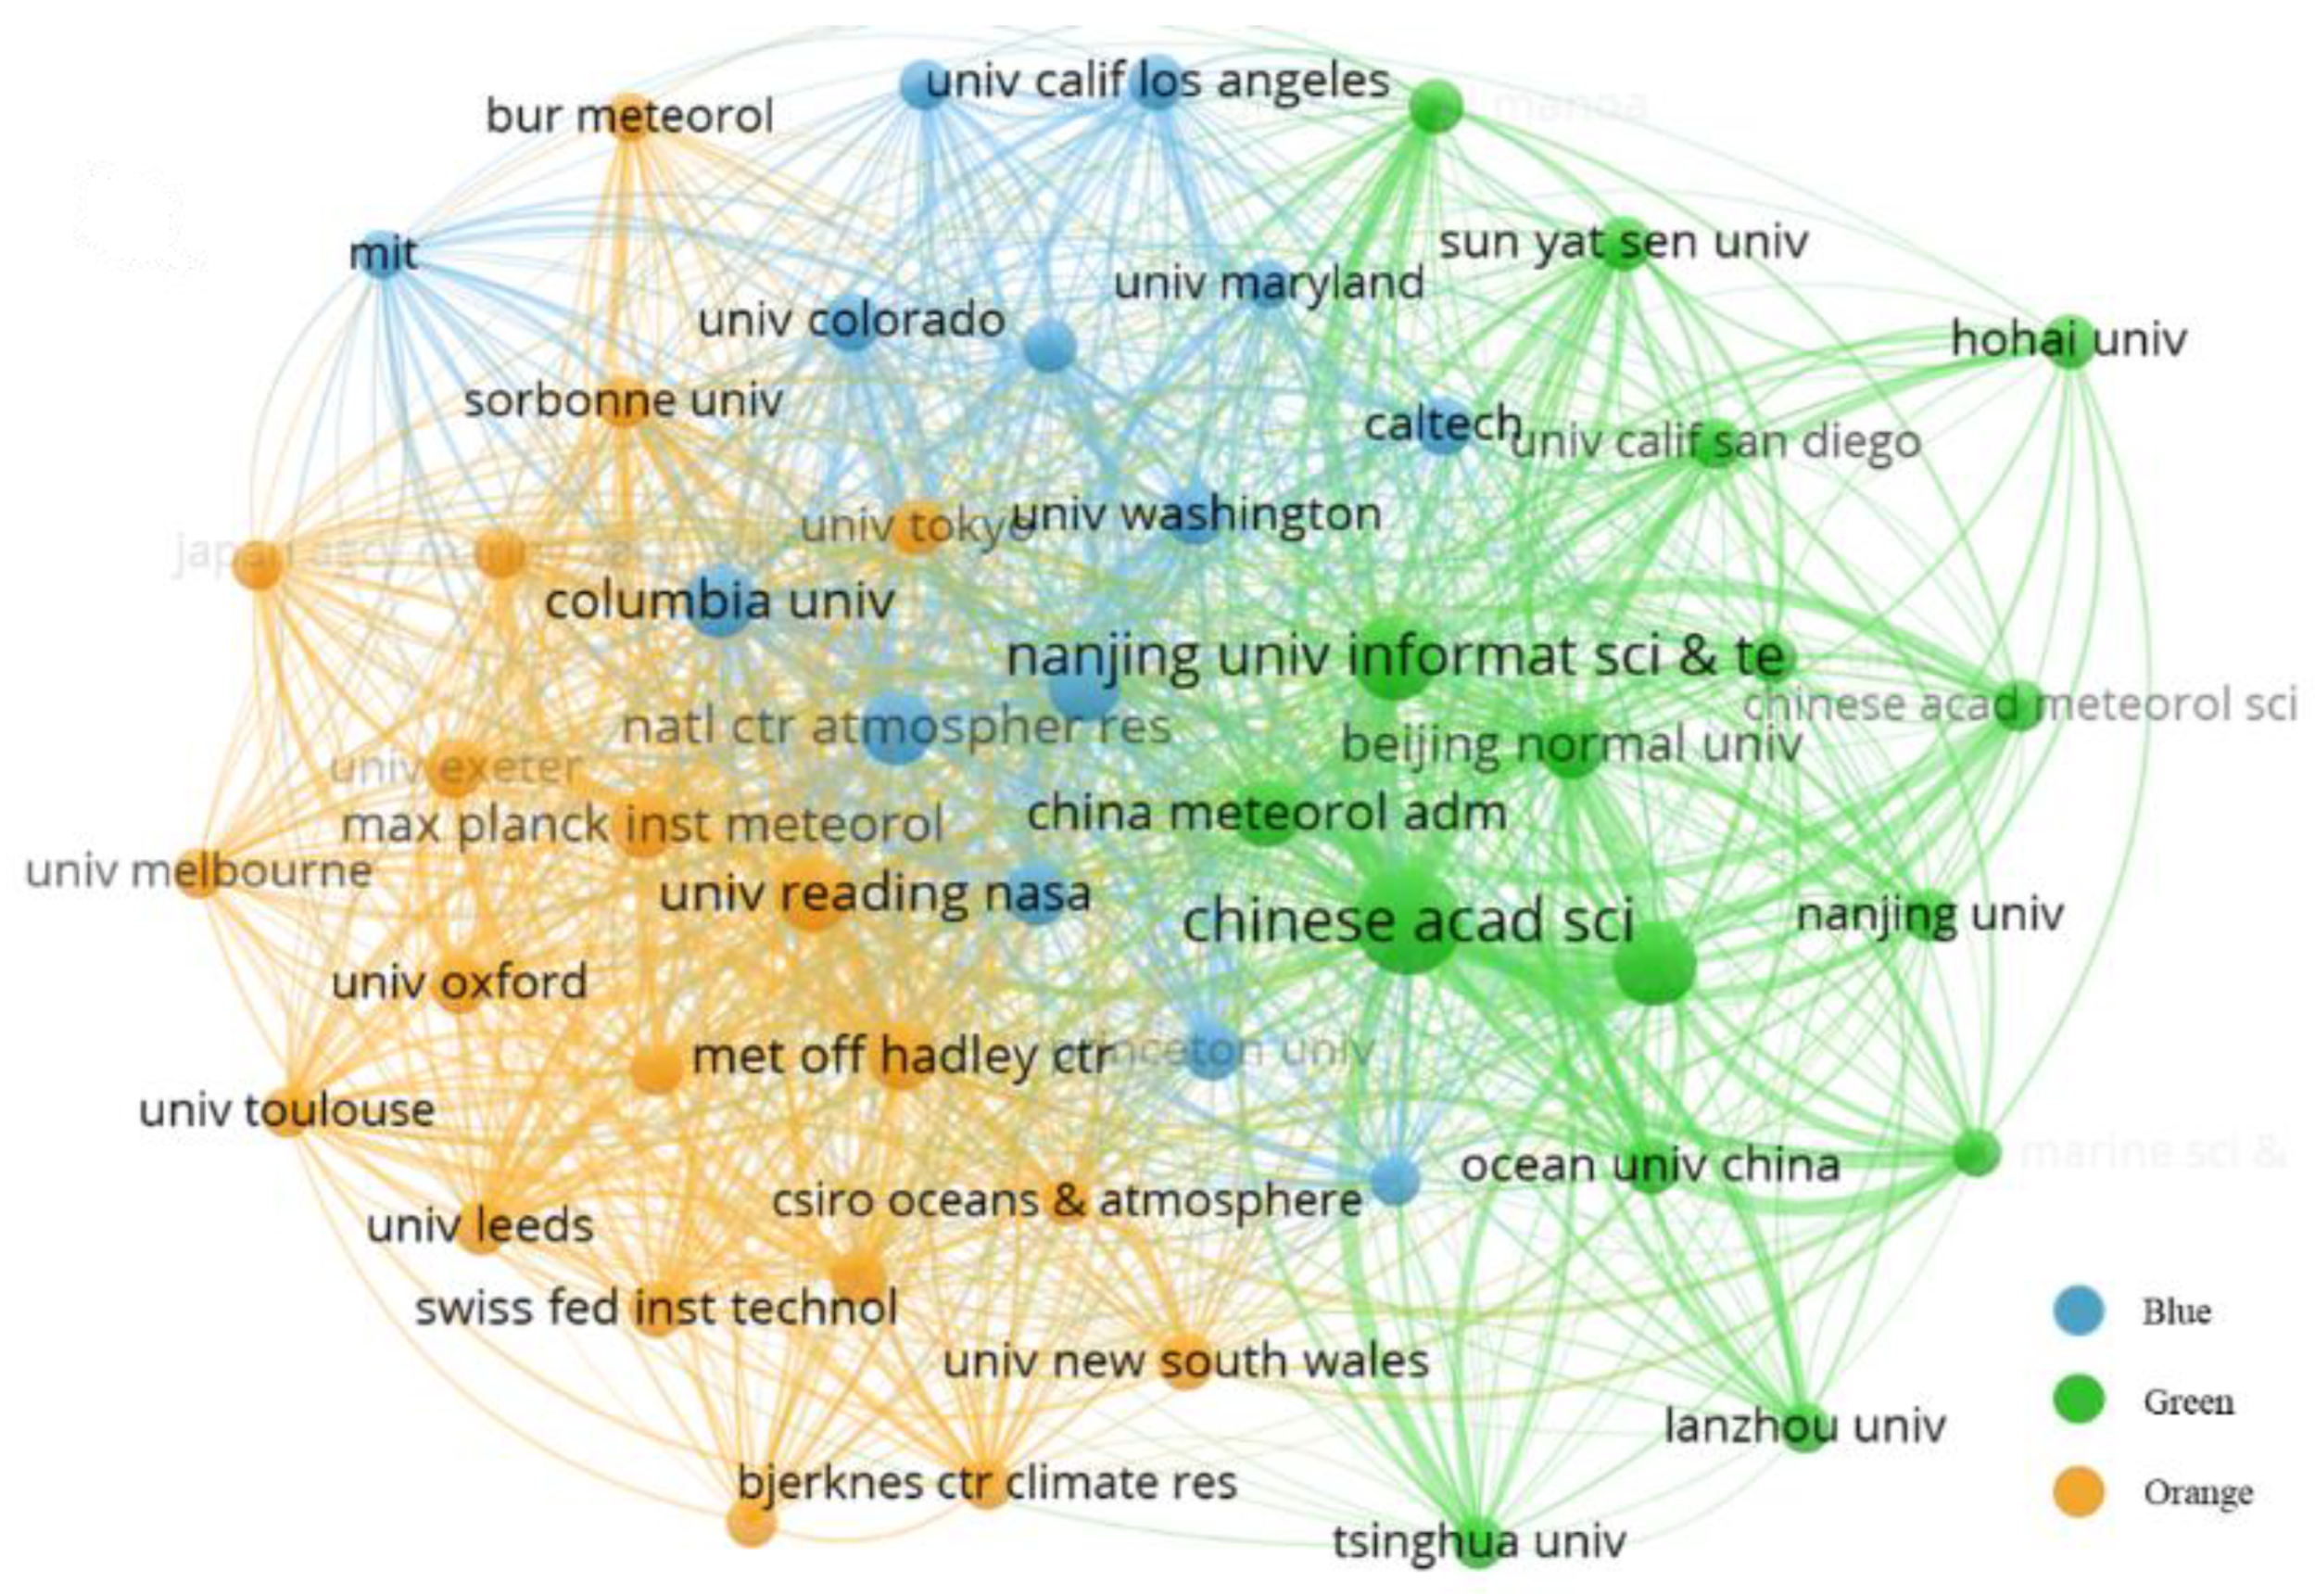
3.3. Contributions by Country and Institution

The global scientific community has extensively utilized CMIP-derived data for scientific research. Statistics showed that 10,655 papers were published by researchers from 142 countries or regions on six continents (Figure 3). At the intercontinental level, Europe had the most publications with 34.96% of all publications, followed by Asia with 30.80%, and North America, Oceania, Africa, and South America with 23.68%, 5.42%, 2.90%, and 2.23%, respectively. At the country level, the United States had the most scientific publications (3650), followed by China (3048), the United Kingdom (1057), Germany (997), and Australia (884).
The cooperation networks of organizations in Figure 4 illustrate that organizations rely on CMIP results to understand climate change and to meet the sustainable development goals (SDGs), but they also value mutual communications and close international cooperations. Each of the 50 organizations (Table A1), out of a total of 5029, published more than 100 papers. The top five organizations with largest links were the Chinese Academy of Sciences, the University of the Chinese Academy of Sciences (closely related to the Chinese Academy of Sciences), the National Center for Atmospheric Research, the Nanjing University of Information Science and Technology, and the National Oceanic and Atmospheric Administration. In the blue cluster, there was close cooperation among the Reading University Met Office Hadley Centre and the University of Oxford in the UK, the Max Planck Institute for Meteorology in Germany, and the University of Tokyo in Japan. In the green cluster, there was extensive collaboration with several of the US institutions such as Columbia University, the Lawrence Livermore National Laboratory, the National Center for Atmospheric Research, etc. In the orange cluster, there was close cooperation between the Chinese Academy of Sciences, Nanjing University, and Sun Yat-Sen University.

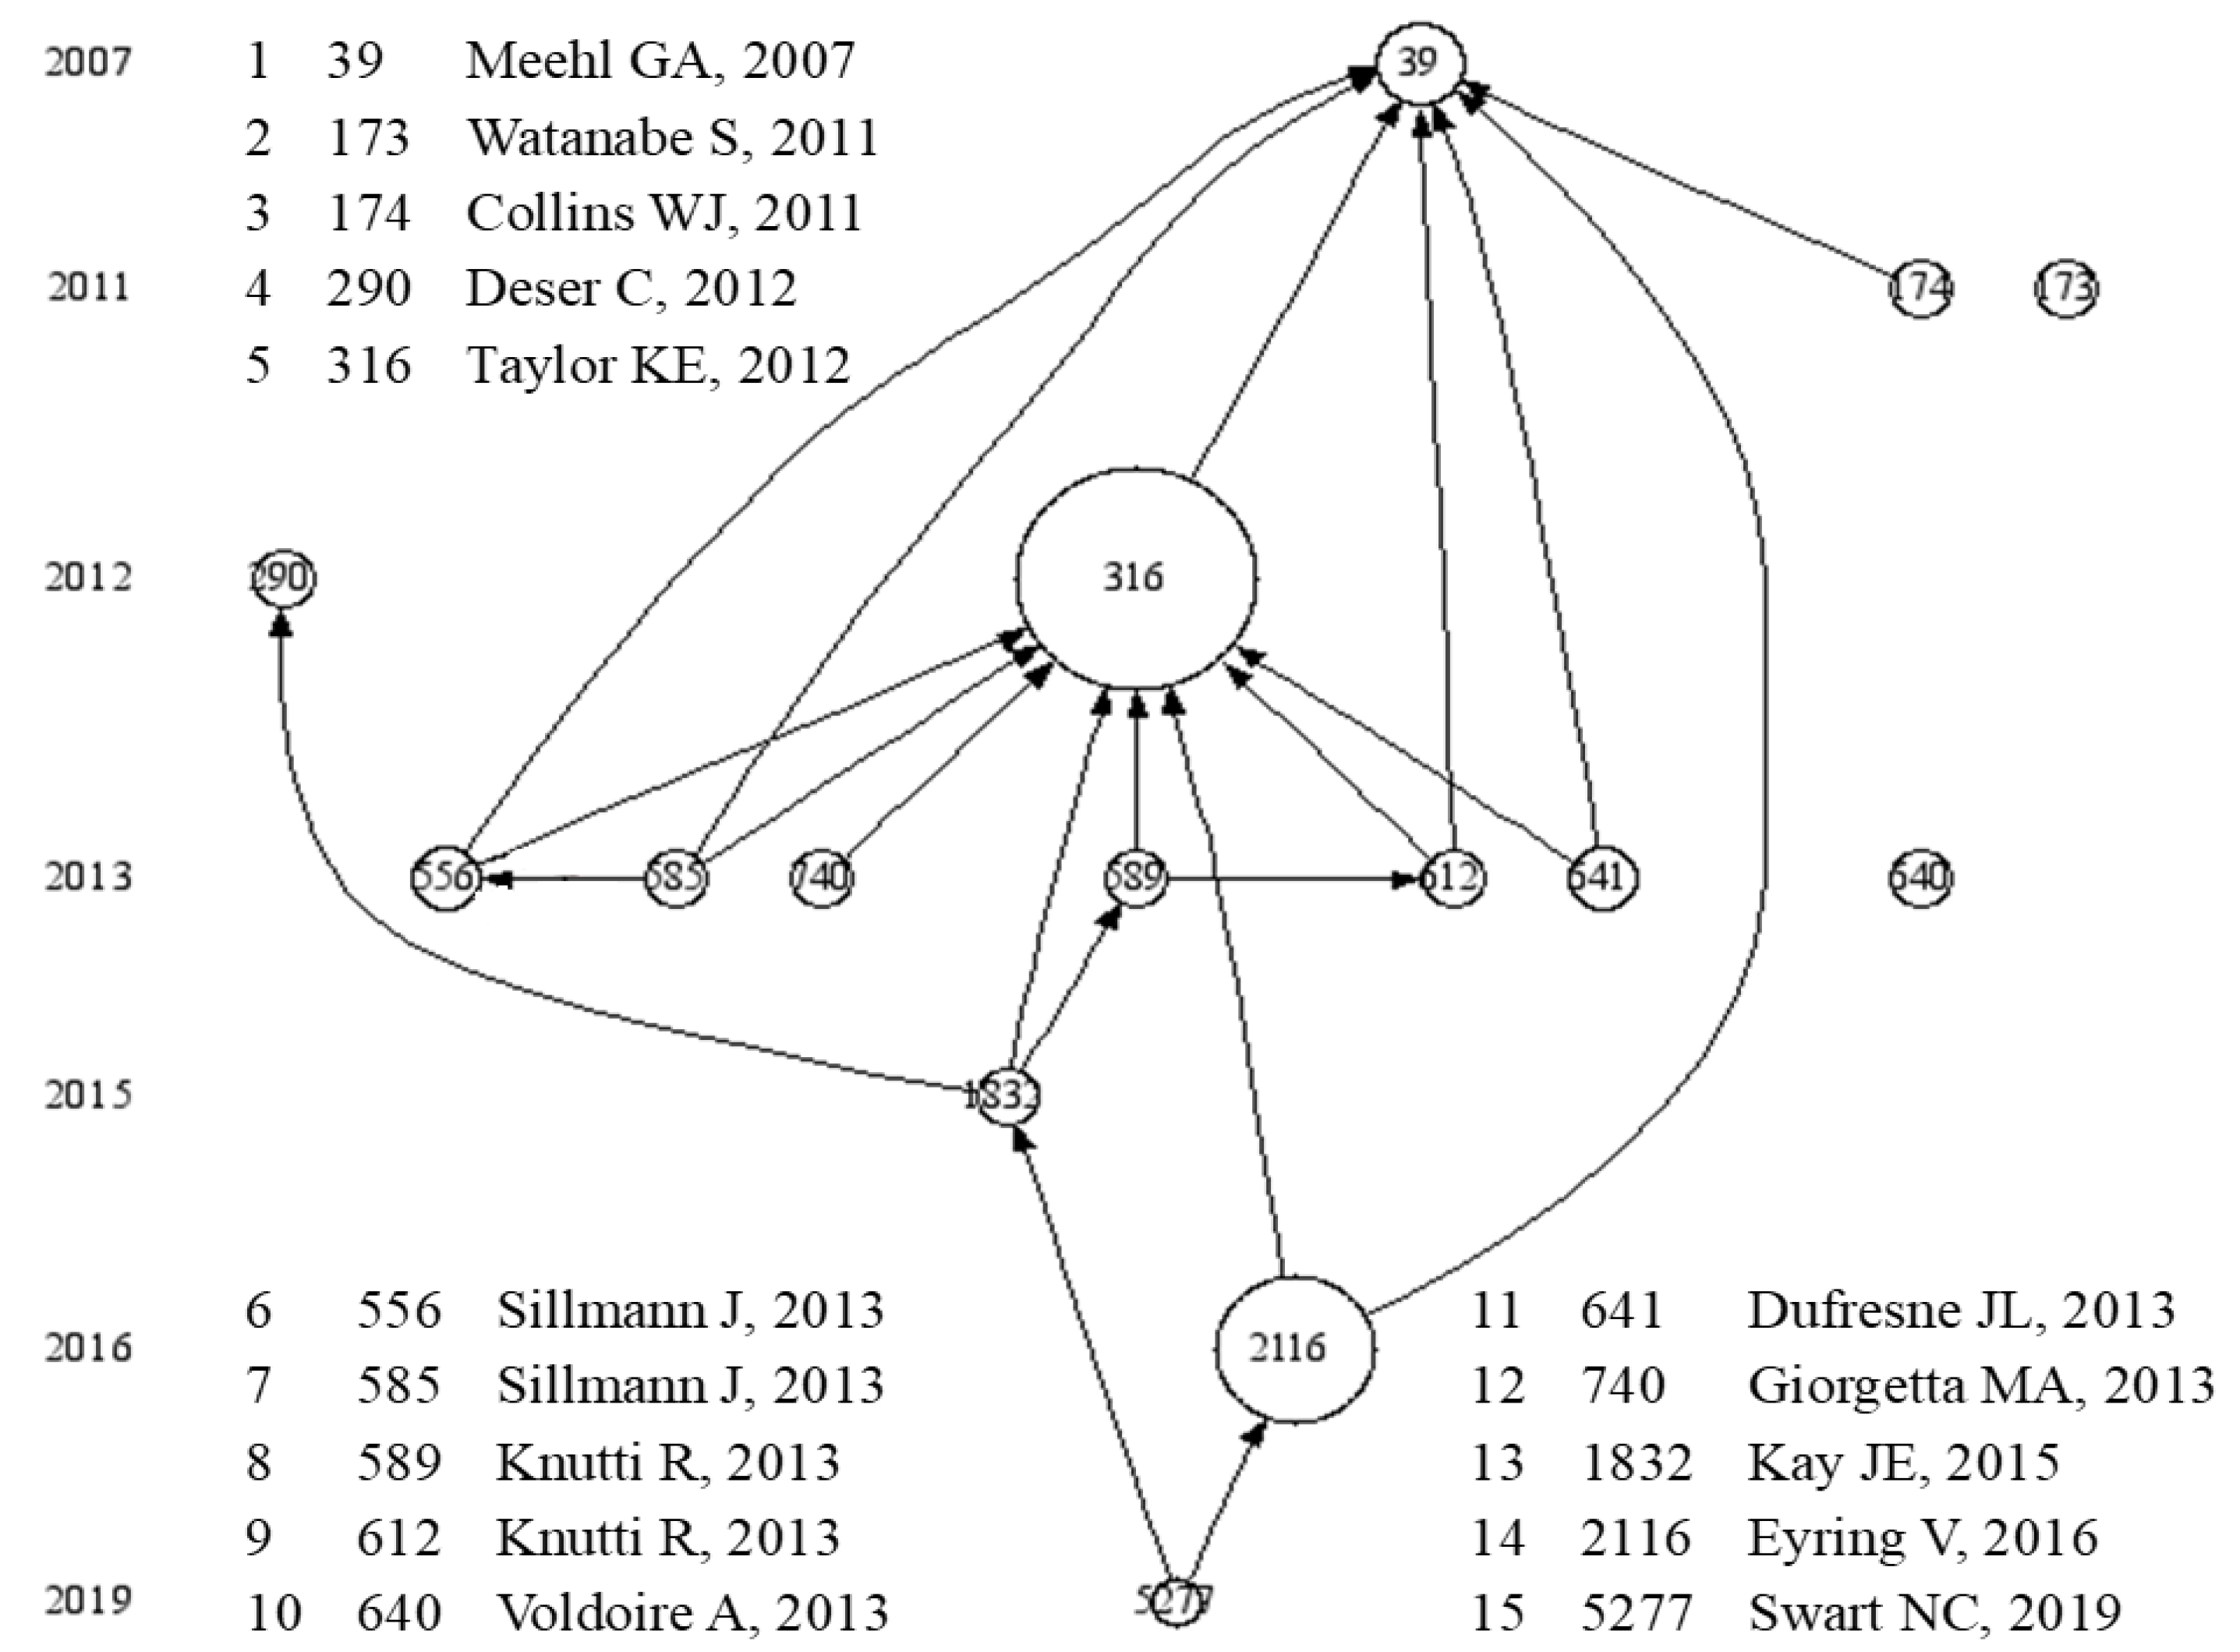
3.4. The Representative Literature

The analysis of the highly cited literature provides a focal point for CMIP-related research. The relationship between the top 15 highly cited scientific papers extracted from the WoSCC is shown in Figure 5. In terms of citation relations, articles describing the design of CMIP experiments and the data at different stages of the process were sources for other articles. In terms of research content, the foci of these highly-cited scientific and technical papers published between 2007 and 2019 were mainly in four areas. Firstly, a systematic summary of the CMIP, experimental design, or multi-model dataset of the different phases of CMIP [62]. For example, CMIP5 experimental design [11] and CMIP6 experimental design and organization [12]. Then, the introduction and description of the Earth system model such as the Community Earth System Model [63], the Canadian Earth System Model version 5 (CanESM5.0.3) [64], the CNRM-CM5.1 global climate model [65], MIROC-ESM 2010 [66], and Earth–System model–HadGEM2 [52]. Thirdly, the use of model outputs for global or regional climate change. For instance, the use of the IPSL-CM5 Earth System Model to project climate change [67], MIP-ESM usage to simulate climate and carbon cycle changes from 1850 to 2100 [68], as well as the application of 31 CMIP5 models and 18 CMIP3 models to evaluate climate extremes indices [69]. Finally, uncertainty in climate change projections, including the role of internal variability [70] and the uncertainty in climate models [62].

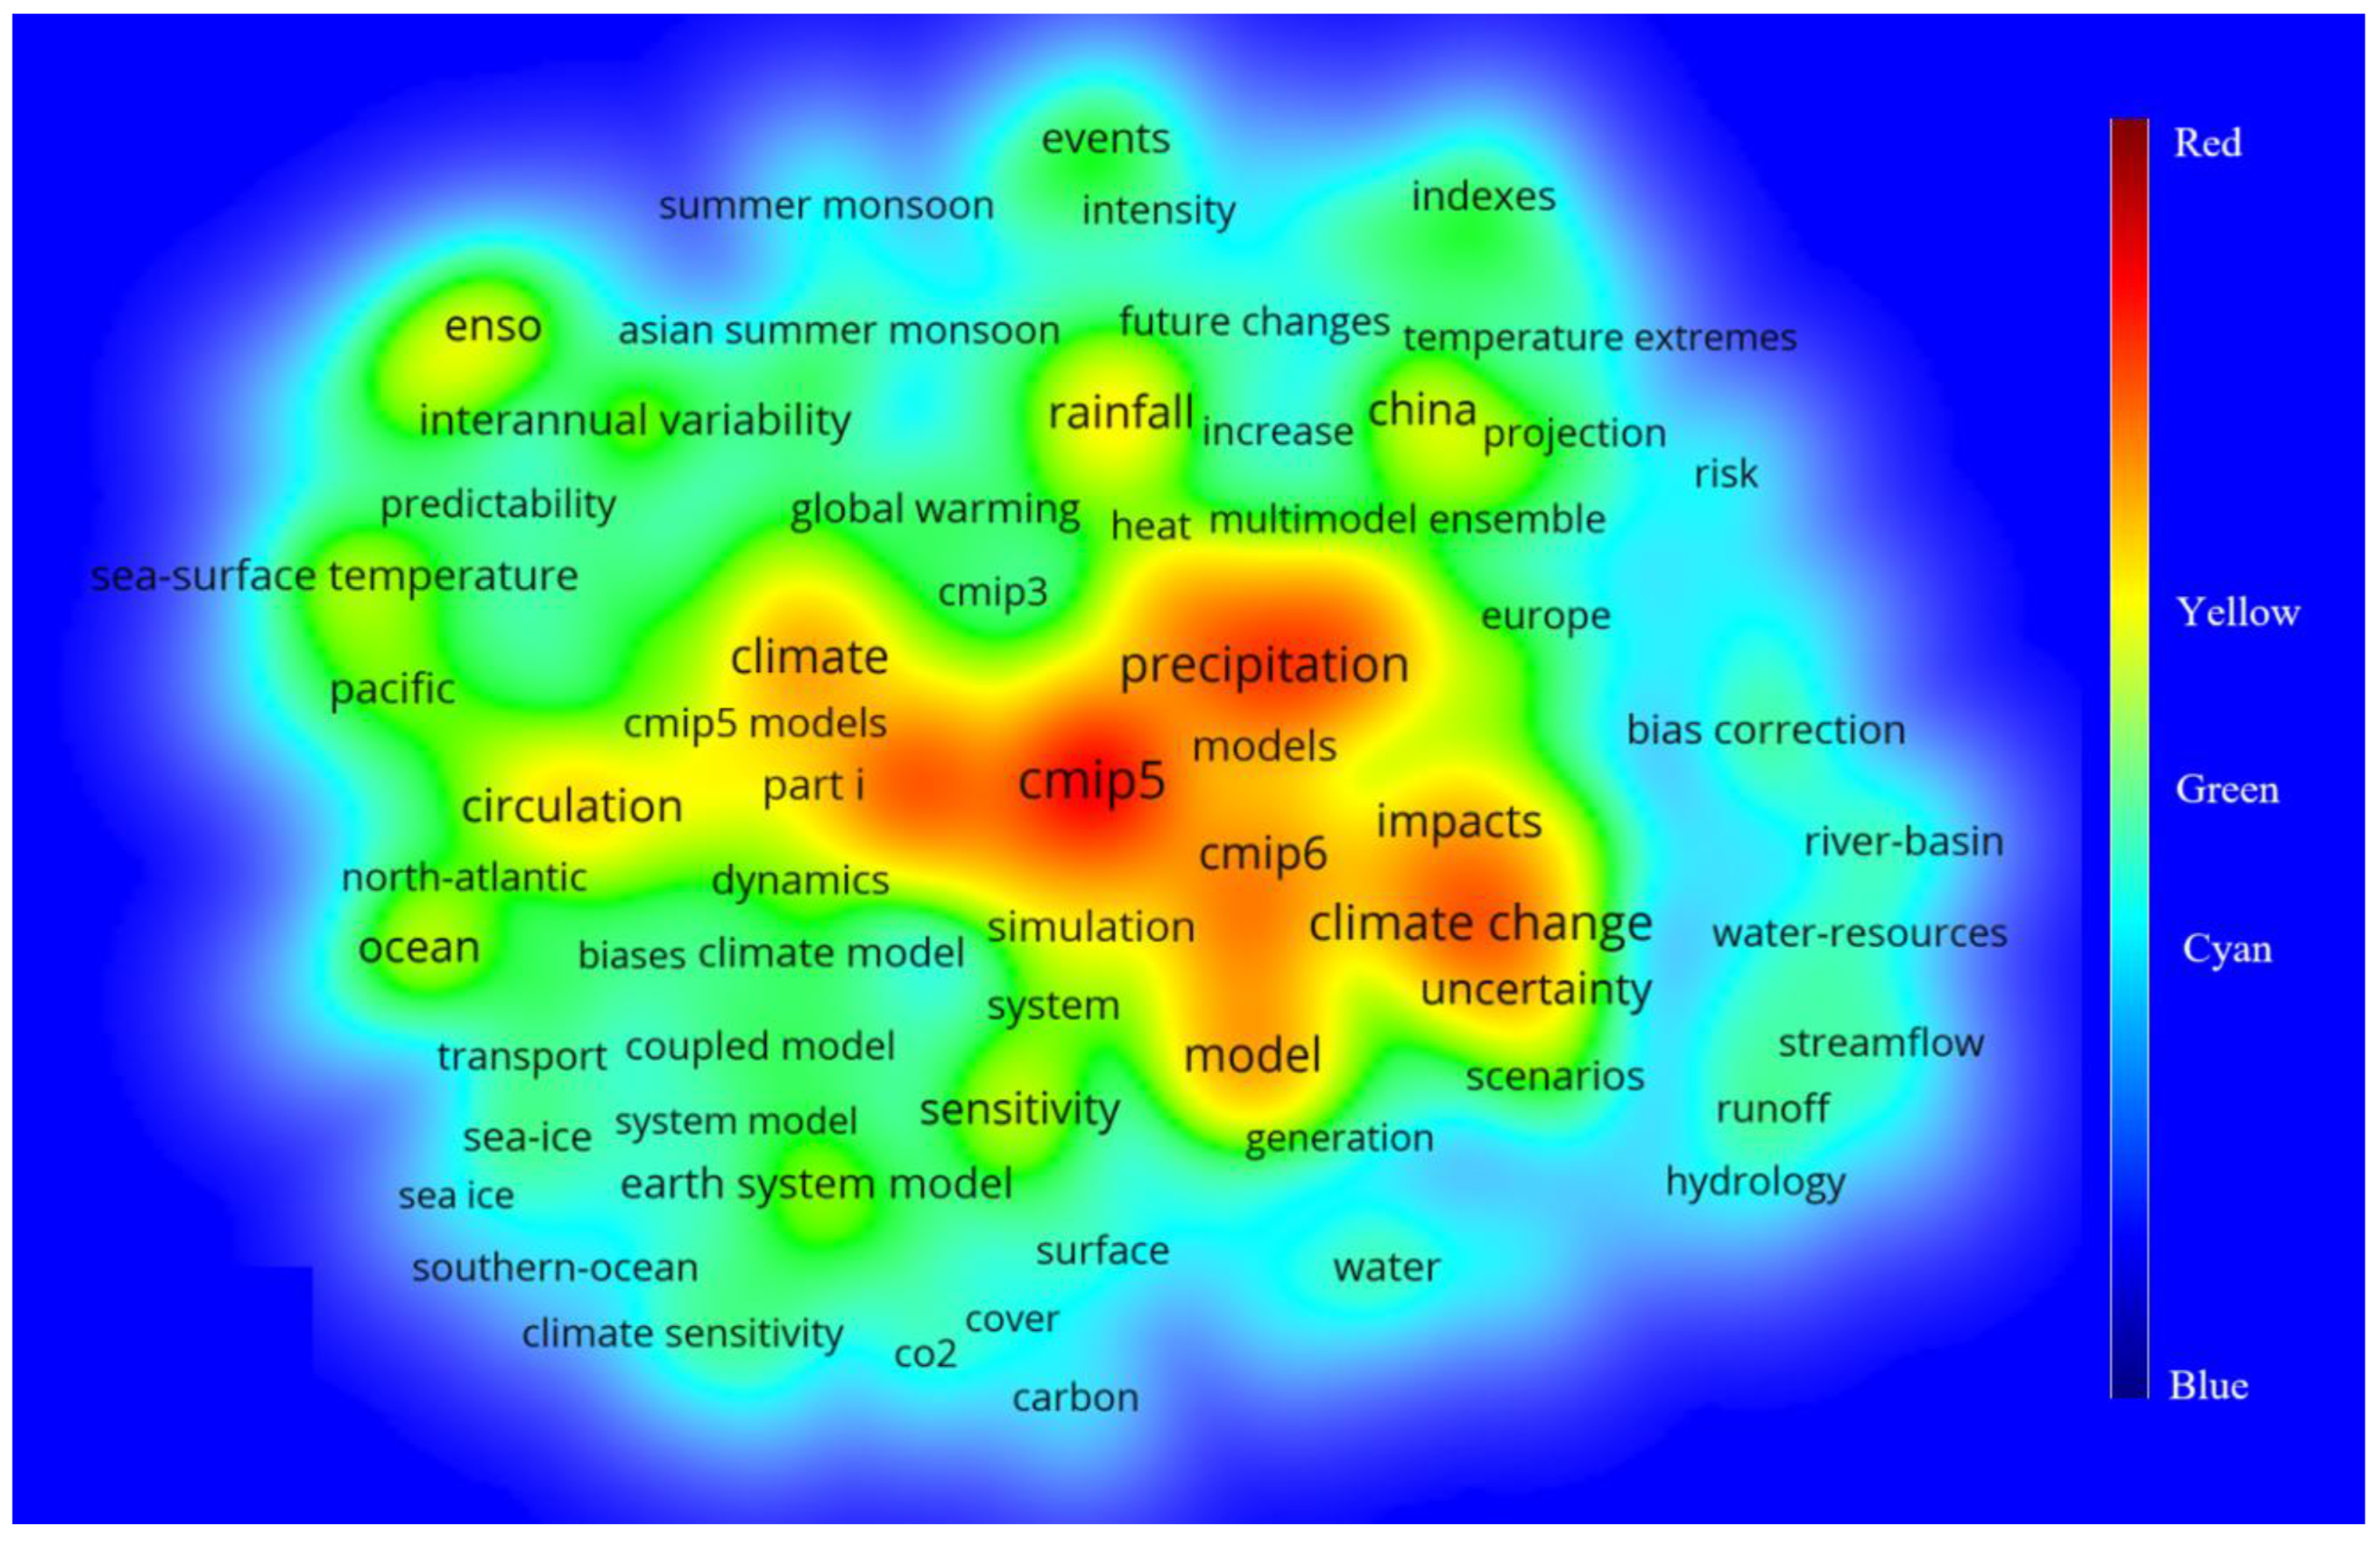
3.5. Author Keywords Co-Occurrence Analysis

The keywords co-occurring at high frequency often represented the research directions or questions with high attention. From 2000 to 2023, 10,665 scientific papers contributed 18,029 keywords from titles, abstracts, and keyword lists. In Figure 6, there were 145 keywords with more than 100 co-occurrences that are divided into four colored groups. The red-yellow category includes keywords with more than 1000 occurrences and a total link strength of over 5000, indicating a scientific focus on using climate factors (e.g., precipitation and temperature) from models or data from CMIP5 and CMIP6 to investigate climate variability. The yellow-green category consists of keywords with 500–1000 occurrences and a total link strength of over 2000, representing the existing research directions such as the change and impact of El Niño or ENSO, ocean circulation, and the performance, uncertainty, and sensitivity of models and simulations in China or other regions, etc. The green-cyan category encompasses keywords with 200–500 occurrences and a total link strength exceeding 1000, indicating research directions such as variability of extreme events (droughts, rainfall, temperature), the responses of sea ice, sea surface temperature, the hydrological cycle for climate warming, bias correction of coupled model outputs, climate change attribution, future scenario projections for climate factors, etc. The cyan-blue category includes keywords with 100–200 occurrences, representing research directions such as model parameterization modification, teleconnections and feedbacks of different factors, statistical downscaling of model data, changes in carbon and water, etc.

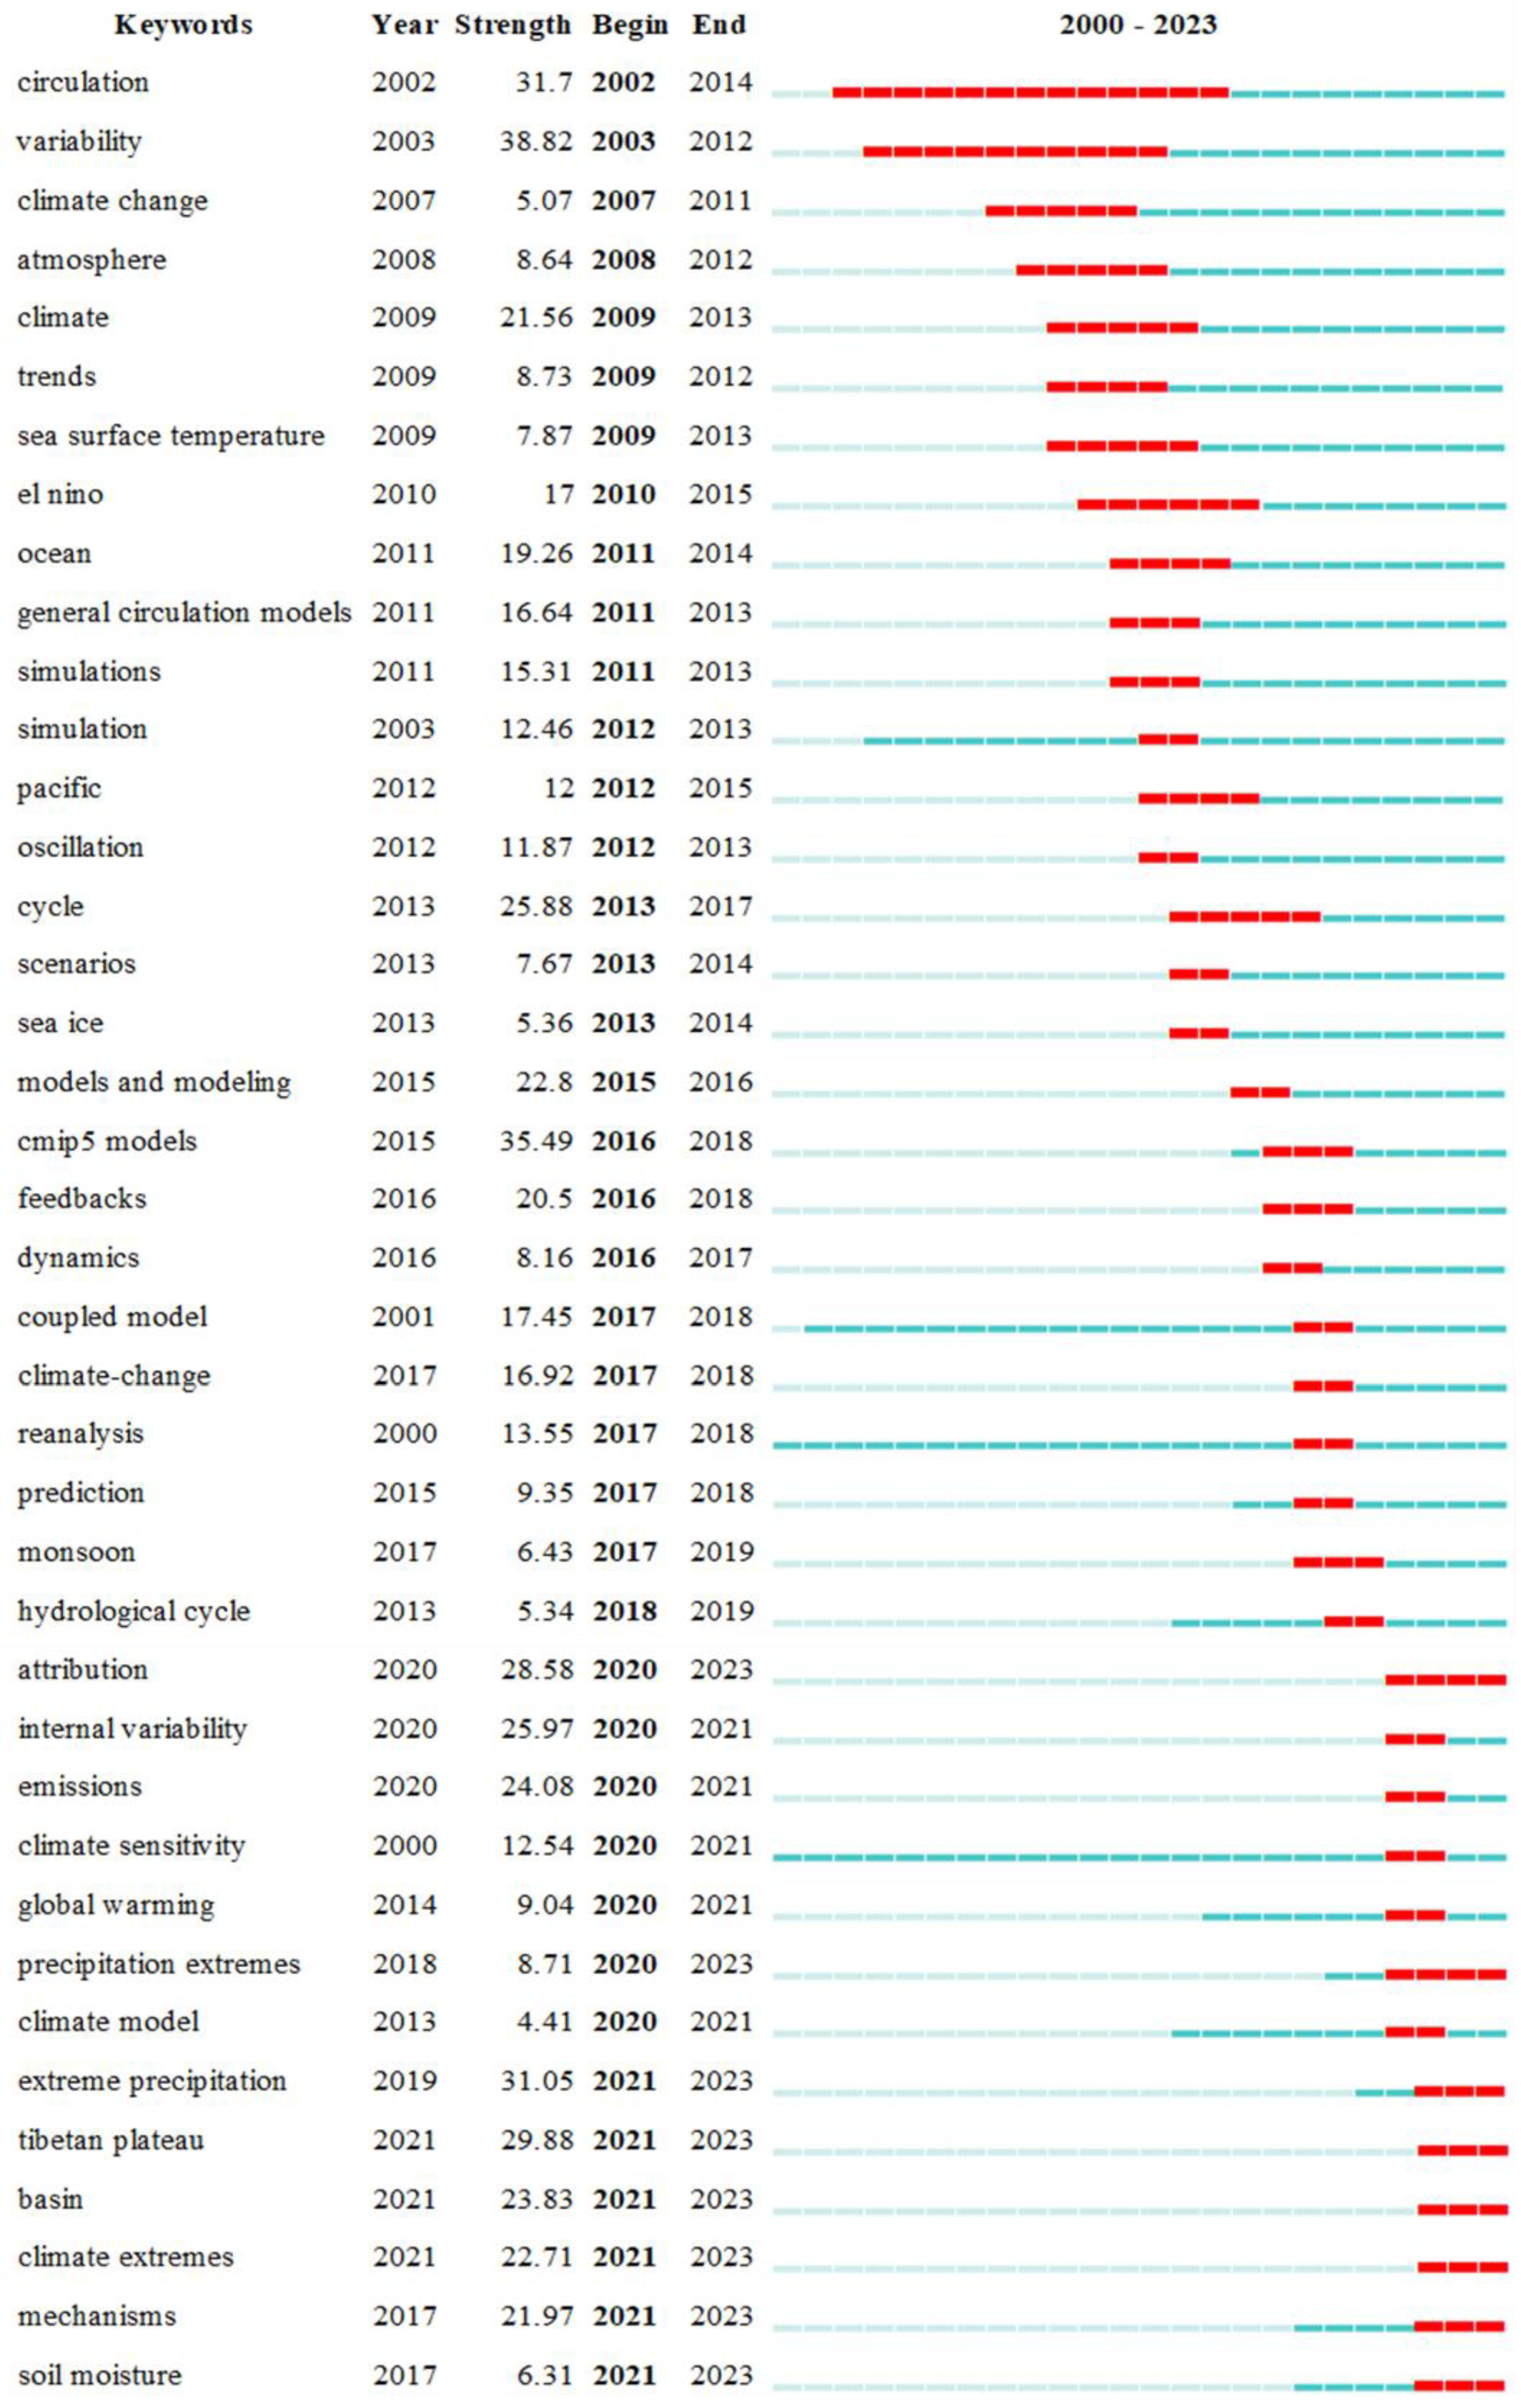
3.6. Analysis of Keyword Mutations

To further investigate changes in research foci over time, CiteSpace was used to calculate the keyword with the strongest citation bursts over time and filter the top 40 keywords and CMIP research hotspots that have changed over time (Figure 7). Some of the keywords were present throughout the research phase of CMIP, but were not maintained as research hotspots. For instance, the keywords with the highest intensity of early breaks were “variability” (strength of 38.82, 2003) and “circulation” (strength of 38.82, 2002) with more than ten years duration, which indicates researchers in that time were more interested in the annual and decadal variability of atmospheric or oceanic circulation and climate (e.g., air temperature, precipitation). In addition, there was some emergence of shorter duration research hotspots, such as “sea surface temperature” (strength of 17, 2009), “general circulation models” (strength of 16.64, 2011), “pacific” (strength of 12, 2012), “oscillation” (strength of 11.87, 2012), and simulations (strength of 15.31, 2011). With the development of computer technology and modeling, scientists were no longer limited to discussing the quantitative relationship between climate change and climate variability, such as the rate of change and trend. They paid more attention to the mutual feedback process between the links in the process of climate change and its interaction with environmental factors, which was represented by keywords such as “feedback” (strength of 20.5, 2016), “attribution” (strength of 28.58, 2020), “Internal variability” (strength of 25.97, 2020) of the climate system, “coupled-model” (strength of 17.45, 2017), “climate sensitivity” (strength of 12.54, 2020), and “climate extremes” (strength of 22.71, 2021) in terms of heatwaves, extreme precipitation, and drought, which were highlighted under global climate change after 2015, particularly in the latest three years.

3.7. The Models of CMIP

The CMIP reveals an increase in the number of models and participating countries. From CMIP3 to CMIP6, there was a gradual increase in model outputs, reaching 30 PB in phase 6. This is attributable to the higher resolution of simulations, the inclusion of more complex processes and scenarios, and the increased complexity of the models. Table S1 represents all models, modelling centers, and countries from CMIP3 to CMIP6. The USA, China, the UK, and Germany led the way in the number of research papers in the field, demonstrating their leadership in advancing climate science. Moreover, an emerging trend of collaboration between multiple institutions for the development of a unified model is evident. Examples of such models include the series models EC-Earth3, MIP-ESM-1-2-HAM, and UKESM1-0-LL, among others. This suggests climate change research and model development is a long-term and complex task that requires sustained financial investment, broad global attention, and extensive and in-depth exploration of scientific issues from CMIP3 to CMIP6. Furthermore, numerous scientific questions were focused on, as mentioned in Section 3.5 and Section 3.6.

4. Discussion

The period of 2000–2023 witnessed a dynamic and profound change in climate research, which was closely accompanied by the three CMIP phases, an important project for advancing the study of global climate change. Despite the increasing number of CMIP-related scientific outcomes being published, this does not necessarily imply the realization of breakthrough progress in some scientific questions. Rather, it may indicate that scientists identified the value of model simulations, and more research involving CMIP was conducted. It is worth noting that the low citation rate of papers during 2020–2023 is likely because newly published research takes time to accumulate citations, rather than reflecting a decline in the quality of the research itself. Furthermore, the ongoing increase in the number of published papers underscores the vitality and promise of research in this field. In the future, the combination of simulations, observations, assimilations, and machine learning/artificial intelligence may result in the emergence and accumulation of more high-quality scientific results, deepening our understanding of the climate system and providing more scientific and effective strategies to address climate change.
In this bibliometric analysis, CMIP data have been widely employed in meteorology and atmospheric sciences, multidisciplinary geosciences, environmental sciences, and agronomy, etc., which have benefited from the more detailed CMIP experimental designs, the more variable model outputs, and the progressive increase in the accuracy and resolution of the models. In the first two phases, CMIP involved running 18 GCMs in two different configurations: a “control run” under constant pre-industrial conditions, and a “perturbed run” where atmospheric carbon dioxide was increased by 1% per year over 80 years. Due to limitations in data processing and repository capabilities at that time, CMIP1 and CMIP2 contained only a few output fields and had a rather coarse temporal resolution. CMIP3 focused on atmosphere, land surface, ocean, and sea ice, gathered and distributed the result of coupled models in pre-industrial climate model scenarios with CO2 increasing at a rate of 1% per year, as well as simulations of 20th century under near-real climate forcing scenarios [37]. For CMIP5, the simulation experiments were divided into two categories according to the time scale, long-term prediction, and near-term prediction. This phase further developed Representative Concentration Pathways (RCPs)—a scenario set including greenhouse gas emissions and concentrations and land-use trajectories [73]—and additional simulations including the Earth System Model and carbon biochemical cycle processes. The experiment of CMIP6 included the DECK (Diagnostic, Evaluation, and Characterization of Klima) and CMIP historical simulations (1850–near present), and 21 CMIP-endorsed Model Intercomparison Projects (MIPs) to address a large range of specific questions and fill the scientific gaps of the previous CMIP phase [74].
In terms of sustainable agriculture, climate-smart agricultural practices have the potential to enhance agricultural resilience and mitigate climate change impacts [75]. The CMIP model archives consist of past, present, and future climate change information, providing critical information for understanding and predicting climate variability for climate-smart agriculture. Moreover, based on simulations and projections of the CMIP models, combined with observations, crop models, and census data, the risk evaluation of climate change (temperature rising, droughts, heatwaves, and extreme precipitation, etc.) for agriculture production, crop yields, biodiversity, and food security globally may be more convenient [21,76,77,78]. Furthermore, the CMIP model data coupled with local agricultural data and farmer knowledge are likely to facilitate the development and implementation of tailored climate adaptation and mitigation strategies for smallholder farmers and rural communities, thereby enhancing their capacity to cope with and benefit from climate change while preserving biodiversity and natural resources [79]. The CMIP archives therefore extend the data support and research frontier for agricultural science questions related to climate change.
Although the coupled model outputs have demonstrated their unique value in capturing the trends and variability of climate change in some global and regional studies [80,81,82], their simulations and projections remain uncertain due to natural variability, model uncertainty, and greenhouse gas emission scenario uncertainty [83]. Emergent constraints are a way of reducing uncertainties in climate projections [84] by finding links between the inter-model scatter of an observed predictor and climate projections. The ensemble forecasting [85] and multi-model mean [86] are also effective in enhancing the reliability of model projections. In addition, efforts are underway to improve the representation of key processes in models, including the optimization of parameterizations and modeling processes in models, and the integration of new observational data into model development. [87,88]. It is important to acknowledge that while these efforts can significantly reduce the uncertainties surrounding climate model simulations and projections, they remain a challenge due to the inherent complexity of the climate system.
Notably, the bibliometric analysis strongly depends on the chosen scientific papers. Currently, datasets offering scientific research publications include Google Scholar, Scopus, Web of Science, etc. Table 3 shows the comparison between datasets. In our research, only scientific papers from the Web of Science Core Collection of the Web of Science were chosen for the bibliometric analysis, considering the strict data quality control, frequent update, and various subjects covered. This choice may omit equally influential research from other sources, thereby limiting the comprehensiveness of our analysis [89]. But currently, there is no way to merge multiple sources to perform a more comprehensive analysis, due to the the differences in data formats and availability. Given the broad scope of CMIP-based research, we only focus on macroscopic scientific issues and overall progress in CMIP-related studies. Future research could benefit from more focused areas to deepen our understanding of specific issues.

5. Conclusions

This study offers valuable insights into the dynamic evolution of CMIP research and its trends. The main findings are as follows: CMIP and its data have the potential to support more scientific questions in a variety of research fields. The number of its annual publications has grown exponentially, from less than 10 per year between 2000 and 2007 to more than 1000 per year between 2020 and 2023. CMIP data have the capacity to serve several fields (meteorology and atmospheric sciences, multidisciplinary geosciences, environmental sciences, water resources, and remote sensing, etc.). Approximately 20% of research related to CMIP was published in two journals: the Journal of Climate and Climate Dynamics. The United States, China, and the United Kingdom ranked top three for CMIP publications. The institutions with a strong network of partner organizations (top five) were the Chinese Academy of Sciences, the University of the Chinese Academy of Sciences, the National Center for Atmospheric Research, the Nanjing University of Information Science and Technology, and the National Oceanic and Atmospheric Administration. Highly cited documents were the experimental design of the different phases of CMIP and the introduction of the climate model and the Earth system model as well as the multi-model dataset. In addition, CMIP-related research topics focused on climate change and change variability (e.g., temperature, precipitation, sea level, sea temperature, and salinity), climate behavior (e.g., El Niño, La Nina, warm pool, and monsoon), models, the carbon cycle, CO2, impacts, bias correction, climate sensitivity, and extreme events.

Supplementary Materials

The following supporting information can be downloaded at: https://www.mdpi.com/article/10.3390/agriculture15080826/s1.

Author Contributions

Formal analysis, Y.J.; Writing—original draft, Y.J.; Writing—review & editing, Y.J., N.A., W.D. and H.H.; Supervision, H.H. All authors have read and agreed to the published version of the manuscript.

Funding

No funding was received for this study.

Data Availability Statement

All data were retrieved from the Web of Science and the methods are described in Section 2.

Conflicts of Interest

The authors declare no conflicts of interest.

Appendix A. Article Filter Criteria

Step 1: Select database. All literature documents were downloaded from the Web of Science Core Collection (WoSCC), considering the record quality, data update, subject covered, and bibliometric objective.
Step 2: Design query. We aimed to investigate the progress and trends of the Coupled Model Intercomparison Project (CMIP) and its use of multi-model archives. Therefore, we set the topic in the query bar to retrieve the literature including “Couple Model Intercomparison Project”, “CMIP1”, “CMIP2”, “CMI3”, “CMIP5”, and “CMIP6”, and excluding those containing the terms “gene”, “coated”, or “material” in the title, abstract, or keywords. The specific query type was as follows: TS = (“Couple Model Intercomparison Project” OR (“CMIP1” OR “CMIP2” OR “CMIP3” OR “CMIP5” OR “CMIP6” NOT (gene OR coated or material))). The search was performed to collect the literature available in the WoSCC before 1 January 2024. Data were collected on 7 March 2024.
Step 3: Literature type filtering. We only chose the literature of the Article type, written in the English language to ensure consistency in data analysis, as English is the dominant language in the international scientific community for this field of study.
Step 4: Removal of retracted papers because they are not reliable documents for our study.
Step 5: Removal of duplicate papers to avoid double-counting and ensure the uniqueness of each record. Duplicates could occur due to various reasons, such as the same article being indexed multiple times in the database or being published in multiple versions. We used the Endnote X9 software to identify and manually determine whether the repetition is true.
Step 6: The final judgement of whether the research topic is relevant by reading the title and abstract of the literature records.
A total of 10655 English-language documents were finally obtained for further analysis.
Table A1. The 50 organizations in the cooperation networks of organizations.
IDAbbreviationFull Name
1beijing normal univBeijing Normal University
2bjerknes ctr climate resBjerknes Centre for Climate Research
3bur meteorolBureau of Meteorology
4caltechCalifornia Institute of Technology
5china meteorol admChina Meteorological Administration
6chinese acad meteorol sciChinese Academy of Meteorological Sciences
7chinese acad sciChinese Academy of Sciences
8columbia univColumbia University
9csiro oceans & atmosphereCommonwealth Scientific and Industrial Research Organisation Oceans & Atmosphere
10environm & climate change canadaEnvironment and Climate Change Canada
11hohai univHohai University
12japan agcy marine earth sci & technolJapan Agency for Marine—Earth Science and Technology
13lanzhou univLanzhou University
14lawrence livermore natl labLawrence Livermore National Laboratory
15max planck inst meteorolMax Planck Institute for Meteorology
16met offMet Office
17met off hadley ctrMet Office Hadley Centre
18mitMassachusetts Institute of Technology
19nanjing univNanjing University
20nanjing univ informat sci & technolNanjing University of Information Science and Technology
21nasaNational Aeronautics and Space Administration
22natl ctr atmospher resNational Center for Atmospheric Research
23noaaNational Oceanic and Atmospheric Administration
24ocean univ chinaOcean University of China
25pacific northwest natl labPacific Northwest National Laboratory
26princeton univPrinceton University
27qingdao natl lab marine sci & technolQingdao National Laboratory for Marine Science and Technology
28sorbonne univSorbonne Université
29stockholm univStockholm University
30sun yat sen univSun Yat-Sen University
31swiss fed inst technolSwiss Federal Institute of Technology
32texas a&m univTexas A&M University
33tsinghua univTsinghua University
34univ calif irvineUniversity of California, Irvine
35univ calif los angelesUniversity of California, Los Angeles
36univ calif san diegoUniversity of California, San Diego
37univ chinese acad sciUniversity of Chinese Academy of Sciences
38univ coloradoUniversity of Colorado
39univ exeterUniversity of Exeter
40univ hawaii manoaUniversity of Hawaii at Manoa
41univ leedsUniversity of Leeds
42univ marylandUniversity of Maryland
43univ melbourneUniversity of Melbourne
44univ new south walesUniversity of New South Wales
45univ oxfordUniversity of Oxford
46univ readingUniversity of Reading
47univ tokyoUniversity of Tokyo
48univ toulouseUniversity of Toulouse
49univ victoriaUniversity of Victoria
50univ washingtonUniversity of Washington

References

  1. Yohannes, H. A review on relationship between climate change and agriculture. J. Earth Sci. Clim. Chang. 2015, 7, 335. [Google Scholar]
  2. Kabato, W.; Getnet, G.T.; Sinore, T.; Nemeth, A.; Molnár, Z. Towards climate-smart agriculture: Strategies for sustainable agricultural production, food security, and greenhouse gas reduction. Agronomy 2025, 15, 565. [Google Scholar] [CrossRef]
  3. Beck, S.; Mahony, M. The IPCC and the new map of science and politics. Wires Clim. Chang. 2018, 9, e547. [Google Scholar] [CrossRef]
  4. Trenberth, K.E.; Asrar, G.R. Challenges and opportunities in water cycle research: WCRP contributions. Surv. Geophys. 2012, 35, 515–532. [Google Scholar] [CrossRef]
  5. Jappe, A. International collaboration in global environmental research: A comparison of the International Geosphere Biosphere Program and the International Hydrological Program. Sci. Public Policy 2009, 36, 183–197. [Google Scholar] [CrossRef]
  6. Houghton, J.; Townshend, J.; Dawson, K.; Mason, P.; Zillman, J.; Simmons, A. The GCOS at 20 years: The origin, achievement and future development of the Global Climate Observing System. Weather 2012, 67, 227–235. [Google Scholar] [CrossRef]
  7. Kuyper, J.; Schroeder, H.; Linnér, B.-O. The evolution of the UNFCCC. Annu. Rev. Environ. Resour. 2018, 43, 343–368. [Google Scholar] [CrossRef]
  8. Zhou, T.; Zou, L.; Wu, B.; Jin, C.; Song, F.; Chen, X.; Zhang, L. Development of earth/climate system models in China: A review from the Coupled Model Intercomparison Project perspective. J. Meteorol. Res. 2014, 28, 762–779. [Google Scholar] [CrossRef]
  9. Meehl, G.A.; Boer, G.J.; Covey, C.; Latif, M.; Stouffer, R.J. The Coupled Model Intercomparison Project (CMIP). Bull. Am. Meteorol. Soc. 2000, 81, 313–318. [Google Scholar] [CrossRef]
  10. Durack, P.J.; Taylor, K.E.; Gleckler, P.J.; Meehl, G.A.; Lawrence, B.N.; Covey, C.; Stouffer, R.J.; Levavasseur, G.; Ben-Nasser, A.; Denvil, S.; et al. The Coupled Model Intercomparison Project (CMIP): Reviewing project history, evolution, infrastructure and implementation. EGUsphere, 2025; preprint. [Google Scholar] [CrossRef]
  11. Taylor, K.E.; Stouffer, R.J.; Meehl, G.A. An overview of CMIP5 and the experiment design. Bull. Am. Meteorol. Soc. 2012, 93, 485–498. [Google Scholar] [CrossRef]
  12. Eyring, V.; Bony, S.; Meehl, G.A.; Senior, C.A.; Stevens, B.; Stouffer, R.J.; Taylor, K.E. Overview of the Coupled Model Intercomparison Project Phase 6 (CMIP6) experimental design and organization. Geosci. Model Dev. 2016, 9, 1937–1958. [Google Scholar] [CrossRef]
  13. Touzé-Peiffer, L.; Barberousse, A.; Le Treut, H. The Coupled Model Intercomparison Project: History, uses, and structural effects on climate research. WIREs Clim. Chang. 2020, 11, e648. [Google Scholar] [CrossRef]
  14. Fan, X.; Miao, C.; Gou, J.; Wu, Y.; Zhang, Q. Coupled Model Intercomparison Project and its research progress in simulation performance. Prog. Geogr. 2023, 42, 1204–1215. [Google Scholar] [CrossRef]
  15. Richter, I.; Tokinaga, H. An overview of the performance of CMIP6 models in the tropical Atlantic: Mean state, variability, and remote impacts. Clim. Dyn. 2020, 55, 2579–2601. [Google Scholar] [CrossRef]
  16. Priestley, M.D.K.; Ackerley, D.; Catto, J.L.; Hodges, K.I.; McDonald, R.E.; Lee, R.W. An overview of the extratropical storm tracks in CMIP6 historical simulations. J. Clim. 2020, 33, 6315–6343. [Google Scholar] [CrossRef]
  17. Stroeve, J.C.; Kattsov, V.; Barrett, A.; Serreze, M.; Pavlova, T.; Holland, M.; Meier, W.N. Trends in Arctic sea ice extent from CMIP5, CMIP3 and observations. Geophys. Res. Lett. 2012, 39, L16502. [Google Scholar] [CrossRef]
  18. Bellenger, H.; Guilyardi, E.; Leloup, J.; Lengaigne, M.; Vialard, J. ENSO representation in climate models: From CMIP3 to CMIP5. Clim. Dyn. 2013, 42, 1999–2018. [Google Scholar] [CrossRef]
  19. Li, J.L.F.; Xu, K.M.; Jiang, J.H.; Lee, W.L.; Wang, L.C.; Yu, J.Y.; Stephens, G.; Fetzer, E.; Wang, Y.H. An overview of CMIP5 and CMIP6 simulated cloud ice, radiation fields, surface wind stress, sea surface temperatures, and precipitation over tropical and subtropical oceans. J. Geophys. Res. Atmos. 2020, 125, e2020JD032848. [Google Scholar] [CrossRef]
  20. Jiang, J.H.; Su, H.; Wu, L.; Zhai, C.; Schiro, K.A. Improvements in cloud and water vapor simulations over the tropical oceans in CMIP6 compared to CMIP5. Earth Space Sci. 2021, 8, e2020EA001520. [Google Scholar] [CrossRef]
  21. Jägermeyr, J.; Müller, C.; Ruane, A.C.; Elliott, J.; Balkovic, J.; Castillo, O.; Faye, B.; Foster, I.; Folberth, C.; Franke, J.A.; et al. Climate impacts on global agriculture emerge earlier in new generation of climate and crop models. Nat. Food 2021, 2, 873–885. [Google Scholar] [CrossRef] [PubMed]
  22. Tittensor, D.P.; Novaglio, C.; Harrison, C.S.; Heneghan, R.F.; Barrier, N.; Bianchi, D.; Bopp, L.; Bryndum-Buchholz, A.; Britten, G.L.; Büchner, M.; et al. Next-generation ensemble projections reveal higher climate risks for marine ecosystems. Nat. Clim. Chang. 2021, 11, 973–981. [Google Scholar] [CrossRef]
  23. Hajat, S.; Proestos, Y.; Araya-Lopez, J.-L.; Economou, T.; Lelieveld, J. Current and future trends in heat-related mortality in the MENA region: A health impact assessment with bias-adjusted statistically downscaled CMIP6 (SSP-based) data and Bayesian inference. Lancet Planet. Health 2023, 7, e282–e290. [Google Scholar] [CrossRef]
  24. Varela, R.; de Castro, M.; Dias, J.M.; Gómez-Gesteira, M. Coastal warming under climate change: Global, faster and heterogeneous. Sci. Total Environ. 2023, 886, 164029. [Google Scholar] [CrossRef]
  25. Ye, C.; Duc Dang, T.; Xu, X.; Stewart, C.J.; Arias, M.E.; Zhang, Y.; Zhang, Q. Coupled effects of future rainfall and land use on urban stormwater drainage system in Tampa, Florida (USA). Ecol. Indic. 2023, 153, 110402. [Google Scholar] [CrossRef]
  26. Zhu, N. A hybrid model to predict the hydrological drought in the Tarim River Basin based on CMIP6. Clim. Dyn. 2023, 61, 4185–4201. [Google Scholar] [CrossRef]
  27. Choudhri, A.F.; Siddiqui, A.; Khan, N.R.; Cohen, H.L. Understanding bibliometric parameters and analysis. RadioGraphics 2015, 35, 736–746. [Google Scholar] [CrossRef] [PubMed]
  28. Zhang, L.L.; Ling, J.; Lin, M.W. Carbon neutrality: A comprehensive bibliometric analysis. Environ. Sci. Pollut. R 2023, 30, 45498–45514. [Google Scholar] [CrossRef]
  29. Velastegui-Montoya, A.; Montalván-Burbano, N.; Carrión-Mero, P.; Rivera-Torres, H.; Sadeck, L.; Adami, M. Google Earth Engine: A global analysis and future trends. Remote Sens. 2023, 15, 3675. [Google Scholar] [CrossRef]
  30. Jia, L.; Wang, W.; Zvomuya, F.; He, H. Trends in soil science over the past three decades (1992–2022) based on the scientometric analysis of 39 soil science journals. Agriculture 2024, 14, 445. [Google Scholar] [CrossRef]
  31. Chen, Y.; Lin, M.; Zhuang, D. Wastewater treatment and emerging contaminants: Bibliometric analysis. Chemosphere 2022, 297, 133932. [Google Scholar] [CrossRef] [PubMed]
  32. Öztürk, O.; Kocaman, R.; Kanbach, D.K. How to design bibliometric research: An overview and a framework proposal. Rev. Manag. Sci. 2024, 18, 3333–3361. [Google Scholar] [CrossRef]
  33. Pan, X.; Yan, E.; Cui, M.; Hua, W. Examining the usage, citation, and diffusion patterns of bibliometric mapping software: A comparative study of three tools. J. Informetr. 2018, 12, 481–493. [Google Scholar] [CrossRef]
  34. van Eck, N.J.; Waltman, L. Citation-based clustering of publications using CitNetExplorer and VOSviewer. Scientometrics 2017, 111, 1053–1070. [Google Scholar] [CrossRef]
  35. Eck, N.J.v.; Waltman, L. VOSviewer Manual; University Leiden: Leiden, The Netherlands, 2023. [Google Scholar]
  36. Wu, Y.; Miao, C.; Fan, X.; Gou, J.; Zhang, Q.; Zheng, H. Quantifying the uncertainty sources of future climate projections and narrowing uncertainties with bias correction techniques. Earth’s Future 2022, 10, e2022EF002963. [Google Scholar] [CrossRef]
  37. Meehl, G.A.; Covey, C.; Delworth, T.; Latif, M.; McAvaney, B.; Mitchell, J.F.B.; Stouffer, R.J.; Taylor, K.E. The WCRP CMIP3 multimodel dataset: A new era in climate change research. Bull. Am. Meteorol. Soc. 2007, 88, 1383–1394. [Google Scholar] [CrossRef]
  38. Chen, D.; Achberger, C.; Räisänen, J.; Hellström, C. Using statistical downscaling to quantify the GCM-related uncertainty in regional climate change scenarios: A case study of Swedish precipitation. Adv. Atmos. Sci. 2006, 23, 54–60. [Google Scholar] [CrossRef]
  39. AchutaRao, K.; Sperber, K.R. ENSO simulation in coupled ocean-atmosphere models: Are the current models better? Clim. Dyn. 2006, 27, 1–15. [Google Scholar] [CrossRef]
  40. Furrer, R.; Sain, S.R.; Nychka, D.; Meehl, G.A. Multivariate Bayesian analysis of atmosphere–ocean general circulation models. Environ. Ecol. Stat. 2007, 14, 249–266. [Google Scholar] [CrossRef]
  41. Weber, S.L.; Vettoretti, G.; Sokolov, A.; Robitaille, D.Y.; Peltier, W.R.; Oka, A.; Nawrath, S.; Murakami, S.; Montoya, M.; Levermann, A.; et al. Investigating the causes of the response of the thermohaline circulation to past and future climate changes. J. Clim. 2006, 19, 1365–1387. [Google Scholar]
  42. Flato, G.M. Sea-ice and its response to CO2 forcing as simulated by global climate models. Clim. Dyn. 2004, 23, 229–241. [Google Scholar] [CrossRef]
  43. Raper, S.C.B.; Gregory, J.M.; Stouffer, R.J. The role of climate sensitivity and ocean heat uptake on AOGCM transient temperature response. J. Clim. 2002, 15, 124–130. [Google Scholar] [CrossRef]
  44. Gleckler, P.J.; Taylor, K.E.; Doutriaux, C. Performance metrics for climate models. J. Geophys. Res. Atmos. 2008, 113, D06104. [Google Scholar] [CrossRef]
  45. Mariotti, A.; Zeng, N.; Yoon, J.-H.; Artale, V.; Navarra, A.; Alpert, P.; Li, L.Z.X. Mediterranean water cycle changes: Transition to drier 21st century conditions in observations and CMIP3 simulations. Environ. Res. Lett. 2008, 3, 044001. [Google Scholar] [CrossRef]
  46. Bony, S.; Dufresne, J.-L. An assessment of the primary sources of spread of global warming estimates from coupled atmosphere–ocean models. J. Clim. 2008, 21, 5135–5144. [Google Scholar]
  47. Brown, R.D.; Mote, P.W. The response of northern hemisphere snow cover to a changing climate. J. Clim. 2009, 22, 2124–2145. [Google Scholar] [CrossRef]
  48. Lloyd, J.; Guilyardi, E.; Weller, H.; Slingo, J. The role of atmosphere feedbacks during ENSO in the CMIP3 models. Atmos. Sci. Lett. 2009, 10, 170–176. [Google Scholar] [CrossRef]
  49. Yeh, S.-W.; Kug, J.-S.; Dewitte, B.; Kwon, M.-H.; Kirtman, B.P.; Jin, F.-F. El Niño in a changing climate. Nature 2009, 461, 511–514. [Google Scholar] [CrossRef]
  50. Guenet, B.; Moyano, F.E.; Vuichard, N.; Kirk, G.J.D.; Bellamy, P.H.; Zaehle, S.; Ciais, P. Can we model observed soil carbon changes from a dense inventory? A case study over England and Wales using three versions of the ORCHIDEE ecosystem model (AR5, AR5-PRIM and O-CN). Geosci. Model Dev. 2013, 6, 2153–2163. [Google Scholar] [CrossRef]
  51. Meinshausen, M.; Raper, S.C.B.; Wigley, T.M.L. Emulating coupled atmosphere-ocean and carbon cycle models with a simpler model, MAGICC6—Part 1: Model description and calibration. Atmos. Chem. Phys. 2011, 11, 1417–1456. [Google Scholar] [CrossRef]
  52. Collins, W.J.; Bellouin, N.; Doutriaux-Boucher, M.; Gedney, N.; Halloran, P.; Hinton, T.; Hughes, J.; Jones, C.D.; Joshi, M.; Liddicoat, S.; et al. Development and evaluation of an Earth-System model—HadGEM2. Geosci. Model Dev. 2011, 4, 1051–1075. [Google Scholar] [CrossRef]
  53. Marzeion, B.; Jarosch, A.H.; Hofer, M. Past and future sea-level change from the surface mass balance of glaciers. Cryosphere 2012, 6, 1295–1322. [Google Scholar] [CrossRef]
  54. Valdes, P.J.; Davies-Barnard, T.; Singarayer, J.S.; Jones, C.D. Climatic impacts of land-use change due to crop yield increases and a universal carbon tax from a scenario model. J. Clim. 2014, 27, 1413–1424. [Google Scholar]
  55. Kay, J.E.; Deser, C.; Phillips, A.; Mai, A.; Hannay, C.; Strand, G.; Arblaster, J.M.; Bates, S.C.; Danabasoglu, G.; Edwards, J.; et al. The Community Earth System Model (CESM) large ensemble project: A community resource for studying climate change in the presence of internal climate variability. Bull. Am. Meteorol. Soc. 2015, 96, 1333–1349. [Google Scholar] [CrossRef]
  56. Huang, J.; Yu, H.; Guan, X.; Wang, G.; Guo, R. Accelerated dryland expansion under climate change. Nat. Clim. Chang. 2015, 6, 166–171. [Google Scholar] [CrossRef]
  57. Riahi, K.; van Vuuren, D.P.; Kriegler, E.; Edmonds, J.; O’Neill, B.C.; Fujimori, S.; Bauer, N.; Calvin, K.; Dellink, R.; Fricko, O.; et al. The Shared Socioeconomic Pathways and their energy, land use, and greenhouse gas emissions implications: An overview. Glob. Environ. Chang. 2017, 42, 153–168. [Google Scholar] [CrossRef]
  58. Cook, B.I.; Mankin, J.S.; Marvel, K.; Williams, A.P.; Smerdon, J.E.; Anchukaitis, K.J. Twenty-first century drought projections in the CMIP6 forcing scenarios. Earth’s Future 2020, 8, e2019EF001461. [Google Scholar] [CrossRef]
  59. Donat, M.G.; Lowry, A.L.; Alexander, L.V.; O’Gorman, P.A.; Maher, N. More extreme precipitation in the world’s dry and wet regions. Nat. Clim. Chang. 2016, 6, 508–513. [Google Scholar] [CrossRef]
  60. Diffenbaugh, N.S.; Singh, D.; Mankin, J.S.; Horton, D.E.; Swain, D.L.; Touma, D.; Charland, A.; Liu, Y.; Haugen, M.; Tsiang, M.; et al. Quantifying the influence of global warming on unprecedented extreme climate events. Proc. Natl. Acad. Sci. USA 2017, 114, 4881–4886. [Google Scholar] [CrossRef]
  61. Cai, W.; Wang, G.; Dewitte, B.; Wu, L.; Santoso, A.; Takahashi, K.; Yang, Y.; Carréric, A.; McPhaden, M.J. Increased variability of eastern Pacific El Niño under greenhouse warming. Nature 2018, 564, 201–206. [Google Scholar] [CrossRef]
  62. Knutti, R.; Masson, D.; Gettelman, A. Climate model genealogy: Generation CMIP5 and how we got there. Geophys. Res. Lett. 2013, 40, 1194–1199. [Google Scholar] [CrossRef]
  63. Hurrell, J.W.; Holland, M.M.; Gent, P.R.; Ghan, S.; Kay, J.E.; Kushner, P.J.; Lamarque, J.F.; Large, W.G.; Lawrence, D.; Lindsay, K.; et al. The Community Earth System Model: A framework for collaborative research. Bull. Am. Meteorol. Soc. 2013, 94, 1339–1360. [Google Scholar] [CrossRef]
  64. Swart, N.C.; Cole, J.N.S.; Kharin, V.V.; Lazare, M.; Scinocca, J.F.; Gillett, N.P.; Anstey, J.; Arora, V.; Christian, J.R.; Hanna, S.; et al. The Canadian Earth System Model version 5 (CanESM5.0.3). Geosci. Model Dev. 2019, 12, 4823–4873. [Google Scholar] [CrossRef]
  65. Voldoire, A.; Sanchez-Gomez, E.; Salas y Mélia, D.; Decharme, B.; Cassou, C.; Sénési, S.; Valcke, S.; Beau, I.; Alias, A.; Chevallier, M.; et al. The CNRM-CM5.1 global climate model: Description and basic evaluation. Clim. Dyn. 2012, 40, 2091–2121. [Google Scholar] [CrossRef]
  66. Watanabe, S.; Hajima, T.; Sudo, K.; Nagashima, T.; Takemura, T.; Okajima, H.; Nozawa, T.; Kawase, H.; Abe, M.; Yokohata, T.; et al. MIROC-ESM 2010: Model description and basic results of CMIP5-20c3m experiments. Geosci. Model Dev. 2011, 4, 845–872. [Google Scholar] [CrossRef]
  67. Dufresne, J.L.; Foujols, M.A.; Denvil, S.; Caubel, A.; Marti, O.; Aumont, O.; Balkanski, Y.; Bekki, S.; Bellenger, H.; Benshila, R.; et al. Climate change projections using the IPSL-CM5 Earth System Model: From CMIP3 to CMIP5. Clim. Dyn. 2013, 40, 2123–2165. [Google Scholar] [CrossRef]
  68. Giorgetta, M.A.; Jungclaus, J.; Reick, C.H.; Legutke, S.; Bader, J.; Böttinger, M.; Brovkin, V.; Crueger, T.; Esch, M.; Fieg, K.; et al. Climate and carbon cycle changes from 1850 to 2100 in MPI-ESM simulations for the Coupled Model Intercomparison Project phase 5. J. Adv. Model. Earth Syst. 2013, 5, 572–597. [Google Scholar] [CrossRef]
  69. Sillmann, J.; Kharin, V.V.; Zhang, X.; Zwiers, F.W.; Bronaugh, D. Climate extremes indices in the CMIP5 multimodel ensemble: Part 1. model evaluation in the present climate. J. Geophys. Res. Atmos. 2013, 118, 1716–1733. [Google Scholar] [CrossRef]
  70. Deser, C.; Phillips, A.; Bourdette, V.; Teng, H. Uncertainty in climate change projections: The role of internal variability. Clim. Dyn. 2010, 38, 527–546. [Google Scholar] [CrossRef]
  71. Sillmann, J.; Kharin, V.V.; Zwiers, F.W.; Zhang, X.; Bronaugh, D. Climate extremes indices in the CMIP5 multimodel ensemble: Part 2. Future climate projections. J. Geophys. Res. Atmos. 2013, 118, 2473–2493. [Google Scholar] [CrossRef]
  72. Knutti, R.; Sedláček, J. Robustness and uncertainties in the new CMIP5 climate model projections. Nat. Clim. Chang. 2013, 3, 369–373. [Google Scholar] [CrossRef]
  73. van Vuuren, D.P.; Edmonds, J.; Kainuma, M.; Riahi, K.; Thomson, A.; Hibbard, K.; Hurtt, G.C.; Kram, T.; Krey, V.; Lamarque, J.-F.; et al. The representative concentration pathways: An overview. Clim. Chang. 2011, 109, 5–31. [Google Scholar] [CrossRef]
  74. Zhou, T.J.; Zou, L.W.; Chen, X.L. Commentary on the Coupled Model Intercomparison Project Phase 6 (CMIP6). Clim. Chang. Res. 2019, 15, 445–456. [Google Scholar]
  75. Bhatnagar, S.; Chaudhary, R.; Sharma, S.; Janjhua, Y.; Thakur, P.; Sharma, P.; Keprate, A. Exploring the dynamics of climate-smart agricultural practices for sustainable resilience in a changing climate. Environ. Sustain. Indic. 2024, 24, 100535. [Google Scholar] [CrossRef]
  76. Zhao, C.; Liu, B.; Piao, S.; Wang, X.; Lobell, D.B.; Huang, Y.; Huang, M.; Yao, Y.; Bassu, S.; Ciais, P.; et al. Temperature increase reduces global yields of major crops in four independent estimates. Proc. Natl. Acad. Sci. USA 2017, 114, 9326–9331. [Google Scholar] [CrossRef]
  77. Li, Z.; Liu, W.; Ye, T.; Chen, S.; Shan, H. Observed and CMIP6 simulated occurrence and intensity of compound agroclimatic extremes over maize harvested areas in China. Weather Clim. Extrem. 2022, 38, 100503. [Google Scholar] [CrossRef]
  78. Heikonen, S.; Heino, M.; Jalava, M.; Siebert, S.; Viviroli, D.; Kummu, M. Climate change threatens crop diversity at low latitudes. Nat. Food 2025. [Google Scholar] [CrossRef]
  79. Wheeler, T.; von Braun, J. Climate change impacts on global food security. Science 2013, 341, 508–513. [Google Scholar] [CrossRef] [PubMed]
  80. Zhou, J.; Zhang, J.; Huang, Y. Evaluation of soil temperature in CMIP6 multimodel simulations. Agric. For. Meteorol. 2024, 352, 110039. [Google Scholar] [CrossRef]
  81. Phillips, C.L. How much will soil warm? J. Geophys. Res. Biogeosci. 2020, 125, e2020JG005668. [Google Scholar] [CrossRef]
  82. Liu, Y.; Chen, X.; Bai, Y.; Zeng, J. Evaluation of 22 CMIP6 model-derived global soil moisture products of different shared socioeconomic pathways. J. Hydrol. 2024, 636, 131241. [Google Scholar] [CrossRef]
  83. Latif, M. Uncertainty in climate change projections. J. Geochem. Explor. 2011, 110, 1–7. [Google Scholar] [CrossRef]
  84. Brient, F. Reducing uncertainties in climate projections with emergent constraints: Concepts, examples and prospects. Adv. Atmos. Sci. 2019, 37, 1–15. [Google Scholar] [CrossRef]
  85. Wu, H.; Levinson, D. The ensemble approach to forecasting: A review and synthesis. Transp. Res. Part C Emerg. Technol. 2021, 132, 103357. [Google Scholar] [CrossRef]
  86. Kim, Y.-T.; Yu, J.-U.; Kim, T.-W.; Kwon, H.-H. A novel approach to a multi-model ensemble for climate change models: Perspectives on the representation of natural variability and historical and future climate. Weather Clim. Extrem. 2024, 44, 100688. [Google Scholar] [CrossRef]
  87. Acar, E.; Bayrak, G.; Jung, Y.; Lee, I.; Ramu, P.; Ravichandran, S.S. Modeling, analysis, and optimization under uncertainties: A review. Struct. Multidiscip. Optim. 2021, 64, 2909–2945. [Google Scholar] [CrossRef]
  88. Wang, B.; Jägermeyr, J.; O’Leary, G.J.; Wallach, D.; Ruane, A.C.; Feng, P.Y.; Li, L.C.; Liu, D.L.; Waters, C.; Yu, Q.; et al. Pathways to identify and reduce uncertainties in agricultural climate impact assessments. Nat. Food 2024, 5, 550–556. [Google Scholar] [CrossRef] [PubMed]
  89. Martín-Martín, A.; Orduna-Malea, E.; Thelwall, M.; Delgado López-Cózar, E. Google Scholar, Web of Science, and Scopus: A systematic comparison of citations in 252 subject categories. J. Informetr. 2018, 12, 1160–1177. [Google Scholar] [CrossRef]
  90. Falagas, M.E.; Pitsouni, E.I.; Malietzis, G.A.; Pappas, G. Comparison of PubMed, Scopus, Web of Science, and Google Scholar: Strengths and weaknesses. FASEB J. 2007, 22, 338–342. [Google Scholar] [CrossRef]
Figure 1. Annual publications and total annual citations for articles on CMIP and its multi-model archival applications, according to the Web of Science Core Collection from 2000 to 2023 (data up to 7 March 2024).
Agriculture 15 00826 g001
Figure 2. Top 15 research areas with CMIP and its multi-model archival applications, based on the number of publications and their percentage of the total publication volume.
Agriculture 15 00826 g002
Figure 3. The publication volume of CMIP-related studies at the country level.
Agriculture 15 00826 g003
Figure 4. Cooperation networks of organizations. Using a full counting method in VOSviewer, each publication is limited to a maximum of 25 organizations, and each organization is limited to a minimum of 100 publications, with a total of 50 organizations eligible. Organizations in a collaborative network are linked according to the number of joint publications. The size of the circles and words reflects the number of publications, and the thickness of the connecting lines indicates the strength of cooperation. Some words are not shown in the figure due to overlapping labels. Organization abbreviations: bur = bureau; univ = university; ctr = center; adm = administration; sci = science; res = research; natl = national.
Agriculture 15 00826 g004
Figure 5. Top 15 highly cited scientific papers mapped by HistCite Pro 2.1. Each node represents a document. The number displayed in the circle represents the serial number of the document record in the database and their corresponding references are listed at the bottom of the figure numbered from 1 to 15. A larger circle indicates more citations. The arrows between nodes depict the reference relationships between documents; if an arrow points from node A to node B, it means that document is a reference for the other [11,12,37,52,55,62,64,65,66,67,68,69,70,71,72].
Agriculture 15 00826 g005
Figure 6. Density visualization of keyword co-occurrence. A total of 145 keywords had frequencies of ≥100. A larger font size indicates a greater total link strength and a closer distance between keywords indicates greater relevance. The degree of keyword co-occurrence is represented by a rainbow of colors: the more frequent the keyword co-occurrence, the redder the color around each point; conversely, the colors around each point are bluer if the keyword co-occurrence is less frequent.
Agriculture 15 00826 g006
Figure 7. Top 40 keywords with the strongest citation bursts during 2000–2023 drawn by the “Burstness” control panel of CiteSpace 6.2.6. The thresholds for “Burstness” in our study were kept at the defaults. Year indicates the year in which the keyword first appeared, Begin and End indicate the beginning and end years of the keyword citation burst, respectively, and Strength indicates the importance of a keyword within a specific period. The lines in light blue, dark blue, and red indicate that the keyword has not yet appeared, has appeared, and has become an academically popular topic and point, respectively.
Agriculture 15 00826 g007
Table 1. Tools and their uses in the bibliometric analysis.
ToolUse(s)
Web of ScienceDownload the literature documents, and obtain the annual number of publications and scientific categories.
VOSviewer 1.6.19Visualize the collaboration of organizations and keywords.
HistCite Pro 2.1Extract journals, the number of publications in each country, and representative papers.
CiteSpace 6.2.6Perform keyword bursts.
ArcGIS 10.2Visualize the number of publications per country.
Table 2. Top 15 scientific journals that have published papers related to CMIP multi-model archival applications. C/A: the ratio of the number of journal citations to the number of journal publications; JCR: journal citation report; JIF5yr: journal impact factor per five years.
JournalCountryJIF5yrJCR CategoryJCR RankArticlesCitationsC/A
Journal of ClimateUnited States5.3Meteorology and atmospheric sciencesQ1116353,51846.02
Climate DynamicsUnited States4.4Meteorology and atmospheric sciencesQ2105537,56935.61
Geophysical Research LettersUnited States5.2Geosciences, multidisciplinaryQ181131,97939.43
International Journal of ClimatologyEngland3.8Meteorology and atmospheric sciencesQ2532985818.53
Journal of Geophysical Research-AtmospheresUnited States4.7Meteorology and atmospheric sciencesQ245920,03643.65
Environmental Research LettersEngland7.2Environmental sciencesQ139812,21230.68
Theoretical and Applied ClimatologyGermany3.1Meteorology and atmospheric sciencesQ3253361214.28
Geoscientific Model DevelopmentGermany6.1Geosciences, multidisciplinaryQ125024,99799.99
AtmosphereSwitzerland2.6Environmental sciencesQ319312636.54
Earth’s FutureEngland8.7Environmental sciencesQ1180436424.24
Climatic ChangeNetherlands5.4Environmental sciencesQ1175696739.81
WaterSwitzerland3.3Environmental sciencesQ2159178611.23
Journal of HydrologyNetherlands6.4Geosciences, multidisciplinaryQ1153433728.35
Scientific ReportsEngland4.3Multidisciplinary sciencesQ1145575739.70
Advances in Atmospheric SciencesChina5.2Meteorology and atmospheric sciencesQ1144337323.42
Total journals (527)----10,665386,20234.59
Table 3. Characteristics of Google Scholar, Scopus, and Web of Science [89,90].
CharacteristicGoogle ScholarScopusWeb of Science
Official inauguration date20042004.112004.11
Period coveredTheoretically, all available electronically1966 to present1900 to present
UpdatingMonthly on average1–2 times weeklyWeekly
FocusBiology, life sciences and environmental sciences, business, administration, finance and economics, chemistry and materials science, engineering, pharmacology, veterinary science, social sciences, and arts and humanitiesScience, technology, social science, and arts and humanitiesPhysics sciences, health sciences, life sciences, and social sciences
Disclaimer/Publisher’s Note: The statements, opinions and data contained in all publications are solely those of the individual author(s) and contributor(s) and not of MDPI and/or the editor(s). MDPI and/or the editor(s) disclaim responsibility for any injury to people or property resulting from any ideas, methods, instructions or products referred to in the content.

