Abstract
The exchange of food commodities significantly contributes to alleviating the strain on land used for agricultural production by linking areas rich in land with those facing resource limitations. This study employs the entropy weight–TOPSIS method to measure the water–land–food system, utilizes a two-way fixed-effects model to examine the impact of food import competition on the coordination of the water–land–food system, and applies a spatial Durbin model to explore the spatial spillover effects of this impact. The findings indicate the following: (1) The average coordination level of the WLF system in China stands at 0.317, showing considerable variability. The WLF system coordination in all regions of China initially decreased and then increased in the period studied, with the northeast region exhibiting the highest level of coordination. (2) The competitive effect of domestic and foreign food costs driven by food imports has a positive impact on the coordination of the WLF system. For every 100,000 hectares of land saved through the competition effect, the coordination of China’s WLF system increases by 0.002. However, once the saved land exceeds 1.5 million hectares, the impact of import competition on the importing country’s food market becomes excessive and starts to have a negative effect. (3) Split-sample regression revealed that the positive effect of food import competition on the coordination of the WLF system is stronger in the southern region compared to the northern region. Additionally, the increase in the competition effect has a more pronounced impact on the coordination of the WLF system in major food production areas than in non-major production areas. (4) Based on the results of the spatial econometric model, the increase in the competitive effect of food imports in a region not only increases the coordination of the WLF system within that region but also positively impacts the coordination of the system in neighboring regions. (5) The land use efficiency of food imports acts as a conduit for the impact of food import competition on the coordination of the WLF system.
1. Introduction
1.1. Background
As the primary driving force behind international trade, the welfare gains derived from trade have long been a central focus of academic research. Traditional classical trade theory examines the influence of trade on national welfare through the lens of the technology gap. Based on the theory of absolute advantage, David Ricardo proposed the theory of comparative advantage in 1981, explaining that even when a country is at an absolute disadvantage in the production of two goods, it can still benefit from trade due to relative differences in labor productivity, allowing both parties to gain simultaneously [1]. In contrast, neoclassical trade theory approaches the same issue from the perspective of factor endowments. As the theory evolved, scholars started to explore the “new” sources of trade welfare. Michael pointed out that international trade is driven by increasing returns to scale, product differentiation, and consumer preferences [2]. Krugman introduced the monopolistic competition model into the new trade theory, revealing the dominance of highly productive firms and the prevalence of intra-industry trade [3]. Melitz further developed the new trade theory, focusing on the effects of firm heterogeneity and productivity on trade welfare [4]. This triggered the exploration of the “export self-selection effect” and the “trade promotion effect”. Feenstra et al. pointed out that, in a monopolistic competition environment with a heterogeneous firm model, the trade welfare mainly stems from two aspects: the reduction of firms’ cost markup rates brought about by the growth of import variety and the trade promotion competition effect [5]. Arkolakis further indicated that the measured results of the welfare derived from the trade promoting competition effect are influenced by conditional settings such as those related to heterogeneous firms, monopolistic competition, and variable costs [6].
The exchange of food commodities acts as a vital connection between areas with plentiful land and those facing land scarcity, significantly contributing to easing the burden on land required for agricultural production [7]. Virtual land refers to the amount of land resources consumed during the production and processing of a specific good or service. These land resources are typically embedded in goods or services in a non-physical form [8]. Food trade accounts for a significant proportion of agricultural trade, and therefore, the flow of virtual land within the food trade process should not be underestimated [9]. Scholars commonly analyze the movement of virtual land through the lens of comparative advantage theory [10]. In principle, virtual land resources are expected to transfer from regions or nations with greater land availability to those with limited land endowment [11]. The virtual land embedded in the food trade process disrupts the traditional concept of immobile land [12], enabling it to flow into regions with limited land availability through trade [8]. China, a nation with limited land resources, has adopted a strategy of importing comparatively disadvantaged products and leveraging the influx of virtual land resources embedded in food products [13,14]. This approach has enabled China to conserve land resources [15], allowing them to be utilized for the cultivation of other food crops, thereby reducing the proportion of land-intensive food crops within its agricultural output [16]. Furthermore, according to the trade welfare theory, domestic food producers will import food products with a much lower virtual land content than the domestic products. This practice not only maximizes trade welfare but also gives full play to the trade-for-competitive effect.
1.2. Land Use Efficiency Studies for Food Production
The assessment of land use for food production aims to illustrate the correlation between resource inputs and agricultural outputs within a crop cultivation system. When the output levels remain constant, a reduced input usage indicates greater efficiency, whereas, for a fixed level of inputs, a higher output reflects improved efficiency [17]. Currently, the criteria selected by researchers to evaluate food production land vary significantly. However, there is a noticeable shift from relying solely on single input–output indicators to adopting multiple indicators [18]. Additionally, economic, social, and ecological benefits are increasingly integrated into a comprehensive evaluation framework. With the rapid advancement of both the economy and society, environmental concerns have become an increasingly prominent issue [18]. The escalating yield of agricultural production is accompanied by a concomitant decline in the quality of land [19], attributable to the excessive utilization of chemical fertilizers, pesticides, and agricultural films [20,21]. Consequently, scholars have expanded the traditional indicators for measuring food production land to encompass environmental factors, thus incorporating the concept of “green efficiency” in the evaluation of land use [22]. A number of studies have also argued that the failure to include the environmental pollution generated during the utilization of land in the measurement system will overestimate the land used for food production [23].
The measurement of food production land is chiefly achieved through the utilization of stochastic frontier analysis (SFA) and data envelopment analysis (DEA). In comparison with the DEA method, which is capable of measuring multiple inputs and outputs, SFA possesses a more circumscribed scope of application, as it is able to measure a solitary output indicator. Notably, the SBM-DEA model, which measures carbon emissions as a non-desired output, has garnered significant adoption [20,24]. Moreover, researchers have focused on analyzing the spatial and temporal dynamics of land used for food production to uncover regional distribution patterns and evolutionary trends across different areas in China [25,26]. Additionally, increasing attention has been given to the interconnections between land and land allocated specifically for food cultivation and it has been found that they have the characteristic of agglomeration, a trend that is becoming more and more obvious [27].
The consumption of resources in the production of food products varies across different countries and regions, resulting in differences in the virtual resource content of food products [28,29]. In accordance with the new-new trade theory, a nation or region can leverage trade for competitive advantage by importing food products with a lower VR content than the domestic VR levels, thereby enhancing trade welfare [30]. This phenomenon can be attributed to the fact that countries with higher food production efficiency (lower food virtual resource content) are able to produce food products at a lower cost and price. Consequently, the importation of food from these countries results in the displacement of the market share of the primary food producers in the importing country. Concurrently, this leads to a depression of the price of food in the importing country, thereby reducing the profitability of food production. This, in turn, exerts an influence on the food market in the importing country. The impact of food imports on producers is influenced by the heterogeneity of producers’ own food production efficiency [31]. Producers with low levels of food production efficiency are forced out of the market as their market share is squeezed. Conversely, producers with high food production efficiency are more likely to withstand competitive pressures, and the ongoing impact of import competition leads to a decline in the profitability of domestic food production. This, in turn, prompts the pursuit of enhanced production efficiency, thereby saving costs and ensuring the survival of the producer in the market. This study characterizes the food import competition effect as the process in which a country or region imports food from a source with greater production efficiency (and consequently lower virtual resource content). This dynamic leads to a decrease in food prices within the importing country due to competitive cost advantages, thereby diminishing the profitability of domestic food production. As a result, the importing country is compelled to enhance its own food production efficiency.
1.3. WLF Coordination and Matching Studies
Research on the alignment of soil and water resources with food production has garnered mounting attention. As the demand for food consumption rises, the area cultivated for food crops expands, and the demand for land and water resources gradually increases [32]. Concurrently, the heightened demand for land leads to a contraction in surface water area and an escalation in the pressure on water resources [33]. The excessive utilization of chemical fertilizers and pesticides in the food production process also results in the contamination of land and water sources [34].
The impact of food cultivation structure adjustment on soil and water resources has been primarily explored by scholars. The amount of water and land required for the growth of different food crops varies, and it is posited that by adjusting the planting structure, the food output can be increased without increasing the pressure on resources [35]. A four-pronged approach is adopted in this research, which included the following steps: firstly, the measurement of the impact of changes in food production volume on soil and water resources based on changes in the consumption demand [36]; secondly, the comparison of the impact of food acreage under structural adjustment and non-structural adjustment on the utilization of soil and water resources [37]; thirdly, the consideration of factors such as light, heat, water, soil, economic inputs, natural hazards, and technological efficiency and the use of the SFA or the DEA to measure their contribution to food production; and lastly, the use of log-averaged Dirchner’s decomposition method to explore the impacts of changes in replanting index, cropping structure, and land area on food production [38].
Despite the exploration of the WLF nexus from a variety of perspectives by scholars, the concept of a “WLF system” remains ambiguous due to a lack of a uniform definition. The system’s coordination is predicated on the integration of the three interrelationships to address the problem of resource scarcity, enhance production management capacity, and achieve sustainable food production [39]. The system is characterized by three overarching objectives: firstly, to delineate the sustainable regional food production capacity; secondly, to investigate the external factors that influence the system’s coordination; and thirdly, to enhance WLF coordination [40,41,42,43]. The principle of systemic coordination emphasizes the efficient transformation of resources both within and between complex systems to facilitate a structured evolution and positive feedback loops. This concept prioritizes stability, adaptability, and long-term sustainability at both intra-system and inter-system levels [44]. In this study, the definition of water–land–food system coordination is referred to that of Li et al. in order to determine the level of individual benefits and the mutual benefits of pairwise interactions, along with the overall synergistic advantages among the three interconnected subsystems—water resources, land, and food production—which are evaluated holistically. This assessment considers three key dimensions: stability, appropriateness, and long-term sustainability of these resources [34].
In summary, although extant studies focus on the respective roles of water–land, water–food, and land–food, they lack systemic considerations. The integration of the benefits of each subsystem to achieve inter- and intra-system stability, fitness, and sustainability is the essence of systemic coordination [34]. Concurrently, scholars are undertaking further exploration of all potential sources of trade welfare, whilst striving to quantify the total welfare gained from trade with the utmost precision [45]. Their research covers a broad spectrum of trade-related welfare aspects, such as the self-selection effect in exports, the expansion of import variety, and the competitive dynamics introduced by trade [46]. Moreover, they strongly emphasize the influence of import trade on economic growth and industrial development. In the academic literature concerning the welfare implications of food import trade, scholars have predominantly concentrated on the role of food imports in regulating the domestic supply and demand, as well as the promotion of agricultural economic growth [47]. Nevertheless, there is a paucity of research exploring the role of food import trade in optimizing the efficiency of resource allocation in importing countries [48]. The majority of extant studies are based on the characterization of the virtual resource flows generated by the food import trade [49]. Empirical investigations of virtual resource flows caused by market shocks to force changes in the efficiency of food production in importing countries are lacking, as is research into the expansion of the research boundary to the level of coordination of WLF systems in importing countries [48,50].
The present study is founded on the premise that the trade promotion competition effect, as outlined in the new-new trade theory, can be utilized as a means to explore the cost competition that is precipitated by food imports and the subsequent impact on the diminution of profits in the importing country. This, in turn, engenders the necessity for improvement of the efficiency of land utilization for food production, which, in a secondary manner, enhances the coordination of the WLF system. This study also explores the trade in food imports at the sub-regional level and its impact on the efficiency of allocating resources for food production and the coordination of the WLF system in different regions. The study goes on to explore the impact of the food import trade on the efficiency of food production resource allocation and WLF system coordination in different regions. The study proposes a novel approach to understanding the dynamics of trade-offs between food importation and domestic production, thereby broadening the scope of research on the welfare implications of food importation. This research examines the relevance of the competition effect driven by trade within the context of the food trade sector, provides new insights into the mechanism of adjusting from the food import side to drive the optimization of the food production side in importing countries, and expands the scope of research on the welfare effects of the food import trade. This study aims to explore the impact of food import competition on the coordination of China’s WLF system.
2. Materials and Methods
2.1. Virtual Land Measurement Methodology for China’s Net Food Imports
This study provides a comprehensive review of the methodologies used to quantify the virtual land content per unit of food crops. Most existing research examines the virtual land content from both production and consumption perspectives. However, since this paper focuses on analyzing the impact of the food import trade on domestic production, the chosen approach measured the land resources utilized by each province in food cultivation from a production-oriented viewpoint. This metric is regarded as an indicator of the virtual land content per unit of food crops (see Li et al. [34] for research on willow food). The corresponding calculation formula is as follows:
In Equation (1), Alandz,it represents the virtual land content per unit of food crop, indicating the virtual land required for one unit of z-crop in region i during year t. FSz,it refers to the sown area of z-crop in region i in year t, while FPz,it denotes the total production of z-crop in region i in year t. The virtual land measure for food imports is calculated as follows:
In Equation (2), IMz,it indicates the quantity of crop z imported into region i in year t.
2.2. Measurement of the Competitive Effect of China’s Net Food Imports
Since this paper primarily examined the influence of the food import trade on production, it measured the land resources necessary for food production within each province from the production perspective. This served as an indicator of the virtual land content per unit of food crop produced in each region.
In Equation (3), SLDltk represents the land footprint per unit mass of food crops in country l during year t for crop k (m3/kg). Yltk denotes the yield per unit area of food crops in country l in year t for crop k (kg).
In Equation (4), VLItk represents the average land footprint of food crop k imports in year t (m3/kg). IMltk indicates the quantity of food crop k imported from country l in year t (kg), while n refers to the total number of primary source countries from which China imports crop k.
In Equation (5), FILSitk represents the amount of land conserved through the importation of food crop k into province i during year t (m3), and IMitk indicates the total volume of food crop k imported into province i in year t (kg). The former can be viewed as a reflection of the global land resources saved through food imports, whilst the latter reflects the discrepancy between the cost of land for food production in the domestic market and that of land for food production in the importing countries and defines the competitive impact of food imports from the standpoint of resource utilization, focusing on how these imports influence the domestic food market.
2.3. Methodology for Measuring Land Efficiency for Food Production
The GML index has proven to be a valuable tool for balancing the goals of green development, specifically by optimizing the desired outputs, minimizing the undesirable outputs, and reducing the input factors. Building on the work of Oh [51], this study developed a GML index model to assess changes in land use efficiency for food production across 30 provincial-level administrative regions in China from 2003 to 2020. The specific calculation formula and indicator selection refer to Li et al. [34].
2.4. Characteristics of Spatial and Temporal Variations in WLF System Coordination
2.4.1. Construction of a WLF System Coordination Index System Based on Symbiosis Theory and PSIR
The theoretical basis of symbiosis is the establishment of a symbiotic system, a complex entity characterized by the interdependence, interconnectedness, and agglomeration of elements. This system adheres to the principles of holistic realization, purpose, and environmental adaptation and exhibits the fundamental characteristics of stability, coordination, and sustainability. A symbiotic system comprises three elements: a symbiotic unit, a symbiotic environment, and a symbiotic mode. A symbiotic relationship is defined as the set of relationships generated by a symbiotic unit in a specific symbiotic environment according to a specific symbiotic mode. The evolution of symbiotic systems has been demonstrated to be positively correlated with symbiotic energy [52]. Symbiotic systems are defined by five major characteristics: the interconnectedness and organic integration of their elements; the combinatorial, systematic, and pluralistic nature of the symbiotic units; the symbiotic interface as the carrier for the interaction of the symbiotic units; the symbiotic environment as the external condition for the operation of symbiotic modes; and the goal of the symbiotic system of realizing synergistic development and mutually beneficial symbiosis. However, it is challenging for a single-level symbiotic system to demonstrate the energy flow and relative relationship between symbiotic structures [53]. Consequently, a multi-level symbiotic system has emerged, which consists of multiple symbiotic subsystems with hierarchical differences and interactions between subsystems and can reveal the role of symbiotic systems in different interfaces more scientifically [14,54,55,56].
The selection of appropriate symbiotic interfaces is crucial for improving resource allocation efficiency, enhancing symbiotic energy supply, and promoting system coordination. The term “system coordination” refers to the orderly development and virtuous cycle from low to high within and between subsystems in a complex system, emphasizing stability, adaptability, and sustainable development patterns. The concept has wide applicability in the fields of environment, ecology, and economics. The symbiotic system of “WLF” is a significant subsystem within the complex economic, social, and natural system. In the established symbiotic environment, the optimal allocation of resources within the system can promote the improvement of resource flow and transformation efficiency, thereby achieving the coordinated development of the system. This symbiotic system has been shown to improve both the quantity and the quality of water, land, and food production, while simultaneously enhancing the compatibility of the external environment with the system itself [33]. It has also been found to produce substantial economic, environmental, and social benefits, thereby fostering the system’s sustainable development. From a systems theory perspective, the coordination process within the “WLF” symbiotic system aligns with the pressure–state–impact–response (PSIR) model [43]. In this research, we broke down the coordination of the “WLF” system into three key indices: stability, adaptability, and sustainability. Based on the framework developed by Li et al. [34], we constructed a measurement index system. The PSIR model was then employed to analyze the coordination dynamics of the “WLF” symbiotic system, assess its overall coordination, and provide theoretical guidance for optimizing resource allocation and advancing the system’s sustainable development (see Table 1).

Table 1.
Construction of the indicator system for measuring the water–land–food system coordination.
2.4.2. Methods for Measuring WLF System Coordination
Integrated WLF System Assessment Methods
The entropy weight method is an objective approach for assigning weights, where the weights are determined based on the relative degree of variation in each indicator within the indicator system [57]. In contrast, the TOPSIS method addresses the challenge of selecting optimal solutions in multi-attribute decision-making by calculating the distance between the evaluation object and both the positive and the negative ideal solutions, subsequently ranking them based on these distances. The popularity of this method is due to its objectivity, precision, and simple yet flexible calculation process [58]. The entropy weight–TOPSIS method combines the entropy weight approach with the TOPSIS framework, replacing the original subjective weights with entropy-derived weights. This integration enhances the objectivity and scientific rigor of the evaluation process [59,60]. For this study, 39 indicators were selected from the three subsystems—water resources, land resources, and food production—to assess the coordination of the WLF system. These indicators were then organized into three categories: stability, suitability, and sustainability (details are provided in Table 1). Given the complexity of the system, which involves multiple dimensions of the indicators, the entropy weight–TOPSIS method was utilized to perform the evaluation in a more streamlined, scientific, and logical manner. The specific formula refers to Li et al. [34].
2.5. Impact of the Food Import Competition Effect on WLF System Coordination
2.5.1. Variable Selection
As demonstrated in the preceding theoretical analyses, the selection of appropriate variables is pivotal for an effective model design. The subsequent indicators were selected to measure these variables in line with earlier research. Table 2 provides the details of the variable indicators and their corresponding measurement methods.
Table 2.
Variables and calculation methods of the effect of the land cost competition effect on water–land–food system coordination.
Dependent variable: WLF system coordination. The study drew on the work of Li et al. [34] and used the PSRI model. A total of 39 indicators relevant to the WLF system were chosen using the PSRI model, with a focus on symbiosis theory. These indicators were categorized into three main dimensions: stability, adaptability, and sustainability. To evaluate each sub-system of the WLF system, the entropy weight–TOPSIS method was applied. This evaluation was then integrated with the coupled coordination degree model to assess the overall coordination of the system. It was posited that this methodology would offer a more precise and well-founded representation of the coordinated development level of regional water, land, and food resources.
Independent variable: food import competition effect. Given that the virtual land content per unit of food products is subject to variation between countries and regions, this has a consequential impact on the market share of food producers in China. The trade promotion competition effect is such that countries with a lower virtual land content of food produce food products at lower costs and prices. As a result, importing food from these nations is likely to reduce the market share of China’s primary food producers, while also driving down the prices of food from the exporting countries. This will have an impact on the food market of the importing countries. Consequently, this study proposes a methodology to quantify the “food import competition effect”. This involves calculating the product of the difference between the virtual land content of food produced domestically in China and that of imported food and then multiplying it by the volume of food imports. This approach illustrates the influence of food imports on domestic production, specifically in terms of the use of land resources.
Mediating variable: land efficiency for food production. In this research, the input–output indicators used were based on the work of Li et al. [34], and the GML index method was applied. Additionally, the study incorporated the non-desired outputs and the ecological value of food cultivation into the desired output indicators. The goal was to optimize both the economic and the ecological value of food production while reducing agricultural land pollution, carbon emissions, and other input factors. This methodology aimed to provide a more precise, scientific, and rational representation of land use efficiency.
Instrumental variable: farm size. In this study, the “sum of China’s milk, beef, poultry, mutton and pork production” was employed to characterize the “farm size” and as an instrumental variable. The rationale behind this choice was that the size of the “competitive effect of food imports” is contingent on the “degree of impact of food imports on domestic food production”. It was further posited that the average virtual land content of imported soybeans and corn is considerably lower than that in the domestic market. This suggests that imported soybeans and corn could exert a significant influence on the soybeans and corn that have higher virtual land content in the domestic food market. Furthermore, corn was hypothesized to have a more substantial impact on the domestic food market. The aquaculture industry in China is the largest importer of feed foods (soybeans and maize), and therefore, the correlation between “farm size” and the endogenous variable “food import competition effect” is theoretically evident. However, this correlation was not directly evident with respect to the current random error term and the coordination of the water–land–food system. Consequently, “farm size” was selected as an instrumental variable in this study.
2.5.2. Empirical Modeling of the Food Import Competition Effect on WLF System Coordination
Given that the coordination data for the WLF system (WLF) are constrained within the range of [0,1], a Tobit regression model was applied for the analysis, represented by the following formula:
In Equations (6)–(8), the variable WLF*it serves as the dependent variable, representing the coordination of the WLF system in region i during year t. Filcit is the key explanatory variable, reflecting the impact of the food import competition effect in region i at time t. Filci(t−1) represents the first-order lag of the food import competition effect. The variable Xz,it includes control factors influencing the WLF system in region i during year t, where z = 1, 2, …, 10 corresponds to the 10 control variables: technological environment, water usage structure, irrigation ratio, level of agricultural financial support, disaster rate, agricultural machinery advancement, industrial and economic structure, environmental regulations, village land distribution, and crop specialization. σ represents a constant term, and α indicates the coefficient associated with each variable. The unobservable provincial effect is denoted by μi, while φt captures the time trend fixed effect. εit stands for random error. Equation (6) serves as the baseline model, investigating the linear relationship between the food import competition effect and the coordination of the WLF system. Equation (7) incorporates the lagged term of food import competition effect to explore its delayed impact on system coordination. Equation (8) introduces the quadratic term of food import competition effect to assess its non-linear influence on system coordination.
Moreover, the present study proceeded to undertake spatial econometric modelling. Initially, the spatial autocorrelation of the dependent variable was examined through the utilization of the global Moran’s I index. Thereafter, a spatial econometric model was selected for the purpose of analyzing its spatial effects. The global Moran’s I index, which measures water stress in food production, can be represented by the following equation:
In Equation (9), I symbolizes the global Moran’s I index. S2 refers to the variance of WLF*i, while WLF*a represents the average of WLF*i. ωik stands for the spatial weight matrix, which is calculated by using the inverse of the spatial distance between province i and province k. n and m denote the total number of provinces involved. For additional spatial econometric analysis, this study employed the dynamic spatial panel Durbin model, which is presented in Equation (10)
2.6. Data Sources and Data Processing
The data utilized in this study primarily encompassed 30 provincial-level administrative regions in China spanning from 2003 to 2020. However, due to the unavailability of certain statistics, four regions—Hong Kong, Macao, Taiwan, and Tibet—were not included in the analysis.
3. Results
3.1. Distributional Characteristics of WLF System Coordination
3.1.1. An Overview of WLF System Coordination in China’s Provincial-Level Administrative Regions
Using the entropy weight–TOPSIS index method, the average coordination values of the WLF system were calculated for 30 provincial-level regions in China over several periods from 2003 to 2020; the results are shown in Table 3. At the national level, as well as in key food-producing, major food-marketing, and production-marketing balance regions, the coordination values initially declined before rising again. However, significant disparities in the coordination of the WLF system were observed across different provincial regions. Areas with lower levels of coordination, such as Guizhou, Chongqing, Shaanxi, Hainan, Gansu, Guangxi, Shanxi, Beijing, and Zhejiang, tended to be situated outside of the major food-producing zones and are characterized by limited availability of both land and water resources.
Table 3.
Water–land–food system coordination in different regions in China during 2003–2020.
The average coordination level of the WLF system in China stood at 0.317, showing considerable variability. Provinces such as Heilongjiang (0.466), Jiangsu (0.396), Shandong (0.395), Henan (0.385), and Anhui (0.370) displayed significant differences in their coordination performance; most of these regions are located in the Northeastern, Huang-Huai-Hai area, where the coordination levels surpass the national average. On the other hand, provinces like Chongqing (0.221), Gansu (0.233), Guizhou (0.235), Yunnan (0.246), Shanxi (0.250), and Ningxia (0.251) exhibited notably lower levels of coordination, predominantly in the northwestern and southwestern regions. The national growth rate of WLF system coordination was −2.42%, suggesting a general decline in coordination in certain regions.
3.1.2. Kernel Density Estimates of WLF System Coordination
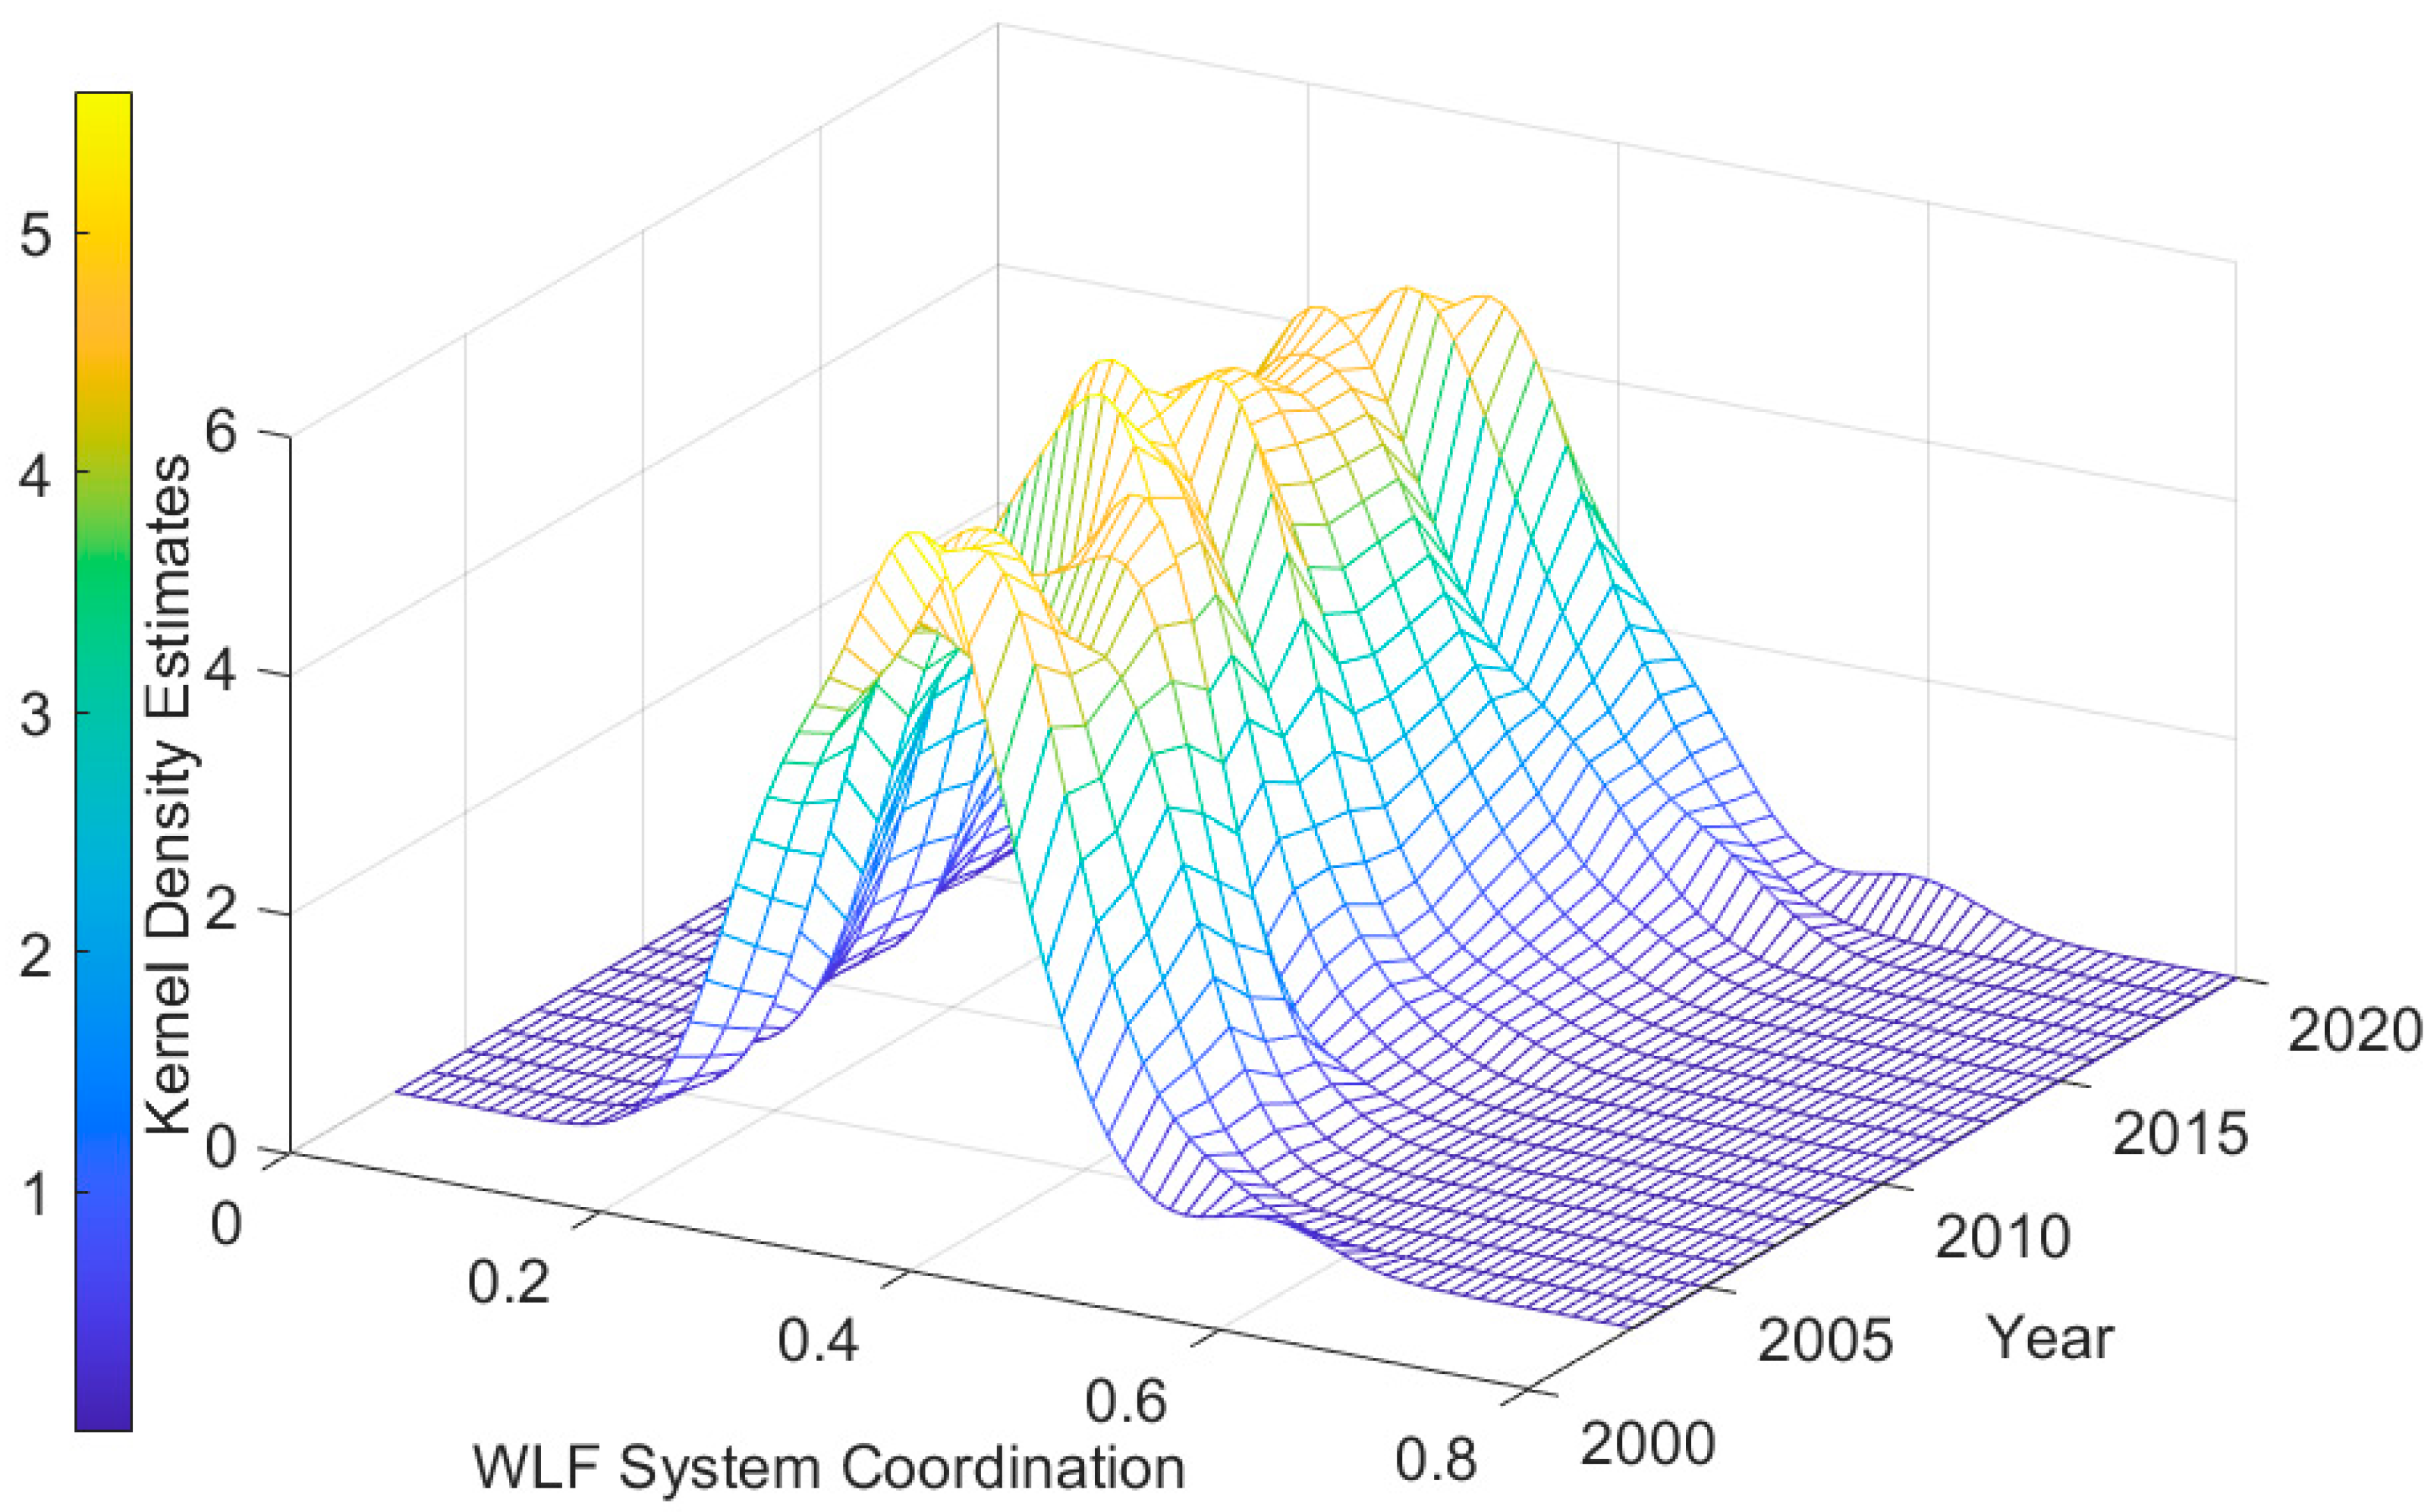
The evolution of China’s WLF system coordination is illustrated in Figure 1. The coordination levels for most samples fell within the range of 0.2–0.5, and the kernel density function (KDF) distribution curves primarily exhibited a single peak with high intensity and a relatively narrow span. In 2003, the KDF distribution curves showed a prominent main peak with a minor secondary peak on the right, indicating a polarization phenomenon in the coordination of China’s WLF system. However, by 2011, a single, extremely strong peak emerged on the left, reflecting a rapid decline in overall system coordination from 2003 to 2011. From 2011 onward, the peak gradually shifted to the right, reaching a level comparable to that of 2003 by 2020, suggesting a potential recovery of the system. This recovery can be attributed to the implementation of ecologically sustainable development policies in 2011, which promoted water conservation awareness and reduced ecosystem damage. Additionally, the increasing volume of food imports has substituted for domestic production, saving local water and land resources and gradually improving the coordination of China’s WLF system.
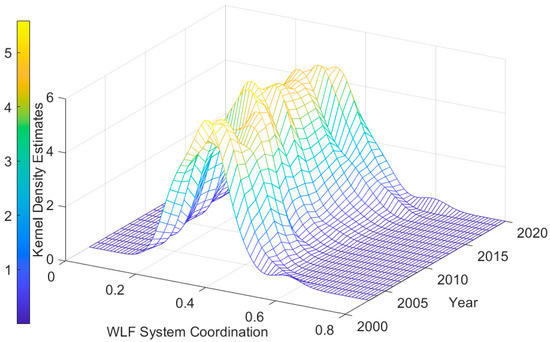
Figure 1.
Kernel density estimates of water–land–food system coordination in China during 2003–2020.
3.1.3. Spatial Relevance of WLF System Coordination
This research calculated the global Moran’s I index for WLF system coordination across 30 provincial administrative regions in China from 2003 to 2020, utilizing the inverse distance weight matrix. The results, presented in Table 4, revealed that the spatial autocorrelation coefficients for all years were both positive and statistically significant. This suggests that spatial autocorrelation existed in the coordination of the WLF system among the regions included in the analysis.
Table 4.
Spatially autocorrelated Moran’s I index of water–land–food system coordination.
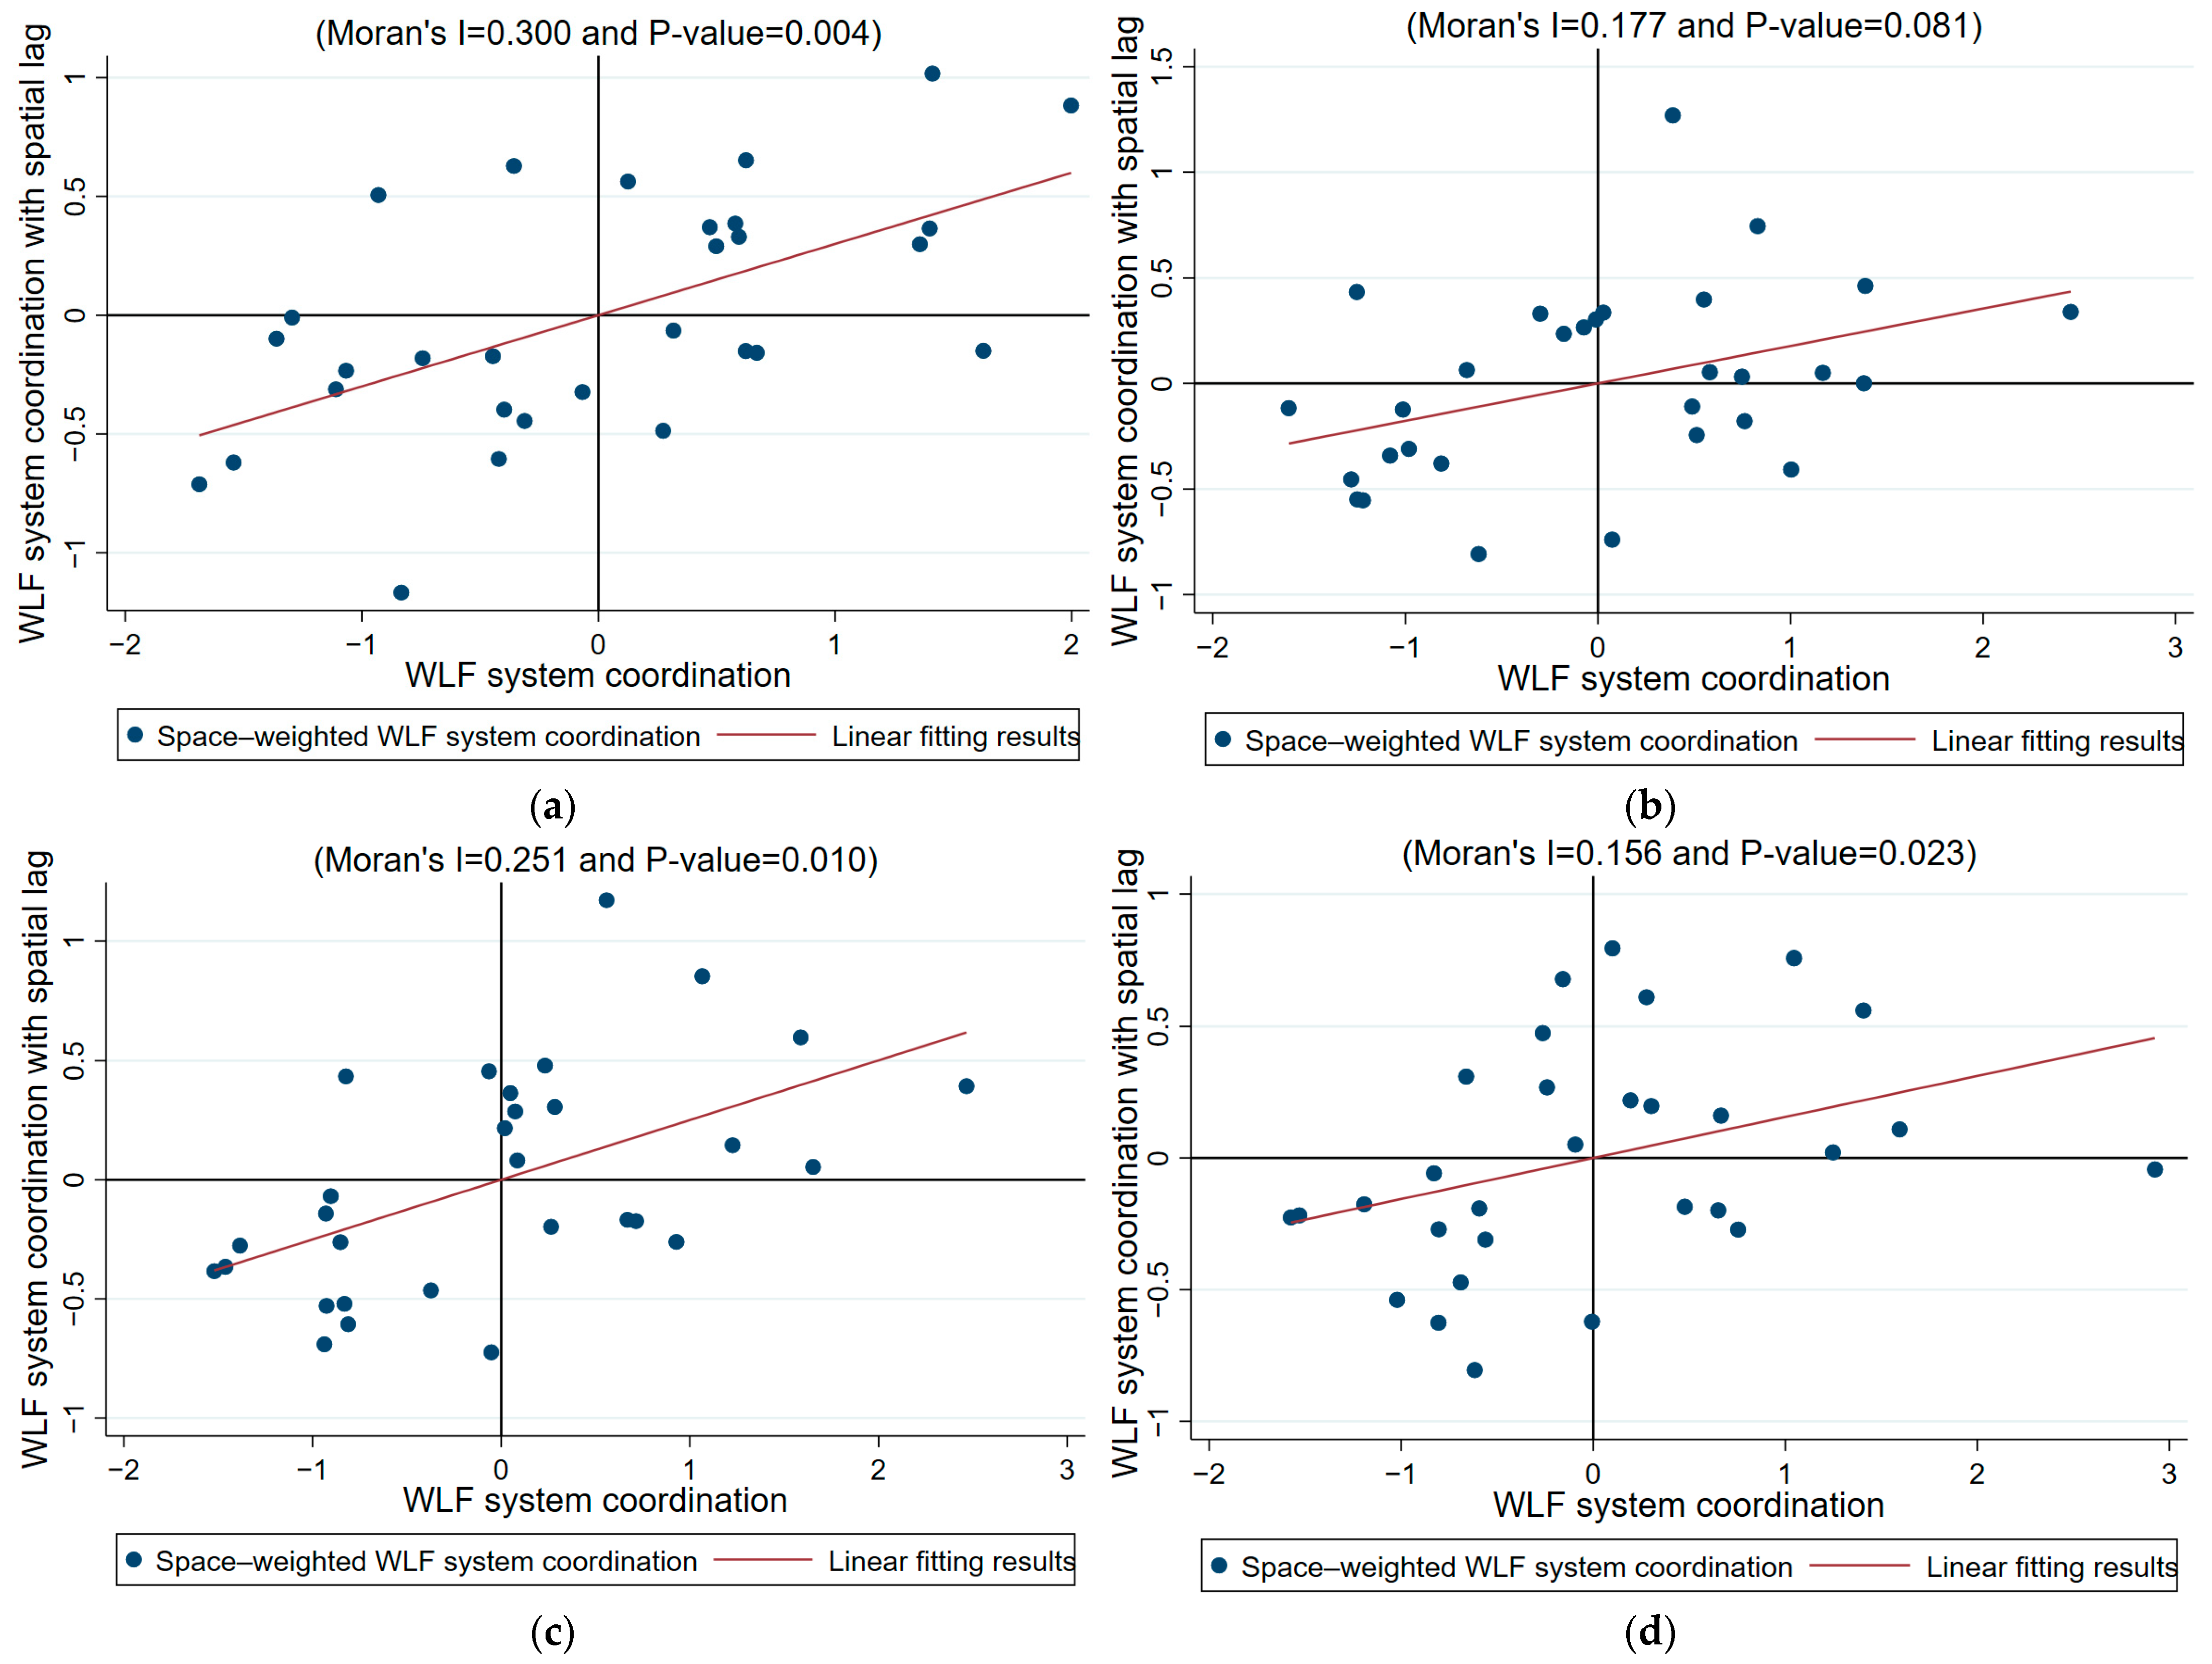
To aid in the analysis, this study created scatter plots depicting the spatial distribution of WLF system coordination for the years 2005, 2010, 2015, and 2020 (see Figure 2). The analysis of these figures revealed that, within the specified time frame, the spatially weighted coordination values for the majority of the provinces were positioned in the first and third quadrants. This pattern was further supported by the fitting results, which also intersected with these quadrants. The results suggest a substantial positive global spatial correlation in the coordination of the WLF system across 30 provincial-level regions in China from 2003 to 2020, accompanied by a notable spatial clustering effect. In other words, provinces with higher levels of WLF system coordination tended to be geographically clustered, while those with lower coordination were similarly situated near each other. Therefore, spatial econometric models should be incorporated into the analysis to account for spatial effects, thereby addressing potential measurement biases in models that ignore geospatial distribution factors.
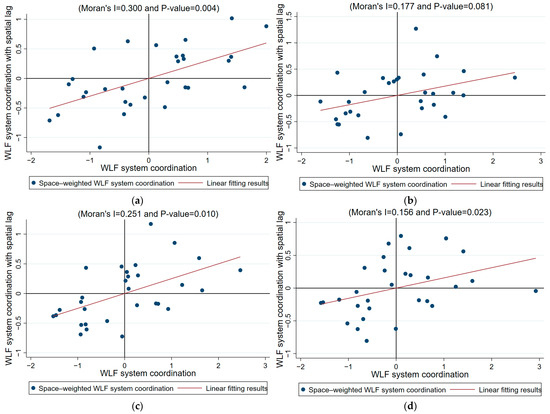
Figure 2.
Moran’s I index scatter plot for the coordination of the water–land–food system in China. (a) Scatterplot of Moran’s I in 2005, (b) scatterplot of Moran’s I in 2010, (c) scatterplot of Moran’s I in 2015, (d) scatterplot of Moran’s I in 2020.
3.2. Empirical Examination of How the Food Import Competition Effect Influences WLF System Coordination in China
As shown in Table 5, the model estimation (based on Equation (6)) investigated the influence of the food import competition effect on the coordination of the WLF system. The results in column (1) present the regression of the control variables on the WLF system coordination, which served as a reference for the subsequent models. The findings in column (2) revealed that the food import competition effect on the coordination of the WLF system was statistically significant at the p < 1% level, with a coefficient of 0.002. This implies that as the food import competition effect increases, the coordination of the WLF system decreases by 0.002.
Table 5.
Regression results of the baseline model showing the impact of land cost competition on the coordination of the water–land–food system.
To address the potential endogeneity issue, the study used “farm size” as an instrumental variable. Column (3) shows the validity test of this instrumental variable, where the F-value from the first-stage estimation is 13.53, significantly above the threshold of 10 for weak instruments. Furthermore, the Wald test for endogeneity was statistically significant at the p < 1% level, confirming that the food import competition effect was endogenous. Thus, “farm size” was considered an appropriate instrumental variable for this analysis. The results from the two-stage regression analysis in column (3) indicate that the food import competition effect on WLF system coordination was significant at the p < 1% level, with a coefficient of 0.023. This finding emphasizes that competition from food imports positively influenced the system coordination.
Considering the potential time lag in the food import competition effect on WLF system coordination, the first-order lag term of food import competition effect was incorporated into the model (Equation (7)). The results in column (4) show that the impact of food import competition was statistically significant at the p < 5% level, with a coefficient of 0.002. This suggests that a one-unit increase in food import competition effect would lead to a 0.002-unit increase in WLF system coordination in the subsequent year, indicating a delayed effect.
Additionally, the accuracy of parameter estimation is closely linked to a model specification. If the relationship between the food import competition effect and system coordination is nonlinear, the regression results might be erroneous. In such cases, non-parametric bootstrap estimation (with 1000 resamples) is employed to test the robustness of the baseline model. The results of this non-parametric analysis are shown in column (4) of Table 5, where the food import competition effect on system coordination was found to be significant at the p < 1% level, with a coefficient of 0.002. This reaffirmed that the food import competition effect enhanced coordination in the WLF system of China. Furthermore, the baseline model’s findings remained robust.
Finally, as shown in column (6), the quadratic term of food import competition effect on system coordination was significant at the p < 1% level, with a coefficient of −0.0002. This suggests that the relationship between the food import competition effect and WLF system coordination follows an “inverted U-shape” pattern, as indicated by Equation (8). The competitive effect of food imports on domestic and foreign food production, caused by food imports, has an optimal value (when the area of land saved by food imports reaches 1.5 million hectares), which will lead to the strongest WLF system coordination. Beyond this threshold, an excessively strong competitive effect may hit the food industry in the importing country, causing the WLF system coordination to decrease rather than increase.
3.2.1. Analysis of the Variations in the Competitive Impacts of Food Imports on the Coordination of the WLF System
To further investigate the regional differences in how the food import competition effect influences WLF system coordination, the sample was divided into northern and southern regions based on their regional characteristics (see Table 6). The regression outcomes for the northern region are presented in columns (1) to (4), with column (1) showing the results of the control variables’ impact on WLF system coordination. As observed in columns (2) to (4), the influence of the food import competition effect on the coordination of the WLF system in the northern region was generally not statistically significant, which contrasts with the results obtained from the full sample. In the case of the southern region, the regression results are shown in columns (5) to (8), with column (5) presenting the effect of the control variables on WLF system coordination. As seen in columns (6) to (8), the results from the baseline regression model, the inclusion of instrumental variables, and the incorporation of a first-order lag term for the impact of the food import competition effect demonstrated a positive and statistically significant effect of the food import competition effect on WLF system coordination, aligning with the findings from the full sample regression.
Table 6.
Regional differences in the effect of land cost competition on the coordination of water–land–food systems in the north and south.
Additionally, significant differences in food production characteristics may exist between regions that are primary food producers and those that are not. This study classified the sample into two groups—primary food-producing and non-primary food-producing regions—based on the characteristics of the respective production areas for further analysis, as shown in Table 7. The regression results for the primary food-producing regions are presented in columns (1)–(4), with column (1) displaying the regression of the control variables on the coordination of the WLF system. As observed in columns (2)–(4), the regression results from the baseline model, the incorporation of instrumental variables, and the inclusion of the first-order lag term of the competitive food imports effect revealed that the impact of the food import competition effect significantly and positively influenced WLF system coordination. These results align with those from the full sample, although the coefficient magnitude may vary. The regression results for the non-primary food-producing regions are shown in columns (5)–(8), with column (5) presenting the regression of the control variables on system coordination. As indicated in columns (6)–(8), the results from the baseline regression model, the inclusion of instrumental variables, and the first-order lagged term of the food import competition effect showed that the food import competition effect on WLF system coordination was statistically insignificant in the non-food-producing regions. This contrasts sharply with the regression results for the full sample. The positive impact of the food import competition effect on the coordination of the WLF system was more pronounced in primary food-producing regions compared to non-primary food-producing regions.
Table 7.
Differences in the impact of land cost competition on the coordination of the water–land–food system across various production regions.
3.2.2. Spatial Spillovers from the Effects of the Food Import Competition Effect Affecting the Coordination of WLF Systems
As shown in column (1) of Table 8 (based on Equation (9)), the coefficient for the impact of the food import competition effect on WLF system coordination was statistically significant at the 5% level, with a value of 0.001. Additionally, the results in column (2) revealed that when accounting for the influence of the food import competition effect from other regions, the coefficient increased to 0.004, which was significant at the 1% level. This suggests that models that do not incorporate spatial effects underestimate the magnitude of the positive impact of the food import competition effect on the coordination of the WLF system.
Table 8.
Spatial Durbin model of the effect of land cost competition on water–land–food system coordination.
It is clear that the dynamic spatial panel Durbin model is not a simple linear regression model. As a result, the coefficients obtained did not directly represent the marginal effects of the food import competition effect on the coordination of the WLF system. To gain a more comprehensive understanding, it was essential to decompose these estimated coefficients into direct, indirect, and total effects using partial differentiation techniques (refer to Table 9).
Table 9.
Results of the spatial spillover effect decomposition of land cost competition on water–land–food system coordination.
The results of the direct effect decomposition showed that the immediate impact of the food import competition effect on WLF system coordination was statistically significant at the 5% level, with a coefficient of 0.001. This suggests that, after considering the feedback effect (according to which the food import competition effect in one region influences the coordination of the WLF system in neighboring regions, which in turn affects the local coordination), a one-unit increase in food import competition effect will lead to a 0.001-unit rise in the coordination of the region’s WLF system.
As regards the indirect effect, the decomposition revealed that the short-term influence of the food import competition effect on neighboring regions’ WLF system coordination was statistically significant at the 1% level, with a coefficient of 0.004. This implies that for every unit increase in the food import competition effect within a region, there will be a corresponding 0.004-unit increase in the coordination of the WLF system in neighboring regions.
Lastly, the total effect decomposition analysis indicated that the overall short-term impact of the food import competition effect on WLF system coordination was highly significant at the 1% level, with a coefficient of 0.006. This suggests that an increase in the food import competition effect in one region will result in a 0.006-unit rise in WLF system coordination, both within the region and in adjacent areas.
The findings of the present study indicate that an augmentation in the competitive effect of food imports in a region will engender an enhancement in the coordination of the WLF system in that region as well as in neighboring regions.
3.2.3. Path Test to Assess the Impact of Competitive Food Imports on the Coordination of WLF Systems
This study employed the bootstrap mediation test, which does not impose constraints on the sampling distribution and offers strong statistical reliability, to examine the pathways through which the food import competition effect influences the coordination of the WLF system. The findings indicated that the mediating effect of land use efficiency in the relationship between the food import competition effect and WLF system coordination was 0.001. Additionally, the results from both the skewness-corrected test and the percentile test, with their 95% confidence intervals not containing zero, confirmed the presence of this mediating effect (see Table 10).
Table 10.
Mediating mechanism test results for the impact of food import competition on water–land–food system coordination.
4. Discussion and Conclusions
4.1. Discussion
The present study is an erudite piece of research that defines and quantifies the concept of food import competition effect based on the competition effect of trade promotion in the new trade theory. It combined the symbiosis theory and the PSIR model to construct a WLF system coordination measurement index system and used the entropy weight–TOPSIS method. Meanwhile, it used the GML index to measure land efficiency for food production. This research examined the relevance of the competition effect driven by trade within the context of the food trade sector, provides new insights into the mechanism of adjusting from the food import side to drive the optimization of the food production side in importing countries, and expands the scope of research on the welfare effects of the food import trade. The following conclusions are drawn:
Firstly, the ramifications of food imports on the WLF system are multifaceted, giving rise to a number of complex competitive effects. The scale of food imports, particularly soybean and maize, has expanded significantly, bringing in food with lower virtual land content compared to that of domestic production. This has created import competition, significantly impacting the domestic food market. Due to China’s limited per capita land, technological innovation in food production has been driven to optimize land use. Trade thus promotes domestic food production through a combination of competition and technological innovation. This results in improved production efficiency, land conservation, reduced production inputs, and decreased pollutant emissions, enhancing the sustainability and stability of land resources for food production. The coordination of the system improves, with land efficiency playing a key role. However, when the virtual land saved by the competition effect exceeds 1.5 million hectares, the situation reverses. Initially, competition helps eliminate water-inefficient producers, but excessive competition floods the Chinese market with international food products, rendering the market’s self-regulation ineffective. In this case, the elimination of inefficient producers is not only a result of market forces but also due to the price system’s limitations, which hinder producers with relatively high land use efficiency.
The positive impact of the food import competition effect on the coordination of the WLF system was more pronounced in the southern region compared to the northern region. This difference can be attributed to the significantly larger scale of food production and operations in the north, where the effect of food imports on large-scale farming is less pronounced through trade-promoting competition. Additionally, the northern region exhibits a higher level of land efficiency for food production, meaning that the marginal benefits of food imports—especially through technological innovations—are relatively small. In contrast, the southern region, with its smaller scale of food production and lower efficiency, experiences a more substantial impact from food imports. This is primarily because the southern region imports larger quantities of food with lower virtual land content, which helps eliminate less efficient and smaller-scale producers. This process promotes larger, more efficient food production and encourages the adoption of large-scale farming practices. Furthermore, this shift facilitates the development of production support services in the southern region, promoting specialization in food production through both horizontal and vertical divisions of labor. It also enables a more precise input of resources, reducing redundancies in factor inputs like land. As a result, the stability, sustainability, and suitability of land for food production improve, thereby boosting the coordination of the WLF system in China.
Moreover, the positive impact of the food import competition effect on the coordination of the WLF system was stronger in primary food-producing regions than in non-primary food-producing regions. This can be partly explained by the advanced development of livestock farming in key food-producing areas, which increases the demand for feed crops like soybean and maize. The expansion of soybean and corn imports, bringing in agricultural products with lower virtual land content compared to that of domestic production, significantly impacts the food market in these regions, generating a strong trade competition effect. At the same time, the substitution effect from the influx of imported food products has led to greater specialization in domestic food production. This specialization has fostered expertise in planting and crop management, promoting a more scientific approach to field management and improving food production efficiency, while reducing losses from changes in production activities. In contrast, the demand for land in primary food-producing regions exceeds that in the southern regions, and the pressure on land resources is rising due to economic and social development. This results in a continued high pressure on land for food production. Consequently, driven by technological innovation, food production technology has advanced to conserve land resources, thereby improving land resource allocation efficiency for food production.
Fourthly, the repercussions of competitive food imports on the coordination of the WLF system are subject to spatial spillovers. The issue of food distribution among provincial administrative regions must be given due consideration. The importation of food products from one region may result in market domination, leading to a partial dispatch to neighboring regions. This, in turn, has the potential to impact the land efficiency for food production in these regions, thereby affecting the coordination of the WLF system in the neighboring regions. Food commodities exhibit a certain degree of mobility, attributable to disparities in the production costs between imported and domestic food products in various regions. This, coupled with discrepancies in food supply and demand, facilitates the deployment of imported food products within peripheral regions. Consequently, this dynamic impacts the food production landscape in these areas [22,61]. Conversely, the influx of food imports engenders a demonstration effect, wherein a region addresses the discrepancy between food supply and demand through import trade, thereby alleviating pressure on water resources and creating a conducive environment for accelerated economic and social development. The influence of policies and profits on the behavior of governments and food enterprises in neighboring regions is such that the structure, quantity, and sources of food imports in these regions are affected [62]. This, in turn, affects the efficiency of the use of food production resources in neighboring regions and, ultimately, the region’s WLF system coordination.
4.2. Policy Implications
The conclusions of this study present several key recommendations for improving the coordination of China’s WLF system, with particular emphasis on food import diversification, land tenure, and land use efficiency. To enhance China’s WLF system coordination, it is recommended that China increase the diversity of its food import sources while optimizing land efficiency for food production. Currently, China’s food imports are heavily reliant on markets in the United States, Brazil, and Argentina, which concentrate virtual land imports. Given the growing risks of extreme weather and trade barriers, diversifying food import sources will better safeguard China’s food security. The government should promote the development of diversified import channels, focusing on countries with higher food production land efficiency (i.e., those with lower virtual land content). This strategy will not only reduce food trade risks but also improve domestic land efficiency for food production.
In line with this, China should also increase food imports, particularly soybean and maize, from countries with a lower virtual land content, such as Turkey, Italy, Canada, and Brazil. This strategy is expected to enhance the food import competition effect, thus improving land efficiency in food production. However, it is equally important to recognize that land tenure and land use are fundamental in determining land efficiency. Policies connecting land tenure to land restoration practices will be crucial in ensuring the long-term sustainability and productivity of agricultural land.
Land tenure reform, especially in rural areas, should be a priority, as secure land tenure encourages long-term investments and the adoption of sustainable agricultural practices [63]. By supporting land restoration initiatives, promoting technological innovations in farming, and incentivizing an efficient land use, China can enhance land productivity while protecting the environment. In particular, areas with lower land efficiency, such as southern China, stand to benefit from both the competitive effects of food imports and targeted technological advancements that improve land use practices [64].
Ultimately, a comprehensive policy approach that integrates food import diversification, land tenure security, and technological innovation will improve the coordination of China’s WLF system, supporting food security and sustainable agricultural practices.
4.3. Limitations of the Study and Future Perspectives
This study has several limitations that warrant further exploration. First, the analysis was focused on China, limiting the generalizability of the findings. Future research could extend this approach to other countries with different agricultural systems to test the universality of the food import competition effect. Second, the socio-economic impacts of food imports, such as effects on farmers’ livelihoods and food price volatility, were not examined in depth and should be considered in future studies.
Another limitation is the exclusion of emerging agricultural technologies, such as precision farming, which could enhance land efficiency. Future research could explore how technological advancements influence WLF system coordination and land efficiency. Moreover, the study did not address regional variations within China, where the impact of food imports may differ significantly across regions. A regional analysis could provide deeper insights into the spatial dynamics of food trade and production.
Lastly, future studies could incorporate more comprehensive data, including the environmental impacts of food imports, and explore the role of policy interventions in improving land use efficiency and food security. Expanding research in these areas will enhance the understanding of the WLF system and provide valuable insights for policy-making.
Author Contributions
Z.L.: methodology, investigation, writing—original draft. W.Y.: conceptualization, writing—review and editing. C.Z.: proofreading and editing. All authors have read and agreed to the published version of the manuscript.
Funding
The paper was supported by the “Startup Fund for Advanced Talents of Putian University” (grant number: 2024157).
Institutional Review Board Statement
Not applicable.
Data Availability Statement
The data presented in this study are available from the China Bureau of Statistics.
Acknowledgments
The authors would like to thank the anonymous reviewers for their constructive comments and suggestions.
Conflicts of Interest
The authors declare no conflicts of interest.
References
- Davidson, W.H. Factor Endowment, Innovation and International Trade Theory. Kyklos 1979, 32, 764–774. [Google Scholar] [CrossRef]
- Michael, S. Product Selection, Fixed Costs, and Monopolistic Competition. Rev. Econ. Stud. 1976, 43, 217–235. [Google Scholar]
- Krugman, P.R. Increasing returns, monopolistic competition, and international trade. J. Int. Econ. 1979, 9, 469–479. [Google Scholar] [CrossRef]
- Melitz, M.J. The Impact of Trade on Intra-industry Reallocations and Aggregate Industry Productivity. Econometrica 2003, 71, 1695–1725. [Google Scholar] [CrossRef]
- Feenstra, R.C. Alternative Sources of the Gains from International Trade: Variety, Creative Destruction, and Markups. J. Econ. Perspect. 2018, 32, 25–46. [Google Scholar] [CrossRef]
- Arkolakis, C.; Costinot, A.; Donaldson, D.; Rodríguez-Clare, A. The Elusive Pro-Competitive Effects of Trade. Soc. Sci. Electron. Publ. 2019, 86, 46–80. [Google Scholar]
- Huang, H.; Lampe, M.V.; Tongeren, F.V. Climate change and trade in agriculture. Food Policy 2011, 36, S9–S13. [Google Scholar] [CrossRef]
- Qiang, W.L.; Niu, S.W.; Liu, A.M.; Kastner, T.; Bie, Q.; Wang, X.; Cheng, S.K. Trends in global virtual land trade in relation to agricultural products. Land Use Policy 2020, 92, 104439. [Google Scholar] [CrossRef]
- Liu, W.; Yang, H.; Ciais, P.; Kummu, M.; Hoekstra, A.Y. China’s Food Supply Sources Under Trade Conflict with the United States and Limited Domestic Land and Water Resources. Earth’s Future 2020, 8, e2020EF001482. [Google Scholar] [CrossRef]
- Yawson, D.O. Estimating virtual water and land use transfers associated with future food supply: A scalable food balance approach. MethodsX 2020, 7, 100811. [Google Scholar] [CrossRef]
- Cao, C.; Yuan, G.J. Foreign trade and virtual land resources: A case study of China’s grain. Agric. Econ. Zemed. Ekon. 2022, 68, 259–270. [Google Scholar] [CrossRef]
- Ni, G.H.; Teng, M.; Su, B.; Chen, Z.L. Impact of political relationships on virtual land flow from China’s food trade. Socioecon. Plan. Sci. 2024, 96, 102085. [Google Scholar] [CrossRef]
- Zhao, D.D.; Hubacek, K.; Feng, K.S.; Sun, L.X.; Liu, J.G. Explaining virtual water trade: A spatial-temporal analysis of the comparative advantage of land, labor and water in China. Water Res. 2019, 153, 304–314. [Google Scholar] [CrossRef] [PubMed]
- Luo, L.; Xing, Z.C.; Chu, B.W.; Zhang, H.B.; Wang, H.K. Virtual land trade and associated risks to food security in China. Environ. Impact Assess. Rev. 2024, 106, 107461. [Google Scholar] [CrossRef]
- Raza, D.; Shu, H.; Ehsan, M.; Fan, H.; Abdelrahman, K.; Aslam, H.; Quddoos, A.; Aslam, R.W.; Nazeer, M.; Fnais, M.S.; et al. Evaluation of agriculture land transformations with socio-economic influences on wheat demand and supply for food sustainability. Cogent Food Agric. 2025, 11, 2448597. [Google Scholar] [CrossRef]
- Weijiao, Y.; Ziqiang, L. Will the Grain Imports Competition Effect Reverse Land Green Efficiency of Grain Production? Analysis Based on Virtual Land Trade Perspective. Agriculture 2023, 13, 2220. [Google Scholar] [CrossRef]
- Meier, T.; Christen, O.; Semler, E.; Jahreis, G.; Voget-Kleschin, L.; Schrode, A.; Artmann, M. Balancing virtual land imports by a shift in the diet. Using a land balance approach to assess the sustainability of food consumption. Germany as an example. Appetite 2014, 74, 20–34. [Google Scholar] [CrossRef]
- Duro, J.A.; Lauk, C.; Kastner, T.; Erb, K.H.; Haberl, H. Global inequalities in food consumption, cropland demand and land-use efficiency: A decomposition analysis. Glob. Environ. Change Hum. Policy Dimens. 2020, 64, 102124. [Google Scholar] [CrossRef]
- Hemerijckx, L.M.; De Vos, K.; Kaunda, J.O.; Van Rompaey, A. Future scenarios for urban agriculture and food security in sub-Saharan Africa: Modelling the urban land-food system in an agent-based approach. Comput. Environ. Urban Syst. 2025, 118, 102258. [Google Scholar] [CrossRef]
- Li, Z.M.; Fu, W.; Luo, M.C.; Chen, J.C. The Coupling Coordination between the Competitiveness Level and Land Use Efficiency of Green Food Industry in China. Land 2022, 11, 2116. [Google Scholar] [CrossRef]
- Wang, Y.B.; Wang, H.Q.; Sun, J.X.; Qi, P.; Zhang, W.G.; Zhang, G.X. Spatially optimized allocation of water and land resources based on multi-dimensional coupling of water quantity, quality, efficiency, carbon, food, and ecology. Agric. Water Manag. 2025, 309, 109340. [Google Scholar] [CrossRef]
- Lu, L.C.; Chiu, S.Y.; Chiu, Y.H.; Chang, T.H. Three-stage circular efficiency evaluation of agricultural food production, food consumption, and food waste recycling in EU countries. J. Clean. Prod. 2022, 343, 109340. [Google Scholar] [CrossRef]
- Chen, Q.; Xie, H. Temporal-Spatial Differentiation and Optimization Analysis of Cultivated Land Green Utilization Efficiency in China. Land 2019, 8, 158. [Google Scholar] [CrossRef]
- Ding, T.H.; Chen, J.F. Evaluation and obstacle factors of coordination development of regional water-energy-food-ecology system under green development: A case study of Yangtze River Economic Belt, China. Stoch. Environ. Res. Risk Assess. 2021, 36, 25–34. [Google Scholar] [CrossRef]
- Niu, S.D.; Lyu, X.; Gu, G.Z. A New Framework of Green Transition of Cultivated Land-Use for the Coordination among the Water-Land-Food-Carbon Nexus in China. Land 2022, 11, 933. [Google Scholar] [CrossRef]
- Yaqoob, N.; Jain, V.; Atiq, Z.; Sharma, P.; Ramos-Meza, C.S.; Shabbir, M.S.; Tabash, M.I. The relationship between staple food crops consumption and its impact on total factor productivity: Does green economy matter? Environ. Sci. Pollut. Res. Int. 2022, 29, 69213–69222. [Google Scholar] [CrossRef]
- Zhai, X.J.; Wang, H.T.; Kou, C.H.; Ma, G.F.; Lin, H. Influence of Environmental Regulation on Cooperative Game in Green Food Industrial Supply Chain. J. Environ. Prot. Ecol. 2021, 22, 724–734. [Google Scholar]
- Osei-Owusu, A.K.; Kastner, T.; Ruiter, H.D.; Thomsen, M.; Caro, D. The global cropland footprint of Denmark’s food supply 2000–2013. Glob. Environ. Change 2019, 58, 101978. [Google Scholar] [CrossRef]
- Maroufpoor, S.; Haddad, O.B.; Maroufpoor, E.; Singh, V.P. Optimal virtual water flows for improved food security in water-scarce countries. Sci. Rep. 2021, 11, 2102. [Google Scholar] [CrossRef]
- Cai, B.M.; Hubacek, K.; Feng, K.S.; Zhang, W.; Wang, F.; Liu, Y. Tension of Agricultural Land and Water Use in China’s Trade: Tele-Connections, Hidden Drivers and Potential Solutions. Environ. Sci. Technol. 2020, 54, 5365–5375. [Google Scholar] [CrossRef]
- Masud, M.B.; Wada, Y.; Goss, G.; Faramarzi, M. Global implications of regional grain production through virtual water trade. Sci. Total Environ. 2019, 659, 807–820. [Google Scholar] [CrossRef] [PubMed]
- Chartres, C.J.; Noble, A. Sustainable intensification: Overcoming land and water constraints on food production. Food Secur. 2015, 7, 235–245. [Google Scholar] [CrossRef]
- Elagib, N.A.; Al-Saidi, M. Balancing the benefits from the water–energy–land–food nexus through agroforestry in the Sahel. Sci. Total Environ. 2020, 742, 140509. [Google Scholar] [CrossRef] [PubMed]
- Li, Z.; Ye, W.; Jiang, H.; Song, H.; Zheng, C. Impact of the eco-efficiency of food production on the water-land-food system coordination in China: A discussion of the moderation effect of environmental regulation. Sci. Total Environ. 2023, 857, 159641. [Google Scholar] [CrossRef]
- Clothier, B.; Jovanovic, N.; Zhang, X. Reporting on water productivity and economic performance at the water-food nexus. Agric. Water Manag. 2020, 237, 106123. [Google Scholar] [CrossRef]
- Deng, C.X.; Zhang, G.J.; Li, Z.W.; Li, K. Interprovincial food trade and water resources conservation in China. Sci. Total Environ. 2020, 737, 139651. [Google Scholar] [CrossRef] [PubMed]
- Sun, S.K.; Lu, Y.J.; Gao, H.; Jiang, T.T.; Du, X.Y.; Shen, T.X.; Wu, P.T.; Wang, Y.B. Impacts of food wastage on water resources and environment in China. J. Clean. Prod. 2018, 185, 732–739. [Google Scholar] [CrossRef]
- Siciliano, G.; Rulli, M.C.; D’Odorico, P. European large-scale farmland investments and the land-water-energy-food nexus. Adv. Water Resour. 2017, 110, 579–590. [Google Scholar] [CrossRef]
- Ofori, S.A.; Cobbina, S.; Obiri, S. Climate Change, Land, Water, and Food Security: Perspectives from Sub-Saharan Africa. Front. Sustain. Food Syst. 2021, 5, 680924. [Google Scholar] [CrossRef]
- Kebede, A.S.; Nicholls, R.J.; Clarke, D.; Savin, C.; Harrison, P.A. Integrated Assessment of the Food-Water-Land-Ecosystems Nexus in Europe: Implications for Sustainability. Sci. Total Environ. 2021, 768, 144461. [Google Scholar] [CrossRef]
- Ringler, C.; Bhaduri, A.; Lawford, R. The nexus across water, energy, land and food (WELF): Potential for improved resource use efficiency? Curr. Opin. Environ. Sustain. 2013, 5, 617–624. [Google Scholar] [CrossRef]
- Lee, S.H.; Mohtar, R.; Yoo, S. Assessment of food trade impacts on water, food, and land security in the MENA region. Hydrol. Earth Syst. Sci. 2018, 1, 557–572. [Google Scholar] [CrossRef]
- Psomas, A.; Vryzidis, I.; Spyridakos, A.; Mimikou, M. MCDA approach for agricultural water management in the context of water–energy–land–food nexus. Oper. Res. 2018, 21, 689–723. [Google Scholar] [CrossRef]
- Karabulut, A.A.; Crenna, E.; Sala, S.; Udias, A. A proposal for integration of the ecosystem-water-food-land-energy (EWFLE) nexus concept into life cycle assessment: A synthesis matrix system for food security. J. Clean. Prod. 2018, 172, 3874–3889. [Google Scholar] [CrossRef]
- Yilin, L.; La, Z.; Varis, O.; Kai, F.; Gang, L.; Pute, W. Enhancing water and land efficiency in agricultural production and trade between Central Asia and China. Sci. Total Environ. 2021, 780, 146584. [Google Scholar] [CrossRef]
- Taherzadeh, O.; Caro, D. Drivers of water and land use embodied in international soybean trade. J. Clean. Prod. 2019, 223, 83–93. [Google Scholar] [CrossRef]
- Cai, B.M.; Feng, K.S.; Zhang, W.; Liu, Y.; Wang, F.; Hubacek, K. Mitigating trade-driven water scarcity via water-saving irrigation in China: Different role of surface water and groundwater. Resour. Conserv. Recycl. 2024, 205, 107570. [Google Scholar] [CrossRef]
- Yang, H.; Wang, L.; Abbaspour, K.C.; Zehnder, A.J.B. Virtual water trade: An assessment of water use efficiency in the international food trade. Hydrol. Earth Syst. Sci. 2006, 10, 443–454. [Google Scholar] [CrossRef]
- Lamastra, L.; Miglietta, P.P.; Toma, P.; De Leo, F.; Massari, S. Virtual water trade of agri-food products: Evidence from Italian-Chinese relations. Sci. Total Environ. 2017, 599, 474–482. [Google Scholar] [CrossRef]
- Konar, M.; Dalin, C.; Suweis, S.; Hanasaki, N.; Rinaldo, A.; Rodriguez-Iturbe, I. Water for food: The global virtual water trade network. Water Resour. Res. 2011, 47, W05520. [Google Scholar] [CrossRef]
- Oh, D.H. A global Malmquist-Luenberger productivity index. J. Product. Anal. 2010, 34, 183–197. [Google Scholar] [CrossRef]
- Quispel, A. Some theoretical aspects of symbiosis. Antonie Leeuwenhoek 1951, 17, 69–80. [Google Scholar] [CrossRef]
- Ren, D.D.; Yang, Y.H.; Yang, Y.M.; Richards, K.; Zhou, X.Y. Land-Water-Food Nexus and indications of crop adjustment for water shortage solution. Sci. Total Environ. 2018, 626, 11–21. [Google Scholar] [CrossRef] [PubMed]
- Han, C.H.; Han, X.T.; Ma, B.; Li, D.; Wang, Z.F.; Hao, Z.L.; Zhang, X.Y. Research on the Coupling Coordination Relationship and Spatial Equilibrium Measurement of the Water-Energy-Food Nexus System in China. Water 2025, 17, 527. [Google Scholar] [CrossRef]
- Wang, Y.R.; Song, J.X.; Li, Q.; Jiang, X.H. Exploration of the development of water-energy-food nexus and its endogenous and exogenous drivers in the Yellow River Basin, China. J. Environ. Manag. 2025, 378, 124735. [Google Scholar] [CrossRef]
- Yan, X.; Jiang, D.; Fu, J.; Hao, M. Assessment of Sweet Sorghum-Based Ethanol Potential in China within the Water–Energy–Food Nexus Framework. Sustainability 2018, 10, 1046. [Google Scholar] [CrossRef]
- Zou, Z.H.; Yi, Y.; Sun, J.N. Entropy method for determination of weight of evaluating indicators in fuzzy synthetic evaluation for water quality assessment. J. Environ. Sci. 2006, 18, 1020–1023. [Google Scholar] [CrossRef]
- Shih, H.S.; Shyur, H.J.; Lee, E.S. An extension of TOPSIS for group decision making. Math. Comput. Model. 2007, 45, 801–813. [Google Scholar] [CrossRef]
- Sun, L.Y.; Miao, C.L.; Yang, L. Ecological-economic efficiency evaluation of green technology innovation in strategic emerging industries based on entropy weighted TOPSIS method. Ecol. Indic. 2017, 73, 554–558. [Google Scholar] [CrossRef]
- Qi, Y.Y.; Farnoosh, A.; Lin, L.; Liu, H. Coupling coordination analysis of China’s provincial water-energy-food nexus. Environ. Sci. Pollut. Res. 2022, 29, 23303–23313. [Google Scholar] [CrossRef]
- Olayungbo, D.O. Global oil price and food prices in food importing and oil exporting developing countries: A panel ARDL analysis. Heliyon 2021, 7, e06357. [Google Scholar] [CrossRef] [PubMed]
- Hanyuan, J.; Ciwen, Z. Will the structure of food imports improve China’s water-intensive food cultivation structure? A spatial econometric analysis. Water 2023, 15, 2800. [Google Scholar] [CrossRef]
- Cai, B.Z.; Wangda, L.; Shi, F.; Abate, M.C.; Geremew, B.; Addis, A.K. Agricultural socialized services and Chinese food security: Examining the threshold effect of land tenure change. Front. Sustain. Food Syst. 2024, 8, 1371520. [Google Scholar] [CrossRef]
- Ibrahim, H.K.; Hendriks, S.L.; Schönfeldt, H.C. The effect of land tenure across food security outcomes among smallholder farmers using a flexible conditional difference-in-difference approach. Int. J. Agric. Sustain. 2023, 21, 2220900. [Google Scholar] [CrossRef]
Disclaimer/Publisher’s Note: The statements, opinions and data contained in all publications are solely those of the individual author(s) and contributor(s) and not of MDPI and/or the editor(s). MDPI and/or the editor(s) disclaim responsibility for any injury to people or property resulting from any ideas, methods, instructions or products referred to in the content. |
© 2025 by the authors. Licensee MDPI, Basel, Switzerland. This article is an open access article distributed under the terms and conditions of the Creative Commons Attribution (CC BY) license (https://creativecommons.org/licenses/by/4.0/).