Article

Seasonal Income Effects on Financial Awareness, Capability, and Risky Behavior in Agro-Industrial MSMEs in East Java

by
Mochammad Fahlevi
1,2,*,
Aulia Luqman Aziz
3,*,
Mohammed Aljuaid
4,
Sebastian Saniuk
5 and
Sandra Grabowska
6
1
Management Department, BINUS Online, Bina Nusantara University, Jakarta 11480, Indonesia
2
Research & Management Sciences, Faculty of Business and Management, Universiti Sultan Zainal Abidin (UniSZA), Kuala Terengganu 21300, Malaysia
3
Faculty of Administrative Science, Universitas Brawijaya, Malang 65145, Indonesia
4
Department of Health Administration, College of Business Administration, King Saud University, Riyadh 11437, Saudi Arabia
5
Department of Engineering Management and Logistic Systems, University of Zielona Gora, 65-417 Zielona Gora, Poland
6
Department of Production Engineering, Silesian University of Technology, 40-019 Gliwice, Poland
*
Authors to whom correspondence should be addressed.
Agriculture 2025, 15(7), 709; https://doi.org/10.3390/agriculture15070709
Submission received: 19 February 2025 / Revised: 15 March 2025 / Accepted: 23 March 2025 / Published: 26 March 2025
(This article belongs to the Section Agricultural Economics, Policies and Rural Management)

Abstract

:
This study examines the role of financial awareness (FA), financial capability (FC), and their influence on risky financial behaviors—risky paying behavior (RPB), risky borrowing behavior (RBB), and financial goals (FGs)—among agro-industrial MSMEs in East Java. This study also explores the moderating effects of expected future financial security (EFFS) and current money management stress (CMMS) in the context of seasonal income fluctuations. This study employed a quantitative approach using structural equation modeling (SEM) with SmartPLS 4. Data were collected through surveys with 287 MSME owners in six cities/regencies in East Java, selected using a random sampling method. The research variables were measured using validated scales adapted from previous studies. FA significantly influenced FC, RPB, and RBB, whereas FC positively impacted FG. RPB had a strong positive effect on FG, whereas RBB showed no significant relationship. The mediation effect of FC between FA and FG was significant, highlighting its pivotal role in achieving FG. However, the moderating effects of EFFS and CMMS on the FC–FG relationship were not significant, suggesting their limited direct impact in this context. This study reveals the urgent need for tailored financial literacy programs that address specific issues faced by MSME owners, such as managing irregular cash flows and minimizing risky financial behavior. Financial institutions should develop accessible financial tools and products for agro-industrial MSMEs.

1. Introduction

Micro, small, and medium enterprises (MSMEs) are not only the backbone of the Indonesian economy but also reflect the social dynamics and financial resilience of millions of small business owners [1,2]. An interesting phenomenon is how agro-industrial MSMEs in East Java experience a cycle of seasonal income in one period and financial droughts in another because of seasonal income fluctuations. For example, coffee farmers in Banyuwangi enjoy a surge in income during the harvest season but face difficulties in maintaining business continuity when production declines [3]. Similarly, seafood processors in Lamongan often experience surpluses during the fishing season but face drastic drops in income during the off-season [4]. These phenomena show how unstable income patterns can lead to suboptimal financial decisions, such as reliance on short-term debt or failure, to set aside reserve funds. According to a report by the authors of [5], they faced challenges such as high interest rates, a lack of collateral, low financial literacy, and complex application processes, which often resulted in loan rejection. A survey reported in [6] in collaboration with NielsenIQ Indonesia in 2024 revealed that only 46% of MSMEs in Indonesia will fully separate business and personal finances. This lack of separation can affect cash flow and business sustainability. In addition, a report in [7] showed that two-thirds of small business owners in Indonesia had not accessed credit or loans in the past 12 months, with 62% stating that they did not need credit. This reflects the tendency to rely on self-funding, which can increase the risk of financial distress during periods of low revenue. This instability creates a major challenge for business sustainability, leaving many MSME players trapped in a cycle of seasonal incomes without effective financial awareness (FA) or financial capabilities (FCs).
MSME owners who lack financial literacy tend to neglect aspects such as product diversification and investment in technology to increase productivity, which contributes to the low sustainability of their businesses [8,9,10]. In addition, ref. [11] found that seasonal income instability increases the risk of financial behaviors, such as risky borrowing behavior (RBB) or risky paying behavior (RPB). In the context of the agro-industry in East Java, this creates additional pressure on business owners’ ability to achieve long-term financial goals (FGs). Research has extensively discussed the relationships between financial literacy, FC, and financial behavior. For example, ref. [12] asserted that financial literacy is a key factor in helping individuals manage irregular incomes and reduce the risk of financial mistakes. According to [13], good financial literacy can improve business owners’ ability to manage cash flows, although seasonal impacts remain a major challenge.
However, most of these studies are still general and do not highlight the complexity of financial behavior influenced by seasonal income in the agro-industrial sector. Empirical studies that specifically explore the relationship between financial literacy, risky financial behavior, and FG in the context of agro-industrial MSMEs are limited [11,14]. In addition, few studies have integrated concepts such as expected future financial security (EFFS) and current money management stress (CMMS) into financial behavior models. Research in [15] shows that subjective financial literacy significantly affects financial self-efficacy, which has an impact on RPB, whereas objective financial literacy and the effect of financial self-efficacy on RBB tend to be insignificant. On the other hand, Ardini et al. [16] revealed that digital financial literacy plays an important role in improving financial skills and FG, especially through the mediation of financial skills. Both studies highlight the importance of financial literacy in promoting sound financial behavior; however, a research gap remains in exploring the impact of seasonal income fluctuations on risky financial behavior, especially in the agro-industrial sector, which faces unique challenges in financial stability.
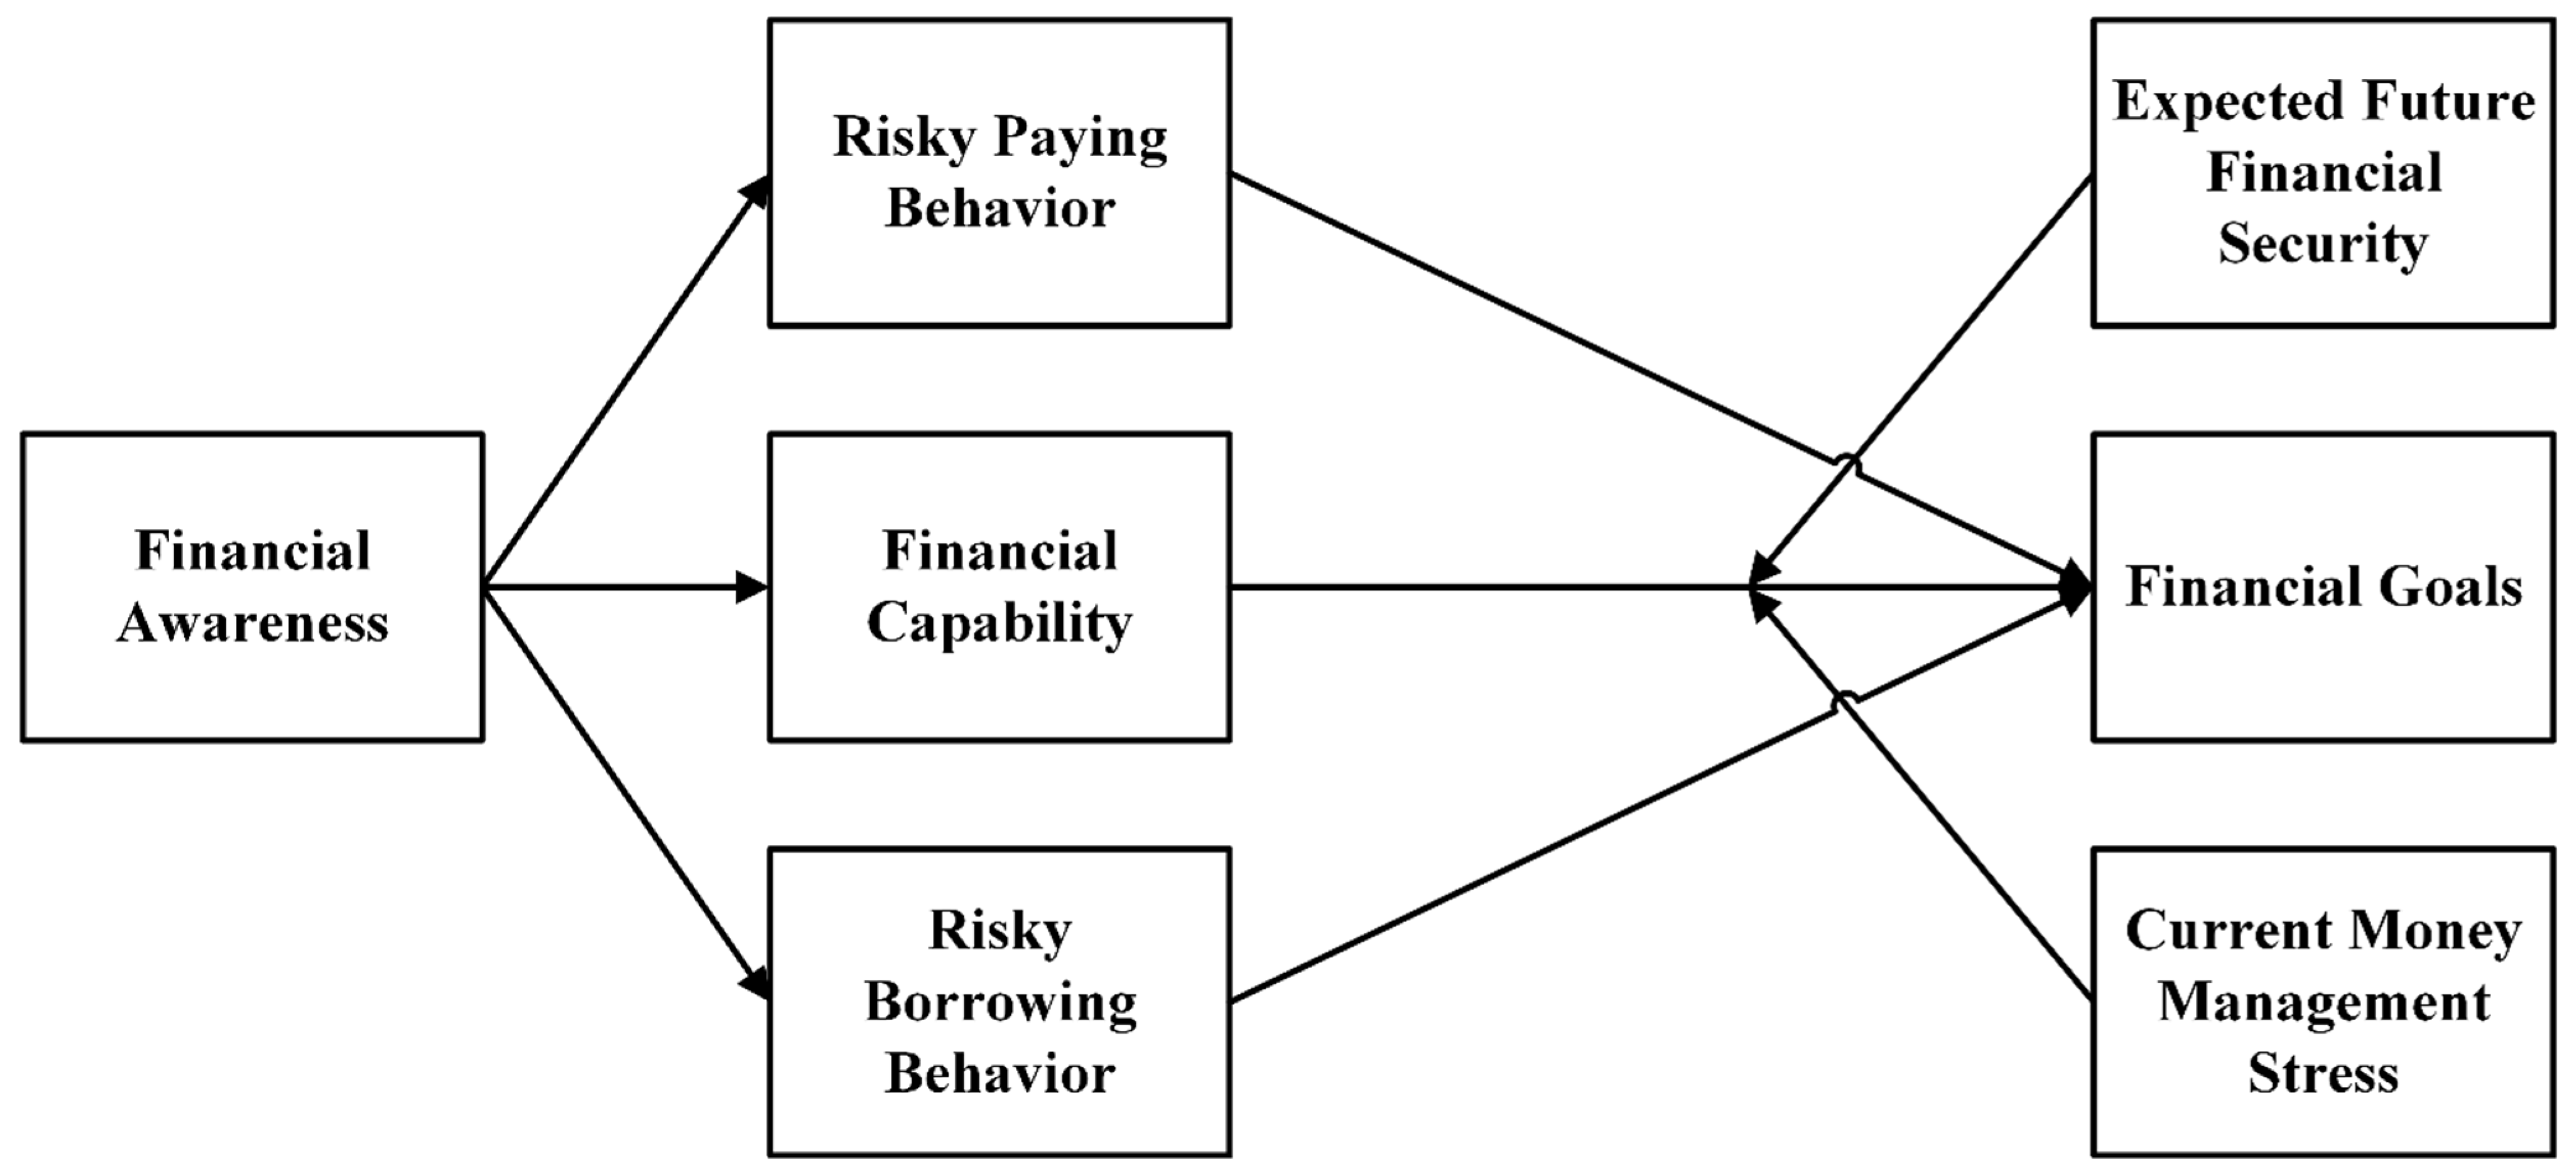
This study aims to bridge this gap by examining the interaction between FA, FC, risk, stress, and FG in the context of the seasonal income of agro-industrial MSMEs in East Java. Although financial literacy has been identified as an important factor in business management, there is a research gap in understanding how it interacts with variables, such as FC and risky financial behavior. Furthermore, most previous studies have not considered the psychological (financial) stress that business owners face due to cash flow instability. Recognizing and addressing the psychological aspects of financial stress are crucial for developing comprehensive support systems for business owners and ensuring the long-term resilience of MSMEs. This gap provides an opportunity for further exploring how FA can influence financial goals through the mediation of variables, such as FC, financial risk, and the moderation of future financial security. This approach is expected to provide a new and comprehensive model for the financial management of MSMEs, particularly in the agro-industrial context. The roles of EFFS and CMMS as moderating variables provide a new dimension in the relationship between FC and FG. EFFS reflects the extent to which business owners feel confident of their future financial stability, which may motivate them to set and achieve a more ambitious FG despite being faced with seasonal income. Meanwhile, the CMMS reflects the psychological pressure business owners experience in managing their daily cash flow and debt, which may hinder their focus on long-term FG. These two variables have the potential to strengthen or weaken the effect of FC on FG depending on how business owners manage future expectations and cope with current financial stress.
This study uncovers the complex mechanisms of these two moderators in guiding agro-industrial MSME owners’ financial decisions, particularly amid seasonal income uncertainty. This study uses the Behavioral Finance Theory (BFT) as a grand theory. This theory provides a relevant framework for understanding how psychological factors such as stress and expectations influence financial decision-making. The BFT enables an in-depth exploration of risky financial behaviors and FG, which are influenced by internal (FC) and external (seasonal income) factors. By adopting this theory, this study sheds light on the complex relationships between financial literacy, psychological factors, and financial outcomes relevant to the FG of agro-industrial MSME owners.
In Section 2, this study explains the theoretical basis used in building the research model, accompanied by an explanation of each variable and the results of previous studies. Section 3 presents the approach, measurement details, and data analysis techniques. In Section 4, the research results are presented based on the results of statistical calculations, which are quite detailed and thorough, and in-depth discussion. In Section 5, the conclusions and research implications are presented.

2. Literature Review

2.1. Behavioral Finance Theory (BFT)

Behavioral Finance Theory (BFT) is a branch of traditional finance that seeks to explain how psychological and emotional factors influence individual and business financial decision-making [16,17]. This theory came to prominence in the late 20th century as a response to the limitations of the assumptions in the Efficient Market Hypothesis [18] and the Rational Choice Theory in classical economics, which assumes that individuals always act rationally in making financial decisions [19]. The main pioneers in the development of BFT are Daniel Kahneman and Amos Tversky [20] through their Prospect Theory, which shows that individuals do not always make rational financial decisions but are more influenced by cognitive biases, risk perception, and heuristics. Richard Thaler [21] later extended this theory with the concepts of mental accounting and loss aversion, which explains how individuals categorize their finances into different categories based on emotions and personal preferences, rather than based on optimal economic principles.
The BFT recognizes that entrepreneurs and MSME owners often make decisions based on emotions, future expectations, and financial pressure rather than solely based on rational economic calculations. These decisions can be influenced by various factors such as financial stress, limited financial literacy, and optimism or pessimism towards ongoing economic conditions. Agro-industrial MSMEs in East Java face unique challenges that can lead to high financial volatility. MSME owners in this sector often exhibit financial behaviors influenced by cognitive biases, such as overconfidence bias (overconfidence in the ability to manage finances), loss aversion (unwillingness to take risks for fear of loss), and present bias (preferring short-term gains over long-term investments). This observation aligns with the findings of [22], which indicate that individuals often disregard risks when their financial circumstances are favorable. Conversely, during the off-season, many MSME owners encounter financial strain and stress, potentially resulting in impulsive financial decisions. Such decisions may include obtaining short-term loans with high interest rates or reducing business investments to sustain personal consumption. This phenomenon aligns with the concept of mental accounting, as described in [21], which elucidates how individuals allocate their financial resources into distinct categories and frequently fail to engage in efficient financial planning. The BFT underscores that business owners possessing robust EFFS are inclined to make more rational decisions in managing cash flows, whereas those experiencing CMMS are prone to making impulsive and risky decisions.

2.2. Financial Awareness (FA)

Financial awareness (FA) refers to an individual or business owner’s understanding of basic financial concepts such as budgeting, cash flow management, investing, and debt management [23]. This awareness includes the ability to understand the current financial situation, recognize future financial needs, and make informed decisions to achieve financial well-being [24]. Ref. [25] asserted that the cornerstone of financial well-being is the FA, which encompasses the comprehension of various monetary concepts, including financial inclusion and managing debt. FA is essential for business owners, particularly because of the seasonal nature of income. An effective FA enables firms to plan their finances more efficiently, identify periods of reduced cash flows, and implement proactive strategies to ensure business continuity. Existing research underscores the importance of FA in facilitating sound financial decision-making. As noted in [26], FA, as a component of financial literacy, empowers individuals to make effective and responsible financial decisions. Enhancing FA among the owners of MSME agro-industrial enterprises is a crucial strategy for improving their financial management, particularly when dealing with seasonal income fluctuations. This approach not only bolsters the financial health of these businesses but also plays a role in fostering broader economic development.

2.3. Financial Capability (FC)

Financial capability (FC) refers to the capacity of individuals or business owners to manage their financial resources effectively, including knowledge, skills, attitudes, and behaviors in financial management [27]. According to the [28], FC is the internal ability to act in one’s best financial interests, taking into account socioeconomic and environmental conditions. FC plays a crucial role in the maintenance of business viability. MSME owners with strong financial skills can effectively create budgets, handle cash flows, and make well-informed investment choices. These abilities enable them to successfully navigate the monetary challenges arising from seasonal shifts in their business cycles [29]. Previous research has shown that increased FC is positively associated with better financial management and FG achievement [16,27,29]. For instance, ref. [30] demonstrated that individuals with high FC are more adept at managing irregular incomes and mitigating the risk of financial errors. By contrast, a deficiency in FC can result in inadequate financial management, such as the inability to distinguish between personal and business finances, which ultimately jeopardizes business sustainability. Therefore, improving FC among agro-industrial MSME owners is a strategic step to ensuring that they can manage their finances more effectively, particularly in the face of seasonal income challenges.

2.4. Risky Paying Behavior (RPB) and Risky Borrowing Behavior (RBB)

To comprehend risky payments and borrowing practices, it is crucial to examine the MSMEs operating in the agro-industrial sector. Risky paying behavior (RPB) refers to actions or habits in making payments that can increase the financial risk of a business [15]. Examples include delayed payments to suppliers, untimely debt repayments, and the use of funds allocated to specific obligations for other purposes. Risky borrowing behavior (RBB) refers to borrowing behavior that may pose a risk to business sustainability [31]. This includes taking loans without meticulous planning, borrowing at raised interest rates without assessing the capacity for repayment, and depending on unsecured informal loan sources. Prior research indicates that such precarious financial behavior is frequently attributed to a deficiency in financial literacy and FA among MSME owners. According to [32], many MSME players do not understand the financial products offered by financial institutions, resulting in a decline in their FG. This lack of understanding can lead to unwise financial decisions, such as taking loans on unfavorable terms or failing to meet repayment obligations on time. Therefore, it is important for agro-industrial MSME owners to improve their financial literacy and FA regarding the consequences of RPB and RBB. By gaining deeper insight into financial management and understanding the potential pitfalls of risky payment and borrowing practices, MSME owners can make more informed choices, sustain financial health, and ensure that their businesses remain viable despite fluctuations in seasonal income.

2.5. Expected Future Financial Security (EFFS) and Current Money Management Stress (CMMS)

In the literature on financial well-being, expected future financial security (EFFS) and current money management stress (CMMS) are important interrelated concepts [33,34]. EFFS refers to an individual’s belief in their future financial stability and security. Individuals with high EFFS feel confident that they will be able to meet future financial needs such as retirement, children’s education, or asset purchases. In contrast, CMMS describes the level of stress individuals experience in managing their current finances. This stress can arise from a variety of factors, including insufficient income, mounting debt, and the inability to manage daily expenses [35]. Previous research shows that EFFS and CMMS have a significant impact on individuals’ financial behavior and decisions. Ref. [36] identified that the perceptions of financial well-being comprise three primary components: the capacity to fulfill current needs, the attainment of a desired lifestyle, and the achievement of financial independence. These findings demonstrate the importance of EFFS in shaping individuals’ perceptions of financial well-being. On the other hand, CMMS can affect mental health and overall well-being. According to [37], high financial stress can lead to various mental health problems, including anxiety, depression, and sleep disorders. Therefore, it is important for individuals to effectively manage their financial stress to maintain mental and physical well-being. Owners of MSMEs who exhibit high levels of EFFS are generally more optimistic and proactive in expanding production over the long term [38]. Conversely, a high CMMS may hinder the ability to make rational financial decisions, which may lead to risky financial behaviors such as uncontrolled debt taking or delayed payment of obligations.

2.6. Financial Goals

Financial goals (FGs) refer to the specific objectives that an individual or business aims to achieve to ensure sustainable financial well-being and growth [16,30]. These goals can be categorized based on the timeframe, ranging from short, medium, to long term. In MSMEs, FGs include increasing revenue, reducing operational costs, optimizing cash flows, and investing in business development. Establishing an FG is crucial for building economic stability for an MSME owner of the agro-industry sector. MSME owners with well-defined monetary objectives can manage their revenue more effectively [39]: for instance, by reserving funds during prosperous periods to sustain operations when income decreases. Furthermore, effective financial management enables firms to invest in machinery or digital solutions that can enhance their business output and streamline processes. Previous research has shown that businesses with structured FG are better able to manage resources effectively and achieve sustainable growth. Ref. [36] emphasizes that small business owners who establish FG, such as increasing profit margins or reducing operating costs, are more likely to succeed in maintaining financial stability. The research corroborates that in the absence of a clear FG, businesses often encounter challenges in managing cash flows and making optimal investment decisions. Given the unpredictable nature of seasonal income, the owners of agro-industrial MSMEs must enhance their understanding of establishing and achieving FGs. This knowledge is essential for maximizing MSME growth and ensuring the continued viability of the enterprises.

2.7. Research Framework

Figure 1 shows the research framework for investigating the financial behavior and outcomes of MSME owners in the agro-industrial sector.
The model shows the psychological and behavioral aspects of financial management, particularly in environments marked by seasonal income variations, as is prevalent in the agro-industrial sector. The FA serves as the foundational element that directly impacts the FC, RBB, and RPB. The positive influence of FA on FC indicates that heightened FA enhances FC, which subsequently shows a fundamental role in shaping financial behaviors and outcomes. Concurrently, FA also affects risky financial behaviors, suggesting that FA does not invariably lead to reduced risk-taking, but may also reflect intricate financial decision-making patterns among MSMEs. FC functions as a mediator between FA and FG. As FA augments FC, individuals with enhanced FC are more likely to achieve an FG. However, risky financial behaviors yield mixed results in influencing financial goals, while RPB significantly impacts FG and RBB, indicating that different financial risks affect goal attainment in distinct ways. The moderating variables, EFFS and CMMS, were anticipated to affect the strength of the relationship between FC and FG.

3. Methodology

This study uses a quantitative approach with a survey method to collect data from MSME owners in the agro-industrial sector, spread across several cities in East Java. This approach examines the relationship between FA, FC, RPB, RBB, EFFS, CMMS, and FG to address seasonal income fluctuations. Data analysis was conducted using structural equation modeling (SEM) with SmartPLS 4 software, which facilitates the simultaneous testing of causal relationships between latent variables [40].

3.1. Measurement

This study employs an extensive measurement framework, drawing upon established scales for the variables FA, FC, and FG adapted from the work of [41] and emphasizing behaviors and attitudes critical to financial literacy and planning. The FA encompasses individuals’ efforts to regularly evaluate spending, document bills, compare financial products, and engage in informed discussions on financial matters. These actions reflect a proactive approach to managing finances and improving decision-making capabilities. FC, also derived from [41], focuses on the ability to meet daily financial obligations, maintain sufficient cash flow, and make informed purchasing decisions. It highlights not only the technical skills required for financial management but also the psychological discipline needed to prioritize necessities over impulsive spending. FG, another construct from [41], represents an individual’s ability to plan for both short- and long-term objectives such as retirement or significant purchases. This dimension underscores the importance of saving and avoiding reliance on credit, emphasizing financial foresight and preparation.
The variables RPB and RBB are adapted from [42], reflecting behaviors that can lead to financial instability. The RPB focuses on challenges, such as failing to pay bills on time or being unable to fully repay consumer credit each month. These behaviors indicate a lack of financial discipline and planning, which can exacerbate financial stress. On the other hand, the RBB examines tendencies, such as relying on credit cards for borrowing, impulsive online shopping with consumer credit, and disregarding product prices when using credit. These patterns reflect behaviors that increase financial vulnerability, particularly among individuals with limited income stability.
EFFS and CMMS were derived from [43], providing critical insights into the psychological and emotional aspects of financial management. The EFFS captures individuals’ perceptions of their ability to secure future financial stability. This includes confidence in achieving financial goals, saving enough money to meet long-term needs, and ensuring financial security until the end of life. This reflects a forward-looking perspective that integrates planning and optimism regarding future financial well-being. In contrast, CMMS addresses the psychological strain caused by financial difficulties, such as feeling controlled by finances, being unable to enjoy life due to financial worries, and experiencing setbacks even when financial progress is made. These stressors show the emotional toll that poor financial management or unstable income can have on individuals.

3.2. Population and Sample

The population in this study consisted of owners of agro-industrial MSMEs in several cities in East Java that have seasonal income characteristics, such as agriculture, fisheries, and crop processing sectors. The sample in this study comprised 287 respondents, which was determined based on the minimum sample calculation using the G*Power software 3.1 [44]. The use of G*Power ensures that the number of samples taken meets the level of statistical significance sufficient for SEM-PLS analysis [45]. To ensure an even distribution of samples, this study used a random sampling method with a random odd–even technique [46,47]. In this technique, each MSME in the population list is numbered, and samples are randomly selected based on odd and even numbers until they reach a predetermined number [48]. This technique was used to avoid bias in sample selection and to ensure the representation of MSMEs from various agro-industrial business categories in East Java. The MSMEs sampled in this study were obtained from six cities/regencies in East Java (see Table 1).

3.3. Data Collection Technique

The data for this study were gathered using questionnaires distributed both directly and via digital platforms to the MSME owners. This mixed distribution method was chosen to ensure broad accessibility and accommodate the diverse geographic locations and technological capabilities of participants, particularly those in rural areas [47,49]. The questionnaire used a 7-point Likert scale to capture nuanced responses and provide a more detailed measurement of the research variables [46,50]. A 7-point scale offers greater sensitivity than shorter scales, allowing respondents to express varying degrees of agreement or disagreement more accurately. This approach enhances the reliability and validity of the data by capturing subtle differences in perceptions, attitudes, and behaviors related to financial awareness, capability, and other variables. Furthermore, the structured design of the questionnaire ensures that all aspects of the conceptual framework are addressed, making it an effective tool for analyzing the complex financial dynamics faced by MSME owners.

3.4. Data Analysis Technique

This study used SEM with the PLS approach implemented using SmartPLS 4 software [40,51]. The choice of this method is based on the need to analyze the complex relationships between several latent variables that cannot be measured directly. The SEM-PLS approach was chosen because it has the advantage of handling models with many indicators and allows for the estimation of relationships between variables with a relatively smaller sample than covariance-based SEM methods. Additionally, SEM-PLS is more flexible in handling data that are not normally distributed, and it can be used to test exploratory models involving mediating or moderating variables [45]. This model allows us to understand how psychological and behavioral financial variables moderate the relationship between behavioral financial and FG achievement, which is difficult to analyze using conventional regression methods. In addition, SEM-PLS allows the evaluation of the outer model to test the validity and reliability of research indicators and the inner model to determine the strength of the causal relationship between variables in the structural model [51]. In this study, SEM-PLS is expected to provide more accurate and in-depth results on how agro-industrial MSMEs in East Java manage their finances amid seasonal income challenges.

3.5. Ethical Consideration

This study was conducted with due regard to research ethics standards to ensure that the rights, safety, and privacy of the respondents were maintained. Data confidentiality was guaranteed by ensuring that the information provided by respondents was only used for academic purposes and analyzed in aggregate, without revealing the identity of participating individuals or MSMEs. Anonymity was maintained by not requesting personal information that could directly identify the respondents, such as their full names or specific business addresses. Respondents’ identities were coded so that the research results could not be traced back to specific individuals, thus preserving their privacy to the maximum extent. Additionally, this study emphasizes transparency and clarity regarding the purpose of the research. Respondents were given clear information on how their data would be used and how the results of this study could contribute to a better understanding of the financial management of agro-industrial MSMEs in East Java. The research was also conducted in compliance with academic standards and regulations applicable to social and business research, including compliance with academic research guidelines and privacy policies stipulated in data protection regulations. Before completing the questionnaire, each respondent was asked to read and agree to provide informed consent to explain their rights. The data can be found in the Supplementary Materials.
This document included information on the purpose of the study, where respondents were given an understanding of the main objective of the study, which was to understand the influence of financial and psychological factors on the financial behavior of agro-industrial MSME owners. It also explained the confidentiality of the data and that the information collected would only be used for research purposes and would not be disseminated individually. Respondents also had the right to not answer certain questions if they felt uncomfortable and could stop their participation at any time without negative consequences. To support transparency, the researcher’s contact information was included in the informed consent form so that respondents could ask questions or request further clarification regarding the study.

4. Result and Discussion

4.1. Characteristics Respondents

Table 2 presents the respondents’ demographic and business characteristics. The respondents, totaling 287 MSME owners from various regions, represented a diverse group with varying backgrounds in terms of gender, age, education, business tenure, and industry. The data provide insights into the key attributes that influence financial behavior and decision-making processes.
As shown in Table 2, the majority of respondents were male, accounting for 58.54% of the total, whereas females represented 41.46%. Age distribution highlights that most respondents fall into the 30–40 year age range, constituting 31.71%, followed by those aged 41–50 years at 27.53%. The educational background showed a wide spectrum, with the highest proportion holding a bachelor’s degree (30.66%), indicating a relatively high level of formal education among the respondents. Business tenure reveals that 34.15% of respondents have been in business for 5–10 years, demonstrating a stable experience in managing enterprises. The types of business reflected the regional focus on agriculture, fisheries, and agro-industrial activities, with the highest representation from coffee and cocoa farming (20.21%). Technology adoption also played a crucial role, with 67.25% of the respondents utilizing financial technology, underscoring the growing reliance on digital tools for business operations. Access to credit varies, with 41.46% relying on bank loans and a smaller proportion relying on fintech lending or cooperatives. Financial literacy levels varied significantly, with 41.11% of the respondents categorized as having a moderate level of literacy.

4.2. Descriptive Statistics

Table 3 summarizes the descriptive statistics of the variables used in this study, including their mean and standard deviation ranges. The variables reflect the key aspects of financial behavior and outcomes among MSME owners.
FA demonstrated a mean range of 5.307 to 5.951, with a standard deviation between 1.077 and 1.450, indicating relatively high awareness levels, but some variation among respondents. FC has a mean range of 5.686–5.983 and a standard deviation of 1.064–1.382, showing the respondents’ ability to manage their financial obligations effectively, albeit with slight variability. The FG reflects a mean range of 5.700 to 5.937, with a standard deviation of 1.060 to 1.188, highlighting the importance of goal-oriented financial planning among the respondents. The RPB and RBB showed contrasting trends. While RPB has a high mean range of 5.878–5.885 with relatively low variability (0.975–1.276), RBB exhibits a lower mean range of 4.244–4.561 and a much higher standard deviation (2.108–2.189), indicating a significant inconsistency in borrowing behavior. The EFFS showed a mean range of 5.369–5.920 and a standard deviation of 1.031–1.263, reflecting a strong sense of financial stability and future planning among most respondents. In contrast, CMMS had a mean range of 4.686–5.157 and a standard deviation of 1.619–1.960, indicating moderate stress levels with some variation across the sample.

4.3. Common Method Bias (CMB)

Table 4 presents the inner VIF values for all structural paths in the model. The results show that all VIF values ranged between 1.000 and 1.760, which is well below the threshold of 3.3 recommended in [52]. For example, the paths from CMMS to FG and from RPB to FG exhibited VIF values of 1.760 and 1.221, respectively, indicating low multicollinearity and a negligible common method bias. Similarly, the interaction terms, such as EFFS × FC to FG and CMMS × FC to FG, showed VIF values of 1.231 and 1.351, respectively, further confirming that the model does not suffer from CMB issues.
These results validate the robustness of the measurement model and ensure that the relationships between the constructs are not significantly influenced by the common method variance. Low VIF values strengthen the credibility of the findings and support the conclusion that observed relationships are likely to reflect the actual dynamics within the data.

4.4. Measurement Model

Table 5 presents the factor loadings, composite reliability (CR), and average variance extracted (AVE) for the constructs measured. These metrics are crucial for assessing the reliability and validity of a measurement model. Factor loadings represent the correlation between each indicator and its underlying constructs. CR evaluates the internal consistency of the construct, and AVE indicates the proportion of variance captured by the construct relative to the variance due to measurement error.
Most items in the table exhibit factor loadings above the commonly accepted threshold of 0.6 [53], indicating that the indicators adequately represent their respective constructs. Constructs such as CMMS and RBB showed particularly strong factor loadings, with values ranging from 0.829 to 0.942. These high loadings reflect strong relationships between the items and their constructs, thus enhancing the overall reliability of the model. The CR values for these constructs were also above the threshold of 0.7 [
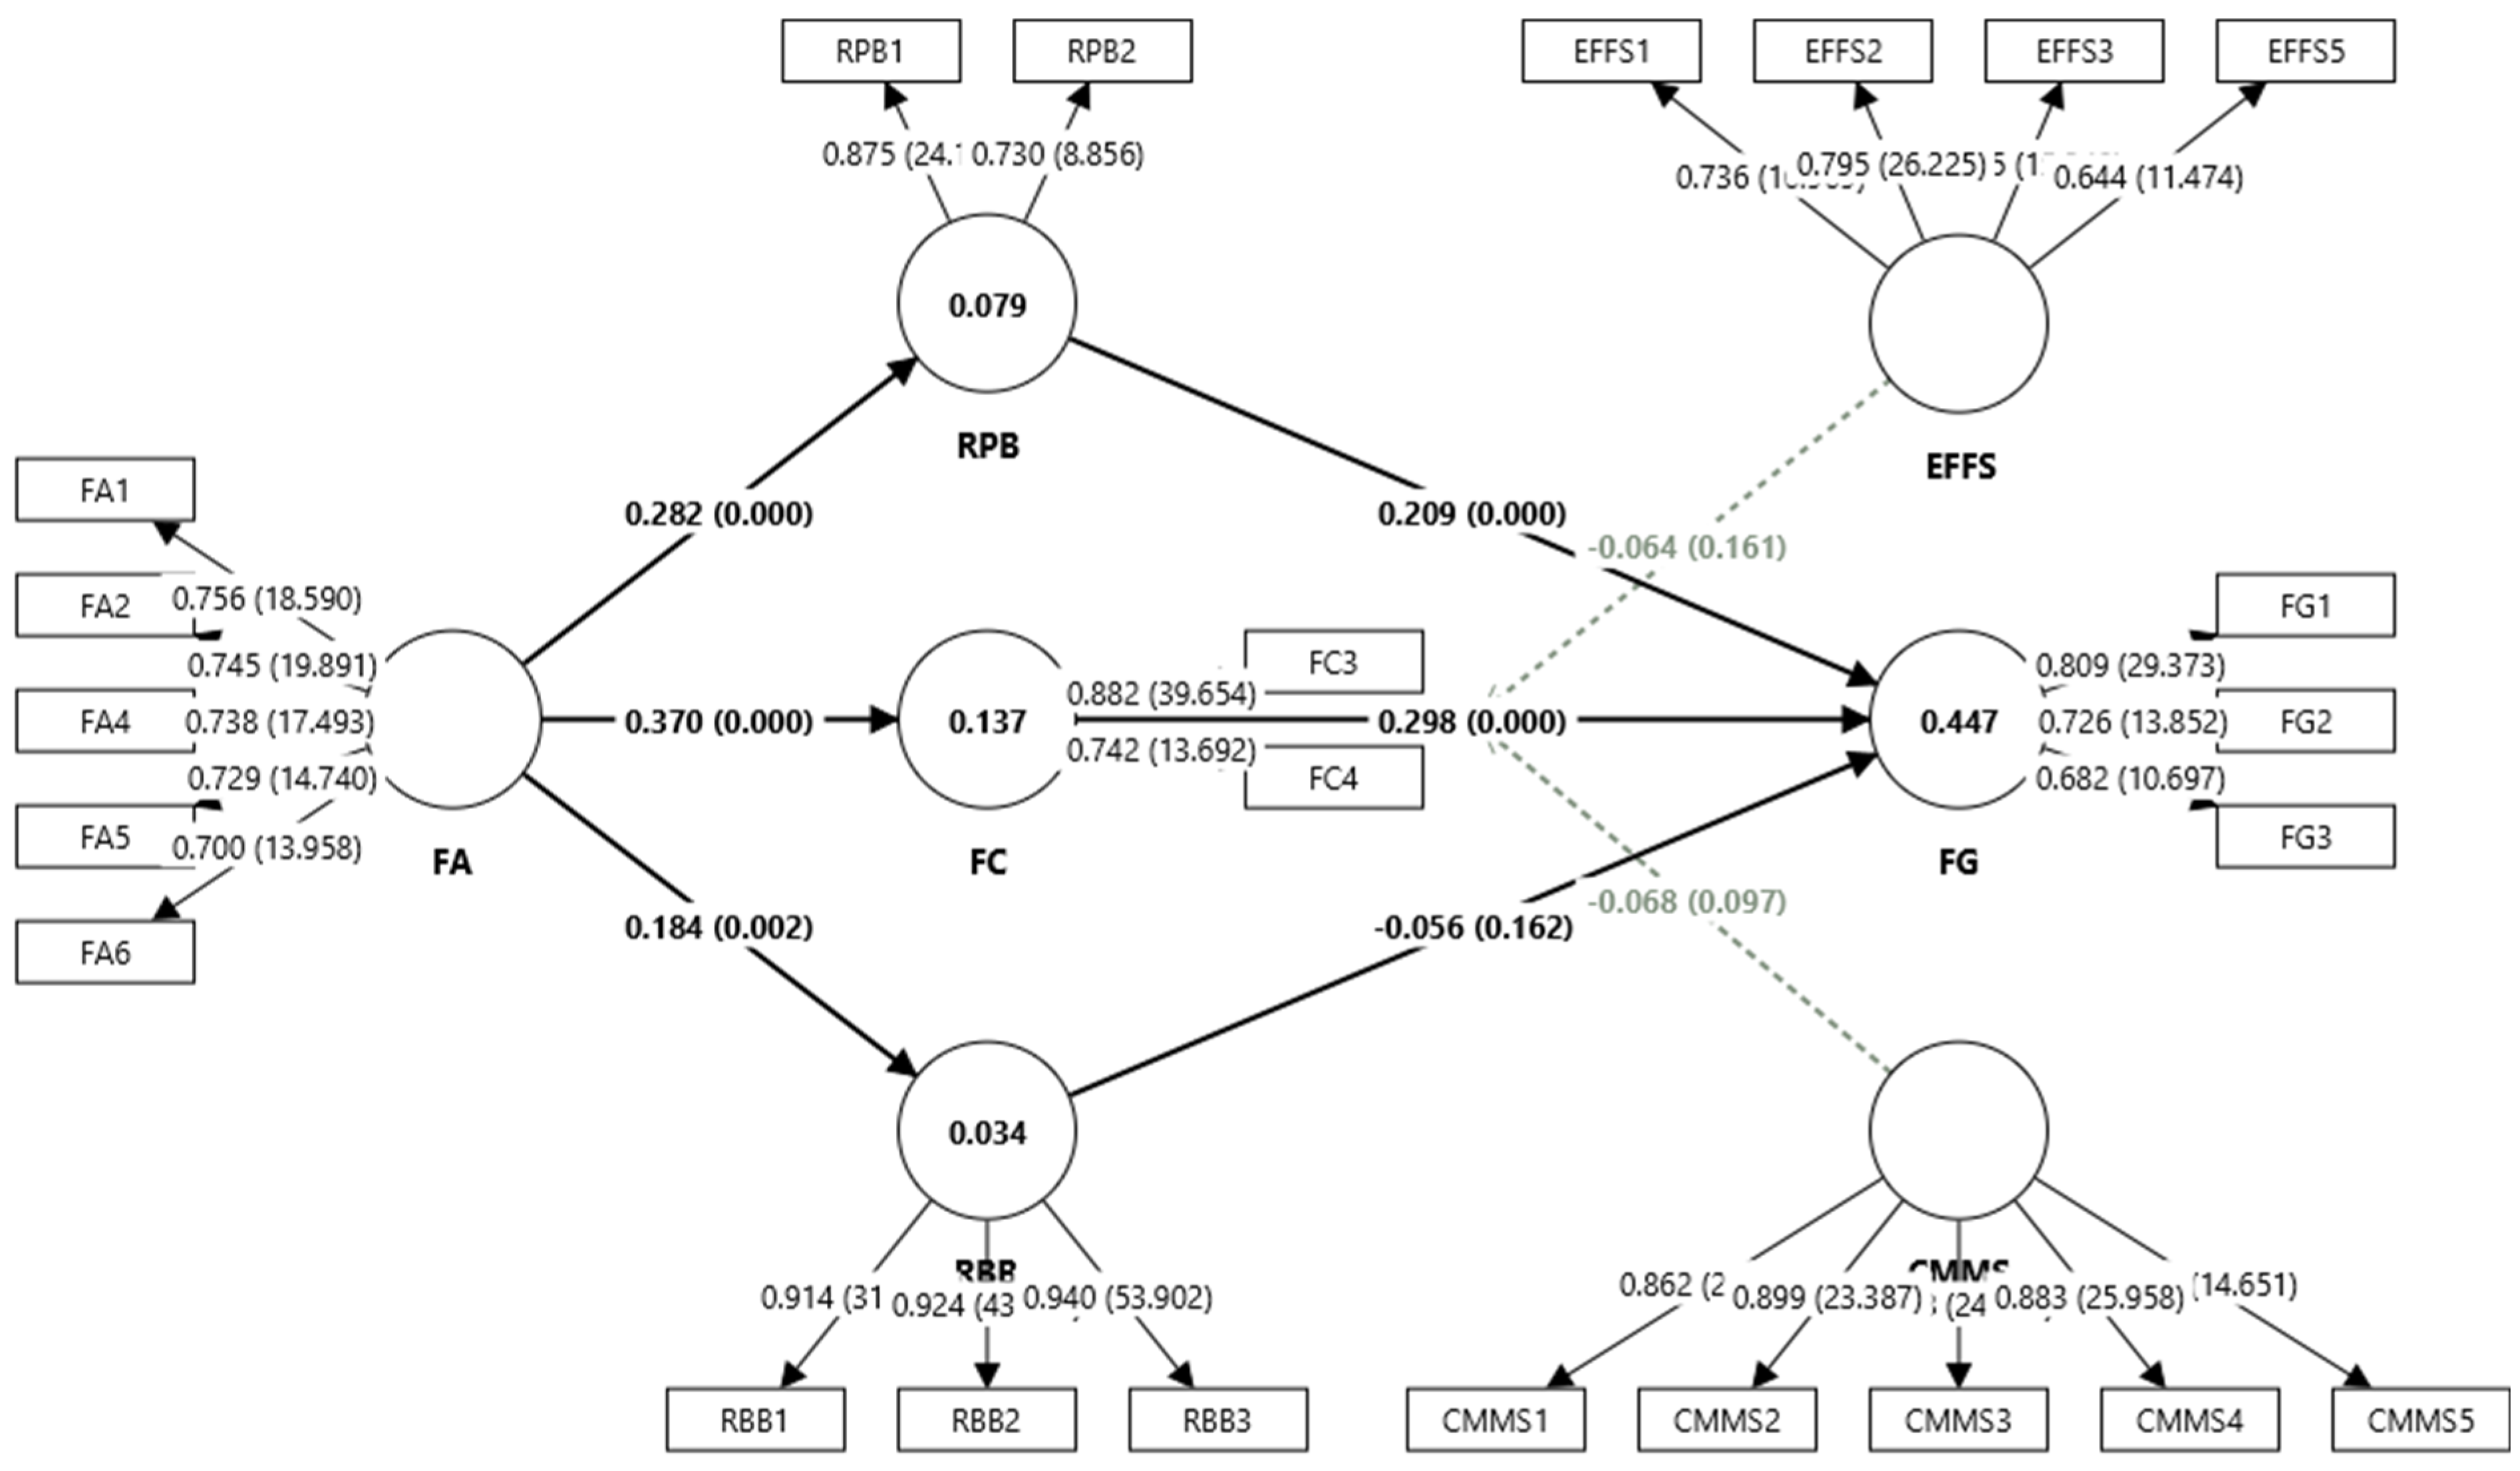
50], thus ensuring internal consistency. However, some items showed factor loadings below 0.6, such as FC1 (0.532) and FC2 (0.595) under the financial capability (FC) construct. Items with factor loadings below 0.6 contribute less to the construct and may reduce the overall model fit. According to the measurement theory, removing such items can improve the construct’s reliability and validity, particularly if their exclusion raises the CR and AVE above the recommended thresholds. For example, eliminating FC1 and FC2 could potentially strengthen the representation of financial capability in the model by focusing on stronger indicators, such as FC3 and FC4. Similarly, for the FA construct, FA3 showed a factor loading of 0.593, which is slightly below the threshold. Although this value is close to acceptable, its inclusion may slightly weaken the construct’s overall validity. Removing this item could enhance AVE and ensure that the construct better captures the essence of financial awareness. The EFFS4 was also deleted to enhance the AVE of the EFFS constructs.
Table 6 presents the Fornell–Larcker criterion results used to assess discriminant validity in the measurement model [40]. Discriminant validity ensures that each construct in the model is distinct from others. This criterion is satisfied if the square root of the AVE for each construct (diagonal values) is greater than the correlation between that construct and all other constructs (off-diagonal values) [45].
All constructs in the model satisfy the Fornell–Larcker criterion. For instance, the square root of the AVE for RBB (0.926) was significantly higher than its correlation with other constructs, such as FG (0.062) and EFFS (0.183). Similarly, RPB has a square root of AVE of 0.806, which is higher than its correlation with constructs such as FA (0.282) and FC (0.287).
The final model was refined by removing low-loading items (e.g., FA3, FC1, and FC2) to improve construct validity and overall model fit (see Figure 2). The retained items provided stronger and more reliable measurements of their respective constructs, enhancing the clarity and precision of the relationships.

4.5. Structural Model

Table 7 presents the model fit indicators and R-squared values for the structural model, providing an understanding of its overall quality and explanatory power. Model fit indicators, such as SRMR, d_ULS, d_G, chi-square, and NFI, assess the extent to which the estimated model aligns with the observed data, whereas R-square and Q2 evaluate the variance explained by the constructs.
The Standardized Root Mean Square Residual (SRMR) measures the average discrepancy between the observed and predicted correlations. An SRMR value below 0.08 indicates a good model fit, and the saturated model achieves a value of 0.082, which is close to the threshold, whereas the estimated model shows a slightly higher value of 0.138, suggesting room for improvement. The d_ULS and d_G indicators assess the discrepancy between implied and observed covariance matrices. The saturated model has lower values (2.020 and 0.501, respectively) than the estimated model (5.677 and 0.647, respectively), indicating that the saturated model fits better with the observed data. The chi-square value for the saturated model was 882.478, which increased to 1040.399 in the estimated model. While higher chi-square values typically indicate poorer fit, they should be interpreted cautiously in larger sample sizes, as chi-square is sensitive to the sample size. The normed fit index (NFI), which compares the fit of the proposed model to a null model, was 0.730 for the saturated model and 0.681 for the estimated model. Both values were below the conventional threshold of 0.9, indicating a moderate fit. The R-squared values indicate the proportion of the variance explained by the independent variables for each construct. FC has an R-square of 0.137 (adjusted 0.134), suggesting that the predictors explain 13.7% of the variance in FC. FG exhibited a higher R-squared of 0.447 (adjusted 0.433), indicating that 44.7% of its variance was explained by the predictors, demonstrating the strongest explanatory power in the model. The RBB had a low R-squared value of 0.034 (adjusted 0.030), indicating minimal explanatory power. Similarly, the RPB showed an R-square of 0.079 (adjusted 0.076), reflecting the limited variance explained. A Q2 value of 0.575 indicated the model’s predictive relevance for endogenous constructs. A Q2 value above 0 confirms the model’s ability to predict and implies its robustness in explaining financial behaviors and goals within the context of the study.
Figure 3 illustrates the bootstrapping results of the final structural model, which provides statistical significance and reliability for the hypothesized relationships and factor loadings. Bootstrapping is a resampling technique that generates robust standard errors and t-values to test the significance of the path coefficients and indicator loadings.
The path analysis results in Table 8 provide a detailed understanding of the relationships between the variables in the structural model and examine their significance and impact.
FA demonstrated a strong and significant direct relationship with FC, as indicated by a path coefficient (O) of 0.370 and a t-statistic of 5.845 (p < 0.000). This highlights the critical role of the FA in shaping individuals’ ability to effectively manage their financial obligations, reflecting a clear connection between awareness and capability. FA also significantly influenced RBB and RPB, with path coefficients of 0.184 (t = 2.904, p = 0.002) and 0.282 (t = 4.011, p < 0.000), respectively. These results suggest that individuals with higher financial awareness are more likely to proactively manage their borrowing and payment behaviors, although RBB’s influence of RBB on FG is not statistically significant (O = −0.056, p = 0.162). This lack of significance indicates that borrowing behavior, while being affected by awareness, does not directly impact FG achievement.
As an intermediary construct, FC had a substantial and significant positive effect on FG (O = 0.298, t = 4.116, p < 0.000). This underscores the importance of financial capability in facilitating long-term goal-setting and achievement, aligning with the model’s focus on the practical application of financial skills. Moreover, the indirect path from FA to FG through FC was also significant (O = 0.110, t = 3.155, p = 0.001), reinforcing the cascading effect of awareness through capability on goal attainment. The influence of RPB on FG is significant and positive (O = 0.209, t = 3.432, p < 0.000), demonstrating that effective payment behavior contributes to the realization of financial goals. Conversely, the moderating effects of EFFS and CMMS on the FC-to-FG relationship were not significant, with path coefficients of −0.064 (p = 0.161) and −0.068 (p = 0.097), respectively. These results suggest that while psychological factors such as future security and financial stress are important, their interactions with capability may not strongly influence the direct pathway to goal attainment in this study. Interestingly, the indirect paths involving FA, RBB, and FG (O = −0.010, p = 0.187) are not significant, indicating that risky borrowing behavior does not mediate the relationship between financial awareness and goal attainment. By contrast, the indirect path through RPB (O = 0.059, t = 2.208, p = 0.014) is significant, highlighting that effective payment behavior serves as a critical mediator for FA to positively impact FG.

4.6. Discussion

The findings of this study underscore the significant role of FA and FC in shaping the financial behaviors and goals of agro-industrial MSME owners in East Java, a group highly vulnerable to seasonal income fluctuations. As observed in previous studies [1,2,54], MSMEs constitute the foundation of the Indonesian economy. However, many of these enterprises are ensnared in a cyclical pattern of financial instability due to irregular income streams. This study adds to the body of knowledge by illustrating how FA influences FC and risky financial behaviors such as RBB and RPB and ultimately affects FG attainment. The path analysis results revealed that FA directly affected FC with a path coefficient of 0.370 (p < 0.000). This finding aligns with previous research in [25], which emphasizes the critical role of FA in equipping business owners with the knowledge and skills needed to manage finances effectively. Agro-industrial MSMEs benefit from high FA because it enables them to allocate resources efficiently during periods of peak income while preparing for challenges during the off-season. Similarly, ref. [26] notes that FA is a fundamental component of financial literacy, empowering MSMEs to make better decisions about budgeting, debt management, and investment.
The significant relationship between FA and RPB (path coefficient = 0.282, p < 0.000) and RBB (path coefficient = 0.184, p = 0.002) further validates the critical influence of financial awareness on reducing risky financial behaviors. This finding is consistent with [9], which showed that seasonal income instability exacerbates the likelihood of risky financial behavior among MSMEs. For instance, the implementation of the final tax for MSMEs at 0.5% turnover (PP 23/2018) did not consider seasonal income fluctuations. MSMEs with unstable incomes still have to pay taxes based on turnover, even though they experience periods of low income. Moreover, FC emerged as a pivotal mediator between FA and FG with a significant indirect effect (path coefficient = 0.110, p = 0.001). This result corroborates the findings of [16], which noted that FC significantly enhances the ability to achieve financial goals by fostering disciplined financial management. Conversely, low FC often results in suboptimal financial decisions such as failing to separate personal and business finances, as noted in the [6] survey. RPB also significantly influences FG (path coefficient = 0.209, p < 0.000), indicating that timely and disciplined payment practices contribute positively to achieving long-term FG. This finding aligns with that of [10], which emphasized that reducing risky financial behaviors is essential for sustainable business management. However, the impact of RBB on FG was found to be insignificant (p = 0.162), suggesting that borrowing behaviors, although influenced by FA, may not directly translate into FG achievement.
This finding is similar to the conclusions of [15], who noted that subjective financial literacy plays a more critical role in addressing RPB than RBB does. The moderating effects of EFFS and CMMS on the FC–FG relationship were not significant, with p-values of 0.161 and 0.097, respectively. This psychological factor is due to the government’s policy weaknesses, and the absence of insurance schemes or adequate financial protection for agro-industrial MSMEs makes them vulnerable to weather risks, natural disasters, and market price fluctuations. Without such protection, businesses are more likely to rely on informal loans with high interest rates or risky financial practices. However, previous research in [35,36] suggests that these variables can still shape financial behaviors indirectly, as individuals with high EFFS are more optimistic and forward-looking, whereas those with high CMMS may struggle to focus on long-term planning.
Any uncertainty in import policies that is unfavorable to agro-industrial MSMEs, such as the import of large quantities of food commodities during the local harvest season, can cause local product prices to fall. Conversely, complicated export regulations can hinder businesses from selling their products to foreign markets. This research helps develop a mitigation strategy by involving several important factors, such as FA and FC, and psychological factors, such as EFFS and CMMS, in a cohesive model to address the unique challenges faced by agro-industrial MSMEs. The application of the BFT offers a robust framework for understanding the interplay between cognitive, emotional, and external factors that influence financial behaviors and outcomes. As the focus of [21,22], MSME owners are subject to the cognitive biases and emotional pressures that shape their financial decisions.

5. Conclusions

This study shows that FA significantly affects FC, RBB, and RPB, highlighting its foundational role in fostering disciplined financial practices. FC emerges as a key mediator in the relationship between FA and FG, emphasizing the importance of financial literacy and capability in achieving long-term business sustainability. While RPB significantly contributes to FG, the effect of RBB on FG is insignificant, suggesting that borrowing behavior may not directly translate into financial goal achievement. Additionally, psychological factors, such as EFFS and CMMS, did not significantly moderate the relationship between FC and FG, indicating their limited direct influence.
This study has significant theoretical and practical implications for improving the financial behavior and sustainability of agro-industrial MSMEs. The findings contribute to the BFT by emphasizing the critical role of FA as a key driver of FC and its influence on risky financial behaviors and FG achievement. The inclusion of psychological variables, such as EFFS and CMMS, provides a deeper understanding of how emotional and cognitive factors shape financial decision-making. This study validates the mediating role of FC in linking FA to FG, offering a theoretical model for exploring financial resilience in businesses that face seasonal income challenges.
This study reveals the urgent need for tailored financial literacy programs that address specific issues faced by MSME owners, such as managing irregular cash flows and minimizing risky financial behavior. Moreover, stress management resources should be made available to help MSME owners cope with financial pressures, which can impair decision-making and long-term planning. Policymakers can promote sector-specific interventions, including subsidies during the off-season and incentives for technological investment to ensure income stability and business continuity. Enhancing inclusive financing mechanisms is anticipated to augment the productivity and competitiveness of MSMEs, thereby facilitating the creation of improved employment opportunities and fostering economic growth in alignment with Sustainable Development Goal (SDG) 8, particularly within the agro-industrial sector. This research has limitations in only using a quantitative approach, and it was only carried out in several cities in East Java. Further research can explore this problem using other approaches more thoroughly in every city in East Java.

Supplementary Materials

The following supporting information can be downloaded at https://www.mdpi.com/article/10.3390/agriculture15070709/s1.

Author Contributions

Conceptualization, M.F. and A.L.A.; methodology, M.F.; software, M.A.; validation, M.F., A.L.A. and M.A.; formal analysis, M.F.; investigation, M.F.; resources, M.F.; data curation, M.F.; writing—original draft preparation, M.F.; writing—review and editing, S.S. and S.G.; visualization, A.L.A.; supervision, S.S. and S.G.; project administration, M.F.; funding acquisition, M.A. All authors have read and agreed to the published version of the manuscript.

Funding

We would like to extend our appreciation to King Saud University for funding this work through the Researcher Supporting Project (RSP2025R481), King Saud University, Riyadh, Saudi Arabia.

Institutional Review Board Statement

This study adheres to the ethical standards outlined in the Helsinki Declaration and received approval from the Ethics Committee of Universitas Brawijaya, approval number: 01843/UN10.F0201/B/PT/2025. The study prioritized the principles of respect, beneficence, and justice, ensuring that all participants’ rights and welfare were safeguarded throughout the research process.

Data Availability Statement

Data can be downloaded in Supplementary Materials.

Conflicts of Interest

The authors declare no conflicts of interest.

References

  1. International Monetary Fund. Financing Barriers and Performance of Micro, Small, and Medium Enterprises (MSMES); International Monetary Fund: Washington, DC, USA, 2024; Volume 2024, p. 52. [Google Scholar] [CrossRef]
  2. Zuhroh, D.; Jermias, J.; Ratnasari, S.L.; Sriyono; Nurjanah, E.; Fahlevi, M. The Impact of Sharing Economy Platforms, Management Accounting Systems, and Demographic Factors on Financial Performance: Exploring the Role of Formal and Informal Education in MSMEs. J. Open Innov. Technol. Mark. Complex. 2025, 11, 100447. [Google Scholar] [CrossRef]
  3. Jawapos. Productivity Declines, Disperta Intervenes with Coffee Farmers. Available online: https://radarbanyuwangi.jawapos.com/ekonomi-bisnis/75922132/produktivitas-menurun-disperta-intervensi-petani-kopi (accessed on 5 February 2025).
  4. VIVA. Khofifah Greets Fishermen in Lamongan, Laments Falling Fish Prices and Scarce Fuel. Available online: https://jatim.viva.co.id/kabar/15013-khofifah-sapa-nelayan-di-lamongan-dicurhati-harga-ikan-turun-dan-bbm-langka (accessed on 5 February 2025).
  5. International Monetary Fund (IMF). Asia and Pacific Financing Barriers and Performance of Micro, Small, and Medium Enterprises (MSMES); International Monetary Fund (IMF): Washington, DC, USA, 2024. [Google Scholar]
  6. OCBC. OCBC Financial Fitness Index 2024. Available online: https://www.ocbc.id/tentang-ocbc-nisp/informasi/siaran-pers/2024/08/16/ocbc-ffi-2024 (accessed on 5 February 2025).
  7. Mastercard. Empowering Indonesia’s Small Businesses: Insights and Strategies for Overcoming Digital and Financial Barriers. Available online: https://newsroom.mastercard.com/news/ap/en/newsroom/press-releases/en/2024/empowering-indonesia-s-small-businesses-insights-and-strategies-for-overcoming-digital-and-financial-barriers/ (accessed on 5 February 2025).
  8. Habiburrahman; Prasetyo, A.; Raharjo, T.W.; Rinawati, H.S.; Trisnani; Eko, B.R.; Wahyudiyono; Wulandari, S.N.; Fahlevi, M.; Aljuaid, M.; et al. Determination of Critical Factors for Success in Business Incubators and Startups in East Java. Sustainability 2022, 14, 14243. [Google Scholar] [CrossRef]
  9. Prasetyo, A.; Putri Harwijayanti, B.; Ikhwan, M.N.; Lukluil Maknun, M.; Fahlevi, M. Interaction of Internal and External Organizations in Encouraging Community Innovation. Front. Psychol. 2022, 13, 903650. [Google Scholar] [CrossRef]
  10. Setyaningrum, R.P.; Norisanti, N.; Fahlevi, M.; Aljuaid, M.; Grabowska, S. Women and Entrepreneurship for Economic Growth in Indonesia. Front. Psychol. 2023, 13, 975709. [Google Scholar]
  11. Possner, A.; Bruns, S.; Musshoff, O. A Cambodian Smallholder Farmer’s Choice between Microfinance Institutes and Informal Commercial Moneylenders: The Role of Risk Attitude. Agric. Financ. Rev. 2021, 82, 183–204. [Google Scholar] [CrossRef]
  12. Lusardi, A.; Mitchell, O.S. The Economic Importance of Financial Literacy: Theory and Evidence. J. Econ. Lit. 2014, 52, 5–44. [Google Scholar] [CrossRef]
  13. Cupák, A.; Fessler, P.; Hsu, J.W.; Paradowski, P.R. Investor Confidence and High Financial Literacy Jointly Shape Investments in Risky Assets. Econ. Model. 2022, 116, 106033. [Google Scholar] [CrossRef]
  14. Wasan, P.; Kumar, A.; Luthra, S. How Can Banks and Finance Companies Incorporate Value Chain Factors in Their Risk Management Strategy? The Case of Agro-Food Firms. Bus. Strategy Environ. 2023, 32, 858–877. [Google Scholar] [CrossRef]
  15. Siswanti, I.; Fahlevi, M.; Prowanta, E.; Riwayati, H.E. Exploring Financial Behaviours in Islamic Banking: The Role of Literacy and Self-Efficacy Among Jakarta’s Bank Customers. Cuad. Econ. 2024, 47, 61–72. [Google Scholar] [CrossRef]
  16. Ardini, L.; Fahlevi, M.; Dandi, M.; Dahlan, O.P.; Dahlan, S.P. Digital Financial Literacy and Its Impact on Financial Skills and Financial Goals in Indonesia’s Digital Payment Ecosystem. Econ. Stud. 2024, 33, 181–200. [Google Scholar]
  17. Bagh, T.; Bouri, E.; Khan, M.A. Climate Change Sentiment, ESG Practices and Firm Value: International Insights. China Financ. Rev. Int. 2024. ahead-of-print. [Google Scholar] [CrossRef]
  18. Fama, E.F. Agency Problems and the Theory of the Firm. J. Political Econ. 1980, 88, 288–307. [Google Scholar] [CrossRef]
  19. Thaler, R. Toward a Positive Theory of Consumer Choice. J. Econ. Behav. Organ. 1980, 1, 39–60. [Google Scholar] [CrossRef]
  20. Kahneman, D.; Tversky, A. Prospect Theory: An Analysis of Decision Under Risk. In Handbook of the Fundamentals of Financial Decision Making; World Scientific Handbook in Financial Economics Series; World Scientific: Singapore, 2012; Volume 4, pp. 99–127. ISBN 978-981-4417-34-1. [Google Scholar]
  21. Thaler, R.H. Psychology and Savings Policies. Am. Econ. Rev. 1994, 84, 186–192. [Google Scholar]
  22. Tversky, A.; Kahneman, D. Advances in Prospect Theory: Cumulative Representation of Uncertainty. J. Risk Uncertain. 1992, 5, 297–323. [Google Scholar] [CrossRef]
  23. Peel, M.J.; Pendlebury, M.W.; Groves, R.E.V. The Determinants of Students’ Financial Awareness—Some UK Evidence. Br. Account. Rev. 1991, 23, 23–48. [Google Scholar] [CrossRef]
  24. Tuffour, J.K.; Amoako, A.A.; Amartey, E.O. Assessing the Effect of Financial Literacy Among Managers on the Performance of Small-Scale Enterprises. Glob. Bus. Rev. 2022, 23, 1200–1217. [Google Scholar] [CrossRef]
  25. Kumar, R.; Pathak, D.C. Financial Awareness: A Bridge to Financial Inclusion. Dev. Pract. 2022, 32, 968–980. [Google Scholar] [CrossRef]
  26. Liu, H.-C.; Lin, J.-S. Impact of Internet Integrated Financial Education on Students’ Financial Awareness and Financial Behavior. Front. Psychol. 2021, 12, 751709. [Google Scholar] [CrossRef]
  27. Atkinson, A.; McKay, S.; Collard, S.; Kempson, E. Levels of Financial Capability in the UK. Public Money Manag. 2007, 27, 29–36. [Google Scholar] [CrossRef]
  28. World Bank Group. Financial Capability. Available online: https://responsiblefinance.worldbank.org/en/responsible-finance/financial-capability (accessed on 5 February 2025).
  29. Xiao, J.J.; O’Neill, B. Consumer Financial Education and Financial Capability. Int. J. Consum. Stud. 2016, 40, 712–721. [Google Scholar] [CrossRef]
  30. Serido, J.; Shim, S.; Tang, C. A Developmental Model of Financial Capability: A Framework for Promoting a Successful Transition to Adulthood. Int. J. Behav. Dev. 2013, 37, 287–297. [Google Scholar] [CrossRef]
  31. Xiao, J.J.; Tang, C.; Serido, J.; Shim, S. Antecedents and Consequences of Risky Credit Behavior among College Students: Application and Extension of the Theory of Planned Behavior. J. Public Policy Mark. 2011, 30, 239–245. [Google Scholar] [CrossRef]
  32. Zuhroh, D.; Jermias, J.; Ratnasari, S.L.; Nurjanah, E.; Fahlevi, M. The Role of GoJek and Grab Sharing Economy Platforms and Management Accounting Systems Usage on Performance of MSMEs during COVID-19 Pandemic: Evidence from Indonesia. Uncertain Supply Chain. Manag. 2024, 12, 249–262. [Google Scholar] [CrossRef]
  33. van Raaij, W.F.; Riitsalu, L.; Põder, K. Direct and Indirect Effects of Self-Control and Future Time Perspective on Financial Well-Being. J. Econ. Psychol. 2023, 99, 102667. [Google Scholar] [CrossRef]
  34. Riitsalu, L.; Sulg, R.; Lindal, H.; Remmik, M.; Vain, K. From Security to Freedom—The Meaning of Financial Well-Being Changes with Age. J. Fam. Econ. Issues 2024, 45, 56–69. [Google Scholar] [CrossRef]
  35. Ponchio, M.C.; Soni, M.J.; Mahapatra, M.S.; Sarkar, S. Using Item Response Theory in the Assessment of the Financial Well-Being Scale: An Application in Brazil and India. Int. J. Bank Mark. 2023, 41, 1671–1692. [Google Scholar] [CrossRef]
  36. Sabri, M.F.; Wahab, R.; Mahdzan, N.S.; Magli, A.S.; Rahim, H.A. Mediating Effect of Financial Behaviour on the Relationship Between Perceived Financial Wellbeing and Its Factors Among Low-Income Young Adults in Malaysia. Front. Psychol. 2022, 13, 858630. [Google Scholar] [CrossRef]
  37. Friedline, T.; Chen, Z.; Morrow, S. Families’ Financial Stress & Well-Being: The Importance of the Economy and Economic Environments. J. Fam. Econ. Issues 2021, 42, 34–51. [Google Scholar] [CrossRef]
  38. Kindström, D.; Carlborg, P.; Nord, T. Challenges for Growing SMEs: A Managerial Perspective. J. Small Bus. Manag. 2024, 62, 700–723. [Google Scholar] [CrossRef]
  39. Angelakis, A.; Μanioudis, Μ. The Historical Evolution of Small and Medium-Sized Enterprises (SMEs) in Greece: The Exploration of Growth Policies Aiming to Accelerate Innovation-Based Economic Transformation and Knowledge Economy. J. Knowl. Econ. 2024. [Google Scholar] [CrossRef]
  40. Hair, J.F.; Risher, J.J.; Sarstedt, M.; Ringle, C.M. When to Use and How to Report the Results of PLS-SEM. Eur. Bus. Rev. 2019, 31, 2–24. [Google Scholar]
  41. Dewi, V.I.; Febrian, E.; Effendi, N.; Anwar, M.; Nidar, S.R. Financial Literacy and Its Variables: The Evidence from Indonesia. Econ. Sociol. 2020, 13, 133–154. [Google Scholar] [CrossRef]
  42. Liu, L.; Zhang, H. Financial Literacy, Self-Efficacy and Risky Credit Behavior among College Students: Evidence from Online Consumer Credit. J. Behav. Exp. Financ. 2021, 32, 100569. [Google Scholar] [CrossRef]
  43. Netemeyer, R.G.; Warmath, D.; Fernandes, D.; Lynch, J.G., Jr. How Am I Doing? Perceived Financial Well-Being, Its Potential Antecedents, and Its Relation to Overall Well-Being. J. Consum. Res. 2018, 45, 68–89. [Google Scholar] [CrossRef]
  44. Kang, H. Sample Size Determination and Power Analysis Using the G*Power Software. J. Educ. Eval. Health Prof. 2021, 18, 17. [Google Scholar] [CrossRef]
  45. Ringle, C.M.; Sarstedt, M.; Mitchell, R.; Gudergan, S.P. Partial Least Squares Structural Equation Modeling in HRM Research. Int. J. Hum. Resour. Manag. 2020, 31, 1617–1643. [Google Scholar]
  46. Saunders, M.; Lewis, P.; Thornhill, A. Research Methods for Business Students, 5th ed.; Prentice Hall: London, UK, 2009; ISBN 978-0-273-71686-0. [Google Scholar]
  47. Sekaran, U.; Bougie, R. Research Methods for Business: A Skill Building Approach; John Wiley & Sons: New York, NY, USA, 2016; ISBN 1-119-16555-5. [Google Scholar]
  48. Stratton, S.J. Population Research: Convenience Sampling Strategies. Prehosp. Disaster Med. 2021, 36, 373–374. [Google Scholar] [CrossRef]
  49. Likert, R. A Technique for the Measurement of Attitudes. Arch. Psychol. 1932, 22, 5–55. [Google Scholar]
  50. Lind, D.A.; Marchal, W.G.; Wathen, S.A. Statistical Techniques in Business & Economics, 17th ed.; McGraw Hill Education: New York, NY, USA, 2018; p. 897. ISBN 978-1-259-66636-0. [Google Scholar]
  51. Sarstedt, M.; Ringle, C.M.; Hair, J.F. Partial Least Squares Structural Equation Modeling. In Handbook of Market Research; Springer: Cham, Switzerland, 2017; pp. 587–632. [Google Scholar]
  52. Kock, N. Common Method Bias in PLS-SEM: A Full Collinearity Assessment Approach. IJeC 2015, 11, 1–10. [Google Scholar] [CrossRef]
  53. Chin, W.W. The Partial Least Squares Approach to Structural Equation Modeling. Mod. Methods Bus. Res. 1998, 295, 295–336. [Google Scholar]
  54. Indrawati, N.K.; Muljaningsih, S.; Juwita, H.A.J.; Jazuli, A.M.; Nurmasari, N.D.; Fahlevi, M. The Mediator Role of Risk Tolerance and Risk Perception in the Relationship between Financial Literacy and Financing Decision. Cogent Bus. Manag. 2025, 12, 2468877. [Google Scholar] [CrossRef]
Figure 1. Research framework.
Agriculture 15 00709 g001
Figure 2. Final model.
Agriculture 15 00709 g002
Figure 3. Bootstrapping.
Agriculture 15 00709 g003
Table 1. Sample distribution.
City/RegencySample SizeMSME FocusIncome Characteristics
Banyuwangi55Coffee and CocoaHigh seasonal income during coffee and cocoa harvests, vulnerable to global price fluctuations.
Jember47Tobacco and Horticultural Food ProcessingIncome heavily relies on tobacco harvests and horticultural price fluctuations.
Malang63Dairy, Apple Processing, and HorticultureStable income from dairy but seasonal for apples and horticulture.
Lamongan42Fisheries and Seafood ProcessingIncome depends on fishing seasons and seafood market prices.
Sidoarjo41Seafood and Processed Milkfish IndustryIncome is influenced by seafood production cycles and market demand.
Madura (Pamekasan and Bangkalan)39Salt and Batik-Based AgroindustrySeasonal income from salt (weather-dependent) and stable income from batik.
Table 2. Characteristics of the respondents.
CategorySub-CategoryFrequencyPercentage (%)
GenderMale16858.54
Female11941.46
Age<30 Years6723.34
30–40 Years9131.71
41–50 Years7927.53
>50 Years5017.42
Education LevelElementary School134.53
Middle School279.41
High School8429.27
Diploma4616.02
Bachelor’s Degree8830.66
Master’s/Doctorate Degree2910.11
Business Tenure (Years)<5 Years5920.56
5–10 Years9834.15
11–15 Years7425.78
>15 Years5619.51
Type of BusinessAgriculture (Coffee, Cocoa)5820.21
Horticulture4415.33
Livestock (Dairy)3913.59
Fisheries5318.47
Seafood Processing4917.07
Batik and Salt Industries4415.33
Financial Technology UseYes19367.25
No9432.75
Access to CreditBank11941.46
Fintech Lending4415.33
Cooperative6422.30
No Access to Credit6020.91
Financial LiteracyLow8128.22
Moderate11841.11
High8830.66
Table 3. Descriptive Statistics.
VariableMean (Range)Standard Deviation (Range)
FA5.307–5.9511.077–1.450
FC5.686–5.9831.064–1.382
FG5.700–5.9371.060–1.188
RPB5.878–5.8850.975–1.276
RBB4.244–4.5612.108–2.189
EFFS5.369–5.9201.031–1.263
CMMS4.686–5.1571.619–1.960
Table 4. Inner VIF.
Table 4. Inner VIF.
Inner PathVIF
CMMS -> FG1.760
EFFS -> FG1.381
FA -> FC1.000
FA -> RBB1.000
FA -> RPB1.000
FC -> FG1.470
RBB -> FG1.606
RPB -> FG1.221
EFFS × FC -> FG1.231
CMMS × FC -> FG1.351
Table 5. PLS algorithm.
ConstructsItemStatementFactor LoadingCRAVE
Current Money Management Stress (CMMS)CMMS1Due to my financial situation, I feel I may never have the things I desire in life0.8610.9360.746
CMMS2I often find myself behind on managing my financial responsibilities0.899
CMMS3I feel as though my finances control every aspect of my life0.829
CMMS4Whenever I feel I have gained control over my finances, unexpected events set me back0.884
CMMS5I am unable to fully enjoy life because I obsess too much about money0.844
Expected Future Financial Security (EFFS)EFFS1I am confident that I am becoming financially secure for the future0.6990.8100.518
EFFS2I am taking steps to secure my financial future0.756
EFFS3I believe I will achieve the financial goals that I have set for myself0.659
EFFS4I am saving or planning to save enough money to last throughout my life0.657
EFFS5I am confident that I will be financially secure until the end of my life0.683
Financial Awareness (FA)FA1I regularly evaluate my spending habits to ensure my financial decisions align with my goals.0.7350.8540.538
FA2I make a detailed shopping list before making any purchases to avoid impulsive spending0.736
FA3I compare different financial products thoroughly before making a decision0.593
FA4I consistently document all my bills to keep track of my financial obligations0.698
FA5I actively gather information related to financial issues to improve my decision-making0.713
FA6I am willing to discuss financial issues with others to gain insight and advice0.710
Financial Capability (FC)FC1I consistently pay my bills on time, ensuring financial obligations are met.0.5320.7970.664
FC2I manage my finances to ensure I have sufficient cash for necessary expenses0.595
FC3I buy items only when they are needed, avoiding unnecessary spending0.798
FC4I seek and gather information before deciding on a purchase to make informed choices0.684
Financial Goals (FG)FG1I make clear plans on how to use my money to achieve my financial objectives0.8100.7840.549
FG2I plan for long-term goals, such as retirement, to ensure financial stability0.718
FG3I prioritize saving money to buy items with cash rather than relying on credit.0.688
Risky Borrowing Behavior (RBB)RBB1I often rely on credit cards for borrowing money to cover expenses0.9090.9480.858
RBB2I tend to be impulsive when using consumer credit for online shopping0.926
RBB3I pay less attention to product prices when purchasing items using consumer credit0.942
Risky Paying Behavior (RPB)RPB1I sometimes fail to pay my bills on time each month, leading to financial stress0.8770.7860.649
RPB2I occasionally struggle to pay off consumer credit in full every month0.728
Table 6. Fornell–Larcker. Bold in number to show the loading and variance to each construct.
ConstructsCMMSEFFSFAFCFGRBBRPB
CMMS0.864
EFFS0.2710.720
FA0.2680.4460.734
FC0.1360.3680.3700.815
FG0.2180.5090.5090.5310.741
RBB0.6010.1830.184−0.0240.0620.926
RPB0.0650.3730.2820.2870.4100.0400.806
Table 7. Model fit.
Table 7. Model fit.
IndicatorsSaturated ModelEstimated ModelR-SquareR-Square Adjusted
SRMR0.0820.138
d_ULS2.0205.677
d_G0.5010.647
Chi-square882.4781040.399
NFI0.7300.681
FC 0.1370.134
FG 0.4470.433
RBB 0.0340.030
RPB 0.0790.076
Q2 0.575
Table 8. Path analysis.
Path(O)(M)(STDEV)(|O/STDEV|)p ValuesDecision
FA -> FC0.3700.3780.0635.8450.000Accepted
FA -> RBB0.1840.1910.0632.9040.002Accepted
FA -> RPB0.2820.2900.0704.0110.000Accepted
FC -> FG0.2980.2980.0724.1160.000Accepted
RBB -> FG−0.056−0.0570.0570.9850.162Rejected
RPB -> FG0.2090.2070.0613.4320.000Accepted
EFFS × FC -> FG−0.064−0.0650.0640.9920.161Rejected
CMMS × FC -> FG−0.068−0.0730.0521.3000.097Rejected
FA -> RBB -> FG−0.010−0.0110.0120.8900.187Rejected
FA -> FC -> FG0.1100.1130.0353.1550.001Accepted
FA -> RPB -> FG0.0590.0610.0272.2080.014Accepted
Disclaimer/Publisher’s Note: The statements, opinions and data contained in all publications are solely those of the individual author(s) and contributor(s) and not of MDPI and/or the editor(s). MDPI and/or the editor(s) disclaim responsibility for any injury to people or property resulting from any ideas, methods, instructions or products referred to in the content.

