
The Effect of Farmers’ Insurance-Adoption Behavior on Input for Beef-Cattle Disease Prevention: Endogenous Switching Regression Model


Abstract
1. Introduction
1.1. Current Challenges in Beef-Cattle Disease Prevention
1.2. Research Gap and Objectives
1.3. Research Contributions and Article Structure
2. Theoretical Analysis and Research Hypotheses
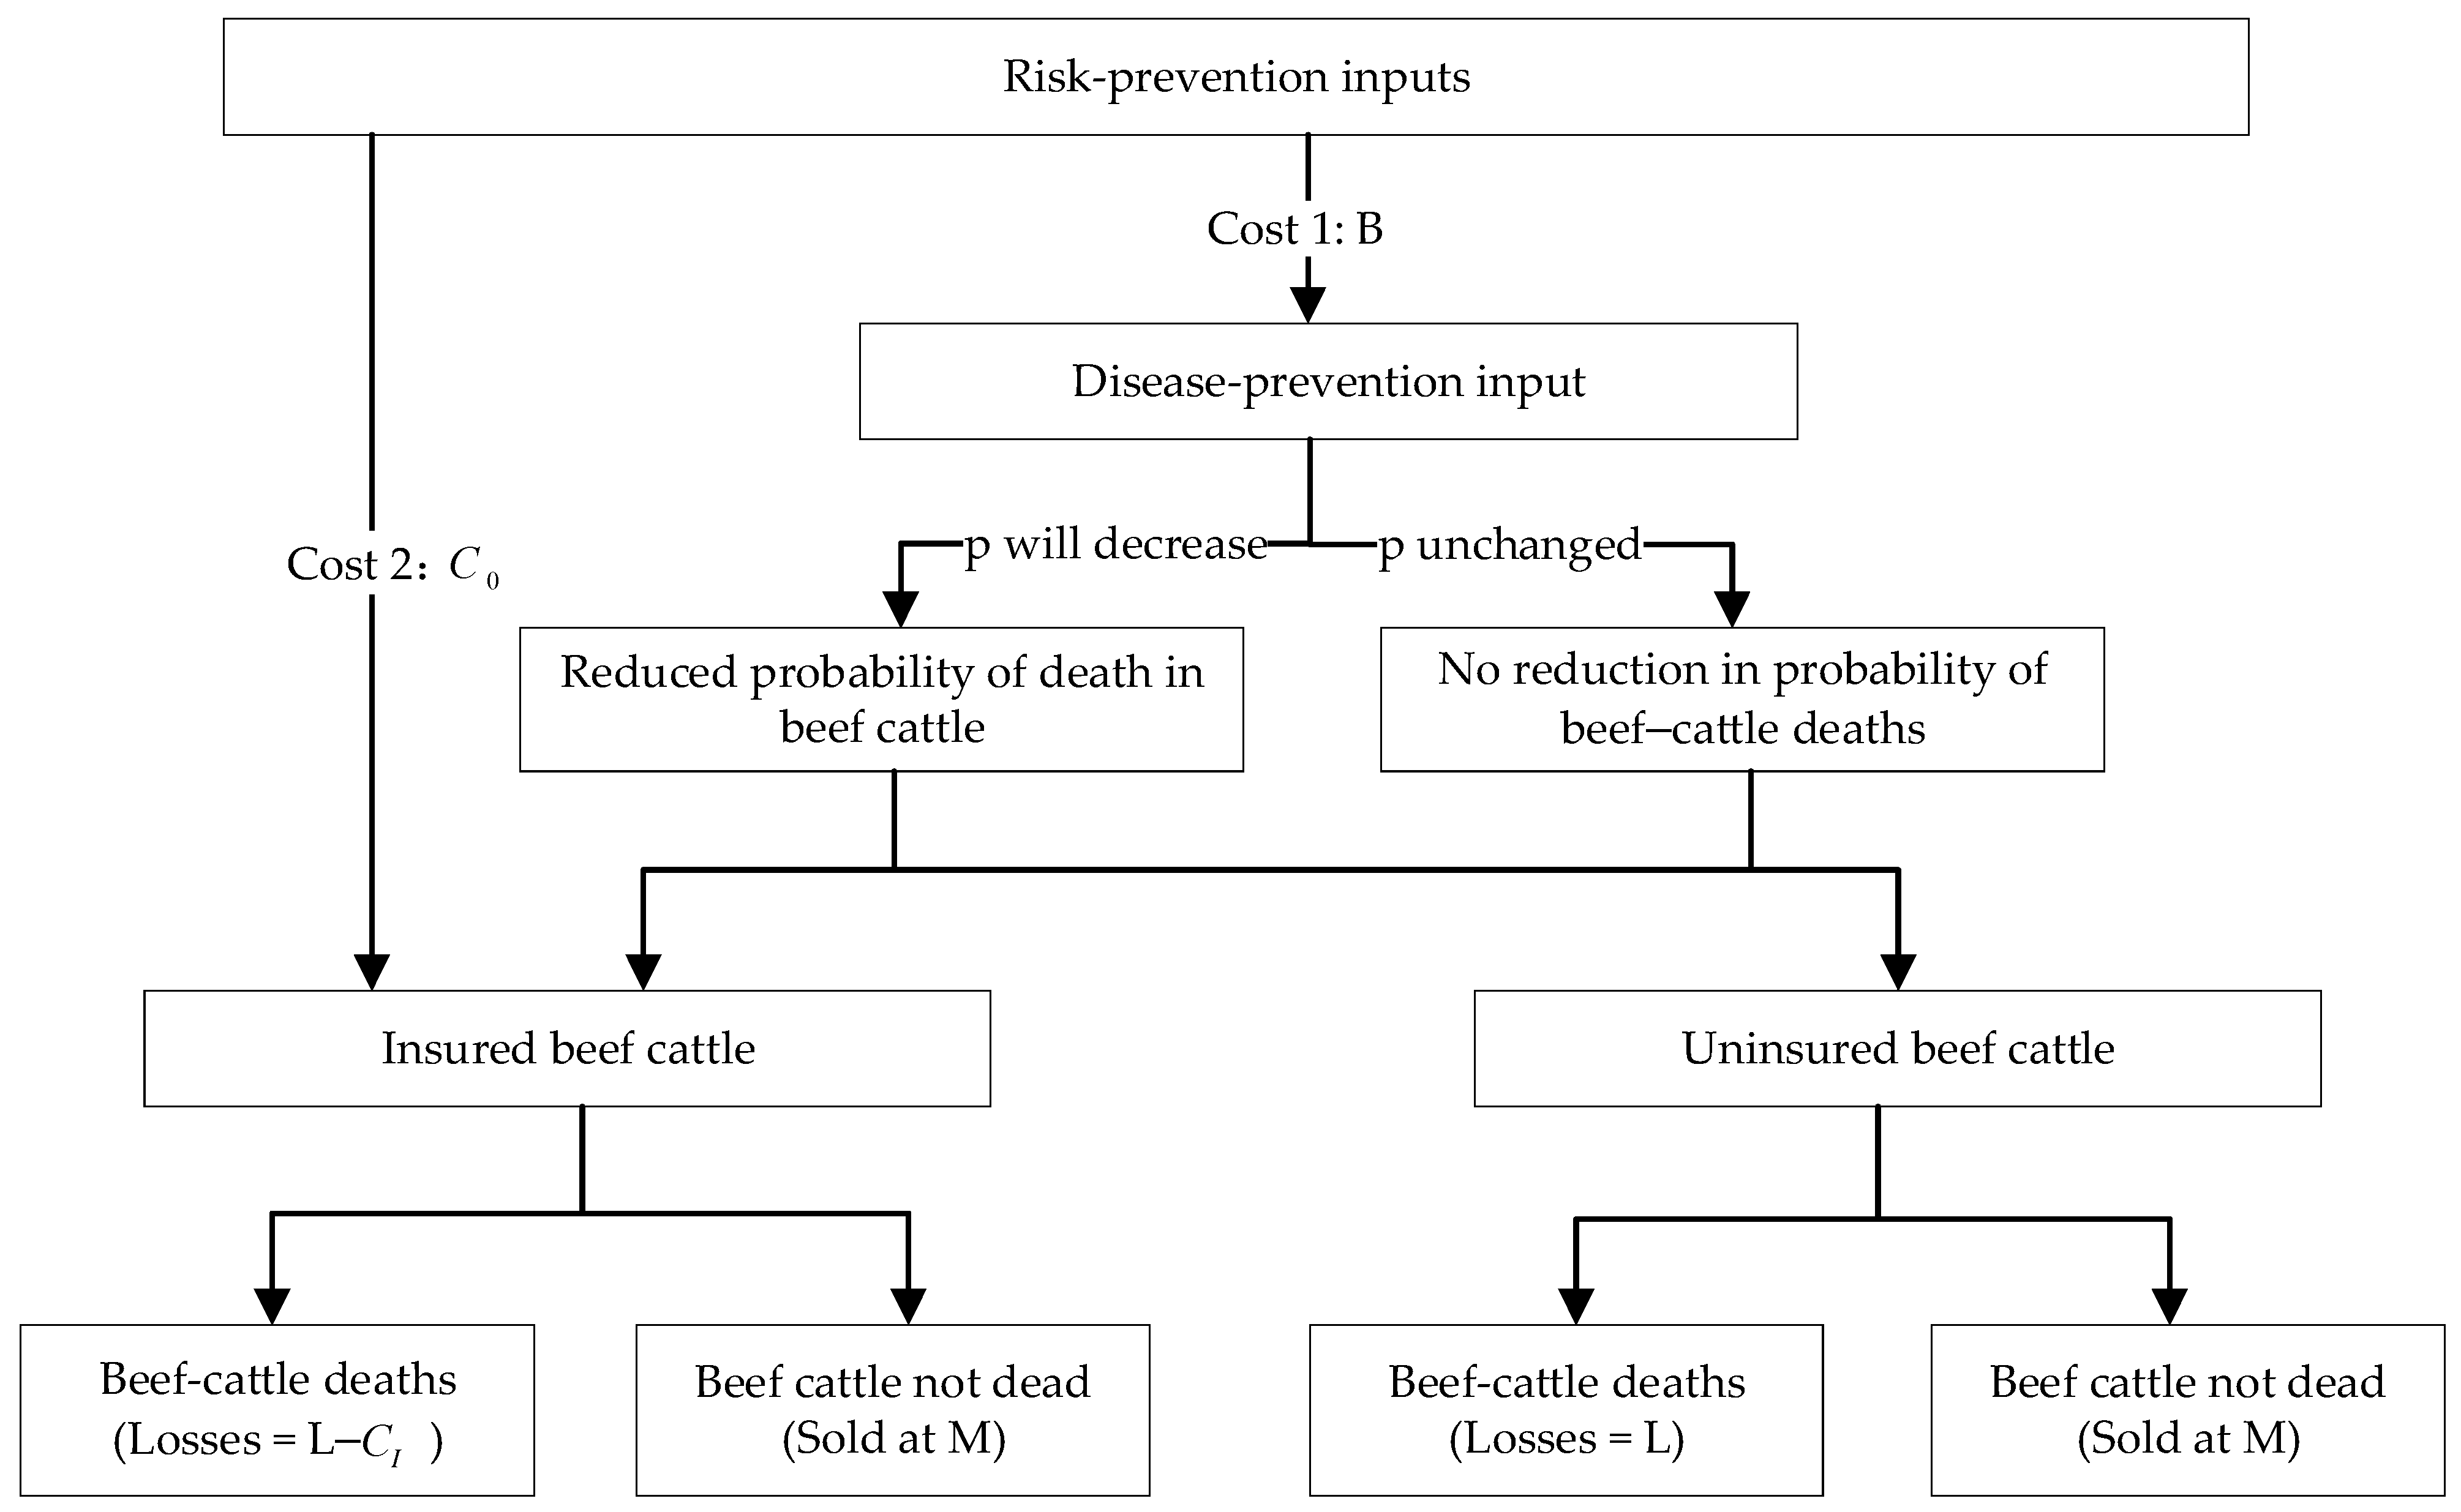
2.1. Basic Model and Cost Functions
2.2. Incorporating Insurance
2.3. Hypothesis Development
3. Study Area, Data, and Methods
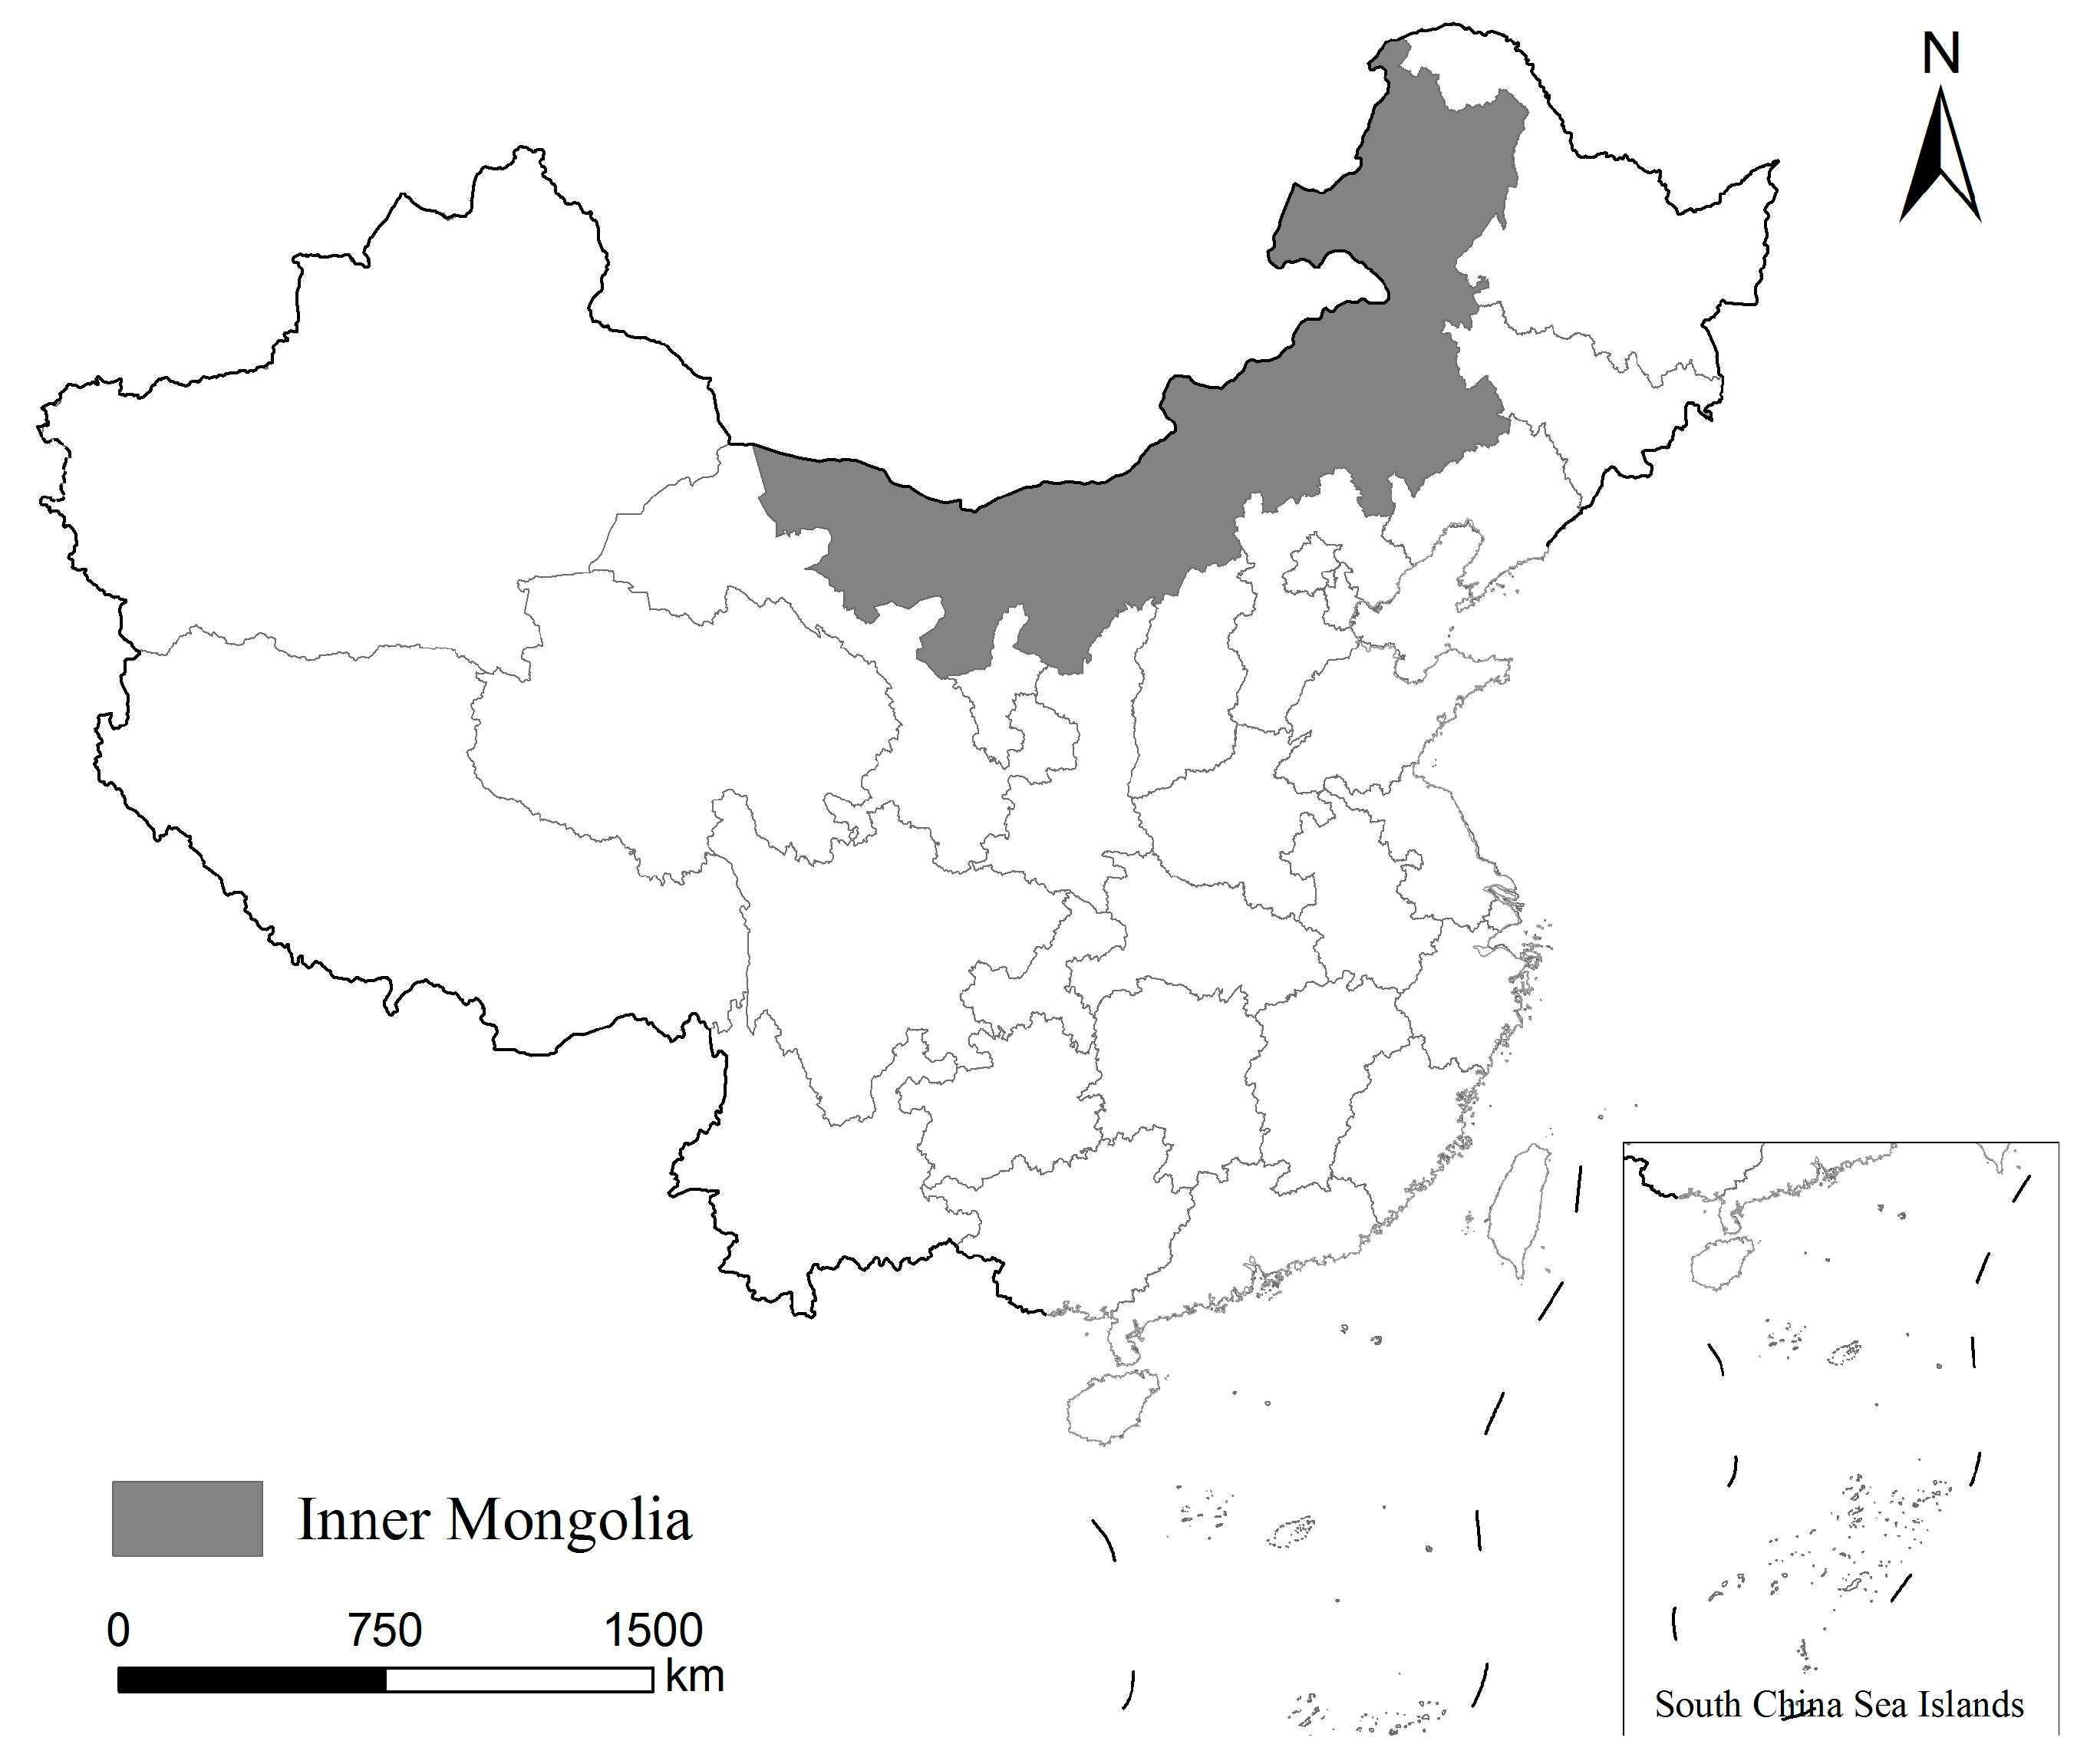
3.1. Study Area
3.2. Data Collection
3.3. Econometric Methods
3.4. Variable Design
4. Results
4.1. ESR-Model Estimation Results
4.2. Results of Treatment Effect Estimates
4.3. Robustness Check
4.4. Further Analysis: Purchase Price Movements in the Beef-Cattle Market
4.5. Heterogeneity Analysis
5. Discussion
5.1. Main Findings
5.2. Findings of the Heterogeneity Analysis
5.3. Policy Implications
5.4. Limitations and Future Research
6. Conclusions
Author Contributions
Funding
Institutional Review Board Statement
Data Availability Statement
Conflicts of Interest
Appendix A

| Month | Class I | Class II | Class III | ||
|---|---|---|---|---|---|
| FMD | Bovine Nodular Skin Disease | Infectious Bovine Rhinotracheitis | Bovine Tuberculosis | BVD | |
| January | − | 1 | 35 | 1 | 884 |
| February | − | − | 15 | 2 | 709 |
| March | − | − | 52 | 1 | 1456 |
| April | − | − | 25 | 1 | 810 |
| May | − | 3 | 19 | − | 901 |
| June | − | 3 | 9 | 43 | 659 |
| July | − | 7 | 11 | 2 | 891 |
| August | − | 22 | 56 | 32 | 1291 |
| September | 7 | 2 | 11 | 30 | 741 |
| October | 2 | − | 11 | 5 | 564 |
| November | 10 | 11 | 49 | 31 | 724 |
| December | − | − | 11 | 34 | 1205 |
| Total | 19 | 49 | 304 | 182 | 10,835 |
| Year | Cost of Substances and Services per Head (Yuan) | Labor Cost per Head (Yuan) | Total Cost per Head (Yuan) | Percentage of Insurance Claims (%) |
|---|---|---|---|---|
| 2022 | 12,506.52 | 1217.52 | 13,724.04 | 72.86% |
| 2021 | 12,620.99 | 1175.52 | 13,796.51 | 72.48% |
| 2020 | 11,491.02 | 1147.56 | 12,638.58 | 79.12% |
| Year | 2022 | 2021 | 2020 | 2019 | 2018 | 2017 | 2016 | 2015 | 2014 | 2013 |
|---|---|---|---|---|---|---|---|---|---|---|
| China | 718.3 | 697.5 | 672.4 | 667.3 | 644.1 | 634.6 | 716.8 | 700.1 | 689.2 | 673.2 |
| Hebei | 58.1 | 55.8 | 55.6 | 57.2 | 56.5 | 55.6 | 54.3 | 53.2 | 52.4 | 52.3 |
| Inner Mongolia | 71.9 | 68.7 | 66.3 | 63.8 | 61.4 | 59.5 | 55.6 | 52.9 | 54.5 | 51.8 |
| Liaoning | 32.3 | 31.5 | 31.0 | 29.6 | 27.5 | 25.1 | 41.6 | 40.3 | 42.8 | 43.2 |
| Jilin | 44.3 | 40.8 | 38.7 | 41.9 | 40.7 | 38.0 | 47.1 | 46.6 | 46.0 | 45.0 |
| Heilongjiang | 52.7 | 50.7 | 48.3 | 45.5 | 42.6 | 43.9 | 42.5 | 41.6 | 40.6 | 39.7 |
| Shandong | 60.4 | 61.3 | 59.7 | 73.3 | 76.4 | 75.9 | 67.0 | 67.9 | 66.6 | 67.9 |
| Henan | 36.7 | 35.5 | 36.7 | 36.2 | 34.8 | 35.0 | 83.0 | 82.6 | 82.1 | 80.6 |
| Sichuan | 38.6 | 36.9 | 37.0 | 36.4 | 34.5 | 33.3 | 36.9 | 35.4 | 33.4 | 31.1 |
| Yunnan | 43.6 | 42.0 | 40.9 | 39.0 | 36.0 | 35.8 | 35.2 | 34.3 | 33.6 | 31.8 |
| Xinjiang | 49.4 | 48.5 | 44.0 | 44.5 | 42.0 | 43.0 | 42.5 | 40.4 | 39.2 | 37.8 |
| Proportion of Inner Mongolia (%) | 10.0 | 9.8 | 9.8 | 9.6 | 9.5 | 9.4 | 7.8 | 7.6 | 7.9 | 7.7 |
| Ranking of Inner Mongolia | 1 | 1 | 1 | 2 | 2 | 2 | 3 | 4 | 3 | 4 |
| Year | 2022 | 2021 | 2020 | 2019 | 2018 | 2017 | 2016 | 2015 | 2014 | 2013 |
|---|---|---|---|---|---|---|---|---|---|---|
| China | 4839.9 | 4707.4 | 4565.5 | 4533.9 | 4397.5 | 4340.3 | 5110.0 | 5003.4 | 4929.2 | 4828.2 |
| Hebei | 353.2 | 339.9 | 335.2 | 349.1 | 345.6 | 340.5 | 331.9 | 325.4 | 320.6 | 325.3 |
| Inner Mongolia | 428.8 | 410.3 | 397.0 | 383.3 | 375.1 | 363.2 | 339.7 | 326.4 | 336.8 | 320.2 |
| Liaoning | 203.5 | 198.7 | 195.8 | 188.1 | 175.1 | 159.9 | 272.3 | 266.3 | 283.3 | 287.2 |
| Jilin | 262.3 | 242.4 | 238.7 | 258.7 | 249.6 | 233.6 | 306.4 | 303.2 | 299.6 | 297.0 |
| Heilongjiang | 311.4 | 299.7 | 289.4 | 281.0 | 270.2 | 281.5 | 274.3 | 269.7 | 263.6 | 256.2 |
| Shandong | 275.6 | 280.0 | 275.7 | 345.9 | 363.4 | 361.6 | 445.5 | 447.5 | 440.8 | 443.4 |
| Henan | 243.5 | 235.9 | 241.2 | 238.4 | 231.2 | 233.0 | 550.2 | 548.6 | 546.0 | 535.5 |
| Sichuan | 306.0 | 293.1 | 296.4 | 291.7 | 276.2 | 267.3 | 305.2 | 295.5 | 278.7 | 264.7 |
| Yunnan | 360.1 | 345.2 | 335.9 | 326.4 | 309.1 | 307.8 | 300.4 | 292.8 | 287.3 | 275.7 |
| Xinjiang | 292.6 | 289.2 | 266.3 | 270.9 | 253.5 | 259.3 | 258.1 | 247.3 | 239.4 | 230.3 |
| Proportion of Inner Mongolia (%) | 8.9 | 8.7 | 8.7 | 8.5 | 8.5 | 8.4 | 6.6 | 6.5 | 6.8 | 6.6 |
| Ranking of Inner Mongolia | 1 | 1 | 1 | 1 | 1 | 1 | 3 | 3 | 3 | 4 |
| Year | 2022 | 2021 | 2020 | 2019 | 2018 | 2017 | 2016 | 2015 | 2014 | 2013 |
|---|---|---|---|---|---|---|---|---|---|---|
| China | 8454.1 | 8004.4 | 7685.1 | 6998.0 | 6618.4 | 6617.9 | 7441.0 | 7372.9 | 7040.9 | 6838.6 |
| Inner Mongolia | 658.9 | 585.9 | 538.3 | 499.8 | 489.8 | 526.5 | 444.8 | 423.2 | 388.3 | 369.9 |
| Jilin | 377.8 | 323.6 | 270.5 | 316.2 | 309.4 | 322.0 | 400.4 | 420.8 | 401.8 | 408.6 |
| Henan | 322.8 | 289.3 | 270.0 | 257.3 | 231.1 | 230.5 | 620.8 | 650.4 | 626.6 | 610.1 |
| Sichuan | 583.6 | 524.8 | 547.8 | 502.3 | 476.2 | 494.8 | 552.8 | 561.8 | 529.4 | 487.9 |
| Yunnan | 835.0 | 824.5 | 810.4 | 777.5 | 755.8 | 747.7 | 721.8 | 688.2 | 681.3 | 658.9 |
| Tibet | 555.5 | 544.7 | 531.3 | 525.2 | 498.4 | 470.0 | 466.6 | 471.3 | 467.5 | 467.5 |
| Gansu | 495.5 | 480.1 | 450.3 | 427.1 | 410.5 | 394.1 | 416.4 | 420.1 | 423.8 | 402.1 |
| Xinjiang | 632.3 | 628.7 | 634.8 | 475.5 | 4920. | 521.9 | 457.9 | 429.6 | 427.1 | 423.6 |
| Proportion of Inner Mongolia (%) | 7.8 | 7.3 | 7.0 | 7.1 | 7.4 | 8.0 | 6.0 | 5.7 | 5.5 | 5.4 |
| Ranking of Inner Mongolia | 2 | 3 | 4 | 4 | 4 | 2 | 6 | 6 | 8 | 8 |
| League (or City) | Beef-Cattle Output (10,000 Head/Year) | Total Beef Production (Tons/Year) | Year-End Stock of Beef Cattle (10,000 Head/Year) |
|---|---|---|---|
| Tongliao City | 105.09 (Ranked first) | 178,669 (Ranked first) | 237.2 (Ranked first) |
| Chifeng City | 80.37 (Ranked second) | 132,886 (Ranked second) | 139.01 (Ranked second) |
| Xilingol League | 71.3 | 119,909 | 121.03 |
| Hulunbuir City | 60.26 | 94,590 | 103.35 |
| Hinggan League | 29.44 | 51,556 | 76.32 |
| Baotou City | 21.25 | 37,139 | 15.69 |
| Hohhot City | 17.59 | 31,009 | 38.57 |
| Ordos City | 15.64 | 26,035 | 33.37 |
| Ulanqab City | 13.06 | 22,003 | 23.63 |
| Bayannur City | 11.84 | 20,039 | 25.6 |
| Alxa League | 2.74 | 4282 | 5.67 |
| Wuhai City | 0.23 | 589 | 0.91 |
| Total | 428.81 | 718,706 | 820.35 |
| Proportion of Tongliao City (%) | 0.25 | 0.25 | 0.29 |
| Proportion of Chifeng City (%) | 0.19 | 0.18 | 0.17 |
Appendix B
| Variable | Disease-Prevention Input |
|---|---|
| Insurance-adoption behavior | 0100 ** |
| Sex | 0.152 *** |
| Age | −0.152 *** |
| Educational level | 0.116 ** |
| Farming year | −0.085 * |
| Farming scale | 0.259 *** |
| Farm size | 0.247 *** |
| Net income from farming | 0.230 *** |
| Green farming technology | 0.080 * |
| Mortality rate | 0.098 ** |
| Risk perception | 0.109 ** |
| Risk disposition | 0.053 |
| Disease cognitive skill | 0.135 *** |
| Unit frequency of disease prevention | −0.088 * |
| Distance | 0.103 ** |
| Price fluctuations | −0.127 *** |
| Regional variable | 0.145 *** |
| Variable | VIF | 1/VIF |
|---|---|---|
| Sex | 1.05 | 0.95 |
| Age | 2.22 | 0.45 |
| Educational level | 1.14 | 0.88 |
| Farming year | 2.12 | 0.47 |
| Farming scale | 4.15 | 0.24 |
| Farm size | 3.44 | 0.29 |
| Net income from farming | 1.34 | 0.74 |
| Green farming technology | 1.12 | 0.89 |
| Mortality rate | 1.05 | 0.95 |
| Risk perception | 1.06 | 0.94 |
| Risk disposition | 1.04 | 0.96 |
| Disease cognitive skill | 1.12 | 0.89 |
| Unit frequency of disease prevention | 1.33 | 0.75 |
| Price fluctuations | 1.08 | 0.93 |
| Regional variable | 1.31 | 0.76 |
| Insurance awareness | 1.19 | 0.84 |
| Mean VIF | 1.61 | − |
| Variable | VIF | 1/VIF |
|---|---|---|
| Insurance | 1.26 | 0.80 |
| Sex | 1.05 | 0.95 |
| Age | 2.22 | 0.45 |
| Educational level | 1.14 | 0.88 |
| Farming year | 2.12 | 0.47 |
| Farming scale | 4.06 | 0.25 |
| Farm size | 3.44 | 0.29 |
| Net income from farming | 1.38 | 0.73 |
| Green farming technology | 1.18 | 0.85 |
| Mortality rate | 1.07 | 0.94 |
| Risk perception | 1.06 | 0.94 |
| Risk disposition | 1.04 | 0.96 |
| Disease cognitive skill | 1.11 | 0.90 |
| Unit frequency of disease prevention | 1.33 | 0.75 |
| Distance | 1.05 | 0.95 |
| Price fluctuations | 1.09 | 0.92 |
| Regional variable | 1.29 | 0.77 |
| Mean VIF | 1.58 | − |
| Variable | Decision Equations (Insured Behavior) | Impact Effect Equation (Disease-Prevention Input) | |
|---|---|---|---|
| Insured Group | Uninsured Group | ||
| Sex | 0.661 (0.490) | 0.260 (0.450) | 0.409 (0.411) |
| Age | 0.012 (0.010) | −0.003 (0.009) | −0.005 (0.011) |
| Educational level | 0.052 ** (0.026) | 0.003 (0.021) | 0.028 (0.026) |
| Farming year | −0.008 (0.008) | −0.003 (0.007) | −0.004 (0.008) |
| Farming scale | −0.004 (0.004) | −0.008 ** (0.003) | 0.002 (0.003) |
| Farm size | −0.004 * (0.003) | 0.006 ** (0.002) | −0.001 (0.002) |
| Net income from farming | 0.247 *** (0.059) | 0.034 (0.053) | 0.040 (0.051) |
| Green farming technology | 0.492 *** (0.097) | −0.086 (0.100) | 0.186 * (0.099) |
| Mortality rate | 3.517 *** (1.180) | 1.942 ** (0.943) | 2.508 ** (1.264) |
| Risk perception | 0.309 (0.342) | 0.186 (0.330) | 0.422 (0.318) |
| Risk disposition | −0.060 (0.076) | −0.044 (0.062) | 0.024 (0.078) |
| Disease cognitive skill | −0.019 (0.022) | −0.005 (0.018) | 0.048 ** (0.022) |
| Unit frequency of disease prevention | 0.121 (0.152) | 0.480 *** (0.113) | 0.891 *** (0.164) |
| Distance | − | 0.198 * (0.117) | −0.039 (0.139) |
| Price fluctuations | 0.007 (0.140) | −0.030 (0.116) | −0.128 (0.145) |
| Regional variable | 0.584 *** (0.158) | 0.129 (0.151) | 0.538 *** (0.167) |
| Insurance awareness | 0.432 *** (0.057) | − | − |
| Constant | −7.302 *** (1.091) | 2.743 ** (1.097) | 0.903 (0.907) |
| Observations | 447 | 195 | 252 |
| −0.279 *** (0.051) | |||
| −0.044 (0.230) | |||
| 0.138 ** (0.064) | |||
| 0.883 *** (0.218) | |||
| Wald test | 68.100 *** | ||
| Log likelihood | −803.538 | ||
| LR test | 11.870 *** | ||
References
- Chang, Q.; Zhou, H.; Khan, N.; Ma, J. Can Climate Change Increase the Spread of Animal Diseases? Evidence from 278 Villages in China. Atmosphere 2023, 14, 1581. [Google Scholar] [CrossRef]
- Donadeu, M.; Nwankpa, N.; Abela-Ridder, B.; Dungu, B. Strategies to increase adoption of animal vaccines by smallholder farmers with focus on neglected diseases and marginalized populations. PLoS Negl. Trop. Dis. 2019, 13, e0006989. [Google Scholar] [CrossRef]
- OIE. Their Health, Our Future, Activity Report 2019; OIE: Paris, France, 2019. [Google Scholar]
- Ellis-Iversen, J.; Cook, A.J.C.; Watson, E.; Nielen, M.; Larkin, L.; Wooldridge, M.; Hogeveen, H. Perceptions, circumstances and motivators that influence implementation of zoonotic control programs on cattle farms. Prev. Vet. Med. 2010, 93, 276–285. [Google Scholar] [CrossRef] [PubMed]
- Rushton, J.; Bruce, M.; Bellet, C.; Torgerson, P.; Shaw, A.; Marsh, T.; Pigott, D.; Stone, M.; Pinto, J.; Mesenhowski, S.; et al. Initiation of Global Burden of Animal Diseases Programme. Lancet 2018, 392, 538–540. [Google Scholar] [CrossRef]
- Acosta, A.; Lloyd, T.; McCorriston, S.; Lan, H. The ripple effect of animal disease outbreaks on food systems: The case of African Swine Fever on the Chinese pork market. Prev. Vet. Med. 2023, 215, 105912. [Google Scholar] [CrossRef]
- Soliman, T.; Barnes, A.; Helgesen, I.S. The hidden carbon impact of animal disease. PLoS ONE 2023, 18, e0292659. [Google Scholar] [CrossRef]
- Qian, Y.; Song, K.; Hu, T.; Ying, T. Environmental status of livestock and poultry sectors in China under current transformation stage. Sci. Total Environ. 2018, 622–623, 702–709. [Google Scholar] [CrossRef]
- Zhang, Y.; Yan, J. The illusion of peaking carbon emissions in China’s beef cattle industry: An empirical analysis and test based on EKC theory. Issues Agric. Econ. 2022, 06, 93–105. [Google Scholar] [CrossRef]
- Ma, X.; Wang, M. Comparison of economic efficiency of beef cattle production in typical countries and enlightenment to China. J. Northwest A & F Univ. (Soc. Sci. Ed.) 2023, 23, 138–152. [Google Scholar] [CrossRef]
- MOA. The List of Animal Disease Types of Class I, II and III; Ministry of Agriculture of the People’s Republic of China: Beijing, China, 2022; No. 57. Available online: http://www.moa.gov.cn/govpublic/xmsyj/202206/t20220629_6403635.htm (accessed on 20 October 2024).
- Asseldonk, M.V.; Meuwissen, M.P.; Huirne, R.B.; Wilkens, E. Public and Private Schemes Indemnifying Epidemic Livestock Losses in the European Union: A Review; The Economics of Livestock Disease Insurance: Concepts, Issues and International Case Studies; CABI Publishing: Wallingford, UK, 2006; pp. 115–125. [Google Scholar] [CrossRef]
- Hodnik, J.J.; Knific, T.; Starič, J.; Toplak, I.; Ocepek, M.; Hostnik, P.; Ježek, J. Overview of Slovenian Control Programmes for Selected Cattle Diseases, Listed Under Category C, D or E of the European Animal Health Law. Front. Vet. Sci. 2021, 8, 674515. [Google Scholar] [CrossRef]
- Buchan, M.S.; Lhermie, G.; Mijar, S.; Pajor, E.; Orsel, K. Individual drivers and barriers to adoption of disease control and welfare practices in dairy and beef cattle production: A scoping review. Front. Vet. Sci. 2023, 10, 1104754. [Google Scholar] [CrossRef]
- PC. Animal Epidemic Prevention Law of the People’s Republic of China; The National People’s Congress of the People’s Republic of China: Beijing, China, 2021. Available online: http://www.npc.gov.cn/npc/c2/c30834/202101/t20210122_309854.html (accessed on 10 May 2024).
- MOA. Guiding Opinions on the Implementation of Financial Support Policies for Animal Epidemic Disease Prevention and Control; Ministry of Agriculture of the People’s Republic of China: Beijing, China, 2017. Available online: http://www.moa.gov.cn/nybgb/2017/dlq/201712/t20171231_6133724.htm (accessed on 10 May 2024).
- Tago, D.; Hammitt, J.K.; Thomas, A.; Raboisson, D. The Impact of Farmers’ Strategic Behavior on the Spread of Animal Infectious Diseases. PLoS ONE 2016, 11, e0157450. [Google Scholar] [CrossRef]
- Khan, M.A.; Chander, M.; Bardhan, D. Willingness to pay for cattle and buffalo insurance: An analysis of dairy farmers in central India. Trop. Anim. Health Prod. 2013, 2, 461–468. [Google Scholar] [CrossRef]
- Prabu, M.; Pandian, A.S.S.; Shree, J.S. Livestock insurance scheme under the National Livestock Mission, India-certain constraints as perceived by the beneficiaries. Acta Agric. Scand. Sect. A-Anim. Sci. 2023, 72, 158–164. [Google Scholar] [CrossRef]
- CPG. National Medium-to-Long-Term Plan for the Prevention and Control of Animal Diseases (2012–2020); Central People’s Government of the People’s Republic of China: Beijing, China, 2012; No. 31. Available online: https://www.gov.cn/zhengce/zhengceku/2012-05/25/content_2770.htm (accessed on 10 May 2024).
- Campbell, V.L.; Thompson, J.M.; Apriesnig, J.L.; Tonsor, G.T.; Pendell, D.L. Producer perceptions of US livestock indemnity policy. Appl. Anim. Sci. 2024, 40, 542–548. [Google Scholar] [CrossRef]
- Zhao, Y.; Zhang, X. A study of the impact of policy dairy insurance on farmers’ mortality losses in dairy breeding. Insur. Stud. 2018, 9, 66–80. [Google Scholar] [CrossRef]
- Ye, Z. Thoughts on improving China’s agricultural insurance system. J. Financ. Res. 2018, 12, 174–188. [Google Scholar]
- Miranda, M.J.; Glauber, J.W. Systemic Risk, Reinsurance, and the Failure of Crop Insurance Markets. Am. J. Agric. Econ. 1997, 79, 206–215. [Google Scholar] [CrossRef]
- Yi, F.; Lu, Y.; Wang, K. The Paradox of Agricultural Production Risks and Compensation Levels under the “Fixed Subsidy” Model of Premium Subsidies: A Case Study of Policy-based Corn Insurance-Small Losses, Small Compensation; Large Losses, Large Compensation. Chin. Rural. Econ. 2022, 03, 128–144. [Google Scholar]
- Du, X.; Feng, H.; Hennessy, D.A. Rationality of Choices in Subsidized Crop Insurance Markets. Am. J. Agric. Econ. 2017, 99, 732–756. [Google Scholar] [CrossRef]
- Goodwin, B.K.; Smith, V.H. What Harm Is Done By Subsidizing Crop Insurance? Am. J. Agric. Econ. 2013, 95, 732–756. [Google Scholar] [CrossRef]
- Hazell, P.; Varangis, P. Best practices for subsidizing agricultural insurance. Glob. Food Secur. 2020, 25, 100326. [Google Scholar] [CrossRef]
- Tuo, G. China Agricultural Insurance Development Report 2011; China Agriculture Press: Beijing, China, 2012. [Google Scholar]
- Smith, V.H. The US federal crop insurance program: A case study in rent seeking. Agric. Financ. Rev. 2020, 80, 339–358. [Google Scholar] [CrossRef]
- Zhao, C.; Wang, Z.; Yang, D.; Cao, W. Research on Enterprise Catering Behavior and Government Subsidy Performance: An Analysis Based on Different Profit Conditions of Enterprises. China Ind. Econ. 2015, 07, 130–145. [Google Scholar] [CrossRef]
- Kousky, C. The Role of Natural Disaster Insurance in Recovery and Risk Reduction. Annu. Rev. Resour. Econ. 2019, 11, 399–418. [Google Scholar] [CrossRef]
- Martínez-López, B.; Ivorra, B.; Fernández-Carrión, E.; Perez, A.M.; Medel-Herreroe, A.; Sánchez-Vizcaíno, F.; Gortázar, C.; Ramos, A.M.; Sánchez-Vizcaíno, J.M. A multi-analysis approach for space-time and economic evaluation of risks related with livestock diseases: The example of FMD in Peru. Prev. Vet. Med. 2014, 114, 47–63. [Google Scholar] [CrossRef]
- Tuo, G.; Zhu, J. Compulsory and Moral Hazard in Policy Agricultural Insurance. China Insurance Newspape, 2 April 2007. [Google Scholar]
- Lin, G.; Wang, S. A study of the impact of poultry insurance on breeders’ factor inputs for disease prevention and control. J. Agrotech. Econ. 2013, 12, 94–102. [Google Scholar] [CrossRef]
- Smith, V.H.; Goodwin, B.K. Crop insurance, moral hazard, and agricultural chemical use. Am. J. Agric. Econ. 1996, 78, 428–438. [Google Scholar] [CrossRef]
- Mishra, A.K.; Wesley, N.R.; El-Osta, H.S. Is moral hazard good for the environment? Revenue insurance and chemical input use. J. Environ. Manag. 2005, 74, 11–20. [Google Scholar] [CrossRef]
- Zhang, C.; Zhang, C.; Qiu, H.; Lv, K. Impact of agricultural insurance participation behavior on farmers’ inputs: The case of organic fertiliser inputs. J. Agrotech. Econ. 2017, 6, 79–87. [Google Scholar] [CrossRef]
- Zhang, Z.; Mu, Y.; Hou, L. Does participation in agricultural insurance optimise factor allocation? Analysis of production effects of endogenisation of farmers’ insurance behavior. Chin. Rural. Econ. 2018, 10, 53–70. [Google Scholar]
- Norton, M.; Sprundel, G.V.; Turvey, C.G.; Meuwissen, M.P.M. Applying weather index insurance to agricultural pest and disease risks. Int. J. Pest Manag. 2016, 62, 195–204. [Google Scholar] [CrossRef]
- Zhang, C.; Lv, K.; Chen, X. Does agricultural insurance affect pesticide application by farmers? Evidence of production from food farmers in four provinces. J. China Agric. Univ. 2019, 24, 184–194. [Google Scholar] [CrossRef]
- Babcock, B.A.; Hennessy, D.A. Input demand under yield and revenue insurance. Am. J. Agric. Econ. 1996, 78, 416–427. [Google Scholar] [CrossRef]
- Ahsan, S.M.; Ali, A.G.; Kurian, N.J. Toward a theory of agricultural insurance. Am. J. Agric. Econ. 1982, 64, 520–552. [Google Scholar] [CrossRef]
- Chambers, R.G. Insurability and moral hazard in agricultural insurance markets. Am. J. Agric. Econ. 1989, 71, 604–616. [Google Scholar] [CrossRef]
- Rao, X.; Zhang, Y. Livestock insurance, moral hazard, and farmers’ decisions: A field experiment among hog farms in China. Geneva Pap. Risk Insur.-Issues Pract. 2020, 45, 134–156. [Google Scholar] [CrossRef]
- Sibiko, W.K.; Qaim, M. Weather index insurance, agricultural input use, and crop productivity in Kenya. Food Secur. 2020, 12, 151–167. [Google Scholar] [CrossRef]
- Horowitz, J.K.; Lichtenberg, E. Insurance, moral hazard, and chemical use in agriculture. Am. J. Agric. Econ. 1993, 75, 425–434. [Google Scholar] [CrossRef]
- Zhong, F.; Ning, M.; Xing, L.; Miao, Q. Study on the relationship between agricultural insurance and agrochemical application: An empirical analysis of farmers in the Manas River Basin, Xinjiang. China Econ. Q. 2007, 1, 291–308. [Google Scholar] [CrossRef]
- Chang, H.; Mishra, A.K. Chemical usage in production agriculture: Do crop insurance and Off-Farm work play a part? J. Environ. Manag. 2012, 105, 76–82. [Google Scholar] [CrossRef]
- Zhang, Y.; Zhu, X.; Turvey, G.C. On the impact of agricultural livestock microinsurance on death-loss, production and vaccine use: Observations from a quasi-natural experiment in China. Geneva Pap. Risk Insur.-Issues Pract. 2016, 41, 225–243. [Google Scholar] [CrossRef]
- Zhang, X.; Zhao, Y. A study of the impact of dairy cattle insurance on farmers’ inputs to disease risk prevention and control. Insur. Stud. 2020, 6, 69–80. [Google Scholar] [CrossRef]
- Reeling, J.; Horan, D. Self-Protection, strategic interactions, and the relative endogeneity of disease risks. Am. J. Agric. Econ. 2015, 97, 452–468. [Google Scholar] [CrossRef]
- Tian, P.; Zheng, J.; Sun, H. Information asymmetry, farmers’ prevention and control of major animal diseases and policy incentives: A principal-agent theory based perspective. J. Agrotech. Econ. 2019, 1, 54–68. [Google Scholar] [CrossRef]
- Koundouri, P.; Laukkanen, M.; Myyrä, S.; Nauges, C. The effects of EU agricultural policy changes on farmers’ risk attitudes. Eur. Rev. Agric. Econ. 2009, 36, 53–77. [Google Scholar] [CrossRef]
- Lence, S.H. Using Consumption and Asset Return Data to Estimate Farmers’ Time Preferences and Risk Attitudes. Am. J. Agric. Econ. 2000, 82, 934–947. [Google Scholar] [CrossRef]
- Niemi, J.K.; Heikkilä, J. Impact of risk aversion and disease outbreak characteristics on the incentives of producers as a group to participate in animal disease insurance-A simulation. Prev. Vet. Med. 2011, 100, 4–14. [Google Scholar] [CrossRef]
- Jin, D.; Pan, Y. A primer on moral hazard regulation in policy-based agricultural insurance: Based on the perspective of information economics. Issues Agric. Econ. 2009, 30, 25–33. [Google Scholar] [CrossRef]
- Tuo, G.; Han, Z. Several issues worth paying attention to in agricultural insurance operation: Thoughts triggered by an agricultural insurance claim case. China Insur. 2019, 7, 31–36. [Google Scholar]
- Bee, C. Analysis Brief of China’s Beef Cattle Industry in 2023; Bee Cloud: Shenzhen, China, 2023; Available online: https://cloud.abeedata.com/ (accessed on 30 June 2024).
- Zhao, B.; Gao, Y.; Han, C.; Han, L. Research on high-quality development of beef cattle industry in Inner Mongolia Autonomous Region. Mod. Anim. Husb. 2024, 44, 43–45. [Google Scholar] [CrossRef]
- Maddala, G.S. Limited-Dependent and Qualitative Variables in Econometrics; Cambridge University Press: Cambridge, UK, 1983. [Google Scholar] [CrossRef]
- Lokshin, M.; Sajaia, Z. Maximum Likelihood Estimation of Endogenous Switching Regression Models. Stata J. 2004, 4, 282–289. [Google Scholar] [CrossRef]
- Li, C.; Liu, X. Entrepreneurial effects of land transfer: An empirical analysis based on the endogenous switching probit model. Chin. Rural. Econ. 2020, 5, 96–112. [Google Scholar]
- Li, J.; Lu, Q. The impact of joining a cooperative on the land transfer behavior of farmers. Resour. Sci. 2022, 44, 1181–1195. [Google Scholar]
- Heckman, J.; Ichimura, H.; Todd, P. Matching as an econometric evaluation estimator. Rev. Econ. Stud. 1998, 65, 261–294. [Google Scholar] [CrossRef]
- Zhang, Y.; Yang, F. Research on livestock insurance, demand and participation rate: An empirical study based on microdata of pig breeders in Zhejiang Province. Financ. Trade Econ. 2012, 2, 58–65. [Google Scholar] [CrossRef]
- Li, W.; Wang, G. The impact of social capital on farmers’ adoption of farm waste resource utilisation tchnologies: The moderating role of environmental regulation policies. J. Agro-For. Econ. Manag. 2021, 20, 199–208. [Google Scholar] [CrossRef]
- Liu, Q.; Xiao, H. Has training on environmentally friendly technologies contributed to increased green productivity of breeders? A study based on 614 breeders in 11 provinces (or districts). Rural. Econ. 2022, 4, 52–62. [Google Scholar]
- Zhang, G.; Zhang, S. Analysis of factors influencing farmers’ prevention and control behaviors under the risk of animal epidemics. Rural. Econ. 2013, 2, 105–108. [Google Scholar]
- Mohammed, M.A.; Ortmann, G.F. Factors influencing the adoption of livestock insurance by commercial dairy farmers in three Zobatat of Eritrea. Agrekon 2005, 44, 172–186. [Google Scholar] [CrossRef]
- Amarea, A.; Simaneb, B.; Nyangagac, J.; Defisaa, A.; Hamzaa, D.; Gurmessaa, B. Index-based livestock insurance to manage climate risks in Borena zone of southern Oromia, Ethiopia. Clim. Risk Manag. 2019, 25, 100191. [Google Scholar] [CrossRef]
- Dong, H.; Jimoh, S.O.; Hou, Y.; Hou, X. Willingness to Pay for Livestock Husbandry Insurance: An Empirical Analysis of Grassland Farms in Inner Mongolia, China. Sustainability 2020, 12, 7331. [Google Scholar] [CrossRef]
- Wang, E.; Yu, Y. Analysis of farmers’ willingness to pay for crop insurance at multiple coverage levels. Issues Agric. Econ. 2010, 7, 61–69. [Google Scholar] [CrossRef]
- Li, D.; Liu, C. Farmers’ needs for policy grain crop insurance from the perspective of insurance management: A questionnaire survey based on 740 grain growing farmers in the “Two Great Plains” of Heilongjiang province. Insur. Stud. 2014, 12, 70–77. [Google Scholar] [CrossRef]
- Liu, C.; Yin, J. Analysis of the demand specificity and influencing factors of China’s policy pig insurance: Based on the empirical data of Beijing breeders. Issues Agric. Econ. 2014, 35, 101–105. [Google Scholar] [CrossRef]
- Zhang, Y.; Zhan, J.; Chen, C. The impact of specialisation and awareness on farmers’ demand for pig price index insurance. Chin. Rural. Econ. 2017, 2, 70–83. [Google Scholar]
- Li, Y.; Ma, J. Differential analysis of the income effect of scientific fertilisation techniques: Empirical estimation based on initial endowment of food and agriculture. J. Agrotech. Econ. 2021, 7, 18–32. [Google Scholar] [CrossRef]
- Yin, Z.; Liu, T.; Zhang, C. Impact of rural labour mobility on household savings rates. China Ind. Econ. 2020, 1, 24–42. [Google Scholar] [CrossRef]
- Ma, B. The impact of plantation insurance on farmers’ cropping decisions: A literature review perspective. J. Adm. Manag. Inst. Minist. Agric. Rural. Aff. 2023, 14, 38–46. [Google Scholar]
- Wang, J.; Hu, X. Factors Influencing Disease Prevention and Control Behaviors of Hog Farmers. Animals 2023, 13, 787. [Google Scholar] [CrossRef]
- Luo, L.; Liu, F.; He, W.; He, Z. Analysis of factors influencing disease prevention and control behavior on livestock farms: A study based on meat, beef and sheep breeders in Qinghai Province. Chin. J. Anim. Sci. 2015, 51, 7–11. [Google Scholar]
- Liu, M.; Lu, Q.; Zhang, S. Avian influenza prevention and control behavior of breeders in different modes and their influencing factors: Based on data from 363 surveys of Free-Range and Large-Scale breeders. J. Hunan Agric. Univ. (Soc. Sci.) 2016, 17, 22–28. [Google Scholar] [CrossRef]
- Dercon, S.; Christiaensen, L. Consumption risk, technology adoption and poverty traps: Evidence from Ethiopia. J. Dev. Econ. 2011, 96, 159–173. [Google Scholar] [CrossRef]
- Hall, D.C.; Knight, T.O.; Coble, K.H.; Baquet, A.E.; Patrick, G.F. Analysis of Beef Producers’ Risk Management Perceptions and Desire for Further Risk Management Education. Rev. Agric. Econ. 2003, 25, 430–448. [Google Scholar] [CrossRef]
- Boyer, C.N.; DeLong, K.L.; Griffith, A.P.; Martinez, C.C. Factors influencing United States cattle producers use of livestock risk protection. Agric. Econ. 2024, 55, 677–689. [Google Scholar] [CrossRef]
- Yan, J.; Wang, M. Research on the coupling and coordination relationship of breeding system of beef cattle industry in China. Econ. Probl. 2024, 7, 112–121. [Google Scholar] [CrossRef]
- Wang, M. We will support the steady development of the beef cattle industry. Economic Daily, 11 October 2024; Current Affairs Commentaries: 005. [Google Scholar] [CrossRef]
| Variable | Definition | |
|---|---|---|
| Dependent variable | Disease-prevention input | The sum of the costs for voluntary vaccination, deworming, and shed disinfection (yuan) |
| Treatment variable | Insurance-adoption behavior | Whether to adopt beef-cattle insurance: Yes = 1; No = 0 |
| Control variables | ||
| Personal characteristics | Sex | Sex of respondents: Male = 1; Female = 0 |
| Age | Actual age of respondents (years) | |
| Educational level | Respondents’ actual years of education (years) | |
| Farming characteristics | Farming year | Respondents’ actual years of farming (years) |
| Farming scale | Maximum farming quantity of this year (head) | |
| Farm size | Actual size of the beef-cattle farm (square meters) | |
| Net income from farming | Net income of farming in the current year after deducting the cost (years) | |
| Green farming technology | Number of adoptions of green farming technology (pieces) | |
| Risk characteristics | Mortality rate | Proportion of the number of beef-cattle deaths to the maximum farming quantity in the current year (%) |
| Risk perception | Whether due attention is given to the potential risks such as epidemic diseases and natural disasters that may arise during the farming process: Yes = 1; No = 0 | |
| Risk disposition | Extent of risk appetite: Risk appetite = 1; Risk neutrality = 2; Risk avoidance = 3 | |
| Disease-prevention characteristics | Disease cognitive skill | Number of diseases to which beef cattle are usually prone that the respondents have already known (pieces) |
| Unit frequency of disease prevention | Ratio of the total frequency of disease prevention this year to the maximum quantity of farming (times) | |
| Distance | Whether the distance from the livestock sheds to the local animal husbandry and veterinary station exceeds the average distance from the village where the farmer is located to the station: Yes = 1; No = 0 | |
| External characteristic | Price fluctuations | Alteration in the acquisition price of the beef-cattle market in the present year when compared with that of the previous year: Lower = 1; Not lowered = 0 |
| Regional characteristic | Regional variable | Tongliao city = 1; Chifeng city = 0 |
| Identifying variable | Insurance awareness | Respondents’ knowledge of beef-cattle insurance policies and provisions: very little understanding = 1; less understanding = 2; fair = 3; more understanding = 4; very much understanding = 5 |
| Variable | Full Sample | Insured Group n = 195 | Uninsured Group n = 252 |
|---|---|---|---|
| Disease-prevention input a | 1294.899 (1772.630) | 1379.708 (1905.035) | 1229.274 (1663.870) |
| Insurance-adoption behavior | 0.436 (0.496) | 1.000 (0.000) | 0.000 (0.000) |
| Sex | 0.975 (0.155) | 0.985 (0.123) | 0.968 (0.176) |
| Age | 48.767 (9.574) | 48.041 (9.388) | 49.329 (9.697) |
| Educational level | 8.389 (2.807) | 8.672 (2.740) | 8.171 (2.844) |
| Farming year | 26.539 (11.647) | 25.697 (11.085) | 27.190 (12.046) |
| Farming scale | 41.354 (41.051) | 39.275 (32.481) | 42.963 (46.616) |
| Farm size | 50.855 (51.447) | 43.369 (42.287) | 56.647 (56.953) |
| Net income from farming b | 47,291.960 (208,654.900) | 35,439.65 (176,482.600) | 56,463.380 (230,420.600) |
| Green farming technology | 3.192 (0.763) | 3.441 (0.674) | 3.000 (0.773) |
| Mortality rate | 3.070 (5.941) | 3.605 (6.325) | 2.657 (5.605) |
| Risk perception | 0.955 (0.207) | 0.969 (0.173) | 0.944 (0.230) |
| Risk disposition | 2.228 (0.902) | 2.200 (0.906) | 2.250 (0.900) |
| Disease cognitive skill | 6.197 (3.275) | 6.256 (3.244) | 6.151 (3.304) |
| Unit frequency of disease prevention | 0.510 (0.528) | 0.549 (0.584) | 0.479 (0.479) |
| Distance | 0.351 (0.478) | 0.385 (0.488) | 0.325 (0.469) |
| Price fluctuations | 0.512 (0.500) | 0.554 (0.498) | 0.480 (0.501) |
| Regional variable | 0.582 (0.494) | 0.723 (0.449) | 0.472 (0.500) |
| Insurance awareness | 2.960 (1.342) | 3.641 (1.241) | 2.432 (1.170) |
| Variable | Decision Equations (Insured Behavior) | Impact Effect Equation (Disease-Prevention Input) | |
|---|---|---|---|
| Insured Group | Uninsured Group | ||
| Sex | 0.824 ** (0.392) | 0.434 (0.483) | 0.872 (0.538) |
| Age | 0.015 (0.010) | −0.007 (0.010) | −0.008 (0.014) |
| Educational level | 0.044 * (0.024) | 0.008 (0.023) | 0.064 * (0.034) |
| Farming year | −0.009 (0.008) | −0.004 (0.008) | −0.012 (0.011) |
| Farming scale | −0.007 ** (0.003) | 0.009 *** (0.004) | 0.007 * (0.004) |
| Farm size | −0.003 (0.002) | 0.005 ** (0.003) | −0.005 (0.003) |
| Net income from farming | 0.271 *** (0.051) | 0.116 * (0.062) | 0.220 *** (0.066) |
| Green farming technology | 0.470 *** (0.089) | −0.079 (0.115) | 0.421 *** (0.124) |
| Mortality rate | 3.690 *** (1.090) | 1.520 (1.051) | 4.506 *** (1.616) |
| Risk perception | 0.405 (0.306) | 0.219 (0.351) | 0.850 ** (0.416) |
| Risk disposition | −0.024 (0.068) | −0.015 (0.066) | 0.146 (0.100) |
| Disease cognitive skill | 0.004 (0.020) | −0.002 (0.019) | 0.070 ** (0.028) |
| Unit frequency of disease prevention | 0.092 (0.148) | 0.150 (0.119) | 0.147 (0.210) |
| Distance | − | 0.172 (0.124) | −0.016 (0.149) |
| Price fluctuations | −0.038 (0.127) | −0.112 (0.122) | −0.215 (0.185) |
| Regional variable | 0.590 *** (0.141) | 0.166 (0.170) | 0.998 *** (0.201) |
| Insurance awareness | 0.313 *** (0.048) | − | − |
| Constant | −7.552 *** (0.971) | 4.613 *** (1.403) | 0.898 (1.176) |
| Observations | 447 | 195 | 252 |
| −0.221 *** (0.052) | |||
| 0.064 (0.312) | |||
| 0.475 *** (0.055) | |||
| 2.265 *** (0.424) | |||
| Wald test | 99.480 *** | ||
| Log likelihood | −844.953 | ||
| LR test | 66.420 *** | ||
| Insured Beef Cattle | Uninsured Beef Cattle (Counterfactual) | ATT | t | |
|---|---|---|---|---|
| Average treatment effect | 6.682 (0.045) | 8.917 (0.048) | −2.235 *** (0.066) | −33.973 |
| Insured Beef Cattle | Uninsured Beef Cattle (Counterfactual) | ATT | t | |
|---|---|---|---|---|
| Average treatment effect | 3.317 (0.030) | 4.453 (0.041) | −1.137 *** (0.050) | −22.581 |
| Two-Stage TEM | Joint-Equation MLE | |||
|---|---|---|---|---|
| Input Equations for Disease Prevention | Insured Behavior Equation | Input Equations for Disease Prevention | Insured Behavior Equation | |
| Insurance-adoption behavior | −0.605 ** (0.309) | − | −1.898 *** (0.153) | − |
| Control variable | Controlled | Controlled | Controlled | Controlled |
| Insurance awareness | − | 0.446 *** (0.058) | − | 0.197 *** (0.038) |
| Constant | 2.224 *** (0.822) | −6.583 *** (1.107) | 0.912 (0.936) | −6.866 *** (0.941) |
| Wald test | 172.520 *** | 230.360 *** | ||
| Log likelihood | −221.748 | −875.478 | ||
| LR test | 168.890 *** | 82.010 *** | ||
| Sample Type | Sample Size | Insured Beef Cattle | Uninsured Beef Cattle (Counterfactual) | ATT | t | |
|---|---|---|---|---|---|---|
| Average treatment effect | Sample of “price fluctuations = 1” | 108 | 6.556 (0.067) | 8.905 (0.075) | −2.349 *** (0.101) | −23.344 |
| Full sample | 195 | 6.682 (0.045) | 8.917 (0.048) | −2.235 *** (0.066) | −33.973 |
| Different Inputs for Disease Prevention | Insured Beef Cattle | Uninsured Beef Cattle (Counterfactual) | ATT | t | Rate |
|---|---|---|---|---|---|
| Voluntary vaccination | 1.664 (0.020) | 1.718 (0.074) | −0.054 (0.076) | −0.701 | −3.28% |
| Deworming | 6.267 (0.051) | 8.466 (0.051) | −2.199 *** (0.072) | −30.358 | −35.09% |
| Shed disinfection | 4.703 (0.047) | 6.866 (0.055) | −2.162 *** (0.072) | −30.018 | −45.97% |
| Resource Endowment of Different Farmers | Sample Size of Insured Group | Insured Beef Cattle | Uninsured Beef Cattle (Counter -Factual) | ATT | t | Rate | |
|---|---|---|---|---|---|---|---|
| Farming area | Core area | 141 | 6.749 (0.053) | 7.269 (0.055) | −0.520 *** (0.076) | −6.814 | 7.70% |
| Nearby core area | 54 | 6.508 (0.115) | 4.129 (0.131) | 2.379 *** (0.174) | 13.643 | −36.56% | |
| Beef-cattle deaths | Deaths | 86 | 6.938 (0.073) | 8.812 (0.068) | −1.874 *** (0.100) | −18.709 | −27.01% |
| No deaths | 109 | 6.478 (0.061) | 8.674 (0.094) | −2.196 *** (0.112) | −19.633 | −33.90% | |
Disclaimer/Publisher’s Note: The statements, opinions and data contained in all publications are solely those of the individual author(s) and contributor(s) and not of MDPI and/or the editor(s). MDPI and/or the editor(s) disclaim responsibility for any injury to people or property resulting from any ideas, methods, instructions or products referred to in the content. |
© 2025 by the authors. Licensee MDPI, Basel, Switzerland. This article is an open access article distributed under the terms and conditions of the Creative Commons Attribution (CC BY) license (https://creativecommons.org/licenses/by/4.0/).
Share and Cite
Zhang, L.; Wu, Y. The Effect of Farmers’ Insurance-Adoption Behavior on Input for Beef-Cattle Disease Prevention: Endogenous Switching Regression Model. Agriculture 2025, 15, 659. https://doi.org/10.3390/agriculture15060659
Zhang L, Wu Y. The Effect of Farmers’ Insurance-Adoption Behavior on Input for Beef-Cattle Disease Prevention: Endogenous Switching Regression Model. Agriculture. 2025; 15(6):659. https://doi.org/10.3390/agriculture15060659
Chicago/Turabian StyleZhang, Liangying, and Yunhua Wu. 2025. "The Effect of Farmers’ Insurance-Adoption Behavior on Input for Beef-Cattle Disease Prevention: Endogenous Switching Regression Model" Agriculture 15, no. 6: 659. https://doi.org/10.3390/agriculture15060659
APA StyleZhang, L., & Wu, Y. (2025). The Effect of Farmers’ Insurance-Adoption Behavior on Input for Beef-Cattle Disease Prevention: Endogenous Switching Regression Model. Agriculture, 15(6), 659. https://doi.org/10.3390/agriculture15060659