Article

Transcriptomic and Metabolomic Analysis Reveals the Mechanism of H18 Pepper Color Change

1
Institute of Vegetables, Anhui Academy of Agricultural Sciences, Hefei 230031, China
2
Key Laboratory of Horticultural Crop Germplasm Innovation and Utilization (Co-Construction by Ministry and Province), Institute of Horticulture, Anhui Academy of Agricultural Sciences, Hefei 230031, China
3
Anhui Provincial Key Laboratory for Germplasm Resources Creation and High-Efficiency Cultivation of Horticultural Crops, Institute of Vegetables, Anhui Academy of Agricultural Sciences, Hefei 230031, China
4
College of Life Sciences, Anhui Agricultural University, Hefei 230031, China
5
School of Agriculture and Biology, Shanghai Jiao Tong University, Shanghai 200030, China
*
Author to whom correspondence should be addressed.
These authors contributed equally to this work.
Agriculture 2025, 15(6), 655; https://doi.org/10.3390/agriculture15060655
Submission received: 4 February 2025 / Revised: 3 March 2025 / Accepted: 6 March 2025 / Published: 20 March 2025
(This article belongs to the Section Crop Genetics, Genomics and Breeding)

Abstract

:
Pigments in plants not only determine their visual characteristics but also play crucial roles in photosynthesis, pollinator attraction, and disease resistance. The diverse colors of chili peppers arise from various pigments. However, detailed reports on the genetic and metabolic changes of these pigments in the developmental stages of colorful chili peppers are limited. In this study, we analyzed the content of anthocyanins and carotenoids in the fruits of the cultivated pepper variety H18 at different growth and development stages. Our findings revealed that, as the fruits mature, the anthocyanin content gradually decreases while the carotenoid content increases. Using the transcriptomic and metabolomic sequencing of pepper fruits at various developmental stages, we identified four types of anthocyanins: pelargonidin, cyanidin, delphinidin, and peonidin, as well as a small amount of proanthocyanidins. The concentrations of these anthocyanins generally showed a decreasing trend, and the expression patterns of anthocyanin biosynthesis genes were consistent with the metabolic data. In the analysis of carotenoids, we found that, apart from Lutein, the concentrations of all other detected carotenoids increased during fruit development. Most carotenoids began to accumulate significantly at the orange fruit stage (H18-O) and peaked at the red fruit stage (H18-R). Transcriptomic and RT-qPCR data indicated that the expression of carotenoid biosynthesis genes also increased progressively. Furthermore, we investigated the degradation of anthocyanins and identified potential degradation genes, including BGLU, POD, and PPO. This study provides deep insights into the mechanisms underlying pigment changes in colorful peppers, which may contribute to the improvement of pepper varieties and future research on pigment regulatory mechanisms.

1. Introduction

Pigments, natural compounds found abundantly in both flora and fauna, play critical roles in the regulation of various physiological and biochemical processes and in stress responses in plants [1,2,3]. They are essential for the growth and development of both plant and animal life [4]. Recent studies indicate that pigments, acting as antioxidants, contribute to hormone synthesis and activation by scavenging free radicals and influencing the synthesis and degradation of enzymes. This mechanism helps mitigate the damage caused by reactive oxygen species (ROS), thereby enhancing plant resilience to various biotic and abiotic stressors [5,6]. Furthermore, these pigments are not only nutritionally beneficial but also improve the quality of fruits and promote human health [2,7].
Fruits and vegetables contain a variety of pigments, primarily consisting of green chlorophyll, red to blue-purple anthocyanins, and yellow to orange carotenoids. Additionally, plant-specific pigments, such as betalaines (found in beets, dragon fruits, etc.) and capsanthin (a carotenoid found in chili peppers), contribute to the diverse coloration of fruits and vegetables [8,9]. Color changes in plant fruits are often associated with their growth and development and are generally classified into three physiological mechanisms: (1) loss of chlorophyll from chloroplasts, accompanied by the breakdown and recirculation of certain vesicle membranes and photosynthetic proteins [10,11]; (2) accumulation of anthocyanin glycosides in cytoplasmic vesicles as well as their subsequent degradation [12,13]; and (3) accumulation of colored carotenoids in the lipid globules of the developing chloroplasts or in other characteristic membrane-bound structures, which are transformed by chloroplasts or derived from other types of plastids [14].
Anthocyanin is a natural water-soluble pigment distributed in most plants [15]. These pigments not only impart color to various plant organs, including roots, stems, leaves, flowers, fruits, and seeds [16,17], but they can also improve the ability of plants to reproduce offspring and resist the adverse environment [18,19]. Moreover, anthocyanins are currently recognized as one of the most effective antioxidants discovered by mankind, boasting powerful free radical scavenging properties. Their antioxidant activity surpasses that of vitamin E by a factor of 50 and vitamin C by a factor of 20 [3,20]. Anthocyanidins are more active and extremely unstable, so it is rare to find free-form anthocyanidins in nature [21]. The general structure of anthocyanins involves the attachment of various monosaccharides and disaccharides to the free hydroxyl group via glycosidic bonds, resulting in the formation of different anthocyanins [22,23]. To date, more than 600 anthocyanin glycosides have been identified, all of which are derived from six anthocyanins: pelargonidin, cyanidin, delphinidin, peonidin, malvidin, and petunidin [3]. Anthocyanin synthesis primarily follows the flavonoid pathway, starting with the precursors malonyl CoA and coumaroyl CoA. These are catalyzed by CHS (chalcone synthase) and CHI (chalcone isomerase) to form the colorless compound Naringenin. Naringenin is then catalyzed by F3H into DHK (dihydrokaempferol). DHK can further be catalyzed by F3′H and F3′5′H to produce dihydroquercetin, DHQ, and dihydromyricetin, DHM. The colorless DHK (dehydrokaempferol), DHQ (dehydroquercetin), and DHM (dehydromaltol) are progressively reduced to the unstable leucoanthocyanidin by the enzyme DFR (deoxyloganetic acid reductase). This intermediate is then converted into anthocyanins through the action of two enzymes: anthocyanin synthase (ANS) and flavonoid 3-O-glucosyltransferase (3GT) [24,25].
Fruit development reaches certain stages during which anthocyanin degradation, or “fading”, sometimes occurs [26]. However, research on the anthocyanin degradation pathway remains limited. Enzymes associated with anthocyanin degradation were first identified in the flowers of Brunfelsia calycina (Solanaceae), which rapidly change color from dark purple to all white after opening [27]. Subsequently, a vacuolar-type III peroxidase BcPrx01 was implicated in the anthocyanin degradation [28]. Oren-Shamir proposed three candidate enzyme families involved in the degradation of anthocyanins: polyphenol oxidase, peroxidase, and β-glucosidase. Two potential pathways for anthocyanin degradation have been suggested. The first involves direct oxidation by peroxidase, while the second pathway consists of two steps: deglycosylation by β-glucosidase followed by oxidation by polyphenol oxidase or peroxidase [13,29]. It has also been shown that the rate of conversion of colorless flavonoids to oxidized red pigments is significantly reduced when polyphenol oxidase activity is inhibited [30].
Over 750 species of carotenoids have been identified, and they typically accumulate in plastids [31,32]. Carotenoids serve various functions, such as photosynthesis, photoprotection, phytohormone synthesis, and signaling, and they are also essential for humans as precursors for vitamin A synthesis and as dietary antioxidants [33]. There are two pathways for the synthesis of carotenoids in plants: the MEP (2-C-Methyl-D-erythritol 4-phosphate, MEP) pathway and the MVA (Mevalonate pathway) pathway; the former occurs mainly in the organelle plastids of plant cells and fungi, and the latter occurs mainly in the cytosol of plant cells and bacteria [14,34]. The precursor IPP (from the MVA or MEP pathways) is catalyzed by the enzyme geranylgeranyl diphosphate synthase (GGPS) to form GGPP. Phytoene synthase converts GGPP to phytoene, phytoene desaturase converts phytoene to lycopene, and lycopene is catalyzed by Lycopene cyclases (LCY-B and LCY-E) to produce α- or β-carotene. β-carotene is converted into zeaxanthin by the action of β-carotene hydroxylase, and zeaxanthin is subsequently converted into antheraxanthin and violaxanthin through the activity of zeaxanthin epoxidase [35,36]. In chili peppers, antheraxanthin and violaxanthin are further converted into capsanthin and capsorubin by capsanthin-capsorubin synthase (CCS) [37]. Additionally, carotenoids serve as precursors for the biosynthesis of others, and carotenoids are precursors for the biosynthesis of a variety of substances, including two phytohormones, abscisic acid (ABA) and monocotyledonin [38,39].
Pepper (Capsicum annuum L.) holds a prominent position in China’s vegetable cultivation due to its rich nutritional profile and versatile agricultural uses. The diverse colors of pepper plants, ranging from green to yellow and purple, reflect the variety of antioxidant properties and nutritional compositions they possess [40]. In this study, we previously developed a stable chili pepper variety, H18, through directed breeding. This variety exhibits a distinct color change in its fruit skin during development. The fruit initially appears purple, then transitions to off-white, followed by orange, and finally matures to red. To investigate the mechanism behind H18’s color change, this study combines transcriptomic and metabolomic analyses to examine the changes in pigment substances and the associated genes during the color transition process of the fruit. This research provides a theoretical foundation for improving the quality of chili pepper fruits and for molecular breeding.

2. Materials and Methods

2.1. Plant Materials

In this study, the self-stabilizing pepper variety H18, characterized by colored fruits, was selectively bred from the Vegetable Research Institute of the Anhui Provincial Academy of Agricultural Sciences through targeted breeding efforts. In the springtime, the H18 chili pepper variety was cultivated at the Gangji demonstration base of the Anhui Academy of Agricultural Sciences. H18 peppers were initially nurtured by planting seeds in hole trays inside greenhouses during the winter. In the spring, the seedlings were transplanted into greenhouses equipped with well-drained irrigation systems and nutrient-rich soil, with a pH level between 6.0 and 7.0 and temperatures ranging from 20 °C to 30 °C. To prevent pests and diseases, we regularly applied organic pesticides. Fruit samples were collected at different developmental stages. We chose four stages of H18 fruits, which exhibited four different colors: purple, off-white, orange, and red fruit stages: the purple pepper fruit stage (H18-P) was at 10 days after pollination (DAP), the off-white stage (H18-W) was at 20 DAP, the transition to the orange stage (H18-O) started at 30 DAP, and the final red stage (H18-R) was at 45 DAP. All sample peppers had their stalks, seeds, and stones removed, leaving only the flesh, and they were immediately frozen in liquid nitrogen and then stored at −80 °C without thawing before RNA or metabolite extraction.

2.2. Detection of Anthocyanins and Carotenoids

Anthocyanin extraction was performed according to a modified method referenced from previous studies [41]. For anthocyanin extraction, freeze-dried samples of pepper fruits from the H18 variety were used. Three biological replicates were taken for each stage to eliminate errors between samples. A 0.5 g sample was weighed, cut into pieces, and mixed with an appropriate amount of quartz sand and pre-cooled extraction solution (1% HCl: 99% methanol, v/v). The mixture was homogenized and extracted in the dark at 4 °C for 20 min. The extract was filtered through filter paper into a funnel and collected in a volumetric flask. The volume was adjusted to 25 mL with additional extraction solution. Absorbance was measured at 530 nm using a cuvette containing the extract. The extraction solution, used as a blank control, was also measured at 530 nm. The concentration of total pepper anthocyanins was determined from a linear calibration curve prepared using the total anthocyanins from blueberry extract (Yuan Ye, Shanghai, China). The linear calibration curve is shown in Figure S1. A plant carotenoid content assay kit (Solarbio, Beijing, China) was used for the carotenoids in the pepper fruits, and the instructions were followed for extraction. The absorbance values of the sample extracts at A663, A645, and A470 nm were determined using a multifunctional enzyme marker (TECAN/SPARK), and chlorophyll a, chlorophyll b, and carotenoid contents were calculated after 24 h maceration with 80% acetone (until the material whitened), following the method of Arnon [42].

2.3. Transcriptomic Sequencing and Analysis

RNA extraction, reverse transcription, and cDNA library construction were performed by sequencing companies (Frasergen, Wuhan, China). Three biological replicates of samples from four fruit development stages were taken to eliminate errors between samples. These libraries were subjected to Paired-end (PE) sequencing using NGS (Next-Generation Sequencing) based on the Illumina sequencing platform. From the raw data, adaptor sequences and low-quality reads were first filtered out. The remaining sequences were considered clean reads, and unigene expression was calculated as TPM with the software package salmon [43]. All raw data were uploaded to the SRA database of NCBI (BioProject accession No. PRJNA1151840).
The GO (http://www.geneontology.org/, accessed on 15 October 2024) functional database and KEGG (https://www.genome.jp/kegg/, accessed on 15 October 2024) pathway database were used to perform the enrichment analysis on the differential gene set. Based on the results of the KEGG enrichment analysis of differentially expressed genes, the top 25 pathways with a p-value < 0.05, representing the most significant enrichment, were selected for display [44,45].

2.4. Metabolomic Sequencing and Analysis

The extraction of biological samples from pepper fruits and the sequencing of non-targeted metabolomics were performed by sequencing companies (Frasergen, Wuhan, China). Biological samples were placed in a lyophilizer (Scientz-100F, SCIENTZ, Ningbo, China) to be vacuum freeze-dried, and they were milled (30 Hz, 1.5 min) to powder form using a milling instrument (MM 400, Retsch, Shanghai, China); then, 50 mg of the sample powder was weighed using an electronic balance (MS105DΜ, Mettler-Toledo, Zurich, Switzerland), and 1200 μL of pre-cooled 70% methanol aqueous internal standard extract at −20 °C was added (a ratio of 1200 μL of extractant was added for every 50 mg of sample). The sample was vortexed once every 30 min for 30 s for a total of 6 times; after centrifugation (12,000 rpm, 3 min), the supernatant was aspirated, and the sample was filtered through a microporous filter membrane (0.22 μm pore size) and stored in the injection vial for UPLC-MS/MS analysis. Three biological replicates of samples from four fruit development stages were taken to eliminate errors between samples. The raw data from the mass spectrometer downlink were converted to mzXML format using ProteoWizard v3.0 (filtering conditions: peak picking and MS Levels: 1-2.), and the peaks were extracted, aligned, and corrected for retention time with the XCMS program. The peaks with >50% missing were filtered, and the blanks were filled with KNN and corrected for peak area using the SVR method. The analysis software used for plant non-target material identification was a combination of common search library algorithms and MetDNA, authorized by Mr. Zhengjiang Zhu [46]. According to the priority of data analysis: firstly, the company’s own local high-resolution database was searched by the algorithm (MS2-search-local), followed by public online libraries, HMDB (https://hmdb.ca/, accessed on 20 October 2024), KEGG (https://www.kegg.jp/, accessed on 20 October 2024), Mona (https://mona.fiehnlab.ucdavis.edu/, accessed on 20 October 2024), MassBank (http://www.massbank.jp/, accessed on 20 October 2024), etc., and lastly, by the machine learning-based prediction library (MS2-Insilico). Detailed matching rules: First level second level match mz error 25 ppm, first level second level match rt error 6 s. Mother ion Q1 search library allows 25 ppm error, MS2 search library allows 50 ppm error, minimum second level score 0.3. The final score consists of three parts, fragmentation score, forward search library score, and reverse search library score, which are weighted as follows: fragmentation score weight = 0.1, forward search library score weight = 0.3, reverse search library score weight = 0.6. Finally, the substances with a score of 0.5 or above and a CV value of less than 0.3 in the QC samples were extracted, and then, the positive and negative patterns were combined (the substances with the highest qualitative grade and the smallest CV value were retained) to obtain the ALL_sample_data file.

2.5. Targeted Carotenoid Metabolomic Sequencing and Analysis

Three biological replicates of samples from four fruit development stages were taken to eliminate errors between samples. The pepper fruit samples were ground into a powder form using a ball mill (MM 400, Retsch, Shanghai, China) (30 Hz, 1 min). After grinding, the samples were extracted with 0.5 mL of a hexane/acetone/ethanol mixture (1:1:1, v/v/v) containing 0.01% BHT (g/mL). The samples were vortexed for 20 min at room temperature and then centrifuged for 5 min at 4 °C at 12,000 r/min, and the supernatant was extracted once more. The supernatant was extracted, repeated once, and then centrifuged to combine the supernatants; the extract was concentrated, redissolved with 100 μL of dichloromethane, passed through a 0.22 μm filter membrane, and stored in a brown injection bottle for LC-MS/MS analysis. The data acquisition instrumentation system mainly consisted of Ultra Performance Liquid Chromatography (UPLC) (ExionLC™ AD, https://sciex.com.cn/, accessed on 28 October 2024) and Tandem Mass Spectrometry (MS/MS) (QTRAP® 6500+, https://sciex.com.cn/, accessed on 28 October 2024). A MWDB (Metware Database) was constructed using standards to qualitatively analyze the data detected by mass spectrometry. Date quantification was accomplished by using the Multiple Reaction Monitoring (MRM) mode of triple quadrupole mass spectrometry, in which the quadrupole first screened the precursor ions (parent ions) of the target substance and excluded ions corresponding to substances of other molecular weights in order to preliminarily exclude interferences, and then the precursor ions were induced to ionize by collision chambers and then fractured to form multiple fragment ions, which were then filtered through the triple quadrupole to select the desired characteristic fragment ions, resulting in more accurate and reproducible quantification. The precursor ions were induced to ionize by the collision chamber and broken to form multiple fragment ions, which were then filtered through a triple four-stage rod to select the required characteristic fragment ions, eliminating the interference of non-target ions, making the quantification more accurate and reproducible. After obtaining the mass spectrometry data of different samples, the chromatographic peaks of all the targets were integrated and analyzed quantitatively by the MWDB (Metware Database) calibration curve.

2.6. RNA Extraction and cDNA Synthesis

A total of three biological replicates of H18 fruit samples at four developmental stages were harvested and flash-frozen in liquid nitrogen until further processing for RNA extraction. Each biological replicate pepper had its stalks, seeds, and stones removed, leaving only the pepper flesh. Samples were hand-ground in liquid nitrogen using mortar and pestle before the mRNA extraction. Total RNA was extracted using the TIANGEN RNAprep pure kit (Tiangen, Beijing, China) following the manufacturer’s instructions. Protein and cell debris were removed using a buffer solution provided in the kit, and finally, high-quality total RNA was obtained using purification columns. Reverse transcription was performed using an EasyScript One-Step gDNA Removal and cDNA Synthesis SuperMix kit (TransGen Biotech, Beijing, China).

2.7. RT–qPCR Analysis

All RT–qPCR primers were designed using Beacon Designer 7 software (Table S1) [47]. RT-qPCR was performed with a CFX96 TouchTM Real-Time PCR Detection System (BIO-RAD, Hercules, CA, USA), with three biological replicates for each sample. CaEIF5A2 was used as a reference gene for pepper [48]. The relative gene expression levels were calculated using the 2−∆∆CT method [49].

2.8. Data Collection and Statistical Analysis

Data are presented as means ± SE of at least three independent experiments. The experimental data were analyzed by one-way ANOVA using SPSS 25.0 software, and multiple comparisons were performed using Duncan’s method (p < 0.05). Statistical analyses were performed using GraphPad Prism 8.0 software. The pepper color shift pattern maps in this paper were drawn by Figdraw software v2.0 (https://www.figdraw.com/, accessed on 30 October 2024).

3. Results

3.1. Phenotype Identification and Pigment Content Analysis of H18 Pepper

We initially observed H18 pepper fruits at different developmental stages. At the early stage, the fruits were purple, and their size ceased to increase as they entered the color transition phase. The color transition process began initially with purple H18-P (10 DAP), which gradually faded to off-white (H18-W, 20 DAP). This was followed by a shift to orange (H18-O, 30 DAP), and finally, the fruits turned red upon ripening (H18-R, 45 DAP) (Figure 1A). To further investigate the biochemical changes underlying these physical transformations, we quantified the concentrations of anthocyanins and carotenoids at four distinct developmental stages. Our results revealed that anthocyanins were highest in the H18-P pepper fruits and were much higher than the H18-W, H18-O, and H18-R stages, and a trend of decreasing anthocyanin content with fruit ripening was shown (Figure 1B), while carotenoid levels showed an opposite trend. The content of carotenoids was low during the H18-P and H18-W stages, it then increased significantly during the H18-O stage, and it reached its highest content during the H18-R stage, showing a trend of increasing carotenoid content with fruit maturation (Figure 1C). This inverse relationship between anthocyanins and carotenoids may be crucial in the color evolution of the H18 pepper fruits.

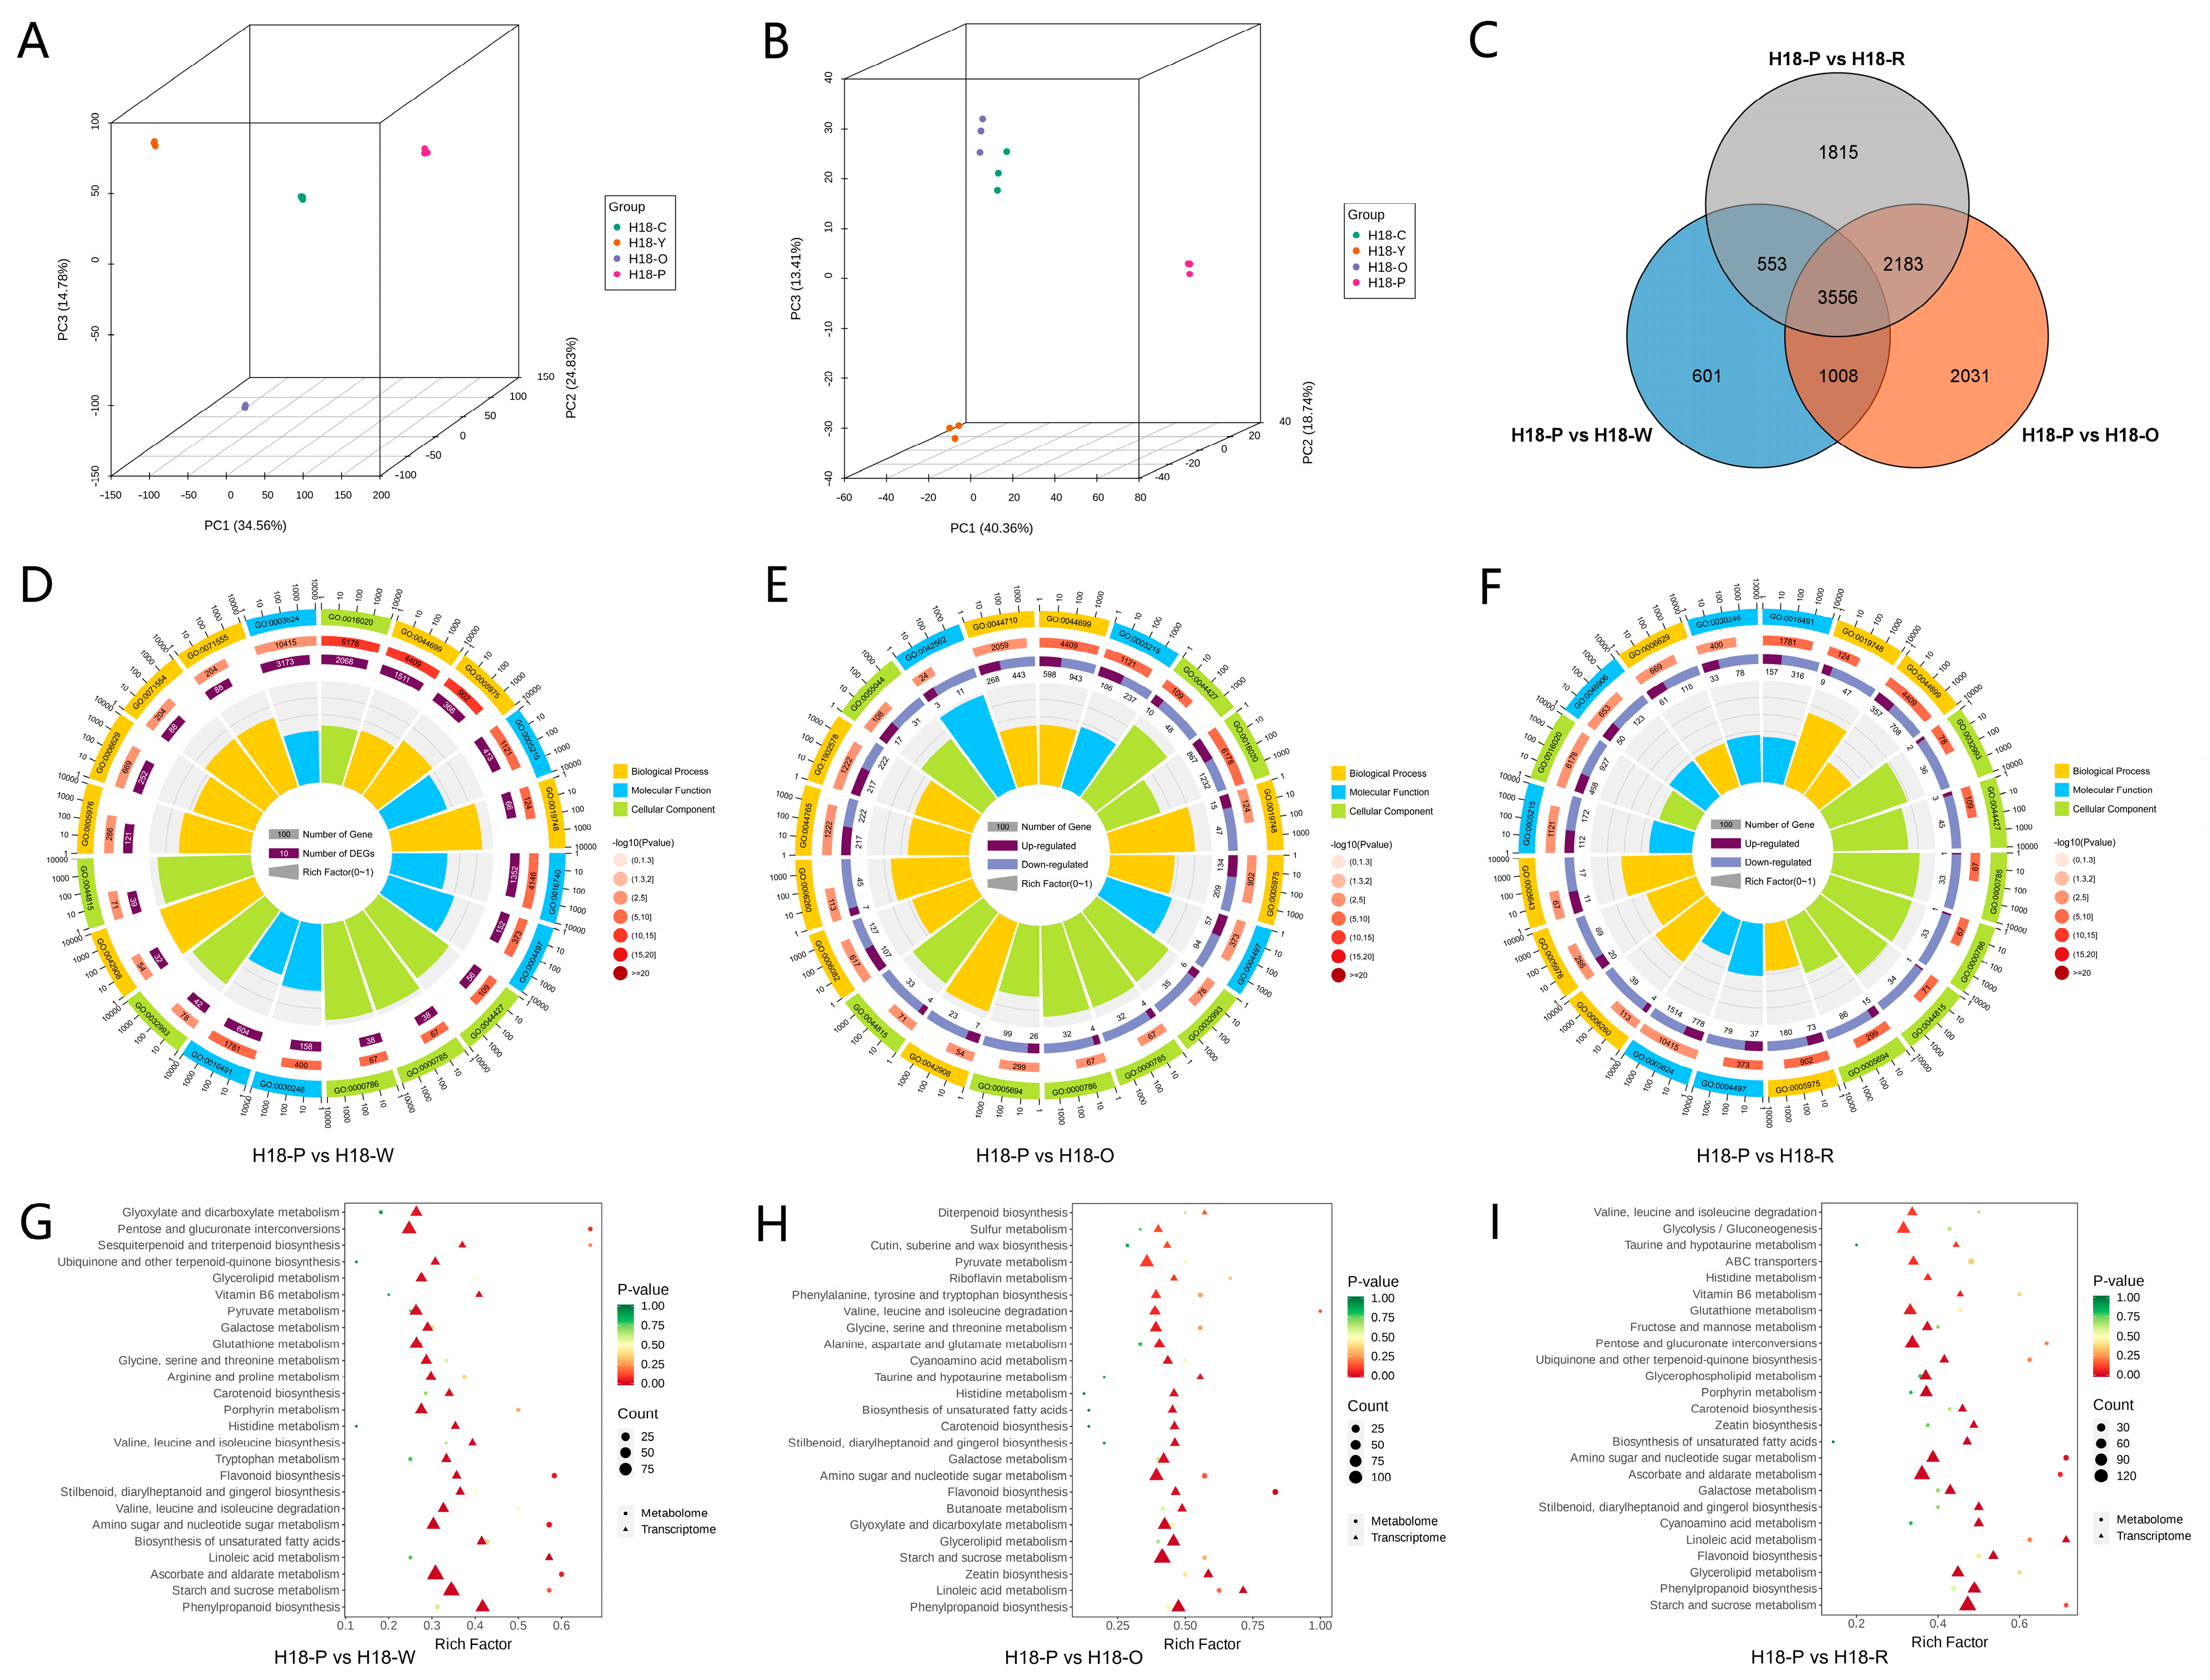
3.2. Analysis of Transcriptomic and Metabolomic of H18 Pepper Fruits at Different Color Stages

We performed transcriptomic and metabolomic analyses on H18 chili peppers at four distinct developmental stages. The principal component analysis (PCA) of both the transcriptomic and metabolomic data revealed a high degree of similarity between samples from the same developmental stage, while significant differences were observed between the principal components of samples from different stages (Figure 2A,B). A comparison of H18-P with the other three fruit developmental stages in terms of gene expression identified 22,678 DEGs (Table S2). Specifically, we identified 5719, 8779, and 8180 DEGs in the comparisons of H18-P vs. H18-W, H18-P vs. H18-O, and H18-P vs. H18-R, respectively. Among these, there were 1884, 3451, and 2228 upregulated genes, and 3836, 5329, and 5881 downregulated genes in the respective comparisons (Table S2, Figure 2C). The gene ontology (GO) functional analysis of these DEGs showed enrichment in molecular function, cellular component, and biological process (Figure 2D–F); meanwhile, the KEGG pathways enriched by the DEGs and DAMs included flavonoid and carotenoid metabolic pathways (Figure 2G–I). The flavonoid metabolic pathways were primarily related to anthocyanin synthesis, while the carotenoid pathways were associated with the biosynthesis of carotene, zeaxanthin, antheraxanthin, capsanthin, and others. These results suggest that the pigmentation changes observed in H18 chili peppers may be influenced by the flavonoid (mainly anthocyanins) and carotenoid metabolic pathways. Consequently, we focused our analysis on the genes and metabolites involved in these two pathways.

3.3. DEGs and DAMs Related to Anthocyanins Biosynthesis

Using metabolomic sequencing, we detected four types of anthocyanins (cyanidin, delphinidin, peonidin, and pelargonidin anthocyanins) and a range of proanthocyanins. We analyzed the content of these anthocyanins in H18 pepper fruits at four distinct developmental stages (H18-P, H18-W, H18-O, and H18-R). The results showed that, as the fruits matured, the levels of both anthocyanins and proanthocyanins generally decreased, except for delphinidin 3-sambubioside and peonidin 3-(6″-acetylglucoside) (Figure 3B, Table S3). Subsequently, we examined the expression of structural genes involved in the biosynthesis of anthocyanins and observed that some candidate genes on the anthocyanin synthesis pathway showed a decreasing trend in their expression levels at the H18-P, H18-W, H18-O, and H18-R developmental stages, such as Capana05g002274 (CaCHS), Capana05g002107 (CaCHI1), Capana07g002048 (CaCHI2), Capana00g002736 (CaCHI3), Capana02g002586 (CaF3H), Capana02g002763 (CaDFR1), and Capana09g000707 (CaDFR2) (Figure 3A). To validate the reliability of the transcriptomic data, we performed RT-qPCR analysis. The results confirmed the trend observed in the transcriptomic data, showing that the expression levels of these genes involved in anthocyanin metabolism decreased as the fruits matured (Figure 3C).

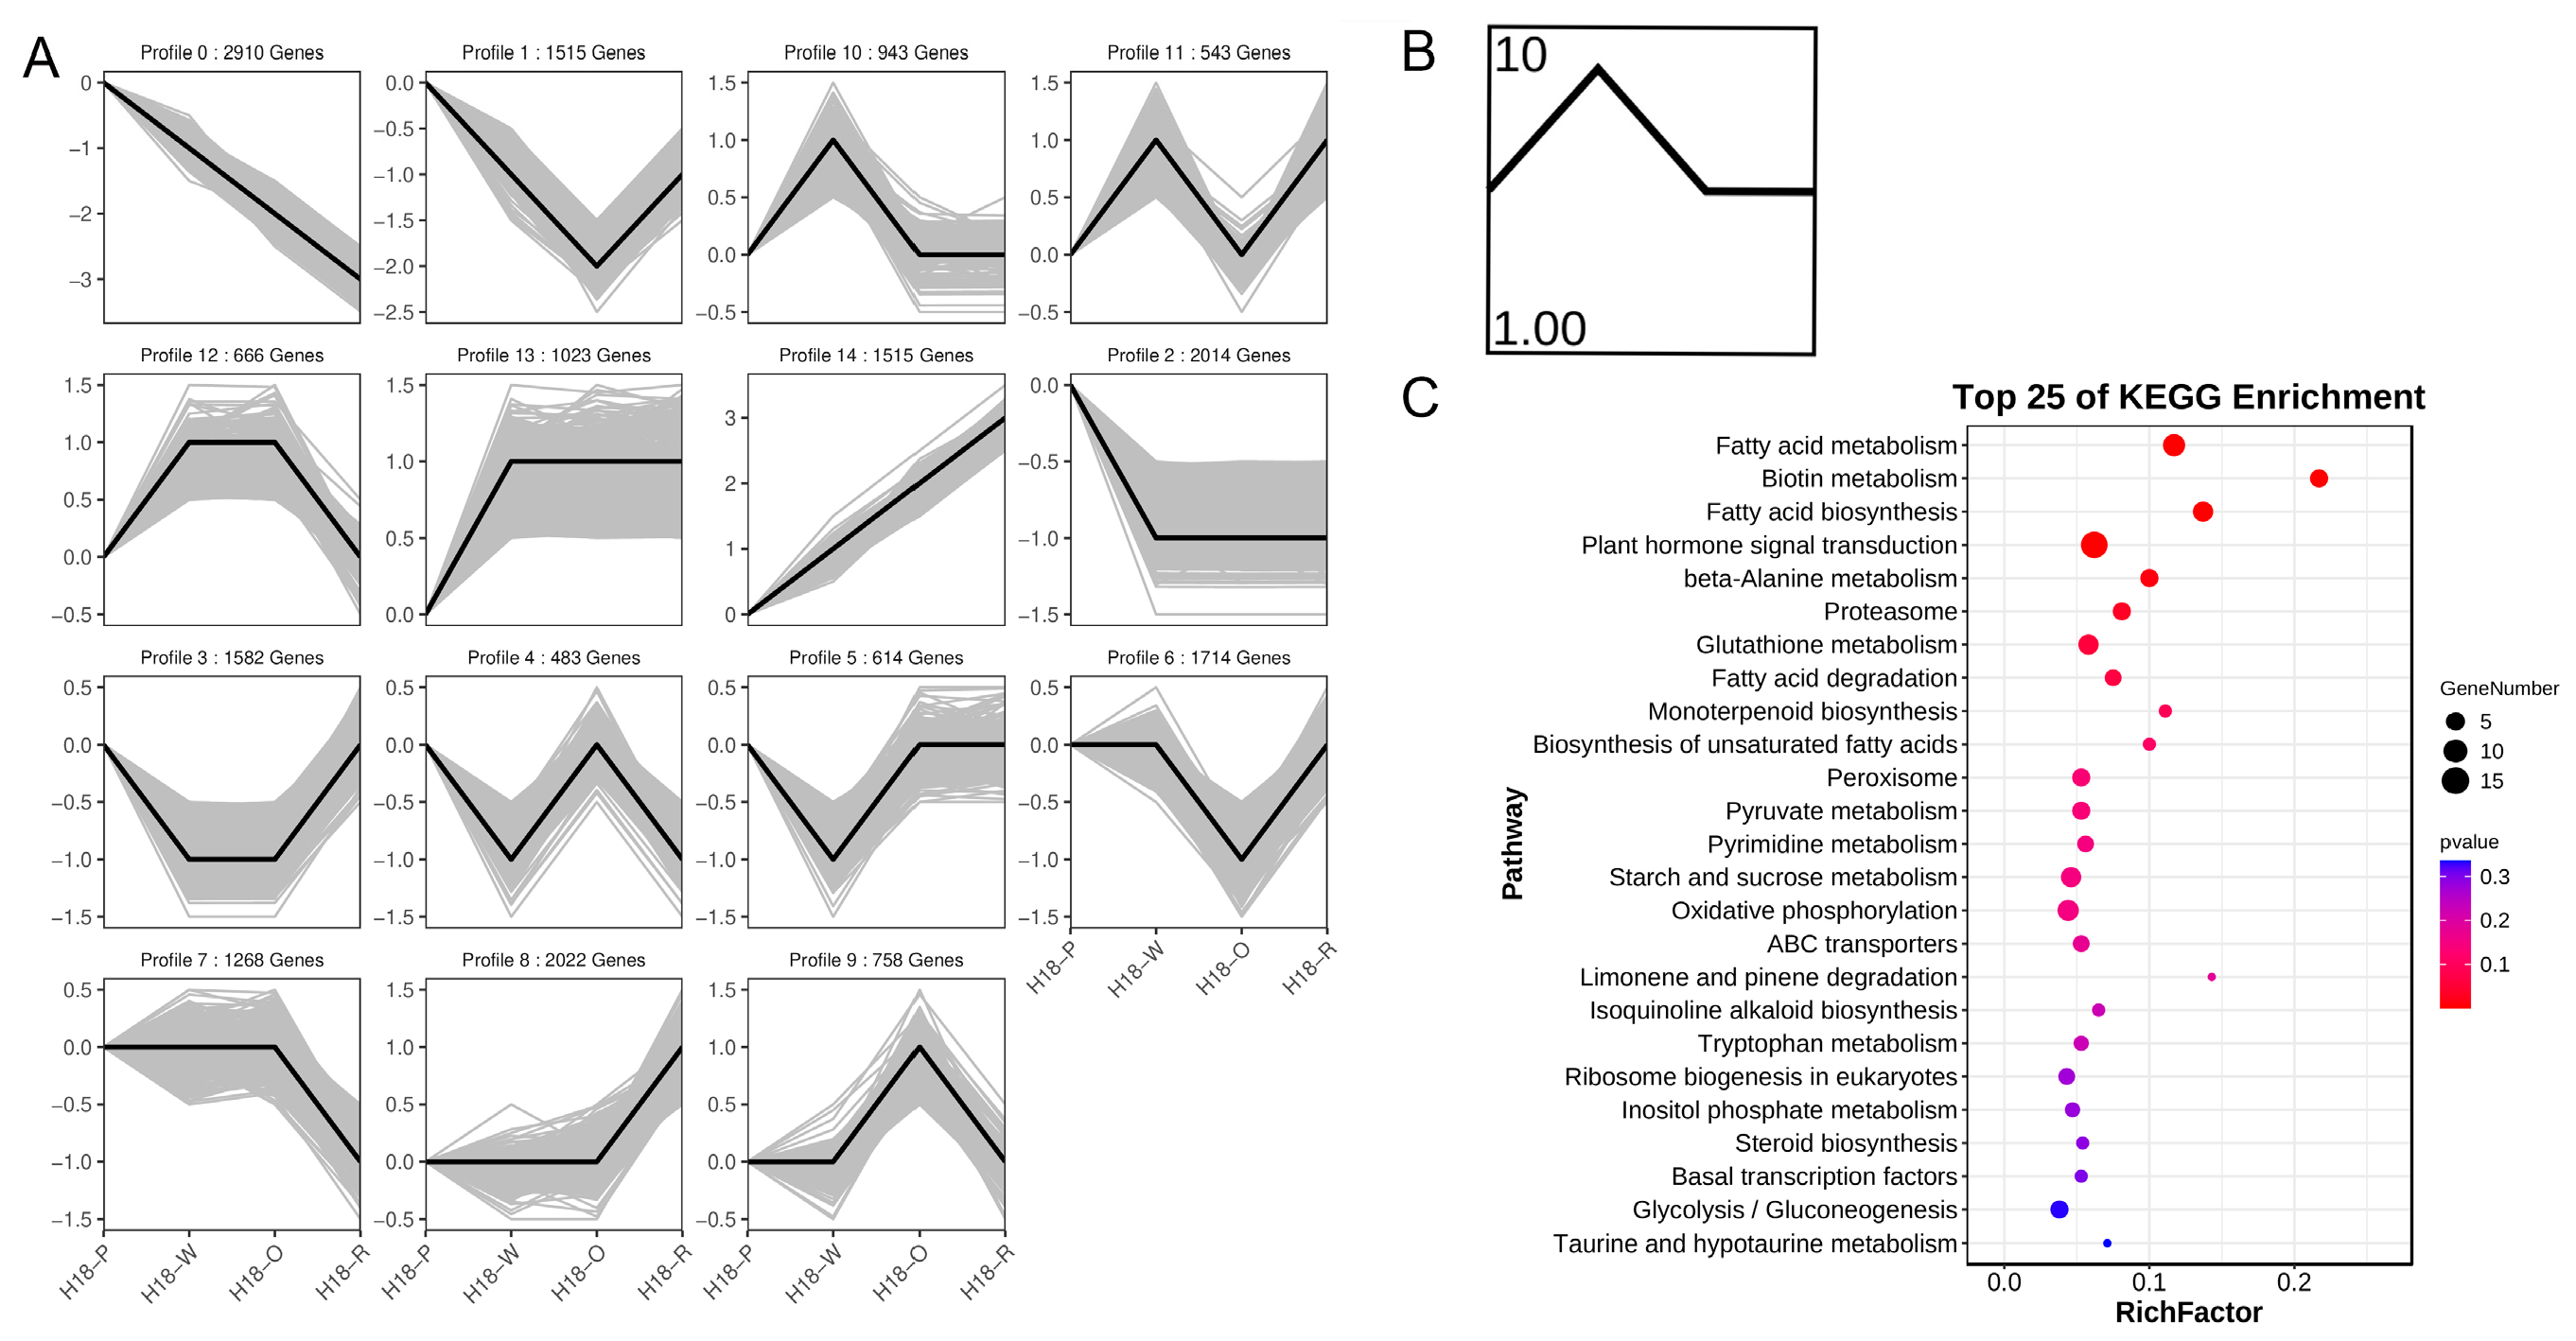
3.4. Trend Analysis of Transcriptomics Data of H18 Pepper Fruits

Through our research, we found that the anthocyanin content in the H18-W developmental stage of pepper fruits significantly decreases and stabilizes in the subsequent stages. We hypothesize that the expression levels of genes related to anthocyanin degradation increase significantly during the H18-W stage and may decline during the H18-O stage, when the degradation phenomenon of anthocyanins is not evident, before stabilizing in the H18-R stage. Therefore, we conducted a trend analysis of transcriptomic data from pepper fruits at different developmental stages of H18 and found that profile10 is consistent with our speculation on the expression trend of genes related to anthocyanins degradation (Figure 4A). We, therefore, follow up with an analysis of Profile10. The results show that Profile10 consists of a total of 943 genes, and we performed a KEGG analysis on these 943 genes, discovering a strong correlation with the peroxisome pathway (Figure 4B,C). In conjunction with previous studies on anthocyanin degradation genes, we are further convinced that the degradation of anthocyanins in the H18 pepper is closely related to oxidases.

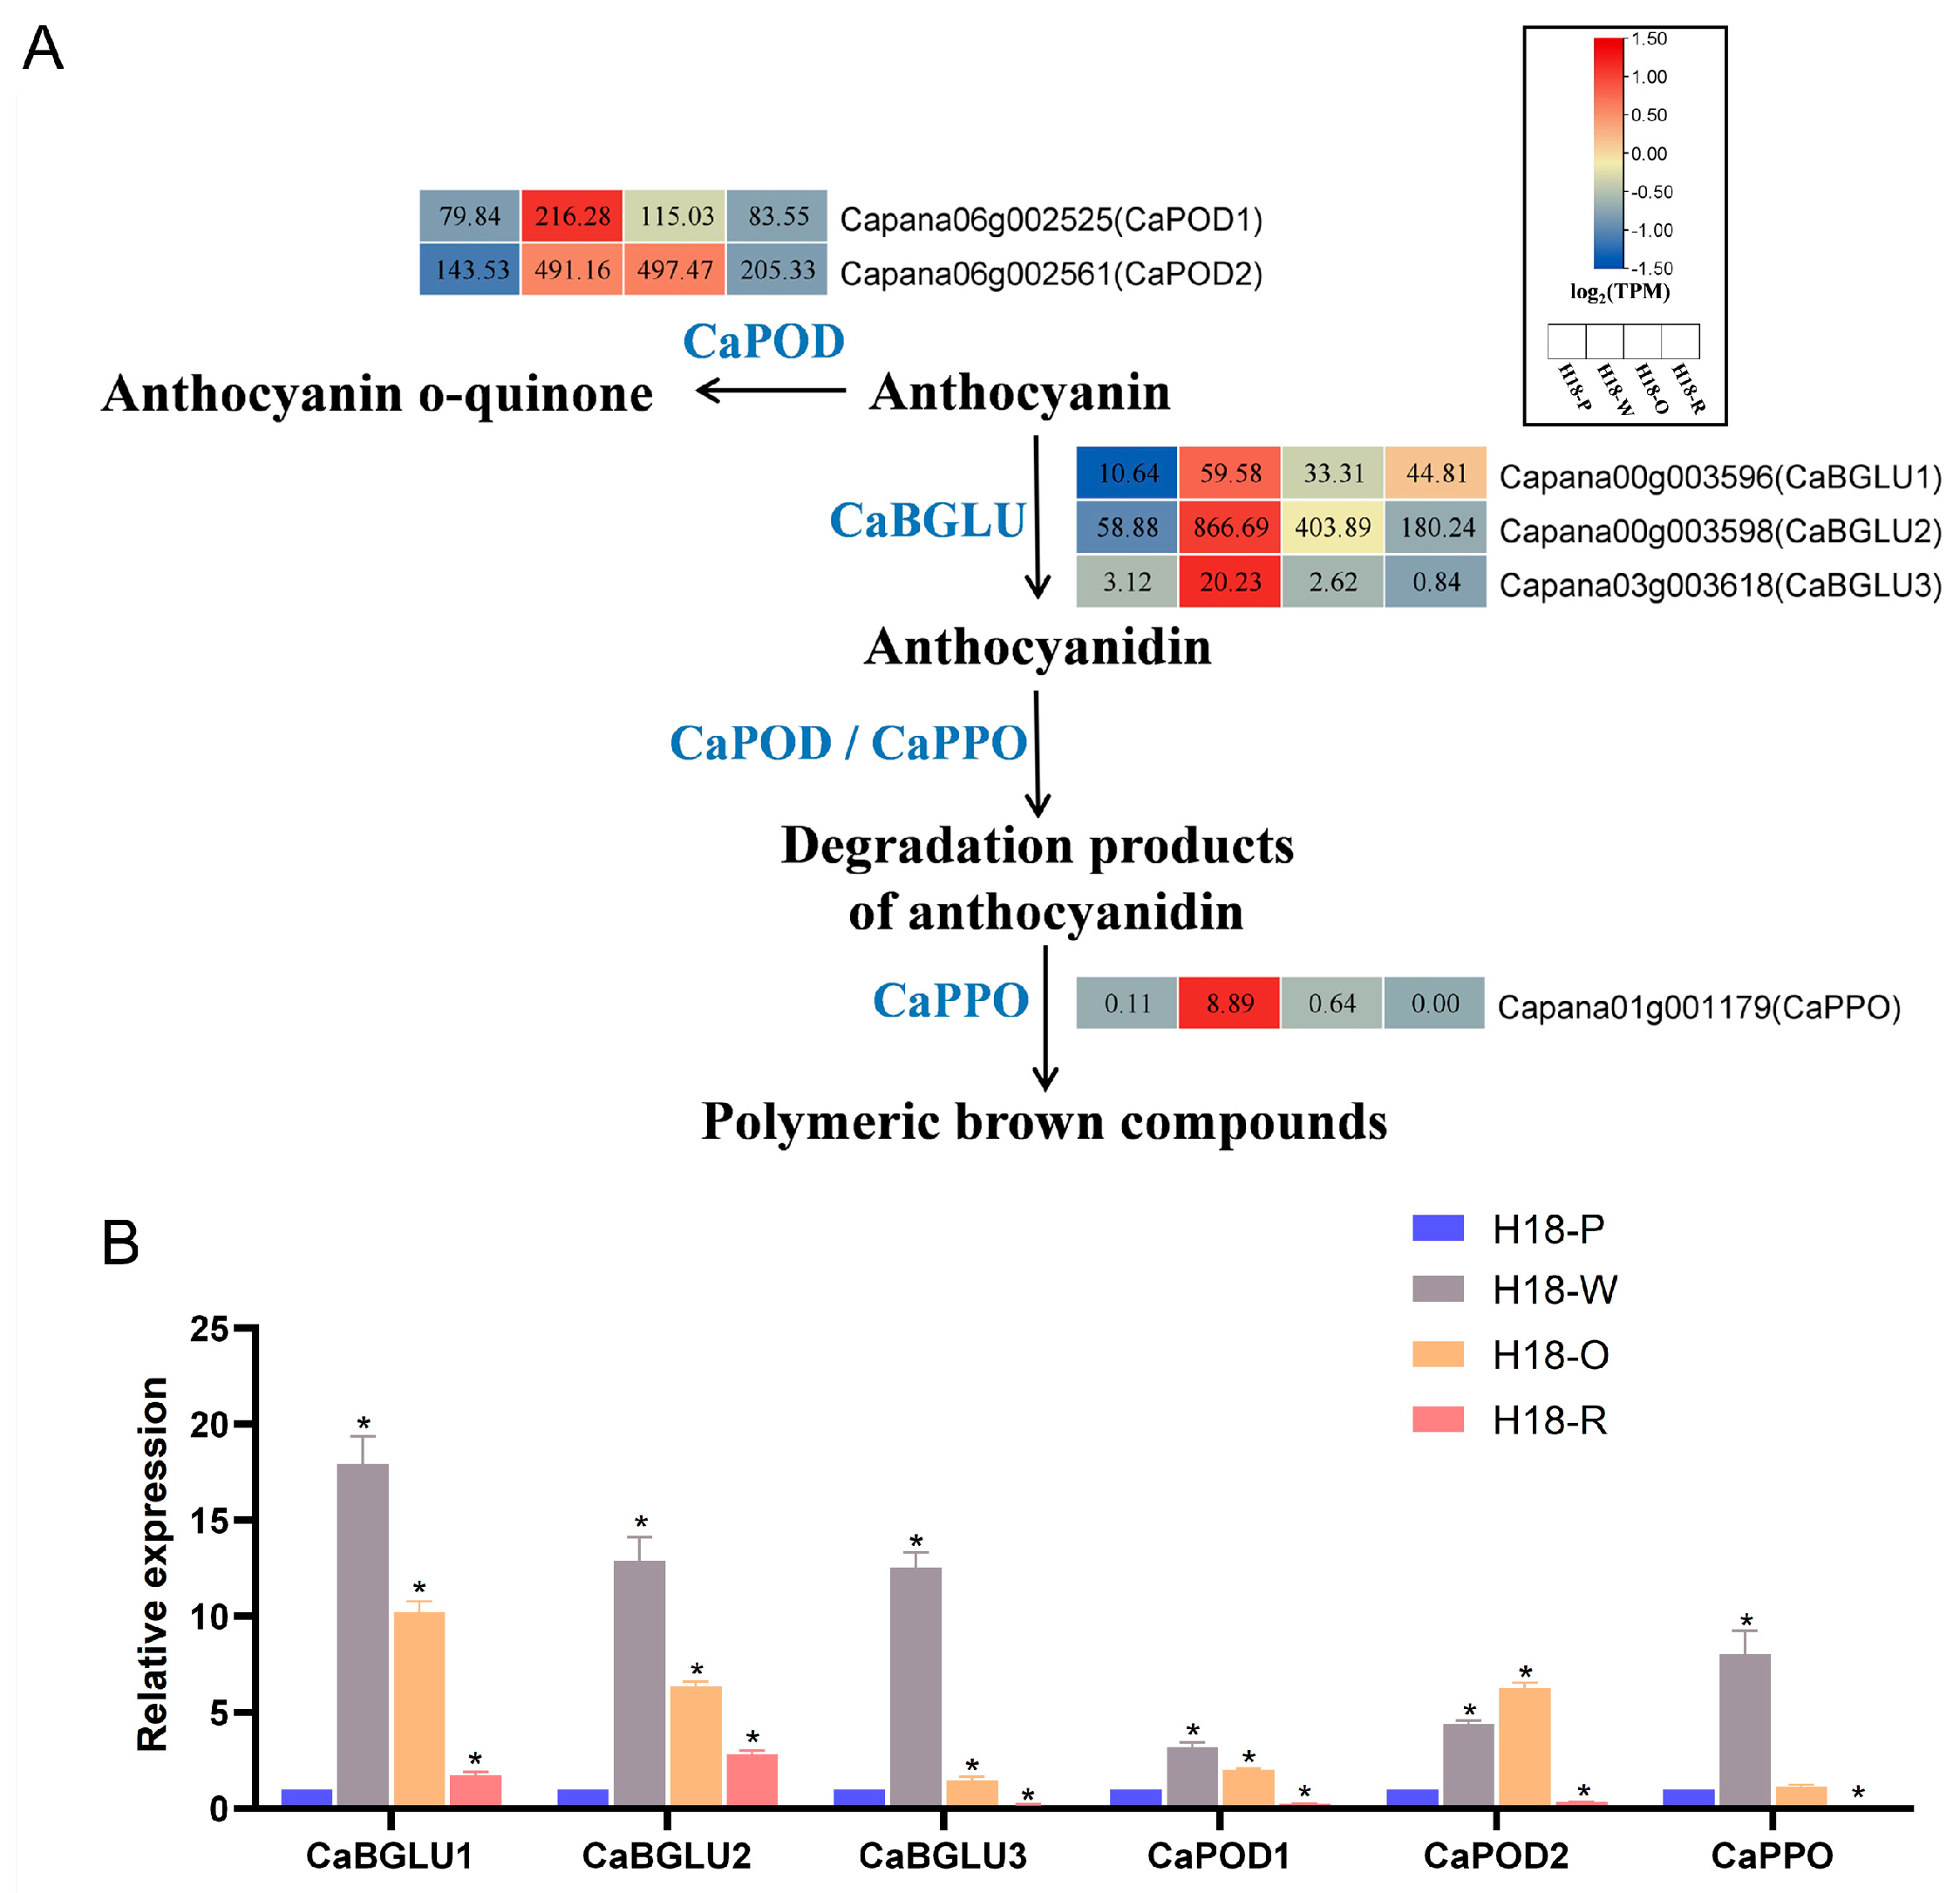
3.5. The Mechanism of Anthocyanin Degradation Analyze in H18 Pepper

The levels of anthocyanidins in pepper fruits at four distinct developmental stages were investigated. The results revealed that the anthocyanidin content was highest during the purple pepper phase, gradually decreasing thereafter, suggesting that anthocyanins undergo a degradation process. As previously discussed, anthocyanin degradation typically occurs via two pathways and involving three enzymes: β-glucosidase, polyphenol oxidase, and peroxidase, and according to our study, the genes consistent with the trend of anthocyanin degradation gene expression are associated with the peroxisome pathway (Figure 5). We investigated the expression levels of all genes within these three gene families and identified some candidate genes that correlated with the degradation trend of anthocyanin glycosides, including β-glucosidase candidate genes Capana00g003596 (CaBGLU1), Capana00g003598 (CaBGLU2), and Capana03g003618 (CaBGLU3), polyphenol oxidase candidate gene Capana01g001179 (CaPPO), and peroxidase candidate genes Capana06g002525 (CaPOD1) and Capana06g002561 (CaPOD2). During the purple fruit stage of H18 pepper fruits, the expression of these genes was low, it increased during the off-white stage (H8-W), and then it decreased progressively (Figure 5A). The RT-qPCR analysis of these candidate genes confirmed the transcriptome data, further supporting the involvement of these genes in the anthocyanin degradation process (Figure 5B).

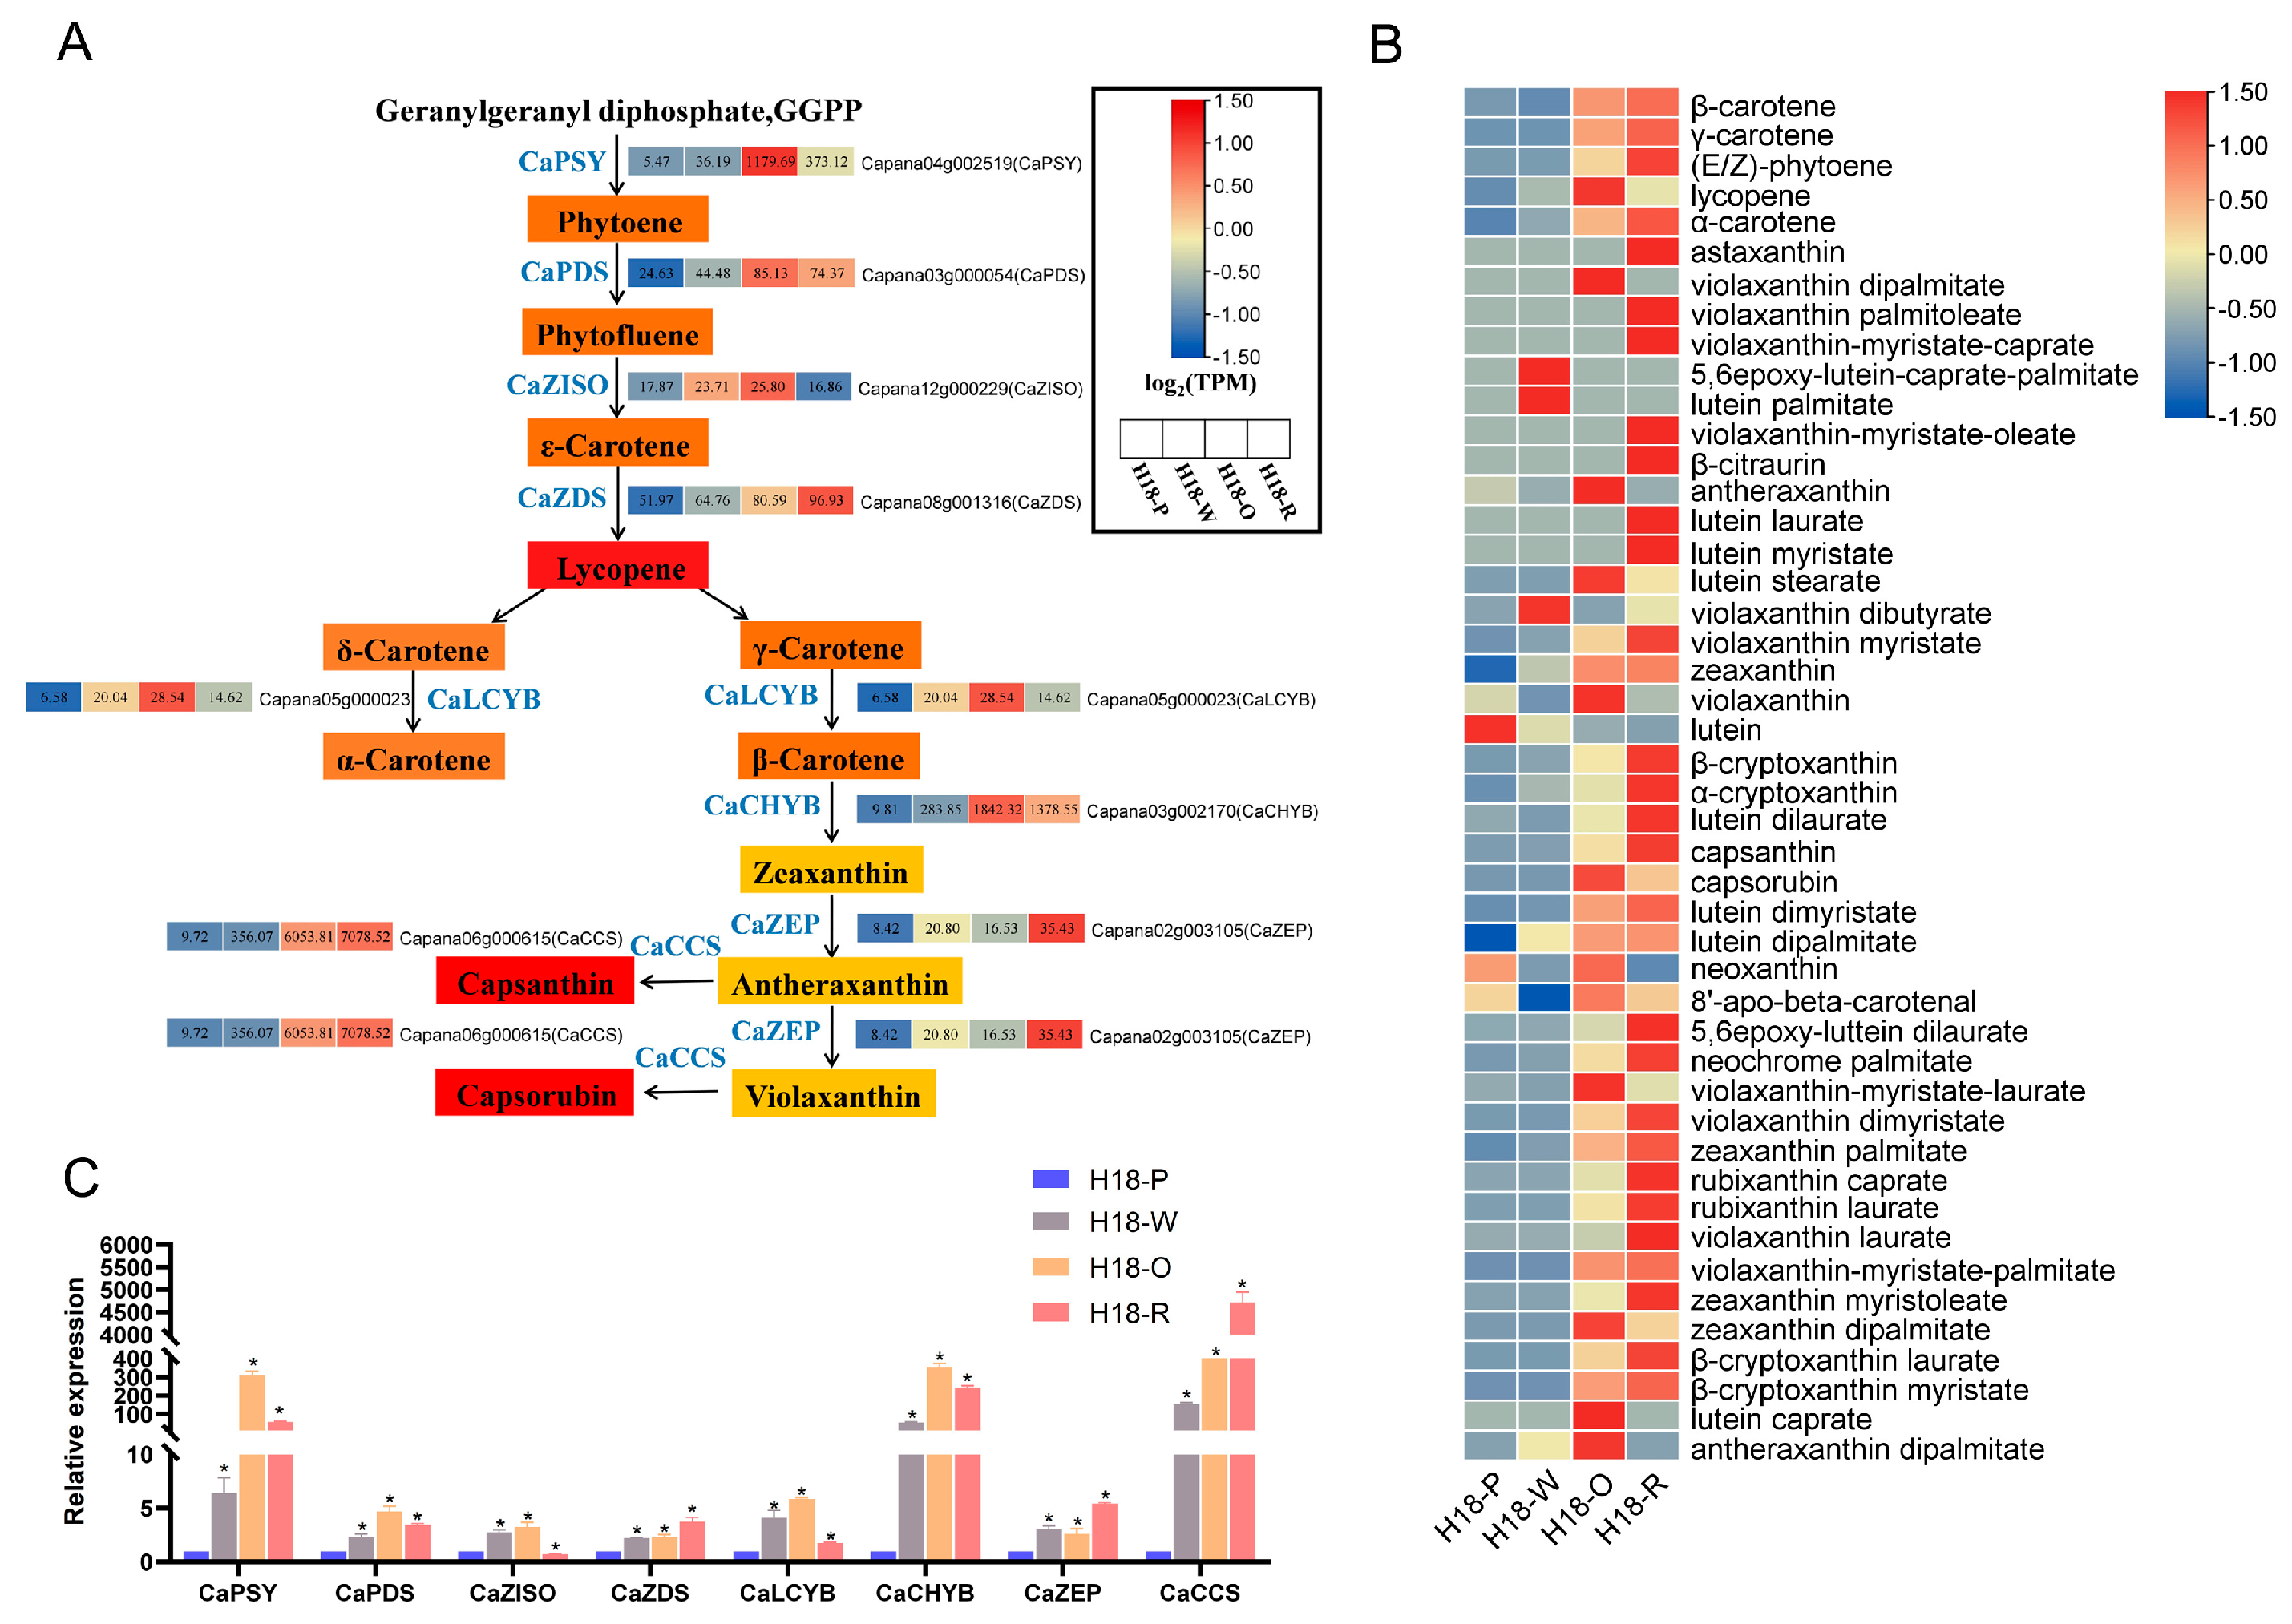
3.6. DEGs and DAMs Related to Carotenoids Biosynthesis

We conducted targeted carotenoid metabolome sequencing to identify and quantify the carotenoid metabolites at four distinct stages of pepper fruit development: H18-P, H18-W, H18-O, and H18-R. Most metabolites in the carotenoid metabolic pathway were detected at low levels during the purple (H18-P) and off-white (H18-W) stages. However, their accumulation significantly increased as the fruits transitioned to the orange (H18-Y) stage. Some metabolites, such as lycopene, antheraxanthin, violaxanthin, and capsorubin, peaked during the H18-Y stage and subsequently declined. In contrast, other metabolites, including β-carotene, γ-carotene, α-carotene, zeaxanthin, and capsanthin, reached their highest accumulation during the red (H18-R) stage of fruit development. The increase in capsanthin content and the decrease in capsorubin content during the development of peppers from H18-Y to H18-R suggest that the red coloration of H18 peppers is primarily driven by capsanthin. In addition to these substances, certain other compounds initially (H18-P) accumulate in high concentrations before gradually decreasing over time, such as lutein (Figure 6B, Table S4). The analysis of the expression patterns of the structural genes in the carotenoid biosynthesis pathway revealed that the majority of genes involved in carotenoid metabolism exhibited a consistent trend in expression with the accumulation of metabolites along the carotenoid pathway. The expression of most carotenoid synthesis candidate genes reached its peak during the H18-Y stage and then decreased during the H18-R stage, such as Capana04g002519 (CaPSY), Capana03g000054 (CaPDS), Capana12g000229 (CaZISO), Capana05g000023 (CaLCYB), and Capana03g002170 (CaCHYB). However, some candidate genes, such as Capana08g001316 (CaZDS), Capana02g003105 (CaZEP), and Capana06g000615 (CaCCS), achieved their highest levels of expression during the H18-R stage (Figure 6A). We then performed RT-qPCR on the genes involved in the carotenoid synthesis pathway and found that the result corroborated the expression trends observed in the transcriptomic data, providing additional validation for our findings (Figure 6C).

4. Discussion

Numerous studies have been conducted on pigment composition in pepper fruits [50,51,52]. However, most research has primarily focused on individual pigments, such as anthocyanins and carotenoids. In this study, we utilized a novel cultivar, H18, which was developed in our previous work and exhibits a distinct color transformation mechanism different from those reported in prior research. Leveraging this unique mechanism, we investigated the synthesis and degradation processes of anthocyanins, as well as the synthesis mechanism of carotenoids during the color transformation of H18 peppers. Our findings provide a new research foundation and direction for understanding the color transformation mechanisms in pigmented peppers. Furthermore, this study offers a theoretical basis for the genetic improvement of colored fruits in pepper and other Solanaceae crops.
The accumulation of anthocyanins is crucial for plant growth and development and for their response to various environmental stresses. Anthocyanins possess antioxidant properties and are critical in the regulation of the balance of reactive oxygen species (ROS) within plant cells [5,6,24]. Moreover, anthocyanins act as a natural ‘sunscreen’, protecting plants from the damaging effects of ultraviolet radiation under intense sunlight [53]. The anthocyanin content of fruit is also a key factor in determining fruit quality, and the cultivation of anthocyanin-rich fruits and vegetables has become a major research focus in recent years [54]. In rice, researchers have successfully bred rice endosperm with elevated anthocyanin levels using a novel gene design technique that allows for the simultaneous delivery of multiple genes [55]. In tomato, a purple variety rich in anthocyanins has been developed through regulating light signaling and genetic manipulation [56]. A key candidate gene, MaVHAG3, was identified in mulberry through comparative genomics and genome-wide association studies (GWAS) [57], and this discovery provides valuable genetic resources for breeding mulberry varieties rich in anthocyanins. In addition, anthocyanins have been used as markers in breeding. For example, the anthocyanin marker R1-nj, integrated into most haploid inducers, helps distinguish between Maize haploid and diploid embryos [58]. By linking the SlSTR1 gene, which regulates male sterility, to the SlANT1 gene of tomato, which is responsible for anthocyanin production in tomatoes, researchers developed a method to quickly and easily determine the fertility status of a strain based on the presence or absence of purple anthocyanins. This innovation has streamlined the breeding process for male sterility [59]. The key gene for anthocyanin synthesis in peppers, Ca3GT, was identified by the previous authors through a map-based cloning strategy and transcriptome sequencing [60]. In this study, we experimentally confirmed, through metabolomic profiling, that anthocyanins accumulate extensively in H18 pepper fruit during the purple-color stage (H18-P) and gradually decrease as the fruits develop. Using the trend of anthocyanin accumulation in H18 peppers, we screened candidate genes involved in the anthocyanin metabolism pathway through transcriptomic data and RT-qPCR. This work aims to provide a theoretical foundation for improving pepper fruit quality and molecular breeding.
Previous research indicates that anthocyanidins are generally unstable under normal conditions, whereas anthocyanins tend to be stored in plant vacuoles after synthesis, exhibiting relatively stable chemical properties [61]. In this study, we observed that the H18 fruit transitions from an initial purple color (H18-P) to an off-white color (H18-W), accompanied by a significant decrease in anthocyanin content, suggesting a process of anthocyanin degradation. Therefore, investigating the degradation pathway of pepper anthocyanins is a valuable research direction. Although previous studies have not extensively explored the degradation pathway of anthocyanins, they have identified several genes involved in this process. In blood orange and lychee fruits, β-glucosidase, polyphenol oxidase, and peroxidase are believed to contribute to anthocyanins at the final ripening stage [29,62,63]. In Brunfelsia calycina, a basic peroxidase, BcPrx01, is responsible for the plant degradation of anthocyanins in Brunfelsia calycina flowers [28]. Research on the leaves of Excoecaria cochinchinensis found that the Excoecaria cochinchinensis leaves accumulate a distinct group of phenolic metabolites, mainly GGs/ETs, at the abaxial layer, and GGs/ETs prevent anthocyanin degradation and increase pigment stability by inhibiting POD enzymes, leading to the permanent maintenance of red leaves [64]. In this investigation, we focused on gene families potentially involved in the degradation mechanisms of anthocyanins, BGLU, PPO, and POD, as well as the candidate genes. Our goal is to identify functional genes that regulate anthocyanin degradation through a substrate-catalyzed approach, providing a theoretical foundation for enhancing the traits of purple pepper fruits.
Pepper fruits are rich in carotenoids, including β-carotene, γ-carotene, lutein, β-cryptoxanthin, antheraxanthin, zeaxanthin, violaxanthin, capsanthin, and capsorubin, among others. The type and content of carotenoid accumulation in chili peppers are influenced by factors such as pepper genotype and fruit maturity stage and show significant differences [65,66]. A study on five varieties of chili peppers found that lutein and neoxanthin, characteristic chloroplast pigments, decreased in concentration as the peppers ripened, and they eventually disappeared [67]. Previous studies have shown that the yellow-orange colors of chili pepper fruits are mainly due to the accumulation of α- and β-carotene, zeaxanthin, lutein, and β-cryptoxanthin. Carotenoids such as capsanthin, capsorubin, and capsanthin-5,6-epoxide confer the red colors [68]. Similar results were observed in this study, where lutein decreased during the development of H18 fruits, while neoxanthin initially decreased, then increased, and ultimately disappeared. In green-fruited tomato, after mutations in three genes, phytoenesynthetase1 (Psy1), STAY-GREEN (SGR), and SlMYB12, low carotenoid levels without the degradation of chlorophylls were observed [69]. Studies have demonstrated that the expression patterns of the strawberry LCYB and LCYE genes correlate with the variations in β-carotene and lutein, respectively, serving as crucial genes for carotenoid accumulation in strawberries [70]. In our research, we identified several genes involved in carotenoid biosynthesis in peppers, including CaPSY, CaLCYB, and CaCCS. The expression levels of these genes exhibit a consistent trend with the accumulation of carotenoids. Previous studies have shown that β-Carotene, antheraxanthin, and violaxanthin increased in concentration, while other pigments, including zeaxanthin, β-cryptoxanthin, capsanthin, and capsorubin, were synthesized de novo [37,67,71]. Our studies have shown that the concentration of carotenoid substances increases as pepper fruit transitions through color stages, from purple to off-white, orange, and finally red. This pattern is consistent with trends identified in the previous study. However, we observed a distinct phenomenon with antheraxanthin and violaxanthin, which are extensively synthesized during the H18-O stage but abruptly decline during the H18-R stage. This decline is likely due to a substantial conversion of antheraxanthin and violaxanthin into capsanthin and capsorubin. In this study, we performed a joint analysis of the carotenoid transcriptome and metabolome in colorful chili peppers to examine carotenoid changes during the color transformation of pepper fruits, providing a theoretical basis for improving the quality of chili pepper fruits.
Extensive research has been conducted on transcription factors regulating plant pigments, including MYB, bHLH, NAC, and WRKY families [72,73,74,75]. These transcription factors often exhibit more pronounced effects on pigment regulation compared to synthetic genes. The investigation of transcription factors provides a more advantageous foundation for subsequent genetic engineering studies on pigment variation in pepper fruits. In our forthcoming research, we plan to focus on the functional genes involved in anthocyanin synthesis/degradation and carotenoid biosynthesis. Our approach will initially employ Virus-Induced Gene Silencing (VIGS) technology to validate the functions of these genes. Subsequently, we will identify and screen transcription factors that regulate pigment biosynthesis in peppers, aiming to elucidate the transcriptional regulatory mechanisms underlying pigment biosynthesis in peppers and thereby facilitating molecular breeding efforts.

5. Conclusions

In this investigation, we aimed to explore the underlying mechanism of color transition in H18 pepper fruits by conducting transcriptomic and metabolomic analyses across various developmental stages. Our findings indicated that, during the purple pepper fruit stage (H18-P), there was a higher content of anthocyanins, accompanied by the elevated expression of anthocyanin synthesis genes, including CHS, CHI, F3H, F3′H, F3′5′H, DFR, ANS, and UGFT. As the fruit transitioned to the off-white stage (H18-W), the expression of these genes was significantly reduced, leading to a noticeable decrease in anthocyanin accumulation. Accordingly, we identified several candidate genes associated with anthocyanin degradation, including CaBGLU1, CaBGLU2, CaBGLU3, CaPOD1, CaPOD2, and CaPPO. During the orange (H18-O) and red (H18-R) stages of pepper development, both transcriptome and metabolome data revealed a significant increase in carotenoid accumulation, accompanied by the upregulation of genes involved in carotenoid synthesis, such as CaPSY, CaPDS, CaZISO, CaZDS, CaLCYB, CaCHYB, CaZEP, and CaCCS. Furthermore, capsanthin plays a dominant role in the color change from orange to red (Figure 7).

Supplementary Materials

The following supporting information can be downloaded at: https://www.mdpi.com/article/10.3390/agriculture15060655/s1, Figure S1: Total anthocyanin standard curve used in this study; Table S1: RT-qPCR primers used in this study; Table S2: DEGs between different developmental stage of H18 pepper fruits; Table S3: Metabolomic data of anthocyanins from H18 pepper fruits at four different stages; Table S4: Metabolomic data of carotenoids from H18 pepper fruits at four different stages.

Author Contributions

Conceptualization, H.W. and H.J.; methodology, L.J.; software, D.L.; validation, C.Y., Q.D., and Y.W.; formal analysis, T.S.; investigation, T.S.; resources, H.J.; data curation, X.H.; writing—original draft preparation, H.W. and L.J.; writing—review and editing, M.A.M.; visualization, H.W.; project administration, H.J.; funding acquisition, L.J. and H.J. All authors have read and agreed to the published version of the manuscript.

Funding

This work was supported by the Postdoctoral Research Program Support from Postdoctoral Fund Program of Anhui Province (2024C863), China Agriculture Research System of MOF and MARA (CARS-23-G40, CARS-23-G49), The Youth Development Fund from Anhui Academy of Agricultural Sciences (QNYC-202121), Open Research Fund Program of Anhui Provincial Key Laboratory for Germplasm Resources Creation and High Efficiency Cultivation of Horticultural Crops, Important Science & Technology Specific Projects of Anhui Province (202203a06020030), Anhui Province Vegetable industry Technology System (2021-711), and Anhui Province Improved Variety Joint Research Project.

Institutional Review Board Statement

Not applicable.

Data Availability Statement

The transcriptomic sequencing data analyses were based on clean data of high quality, and all row data generated in this study are accessible at the National Center for Biotechnology Information (NCBI) under the accession number (BioProject accession No. PRJNA1151840).

Conflicts of Interest

The authors declare that they have no competing interests.

Abbreviations

The following abbreviations are used in this manuscript:
BGLUβ-glucosidase
PPOpolyphenol oxidase
PODperoxidase
MVAMevalonate
MEPMethylerythritol Phosphate
F3′HFlavonoid 3′-hydroxylase
GGPPgeranylgeranyl diphosphate

References

  1. Kim, H.S.; Ji, C.Y.; Lee, C.J.; Kim, S.E.; Park, S.C.; Kwak, S.S. Orange: A target gene for regulating carotenoid homeostasis and increasing plant tolerance to environmental stress in marginal lands. J. Exp. Bot. 2018, 69, 3393–3400. [Google Scholar] [CrossRef] [PubMed]
  2. Lu, S.; Ye, J.; Zhu, K.; Zhang, Y.; Zhang, M.; Xu, Q.; Deng, X.; Costa, F. A fruit ripening-associated transcription factor CsMADS5 positively regulates carotenoid biosynthesis in citrus. J. Exp. Bot. 2021, 72, 3028–3043. [Google Scholar] [CrossRef] [PubMed]
  3. Saigo, T.; Wang, T.; Watanabe, M.; Tohge, T. Diversity of anthocyanin and proanthocyanin biosynthesis in land plants. Curr. Opin. Plant Biol. 2020, 55, 93–99. [Google Scholar] [CrossRef] [PubMed]
  4. Espley, R.V.; Jaakola, L. The role of environmental stress in fruit pigmentation. Plant Cell Environ. 2023, 46, 3663–3679. [Google Scholar] [CrossRef]
  5. Davies, K.M.; Landi, M.; van Klink, J.W.; Schwinn, K.E.; Brummell, D.A.; Albert, N.W.; Chagné, D.; Jibran, R.; Kulshrestha, S.; Zhou, Y.; et al. Evolution and function of red pigmentation in land plants. Ann. Bot. 2022, 130, 613–636. [Google Scholar] [CrossRef]
  6. Li, C.; Shi, L.; Li, X.; Wang, Y.; Bi, Y.; Li, W.; Ma, H.; Chen, B.; Zhu, L.; Fu, Y. ECAP is a key negative regulator mediating different pathways to modulate salt stress-induced anthocyanin biosynthesis in Arabidopsis. New Phytol. 2022, 233, 2216–2231. [Google Scholar] [CrossRef]
  7. Tuszyńska, M. Validation of the Analytical Method for the Determination of Flavonoids in Broccoli. J. Hortic. Res. 2014, 22, 131–140. [Google Scholar] [CrossRef]
  8. Kapoor, L.; Simkin, A.J.; George Priya Doss, C.; Siva, R. Fruit ripening: Dynamics and integrated analysis of carotenoids and anthocyanins. BMC Plant Biol. 2022, 22, 27. [Google Scholar] [CrossRef]
  9. Rodríguez-Mena, A.; Ochoa-Martínez, L.A.; González-Herrera, S.M.; Rutiaga-Quiñones, O.M.; González-Laredo, R.F.; Olmedilla-Alonso, B. Natural pigments of plant origin: Classification, extraction and application in foods. Food Chem. 2023, 398, 133908. [Google Scholar] [CrossRef]
  10. Cackett, L.; Luginbuehl, L.H.; Schreier, T.B.; Lopez-Juez, E.; Hibberd, J.M. Chloroplast development in green plant tissues: The interplay between light, hormone, and transcriptional regulation. New Phytol. 2021, 233, 2000–2016. [Google Scholar] [CrossRef]
  11. Gao, L.L.; Hong, Z.H.; Wang, Y.; Wu, G.Z. Chloroplast proteostasis: A story of birth, life, and death. Plant Commun. 2023, 4, 100424. [Google Scholar] [CrossRef] [PubMed]
  12. Zhang, H.; Wang, L.; Deroles, S.; Bennett, R.; Davies, K. New insight into the structures and formation of anthocyanic vacuolar inclusions in flower petals. BMC Plant Biol. 2006, 6, 29. [Google Scholar] [CrossRef] [PubMed]
  13. Oren-Shamir, M. Does anthocyanin degradation play a significant role in determining pigment concentration in plants? Plant Sci. 2009, 177, 310–316. [Google Scholar] [CrossRef]
  14. Sun, T.; Yuan, H.; Cao, H.; Yazdani, M.; Tadmor, Y.; Li, L. Carotenoid Metabolism in Plants: The Role of Plastids. Mol. Plant 2018, 11, 58–74. [Google Scholar] [CrossRef]
  15. Mattioli, R.; Francioso, A.; Mosca, L.; Silva, P. Anthocyanins: A Comprehensive Review of Their Chemical Properties and Health Effects on Cardiovascular and Neurodegenerative Diseases. Molecules 2020, 25, 3809. [Google Scholar] [CrossRef]
  16. Pal, L.; Dwivedi, V.; Gupta, S.K.; Saxena, S.; Pandey, A.; Chattopadhyay, D.; Bartlett, M. Biochemical analysis of anthocyanin and proanthocyanidin and their regulation in determining chickpea flower and seed coat colour. J. Exp. Bot. 2023, 74, 130–148. [Google Scholar] [CrossRef]
  17. Rodríguez-Lorenzo, M.; Mauri, N.; Royo, C.; Rambla, J.L.; Diretto, G.; Demurtas, O.; Hilbert, G.; Renaud, C.; Tobar, V.; Huete, J.; et al. The flavour of grape colour: Anthocyanin content tunes aroma precursor composition by altering the berry microenvironment. J. Exp. Bot. 2023, 74, 6369–6390. [Google Scholar] [CrossRef]
  18. Kaur, S.; Tiwari, V.; Kumari, A.; Chaudhary, E.; Sharma, A.; Ali, U.; Garg, M. Protective and defensive role of anthocyanins under plant abiotic and biotic stresses: An emerging application in sustainable agriculture. J. Biotechnol. 2023, 361, 12–29. [Google Scholar] [CrossRef]
  19. Lisek, J. Evaluation of Yield and Healthiness of Twenty Table Grapevine Cultivars Grown in Central Poland. J. Hortic. Res. 2014, 22, 101–107. [Google Scholar] [CrossRef]
  20. Jaakola, L. New insights into the regulation of anthocyanin biosynthesis in fruits. Trends Plant Sci. 2013, 18, 477–483. [Google Scholar] [CrossRef]
  21. Khoo, H.E.; Azlan, A.; Tang, S.T.; Lim, S.M. Anthocyanidins and anthocyanins: Colored pigments as food, pharmaceutical ingredients, and the potential health benefits. Food Nutr. Res. 2017, 61, 1361779. [Google Scholar] [CrossRef] [PubMed]
  22. Sendri, N.; Bhandari, P. Anthocyanins: A comprehensive review on biosynthesis, structural diversity, and industrial applications. Phytochem. Rev. 2024, 23, 1913–1974. [Google Scholar] [CrossRef]
  23. Zhao, C.L.; Chen, Z.J.; Bai, X.S.; Ding, C.; Long, T.J.; Wei, F.G.; Miao, K.R. Structure-activity relationships of anthocyanidin glycosylation. Mol. Divers. 2014, 18, 687–700. [Google Scholar] [CrossRef] [PubMed]
  24. Shi, L.; Li, X.; Fu, Y.; Li, C. Environmental Stimuli and Phytohormones in Anthocyanin Biosynthesis: A Comprehensive Review. Int. J. Mol. Sci. 2023, 24, 16415. [Google Scholar] [CrossRef]
  25. Xia, D.; Zhou, H.; Wang, Y.; Li, P.; Fu, P.; Wu, B.; He, Y. How rice organs are colored: The genetic basis of anthocyanin biosynthesis in rice. Crop J. 2021, 9, 598–608. [Google Scholar] [CrossRef]
  26. Bar-Akiva, A.; Ovadia, R.; Rogachev, I.; Bar-Or, C.; Bar, E.; Freiman, Z.; Nissim-Levi, A.; Gollop, N.; Lewinsohn, E.; Aharoni, A.; et al. Metabolic networking in Brunfelsia calycina petals after flower opening. J. Exp. Bot. 2010, 61, 1393–1403. [Google Scholar] [CrossRef]
  27. Vaknin, H.; Bar-Akiva, A.; Ovadia, R.; Nissim-Levi, A.; Forer, I.; Weiss, D.; Oren-Shamir, M. Active anthocyanin degradation in Brunfelsia calycina (yesterday–today–tomorrow) flowers. Planta 2005, 222, 19–26. [Google Scholar] [CrossRef]
  28. Zipor, G.; Duarte, P.; Carqueijeiro, I.; Shahar, L.; Ovadia, R.; Teper-Bamnolker, P.; Eshel, D.; Levin, Y.; Doron-Faigenboim, A.; Sottomayor, M.; et al. In planta anthocyanin degradation by a vacuolar class III peroxidase in Brunfelsia calycina flowers. New Phytol. 2014, 205, 653–665. [Google Scholar] [CrossRef]
  29. Barbagallo, R.N.; Palmeri, R.; Fabiano, S.; Rapisarda, P.; Spagna, G. Characteristic of β-glucosidase from Sicilian blood oranges in relation to anthocyanin degradation. Enzyme Microb. Technol. 2007, 41, 570–575. [Google Scholar] [CrossRef]
  30. Saniewski, M.; Horbowicz, M.; Kanlayanarat, S. The Biological Activities of Troponoids and Their Use in Agriculture A Review. J. Hortic. Res. 2014, 22, 5–19. [Google Scholar] [CrossRef]
  31. Maoka, T. Carotenoids as natural functional pigments. J. Nat. Med. 2019, 74, 1–16. [Google Scholar] [CrossRef] [PubMed]
  32. Yuan, H.; Zhang, J.; Nageswaran, D.; Li, L. Carotenoid metabolism and regulation in horticultural crops. Hortic. Res. 2015, 2, 15036. [Google Scholar] [CrossRef] [PubMed]
  33. Sun, T.; Rao, S.; Zhou, X.; Li, L. Plant carotenoids: Recent advances and future perspectives. Mol. Hortic. 2022, 2, 3. [Google Scholar] [CrossRef] [PubMed]
  34. Banerjee, A.; Sharkey, T.D. Methylerythritol 4-phosphate (MEP) pathway metabolic regulation. Nat. Prod. Rep. 2014, 31, 1043–1055. [Google Scholar] [CrossRef]
  35. Hao, Z.; Liu, S.; Hu, L.; Shi, J.; Chen, J. Transcriptome analysis and metabolic profiling reveal the key role of carotenoids in the petal coloration of Liriodendron tulipifera. Hortic. Res. 2020, 7, 70. [Google Scholar] [CrossRef]
  36. Meng, F.; Li, Y.; Li, S.; Chen, H.; Shao, Z.; Jian, Y.; Mao, Y.; Liu, L.; Wang, Q. Carotenoid biofortification in tomato products along whole agro-food chain from field to fork. Trends Food Sci. Technol. 2022, 124, 296–308. [Google Scholar] [CrossRef]
  37. Song, J.; Sun, B.; Chen, C.; Ning, Z.; Zhang, S.; Cai, Y.; Zheng, X.; Cao, B.; Chen, G.; Jin, D.; et al. An R-R-type MYB transcription factor promotes non-climacteric pepper fruit carotenoid pigment biosynthesis. Plant J. 2023, 115, 724–741. [Google Scholar] [CrossRef]
  38. Stra, A.; Almarwaey, L.O.; Alagoz, Y.; Moreno, J.C.; Al-Babili, S. Carotenoid metabolism: New insights and synthetic approaches. Front. Plant Sci. 2023, 13, 1072061. [Google Scholar] [CrossRef]
  39. Ye, S.; Huang, Y.; Ma, T.; Ma, X.; Li, R.; Shen, J.; Wen, J. BnaABF3 and BnaMYB44 regulate the transcription of zeaxanthin epoxidase genes in carotenoid and abscisic acid biosynthesis. Plant Physiol. 2024, 195, 2372–2388. [Google Scholar] [CrossRef]
  40. Zhou, Y.; Wu, W.; Sun, Y.; Shen, Y.; Mao, L.; Dai, Y.; Yang, B.; Liu, Z. Integrated transcriptome and metabolome analysis reveals anthocyanin biosynthesis mechanisms in pepper (Capsicum annuum L.) leaves under continuous blue light irradiation. BMC Plant Biol. 2024, 24, 210. [Google Scholar] [CrossRef]
  41. Ruan, H.; Shi, X.; Gao, L.; Rashid, A.; Li, Y.; Lei, T.; Dai, X.; Xia, T.; Wang, Y. Functional analysis of the dihydroflavonol 4-reductase family of Camellia sinensis: Exploiting key amino acids to reconstruct reduction activity. Hortic. Res. 2022, 9, uhac098. [Google Scholar] [CrossRef] [PubMed]
  42. Arnon, D.I. Copper Enzymes in Isolated Chloroplasts. Polyphenoloxidase in Beta Vulgaris. Plant Physiol. 1949, 24, 1–15. [Google Scholar] [CrossRef] [PubMed]
  43. Vera Alvarez, R.; Pongor, L.S.; Mariño-Ramírez, L.; Landsman, D. TPMCalculator: One-step software to quantify mRNA abundance of genomic features. Bioinformatics 2019, 35, 1960–1962. [Google Scholar] [CrossRef]
  44. Burge, S.; Kelly, E.; Lonsdale, D.; Mutowo-Muellenet, P.; McAnulla, C.; Mitchell, A.; Sangrador-Vegas, A.; Yong, S.Y.; Mulder, N.; Hunter, S. Manual GO annotation of predictive protein signatures: The InterPro approach to GO curation. Database 2012, 2012, bar068. [Google Scholar] [CrossRef] [PubMed]
  45. Kanehisa, M.; Goto, S. KEGG: Kyoto encyclopedia of genes and genomes. Nucleic Acids Res. 2000, 28, 27–30. [Google Scholar] [CrossRef]
  46. Shen, X.; Wang, R.; Xiong, X.; Yin, Y.; Cai, Y.; Ma, Z.; Liu, N.; Zhu, Z.-J. Metabolic reaction network-based recursive metabolite annotation for untargeted metabolomics. Nat. Commun. 2019, 10, 1516. [Google Scholar] [CrossRef]
  47. Wang, H.; Zhang, Y.; Feng, X.; Hong, J.; Aamir Manzoor, M.; Zhou, X.; Zhou, Q.; Cai, Y. Transcription factor PbMYB80 regulates lignification of stone cells and undergoes RING finger protein PbRHY1-mediated degradation in pear fruit. J. Exp. Bot. 2024, 75, 883–900. [Google Scholar] [CrossRef]
  48. Wan, H.; Yuan, W.; Ruan, M.; Ye, Q.; Wang, R.; Li, Z.; Zhou, G.; Yao, Z.; Zhao, J.; Liu, S.; et al. Identification of reference genes for reverse transcription quantitative real-time PCR normalization in pepper (Capsicum annuum L.). Biochem. Biophys. Res. Commun. 2011, 416, 24–30. [Google Scholar] [CrossRef]
  49. Livak, K.J.; Schmittgen, T.D. Analysis of relative gene expression data using real-time quantitative PCR and the 2−ΔΔCT method. Methods 2001, 25, 402–408. [Google Scholar] [CrossRef]
  50. Zhou, Y.; Mumtaz, M.A.; Zhang, Y.; Shu, H.; Hao, Y.; Lu, X.; Cheng, S.; Zhu, G.; Wang, Z. Response of Anthocyanin Accumulation in Pepper (Capsicum annuum) Fruit to Light Days. Int. J. Mol. Sci. 2022, 23, 8357. [Google Scholar] [CrossRef]
  51. Tang, B.; Li, L.; Hu, Z.; Chen, Y.; Tan, T.; Jia, Y.; Xie, Q.; Chen, G. Anthocyanin Accumulation and Transcriptional Regulation of Anthocyanin Biosynthesis in Purple Pepper. J. Agric. Food. Chem. 2020, 68, 12152–12163. [Google Scholar] [CrossRef] [PubMed]
  52. Tang, Y.; Gan, Y.; Zhang, G.; Shen, X.; Shi, C.; Deng, X.; Lu, Y.; Brotman, Y.; Yang, S.; Ouyang, B. Identification of carotenoids and candidate genes shaping high pigment chili pepper variety. Sci. Hortic. 2024, 327, 112799. [Google Scholar] [CrossRef]
  53. Li, Z.; Ahammed, G.J. Plant stress response and adaptation via anthocyanins: A review. Plant Stress 2023, 10, 100230. [Google Scholar] [CrossRef]
  54. Jian, W.; Cao, H.; Yuan, S.; Liu, Y.; Lu, J.; Lu, W.; Li, N.; Wang, J.; Zou, J.; Tang, N.; et al. SlMYB75, an MYB-type transcription factor, promotes anthocyanin accumulation and enhances volatile aroma production in tomato fruits. Hortic. Res. 2019, 6, 22. [Google Scholar] [CrossRef]
  55. Zhu, Q.; Yu, S.; Zeng, D.; Liu, H.; Wang, H.; Yang, Z.; Xie, X.; Shen, R.; Tan, J.; Li, H.; et al. Development of “Purple Endosperm Rice” by Engineering Anthocyanin Biosynthesis in the Endosperm with a High-Efficiency Transgene Stacking System. Mol. Plant 2017, 10, 918–929. [Google Scholar] [CrossRef]
  56. Sun, C.; Deng, L.; Du, M.; Zhao, J.; Chen, Q.; Huang, T.; Jiang, H.; Li, C.B.; Li, C. A Transcriptional Network Promotes Anthocyanin Biosynthesis in Tomato Flesh. Mol. Plant 2020, 13, 42–58. [Google Scholar] [CrossRef]
  57. Xia, Z.; Fan, W.; Liu, D.; Chen, Y.; Lv, J.; Xu, M.; Zhang, M.; Ren, Z.; Chen, X.; Wang, X.; et al. Haplotype-resolved chromosomal-level genome assembly reveals regulatory variations in mulberry fruit anthocyanin content. Hortic. Res. 2024, 11, uhae120. [Google Scholar] [CrossRef]
  58. Lopez, L.A.; Ochieng, J.; Pacheco, M.; Martinez, L.; Omar, H.A.; Gowda, M.; Prasanna, B.M.; Dhugga, K.S.; Chaikam, V. Effectiveness of R1-nj Anthocyanin Marker in the Identification of In Vivo Induced Maize Haploid Embryos. Plants 2023, 12, 2314. [Google Scholar] [CrossRef]
  59. Du, M.; Zhou, K.; Liu, Y.; Deng, L.; Zhang, X.; Lin, L.; Zhou, M.; Zhao, W.; Wen, C.; Xing, J.; et al. A biotechnology-based male-sterility system for hybrid seed production in tomato. Plant J. 2020, 102, 1090–1100. [Google Scholar] [CrossRef]
  60. Liu, J.; Ai, X.; Wang, Y.; Lu, Q.; Li, T.; Wu, L.; Sun, L.; Shen, H. Fine mapping of the Ca3GT gene controlling anthocyanin biosynthesis in mature unripe fruit of Capsicum annuum L. Theor. Appl. Genet. 2020, 133, 2729–2742. [Google Scholar] [CrossRef]
  61. Chanoca, A.; Kovinich, N.; Burkel, B.; Stecha, S.; Bohorquez-Restrepo, A.; Ueda, T.; Eliceiri, K.W.; Grotewold, E.; Otegui, M.S. Anthocyanin Vacuolar Inclusions Form by a Microautophagy Mechanism. Plant Cell 2015, 27, 2545–2559. [Google Scholar] [CrossRef] [PubMed]
  62. Zhang, Z.; Pang, X.; Ji, Z.; Jiang, Y. Role of anthocyanin degradation in litchi pericarp browning. Food Chem. 2001, 75, 217–221. [Google Scholar] [CrossRef]
  63. Zhang, Z.; Pang, X.; Xue, W.D.; Ji, Z.; Jiang, Y. Role of peroxidase in anthocyanin degradation in litchi fruit pericarp. Food Chem. 2005, 90, 47–52. [Google Scholar] [CrossRef]
  64. Luo, H.; Li, W.; Zhang, X.; Deng, S.; Xu, Q.; Hou, T.; Pang, X.; Zhang, Z.; Zhang, X. In planta high levels of hydrolysable tannins inhibit peroxidase mediated anthocyanin degradation and maintain abaxially red leaves of Excoecaria Cochinchinensis. BMC Plant Biol. 2019, 19, 315. [Google Scholar] [CrossRef]
  65. Baenas, N.; Belović, M.; Ilic, N.; Moreno, D.A.; García-Viguera, C. Industrial use of pepper (Capsicum annum L.) derived products: Technological benefits and biological advantages. Food Chem. 2019, 274, 872–885. [Google Scholar] [CrossRef]
  66. Berry, H.M.; Rickett, D.V.; Baxter, C.J.; Enfissi, E.M.A.; Fraser, P.D. Carotenoid biosynthesis and sequestration in red chilli pepper fruit and its impact on colour intensity traits. J. Exp. Bot. 2019, 70, 2637–2650. [Google Scholar] [CrossRef]
  67. Hornero-Méndez, D.; Gómez-Ladrón de Guevara, R.; Mínguez-Mosquera, M.I. Carotenoid Biosynthesis Changes in Five Red Pepper (Capsicum annuum L.) Cultivars during Ripening. Cultivar Selection for Breeding. J. Agric. Food Chem. 2000, 48, 3857–3864. [Google Scholar] [CrossRef]
  68. Gómez-García Mdel, R.; Ochoa-Alejo, N. Biochemistry and molecular biology of carotenoid biosynthesis in chili peppers (Capsicum spp.). Int. J. Mol. Sci. 2013, 14, 19025–19053. [Google Scholar] [CrossRef]
  69. Kang, S.-I.; Hwang, I.; Goswami, G.; Jung, H.-J.; Nath, U.K.; Yoo, H.-J.; Lee, J.M.; Nou, I.S. Molecular Insights Reveal Psy1, SGR, and SlMYB12 Genes are Associated with Diverse Fruit Color Pigments in Tomato (Solanum lycopersicum L.). Molecules 2017, 22, 2180. [Google Scholar] [CrossRef]
  70. Zhu, H.; Chen, M.; Wen, Q.; Li, Y. Isolation and characterization of the carotenoid biosynthetic genes LCYB, LCYE and CHXB from strawberry and their relation to carotenoid accumulation. Sci. Hortic. 2015, 182, 134–144. [Google Scholar] [CrossRef]
  71. Song, J.; Chen, C.; Zhang, S.; Wang, J.; Huang, Z.; Chen, M.; Cao, B.; Zhu, Z.; Lei, J. Systematic analysis of the Capsicum ERF transcription factor family: Identification of regulatory factors involved in the regulation of species-specific metabolites. BMC Genom. 2020, 21, 573. [Google Scholar] [CrossRef] [PubMed]
  72. Li, C.; Yu, W.; Xu, J.; Lu, X.; Liu, Y. Anthocyanin Biosynthesis Induced by MYB Transcription Factors in Plants. Int. J. Mol. Sci. 2022, 23, 11701. [Google Scholar] [CrossRef] [PubMed]
  73. Duan, X.; Jiang, C.; Zhao, Y.; Gao, G.; Li, M.; Qi, H. Transcriptome and metabolomics analysis revealed that CmWRKY49 regulating CmPSY1 promotes β-carotene accumulation in orange fleshed oriental melon. Hortic. Plant J. 2022, 8, 650–666. [Google Scholar] [CrossRef]
  74. Luo, F.; Duan, X.; Gao, G.; Zhao, Y.; Li, M.; Qi, H. CmERFIV-4-CmWRKY44-CmPSY1 modulates ethylene-induced β-carotene accumulation in oriental melon fruit. Postharvest Biol. Technol. 2025, 222, 113409. [Google Scholar] [CrossRef]
  75. Zhao, Y.; Duan, X.; Wang, L.; Gao, G.; Xu, C.; Qi, H. Transcription Factor CmNAC34 Regulated CmLCYB-Mediated β-Carotene Accumulation during Oriental Melon Fruit Ripening. Int. J. Mol. Sci. 2022, 23, 9805. [Google Scholar] [CrossRef]
Figure 1. The phenotypic observation and determination of anthocyanins and carotenoids in H18 pepper fruits at four different developmental stages. (A) The observation of H18 pepper phenotypes. (B) The determination of anthocyanins in H18 pepper fruits. (C) The determination of carotenoids in pepper fruits. Different lowercase letters in the data column indicate significant differences (p < 0.05) according to Duncan’s test.
Agriculture 15 00655 g001
Figure 2. The transcriptomic and metabolomic analyses of H18 pepper fruits at four different developmental stages. (A) The PCA analysis of transcriptome data. (B) The PCA analysis of metabolome data. (C) The Venn diagram plot analysis of DEGs of transcriptome data. (D) H18-P vs. H18-W DEGs GO analysis. (E) H18-P vs. H18-O DEGs GO analysis. (F) H18-P vs. H18-R DEGs GO analysis. (G) H18-P vs. H18-W DEGs KEGG analysis. (H) H18-P vs. H18-O DEGs KEGG analysis. (I) H18-P vs. H18-R DEGs KEGG analysis.
Agriculture 15 00655 g002
Figure 3. The transcriptomic and metabolomic analyses of the anthocyanin metabolic pathway. (A) The analysis of gene expression levels in anthocyanin metabolism pathways. (B) The metabolomic data heatmap analysis of anthocyanins and procyanidins. (C) The RT-qPCR analysis of genes involved in the anthocyanin metabolism pathway. The asterisks indicate significant differences compared to the expression levels seen with the H18-P fruits; one-way ANOVA (* p < 0.05).
Agriculture 15 00655 g003
Figure 4. The trend analysis of the transcriptomic data of pepper fruits at different developmental stages of H18. (A) The trend analyses of 15 pepper fruits at four H18 development stages. (B) Profiles10 ordered based on the p-value significance of number of genes assigned versus expected. (C) The KEGG analysis of all genes in profiles 10.
Agriculture 15 00655 g004
Figure 5. The transcriptomic analyses of anthocyanins degradation genes. (A) The transcriptomic analysis of anthocyanins degradation genes in H18 pepper fruits at four different developmental stages. (B) The RT-qPCR analysis of anthocyanins degradation genes in H18 pepper fruits at four different developmental stages. The asterisks indicate significant differences compared to the expression levels seen with the H18-P fruits; one-way ANOVA (* p < 0.05).
Agriculture 15 00655 g005
Figure 6. The transcriptomic and metabolomic analyses of the anthocyanin metabolic pathway. (A) The analysis of gene expression levels in the carotenoid metabolism pathways. (B) The metabolomic data heatmap analysis of carotenoids. (C) The RT-qPCR analysis of genes involved in the carotenoid metabolism pathway. The asterisks indicate significant differences compared to the expression levels seen with the H18-P fruits; one-way ANOVA (* p < 0.05).
Agriculture 15 00655 g006
Figure 7. The analysis of color transformation patterns in H18 peppers at different developmental stages.
Agriculture 15 00655 g007
Disclaimer/Publisher’s Note: The statements, opinions and data contained in all publications are solely those of the individual author(s) and contributor(s) and not of MDPI and/or the editor(s). MDPI and/or the editor(s) disclaim responsibility for any injury to people or property resulting from any ideas, methods, instructions or products referred to in the content.

