Article

Impact of Digital Literacy on Rural Residents’ Subjective Well-Being: An Empirical Study in China

1
Soviet Area Revitalization Institute, Jiangxi Normal University, Nanchang 330022, China
2
Research Base for Revitalization and Development of Old Revolutionary Base Areas of Jiangxi Province, Jiangxi Normal University, Nanchang 330022, China
3
School of Marxism, Jiangxi Normal University, Nanchang 330022, China
4
School of Economics and Management, Nanchang University, Nanchang 330031, China
5
Center of Applied Statistics, School of Statistics, Renmin University of China, Beijing 100872, China
*
Author to whom correspondence should be addressed.
Agriculture 2025, 15(6), 586; https://doi.org/10.3390/agriculture15060586
Submission received: 12 February 2025 / Revised: 3 March 2025 / Accepted: 7 March 2025 / Published: 10 March 2025
(This article belongs to the Section Agricultural Economics, Policies and Rural Management)

Abstract

:
The United Nations Organization states that well-being consists of universal goals and aspirations in human life throughout the world. The arrival of the digital age has a profound impact on humans’ way of production and life. While material living standards continue to improve, happiness has become the pursuit of social residents. Based on the theory of happiness economics, we use the China Family Panel Studies (CFPS) data to construct an Ordered Probit fixed-effect model and systematically investigate the dividend and disparities of digital literacy on rural residents’ subjective well-being in China, such as age, gender, region, education attainment, and so on. The results indicate that digital literacy significantly strengthens rural residents’ subjective well-being. Under the influence of digital literacy, subjective well-being is heterogeneous in individuals’ natural and social attributes. Further mechanism tests show that rural residents’ digital literacy strengthens subjective well-being through income generation, consumption upgrading, and social belonging effects. In consequence, the government should promote the construction of digital infrastructure, focus on the penetration and quality of digital technology, digital skill education and training, and guiding residents to utilize digital technology properly. Our study furthers the understanding of residents’ well-being and highlights digital literacy as a means to boost well-being, reduce regional development gaps, and support sustainable development.

1. Introduction

The ultimate aim of economic and social development is to increase residents’ happiness, and achieving happiness is a major goal for most social residents. With the rapid development of information technology and the accelerated popularization of Internet applications, unprecedented and profound changes have taken place in human production and lifestyle. The popularity and use of the Internet have greatly facilitated people’s activities, such as shopping, learning, entertainment, social interaction, and information acquisition [1]. According to the Digital 2024 Global Overview Report released by Meltwater and We Are Social [2], by early 2024, there were 5.35 billion Internet users and 5.61 billion mobile phone users globally, accounting for 66.6% and 69.4% of the world’s population, and 5.04 billion active social media users across the world, 62.3% of the global population, with people spending an average of 2 h and 23 min a day on social media platforms. The 2023 Global Happiness Report announced by Lululemon [3] found that 65% of respondents think that improving happiness is one of their life’s priorities, and it is believed that digital tools play a key role in determining an individual’s happiness [4].
Ameliorating the well-being of rural residents is one of the United Nations Sustainable Development Goals [5]. In terms of subjective well-being, the theory of happiness economics points out that humans’ happiness and sustainable social development should be the driving force and purpose of economic development, while Maslow’s hierarchy of needs theory explains the formation mechanism of happiness from the perspective of psychological needs. Together, they constitute an “objective-subjective” two-dimensional analytical framework. As a developing country, China is faced with the problems of unbalanced regional development and rural underdevelopment [6]. Improving the welfare of rural residents is an important goal in China’s economic and social development. Subjective well-being (SWB) is defined as the subjective cognition and degree of satisfaction that an individual has towards their quality of life. As a “new quality productive force”, digital technology has become a powerful driver in boosting the rural economy and residents’ well-being. Rural residents can increase social communication, create consumption value, engage in recreation, and gain information by mastering digital technologies, which bring development opportunities and digital well-being to residents in rural areas, which then promotes the development of a sustainable digital society [7]. In recent years, China has vigorously endeavored to bridge the digital divide by providing equal access to digital technology for disadvantaged groups and facilitating their integration into digital society, thereby reducing their sense of relative deprivation and promoting social equity. This effort holds significant theoretical value and practical implications for enhancing global well-being.
The application and promotion of digital technology have permeated every aspect of society, serving as a pivotal catalyst and inherent driving force for economic and social advancement [8,9]. The existing literature on the digital economy mainly focuses on four aspects. The first is the positive impact of digital infrastructure on regional development. Broadband infrastructure not only contributes to urban innovation [10] but also has a positive impact on economic development, employment, medical care, education, and other aspects of rural areas [11,12]. The second aspect pertains to the positive impact of digital technology on the transformation and advancement of enterprises, organizations, and governments. The development of digital technology boosts the digital transformation and upgrading of enterprises [13], which also enhances the research and development capabilities for innovation within enterprises, promotes corporate performance [14], and creates new business models [8]. The utilization of contemporary information technology enables government departments to achieve digital services such as process optimization, information sharing, and enhanced convenience. As a result, this facilitates the optimization of government operational modes [15,16]. The third aspect relates to the role of digital technology in facilitating economic and social development. The advancements in areas such as big data, artificial intelligence, blockchain, and other cutting-edge technologies are instrumental in driving the transformation of both traditional and emerging industries [17], reducing industrial transaction costs [16,18], optimizing the allocation of market resources [19], and improving the availability of products or services [20]. The fourth aspect is the impact of digital technology on residents’ lives. The literature suggests that digital technology offers individuals access to educational and communication channels; enhances workers’ skills and capabilities through online recruitment, network-based education, and other platforms; and fosters employment opportunities and entrepreneurial endeavors among residents [21]. In addition, the development of digital technology reinforces people’s social connections [22], unleashes the vitality of demand, and optimizes the consumption structure [19].
The concept of subjective well-being reflects individuals’ personal perception and contentment regarding the overall quality of their lives. SWB serves as a crucial welfare indicator [23], progressively evolving into a manifestation of welfare. To address the relative scarcity of subjective well-being [24], the enhancement of residents’ happiness has emerged as a pressing concern across all sectors of society. Numerous studies contend that income and consumption constitute the primary determinants influencing happiness [25,26]. Furthermore, researchers have argued for factors that influence the subjective well-being of residents in Europe, Spain, and other regions, including health, broadband access, and education [12,27,28]. The subjective well-being of residents can be influenced by various external factors, such as employment and entrepreneurship, the ecological environment, and government support policies [6,29,30].
With the increasing role of the Internet in daily life, it is vital to understand its impact on individual well-being [31]. The impact of digital technology on individual well-being has gradually garnered attention [32], particularly the impact of digital literacy, which reflects individuals’ attitudes, abilities, and thinking regarding the effective use of digital tools and equipment, as well as the utilization of digital resources. The presence of a robust information and communication technology infrastructure plays a pivotal role in augmenting residents’ income levels [33]. The popularization of digital technologies facilitates the upgrading of consumption, wherein conspicuous consumption and increased social connections cater to people’s material and spiritual needs, thereby enhancing residents’ well-being [34]. The advancement of network technology enables individuals to access information, knowledge, and other resources more conveniently, contributing to greater subjective well-being [35]. The implementation of public policies aimed at promoting the utilization of digital technologies has a discernible impact on mitigating the digital divide among residents.
The existing literature mostly studies the relationship between external factors, such as digital technology infrastructure construction and digital technology popularization, and single aspects, such as residents’ income, consumption, and social demand. These studies focus on the impact of objective factors other than technology users on the objective well-being of residents. The relationship between the intrinsic digital literacy of residents themselves and their own subjective well-being is ignored. Improving the well-being of rural residents in China is of great significance in promoting agricultural modernization, narrowing the urban–rural gap, maintaining social stability, and achieving common prosperity, and is a key measure to achieve the country’s long-term development goals. The utilization of digital technology enhances the well-being of rural residents by facilitating their access to digital benefits and fostering balanced regional development. Thus, the relationship between the digital literacy of rural residents and their well-being is the key point of this study.
Using the questionnaire data of the China Family Group Study (CFPS) conducted by the China Social Science Survey Center of Peking University in 2014, 2016, 2018, and 2020, this study uses the principal component analysis method to measure the digital literacy of Chinese rural residents from six dimensions, Internet access, digital learning, work, social interaction, entertainment, and business activities, to investigate the relationship between it and subjective well-being. The results indicate that rural residents’ digital literacy positively impacts their subjective well-being. Specifically, for every 1% increase in the digital literacy level of rural residents, there is a notable 0.048% increase in their subjective well-being, which remains significant even after conducting robustness tests. Furthermore, additional tests reveal that the impact of digital literacy on rural residents’ well-being varies across natural and social characteristics. In particular, it has a more pronounced effect on individuals residing in central and western regions, young and middle-aged groups, males, those with lower education levels, and those with strong social relational networks. Moreover, by incorporating per capita income, cultural consumption as a proportion of total consumption, and rural residents’ self-evaluation of personal relationships into the regression equation analysis, we examine how digital literacy influences subjective well-being among rural residents. The results demonstrate that digital literacy can enhance rural residents’ subjective well-being through its effects on income generation, consumption upgrading, and social belonging.
Our contributions are as follows: First, we take the subjective well-being of rural residents as the research object, which enriches the connotation of rural residents’ well-being. Well-being encompasses both objective welfare and subjective experiences, yet existing studies predominantly examine residents’ well-being from the perspective of objective indicators such as income and consumption. Given their relatively vulnerable status, there is a lack of research exploring rural residents’ subjective perceptions and satisfaction levels regarding their quality of life. Second, we construct the measurement index of digital literacy from the information technology level to provide a new perspective for studying the factors affecting residents’ subjective well-being. The existing literature has paid limited attention to the factors influencing residents’ subjective well-being. By examining the relationship between digital literacy in accessibility to digital technology and rural residents’ subjective well-being, we aim to enhance the comprehension of the influencing factors of rural residents’ well-being and expand the research framework on antecedents of subjective well-being. Third, this paper provides novel empirical evidence to further understand the relationship between digital technology and residents’ well-being. On the grounds of relative deprivation theory, traditional economic theory, and Maslow’s demand theory, it analyzes the important transmission mechanism of digital literacy influencing residents’ subjective well-being from income generating, consumption upgrading, and social belonging effects. Fourth, by studying the disparities of digital literacy among different groups, our study is beneficial for providing a reference for decision-making for formulating precise policies to improve the subjective well-being of rural residents. We find that the enhancement effect of digital literacy on residents’ subjective well-being is more prominent in “vulnerable groups”, which provides solutions for improving social welfare and bridging the “digital gap”. 
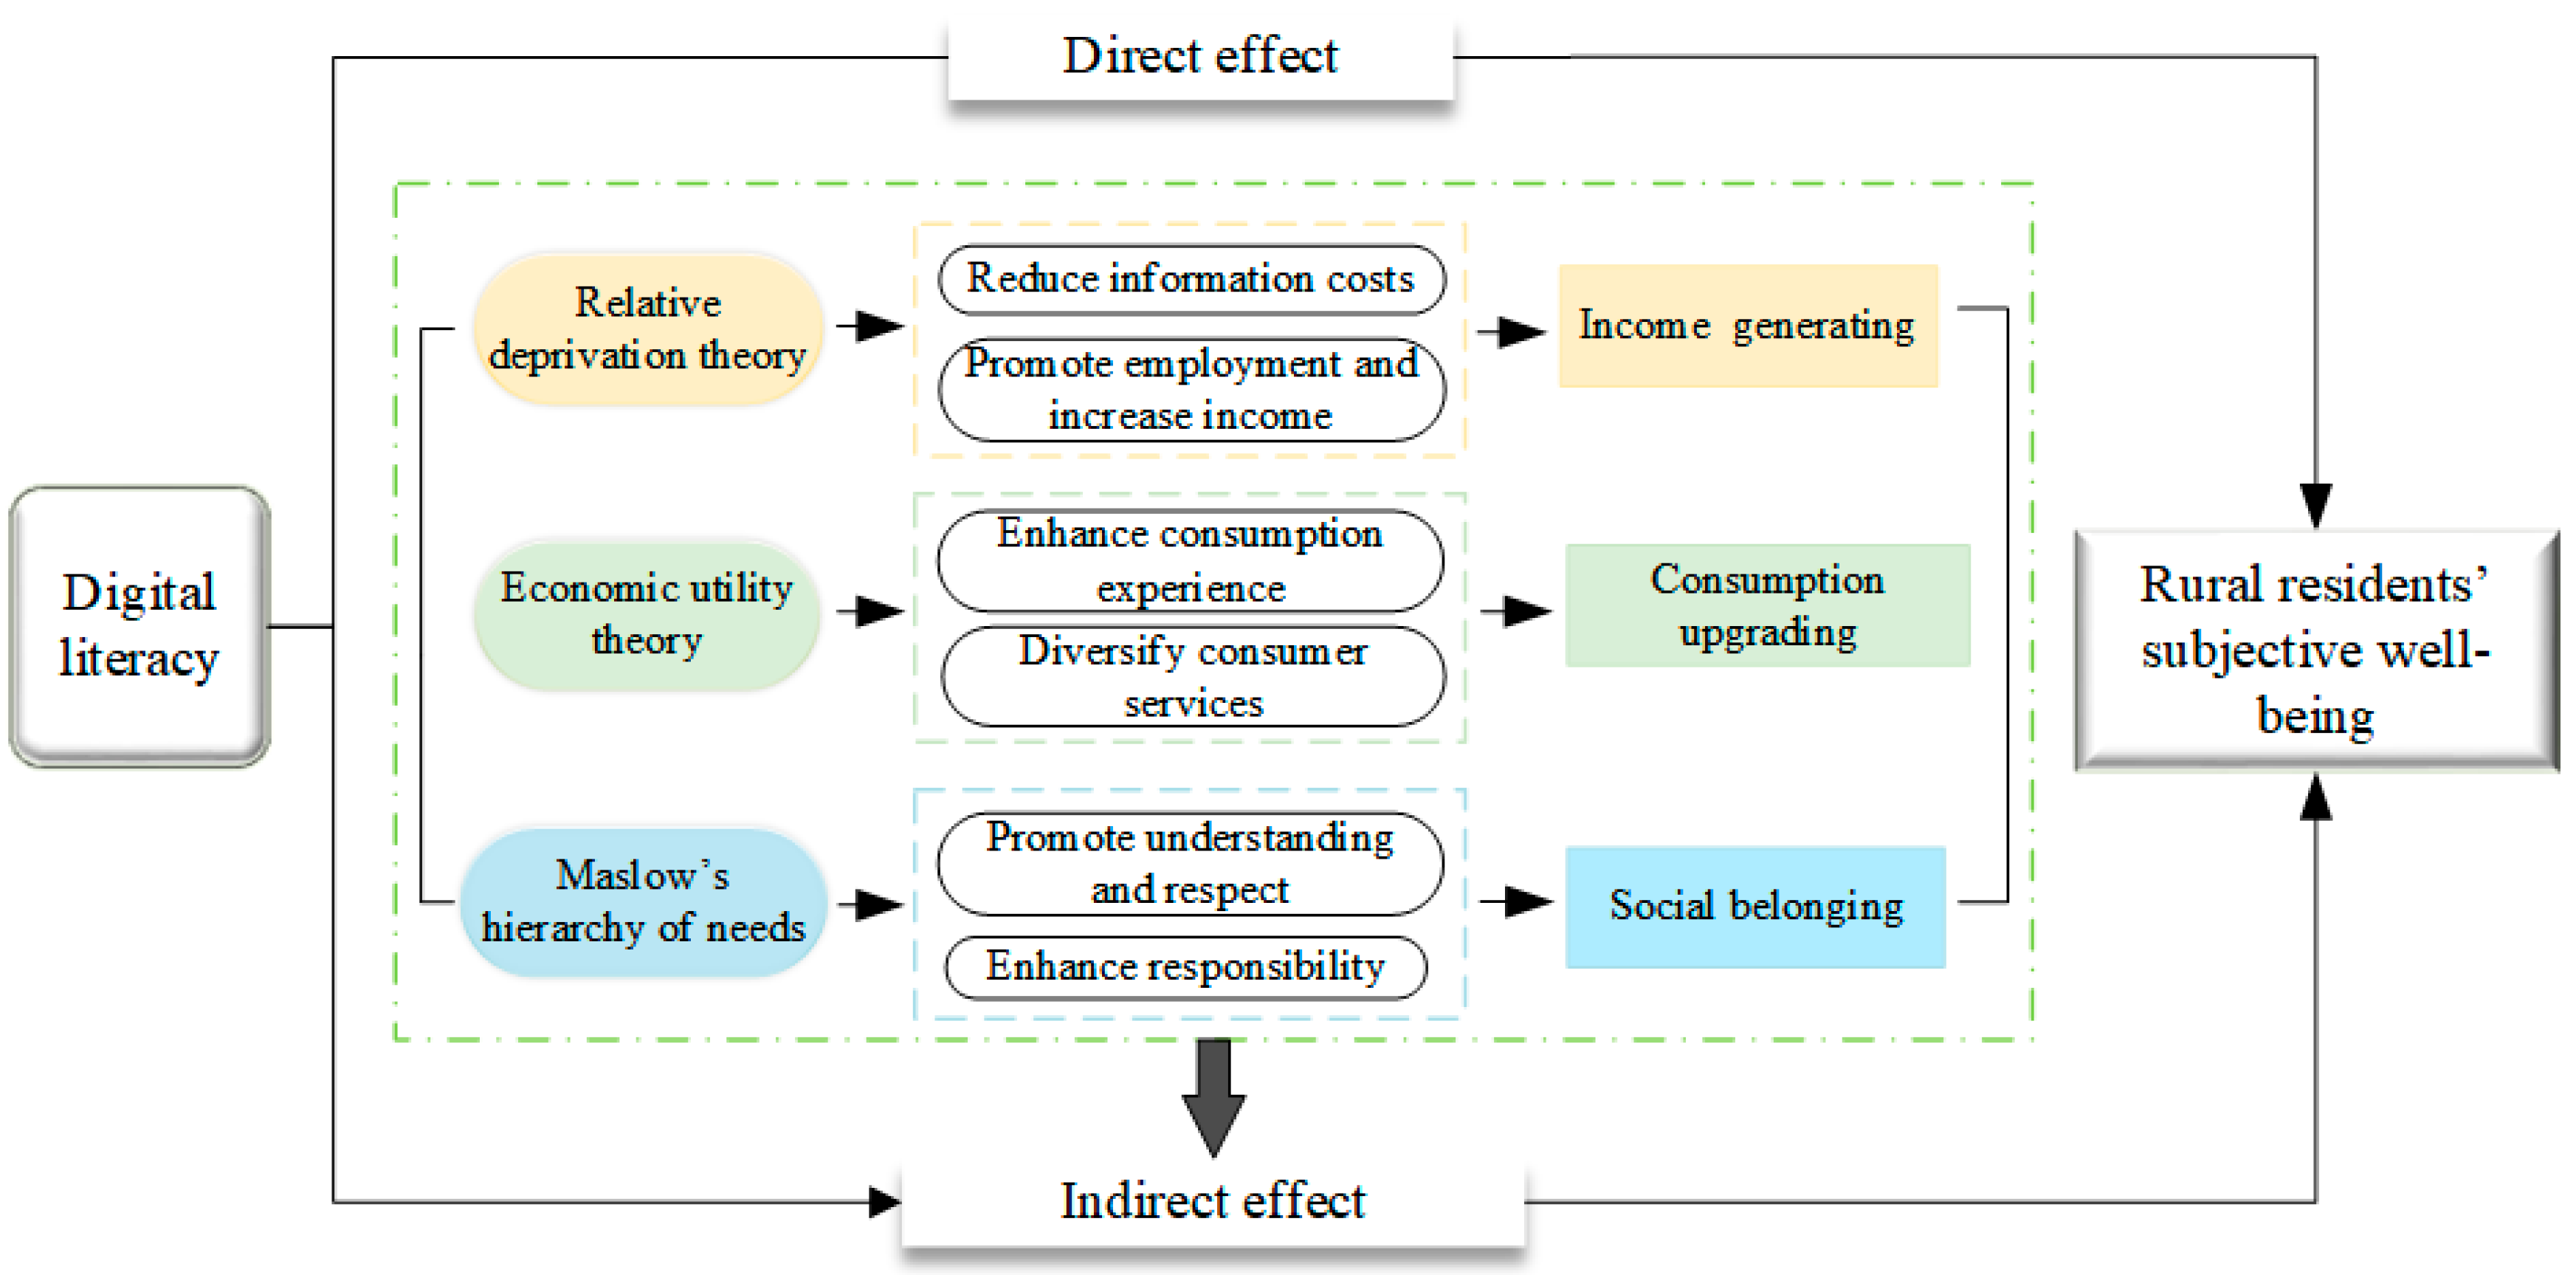
Figure 1 shows this study’s background and theoretical framework.
The structure of this paper is as follows. Section 2 introduces the theoretical and research hypothesis. Section 3 describes the research design. Section 4 presents the results of the empirical analysis. Section 5 provides the research conclusions and policy implications.

2. Theoretical Analysis and Research Hypotheses

The term “digital literacy” originally referred to the comprehensive ability to acquire, comprehend, and utilize information on the Internet [36]. Subsequently, scholars defined digital literacy as the integration of essential skills necessary for individuals to thrive in the evolving digital landscape, encompassing their capacity to effectively access and employ relevant information on online platforms [37]. This concept comprises two dimensions, the strategic aptitude to obtain valuable information and the cognitive ability to assimilate acquired knowledge [38], to achieve valuable outcomes such as education, employment, and social participation. Amartya Sen’s competency approach emphasizes that well-being depends not only on material possessions but also on capabilities that an individual can achieve. New technologies and tools in the field of information and communication have enhanced people’s subjective welfare levels [35,39]. The utilization of digital technology yields a network effect, expanding the scope of social connections and bolstering residents’ confidence in the future [40]. Additionally, it empowers individuals to enhance their efficiency in information retrieval and ability to acquire knowledge [41], thereby bolstering their capacity to exert control over their lives and fostering subjective well-being [32,42]. Currently, the integration of digital technology into individuals’ lives has led to higher levels of subjective well-being among residents who possess Internet-connected phones, computers, and other related devices [43,44]. Hence, we propose Hypothesis 1.
Hypothesis 1:
Elevating the digital literacy of rural residents will enhance their subjective well-being, that is, the digital literacy of rural residents has a “dividend” effect on the subjective well-being of residents.
Level of income plays a crucial role in determining residents’ life satisfaction [45,46]. By reducing the relative income gap, rural families can experience a decrease in the sense of relative deprivation, leading to an elevation in their overall quality of life [47]. Digital literacy helps to advance people’s consumption experience, facilitating the transformation of consumption structure [48]. Simultaneously, with the emergence of online social network platforms, the Internet offers opportunities to maintain existing relationships while establishing new social connections [49], thereby complementing the current social relationships.
Rural residents’ digital literacy influences their SWB by increasing income. According to the theory of relative deprivation, individuals may experience feelings of deprivation due to a lack of resources, which can result in a perceived disadvantage compared to others. This sense of deprivation poses challenges for individuals in maintaining their happiness within the social hierarchy to which they belong [50]. In contrast to urban areas, rural areas exhibit inherent vulnerabilities such as limited access to resources, an imperfect market structure, and a lower level of economic development. Disparities in human capital and income contribute to a sense of relative deprivation among rural communities, leading to a decline in subjective well-being. Digital technology has the potential to overcome barriers in disseminating market information [35], facilitate the circulation of commodities between urban and rural areas, enhance the market impact of agricultural products, and expand the reach of rural markets [51]. This is particularly beneficial for digitally literate rural residents who can leverage digital technology to increase their incomes. Moreover, digital platforms enable rural residents to access valuable resources, such as network knowledge, employment opportunities, and entrepreneurship prospects [52], enabling them to transition from agricultural occupations to non-agricultural ones [53]. In essence, digital literacy acts as a form of human capital that provides latecomer advantages for disadvantaged groups by narrowing the relative income gap and enhancing life satisfaction [54].
Rural residents’ digital literacy also influences SWB by upgrading consumption. Traditional economic theory posits that utility is derived from consumption, with the level and structure of consumption reflecting individual resource status and the implementation of economic and social rights [55]. Changes in consumption patterns significantly impact rural residents’ satisfaction levels [56]. Digital technology provides convenient online shopping platforms, diverse product choices, personalized services, and efficient logistics distribution systems. This facilitates the emergence of new consumption patterns and promotes the upgrading of residents’ consumption habits [35]. Simultaneously, big data analysis accurately identifies user needs, prompting businesses to continuously enhance product quality and service levels. This further caters to residents’ growing demand for personalized consumption while driving continuous optimization in the consumer market [48]. Digital literacy, through consumption upgrading, has a dual impact on residents’ subjective well-being: it enables an upgrade in residents’ consumption structure [57] while enhancing consumers’ subjective well-being through enriched materialistic, spiritual, and cultural experiences [34].
Furthermore, rural residents’ digital literacy influences their SWB by enhancing their sense of social belonging. Frequent social activity is commonly believed to be associated with higher levels of happiness [1]. The increasing popularity of communication technology and the Internet has facilitated the emergence of social platforms that have effectively eliminated temporal and spatial boundaries, enabling the elderly, disabled, and other marginalized groups to integrate into society, reducing social isolation and thereby enhancing human communication and social interaction [58], redounding understanding and respect, and promoting social harmony. Digital technology provides a platform for residents to participate in social and political issues, enhancing individuals’ sense of belonging and social responsibility. Maslow’s hierarchy of needs theory suggests that after fulfilling physiological and security needs, people experience an intensified desire for interpersonal communication. Engaging in communication on social networks facilitates obtaining greater recognition and support from others [59], reducing feelings of loneliness among residents and improving life satisfaction levels [60]. Based on the aforementioned analysis, we propose Hypothesis 2.
Hypothesis 2:
Rural residents’ digital literacy level influences subjective well-being through increasing income, upgrading consumption, and social belonging.
The integration of digital technology into various rural areas encompasses production, livelihood, ecology, and governance. While the application of digital technology has provided diverse opportunities for rural residents to benefit, there is an unequal distribution of these benefits in economic activities [61]. From a behaviorist perspective, individual differences in psychology or cognitive structure result in varying quality and mentality systems that influence the extent to which individuals integrate into the digital age. The digital divide theory places rural vulnerable groups in the context of digital literacy barriers, emphasizing differences in access to digital technologies, skills, and opportunities, which lead to differences in participation in and benefit from the digital economy, thus affecting the inequality of individuals’ digital dividends and happiness. Consequently, significant variations exist in SWB among different groups. At a societal level, regional factors, individual preferences, and cultural disparities also impact residents’ subjective well-being [39,62]. The difference in digital literacy among different characteristics of rural residents results in heterogeneity in improving subjective well-being. Therefore, we propose Hypothesis 3.
Hypothesis 3:
The impact of digital literacy on the subjective well-being of rural residents varies across natural and social attributes. In other words, there exist differences in digital literacy on the subjective well-being of rural residents.

3. Research Design

3.1. Empirical Model

The range of subjective well-being [0,10] is a discrete ordered variable. The Ordered Probit (OProbit) model is a statistical model specially used to deal with ordered dependent variables, such as satisfaction evaluation and grade division. Therefore, the OProbit model is adopted to verify the impact of rural residents’ digital literacy on subjective well-being, as follows:
S W B i t = α 0 + α 1 d i g l i t i t + k = 1 n C o n t r o l s k i t γ k + λ i + μ t + ε i t  
where S W B i t represents the subjective well-being of rural family members i in year t, and d i g l i t i t represents the digital literacy of rural family members i in year t, which is obtained through the principal component analysis of digital ability in different dimensions. C o n t r o l s k i t includes other rural residents’ individual and family characteristics, such as age, gender, education level, and family size, and ε i t represents the random error term. In addition, fixed effects could control heterogeneity at the individual level over time, thereby reducing omitted variable bias, and the county fixed effect ( λ i ) and yearly fixed effect ( μ t ) are controlled in the model.
The hierarchical regression analysis of [63] is used to verify the influence path of rural residents’ digital literacy level on subjective well-being in three steps. The mechanism test model is expressed as follows:
M e d i a t e i = β 0 + β 1 d i g l i t i t + k = 1 n C o n t r o l s k i t γ k + λ i + μ t + ε i t  
S W B i t = γ 0 + γ 1 d i g l i t i t + γ 2 M e d i a t e i + k = 1 n C o n t r o l s k i t γ k + λ i + μ t + ε i t
In Equations (2) and (3), M e d i a t e i represents the intermediary variable that rural residents’ digital literacy influences subjective well-being, and the meanings of the other variables are the same as that of Equation (1), where α 1 is the total utility of rural residents’ digital literacy to improve their subjective well-being, γ 1 is the direct utility, and γ 2 is the indirect effect. If the coefficient β 1 of the M e d i a t e i coefficient in Equation (2) and coefficient γ 2 of the M e d i a t e i coefficient in Equation (3) are both significant, then the influence mechanism exists.

3.2. Variable Definitions

The dependent variable is the subjective well-being of rural residents, which was measured using a self-rated subjective happiness level, building upon previous research conducted by ref. [47]. The CFPS database asks each respondent “How happy are you (on a range of scores from 0 to 10)”, with 0 being the lowest and 10 being the highest.
The independent variable is the digital literacy of rural residents. According to the aforementioned definition of digital literacy, it pertains to an individual’s proficiency in effectively utilizing digital tools and equipment, leveraging digital resources, acquiring new knowledge, and engaging in social communication with others. Hence, we assess the level of digital literacy among rural residents across six dimensions: Internet accessibility, digital education, online work, social interaction in the digital realm, digital entertainment, and engagement in e-commerce activities. First, respondents’ Internet accessibility is assessed based on their utilization of devices such as computers or mobile phones for Internet access, where a value of 0 is assigned if the answer is negative. Second, individuals’ digital literacy is evaluated in alignment with various realization scenarios that demonstrate their adeptness in utilizing digital technology. Their perception of the significance of different functions of digital technology serves as a reflection of their digital literacy level, including digital education, online work, social interaction in the digital realm, digital entertainment, and engagement in e-commerce activities. The importance assigned to these digital functions ranges from 0 to 5. The above six indicators were processed by principal component analysis, and the results show that the Kaiser–Meyer–Olkin value was approximately 0.942 and the p-value of Bartlett’s test was 0.000, which indicated that there was a good correlation between the dimensions and the test was valid.
We control for various variables that may influence subjective well-being, encompassing individual-level, family-related, and regional factors such as age, gender, marital status, health condition, educational attainment, population size, and geographic location.
We use the per capita income of rural residents, cultural consumption accounts for the proportion of total consumption, and self-evaluation relationships of rural residents as the mediating variables for the impact of digital literacy on rural residents’ subjective well-being, and corresponding values are assigned. The relative income has a significant influence on subjective well-being [46]. The advent of the Internet has facilitated the emergence of novel products and services, offering a plethora of diverse digital consumption methods. Concurrently, research studies have demonstrated that consumption exerts a positive influence on individual happiness [34]. According to the relevant research findings, frequent engagement in social activities is generally believed to be positively associated with a heightened sense of well-being [1]. Based on the aforementioned analysis, we select income generating, consumption upgrading, and social belonging as the mediating variables. The assignment of all variables is shown in Table 1.

3.3. Descriptive Statistics

We examined the correlation between digital literacy and subjective well-being among rural residents. According to the data of 2014, 2016, 2018, and 2020 in the China Family Panel Studies Database (CFPS), we constructed a digital literacy index. The CFPS is a household tracking survey conducted by the China Social Science Survey Center of Peking University, which carries out the survey biennially, and the sample covers 25 provinces/municipalities/autonomous regions with a target sample size of 16,000 households. The utilization of a sampling method with extensive coverage ensures the representativeness of the samples. In terms of survey content, the database encompasses comprehensive and systematic individual and household economic information, enabling a thorough depiction of micro-subjects’ characteristics and providing a robust data foundation for research purposes. After matching the four periods’ data, we chose rural samples, eliminated the samples with missing data, and then assigned values to the variables, finally obtaining the relevant data of 16,303 effectively surveyed rural residents. The descriptive statistics of all variables are displayed in Table 2.

4. Analysis of Results

4.1. Ordinal Regression Results

The rural residents’ SWB is selected as the dependent variable, and the digital literacy of rural residents is introduced as the core explanatory variable. The regression results are displayed in Table 3. Among them, columns (1), (3), and (5) do not include the individual and year as fixed effects, while columns (2), (4), and (6) do. In columns (1) and (2), only the digital literacy of rural residents was included as an explanatory variable. In order to alleviate the estimation bias caused by missing variables, the personal characteristic variables of the household head were added to columns (3) and (4), and the individual, family, and regional characteristic variables were added to columns (5) and (6) for regression. The regression results reveal a significant positive relationship between digital literacy and subjective well-being among rural residents, as evidenced by the statistically significant coefficients in columns (1) to (6). The final ordinal variable regression result, represented by column (6), reveals a significant coefficient of 0.048 for d i g l i t , indicating that for every 1% improvement in digital literacy, the subjective well-being of rural residents increases by 0.048% at a statistically significant level.
From the perspective of control variables, the impact of most variables on the subjective well-being of rural residents aligns closely with the existing literature. The influence of rural residents’ education level on subjective well-being is negatively correlated. Individuals with higher levels of education generally hold higher expectations for themselves. When they fail to meet these expectations, individuals may experience self-doubt which can have a detrimental impact on their subjective well-being. The rural residents’ subjective well-being tends to increase with age due to the abundance of time and financial resources available after retirement, as well as reduced social pressures related to employment and housing compared to younger and middle-aged groups. Men tend to report lower levels of well-being compared to women due to the excessive pressures they face in work, life, and society under traditional Chinese gender roles. Health status significantly influences residents’ well-being, with those in good health tending to have higher life satisfaction among rural populations. Residents who are not single demonstrate a stronger pursuit of a happy life and often experience greater happiness compared to those who are single. Residents’ job satisfaction and confidence in their future prospects positively contribute towards their overall well-being level, and increased satisfaction at work and optimism about the future lead to more pronounced subjective well-being among residents. Participating in medical insurance significantly enhances residents’ well-being, primarily because it promotes social equity and fosters a sense of security among people. The expenditure on favors and gifts reflects the interpersonal relationship with the surrounding groups, thus positively affecting their well-being.
Residents with larger families or those living in the eastern region exhibit higher levels of subjective well-being. The size of the family positively correlates with the strength of residents’ social networks and their subjective well-being. Moreover, the eastern region has a relatively high level of social development and strong economic strength, and thus, rural residents experience greater well-being due to superior welfare benefits [64], a more robust social insurance system, and better government governance mechanisms compared to those in the central and western regions. Based on the sample data, the per capita income of rural residents in the eastern region was RMB 18,949 yuan, which is 1.25 times and 1.5 times that of the central and western regions. The per capita consumption of rural residents was RMB 13,619 yuan, which is 1.19 times and 1.29 times of the central and western regions, respectively. Additionally, the higher level of economic development in the eastern region enables residents to access more knowledge and information. The average expenditures for culture, education, and entertainment for rural residents in the eastern region was RMB 4775 yuan, while the consumption in the central and western regions was RMB 4676 yuan and RMB 3882 yuan, respectively, leading to increased satisfaction and a sense of gain among rural inhabitants.

4.2. Endogeneity Test

This study mainly focuses on the impact of digital literacy on subjective well-being, but it should be noted that there may be reverse causality between the two. Individuals with higher subjective well-being may also have stronger learning motivation and exploration tendency to improve digital literacy, thus generating endogenous problems. Combined with the existing literature [1], this study considered using the DDML model, instrumental variable method, DID, PSM, and other methods to solve the potential endogenous problems.

4.2.1. Double/Debiased Machine Learning (DDML)

In order to make up for the shortcomings of traditional models, some scholars have begun to pay attention to the application of machine learning in the field of causal inference [65], of which dual machine learning is a typical representative. We have considered the influencing factors of the subjective well-being of rural residents as far as possible. Due to limitations in the data, there are inevitably missing variables, and the regression analysis may face problems of endogeneity, which can be effectively alleviated by the method of instrumental variables. Accordingly, we use a partial linear instrumental variable model of double/debiased machine learning, alleviating the endogeneity problem in regression. The result in column (1) of Table 4 reveals that digital literacy positively influences rural residents’ subjective well-being at the 1% significance level.

4.2.2. Instrumental Variable Method

The concept of digital literacy refers to an individual’s proficiency in utilizing digital technology, and in the process of causal identification, we may encounter inherent issues due to the omission of certain influencing factors or measurement errors in the data. Given the challenges associated with directly employing instrumental variables in estimating OProbit models, we employ the two-stage least squares method to address these endogenous concerns by selecting communication costs related to rural household post and telecommunications networks as instrumental variables for parameter estimation. Rural household posts and telecommunications expenses exhibit a strong correlation with digital literacy while having a limited direct impact on residents’ happiness, thus satisfying the selection criteria for instrumental variables.
Columns (2) and (3) in Table 4 show the regression results of the instrumental variable method. The regression results of the first stage are shown in column (2). The level of digital literacy among rural residents shows a significant positive correlation with the cost of post and telecommunications network communication in rural households, which serves as an instrumental variable at a statistical significance level of 1%. Further analysis reveals that the F-statistic in the first stage exceeds 10, indicating its robust explanatory power for rural residents’ digital literacy. There is no evidence suggesting a weak instrumental variable problem. Therefore, selecting the cost of post and telecommunications network communication in rural households as an instrumental variable to measure digital literacy is appropriate. The regression results from column (3) in the second stage reaffirm our research findings that the coefficient for digital literacy levels exhibits a significant positive effect at a statistical level of 10%. The enhancement of rural residents’ well-being by 0.338% is directly associated with a 1% increase in their digital literacy, highlighting the significant contribution that advancements in digital literacy can make to subjective well-being, with these conclusions remaining robust.

4.2.3. Difference-in-Differences Method

“Broadband Village” is a pilot project proposed by China in 2014, which aims to narrow the digital divide among vulnerable groups and promote rural economic development and social progress by upgrading broadband network infrastructure in rural areas. To assess the impact of digital literacy on subjective well-being, we used the difference-in-difference method (DID) as a regression method for robustness tests, which effectively control the impact of time trends and other potential confounding factors by comparing changes in the experimental group (the “broadband rural” pilot area) and the control group (the area without the policy) before and after the implementation of the policy, so as to identify the impact more accurately. The results are shown in Table 4. The “broadband rural” policy has a significant positive impact on the subjective well-being of rural residents, which verifies the robustness of the baseline regression results.

4.2.4. Propensity Score Matching (PSM)

We use propensity score matching (PSM) to further estimate the endogenous relationship between digital literacy and subjective well-being. Figure 2 reveals that the deviation of the standardized mean of all matching variables is less than 50%, and the results after matching are significantly smaller than the standard deviation before matching. Additionally, Figure 3 shows that the vast majority of the samples in the experimental group and the control group are within a common value range. This indicates to an extent that there is no systematic deviation in the process of matching variables, which meets the requirements of balance tests. These results indicate that digital literacy still has an explanatory effect on the improvement of rural residents’ happiness when sample selection bias is taken into account, further supporting the robustness of the results.
Figure 4 and Figure 5 report the kernel density curves of PSM, a method that could visually compare the distribution of the treatment group and the control group before and after matching. From the two figures, the deviation between the two kernel density curves before matching is relatively large, and the distance between the mean lines after matching is reduced, so that the two curves are closer to each other and the deviation is reduced. The results of the OProbit regression are proven to be reliable.

4.3. Robustness Tests

4.3.1. Replacement with the Ordered Logit Model

Considering the potential bias in the model setup, we replaced the OProbit regression model with the ordered logit model and repeated the regression analysis. The findings are presented in column (1) of Table 5. The impact of digital literacy level among rural residents on subjective well-being is significantly positive at the 1% statistical significance level. With every 1% increase in digital literacy among rural residents, there is a corresponding increase of 0.076% in the subjective well-being levels. These results align with the previous baseline regression findings.

4.3.2. Change the Core Argument’s Calculation

In order to mitigate estimation bias resulting from variable selection, we change the calculation method of the digital literacy index in the above content and substitute the average of six indicators for the principal component analysis results; the symbol of the variable is ASWB. We adopted the Pearson correlation coefficient method, and the result shows that the estimation coefficients of the two methods have a high consistency, that is, no matter which method is used to calculate the digital literacy index, its core content remains relatively stable, which can verify the robustness of our results. As evidenced in column (2) of Table 5, rural residents’ digital literacy exhibits a significant positive impact on subjective well-being at the 1% significance level. With every 1% increase in rural residents’ digital literacy level, their subjective well-being increases by 0.069%. These findings indicate that despite altering the calculation method for research variables, the influence of rural residents’ digital literacy on subjective well-being remains significant and aligns with previous estimations.

4.3.3. Random Sampling Simulation

This paper employs a random selection method to choose 60% of the overall sample, subsequently recalculating the digital literacy levels of rural residents. Subsequently, it examines the impact of these digital literacy levels on subjective well-being. As indicated in column (3) of Table 5, there is a statistically significant positive relationship between rural residents’ digital literacy and subjective well-being at the 1% significance level. Specifically, for every 1% increase in rural residents’ digital literacy level, there is an associated increase of 0.042% in subjective well-being. These findings are consistent with the aforementioned regression results.

4.4. Mechanism Test

It has been demonstrated that enhancing the digital literacy of rural residents can effectively promote subjective well-being. It is crucial to understand the mechanisms through which digital literacy impacts the subjective well-being of rural residents. With the widespread implementation of digital village construction and network infrastructure, the Internet exerts a profound influence on individuals’ behavior and emotions. In terms of rural communities, leveraging digital technology can enhance their financial management capabilities, employment skills, and information-gathering abilities, thereby generating income and improving overall literacy levels. This enables them to fully enjoy the benefits offered by the digital age while satisfying diverse consumer demands and facilitating consumption structure upgrades. Additionally, digital technology provides various dating platforms that foster communication among residents, which meet residents’ spiritual needs. We explore whether digital literacy enhances subjective well-being among rural residents through its effects on increasing income levels, upgrading consumption structures, and fostering social belonging in order to emphasize its impact on overall digital well-being. Figure 6 displays the mechanism through which digital literacy influences rural residents’ subjective well-being.

4.4.1. Income Generating

Relative income exerts a substantial influence on individuals’ well-being [45,46]. The results of the regression analysis are presented in columns (1) and (2) of Table 6. Column (1) indicates that digital literacy has a significant positive impact on the per capita income of rural residents. Further examination of column (2) reveals that after controlling for per capita income as an intermediary variable, the coefficient estimate for digital literacy’s effect on subjective well-being decreases. This suggests that improving digital literacy can boost rural residents’ income levels, amplify the economic benefits derived from internet use, and ultimately improve life satisfaction and overall well-being. Digital literacy also helps low-income groups integrate into markets more effectively [66], participate more fully in digital production and daily life activities, narrow gaps in income inequality between different social groups, and alleviate feelings of relative deprivation among individuals [47,67], thereby significantly enhancing subjective well-being.

4.4.2. Consumption Upgrading

Digital technology continues to exert significant influence in various domains such as lifestyle consumption, transportation, education, healthcare, cultural tourism, etc., optimizing and upgrading residents’ consumption patterns [26]. The corresponding regression results are shown in columns (3) and (4) of Table 6. The results in column (3) demonstrate a clear impact of digital literacy on the consumption structure. Furthermore, the findings in column (4) indicate that even after incorporating cultural consumption as an intermediary variable, the positive influence of digital literacy on the subjective well-being of rural residents remains significant. This suggests that digital literacy affects residents’ subjective well-being through consumption upgrading. Digital technology provides rural residents with diverse, convenient, and efficient channels for accessing digital services, which promotes a shift towards more substantial consumption from the supply side [19,48]. As the level of digital literacy among rural residents continues to strengthen, their consumption preferences gradually transition from subsistence-oriented to development-focused and enjoyment-driven choices. Consequently, this optimization in consumption structure contributes to an overall increase in happiness among rural residents.

4.4.3. Social Belonging

According to Maslow’s hierarchy of needs theory, human needs are categorized into five layers: physiological, safety, social, esteem, and self-actualization. Digital technology facilitates social interaction and participation and expands social networks, thereby enabling access to more social support. This ultimately enhances rural residents’ sense of belonging within society while meeting their requirements for social recognition and personal growth. The regression results are presented in columns (5) and (6) of Table 6. Column (5) demonstrates a significant expansion of social belonging due to digital literacy. In column (6), the inclusion of rural residents’ rating of personal relationships as an intermediary variable reveals that the impact of digital literacy on subjective well-being remains significantly positive, indicating that social belonging serves as the mechanism through which digital literacy affects subjective well-being among rural residents. Leveraging digital technology not only facilitates communication with existing acquaintances but also fosters new connections, providing novel avenues for perceiving social support; improving access to familial, friendship, and neighborly support systems [22,59]; and compensating for resource deficiencies [68], thus enhancing their sense of social belonging. Consequently, it contributes to enhancing rural residents’ subjective well-being.

4.5. Heterogeneity Analysis

There exists a digital divide among distinct demographic groups [59]. We investigate the heterogeneity of characteristic variables, including natural and social attributes, in order to elucidate the structural disparities in the impact of digital literacy on subjective well-being among rural residents. Natural attributes include age, gender, and education attainment, in which age classification follows the groupings outlined by the United Nations World Health Organization, that is, young individuals are considered as those under 44 years old while middle-aged or elderly individuals are those who are over 45 years old. Gender differentiation encompasses males and females. Education level is stratified into primary school or below, junior high school or secondary school education levels, and junior college or higher education levels. Meanwhile, as for social attributes, the region is geographically divided into the eastern, central, and western areas, while the social network is divided into strong and weak.

4.5.1. Heterogeneity of Gender

Heterogeneity was first examined by gender, and the findings are presented in columns (1) and (2) of Table 7. Digital literacy significantly enhances the subjective well-being of both genders. Further investigation indicates that digital literacy has a stronger impact on the subjective well-being of men than women. Women tend to have a more positive assessment of happiness determinants, are more open to expressing emotions, and have generally higher levels of happiness compared to men [69]; thus, digital literacy has a relatively modest effect on promoting subjective well-being. In accordance with traditional Chinese gender roles and societal expectations, men face greater pressures from work, life, and society, which contributes to lower levels of subjective well-being [68,70]. On the other hand, enhancing men’s digital literacy has a stronger multiplier effect on subjective well-being than that of women. The diverse range of products and services offered by digital technology is beneficial for personal career development and increasing work motivation, enabling men to become important participants or leaders in flexible employment, reduce social pressure, and realize their self-worth. In conclusion, the impact of digital literacy on the subjective well-being of rural residents is more pronounced in the male group.

4.5.2. Heterogeneity of Age

The existing literature has extensively examined the factors influencing subjective well-being across different age groups [71], yet has paid relatively little attention to the distinct impact of digital literacy on the subjective well-being of young, middle-aged, and elderly individuals. The positive impact of digital literacy on the subjective well-being of young, middle-aged, and elderly individuals is evident in columns (3) and (4) of Table 7. For these age groups, the utilization of digital skills not only enhances convenience in daily life but also strengthens social interactions and fosters social support [59], ultimately leading to increased subjective well-being. Digital technology may pose potential challenges for the middle-aged and elderly populations. Due to their own limitations, middle-aged and elderly individuals have a low degree of participation in digital life and a weak ability to use digital services [72]. As a group excluded by digital technology, middle-aged and elderly people face the issue of the digital divide, resulting in a sense of deprivation that leads to limited effects of digital literacy on the promotion of subjective well-being. For the younger demographic, their life status is closely intertwined with digital technology, making it easier for them to frequently engage with various digital devices such as mobile payments, online shopping, knowledge payments, and other diversified digital functions. Consequently, possessing digital literacy enables younger individuals to effectively integrate into the digital environment in order to improve subjective well-being.

4.5.3. Heterogeneity of Educational Attainment

The education level is categorized into three tiers in our study, and the regression results are presented in columns (5) to (7) of Table 7. The dividend effect of digital literacy is more pronounced among individuals with junior high school education or below and technical secondary school education or below compared to those with higher educational attainment. Firstly, individuals with lower levels of education face increased societal, employment, and housing pressures, resulting in higher costs for accessing information and opportunities. Digital technology promotes inclusivity by reducing the asymmetry of information exchange and enhancing information availability [35]. This ultimately alleviates living expenses and potential pressures while significantly improving their quality of life and subjective well-being. Secondly, as both education and digital literacy contribute to human capital accumulation with diminishing marginal returns, a higher level of education may have a crowding-out effect on the subjective well-being of residents who benefit from digital literacy [55]. The positive impact of digital literacy on subjective well-being is particularly pronounced among individuals with relatively lower levels of education.

4.5.4. Heterogeneity of Social Network

Digital technology has expanded the methods by which people establish and maintain social relationships, allowing for social relational networks to form and grow at a wider scale. We divide rural residents into two groups with strong and weak relationships. The results in Table 8 support the view that digital literacy has a significant impact on rural residents’ subjective well-being for both groups. In line with the theory of social capital [73], a social network is one manifestation of social capital, and its expansion contributes to the augmentation of societal capital, improving overall efficiency, quality of life, and well-being. Further analysis found that the influence of digital literacy on subjective well-being is more apparent in the strongly connected group. Digital technology establishes new social connections while maintaining face-to-face communication relationships [49]. Digital interaction channels enable individuals to expand their limited social networks into the digital realm, while strong relationship groups have broader social networks, which can be efficiently maintained and strengthened with digital technology.

4.5.5. Heterogeneity of Region

Given the varying levels of economic development across different regions, the influence of rural residents’ digital literacy on subjective well-being is likely to differ. We divide the regions into eastern, middle, and western in order to examine the regional disparities in the relationship between rural residents’ digital literacy and subjective well-being. The results are presented in columns (5) to (7) of Table 8. The impact of digital literacy among rural residents on subjective well-being is significantly positive, and the digital benefits derived from enhancing digital literacy are greater in the central and western regions compared to those in the eastern region. The enhancement of digital literacy has a limited impact on rural communities in the eastern region because the residents in developed areas have already acquired high-quality information, social resources, and greater economic welfare [39,64]. The residents in underdeveloped areas can compensate for their lack of digital resources and information by mastering digital skills, reducing the cost of information acquisition [35], narrowing the welfare gap with residents in developed areas, and bridging the digital divide between developed and underdeveloped regions. Therefore, the influence of digital literacy among rural residents on subjective well-being is more pronounced in central and western regions.

5. Conclusions and Policy Implications

5.1. Research Conclusions

According to the availability and timeliness of data, we select the CFPS data from 2014, 2016, 2018, and 2020 to investigate the impact of digital literacy on subjective well-being among rural residents in China. The findings suggest that enhancing digital literacy among rural residents can significantly improve subjective well-being as well as their sense of gain and security. The main conclusions resulting from this study are summarized as follows.
First, by controlling for a series of variables, we construct a fixed-effect regression model and reveal that an increase of 1% in rural residents’ digital literacy leads to a significant positive effect on their subjective well-being, with an increment of 0.048% at a statistically significant level. This finding highlights the remarkable “dividend effect” of rural residents’ digital literacy on their subjective well-being. The conclusion validates the findings of the existing literature. For instance, digital technology enhances individuals’ efficiency in gathering information resources, thereby facilitating optimal decision-making and improving their well-being [74]. The “network gain effect” further amplifies the positive impact of Internet usage on residents’ well-being levels [32], while some scholars have pointed out that excessive use of digital networks reduces humans’ interest in participating in social activities, increases their loneliness, and exacerbates the digital divide [75].
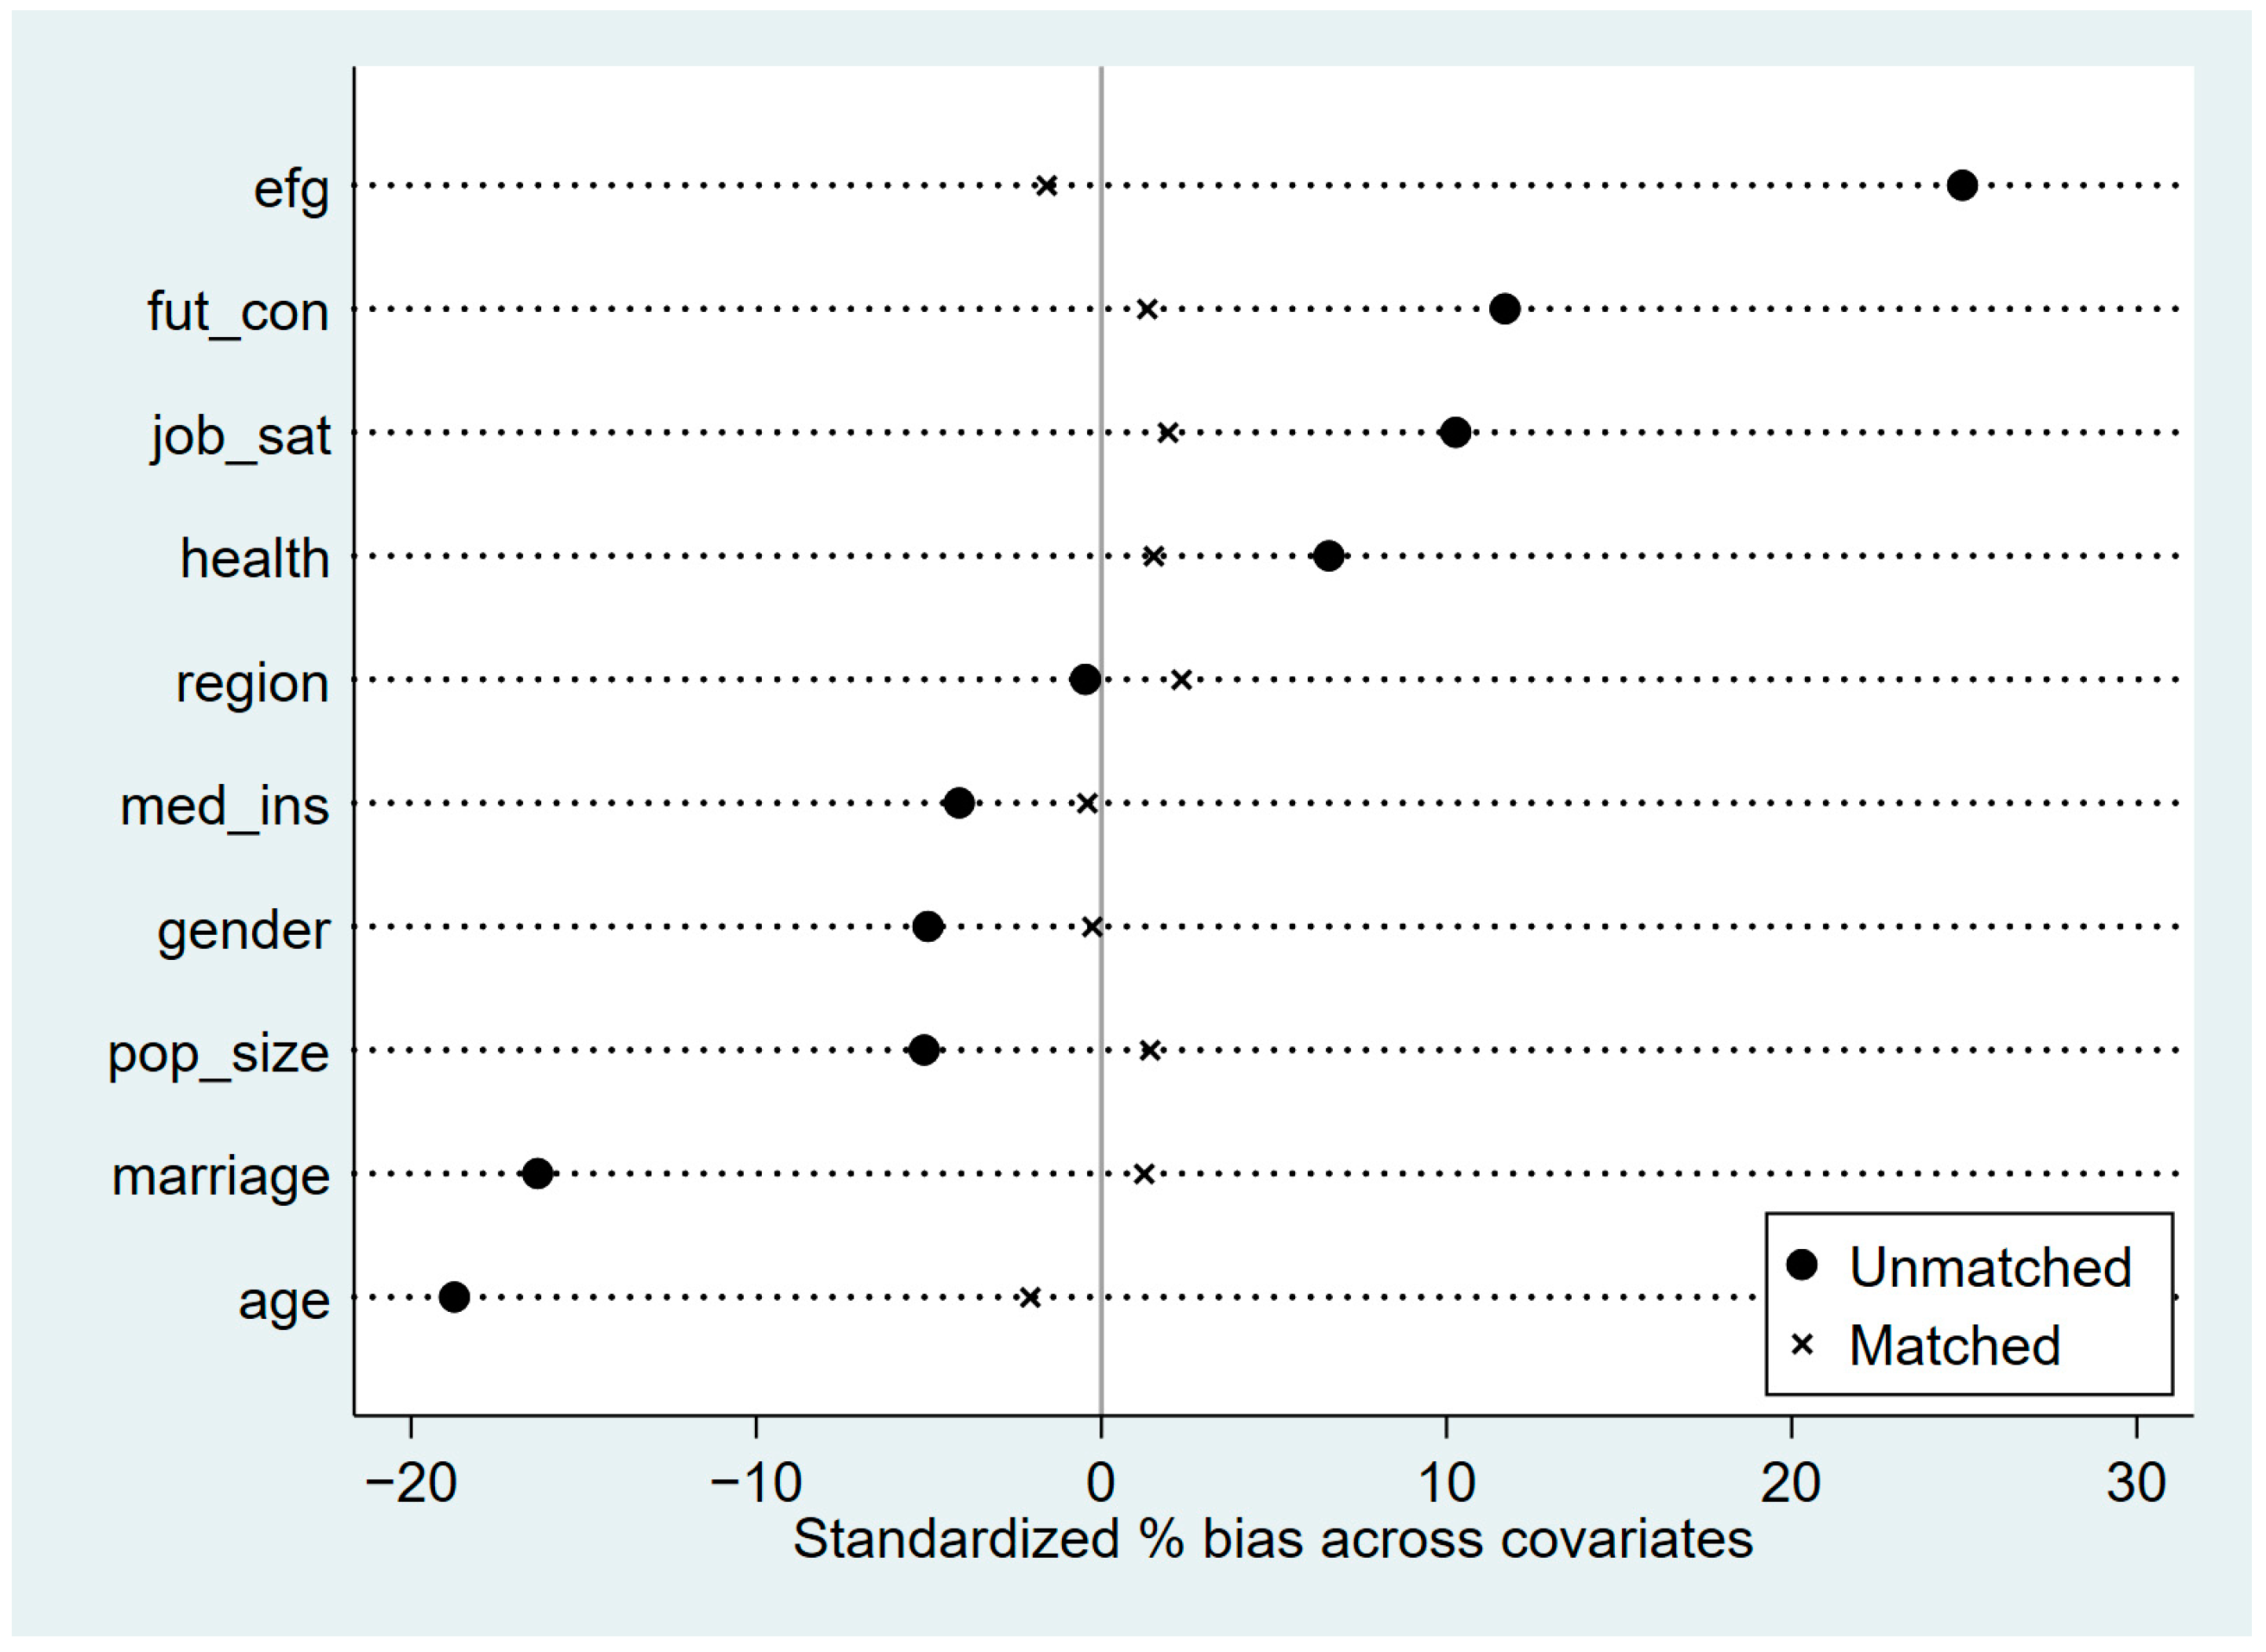
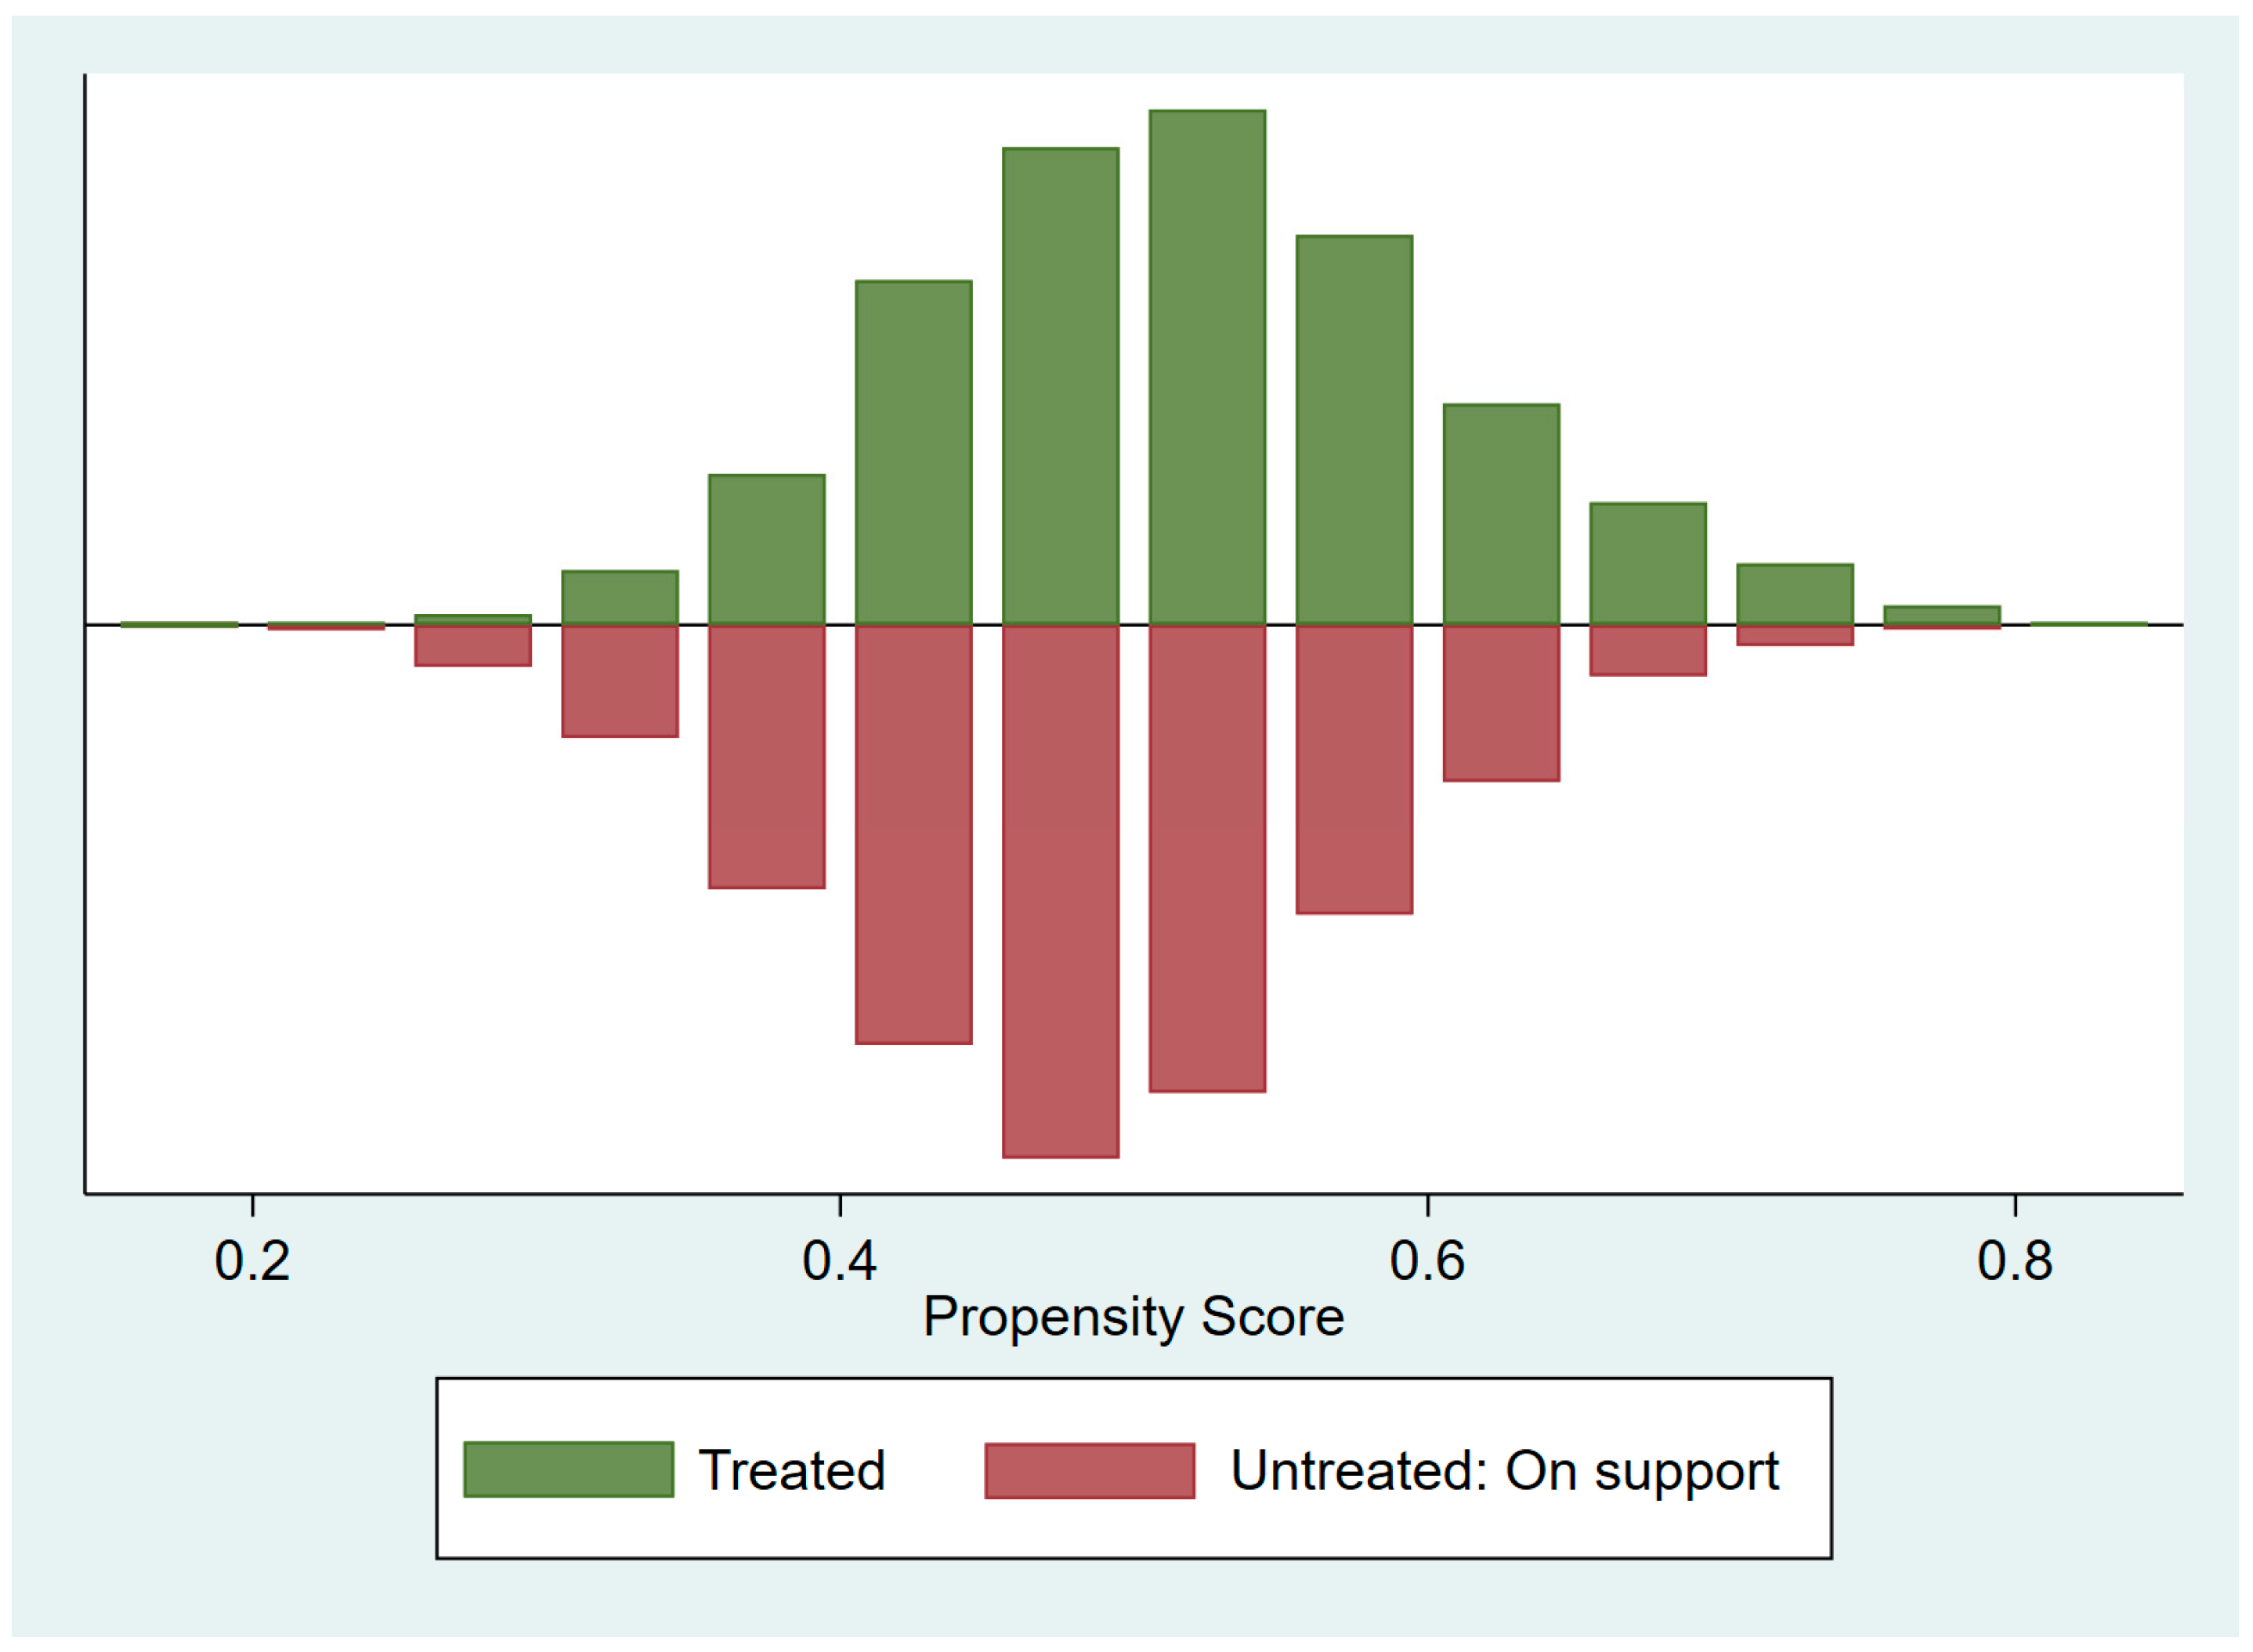
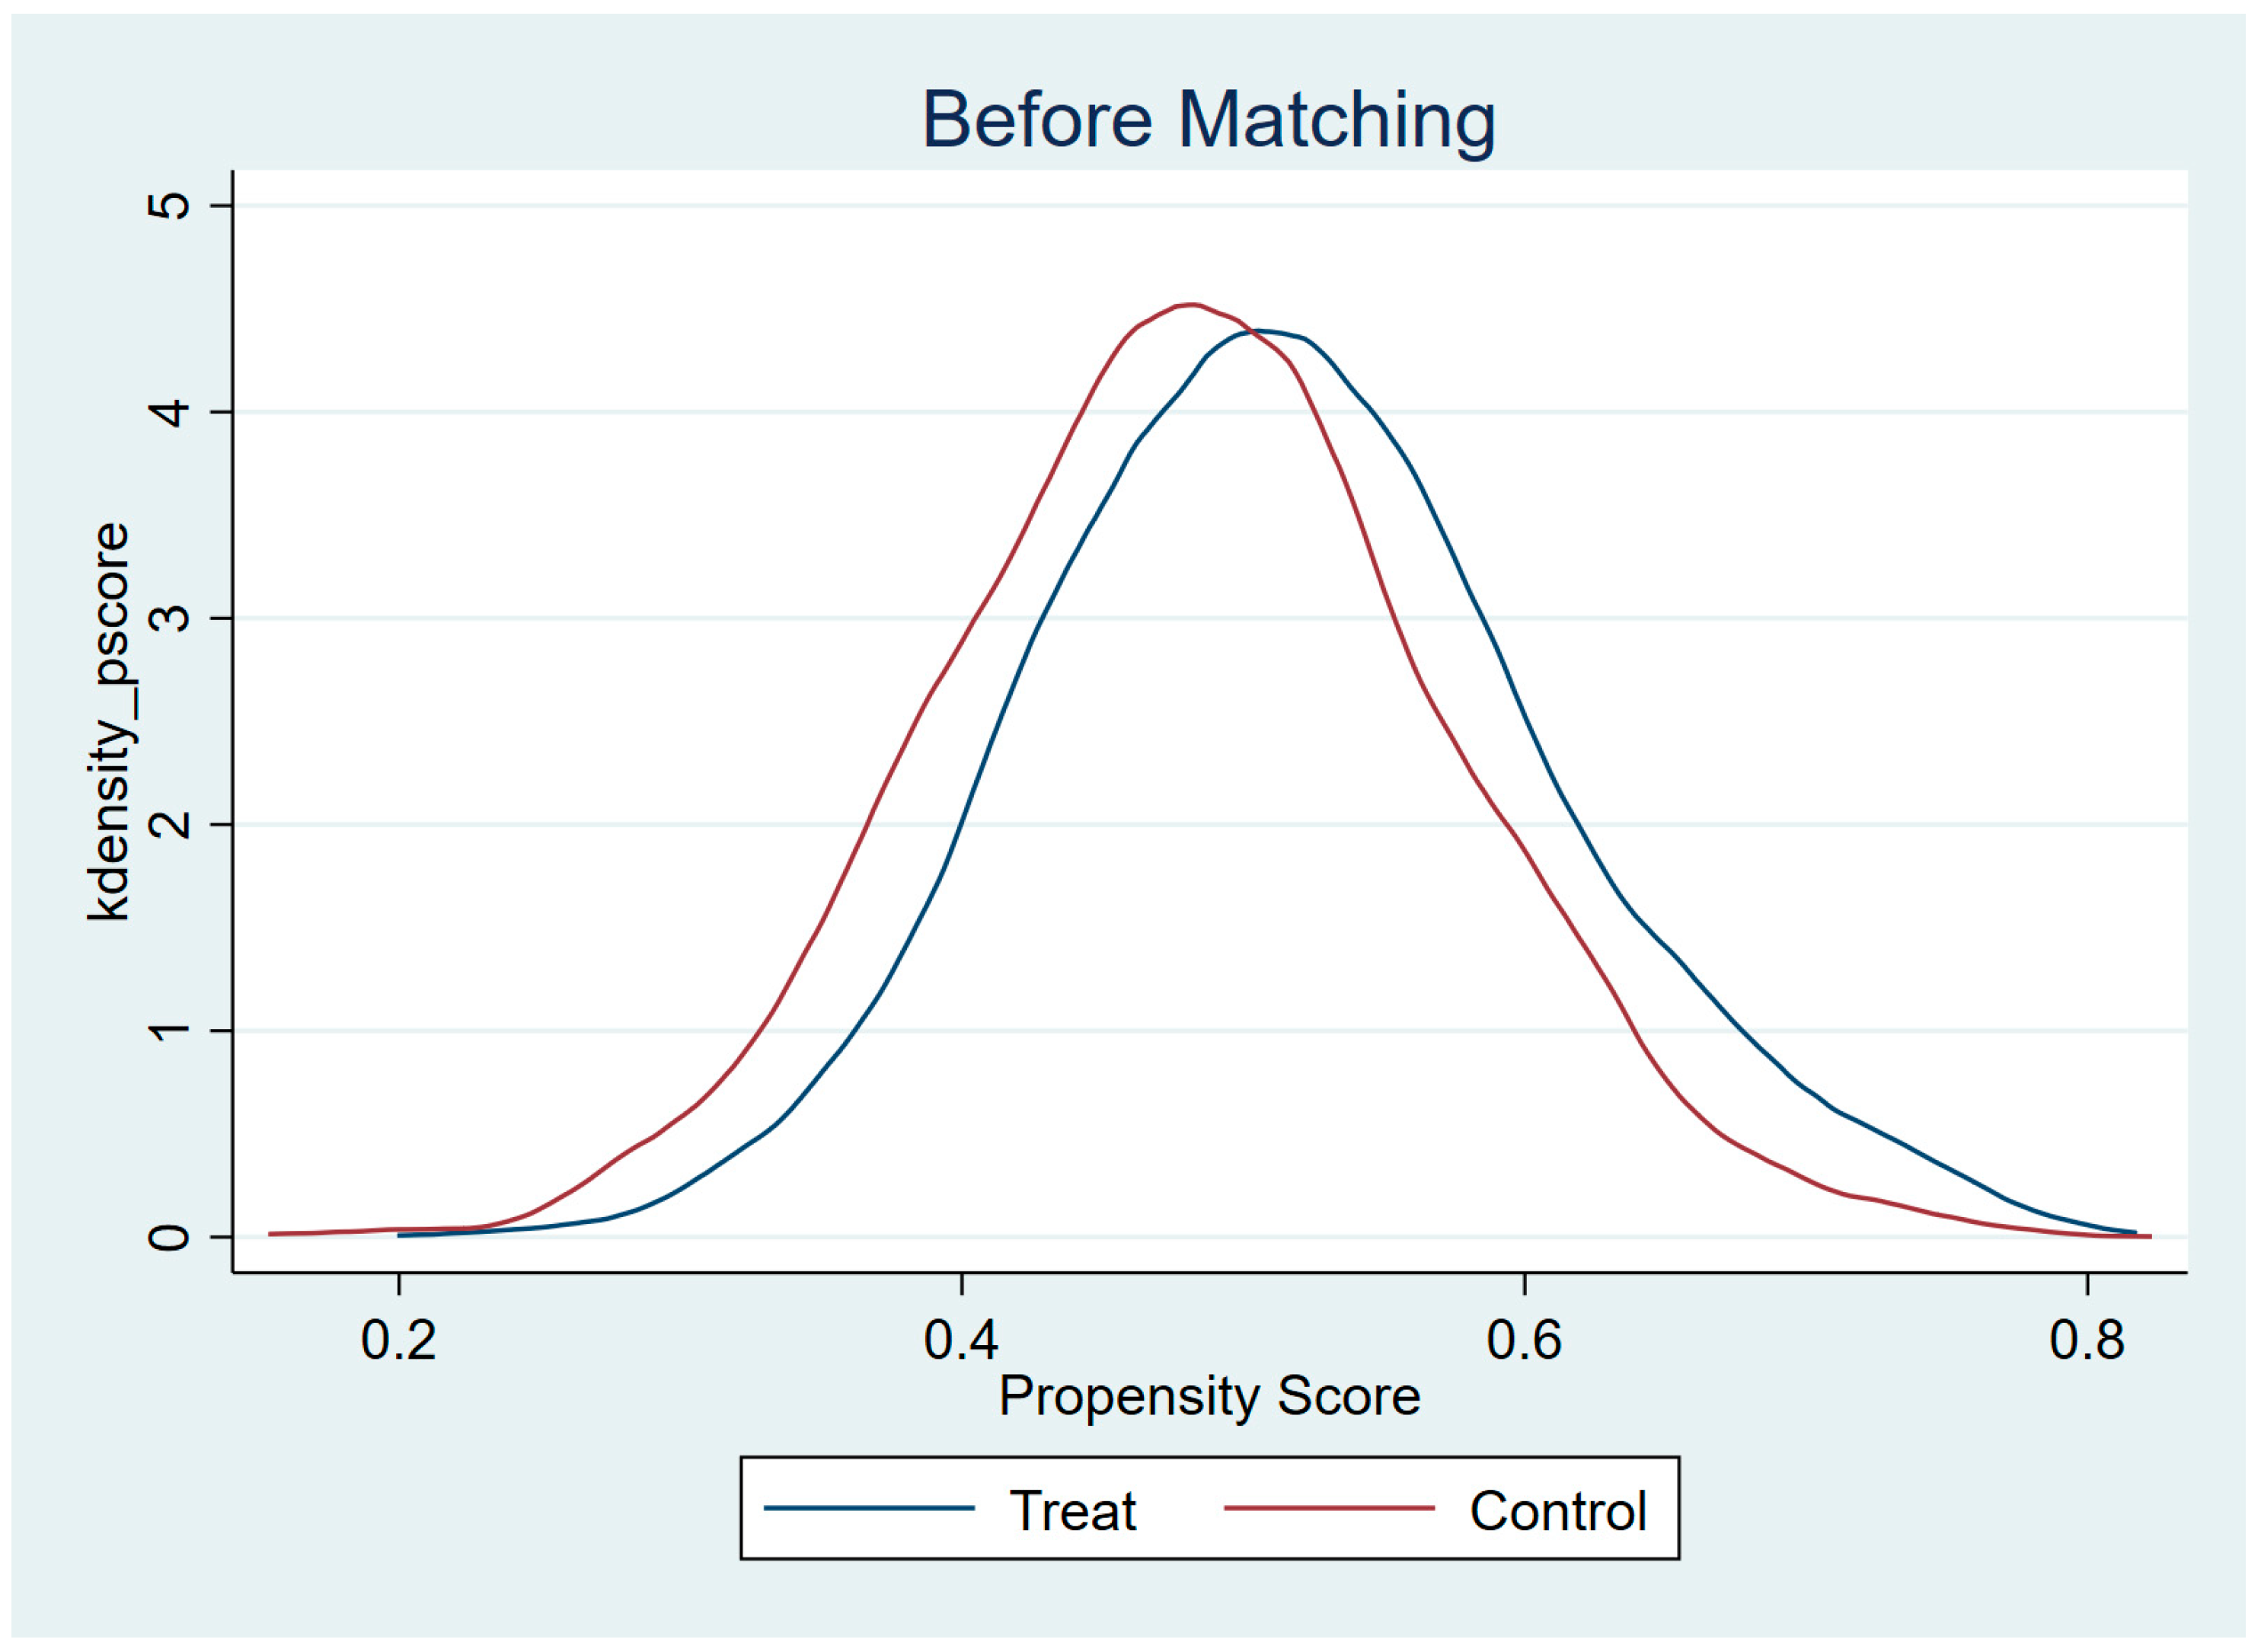
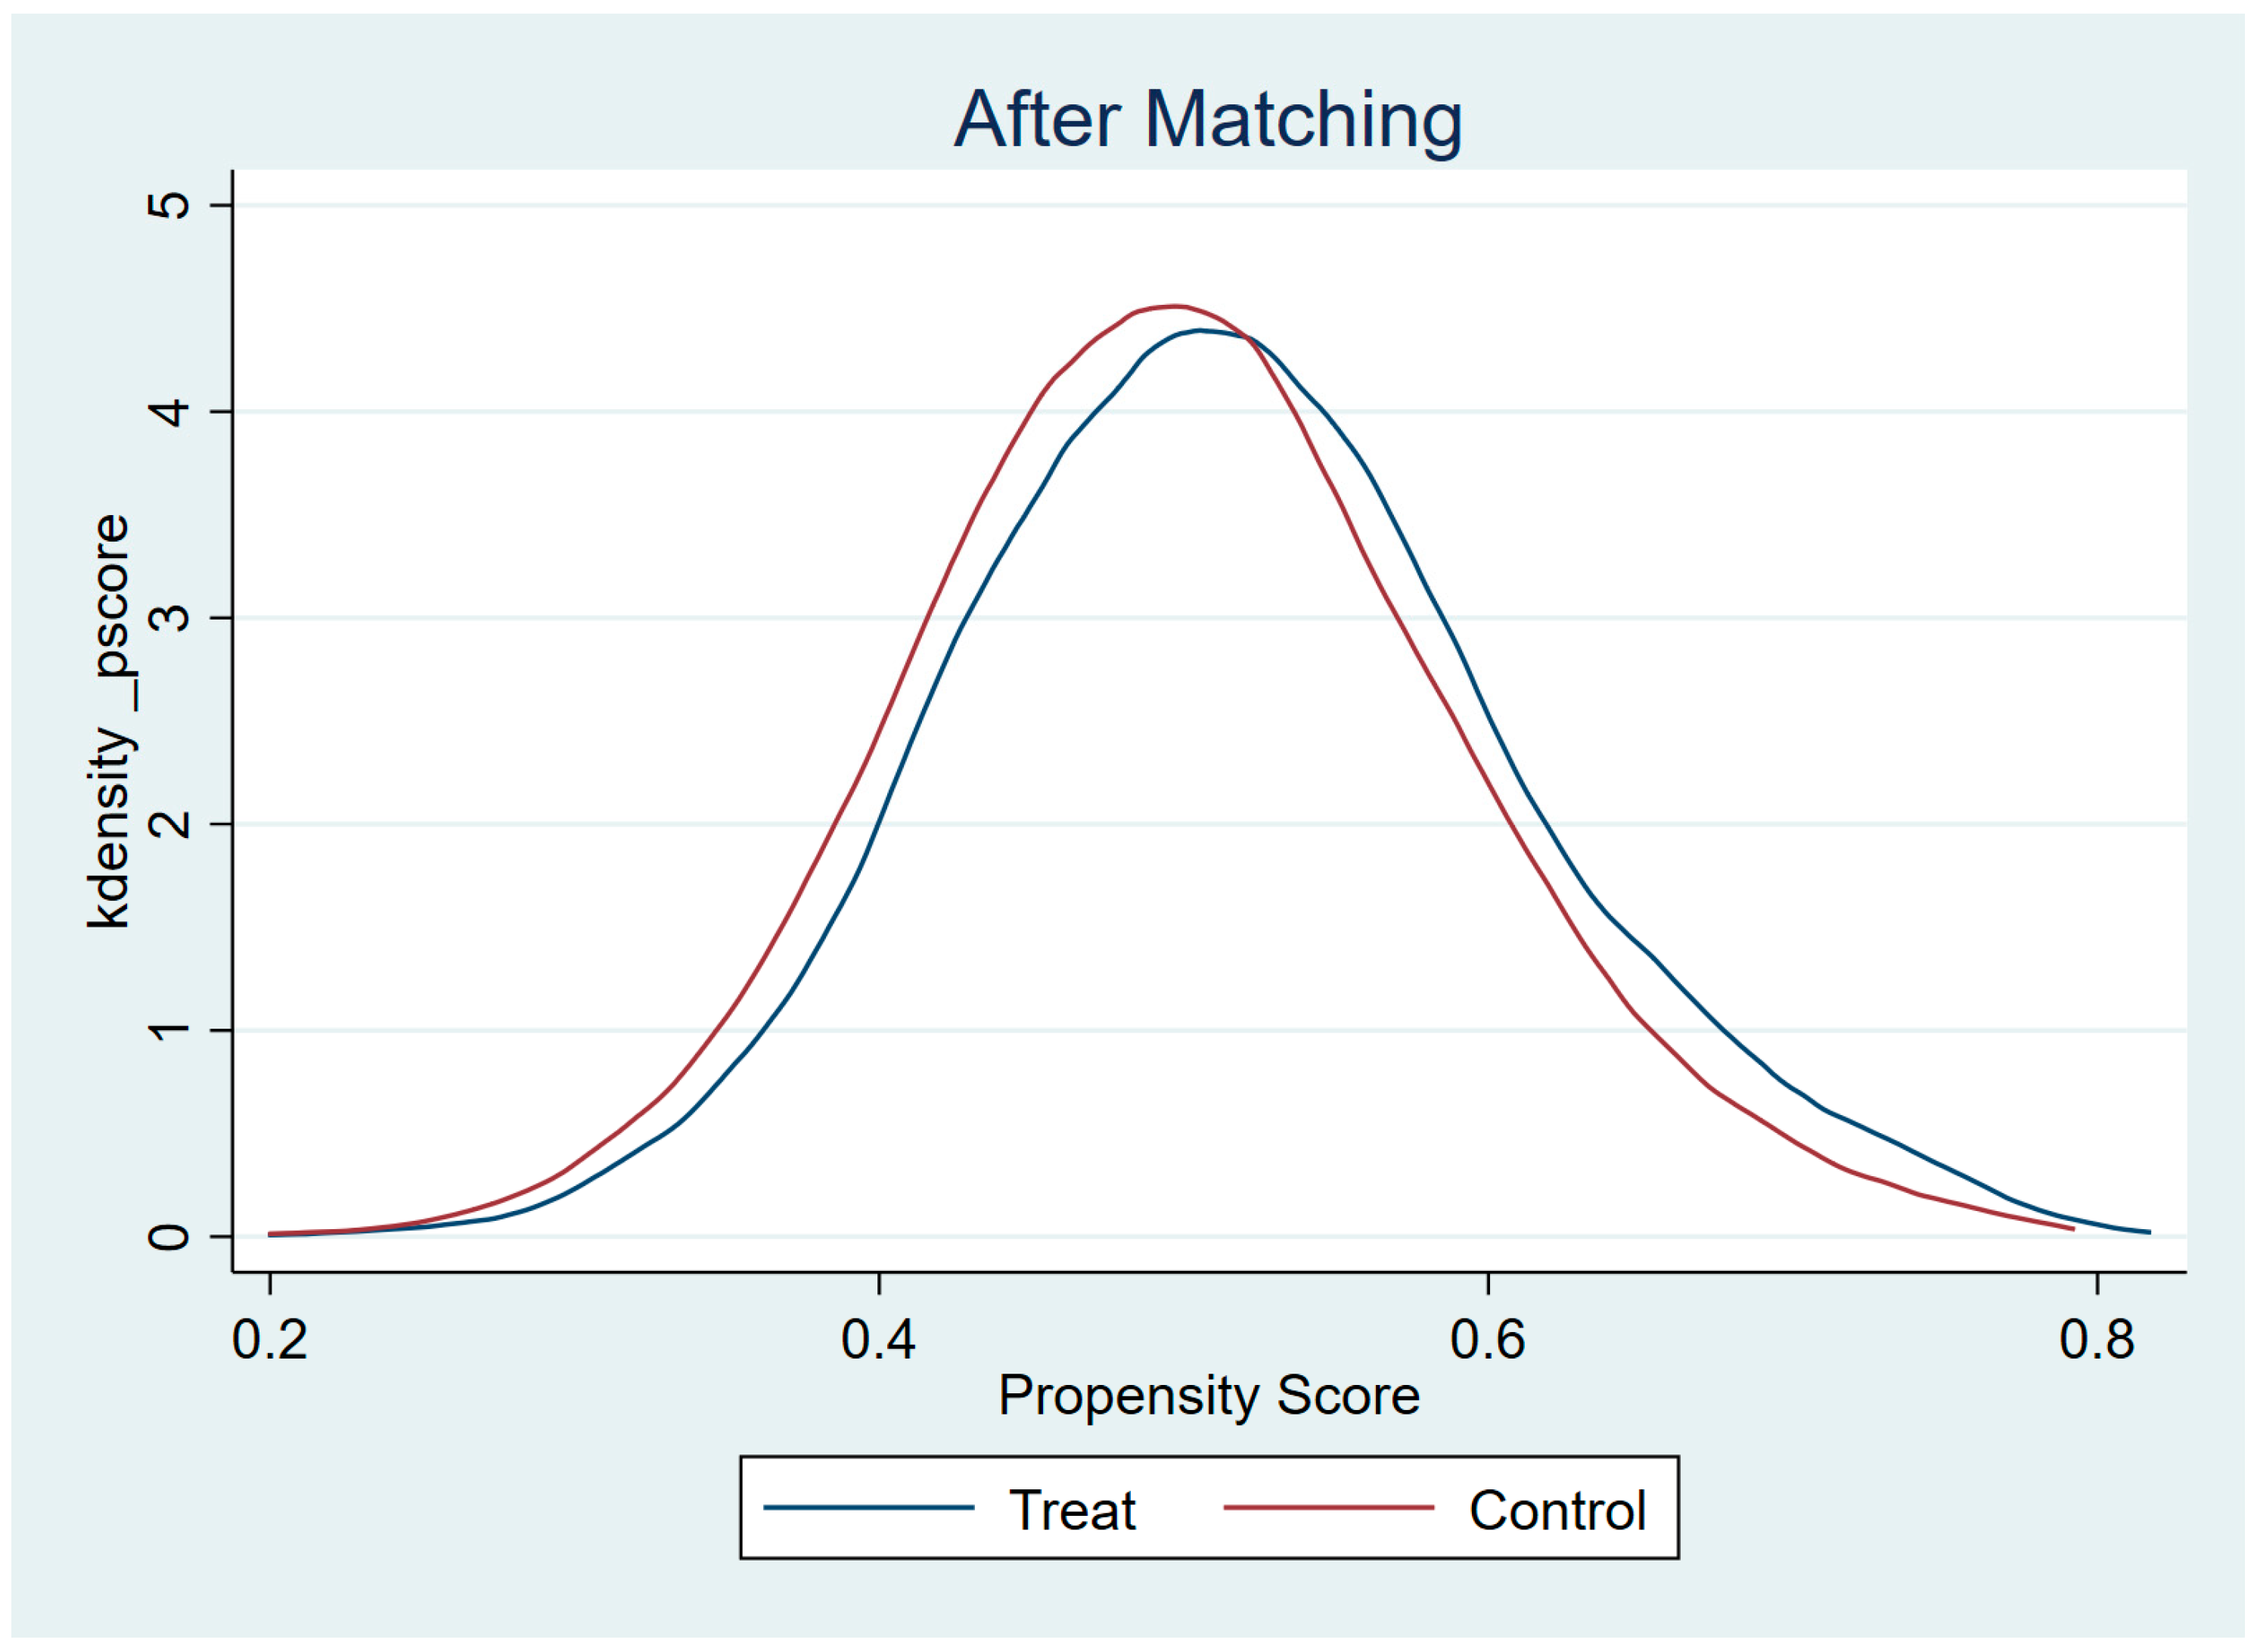
Second, in order to accurately assess the influence of digital literacy on the subjective well-being of rural residents, a series of rigorous robustness tests were conducted. These tests included the examination of endogeneity, replacement of regression models, adjustment of the explanatory variable calculation method, and randomly taking 60% of the samples. As a result, it was confirmed that digital literacy has a significant positive impact on subjective well-being.
Third, given the theory of individual differences, the impact of digital literacy on subjective well-being among rural residents varies across different groups based on people’s natural and social attributes. Specifically, this impact is more pronounced in the central and western regions, male individuals, younger age groups, those with lower education, and those with stronger social networks. These findings highlight significant differences in digital literacy on the subjective well-being of rural residents.
Fourth, we incorporate per capita income, the proportion of cultural consumption in total consumption, and a relationship evaluation as intermediary variables to examine the mechanism through which digital literacy influences rural residents’ subjective well-being. The findings reveal that digital literacy significantly enhances subjective well-being among rural residents by increasing income, upgrading consumption structures, and elevating social belonging. This research elucidates the pathways through which digital literacy impacts subjective well-being.

5.2. Policy Implications

Combined with the above conclusions, we draw the following policy implications. The foremost priority is to expedite the advancement of digital infrastructure. The government is expected to take a leading role in the development of digital infrastructure; enhance financial and policy support; jointly launch a digital subsidy policy to subsidize disadvantaged groups, especially for the western rural network base station, communication cable, and other facility investments; explore investment models for market players; and guide social capital participation in the construction. Furthermore, it is imperative for the government to facilitate the establishment of comprehensive radio and television networks in underserved regions, guide digital enterprises in developed eastern regions to establish cooperative relations with rural areas in western regions, optimize policies supporting talent development, and enhance the popularizing rate and quality of digital technology, thereby ensuring that digital dividends and well-being are truly accessible to all individuals.
Secondly, it is recommended to provide digital skill education and training for rural residents. In response to the specific needs of vulnerable groups, enterprises and social organizations are encouraged to actively participate in digital skill training programs targeting rural residents. Professional teachers should be organized to conduct digital education initiatives in rural areas according to the cognitive characteristics and learning ability of rural residents of different ages and genders and establish a multi-level complementary system for digital training. This will help foster a digital Internet mindset among rural residents and enhance the digital skills and literacy of vulnerable groups. For example, advanced skill training for rural inhabitants, such as digital marketing and e-commerce operations, encourages groups of young people to pair up with their elders in digital skills and conduct “one-to-one” tutoring. China’s “Information access to villages and households” project, Kenya’s “M-PESA” mobile payment project, India’s “Digital India” program, and other digital literacy cases provide effective reference.
Lastly, proper guidance should be provided to residents on utilizing digital technology effectively, which can contribute to income growth, consumption upgrading, and strengthening social connections. This should fully harness the potential of digital technology to actively contribute to information collection and dissemination, the accumulation of social capital, the optimization of consumption structure, flexible employment opportunities, and other aspects. As a result, this should enrich the content available on Internet platforms and systematically advance development models such as “Internet + entrepreneurship”, “Internet + e-commerce”, and “Internet + tourism”, among others, thereby deepening industrial integration. Broadening channels that increase rural residents’ income and employment prospects, enhancing their consumption experiences, and strengthening weak ties within communities can further unleash the “multiplier effect” of the Internet for vulnerable groups in rural areas and improve overall digital well-being.
It should be admitted that there are certain limitations in our study, and future studies could continue to make in-depth analyses from the following aspects. First, in the database, our use of respondents may overestimate or underestimate their digital skills due to some factors, and therefore, future research could consider incorporating objective assessments of digital literacy to supplement self-reported data and reduce potential bias. Next, as a result of the timeliness of the database, future research can focus on the potential impact of digital shifts in the post-pandemic period, which may have amplified the importance of digital literacy. We need to dialectically view digital literacy’s impact. Under the dual influence of objective factors, like the digital divide, literacy barriers, and regional policy constraints, as well as subjective factors, such as digital addiction, misinformation, and privacy issues, individuals may excessively use digital tools, resulting in Internet addiction, exacerbating inequalities for those with limited digital access and skills.

Author Contributions

Conceptualization, C.H.; Project administration, C.H.; Methodology, R.S.; Data curation, R.S.; Formal analysis C.H. and R.S.; Writing—original draft by C.H. and R.S.; Writing—review and editing, C.H., H.W. and J.C.; Supervision, H.W. and J.C.; funding acquisition, C.H., R.S. and J.C. All authors have read and agreed to the published version of the manuscript.

Funding

This study was supported by the National Social Science Fund Project of China (No. 24CGL079), Jiangxi Normal University “Research on High-quality Development of the Yangtze River Economic Belt”, Young Marxist Theory Research Innovation Project of Jiangxi Normal University (2023QMZX21), Fundamental Research Funds for the Central Universities, and the Research Funds of Renmin University of China (No. 22XNF042).

Institutional Review Board Statement

Not applicable.

Data Availability Statement

The data used to support the findings of this study are publicly available from the China Social Science Survey Center of Peking University. The final data are available from the authors upon request.

Conflicts of Interest

The authors declare no conflicts of interest.

References

  1. Sun, Y.; Gao, J.; Zhang, X.; Cheng, Y. The impact of internet use on residents’ happiness in China. Front. Public Health 2023, 11, 1188259. [Google Scholar] [CrossRef] [PubMed]
  2. Meltwater & We Are Social. Digital 2024: Global Overview Report. 2024. Available online: https://datareportal.com/reports/digital-2024-global-overview-report (accessed on 10 August 2024).
  3. Lululemon. The 2023 Global Happiness Report. 2023. Available online: https://www.campaignchina.com/article/lululemon/491674 (accessed on 10 August 2024).
  4. Shi, Y.; Koval, P.; Kostakos, V.; Goncalves, J.; Wadley, G. “Instant Happiness”: Smartphones as tools for everyday emotion regulation. Int. J. Hum.-Comput. Stud. 2023, 170, 102958. [Google Scholar] [CrossRef]
  5. The United Nations. The 17 Sustainable Development Goals. 2015. Available online: https://sdgs.un.org/zh/goals (accessed on 10 August 2024).
  6. He, C.; Zhou, C.; Wen, H. Improving the consumer welfare of rural residents through public support policies: A study on old revolutionary areas in China. Socio-Econ. Plan. Sci. 2024, 91, 101767. [Google Scholar] [CrossRef]
  7. Vassilakopoulou, P.; Hustad, E. Bridging Digital Divides: A Literature Review and Research Agenda for Information Systems Research. Inf. Syst. Front. 2023, 25, 955–969. [Google Scholar] [CrossRef] [PubMed]
  8. Czernich, N.; Falck, O.; Kretschmer, T.; Woessmann, L. Broadband Infrastructure and Economic Growth. Econ. J. 2011, 121, 505–532. [Google Scholar] [CrossRef]
  9. Aldashev, A.; Batkeyev, B. Broadband Infrastructure and Economic Growth in Rural Areas. Inf. Econ. Policy 2021, 57, 100936. [Google Scholar] [CrossRef]
  10. Wang, C.; Wang, L. Does broadband infrastructure promote urban innovation? Evidence from “Broadband China” demonstration policy. Struct. Change Econ. Dyn. 2024, 69, 349–362. [Google Scholar] [CrossRef]
  11. Whitacre, B.; Gallardo, R.; Strover, S. Broadband’s contribution to economic growth in rural areas: Moving towards a causal relationship. Telecommun. Policy 2014, 38, 1011–1023. [Google Scholar] [CrossRef]
  12. de Clercq, M.; D’Haese, M.; Buysse, J. Economic growth and broadband access: The European urban-rural digital divide. Telecommun. Policy 2023, 47, 102579. [Google Scholar] [CrossRef]
  13. Dou, B.; Guo, S.; Chang, X.; Wang, Y. Corporate digital transformation and labor structure upgrading. Int. Rev. Financ. Anal. 2023, 90, 102904. [Google Scholar] [CrossRef]
  14. Srivastava, A.P.; Dhar, R.L. Technology leadership and predicting travel agent performance. Tour. Manag. Perspect. 2016, 20, 77–86. [Google Scholar] [CrossRef]
  15. Mergel, I.; Edelmann, N.; Haug, N. Defining digital transformation: Results from expert interviews. Gov. Inf. Q. 2019, 36, 101385. [Google Scholar] [CrossRef]
  16. Wang, H.; Ding, L.; Guan, R.; Xia, Y. Effects of advancing internet technology on Chinese employment: A spatial study of inter-industry spillovers. Technol. Forecast. Soc. Change 2020, 161, 120259. [Google Scholar] [CrossRef]
  17. Aubert-Tarby, C.; Escobar, O.R.; Rayna, T. The impact of technological change on employment: The case of press digitisation. Technol. Forecast. Soc. Chang. 2018, 128, 36–45. [Google Scholar] [CrossRef]
  18. Law, R.; Buhalis, D.; Cobanoglu, C. Progress on information and communication technologies in hospitality and tourism. Int. J. Contemp. Hosp. Manag. 2014, 26, 727–750. [Google Scholar] [CrossRef]
  19. Li, J.; Wu, Y.; Xiao, J.J. The impact of digital finance on household consumption: Evidence from China. Econ. Model. 2020, 86, 317–326. [Google Scholar] [CrossRef]
  20. Wu, Y.; Huang, S. The effects of digital finance and financial constraint on financial performance: Firm-level evidence from China’s new energy enterprises. Energy Econ. 2022, 112, 106158. [Google Scholar] [CrossRef]
  21. Atasoy, H. The Effects of Broadband Internet Expansion on Labor Market Outcomes. Ilr Rev. 2013, 66, 315–345. [Google Scholar] [CrossRef]
  22. Sinclair, T.J.; Grieve, R. Facebook as a source of social connectedness in older adults. Comput. Hum. Behav. 2017, 66, 363–369. [Google Scholar] [CrossRef]
  23. Diener, E.; Lucas, R.E.; Oishi, S. Advances and open questions in the science of subjective well-being. Collabra: Psychol. 2018, 4, 15. [Google Scholar] [CrossRef]
  24. Wan, G.; Hu, X.; Liu, W. China’s poverty reduction miracle and relative poverty: Focusing on the roles of growth and inequality. China Econ. Rev. 2021, 68, 101643. [Google Scholar] [CrossRef]
  25. Clark, A.E.; Frijters, P.; Shields, M.A. Relative income, happiness, and utility: An explanation for the Easterlin paradox and other puzzles. J. Econ. Lit. 2008, 46, 95–144. Available online: https://hdl.handle.net/10419/34701 (accessed on 10 August 2024). [CrossRef]
  26. Tian, Z.; Wang, R.; Tan, Y. Research on the influence mechanism of internet use on rural residents’ consumption level in China--The mediating effect of consumption literacy. PLoS ONE 2023, 18, e0294723. [Google Scholar] [CrossRef] [PubMed]
  27. Shapiro, A.; Keyes, C.L.M. Marital status and social well-being: Are the married always better off? Soc. Indic. Res. 2008, 88, 329–346. [Google Scholar] [CrossRef]
  28. Cuñado, J.; Perez de Gracia, F. Does Education Affect Happiness? Evidence for Spain. Soc. Indic. Res. 2012, 108, 185–196. [Google Scholar] [CrossRef]
  29. Zhang, X.; Zhang, X.; Chen, X. Happiness in the air: How does a dirty sky affect mental health and subjective well-being? J. Environ. Econ. Manag. 2017, 85, 81–94. [Google Scholar] [CrossRef]
  30. Liu, T.; Liu, Q.; Jiang, D. The Influence of Flexible Employment on Workers’ Wellbeing: Evidence From Chinese General Social Survey. Front. Psychol. 2022, 13, 771598. [Google Scholar] [CrossRef]
  31. Lissitsa, S.; Chachashvili-Bolotin, S. Life satisfaction in the internet age—Changes in the past decade. Comput. Hum. Behav. 2016, 54, 197–206. [Google Scholar] [CrossRef]
  32. Liang, W.; Li, W. Impact of internet usage on the subjective well-being of urban and rural households: Evidence from Vietnam. Telecommun. Policy 2023, 47, 102518. [Google Scholar] [CrossRef]
  33. Zhu, Z.; Ma, W.; Leng, C.; Nie, P. The Relationship Between Happiness and Consumption Expenditure: Evidence from Rural China. Appl. Res. Qual. Life 2021, 16, 1587–1611. [Google Scholar] [CrossRef]
  34. Wang, H.; Cheng, Z.; Smyth, R. Consumption and Happiness. J. Dev. Stud. 2019, 55, 120–136. [Google Scholar] [CrossRef]
  35. Castellacci, F.; Tveito, V. Internet use and well-being: A survey and a theoretical framework. Res. Policy 2018, 47, 308–325. [Google Scholar] [CrossRef]
  36. Gilster, P. Digital Literacy; Wiley: New York, NY, USA, 1997. [Google Scholar]
  37. Hobbs, R. Create to Learn: Introduction to Digital Literacy; John Wiley & Sons: Hoboken, NJ, USA, 2017. [Google Scholar]
  38. Greene, J.A.; Copeland, D.Z.; Deekens, V.M.; Yu, S.B. Beyond knowledge: Examining digital literacy’s role in the acquisition of understanding in science. Comput. Educ. 2018, 117, 141–159. [Google Scholar] [CrossRef]
  39. Graham, C.; Nikolov, M. Does access to information technology make people happier? Insights from well-being surveys from around the world. J. Socio-Econ. 2013, 44, 126–139. [Google Scholar] [CrossRef]
  40. Zhong, J.; Wu, W.; Zhao, F. The impact of Internet use on the subjective well-being of Chinese residents: From a multi-dimensional perspective. Front. Psychol. 2022, 13, 950287. [Google Scholar] [CrossRef] [PubMed]
  41. Hong, Y.-Z.; Chang, H.-H. Does digitalization affect the objective and subjective wellbeing of forestry farm households? Empirical evidence in Fujian Province of China. For. Policy Econ. 2020, 118, 102236. [Google Scholar] [CrossRef]
  42. Hong, S.-H. The recent growth of the internet and changes in household-level demand for entertainment. Inf. Econ. Policy 2007, 19, 304–318. [Google Scholar] [CrossRef]
  43. Kavetsos, G.; Koutroumpis, P. Technological affluence and subjective well-being. J. Econ. Psychol. 2011, 32, 742–753. [Google Scholar] [CrossRef]
  44. Wadley, G.; Smith, W.; Koval, P.; Gross, J.J. Digital Emotion Regulation. Curr. Dir. Psychol. Sci. 2020, 29, 412–418. [Google Scholar] [CrossRef]
  45. Easterlin, R.A.; Morgan, R.; Switek, M.; Wang, F. China’s life satisfaction, 1990-2010. Proc. Natl. Acad. Sci. USA 2012, 109, 9775–9780. [Google Scholar] [CrossRef]
  46. Jebb, A.T.; Tay, L.; Diener, E.; Oishi, S. Happiness, income satiation and turning points around the world. Nat. Hum. Behav. 2018, 2, 33–38. [Google Scholar] [CrossRef] [PubMed]
  47. Oishi, S.; Kesebir, S.; Diener, E. Income Inequality and Happiness. Psychol. Sci. 2011, 22, 1095–1100. [Google Scholar] [CrossRef] [PubMed]
  48. Wang, Y.; Li, L. Digital economy, industrial structure upgrading, and residents’ consumption: Empirical evidence from prefecture-level cities in China. Int. Rev. Econ. Financ. 2024, 92, 1045–1058. [Google Scholar] [CrossRef]
  49. Mitchell, M.E.; Lebow, J.R.; Uribe, R.; Grathouse, H.; Shoger, W. Internet use, happiness, social support and introversion: A more fine grained analysis of person variables and internet activity. Comput. Hum. Behav. 2011, 27, 1857–1861. [Google Scholar] [CrossRef]
  50. Cheung, F.; Lucas, R.E. Income inequality is associated with stronger social comparison effects: The effect of relative income on life satisfaction. J. Personal. Soc. Psychol. 2016, 110, 332. [Google Scholar] [CrossRef]
  51. Nishijima, M.; Ivanauskas, T.M.; Sarti, F.M. Evolution and determinants of digital divide in Brazil (2005–2013). Telecommun. Policy 2017, 41, 12–24. [Google Scholar] [CrossRef]
  52. Ganju, K.K.; Pavlou, P.A.; Banker, R.D. Does Information and Communication Technology Lead to the Well-Being of Nations? A Country-Level Empirical Investigation. Mis Q. 2016, 40, 417–430. Available online: https://www.jstor.org/stable/26628913 (accessed on 10 August 2024). [CrossRef]
  53. Dettling, L.J. Broadband in the Labor Market: The Impact of Residential High-Speed Internet on Married Women’s Labor Force Participation. Ilr Rev. 2017, 70, 451–482. [Google Scholar] [CrossRef]
  54. Philip, L.; Cottrill, C.; Farrington, J.; Williams, F.; Ashmore, F. The digital divide: Patterns, policy and scenarios for connecting the ’final few’ in rural communities across Great Britain. J. Rural. Stud. 2017, 54, 386–398. [Google Scholar] [CrossRef]
  55. Wang, J.; Liu, C.; Cai, Z. Digital literacy and subjective happiness of low-income groups: Evidence from rural China. Front. Psychol. 2022, 13, 1045187. [Google Scholar] [CrossRef]
  56. Weidman, A.C.; Dunn, E.W. The Unsung Benefits of Material Things: Material Purchases Provide More Frequent Momentary Happiness Than Experiential Purchases. Soc. Psychol. Personal. Sci. 2016, 7, 390–399. [Google Scholar] [CrossRef]
  57. Yu, C.; Jia, N.; Li, W.; Wu, R. Digital inclusive finance and rural consumption structure—Evidence from Peking University digital inclusive financial index and China household finance survey. China Agric. Econ. Rev. 2022, 14, 165–183. [Google Scholar] [CrossRef]
  58. Valkenburg, P.M.; Peter, J. Social Consequences of the Internet for Adolescents: A Decade of Research. Curr. Dir. Psychol. Sci. 2009, 18, 1–5. [Google Scholar] [CrossRef]
  59. Elliot, A.J.; Mooney, C.J.; Douthit, K.Z.; Lynch, M.F. Predictors of Older Adults’ Technology Use and Its Relationship to Depressive Symptoms and Well-being. J. Gerontol. Ser. B-Psychol. Sci. Soc. Sci. 2014, 69, 667–677. Available online: http://hdl.handle.net/1802/28307 (accessed on 10 August 2024). [CrossRef] [PubMed]
  60. Dienlin, T.; Masur, P.K.; Trepte, S. Reinforcement or Displacement? The Reciprocity of FtF, IM, and SNS Communication and Their Effects on Loneliness and Life Satisfaction. J. Comput.-Mediat. Commun. 2017, 22, 71–87. [Google Scholar] [CrossRef]
  61. Scheerder, A.; van Deursen, A.; van Dijk, J. Determinants of Internet skills, uses and outcomes. A systematic review of the second- and third-level digital divide. Telemat. Inform. 2017, 34, 1607–1624. [Google Scholar] [CrossRef]
  62. Diener, E.; Oishi, S.; Tay, L. Advances in subjective well-being research. Nat. Hum. Behav. 2018, 2, 253–260. Available online: https://www.nature.com/articles/s41562-018-0307-6 (accessed on 10 August 2024). [CrossRef]
  63. Baron, R.M.; Kenny, D.A. The moderator–mediator variable distinction in social psychological research: Conceptual, strategic, and statistical considerations. J. Personal. Soc. Psychol. 1986, 51, 1173. [Google Scholar] [CrossRef]
  64. Long, C.; Han, J.; Yi, C. Does the Effect of Internet Use on Chinese Citizens’ Psychological Well-Being Differ Based on Their Hukou Category? Int. J. Environ. Res. Public. Health 2020, 17, 6680. [Google Scholar] [CrossRef]
  65. Chernozhukov, V.; Chetverikov, D.; Demirer, M.; Duflo, E.; Hansen, C.; Newey, W.; Robins, J. Double/debiased machine learning for treatment and structural parameters. Econom. J. 2018, 21, C1–C68. [Google Scholar] [CrossRef]
  66. Mora-Rivera, J.; Garcia-Mora, F. Internet access and poverty reduction: Evidence from rural and urban Mexico. Telecommun. Policy 2021, 45, 102076. [Google Scholar] [CrossRef]
  67. Gao, Y.; Zang, L.; Sun, J. Does computer penetration increase farmers’ income? An empirical study from China. Telecommun. Policy 2018, 42, 345–360. [Google Scholar] [CrossRef]
  68. Hori, M.; Kamo, Y. Gender Differences in Happiness: The Effects of Marriage, Social Roles, and Social Support in East Asia. Appl. Res. Qual. Life 2018, 13, 839–857. [Google Scholar] [CrossRef]
  69. Laura Arrosa, M.; Gandelman, N. Happiness Decomposition: Female Optimism. J. Happiness Stud. 2016, 17, 731–756. [Google Scholar] [CrossRef]
  70. Yang, J.; Zeng, Y.; Wang, X. The Gender Happiness Gap in China: Composition Effect or Coefficient Effect? Fem. Econ. 2024, 30, 70–105. [Google Scholar] [CrossRef]
  71. Heo, J.; Chun, S.; Lee, S.; Lee, K.H.; Kim, J. Internet Use and Well-Being in Older Adults. Cyberpsychology Behav. Soc. Netw. 2015, 18, 268–272. [Google Scholar] [CrossRef]
  72. Zhang, C.; Zhang, Y.; Wang, Y. A study on Internet use and subjective well-being among Chinese older adults: Based on CGSS (2012–2018) five-wave mixed interface survey data. Front. Public Health 2024, 11, 1277789. [Google Scholar] [CrossRef] [PubMed]
  73. Chang, C.-M.; Hsu, M.-H. Understanding the determinants of users’ subjective well-being in social networking sites: An integration of social capital theory and social presence theory. Behav. Inf. Technol. 2016, 35, 720–729. [Google Scholar] [CrossRef]
  74. DiMaggio, P.; Bonikowski, B. Make money surfing the web? The impact of Internet use on the earnings of US workers. Am. Sociol. Rev. 2008, 73, 227–250. [Google Scholar] [CrossRef]
  75. Kraut, R.; Burke, M. Internet Use and Psychological Well-Being: Effects of Activity and Audience. Commun. Acm 2015, 58, 94–100. [Google Scholar] [CrossRef]
Figure 1. The study’s background and theoretical framework.
Agriculture 15 00586 g001
Figure 2. Standardized deviation plot for each variable after propensity score matching.
Agriculture 15 00586 g002
Figure 3. Common value range of propensity score matching.
Agriculture 15 00586 g003
Figure 4. The PSM Kernel density curve before matching.
Agriculture 15 00586 g004
Figure 5. The PSM kernel density curve after matching.
Agriculture 15 00586 g005
Figure 6. The mechanism that digital literacy influences rural residents’ subjective well-being.
Agriculture 15 00586 g006
Table 1. The assignment of variables.
Name of VariableSymbolDefinition
Dependent variableSubjective well-being S W B Subjective happiness level score: 0–10
Independent variableDigital literacy d i g _ l i t Whether the network is accessible: Yes = 1, No = 0
The importance of the Internet for learning, work, and social, entertainment, and business activities: 0–5 (0 represents no Internet access and 5 means the most important)
Control variablesAge a g e Age of rural residents
Gender g e n d e r Male = 1, Female = 2
Marriage m a r r i a g e Single individuals are assigned 1 and other individuals are assigned 2
Physical condition h e a l t h Ranges from unhealthy to very healthy: 1–5 (1 represents unhealthy and 5 means the healthiest)
Level of education attainment e d u a t t Illiteracy is assigned 0, nurseries are assigned 1, kindergarten/preschool are assigned 2, primary schools are assigned 3, middle schools are assigned 4, high schools and secondary schools are assigned 5, junior college is assigned 6, undergraduates are assigned 7, masters are assigned 8
Job satisfaction j o b s a t Job satisfaction rating: 1–5 (1 represents dissatisfaction and 5 means the most satisfied)
Medical insurance m e d i n s Whether residents have health insurance: Yes = 1, No = 2
Confidence towards future f u t c o n Confidence in future life: 1–5 (1 represents self-distrust and 5 means the most confident)
Expenditure of favors and gifts e f g Expenditures on favors and gifts for rural residents
Population size p o p s i z e Number of rural household population
Region r e g i o n East region is assigned 1, middle region is assigned 2, west region is assigned 3
Mediating variablesHousehold income i n c o m e Per capita income of rural households
Consumption structure c o n s t r u Cultural consumption accounts for the proportion of total consumption
Relationship evaluation r e e v a Rural residents’ evaluation of personal relationships
Table 2. Descriptive statistics.
VariableObservationMeanStandard Deviation
Dependent variable S W B 16,3037.3782.245
Independent variable d i g l i t 16,30302.192
Control variables a g e 16,30347.82713.700
g e n d e r 16,3031.4780.500
e d u a t t 16,3032.6081.657
h e a l t h 16,3032.9921.267
m a r r i a g e 16,3031.8760.329
j o b s a t 16,3033.6430.959
f u t c o n 16,3034.1280.987
m e d i n s 16,3030.9410.236
e f g 16,3037.7161.097
p o p s i z e 16,3034.5202.004
r e g i o n 16,3032.0460.848
Mediating variables i n c o m e 16,3039.1671.083
c o n s t r u 16,3030.0920.142
r e e v a 16,3037.2331.919
Table 3. Results of the Ordered Probit regression.
VariablesSWB
(1)(2)(3)(4)(5)(6)
d i g l i t 0.023 ***0.042 ***0.022 ***0.051 ***0.023 ***0.048 ***
(0.004)(0.008)(0.005)(0.008)(0.005)(0.008)
a g e 0.006 ***0.007 ***0.005 ***0.006 ***
(0.001)(0.001)(0.001)(0.001)
g e n d e r 0.078 ***0.081 ***0.065 ***0.068 ***
(0.017)(0.016)(0.017)(0.016)
e d u a t t 0.0040.006−0.011 *−0.009
(0.006)(0.007)(0.006)(0.007)
h e a l t h 0.133 ***0.132 ***0.127 ***0.127 ***
(0.007)(0.009)(0.007)(0.009)
m a r r i a g e 0.194 ***0.205 ***0.171 ***0.182 ***
(0.026)(0.029)(0.026)(0.029)
j o b s a t 0.152 ***0.152 ***0.162 ***0.162 ***
(0.009)(0.012)(0.009)(0.012)
f u t c o n 0.367 ***0.367 ***0.368 ***0.368 ***
(0.009)(0.013)(0.009)(0.013)
m e d i n s 0.0210.0180.0460.043
(0.035)(0.044)(0.035)(0.047)
e f g 0.028 ***0.028 **0.020 **0.020 *
(0.008)(0.012)(0.008)(0.011)
p o p s i z e 0.010 **0.010 *
(0.004)(0.005)
r e g i o n −0.145 ***−0.142 ***
(0.010)(0.021)
County FENOYESNOYESNOYES
Year FENOYESNOYESNOYES
Observations16,30316,30316,30316,30316,30316,303
Pseudo R20.00060.00090.05160.05200.05480.0551
Standard errors in parentheses * p < 0.1, ** p < 0.05, *** p < 0.01.
Table 4. Results of the dual machine learning and instrumental variable methods.
Variables(1) DDML(2) First: dig_lit(3) Second: SWB(4) DID
d i g l i t 0.183 *** 0.338 *
(0.023) (0.199)
p t c 0.076 **
(0.022)
d i d 0.173 **
(0.069)
The F number in stage one 38.86
ControlsYESYESYESYES
County FEYESYESYESYES
Year FEYESYESYESYES
Observations16,30316,303821616,303
Pseudo R2 0.71010.01360.2001
Standard errors in parentheses * p < 0.1, ** p < 0.05, *** p < 0.01.
Table 5. Robustness test.
Variables(1) Ordered Logit(2) Variables Replacement(3) Random Sampling
d i g l i t 0.076 *** 0.042 ***
(0.013) (0.009)
A S W B 0.069 ***
(0.011)
ControlsYESYESYES
County FEYESYESYES
Year FEYESYESYES
Observations16,30316,3039782
Pseudo R20.05820.05520.0545
Standard errors in parentheses *** p < 0.01.
Table 6. Mechanism test results.
VariablesIncome GeneratingConsumption UpgradingSocial Belonging
(1) income(2) SWB(3) con_stru(4) SWB(5) re_evu(6) SWB
d i g l i t 0.114 ***0.047 ***0.029 ***0.048 ***0.036 ***0.035 ***
(0.0122)(0.008)(0.010)(0.008)(0.008)(0.009)
i n c o m e 0.036 *
(0.019)
c o n s t r u 0.033 *
(0.019)
r e e v a 0.236 ***
(0.008)
ControlsYESYESYESYESYESYES
County FEYESYESYESYESYESYES
Year FEYESYESYESYESYESYES
Observations16,30316,30316,30316,30316,30316,303
Pseudo R20.58560.05520.58460.05520.02270.0953
Standard errors in parentheses *** p < 0.01, * p < 0.1.
Table 7. Results of gender, age, and education heterogeneity tests.
VariablesGenderAgeEducation Attainment
(1) Male(2) Female(3) Young(4) Middle-Aged and Elderly(5) Primary and Below(6) Junior, Senior,
Technical Secondary School
(7) Junior College and Above
d i g l i t 0.052 ***0.042 ***0.054 ***0.0250.083 ***0.033 ***0.059
(0.011)(0.011)(0.011)(0.017)(0.014)(0.012)(0.061)
ControlsYESYESYESYESYESYESYES
County FEYESYESYESYESYESYESYES
Year FEYESYESYESYESYESYESYES
Observations85147789625110,05211,1044616583
Pseudo R20.05950.05230.05650.05420.05200.06820.0821
Standard errors in parentheses *** p < 0.01.
Table 8. Results of region and education attainment heterogeneity tests.
VariablesSocial networkRegion
(3) Weak(4) Strong(5) East(6) Middle(7) West
d i g l i t 0.044 ***0.052 ***0.034 **0.043 ***0.067 ***
(0.013)(0.009)(0.013)(0.014)(0.013)
ControlsYESYESYESYESYES
County FEYESYESYESYESYES
Year FEYESYESYESYESYES
Observations81528151550945436251
Pseudo R20.05170.05940.07300.04960.0399
Standard errors in parentheses ** p < 0.05, *** p < 0.01.
Disclaimer/Publisher’s Note: The statements, opinions and data contained in all publications are solely those of the individual author(s) and contributor(s) and not of MDPI and/or the editor(s). MDPI and/or the editor(s) disclaim responsibility for any injury to people or property resulting from any ideas, methods, instructions or products referred to in the content.

