Article

Biochar Input to Saline-Alkali Farmland Can Improve Soil Health and Crop Yield: A Meta-Analysis

1
College of Plant Science, Jilin University, Changchun 130012, China
2
Soybean Research Institute, Jilin Academy of Agricultural Sciences, Changchun 130033, China
*
Author to whom correspondence should be addressed.
These authors contributed equally to this work.
Agriculture 2025, 15(5), 561; https://doi.org/10.3390/agriculture15050561
Submission received: 4 February 2025 / Revised: 27 February 2025 / Accepted: 5 March 2025 / Published: 6 March 2025
(This article belongs to the Special Issue Biochar Applications in Agricultural Soil Restoration)

Abstract

:
Soil salinization in farmland is a critical factor limiting global soil health, food security, and ecosystem productivity. Biochar has recently shown great application potential in agricultural fields in many domains, such as soil structure improvement, carbon sequestration, and reductions in greenhouse gas emissions. Here, a meta-analysis of 113 published papers was carried out to quantify the effects of biochar on the remediation of saline-alkali soil and crop yield in terms of climatic conditions and agricultural management, with the aim of determining the optimal agricultural management strategy for biochar application to saline-alkali soils. The results show that adding biochar to saline-alkali farmland increases the TOC in soil (44.0%) and water utilization efficiency (8.7%), and decreases soil salinity (−9.6%), certain salt ion contents in particular (Na+, 12.5%; Cl, 23.4%; HCO3, −17.7%), along with soil pH (−2.2%), resulting in a 20.8% higher crop yield. Applying shell biochar at a rate of 10–20 t·ha−1 for monoculture is the most promising way to bolster the yield in severely saline-alkali irrigated farmland. However, adding biochar raises CO2 and CH4 emissions by 9.8% and 31.6%, respectively, but lowers the emission of N2O by 29.4%. These findings provide scientific recommendations for the sustainable application of biochar in saline-alkali farmland areas worldwide.

1. Introduction

Soil salinization is a general ecological problem that is worsening worldwide, with more than 100 countries now affected by this form of land degradation. Globally, saline-alkali soils encompass at least 1.1 × 10⁹ ha [1], which greatly limits the yield of numerous crops and threatens ecological security, causing serious economic losses and ecological crises [2]. Ways to remediate saline-alkali soil include engineering regulation, bio-remediation, and chemical conditioning. Of these, physical remediation and hydraulic engineering measures are expensive and difficult to implement widely given the varying influence of soil texture, meteorology, and water quality on their regulatory effects; bio-remediation still holds promise for its stability, environmental friendliness, and long-term benefits on ecosystems; in chemically mediated remediation, its ability to improve saline-alkali soil is constrained by the presence of secondary pollutants [3]. Hence, it has become imperative to find an effective, low-cost, green material to bolster soil health, enhance plant productivity, and restore the ecosystem functioning of land with saline-alkali soil.
In the past 20 years, biochar technology has made significant progress in the improvement and utilization of saline-alkali soils. Much research has clearly demonstrated the benefits of biochar for the physicochemical properties of saline-alkali soil, such as improving soil permeability and organic matter content, lowering pH and salinity, and promoting the growth of both microorganisms and crops [4,5]. However, as biochar produced on a large scale is often rich in alkaline metal salts and exhibits strong alkalinity, several studies have identified the negative effects of biochar on the properties of saline-alkali soil, such as raising its pH and increasing its salt content [6]. In summary, the available biochar technology for improving saline-alkali soils exhibits some contradictions and still lacks a systematic applied approach, making it difficult to predict and evaluate the scientific and practical value of biochar technology in the remediation and management of distinct forms of saline-alkali soil. Additionally, given that interactions between biochar and soil are highly complex, existing research findings have only begun to understand their dynamics and impacts, and further refinement of the explanations for the microscopic mechanisms involved is needed. Hence, a comprehensive and systematic evaluation of applying biochar to enhance saline-alkali soils via meta-analysis is necessary and timely. This would clarify the pros and cons of biochar in ameliorating saline-alkali soil under different climatic and soil conditions, in tandem with various agricultural management practices. By integrating these environmental factors to determine biochar’s optimal application rate, it should be possible to effectively guide the widespread use of biochar technology for the amendment of saline-alkali soils and promote the robust development of biochar-based remediation technologies tailored for these soils.
Because biochar has strong chemical inertness, once in the soil, it can interact with the original organic matter for thousands of years, facilitating the long-standing storage of soil carbon pools [7]. If biochar is continuously inputted to soil, the annual C content loss in various soil types is about 10–13% of their total organic carbon (TOC), but the magnitude of loss is reduced by 3.4 times after the addition of biochar [8]. Nevertheless, research has shown that biochar has a positive influence on the decomposition of TOC in soil. For example, adding biochar accelerates the rate of mineralization of TOC in soil, leading to a lower content of TOC in soil [9]. Further, biochar’s addition to soil can spur the mineralization of some difficult-to-breakdown TOC forms. This is because biochar input provides the soil with biodegradable organic carbon and small amounts of nutrients, which has a positive stimulatory effect on the carbon sink for soil mineralization [10]. However, other studies have found no significant influence of biochar on the organic carbon content of the soil. This is ascribed to the planet’s organic carbon sink in soil, which has existed for tens of thousands of years and is an extremely stable system. Considering the experimental time range of contemporary research, an increase or decrease in the organic carbon content in response to biochar addition is only a small fluctuation, which is a normal phenomenon for unstable carbon sinks with short turnover periods, and negligibly affects the large carbon sink in soil [11,12]. In experiments that used distinct preparation materials to investigate the different ways in which biochar impacts soil organic carbon, various biochar additions had only marginal effects, with the loss of organic carbon being about zero, with no apparent effect found irrespective of soil type or biochar type [13]. Hence, there is no clear consensus—for China or globally—on whether the organic carbon content in soil increases, decreases, or remains unchanged after adding biochar to saline-alkali soil.
Biochar prepared from agricultural waste has drawn increasing attention from researchers for the remediation of saline-alkali soil. Nevertheless, most biochar meta-analysis studies have focused on the outcomes of carbon and nitrogen cycles [14,15], with few reports addressing the interrelationships between saline-alkali soil remediation and crop yield. So far, only one relevant meta-analysis has been published, but its scope is limited to China, and the research content is restricted to biochar’s impact on saline-alkali soil organic carbon [16], overlooking the joint effects of other pertinent factors such as soil pH, salt, and water utilization efficiency on the yield of crops. As an efficient and novel soil amendment, we speculate that biochar plays an instrumental role in alleviating soil acidity and alkalinity issues, reducing soil salinity, sequestering carbon, and bolstering crop yields, thereby significantly contributing to the sustainable development of agriculture in saline-alkali areas. To explore and test this hypothesis, we used meta-analysis to (1) clarify the effects of biochar on pH, salinity, and organic carbon content of saline-alkali soil; (2) determine the pivotal factors contributing to biochar’s effects on pH, salinity, and organic carbon content of saline-alkali soil; and (3) identify the optimal conditions for applying biochar to enhance the health of saline-alkali soil. These findings provide a scientific basis for better understanding the effects of biochar on improving the quality of saline-alkali soil and increasing the yield of its crops, with a view to providing a timely reference for global eco-agriculture development in areas with saline-alkali soil.

2. Materials and Methods

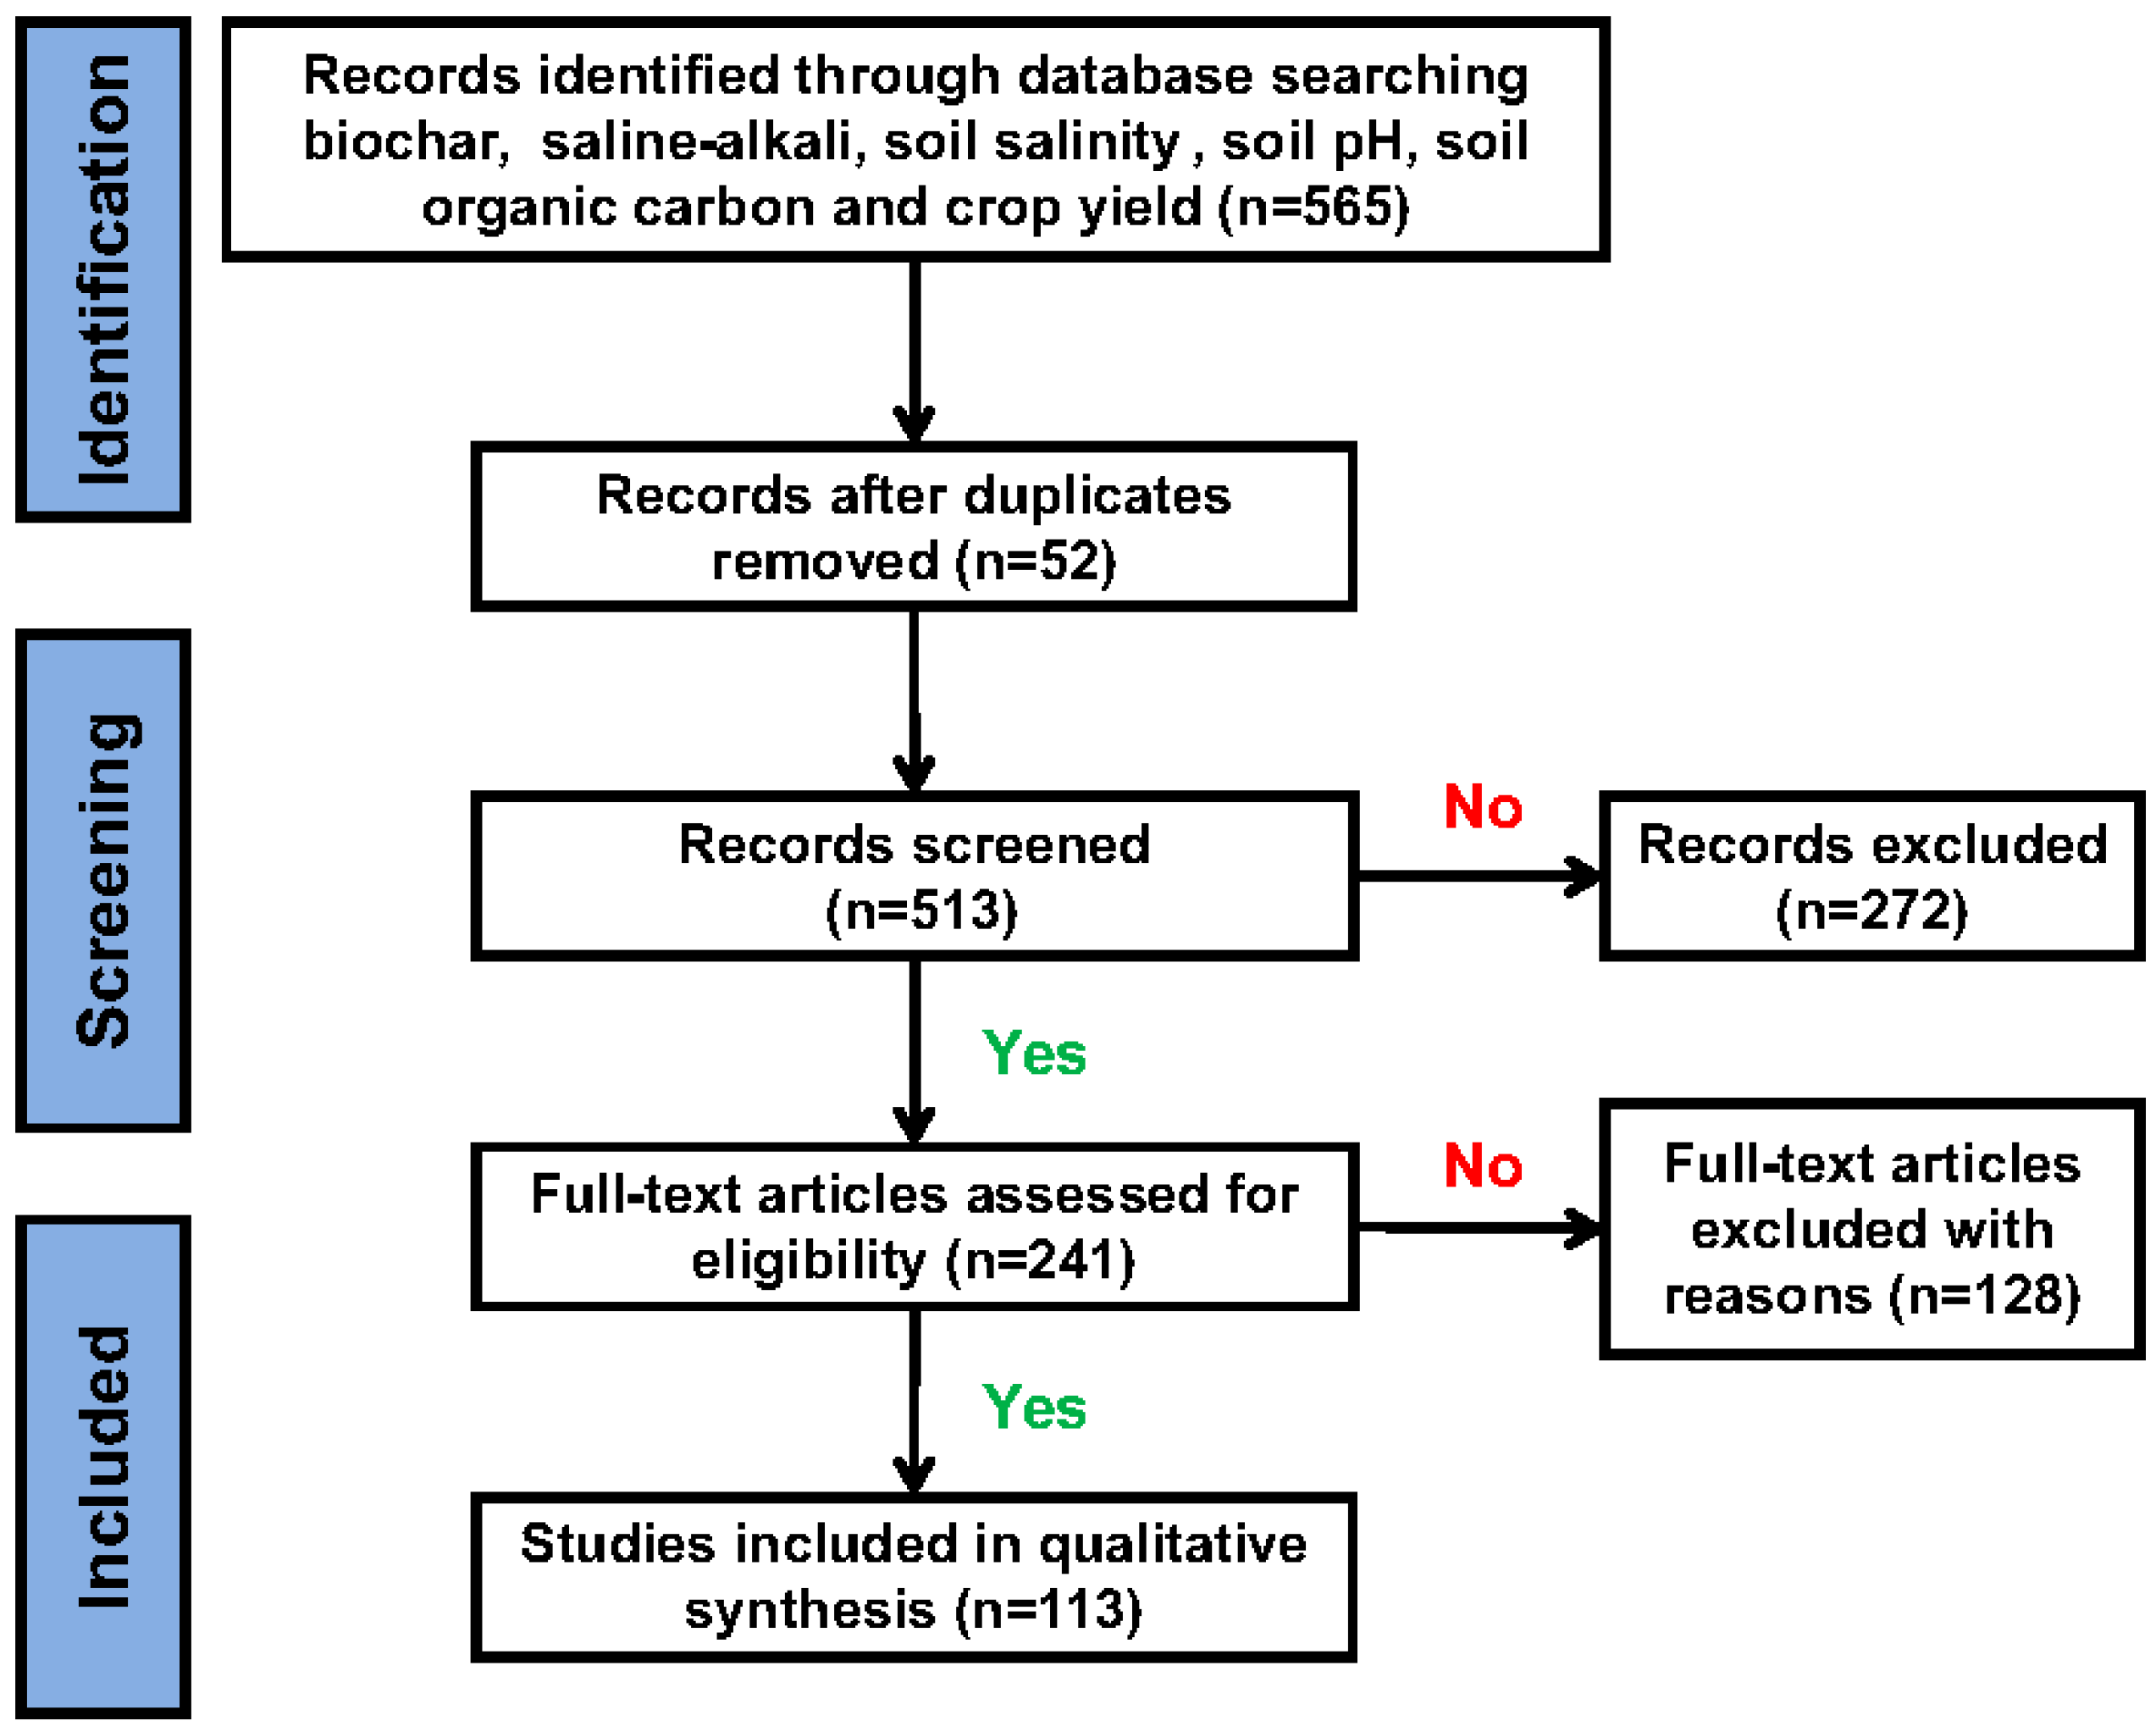
2.1. Data Collection

The Web of Science (WOS, http://apps.webofknowledge.com/, accessed on 1 May 2024) and China National Knowledge Internet (CNKI, http://www.cnki.net/, accessed on 17 May 2024) databases were searched for relevant peer-reviewed literature published between 2014 and 2024. To do this, we used the following Boolean search terms: (“biochar” OR “remediation”) AND (“soil pH” OR “carbon” OR “salinity” OR “yield”) AND (“saline-alkali land” OR “saline land” OR “saline-alkali soil” OR “saline soil”). To assess the effects of biochar on the remediation of saline-alkali soil, for inclusion in this meta-analysis, each study had to meet several criteria: (1) data came from open-air plantings; (2) the imposed treatments consisted of biochar addition (experimental group) and its absence (control group); (3) one or more target variables were assessed; i.e., data were presented that showed biochar’s effect on the pH, salinity, TOC, or crop yield of saline-alkali soil in those articles; and (4) each treatment had at least n = 3 replicates, whose mean and standard deviation (SD) were reported in a table, or could be gleaned from a figure using Engauge Digitizer 12.1 (https://sourceforge.net/projects/digitizer/, accessed on 21 May 2024). If only the standard error (SE) was reported, we derived the SD (=SE × √n); for those studies lacking either, the SD was taken as 1/10 of the mean value [17]. The screening had three phases: in the first phase, the titles of candidate articles were read, to exclude any reviews and other non-suitable literature (synthesis papers, book chapters, comments/opinions) lying outside the purview of our meta-analysis. In the second phase, we carefully read the abstracts and checked the experimental trials and designs, to omit any articles failing to meet the above criteria; finally, in the third phase, we conducted a more rigorous screening of the retained literature [18]. A complete flowchart of the screening program is presented in Figure 1.

2.2. Data Categorization
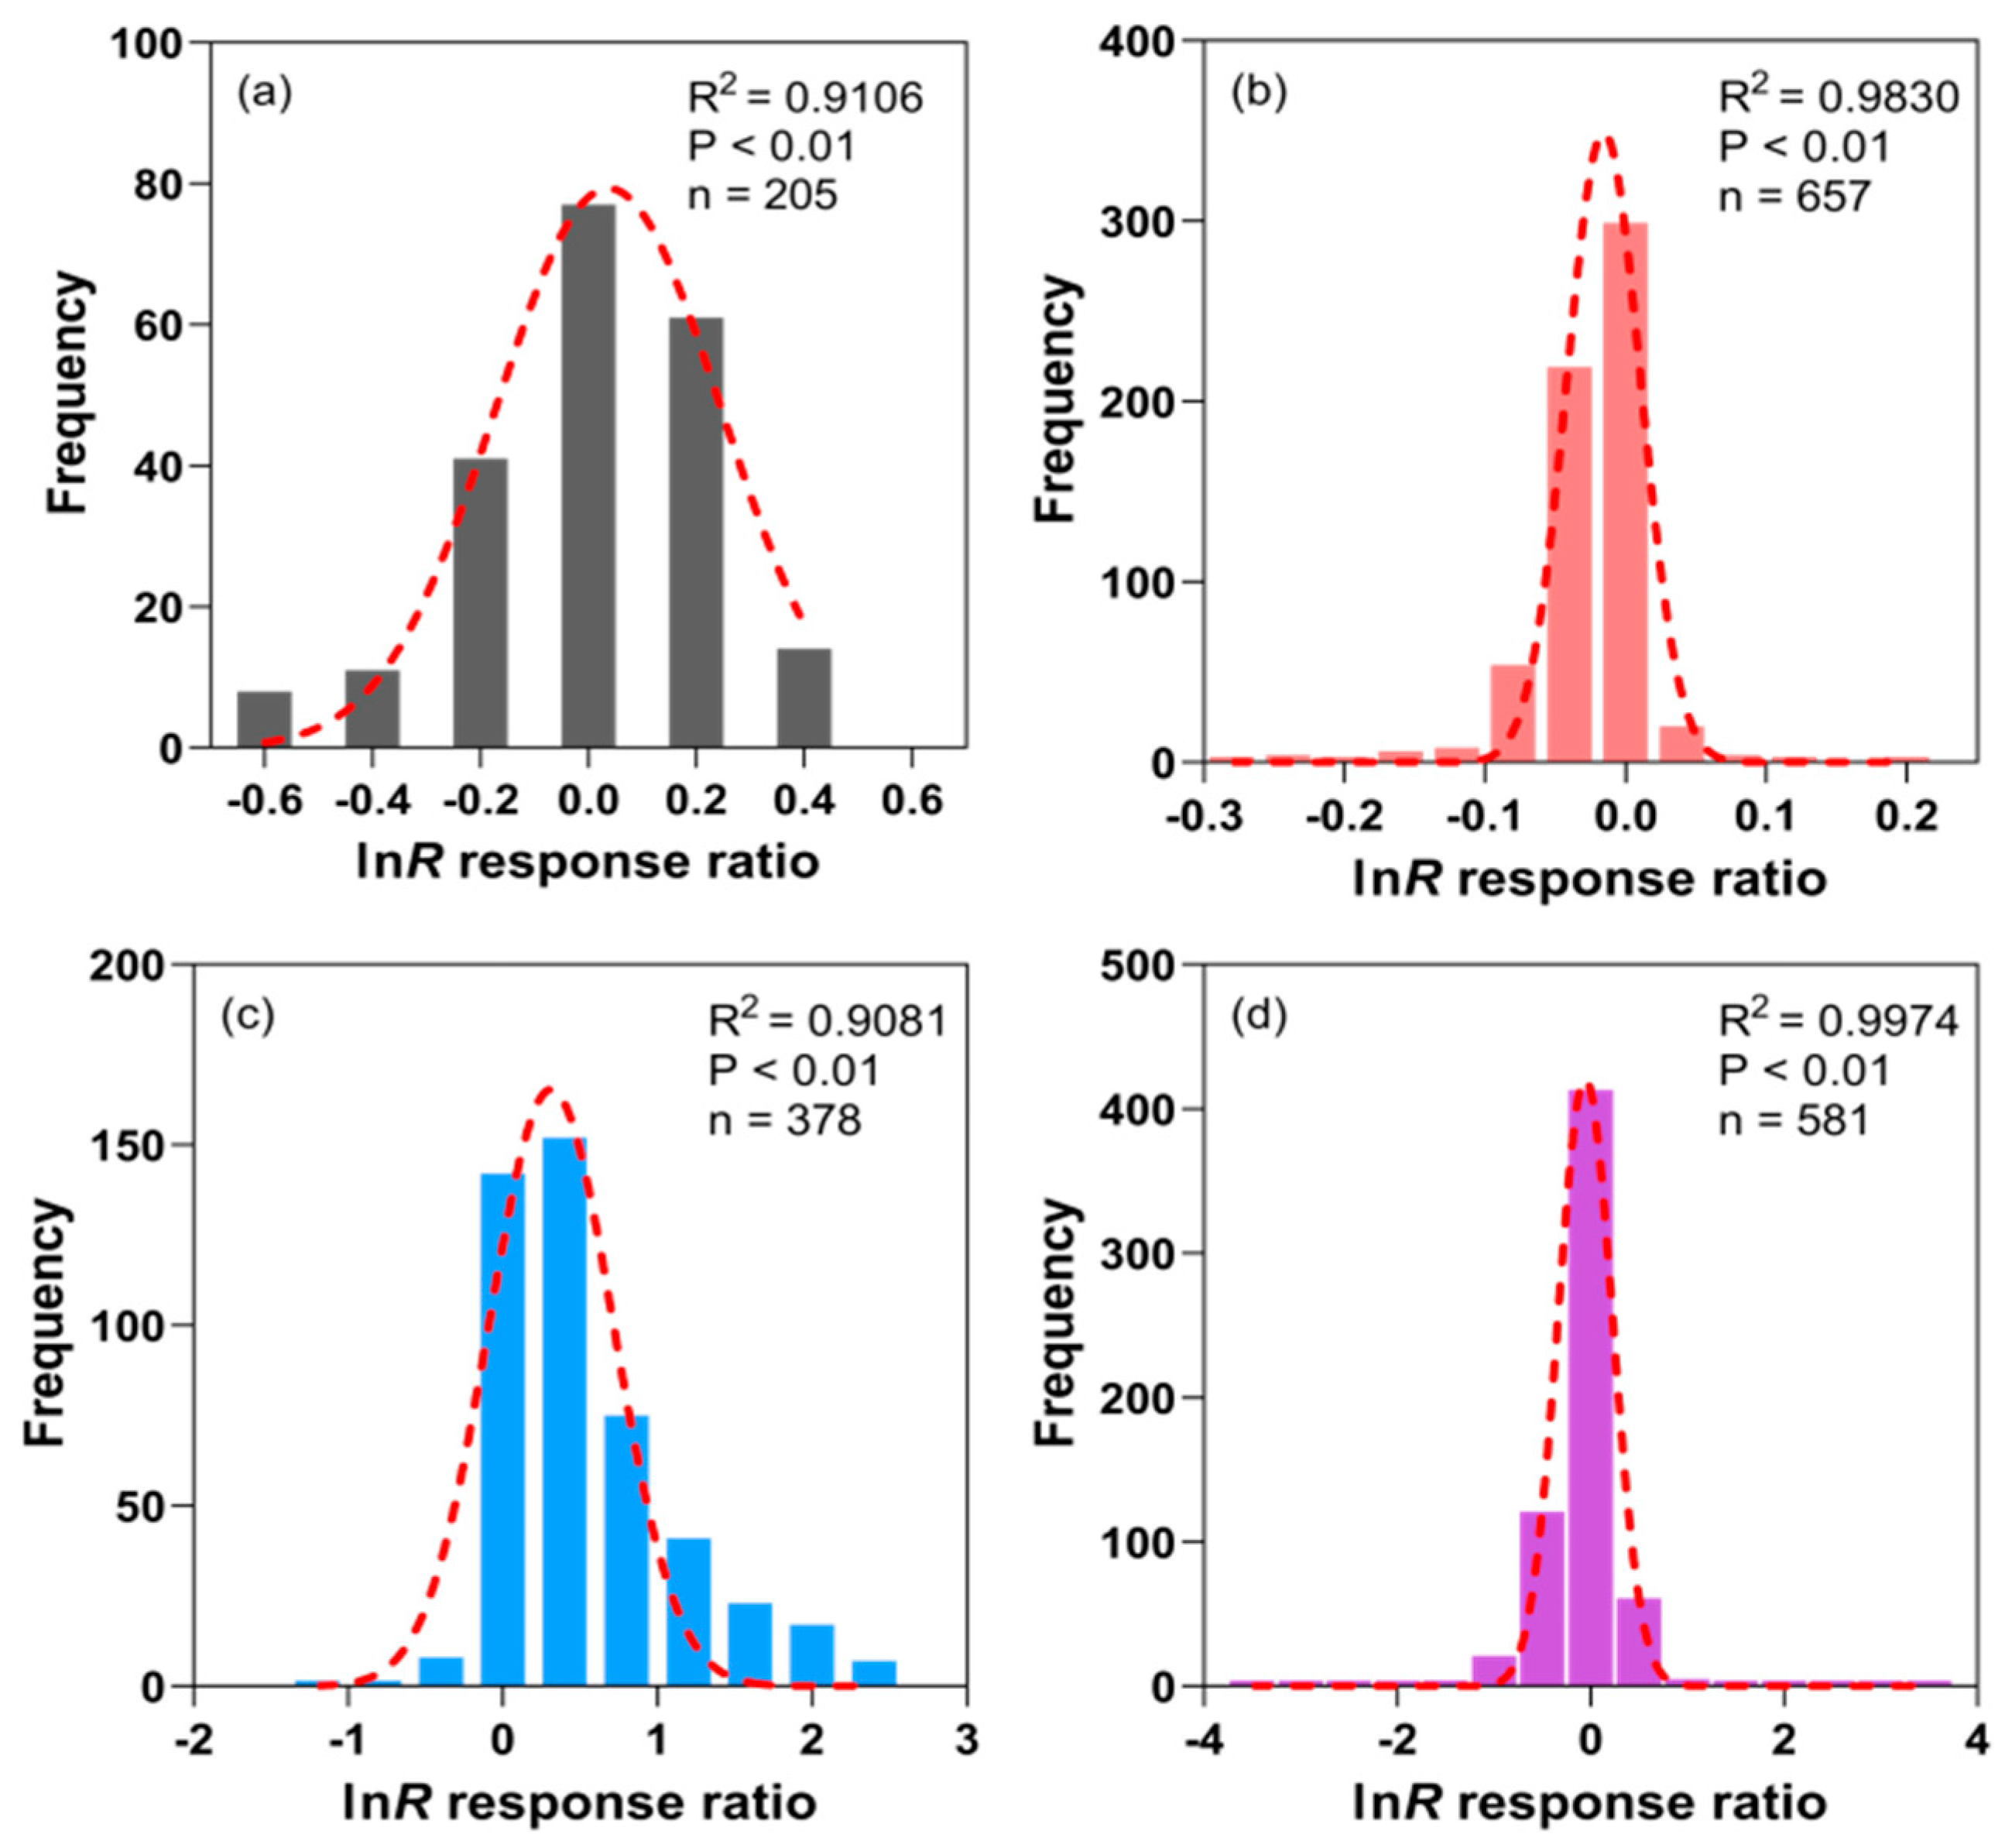
For all literature items fulfilling the criteria (n = 113 studies; see Supplementary Material for details), we extracted their respective title; author-related information; journal source; geographic location of the study; site climatic conditions and soil classification; and agricultural management practices in use. The mean annual temperature (MAT) and mean annual precipitation (MAP) were taken as climate variables. While it would be better to use the recorded precipitation and temperature during the growing season of crops at a given site, the datasets available to us mainly provided information on MAT and MAP. We used both to enable comparisons with other reports and to maintain consistency in data usage [19]. Additionally, soil salinization was categorized into three levels (mild, moderate, or severe grade) as follows: for mild saline-alkali soil, a salinity ≤ 200 g kg−1 and soil pH ≤ 8.5; for moderate saline-alkali soil, a salinity = 200–300 g kg−1 and soil pH = 8.5–9.0; and for severe saline-alkali soil, a salinity ≥ 300 g kg−1 and soil pH ≥ 9.0 [20]. Agricultural management practices included planting pattern, production system, biochar type, biochar pyrolysis temperature, and biochar input. The corresponding units and detailed grouping information are presented in Table 1.

2.3. Meta-Analysis

We used MetaWin 2.1.5.10 software (https://en.freedownloadmanager.org/, accessed on 22 May 2024) to perform the meta-analysis. The natural logarithm of the response ratio (R) served as the effect size value (lnR), which was calculated as follows:
R = X t / X c
l n R = l n ( X t / X c )
where Xt and Xc denote the mean data values for the test (biochar input) and control (not biochar input) groups, respectively, under a saline-alkali land cropping system; lnR is an index that is unitless and takes a positive or negative value, indicating a respective increase or decrease in soil pH, crop yield, soil organic carbon or soil salinity.
The variance of the effect size (Vi) was also calculated as follows:
V i = S D t 2 / N t X t + S D c 2 / N c X c
where SDt and SDc refer to the standard deviations of a given target variable in the test and control groups, respectively, with Nt and Nc being their corresponding values.
For the best precision, we used the weighted mean because statistical precision was likely to differ substantially across the 113 obtained studies. To calculate the weighted mean response rate (lnR++) and corresponding weights (Wi), the following equations were used:
l n R + + = i = 1 k l n R i × W i / i = 1 k W i
W i = 1 / V i
where i and k are the number of comparison and cumulative groups, respectively, and Wi denotes the weight of the effect size value for a given target value.
Resampling (bootstrapping) was used to obtain the 95% confidence interval (CI) of the effect size value. If the confidence interval did not cross zero, then for that target variable, its effect value was deemed statistically significant; more specifically, when the whole confidence interval lay above or below zero, this indicated that the biochar input increased or decreased the target variable significantly (p < 0.05). Accordingly, if the confidence interval included zero, the target variable was considered not significantly affected by the biochar input [21]. The following equations were used to calculate the 95% CI for lnR+:
95 % C I = l n R + + ± 1.96 S E l n R + +
S E l n R + + = 1 / i = 1 k W i
For descriptive purposes, on the basis of the compared test and control groups, their percentage change (E) with respect to the target variable was calculated as follows:
E = e x p l n R + + 1 × 100 %

2.4. Data Analysis

In this meta-analysis, the obtained frequencies of target variable response quantities were fitted to a Gaussian distribution function in Origin 2018 software (https://ea-origin.en.softonic.com/, accessed on 25 May 2024) to test for homogeneity of the observed data and the possible occurrence of bias [22]. The effect ratios of all target variables followed a normal distribution (Figure 2). Hence, for this meta-analysis, the effect of publication bias was negligible. Significant differences between subgroups were compared using 3-way multifactor ANOVAs. To visualize and plot the response values of the target variables (E), we used GraphPad Prism 9.1 software (https://www.graphpad.com/, accessed on 21 May 2024). The relative importance of these variables in reducing crop yield was examined using a random forest model in R v4.3.1 software (https://www.r-project.org/, accessed on 25 May 2024) [23]. To quantify the respective effects of biochar input and environmental variables on the pathways of crop yield, we performed structural equation modeling (SEM) [24]. It should be noted that SEM is not equivalent to partial least squares path modeling (PLS-PM); whereas SEM is based on an extracted covariance matrix, PLS-PM is based on the variance of each dimension.

3. Results

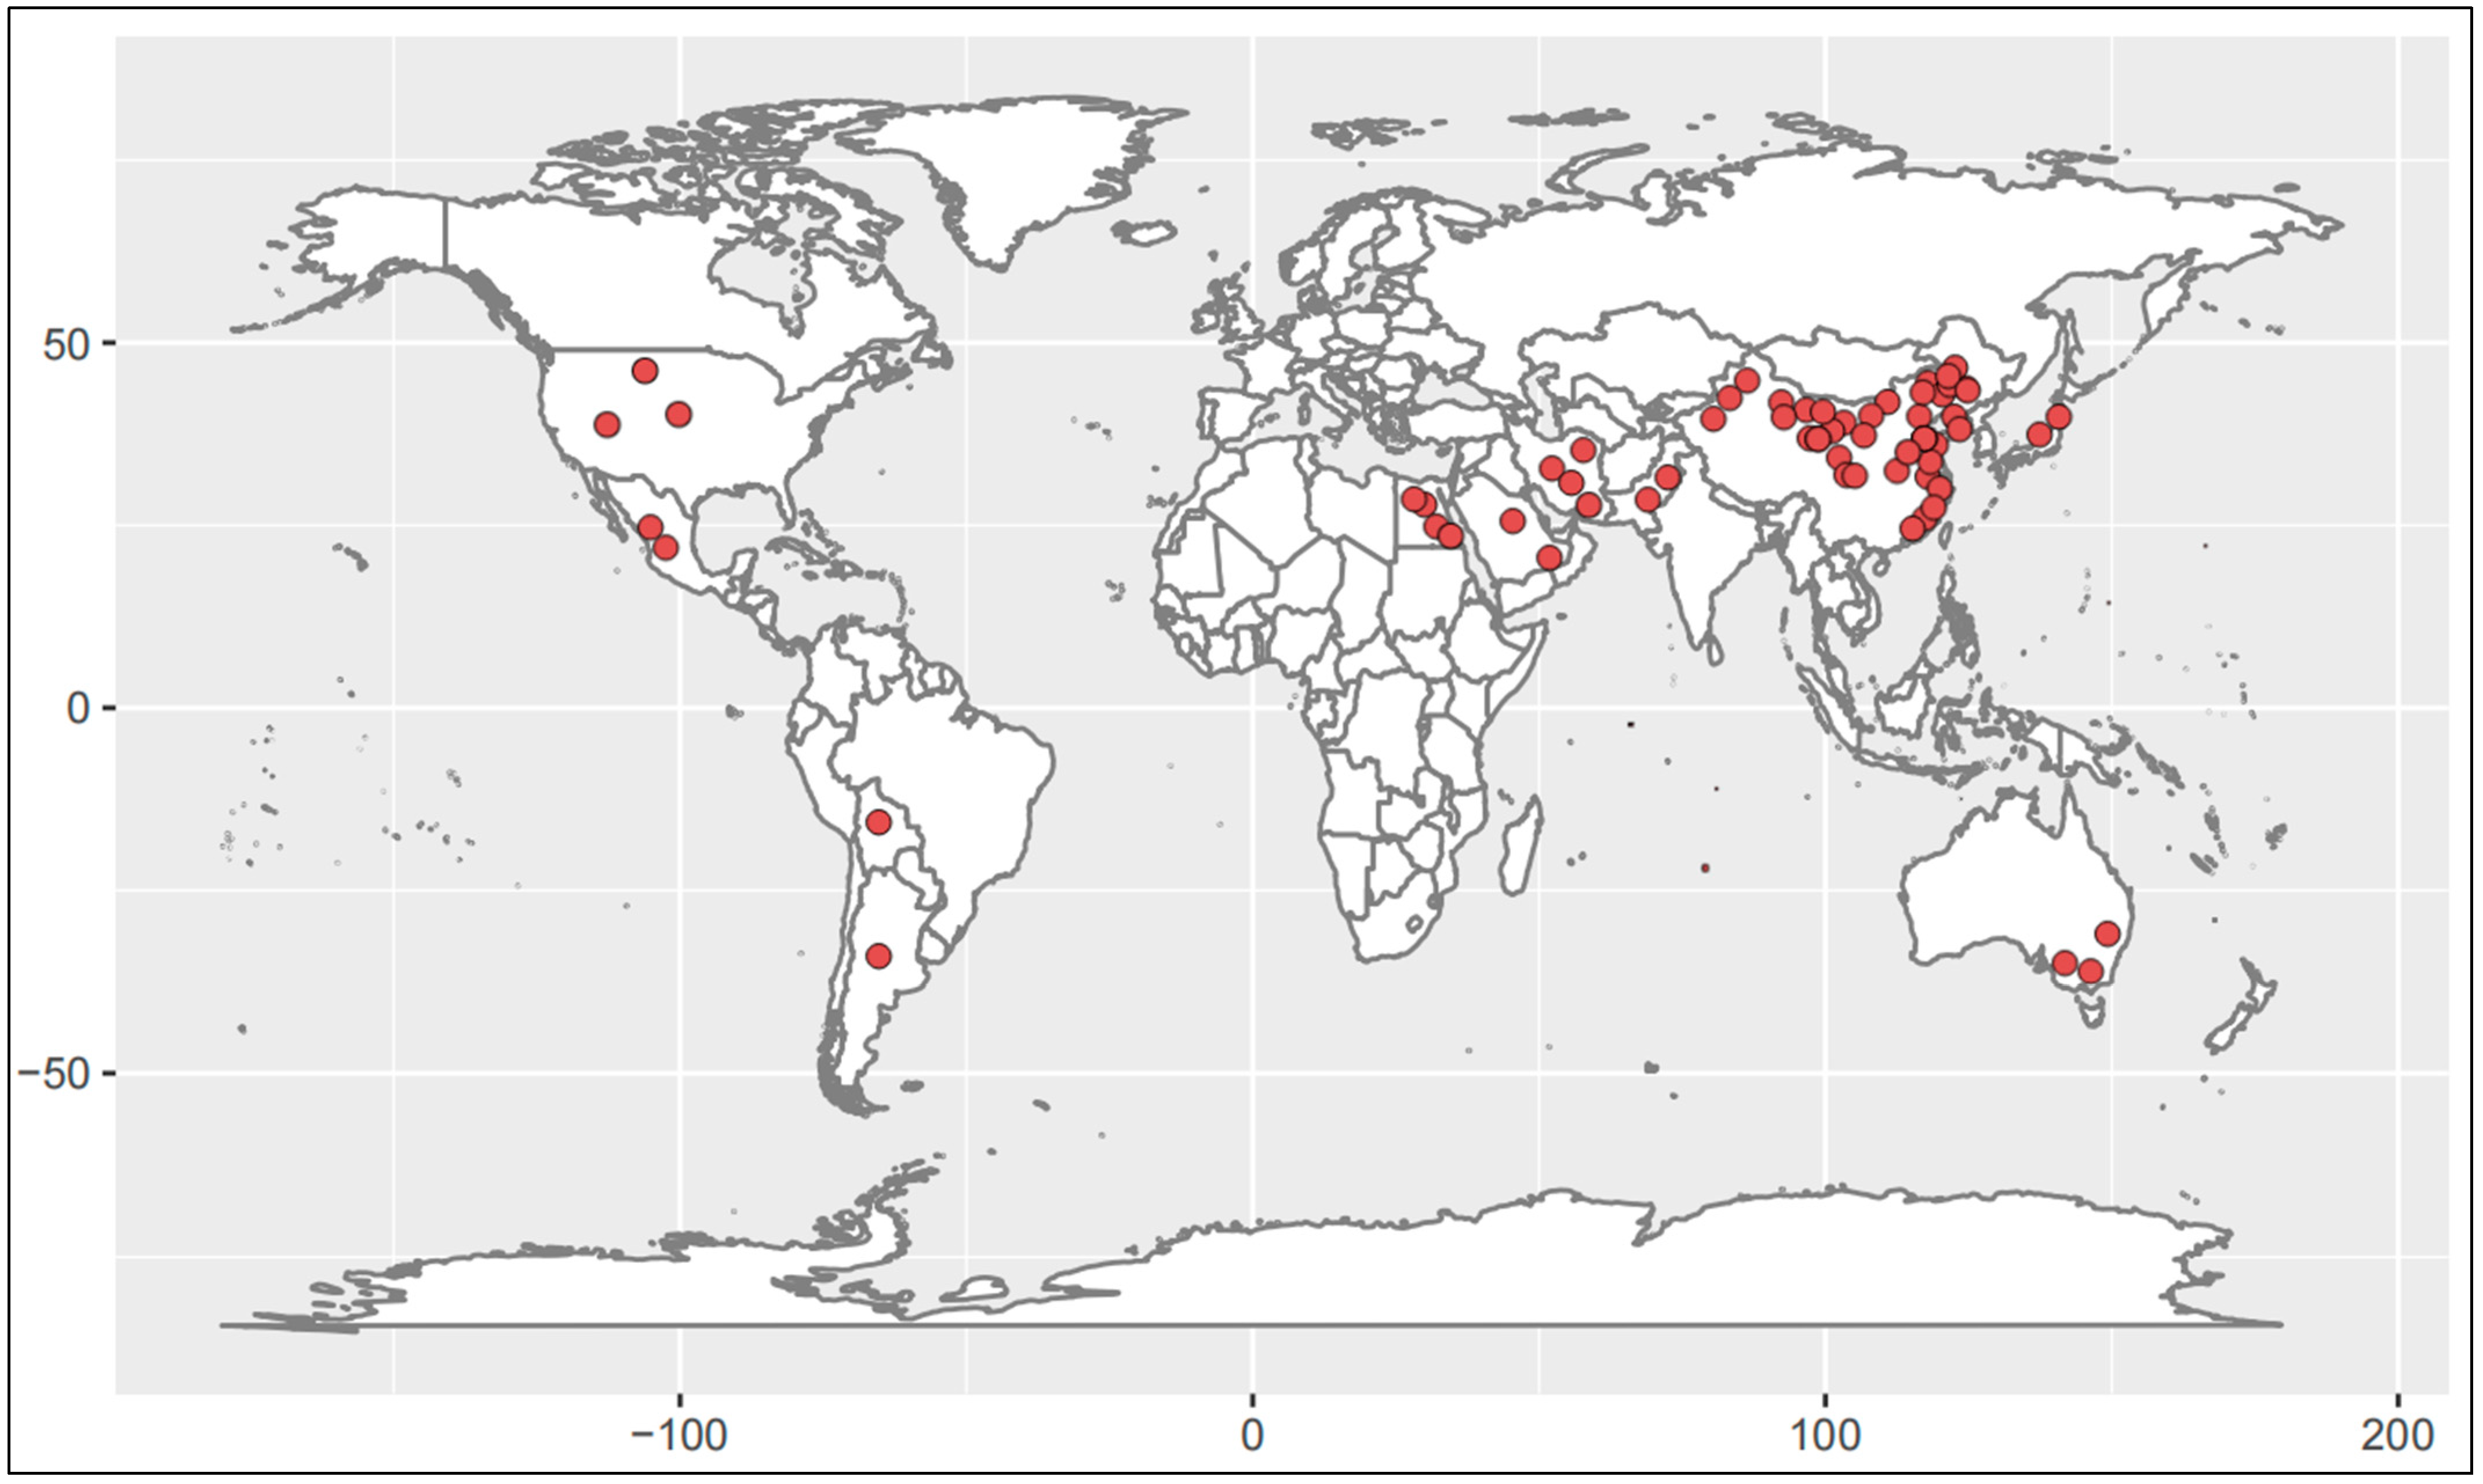
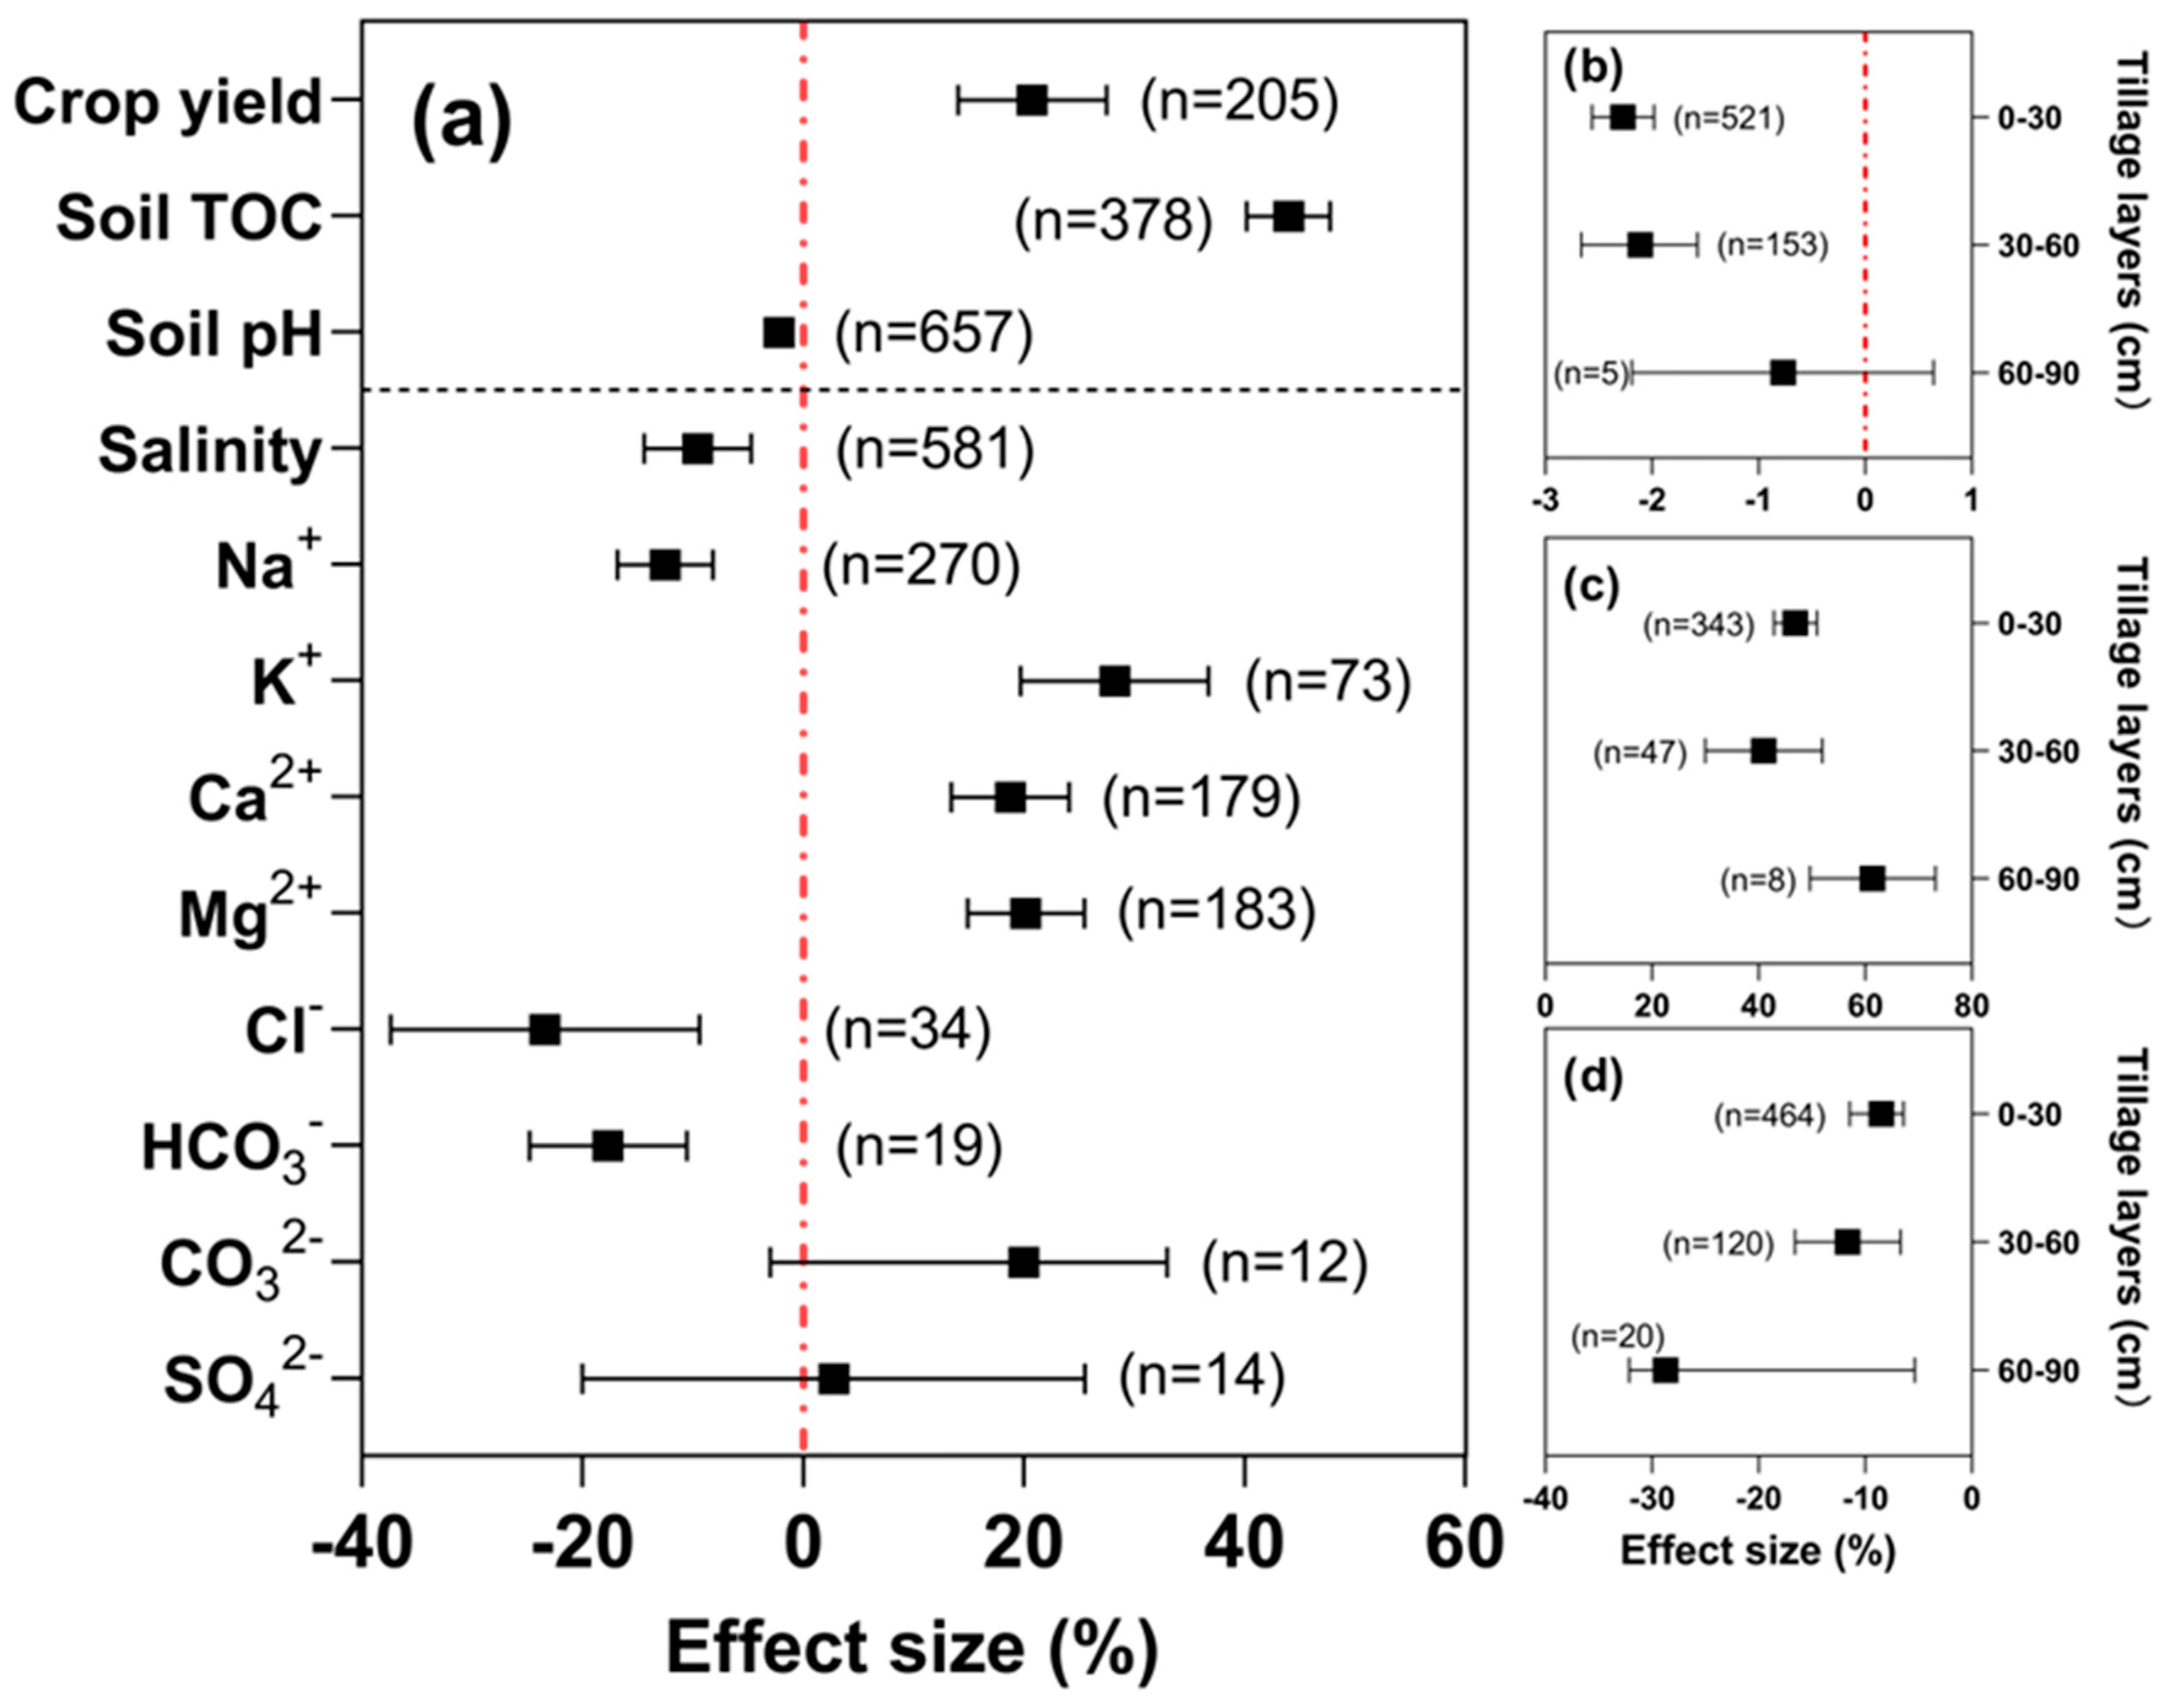
3.1. Dataset Overview

A total of 113 published papers from 11 countries were included in this meta-analysis (Figure 3). They contained 205 comparative crop yield observations, 378 comparative soil organic carbon observations, 657 comparative soil pH observations, 581 comparative soil salinity observations, 784 comparative soil salt ion (Na+, K+, Mg2+, Ca2+, Cl, HCO3, CO32−, SO42−) observations, 250 comparative soil greenhouse gas (CO2, CH4, N2O) emissions observations, and 266 comparative water utilization efficiency observations. The majority of these studies (76%, 88/113) were conducted in China. The remainder (24%) consisted of six each from Egypt and Iran, three each from Australia, Pakistan, and the United States, two from Mexico, and one each from Argentina, Bolivia, Japan, and Saudi Arabia, amounting to 25 of the 113 studies.
Evidently, biochar input significantly increased both the crop yield and the TOC content of soil in the root zone by 20.8% and 44.0%, respectively (Figure 4a); conversely, soil pH and salt in the root zone decreased by 2.2% and 9.6%, respectively. In response to biochar input, the Na+, Cl, and HCO3 concentrations decreased by 12.5%, 23.4%, and 17.7%, respectively; however, the concentrations of K+, Mg2+, and Ca2+ increased by 28.2%, 20.2%, and 18.8%, respectively. Although CO32− and SO42− showed trends of increasing with biochar input, their response ratios (95% CI) overlapped the zero line, suggesting that adding biochar did not significantly influence CO32− or SO42−.
As indicated, soil pH decreased by 2.3% at 0–30 cm and −2.1% at 30–60 cm, but biochar input did not significantly influence soil pH in the deepest soil layer (at 60–90 cm) (Figure 4b). In contrast, biochar input had the greatest effect (61.4%) on increasing TOC in soil at 60–90 cm, and the least impact on it at 30–60 cm; in between, TOC content increased by 46.9% in soil at 0–30 cm (Figure 4c). With increasing soil depth, biochar input had a stronger effect on reducing soil salinity, in that salt contents in soil at 60–90 cm fell by 28.7%, while those at 0–30 cm and 30–60 cm decreased by only 8.5% and 11.6%, respectively (Figure 4d).

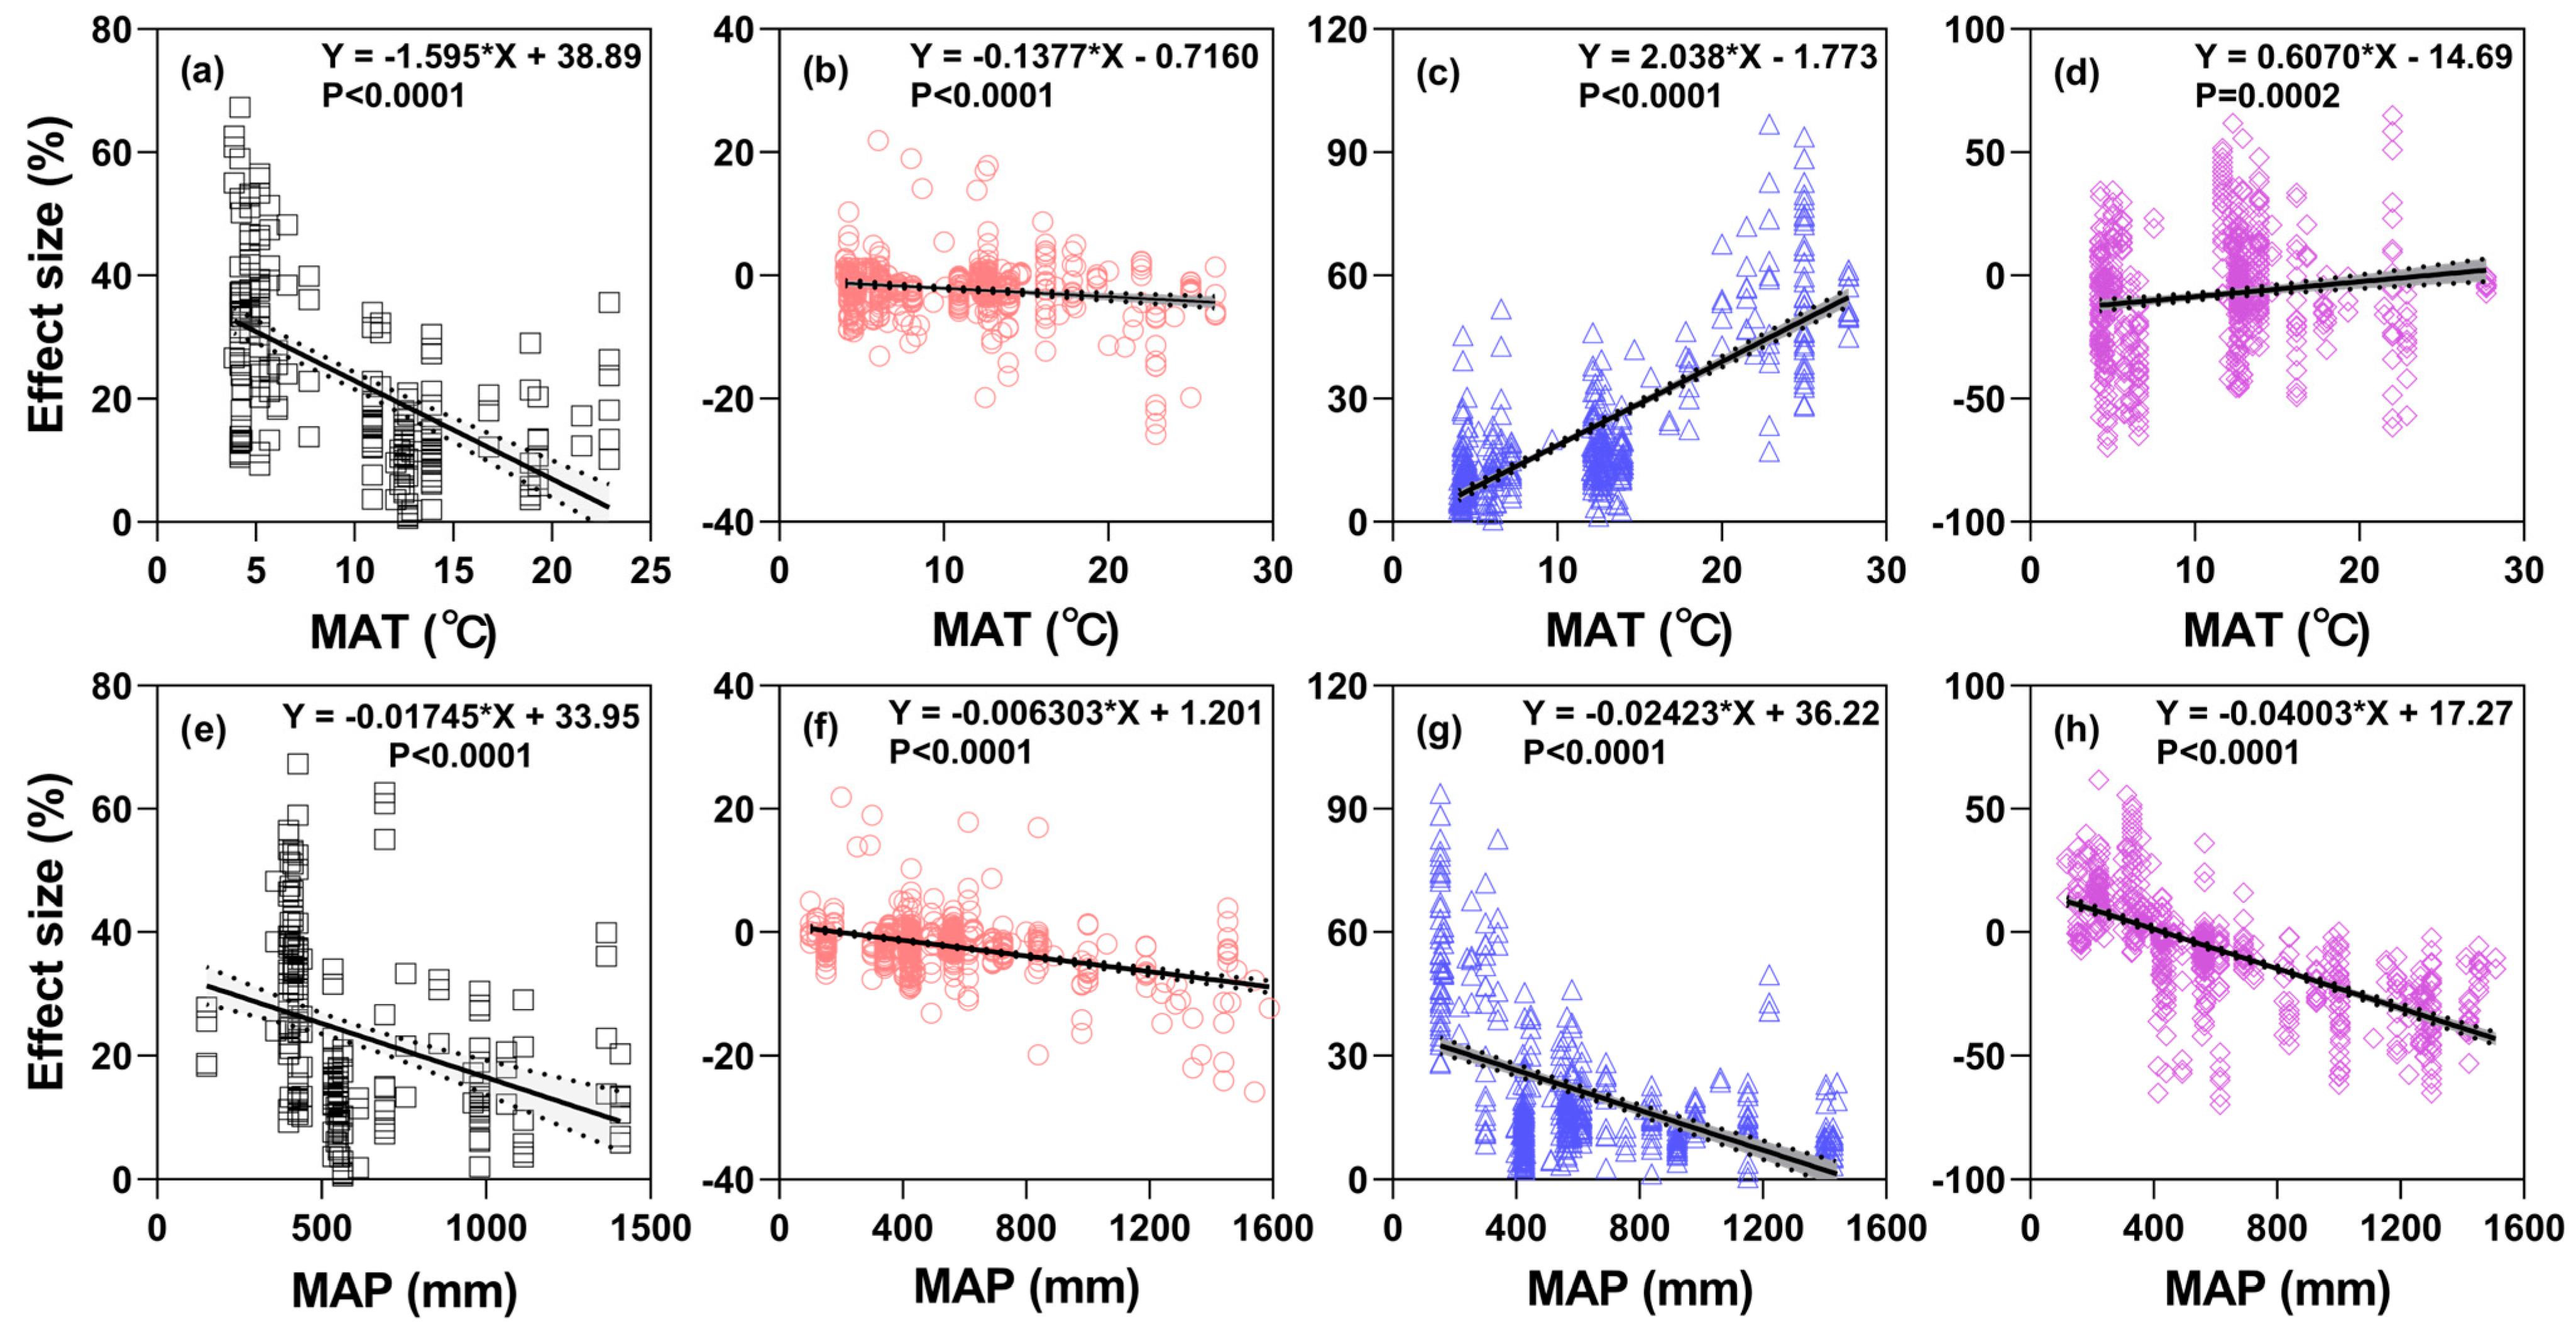
3.2. Climatic Conditions

With a higher MAT, the effect ratio for the crop yield tended to decrease (Figure 5a–d). At a MAT ≤ 10 °C, the positive effect ratio for crop yield was maximal (33.8%), but when the MAT rose to 10–15 °C, it was only 8.6%; however, the effect ratio for increased crop yield rebounded to 25.1% at a MAT ≥ 15 °C. With respect to MAP (Figure 5e,f), its positive effect ratio for crop yield peaked at 400–800 mm, such that a decrease or increase in MAP could result in a diminished yield. This effect ratio decreased to 19.4% at a MAP ≤ 400 mm, while biochar input had no significant influence on crop yield at a MAP ≥ 800 mm.
The effect ratio for soil pH was negative across all levels of MAT or MAP, while that for TOC was always positive and did not bisect the zero line. As MAT or MAP increased, the decline in soil pH intensified, being most pronounced at MAT ≥ 15 °C and MAP ≥ 800 mm, with reductions of 2.1% and 2.3%, respectively. As MAT increased, the effect ratio for the soil’s TOC content increased, peaking at 66.9% at a MAT ≥ 15 °C. When the MAT fell to ≤10 °C, the effect ratio was only 24.1%. This pattern differed from the effect ratio of TOC across the MAP range, where it was greatest (49.9%) at the lowest level (MAP ≤ 400 mm) and fell to 41.7–42.6% at a MAP > 400 mm. The corresponding ratios (95% CI) of soil salinity for biochar input intersected with the zero line when the MAT was 10–15 °C and at an MAP ≤ 400 mm, suggesting that biochar input had no significant influence on soil salinity under these conditions. Lastly, at a MAT ≤ 10 °C or MAT ≥ 15 °C, soil salinity decreased by 19.9% or 14.7%, respectively; at a MAP > 400 mm, soil salinity was reduced by 12.4%.
To determine how the response of a given target variable changes with MAP and MAT, linear regression models were fitted (Figure 6a–h). With increasing MAT and MAP, there was a decline in biochar’s effect on crop yield increase, while its effect on soil pH decreased gradually. In contrast, soil TOC and salinity exhibited consistent trends vis-à-vis MAT and MAP. A higher MAT led to biochar having a larger effect on the increase in soil TOC or salinity, but a gradually smaller effect on both variables under greater MAP.

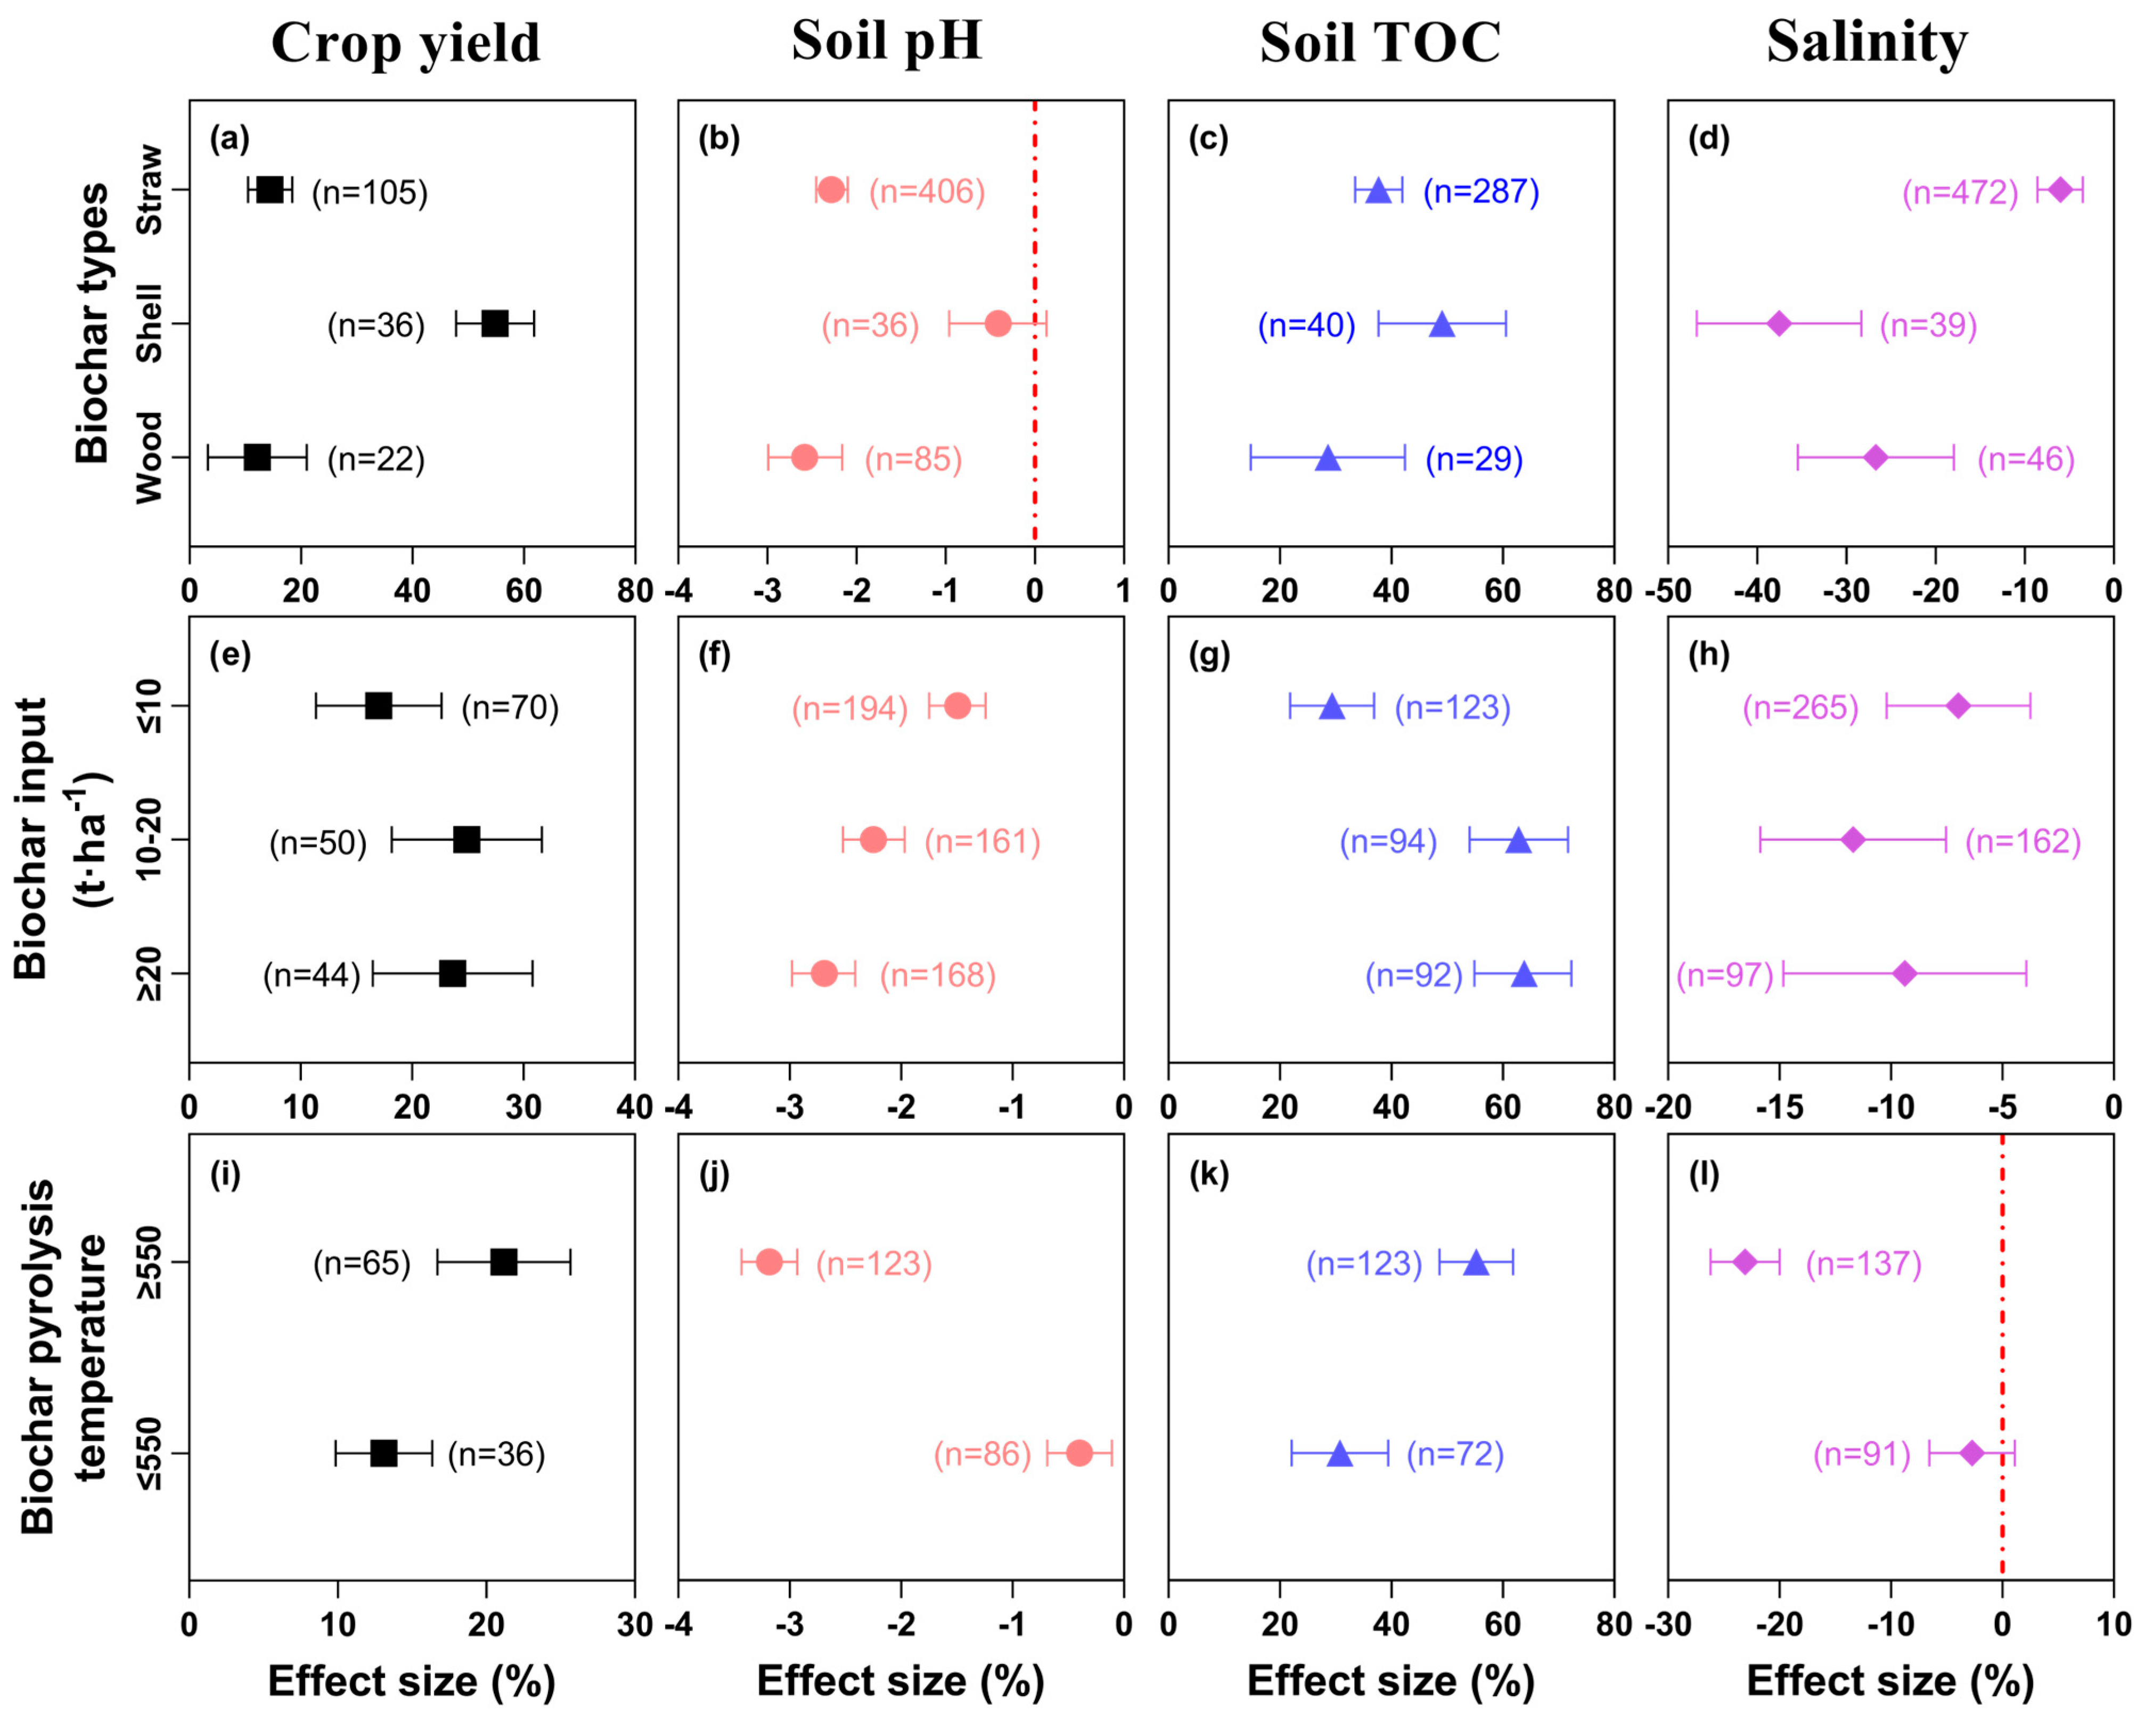
3.3. Biochar Application: Type and Amount

The use of shell biochar (e.g., peanut and hazelnut shells) led to the greatest improvement in crop yield and the soil’s TOC content (54.8% and 49.1%, respectively) and had the most significant negative effect on soil salinity (−37.5%) (Figure 7a–d). Yet, shell biochar was less effective than straw (e.g., corn straw, rice straw) or wood (e.g., wood chips, bamboo charcoal) at lowering the pH of saline-alkali soil; however, straw and wood biochar only reduced the soil pH by 2.3% and 2.6%, respectively, while shell biochar reduced it by 0.4%, albeit not significantly (since this response ratio crossed the zero line). Compared with woody biochar, straw biochar elicited a similar crop yield response, but it was better at promoting the TOC content of saline-alkali soil, increasing it by 5.12%. However, the 6% reduction in soil salinity by straw biochar was not as strong as the 26.7% reduction observed with woody biochar.
When the biochar applied increased from ≤10 t ha−1 to 10–20 t ha−1, the crop yield and TOC content rose 7.9% and 33.5%, respectively, and soil salinity fell by the greatest magnitude (11.7%) (Figure 7e–h). However, adding more biochar, that is ≥20 t ha−1, led to a 13% lower crop yield, a 1% increase in the soil’s TOC content, and a weaker 2.3% reduction in soil salinity. In contrast, soil pH was incrementally reduced after adding greater amounts of biochar.
Biochar produced at different pyrolysis temperatures showed divergent effects on saline-alkali soil and crop yield (Figure 7i–l). When compared to low-temperature biochar (pyrolysis temperature ≤ 550 °C), high-temperature biochar (pyrolysis temperature ≥ 550 °C) was more effective at lowering both soil pH and salinity. Our analysis showed that the effects of high-temperature biochar on reducing soil pH and salinity were –3.2% and –23.1%, respectively, while low-temperature biochar only achieved effect sizes of –0.4% and –2.7%. Additionally, the responses in crop yield and soil TOC increase were greater for high-temperature biochar (21.2% and 55.2%) than for low-temperature biochar (13.1% and 30.8%).

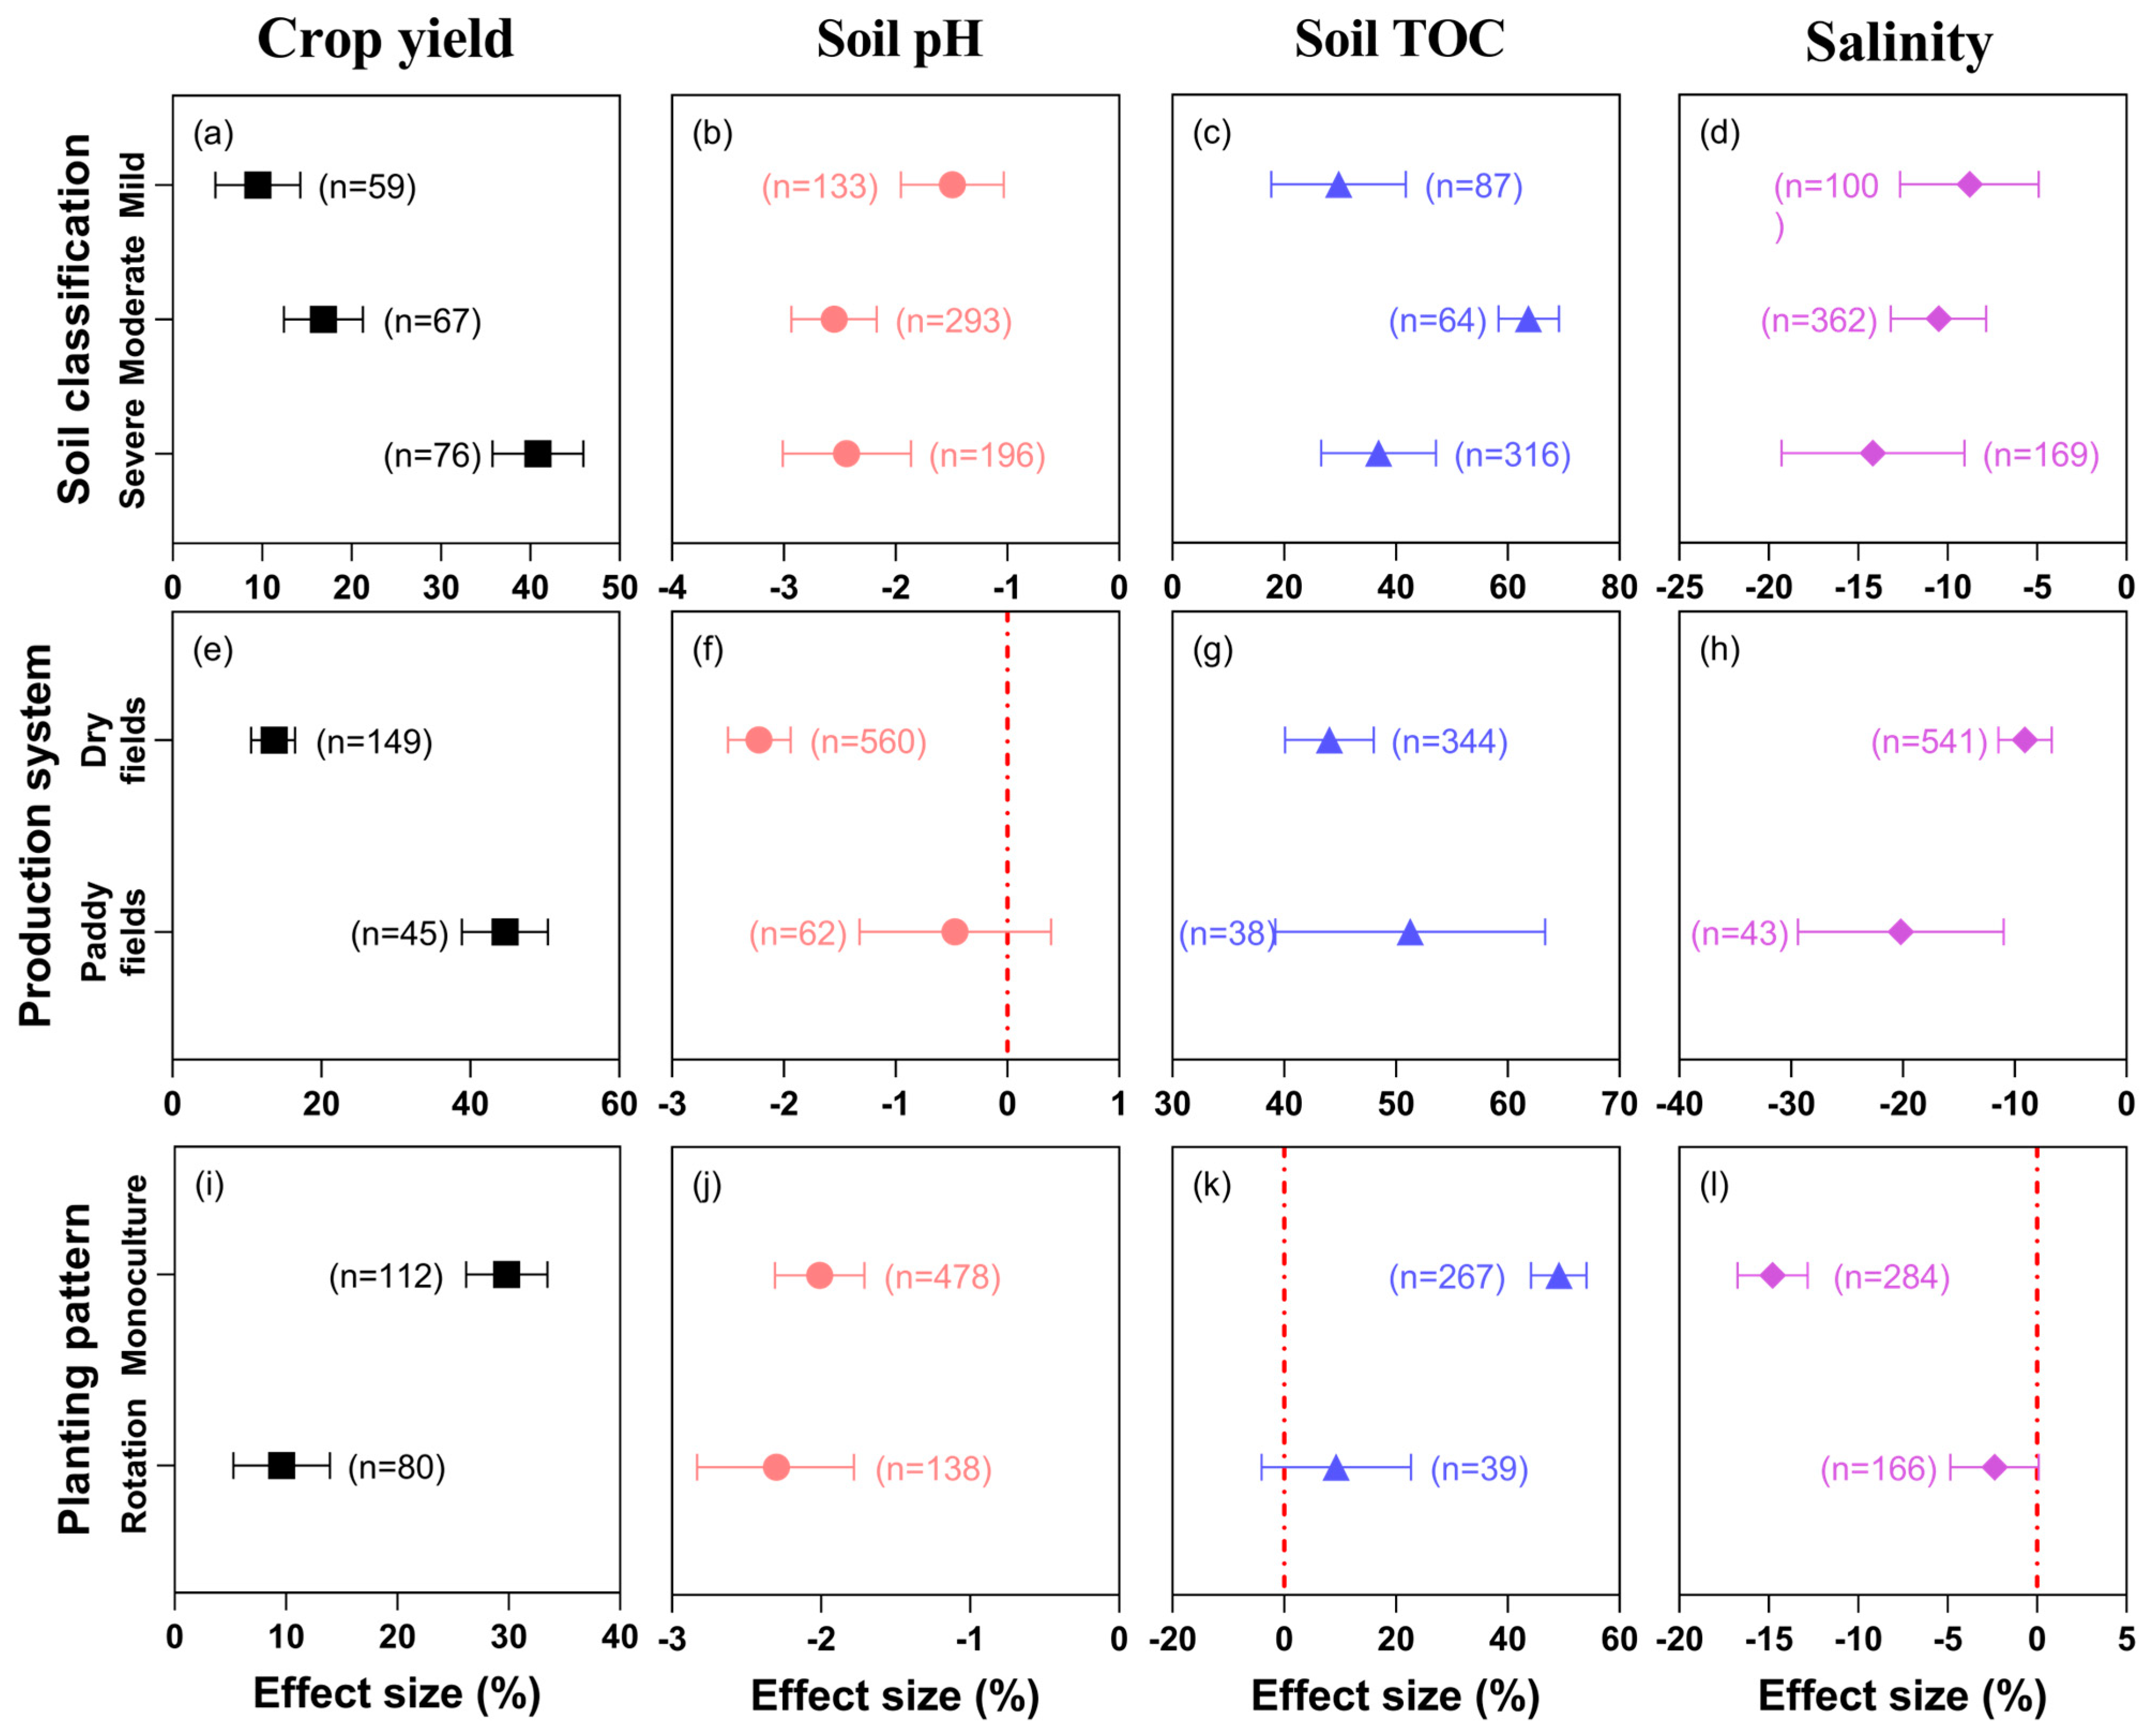
3.4. Soil Classification, Production System, and Planting Pattern

When applied to mild saline-alkali soil, biochar had the smallest positive effect on crop yield and soil TOC content (9.5% and 29.7%, respectively), and likewise, the reduction in soil pH and salt content was weakest (1.5% and 8.8%, respectively) (Figure 8a–d). In moderately saline-alkali soil, the application of biochar had the best effect on increasing the soil’s TOC and decreasing its pH, increasing the former by 63.7% and the latter by 2.6%. In stark contrast, the crop yield increased by 40.9% and soil salinity decreased by 14.2% after biochar was added to severely saline-alkali soil.
The application of biochar to saline-alkali soil in dry farmland and irrigated farmland led to significantly different outcomes in the response variables, especially crop yield and TOC (Figure 8e–h). When applied in dry farmland, biochar increased both crop yield and soil’s TOC content by 13.7% and 44.1%, but did so to a greater degree in irrigated farmland (by 44.7% and 51.7%) resulting in an absolute difference of 31.0% and 7.6%, respectively. There was a stronger reduction effect on soil salinity in irrigated farmland (−20.2%) than in dry farmland, with an absolute difference of 11.1%. Nevertheless, the pH reduction of saline-alkali soil was better in dry farmland (−2.2%) than in irrigated farmland (−0.5%), neither of which was significant.
Crop yield and TOC content of soil were both significantly increased by biochar application under a monoculture mode, by 29.8% and 49.2%, respectively (Figure 8i–l). This was greater than the corresponding 9.6% and 9.3% increases in the crop production rotation mode. The response ratio of soil salinity was −14.8% under the monoculture mode, but only −2.4% under the rotation mode. Compared with the monoculture setting, applying biochar under the rotation mode was slightly more effective at reducing the pH of saline-alkali soil, decreasing it by 2.3% versus 2.0%.
In the analysis of variance of a target response variable by subgroups (i.e., soil classification, biochar type, and planting pattern) (Table 2), soil classification and biochar type had highly significant effects on crop yield (p < 0.01), while planting pattern only significantly affected the soil TOC response (p < 0.05). With the exception of soil pH, soil classification, biochar type, and planting pattern all had significant interactions vis-à-vis the other three target variables.

3.5. Water Use Efficiency and Greenhouse Gas Emissions

Water use efficiency increased by 8.7% after the application of biochar to saline-alkali farmland; the emissions of CO2 and CH4 greenhouse gases rose by 9.8% and 31.6%; however, the emission of N2O fell by 29.4% (Table 3).

3.6. Crop Types and Variable Importance

The yield of rice, soybean, and sorghum increased the most, by more than 20.0%; that of peanut, corn, and cotton rose by more than 10.0%; and wheat had the smallest increase in yield, increasing by 8.9% (Figure 9a). Here, we used the random forest model to derive a variable importance (contribution) ranking to gauge how strongly each factor (driver) influenced the overall crop yield (Figure 9b). As indicated, climatic conditions (MAT and MAP) ranked first and third among the candidate influencing factors, with a cumulative impact of 30.6%. Agricultural practices had a cumulative impact of 43.0%, with the greatest impact for biochar input at 16.0%, whereas planting pattern had the lowest impact at 5.3%, with the remainder having a respective impact of 7.0–7.7%. Among the soil factors, their impact was ranked as salt > TOC > pH.

3.7. SEM Analysis

Structural equation modeling (SEM) was used to quantify the relationships between the TOC content, salinity, and pH of soil and water utilization efficiency after biochar input, and to infer the main ways and means by which biochar input affects crop yield (Figure 10). The loading coefficient for biochar input’s direct effect on crop yield was 0.39, indicating that biochar was positively correlated with yield. The other two pathways by which biochar affects crop yield are by increasing the TOC content of the soil and the water utilization efficiency, which together augment the crop yield. The loading coefficients of soil salinity and pH on crop yield are −0.41 and −0.28, respectively, demonstrating that soil salinity and pH are negatively correlated with crop yield. However, biochar input significantly lowers the salt content and pH of soil, with respective loading coefficients of −0.42 and −0.23, thus alleviating the adverse impact of both on crop yield. In addition, soil salinity was significantly negatively correlated with both the TOC content of soil and water utilization efficiency, but its correlation with soil pH was positive and significant, as was that with water utilization efficiency. Hence, with the salt content and soil pH reduced in tandem, the crop yield ultimately increases.

4. Discussion

4.1. The Overall Impact of Adding Biochar to Saline-Alkali Soils

Maintaining an appropriate soil pH is crucial for ensuring normal plant growth. When the soil pH is too high, the absorption capacity of the roots can be restricted, leading to slow growth and poor development of plants [25]. Some studies suggest that biochar does not reduce soil pH in saline-alkali lands, which is attributed to the alkaline metal ions and carbonates released from biochar [26]. However, our meta-analysis results demonstrate that, globally, the pH of saline-alkali soil decreases by 2.2% and its Na+ content decreases by 12.5% after the application of biochar. This is because the high pH of saline-alkali soil is related to its ESP (sodium salt), so that as biochar reduces the ESP, the pH will also decline [27]. Additionally, biochar contains inorganic components, such as K+, Ca2+, Mg2+, and other ions, which interact with exchangeable Na+ in saline-alkali soil to reduce the content of soluble Na+ and its relative proportion, thereby lowering the pH and ESP of saline-alkali soil [28,29]. This may explain the increase in K+, Ca2+, and Mg2+ contents found in this meta-analysis. According to one study, as the pyrolysis temperature increases, the ash content of biochar also increases, and its alkalinity strengthens [30]. In contrast, biochar produced at low temperatures (<500 °C) tends to be neutral or slightly alkaline, making it more suitable for reducing the pH of saline-alkaline soils [31]. However, the meta-analysis results presented here suggest that high-temperature biochar has greater efficacy in reducing the pH of saline-alkaline soils. High-temperature biochar contains a greater amount of oxidized functional groups, such as carboxyl and phenolic hydroxyl groups, which can react with acidic ions, thus lowering the pH of the soil [32].
Saline-alkali soils are easily identified by their elevated salinity and high EC, both of which are attributable to the accumulation of significant quantities of salts. Accordingly, reducing the soil’s soluble salt content and alleviating the saline stress incurred by soil biota to restore soil ecological functions have remained central goals in the remediation of saline-alkali land. Mounting studies have begun to focus on biochar’s ameliorative effects on saline-alkali soil, with some research indicating that its addition can reduce the salt content of that soil by as much as 51.0% [33,34,35]. Nevertheless, the meta-analysis results of our study show that soil salinity was only reduced by 9.6%. This is because among the 113 references included in this paper, some studies found that applying biochar could lead to greater soil salinity in saline-alkali land, with the direct input of salt ions being a primary factor underpinning its negative effects [36]. The salt ions adsorbed by biochar may be gradually released back into the soil over time as biochar’s adsorption capacity weakens, causing a reversal in its soil improvement results [37].
Biochar, as an organic carbon-rich soil amendment, has an arguably pivotal role to play in carbon sequestration by saline-alkaline soils and in mitigating greenhouse gas emissions [38,39]. The present study shows that the addition of biochar increases the soil organic carbon content by 44%. For greenhouse gases, only N2O emissions decreased, while CO2 and CH4 emissions increased by 1.6% to 38.5%. These results can be explained by the two mechanisms involved when biochar enters the soil: augmented carbon sequestration and enhanced carbon emissions (CO2 and CH4) [40]. However, whether there is a net carbon sequestration effect depends on which of these two mechanisms prevails. The carbon sequestration mechanism mainly involves three aspects. Biochar itself harbors a high proportion of resistant carbon, which is apt to be stored for a long timespan in soil, forming an enduring foundation for carbon sequestration [41]. Biochar is typically alkaline, and its addition to saline-alkali soil can increase the soil pH [42]. This increase in soil pH may then affect the activity and community structure of soil microorganisms, thereby influencing the production and emission of greenhouse gases [43]. Adding biochar may also accelerate the decomposition rate of soil organic matter, leading to higher CO2 emissions [44]. Further, certain properties of biochar (such as its functional groups and stability) may affect the methane oxidation capacity of soil microorganisms, thereby influencing methane emissions [45]. Biochar’s expanded specific surface area enables it to adsorb organic or inorganic substances in soil containing carbon and nitrogen, to form more stable organic-inorganic complexes and other structures, thereby slowing the decomposition and release of carbon [46]. Finally, by regulating soil properties, inhibiting microbial activity, and reducing enzyme activity, biochar can influence both the soil carbon and nitrogen cycles. This, in turn, can modulate the dynamics of soil respiration, nitrification, and denitrification processes, leading to lower N2O emissions but greater CO2 and CH4 emissions [47].
The abundance of microorganisms and enzyme activity in saline-alkali soils is markedly lower than that in normal soils [48]. Studies have shown that because of its extensive surface area, porous structure, and rich organic matter containing vital nutrients ( N, P, and K), biochar can not only enhance the availability of soil inorganic nutrients and soluble organic matter but also reduce its salt content and alleviate salt stress, thus increasing both microbial abundance and enzyme activity [13,49]. However, due to differences in how it is made (its raw materials and processes for preparation), there is a pronounced variation in the pH and nutrient content of biochar. Research findings indicate that high-temperature biochar (>550 °C) contains fewer toxic functional groups, namely carboxylic acids, phenols, and amines, which promotes a shift in soil microbial community composition toward dominance by beneficial taxa like Proteobacteria and Bacteroidetes [30]. Additionally, the type and application rate of biochar can alter the activity of soil enzymes, such as sucrase, urease, and phosphatase. For example, peanut shell biochar or reed biochar can enhance the activity of sucrase in coastal saline-alkaline soils of the Yellow River Delta while inhibiting the activity of urease [50]. Biochar’s application rate can also impact soil enzyme activity. When applied at less than 20 t·ha−1, the increase in soil enzyme activity is relatively rapid; however, when the rate exceeds 20 t·ha−1, there is a slower enhancement of soil enzyme activity [51].

4.2. The Role of Climatic Conditions, Soil Conditions, and Agricultural Management Practices

The effect of biochar on saline-alkali soil depends immensely on climatic conditions, soil conditions, and agricultural management practices. Among these, the mean annual temperature (MAT), mean annual precipitation (MAP), soil texture, biochar application rate and type, and cropping methods can all significantly influence the effects of field biochar on saline-alkali soil and its crop yield (Figure 6, Figure 7, Figure 8 and Figure 9). In particular, MAT, MAP, and the application rate of biochar are key environmental driving factors affecting the yield of various crops (Figure 9b). According to our meta-analysis, as the MAT rises, the TOC content also tends to increase in tandem with more biochar added, but not so with a higher MAP. A higher temperature and the accompanying increase in soil temperature can spur greater soil microbial activity, thereby hastening litter decomposition [52]. However, when precipitation is relatively high, the increase in precipitation and water content of saline-alkali soil may affect soil respiration, leading to less TOC in soil [53]. Notably, we found that under crop rotation conditions, biochar’s addition to saline-alkali soil resulted in a lower increase in TOC compared to its effect in monoculture. This could be due to the higher soil nitrogen content under crop rotation with legumes, inevitably resulting in a lower C:N ratio in soil vis-à-vis the monoculture mode [54]. It is well known that the TOC content is positively related to the C:N ratio in soil, consistent with the latter being a key indicator affecting microbial and metabolic activity; correspondingly, a smaller C:N ratio implies less microbial decomposition of organic carbon in soil [55].
As our meta-analysis results show, adding biochar can reduce the salinity of saline-alkali soil, but this reduction effect is weaker when it is applied in amounts greater than 10 t·ha−1. One study applied 2.0% acidic woody biochar, resulting in a salt content of 1.5% [56]. This is because biochar input can replace the excess exchangeable sodium in saline-alkali soil by increasing the amount of organic carbon and cations in the soil, while also decreasing the sodium salts therein by increasing the soil’s porosity and water-holding capacity; collectively, this lowers the salt content in the surface layer of saline-alkali soil [36]. We also found that with greater soil depth, biochar is more effective at mitigating soil salinity. Hence, we suggest that the 0–30 cm layer of saline-alkali soil is more likely to cause the aggregation phenomenon of base cations, and due to their differing migration rates, the depths of different ionic salt aggregation layers will likely differ; in this process, all base cations would aggregate in the surface layer. However, due to high evaporation and wasteful irrigation in most saline-alkali soil zones, base cations in deeper soil (30–90 cm) enter the surface layer (0–30 cm) with the evaporation of soil moisture, which weakens the reduction effect of biochar on salt content in that surface layer [57].
The application of biochar is able to promote the growth of plants by improving the rhizosphere environment of saline-alkali soil, thereby ameliorating the negative effects of excessive salt on plants [58]. Here, the effects of MAT and MAP on yield were quite pronounced, with the highest yield response values obtained at MAT ≤ 10 °C and a MAP of 400–800 mm. Crucially, the effect of biochar addition on yield enhancement was diminished by excessive or insufficient MAT and MAP. This is because higher temperatures can accelerate transpiration in crop plants, so that water evaporates too quickly from the crop field, but the saline-alkali soil cannot supply enough water to replenish that due its weaker insulation and water-retention capacity, which leads to drought and ultimately constrains the crop’s growth [59]. Low MAP can lead to soil drying and cracking and the inhibition of root growth, resulting in an insufficient supply of water, nutrients, and microorganisms. This lack of water can cause the rapid withering of crop leaves, limiting their photosynthesis, and thereby impairing the plant’s nutrient uptake and growth dynamics [60]. Due to the weak water infiltration capacity of saline-alkali soil, excessive MAP can cause rainwater to accumulate on its surface layer or on the ground surface. If rainwater is not drained in time, saline-alkali farmland is prone to excess water accumulation, resulting in an oxygen deficit and root rot, which adversely affect the growth of crops [61].
The cumulative relative impact of salinity, TOC content, and pH of soil on crop yield was 26.4%. Biochar input increases the TOC content of soil, enhances water utilization efficiency, and decreases the soil’s salt content and pH, culminating in an augmented crop yield. This suggests that biochar improves the physicochemical properties of saline-alkali soil and can directly or indirectly alleviate the stress to plants by enhancing the water utilization efficiency and water-holding capacity, rendering the soil conducive to their growth, while tempering plants’ oxidative stress response and the production of phytohormones (such as abscisic acid) [62]. Moreover, biochar can provide nutrients for plant growth, increase the content of organic carbon and mineral nutrients in soil, and bolster the effectiveness of soil nutrients [63]. Indeed, when applied to saline-alkali soil, biochar releases its own K+, Mg2+, and Ca2+ that reduces Na+ uptake by plants, alleviating oxidative stress in spinach and shepherd’s purse under saline-alkali stress conditions. As reported, biochar’s application raises the K+ content of soil, enhances the K+/Na+ ratio of peanut plants, reduces their uptake of Na+, and improves their stress tolerance [64].

4.3. The Economic Feasibility of Biochar

To date, researchers have analyzed the application costs and economic benefits of biochar in several areas, such as soil improvement, environmental remediation, and greenhouse gas reduction. However, the economic performance of biochar displays a loss-making pattern [65,66]. For example, one study evaluated the costs and benefits of using biochar in grain production systems in Western Europe and Sub-Saharan Africa. Due to high labor costs and high pyrolysis costs in Northwestern Europe, the application cost of biochar (3365 USD·ha−1) was higher there than in sub-Saharan Africa (1187–1978 USD·ha−1). Even after considering the potential future rise in grain prices, it remains unlikely that biochar will become profitable in that region via increased grain yields alone [67]. Generally, the recommended application rate of ordinary biochar is 10–20 t·ha−1, while that of acid-modified biochar may be lower, around 5–10 t·ha−1, given its better improvement effects [68]. The cost of acid-modified biochar typically exceeds that of ordinary biochar due to the required additional acid treatment process, and can range from USD300 to USD500 per ton [69]. Therefore, in the global context of aiming for carbon neutrality, it is important to focus on developing the carbon sequestration value of biochar. By integrating advances in engineering biochar technology, we can augment the agronomic and carbon sequestration benefits of biochar amendments [70].
While biochar has many advantages, the diversity and severity of saline-alkali soils have led to an increasing demand for its use in soil remediation. In this context, the limitations of biochar as a saline-alkali soil conditioner in the future and outstanding issues to be resolved can be summarized as follows: (1) Different soil textures have different biochar requirements; therefore, the proper selection of a suitable biochar type for specific saline-alkali soil conditions and plant growth is imperative. Analyzing the relationship between different biochar-soil-soil remediation effects and conducting the pre-planned targeted preparation of biochar should be the foci of future research on biochar-mediated improvement of saline-alkali soil. (2) The potential mechanisms underpinning the beneficial effects of biochar on plant growth in saline-alkali soils are very complex. Arguably, more in-depth experimental studies are needed to analyze the interactions and mechanisms between biochar and the soil–plant–microbial system in a range of saline-alkali environments. (3) Research on the effects and impacts of applying biochar in combination with different tree species to saline-alkali soil for its remediation should be expanded, and the interactions and mechanisms between biochar and woody plants in saline-alkali soil types should be further clarified. (4) The potential pollution risks and ecological changes associated with biochar usage in soil remediation strategies merit special attention. The raw materials and preparation of biochar may generate toxic substances. In this respect, it is crucial to conduct long-term experiments and broaden the scope of toxicity testing of biochar products, with further analysis of their underlying mechanisms. (5) Currently, most studies have been conducted using pots or small-scale experimental fields. We must expand the scale of inquiry and testing and seek to determine whether the alkaline characteristics of biochar will cause a secondary phase of salinization after a few years.

5. Conclusions

By analyzing 3121 sets of data gleaned from 113 studies, this meta-analysis revealed that adding biochar to saline-alkali farmland increases both the soil content of TOC and water utilization efficiency, reduces overall soil salinity and decreases the content of major salt ions, and lowers soil pH, which ultimately increases the yield of crops. In the context of suitable biochar addition to saline-alkali farmland, the optimal strategy for applying biochar based on this study’s scope is as follows: under the climatic conditions of a MAT ≤ 10 °C and a MAP of 400–800 mm, ideally, shell biochar should be applied at a rate of 10–20 t ha−1 to severely saline-alkali irrigated farmland under monoculture to effectively increase their crop yield while reducing the risk of saline-alkali soil deterioration. Further, the cultivation of rice, soybean, and sorghum on saline-alkali farmland supplemented with biochar has excellent practical prospects for augmenting crop yields and ensuring the long-term sustainability of cropping patterns.

Supplementary Materials

The following supporting information can be downloaded at: https://www.mdpi.com/article/10.3390/agriculture15050561/s1, Supplementary Materials—literature statistics.

Author Contributions

Investigation, Y.F., Z.C. and J.Y.; Writing—original draft preparation, L.Z. and B.B.; Writing—review and editing, L.Z. and Q.L.; Visualization, L.Z. and H.W.; Supervision, Q.L. and J.C. All authors have read and agreed to the published version of the manuscript.

Funding

This work was supported by the National Key Research and Development Program Project (2023YFD1501104) and the Science and Technology Development Plan of Jilin Province, China (20230302003NC) (Funder: Jinhu Cui).

Data Availability Statement

The datasets generated and analyzed in the current study are available from the corresponding author upon reasonable request.

Acknowledgments

We wish to thank Wuliang Shi, Bin Li, Yubin Zhang, for valuable and encouraging discussions.

Conflicts of Interest

The authors declare no conflicts of interest.

References

  1. Shrivastava, P.; Kumar, R. Soil salinity: A serious environmental issue and plant growth promoting bacteria as one of the tools for its alleviation. Saudi J. Biol. Sci. 2015, 22, 123–131. [Google Scholar] [CrossRef]
  2. Ivushkin, K.; Bartholomeus, H.; Bregt, A.K.; Pulatov, A.; Kempen, B.; de Sousa, L. Global mapping of soil salinity change. Remote Sens. Environ. 2019, 231, 111260. [Google Scholar] [CrossRef]
  3. Gao, H.; Fu, T.G.; Wang, F.; Zhang, M.; Qi, F.; Liu, J.T. Influence of groundwater table depth on the evolution of saline-alkali land in a coastal area. Land Degrad. Dev. 2024, 35, 2857–2866. [Google Scholar] [CrossRef]
  4. Gopinath, K.P.; Vo, D.V.N.; Prakash, D.G.; Joseph, A.A.; Viswanathan, S.; Arun, J. Environmental applications of carbon-based materials: A review. Environ. Chem. Lett. 2021, 19, 557–582. [Google Scholar] [CrossRef]
  5. Oliveira, F.R.; Patel, A.K.; Jaisi, D.P.; Adhikari, S.; Lu, H.; Khanal, S.K. Environmental application of biochar: Current status and perspectives. Bioresour. Technol. 2017, 246, 110–122. [Google Scholar] [CrossRef] [PubMed]
  6. Zhang, C.; Zeng, G.M.; Huang, D.L.; Lai, C.; Chen, M.; Cheng, M.; Tang, W.W.; Tang, L.; Dong, H.R.; Huang, B.B.; et al. Biochar for environmental management: Mitigating greenhouse gas emissions, contaminant treatment, and potential negative impacts. Chem. Eng. J. 2019, 373, 902–922. [Google Scholar] [CrossRef]
  7. Si, T.R.; Chen, X.; Yuan, R.; Pan, S.Y.; Wang, Y.; Bian, R.J.; Liu, X.Y.; Zhang, X.H.; Joseph, S.; Li, L.Q.; et al. Iron-modified biochars and their aging reduce soil cadmium mobility and inhibit rice cadmium uptake by promoting soil iron redox cycling. J. Environ. Manag. 2024, 370, 122848. [Google Scholar] [CrossRef]
  8. Thauront, J.L.; Soja, G.; Schmidt, H.P.; Abiven, S. A critical re-analysis of biochar properties prediction from production parameters and elemental analysis. GCB Bioenergy 2024, 16, e13170. [Google Scholar] [CrossRef]
  9. Mounissamy, V.C.; Chandrashekar, D.P.; Adhikari, T.; Sarkar, A.; Lenka, S.; Selladurai, R.; Yadav, D.K.; Saha, M.; Meena, B.P.; Ajay; et al. Priming Effect of Pigeon Pea and Wood Biochar on Carbon Mineralization of Native Soil Organic Carbon and Applied Municipal Solid Waste Compost. BioResources 2024, 19, 7478–7492. [Google Scholar] [CrossRef]
  10. Bekchanova, M.; Kuppens, T.; Cuypers, A.; Jozefczak, M.; Malina, R. Biochar’s effect on the soil carbon cycle: A rapid review and meta-analysis. Biochar 2024, 6, 88. [Google Scholar] [CrossRef]
  11. Gross, A.; Bromm, T.; Polifka, S.; Fischer, D.; Glaser, B. Long-term biochar and soil organic carbon stability—Evidence from field experiments in Germany. Sci. Total Environ. 2024, 954, 176340. [Google Scholar] [CrossRef] [PubMed]
  12. Wang, X.J.; Zhu, Z.; Huang, N.; Wu, L.P.; Lu, T.P.; Hu, Z.J. Impacts of biochar amendment and straw incorporation on soil heterotrophic respiration and desorption of soil organic carbon. Geosci. Lett. 2023, 10, 38. [Google Scholar] [CrossRef]
  13. Thomas, S.C.; Ruan, R.Y.; Gale, N.V.; Gezahegn, S. Phytotoxicity and hormesis in common mobile organic compounds in leachates of wood-derived biochars. Biochar 2024, 6, 51. [Google Scholar] [CrossRef]
  14. Cayuela, M.L.; Jeffery, S.; van Zwieten, L. The molar H:Corg ratio of biochar is a key factor in mitigating N2O emissions from soil. Agric. Ecosyst. Environ. 2015, 202, 135–138. [Google Scholar] [CrossRef]
  15. Kaur, N.; Kieffer, C.; Ren, W.; Hui, D.F. How much is soil nitrous oxide emission reduced with biochar application? An evaluation of meta-analyses. GCB Bioenergy 2023, 15, 24–37. [Google Scholar] [CrossRef]
  16. Yang, S.; Hao, X.H.; Xu, Y.M.; Yang, J.J.; Su, D.R. Meta-Analysis of the Effect of Saline-Alkali Land Improvement and Utilization on Soil Organic Carbon. Life 2022, 12, 1870. [Google Scholar] [CrossRef]
  17. Fan, X.P.; Yin, C.; Yan, G.C.; Cui, P.Y.; Shen, Q.; Wang, Q.; Chen, H.; Zhang, N.; Ye, M.J.; Zhao, Y.H.; et al. The contrasting effects of N-(n-butyl) thiophosphoric triamide (NBPT) on N2O emissions in arable soils differing in pH are underlain by complex microbial mechanisms. Sci. Total Environ. 2018, 642, 155–167. [Google Scholar] [CrossRef]
  18. Mei, K.; Wang, Z.F.; Huang, H.; Zhang, C.; Shang, X.; Dahlgren, R.A.; Zhang, M.H.; Xia, F. Stimulation of N2O emission by conservation tillage management in agricultural lands: A meta-analysis. Soil Tillage Res. 2018, 182, 86–93. [Google Scholar] [CrossRef]
  19. Philibert, A.; Loyce, C.; Makowski, D. Assessment of the quality of meta-analysis in agronomy. Agric. Ecosyst. Environ. 2012, 148, 72–82. [Google Scholar] [CrossRef]
  20. Du, Y.Q.; Liu, X.F.; Zhang, L.; Zhou, W. Drip irrigation in agricultural saline-alkali land controls soil salinity and improves crop yield: Evidence from a global meta-analysis. Sci. Total Environ. 2023, 880, 163226. [Google Scholar] [CrossRef]
  21. Hedges, L.V.; Gurevitch, J.; Curtis, P.S. The meta-analysis of response ratios in experimental ecology. Ecology 1999, 80, 1150–1156. [Google Scholar] [CrossRef]
  22. Adu, M.O.; Yawson, D.O.; Armah, F.A.; Asare, P.A.; Frimpong, K.A. Meta-analysis of crop yields of full, deficit, and partial root-zone drying irrigation. Agric. Water Manag. 2018, 197, 79–90. [Google Scholar] [CrossRef]
  23. Yan, X.J.; Chen, X.H.; Ma, C.C.; Cai, Y.Y.; Cui, Z.L.; Chen, X.P.; Wu, L.Q.; Zhang, F.S. What are the key factors affecting maize yield response to and agronomic efficiency of phosphorus fertilizer in China? Field Crops Res. 2021, 270, 108221. [Google Scholar] [CrossRef]
  24. Zhang, L.Q.; Wang, Y.L.; Lou, Z.X.; Hsu, L.F.; Chen, D.; Piao, R.Z.; Zhao, H.Y.; Cui, Z.J. Meta-Analysis of Factors Affecting C-N Fractions and Yield of Paddy Soils by Total Straw Return and N Fertilizer Application. Agronomy 2022, 12, 3168. [Google Scholar] [CrossRef]
  25. Xin, J.L. Enhancing soil health to minimize cadmium accumulation in agro-products: The role of microorganisms, organic matter, and nutrients. Environ. Pollut. 2024, 348, 123890. [Google Scholar] [CrossRef] [PubMed]
  26. Zhang, Y.F.; Wang, J.M.; Feng, Y. The effects of biochar addition on soil physicochemical properties: A review. Catena 2021, 202, 105284. [Google Scholar] [CrossRef]
  27. Shaygan, M.; Reading, L.P.; Baumgartl, T. Effect of physical amendments on salt leaching characteristics for reclamation. Geoderma 2017, 292, 96–110. [Google Scholar] [CrossRef]
  28. Akhtar, S.S.; Andersen, M.N.; Liu, F.L. Residual effects of biochar on improving growth, physiology and yield of wheat under salt stress. Agric. Water Manag. 2015, 158, 61–68. [Google Scholar] [CrossRef]
  29. Zheng, H.; Wang, X.; Chen, L.; Wang, Z.Y.; Xia, Y.; Zhang, Y.P.; Wang, H.F.; Luo, X.X.; Xing, B.S. Enhanced growth of halophyte plants in biochar-amended coastal soil: Roles of nutrient availability and rhizosphere microbial modulation. Plant Cell Environ. 2018, 41, 517–532. [Google Scholar] [CrossRef]
  30. Tang, J.W.; Zhang, S.D.; Zhang, X.T.; Chen, J.H.; He, X.Y.; Zhang, Q.Z. Effects of pyrolysis temperature on soil-plant-microbe responses to Solidago canadensis L. -derived biochar in coastal saline -alkali soil. Sci. Total Environ. 2020, 731, 138938. [Google Scholar] [CrossRef]
  31. Hossain, M.K.; Strezov, V.; Chan, K.Y.; Ziolkowski, A.; Nelson, P.F. Influence of pyrolysis temperature on production and nutrient properties of wastewater sludge biochar. J. Environ. Manag. 2011, 92, 223–228. [Google Scholar] [CrossRef] [PubMed]
  32. Awad, Y.M.; Wang, J.Y.; Igalavithana, A.D.; Tsang, D.C.W.; Kim, K.H.; Lee, S.S.; Ok, Y.S. Biochar Effects on Rice Paddy: Meta-analysis. In Advances in Agronomy; Sparks, D.L., Ed.; Elsevier Academic Press Inc: San Diego, CA, USA, 2018; Volume 148, pp. 1–32. [Google Scholar]
  33. Islam, T.; Li, Y.L.; Cheng, H.F. Biochars and Engineered Biochars for Water and Soil Remediation: A Review. Sustainability 2021, 13, 9932. [Google Scholar] [CrossRef]
  34. Wu, Y.; Xu, G.; Shao, H.B. Furfural and its biochar improve the general properties of a saline soil. Solid Earth 2014, 5, 665–671. [Google Scholar] [CrossRef]
  35. Zhao, B.W.; Nan, X.J.; Xu, H.; Zhang, T.; Ma, F.F. Sulfate sorption on rape (Brassica campestris L.) straw biochar, loess soil and a biochar-soil mixture. J. Environ. Manag. 2017, 201, 309–314. [Google Scholar] [CrossRef]
  36. Yue, Y.; Guo, W.N.; Lin, Q.M.; Li, G.T.; Zhao, X.R. Improving salt leaching in a simulated saline soil column by three biochars derived from rice straw (Oryza sativa L.), sunflower straw (Helianthus annuus), and cow manure. J. Soil Water Conserv. 2016, 71, 467–475. [Google Scholar] [CrossRef]
  37. Wang, L.W.; O’Connor, D.; Rinklebe, J.; Ok, Y.S.; Tsang, D.C.W.; Shen, Z.T.; Hou, D.Y. Biochar Aging: Mechanisms, Physicochemical Changes, Assessment, And Implications for Field Applications. Environ. Sci. Technol. 2020, 54, 14797–14814. [Google Scholar] [CrossRef]
  38. Fungo, B.; Lehmann, J.; Kalbitz, K.; Tenywa, M.; Thiongo, M.; Neufeldt, H. Emissions intensity and carbon stocks of a tropical Ultisol after amendment with Tithonia green manure, urea and biochar. Field Crops Res. 2017, 209, 179–188. [Google Scholar] [CrossRef] [PubMed]
  39. Thers, H.; Djomo, S.N.; Elsgaard, L.; Knudsen, M.T. Biochar potentially mitigates greenhouse gas emissions from cultivation of oilseed rape for biodiesel. Sci. Total Environ. 2019, 671, 180–188. [Google Scholar] [CrossRef] [PubMed]
  40. Galan-Martin, A.; Contreras, M.D.; Romero, I.; Ruiz, E.; Bueno-Rodriguez, S.; Eliche-Quesada, D.; Castro-Galiano, E. The potential role of olive groves to deliver carbon dioxide removal in a carbon-neutral Europe: Opportunities and challenges. Renew. Sust. Energ. Rev. 2022, 165, 112609. [Google Scholar] [CrossRef]
  41. Mukherjee, A.; Lal, R. The biochar dilemma. Soil Res. 2014, 52, 217–230. [Google Scholar] [CrossRef]
  42. Wang, X.Y.; Lyu, J.; Zhu, H.; Shutes, B.; Xu, Y.Y.; Zhang, F.M. Reclaimed saline-alkali paddy field may be a hotspot of methane and ammonia emissions. Land Degrad. Dev. 2023, 34, 4869–4881. [Google Scholar] [CrossRef]
  43. Hu, M.; Qu, Z.Y.; Li, Y.; Xiong, Y.W.; Huang, G.H. Contrasting effects of different straw return modes on net ecosystem carbon budget and carbon footprint in saline-alkali arid farmland. Soil Tillage Res. 2024, 239, 106031. [Google Scholar] [CrossRef]
  44. Zhang, P.F.; Jiang, Z.W.; Wu, X.D.; Lu, Q.; Lin, Y.; Zhang, Y.Y.; Zhang, X.; Liu, Y.; Wang, S.Y.; Zang, S.Y. Effects of Biochar and Organic Additives on CO2 Emissions and the Microbial Community at Two Water Saturations in Saline-Alkaline Soil. Agronomy 2023, 13, 1745. [Google Scholar] [CrossRef]
  45. Wang, H.Y.; Chen, Y.Q.; Chen, L.; Liao, B.; Dai, Q.G.; Zhang, H.C.; Liao, P. Gypsum Application and Straw Incorporation Interact to Alleviate Methane Emissions in Coastal Saline-Alkali Rice Soils. J. Soil Sci. Plant Nutr. 2024, 24, 4398–4406. [Google Scholar] [CrossRef]
  46. Chen, M.M.; Zhang, S.R.; Liu, L.; Liu, J.G.; Ding, X.D. Organic fertilization increased soil organic carbon stability and sequestration by improving aggregate stability and iron oxide transformation in saline-alkaline soil. Plant Soil 2022, 474, 233–249. [Google Scholar] [CrossRef]
  47. Li, Y.F.; Hu, S.D.; Chen, J.H.; Müller, K.; Li, Y.C.; Fu, W.J.; Lin, Z.W.; Wang, H.L. Effects of biochar application in forest ecosystems on soil properties and greenhouse gas emissions: A review. J. Soils Sediments 2018, 18, 546–563. [Google Scholar] [CrossRef]
  48. Gu, Y.Y.; Zhang, H.Y.; Liang, X.Y.; Fu, R.; Li, M.; Chen, C.J. Impact of Biochar and Bioorganic Fertilizer on Rhizosphere Bacteria in Saline-Alkali Soil. Microorganisms 2022, 10, 2310. [Google Scholar] [CrossRef]
  49. Lashari, M.S.; Ye, Y.X.; Ji, H.S.; Li, L.Q.; Kibue, G.W.; Lu, H.F.; Zheng, J.F.; Pan, G.X. Biochar-manure compost in conjunction with pyroligneous solution alleviated salt stress and improved leaf bioactivity of maize in a saline soil from central China: A 2-year field experiment. J. Sci. Food Agric. 2015, 95, 1321–1327. [Google Scholar] [CrossRef]
  50. Ji, M.Y.; Wang, X.X.; Usman, M.; Liu, F.H.; Dan, Y.T.; Zhou, L.; Campanaro, S.; Luo, G.; Sang, W.J. Effects of different feedstocks-based biochar on soil remediation: A review. Environ. Pollut. 2022, 294, 118655. [Google Scholar] [CrossRef]
  51. Wei, Z.; Wang, J.J.; Fultz, L.M.; White, P.; Jeong, C. Application of biochar in estrogen hormone-contaminated and manure-affected soils: Impact on soil respiration, microbial community and enzyme activity. Chemosphere 2021, 270, 128625. [Google Scholar] [CrossRef]
  52. Cai, F.; Feng, Z.J.; Zhu, L.Z. Effects of biochar on CH4 emission with straw application on paddy soil. J. Soils Sediments 2018, 18, 599–609. [Google Scholar] [CrossRef]
  53. Yan, T.T.; Xue, J.H.; Zhou, Z.D.; Wu, Y.B. The Trends in Research on the Effects of Biochar on Soil. Sustainability 2020, 12, 7810. [Google Scholar] [CrossRef]
  54. Zhao, J.; Yang, Y.D.; Zhang, K.; Jeong, J.; Zeng, Z.H.; Zang, H.D. Does crop rotation yield more in China? A meta-analysis. Field Crops Res. 2020, 245, 107659. [Google Scholar] [CrossRef]
  55. Huang, R.L.; Zhang, Z.Y.; Xiao, X.; Zhang, N.; Wang, X.Y.; Yang, Z.P.; Xu, K.Q.; Liang, Y.T. Structural changes of soil organic matter and the linkage to rhizosphere bacterial communities with biochar amendment in manure fertilized soils. Sci. Total Environ. 2019, 692, 333–343. [Google Scholar] [CrossRef]
  56. Soothar, M.K.; Hamani, A.K.M.; Sootahar, M.K.; Sun, J.S.; Yang, G.; Bhatti, S.M.; Traore, A. Assessment of Acidic Biochar on the Growth, Physiology and Nutrients Uptake of Maize (Zea mays L.) Seedlings under Salinity Stress. Sustainability 2021, 13, 3150. [Google Scholar] [CrossRef]
  57. Wan, X.S.; Gong, F.M.; Qu, M.F.; Qiu, E.X.; Zhong, C.M. Experimental Study of the Salt Transfer in a Cold Sodium Sulfate Soil. KSCE J. Civ. Eng. 2019, 23, 1573–1585. [Google Scholar] [CrossRef]
  58. Bin Yousaf, M.T.; Nawaz, M.F.; Rehman, M.Z.U.; Gul, S.; Yasin, G.; Rizwan, M.; Ali, S. Effect of three different types of biochars on eco-physiological response of important agroforestry tree species under salt stress. Int. J. Phytoremediat. 2021, 23, 1412–1422. [Google Scholar] [CrossRef]
  59. Xin, B.X.; Yu, L.X.; Li, G.S.; Jiao, Y.; Liu, T.X.; Zhang, S.W.; Lei, Z.Y. Impact of Saline-Alkali Land Greening on the Local Surface Temperature—A Multiscale Assessment Based on Remote Sensing. Remote Sens. 2022, 14, 4246. [Google Scholar] [CrossRef]
  60. Wang, X.J.; Wang, J.Y.; Wang, J.P. Seasonality of soil respiration under gypsum and straw amendments in an arid saline-alkali soil. J. Environ. Manag. 2021, 277, 111494. [Google Scholar] [CrossRef]
  61. Wang, Z.X.; Cao, C.; Wang, Q.; Shen, J.J.; Han, M.X.; Xia, W.T.; Zhou, T.; Yu, Z.Y.; Shan, X.H. Analysis of the pore structure characteristics of saline soil in the profile within the frozen depth. Cold Reg. Sci. Technol. 2023, 212, 103882. [Google Scholar] [CrossRef]
  62. Jindo, K.; Mizumoto, H.; Sawada, Y.; Sanchez-Monedero, M.A.; Sonoki, T. Physical and chemical characterization of biochars derived from different agricultural residues. Biogeosciences 2014, 11, 6613–6621. [Google Scholar] [CrossRef]
  63. Mehdizadeh, L.; Moghaddam, M.; Lakzian, A. Amelioration of soil properties, growth and leaf mineral elements of summer savory under salt stress and biochar application in alkaline soil. Sci. Hortic. 2020, 267, 109319. [Google Scholar] [CrossRef]
  64. Chakraborty, K.; Bhaduri, D.; Meena, H.N.; Kalariya, K. External potassium (K+) application improves salinity tolerance by promoting Na+-exclusion, K+-accumulation and osmotic adjustment in contrasting peanut cultivars. Plant Physiol. Biochem. 2016, 103, 143–153. [Google Scholar] [CrossRef]
  65. Lefebvre, D.; Williams, A.; Kirk, G.J.D.; Meersmans, J.; Sohi, S.; Goglio, P.; Smith, P. An anticipatory life cycle assessment of the use of biochar from sugarcane residues as a greenhouse gas removal technology. J. Clean Prod. 2021, 312, 127764. [Google Scholar] [CrossRef]
  66. Mohammadi, A.; Khoshnevisan, B.; Venkatesh, G.; Eskandari, S. A Critical Review on Advancement and Challenges of Biochar Application in Paddy Fields: Environmental and Life Cycle Cost Analysis. Processes 2020, 8, 1275. [Google Scholar] [CrossRef]
  67. Dickinson, D.; Balduccio, L.; Buysse, J.; Ronsse, F.; van Huylenbroeck, G.; Prins, W. Cost-benefit analysis of using biochar to improve cereals agriculture. GCB Bioenergy 2015, 7, 850–864. [Google Scholar] [CrossRef]
  68. Yang, X.; Zhang, S.Q.; Ju, M.T.; Liu, L. Preparation and Modification of Biochar Materials and their Application in Soil Remediation. Appl. Sci. 2019, 9, 1365. [Google Scholar] [CrossRef]
  69. Lu, X.Y.; Guo, W.J.; Wang, B.Y.; Feng, Y.F.; He, S.Y.; Xue, L.H. Screening optimal preparation conditions of low-cost metal-modified biochar for phosphate adsorption and unraveling their influence on adsorption performance. J. Clean Prod. 2023, 425, 138927. [Google Scholar] [CrossRef]
  70. Masek, O.; Buss, W.; Sohi, S. Standard Biochar Materials. Environ. Sci. Technol. 2018, 52, 9543–9544. [Google Scholar] [CrossRef]
Figure 1. PRISMA (preferred reporting items for systematic and meta-analyses) flow diagram for this study’s meta-analysis.
Agriculture 15 00561 g001
Figure 2. Frequency distributions of lnR response ratios for the effects of biochar on crop yield (a), soil pH (b), total organic carbon (TOC) content (c), and salt content (d) of saline-alkali farmland. R2 measures goodness of fit. The closer it is to 1, the better is the fit of the regression to the data.
Agriculture 15 00561 g002
Figure 3. Spatial distribution of the published papers used in the meta-analysis. The red dots indicate the experimental locations of 113 literature sources.
Agriculture 15 00561 g003
Figure 4. The overall response ratio of biochar vis-à-vis its impact on crop yield, total organic carbon (TOC), salt, pH, and salt ions (a). The effects of biochar on pH (b), total organic carbon (TOC) (c), and salt content (d) of saline-alkali soil at different soil depths. The effect sizes and their 95% confidence intervals (CIs) are indicated by the symbols and error bars, respectively; dryland drip irrigation treatments differed significantly from the other irrigation treatments when the CIs did not cross the zero line (red dashed line) (p < 0.05); n is the number of samples for the variable of interest.
Agriculture 15 00561 g004
Figure 5. The effects of biochar on crop yield (a,e), and pH (b,f), TOC (c,g), and salt content (d,h) of saline-alkali soil under different mean annual temperature (MAT) and mean annual precipitation (MAP) values. The effect sizes and their 95% confidence intervals (CIs) are indicated by the symbols and error bars, respectively; dryland drip irrigation treatments differed significantly from the other irrigation treatments when the CIs did not cross the zero line (red dashed line) (p < 0.05); n is the number of samples for the variable of interest.
Agriculture 15 00561 g005
Figure 6. The linear regression model of the target variable with mean annual temperature (MAT) and mean annual precipitation. Panels (ah) show the fitted linear regression models of how the response of the target variable changes with the MAP or MAT.
Agriculture 15 00561 g006
Figure 7. The effects of different types and pyrolysis temperatures of biochar and their applied amounts on crop yield (a,e,i), pH level (b,f,j), TOC (c,g,k), and salt content (d,h,l) of saline-alkali soil. The effect sizes and their 95% confidence intervals (CIs) are indicated by the symbols and error bars, respectively; dryland drip irrigation treatments differed significantly from the other irrigation treatments when the CIs did not cross the zero line (red dashed line) (p < 0.05); n is the number of samples for the variable of interest.
Agriculture 15 00561 g007
Figure 8. The effects of soil classification, production system, and tillage mode on crop yield (a,e,i), pH (b,f,j), TOC (c,g,k), and salt content (d,h,l) of saline-alkali soil. The effect sizes and their 95% confidence intervals (CIs) are indicated by the symbols and error bars, respectively; dryland drip irrigation treatments differed significantly from other irrigation treatments when the CIs did not cross the zero line (red dashed line) (p < 0.05); n is the number of samples for the variable of interest.
Agriculture 15 00561 g008
Figure 9. (a) Effects of biochar on the respective yield of different crops in saline-alkali farmland; (b) ranking of the relative importance of candidate factors influencing crop yield. The effect sizes and their 95% confidence intervals (CIs) are indicated by the column lengths and error bars, respectively; n is the number of samples for the variable of interest.
Agriculture 15 00561 g009
Figure 10. Structural equation modeling (SEM) results for quantifying the direct and indirect effects of biochar input and its related factors (TOC content, pH, salt, and water utilization efficiency) on crop yield. Blue and red indicate negative and positive relationships, respectively (* p < 0.05, ** p < 0.01); black dashed lines indicate no significant correlation.
Agriculture 15 00561 g010
Table 1. Classification of the response variables considered in this meta-analysis.
ItemsVariablesGroups
Climate conditionsMAT (°C) ≤1010–15≥15
MAP (mm) ≤400400–800≥800
Soil classification MildModerateSevere
Agricultural practicesBiochar input (t ha−1) ≤1010–20≥20
Biochar typesStrawShellWood
Biochar pyrolysis
temperature (°C)
≤550≥550
Production systemDry fieldsPaddy fields
Planting patternMonocultureRotation
Crop typesRiceMaizeWheat
SorghumSoybeanCotton
Peanut
Abbreviations: Mean annual temperature (MAT), mean annual precipitation (MAP). Straw biochar: carbon content of 40–80%, ash content of 20–35%, and pH of 8–11. Shell biochar (raw materials are peanut husk, rice husk, etc.): carbon content of 50–90%, ash content 0–40%, and pH of 8–10. Wood biochar: carbon content of 60–85%, ash content of 0–10%, and pH of 5–12. Monoculture: on the same piece of land, only one type of crop is planted within a single growth cycle. Rotation: in the same field, different crops or multiple cropping combinations are rotated in a certain order and pattern, either between seasons or years.
Table 2. Three-way ANOVAs for the effects of subgroups on the four soil response variables. The F value is the ratio of the mean square between groups to the mean square within groups, and the corresponding p-value is the level of significance. The asterisk(s) indicate those F values that were significant (*, p < 0.05) or highly significant (**, p < 0.01).
SubgroupsCrop YieldSoil pHSoil TOCSoil Salinity
FpFpFpFp
Soil classification (S)25.9160 **10.0440 **2.3950.0956.2870.002 **
Biochar type (B)53.9000 **0.7230.4868.8140 **3.6980.025 *
Planting pattern (P)0.5830.4461.3370.2486.3590.013 *0.0570.811
S × B31.9580 **4.6210.001 **6.6010 **11.5080 **
S × T0.0300.971.9310.1656.890.01 *0.1860.831
B × T1.8230.1920.7050.4018.9210 **7.0370.013 **
S × B × T37.8920 **1.4570.2287.2670.01 *9.9890.001 **
Table 3. Impact of biochar on water utilization efficiency and greenhouse gas emissions.
Water Use Efficiency and
Greenhouse Gas Emissions
Pair of
Observations
Mean Effect Size
(%)
95% Confidence
Interval
Water use efficiency2668.7[6.7, 10.7]
CO2 emissions1989.8[1.6, 18.1]
CH4 emissions2131.6[24.6, 38.5]
N2O emissions31−29.4[−42.3, −16.5]
Disclaimer/Publisher’s Note: The statements, opinions and data contained in all publications are solely those of the individual author(s) and contributor(s) and not of MDPI and/or the editor(s). MDPI and/or the editor(s) disclaim responsibility for any injury to people or property resulting from any ideas, methods, instructions or products referred to in the content.

