Article

Roles of N and P in Soil Acidification, Metals Mobilization and Bioavailable Concentration-Based Soil Fertility Assessment in Tea Plantations in Yunnan, China

1
Yunnan Key Laboratory of Plateau Wetland Conservation, Restoration and Ecological Services, College of Ecology and Environment, Southwest Forestry University, Kunming 650224, China
2
National Plateau Wetlands Research Center, Yunnan Dianchi Lake Ecosystem Observation and Research Station, Kunming 650224, China
3
Institute of Tea, Yunnan Academy of Agricultural Sciences, Kunming 650205, China
*
Author to whom correspondence should be addressed.
These authors contributed equally in this work.
Agriculture 2025, 15(5), 543; https://doi.org/10.3390/agriculture15050543
Submission received: 5 February 2025 / Revised: 28 February 2025 / Accepted: 1 March 2025 / Published: 3 March 2025
(This article belongs to the Section Agricultural Soils)

Abstract

:
Tea yield is determined by soil fertility. An elemental bioavailable-content-based fertility assessment is more reliable than that of total content. In tea plantations, soil acidification occurs, affecting metals’ bioavailability and fertility, yet the relations are unclear. Soils (n = 190) were sampled in five major tea-producing regions in Yunnan, China. Bioavailable concentrations of fertilizers (N and P) and essential metals (Ca, Mg, Fe, Mn, Cu and Zn) were analyzed and involved in the fertility evaluation. Soils were acidified (pH = 3.44–5.53), and were partially attributed to excess N-fertilization (R = −0.26; p < 0.01). Soil acidification increased Mg, Fe and Mn bioavailability (R = −0.021, −0.087 and −0.13). P played an important role in improving metals’ bioavailability (R = 0.20–0.48; p < 0.01). Bioavailable metals showed strong heterogeneity. Therefore, the nutritional level distributions of individual indices were complex and inconsistent, so multi-indices were used to achieve more accurate assessments. This study clarified the strong correlation between N-fertilization and soil acidification, and the key role of P in improving metals’ bioavailability and fertility. The data suggest that bioavailable Cu and Zn are suitable for plant growth, Ca and Mg should be enhanced without decreasing P bioavailability, and the potential toxic effect of excessive Mn should be paid attention. The information helps to strategize scientific fertilization and management.

1. Introduction

Tea is one of the most popular non-alcoholic beverages and offers a plethora of health benefits, such as preventing Alzheimer’s disease and anti-cardiovascular disease, anti-oxidant and anti-cancer effects. The main cultivation regions of tea trees are distributed in Asia, East Africa and Europe [1]. China is the origin center of tea plants and the major country in tea cultivation and production, accounting for 40.6% of the world’s total production. Yunnan province, located in southwest China, ranks the top in national tea acreage and production, with the proportion reaching 15.3% and 16% [2]. Lincang is the second largest tea-growing region in Yunnan province, accounting for 24% of provincial plantations. The green tea plant (Camellia sinensis) is widely cultivated in Yunnan province, which is rich in polyphenols, polysaccharides, flavonoids and anthraquinone derivatives that benefit human health [3].
Nitrogen (N) and phosphorus (P) are essential nutrients critical for tea plant growth and production, which are often strongly fixed in soils with low phyto-availability [4]. To ensure optimal plant growth and tea yield, excess N and P were applied to tea plantations [5], leading to soil acidification. Specifically, N fertilization contributes to soil acidification in croplands due to the formation of H+ during NH4+ nitrification [6]. For example, soil pH was decreased from 6.1 to 4.9 after applying 800 kg ha−1 N fertilizer for 71 d [7,8]. High concentrations of P were also found in tea plantations due to the intensive application of inorganic and organic P fertilizers. Soil-available P concentrations in tea plantations can reach 400 mg kg−1 [9]. Therefore, the effect of N and P on soil pH, metals’ bioavailability and bioavailable-concentration-based soil fertility in tea plantations should be studied.
In addition to N fertilization, long-term tea cultivation can also decrease soil pH via root-exuded organic acids (citrate, oxalate and malate) [10] and litter decomposition [11], with pH naturally decreased by 0.07 unit per year [5]. Soil acidification in tea plantations is greater than forest, cash crop and cereal growing soils, with pH decreases of 1.06–1.86 vs. 0.47–1.43, 0.40–1.08 and 0.30–0.89 [10]. Generally, tea plants prefer to grow in acidic to slightly acidic soils (pH = 4.0–6.5), but strong acidification (pH < 4.0) inhibits growth [12]. Therefore, intensive fertilization coupled with tea plantations induced strong acidification in tea-growing soils. Typically, southwest China is characterized by karst landforms, with pH values at 6.07–8.53 [13]. However, soil pH levels in tea-growing soils in Yunnan province, southwest China, were low at 4.77–5.17 [8]. The strong acidic environment causes nutritional metals to be dissolved or desorbed, leading to nutrient losses. In addition, the decreased pH can increase metals’ bioavailability and change soil fertility. However, relationships between N and P fertilization, soil acidification, metals’ bioavailability and soil fertility in tea plantations are unclear.
Calcium (Ca), magnesium (Mg), iron (Fe), manganese (Mn), copper (Cu) and zinc (Zn) are essential nutritional metals for plant growth and development, involved in physiological and biochemical processes like promoting enzyme activity, carbohydrate formation and leaf photosynthesis [14]. In addition, these metals in tea leaves are also beneficial for human health. It was reported that five cups of green tea can provide 45% of Mn, 25% of K and 5% of Mg towards the daily requirements [15]. Given the benefits to humans, nutritional metals in tea leaves are most studied. However, nutritional metal availability in soils is the prerequisite for efficient uptake and accumulation in tea plants, which, however, has been the subject of limited studies.
Soil-bioavailable concentrations of metals represent the fraction that potentially can be taken up by plant roots [16], which is more important in determining soil fertility than the total content, and is strongly affected by soil pH and N and P fertilization. Therefore, this study sampled 190 soils in tea plantations from five regions in Lincang, Yunnan province, China. The aims were to: (1) analyze soil pH and available concentrations of fertilizers (N and P) and metals (Ca, Mg, Fe, Mn, Cu and Zn) and examine their relationships; (2) evaluate soil fertility based on bioavailable concentrations of fertilizers and metals; and (3) clarify the major factor driving soil elements’ availability and fertility. The information helps to better understand the correlation of fertilization, soil acidification and metals’ bioavailability in typical karst regions, thereby helping to strategize scientific fertilization to achieve more accurate fertility assessment and management.

2. Materials and Methods

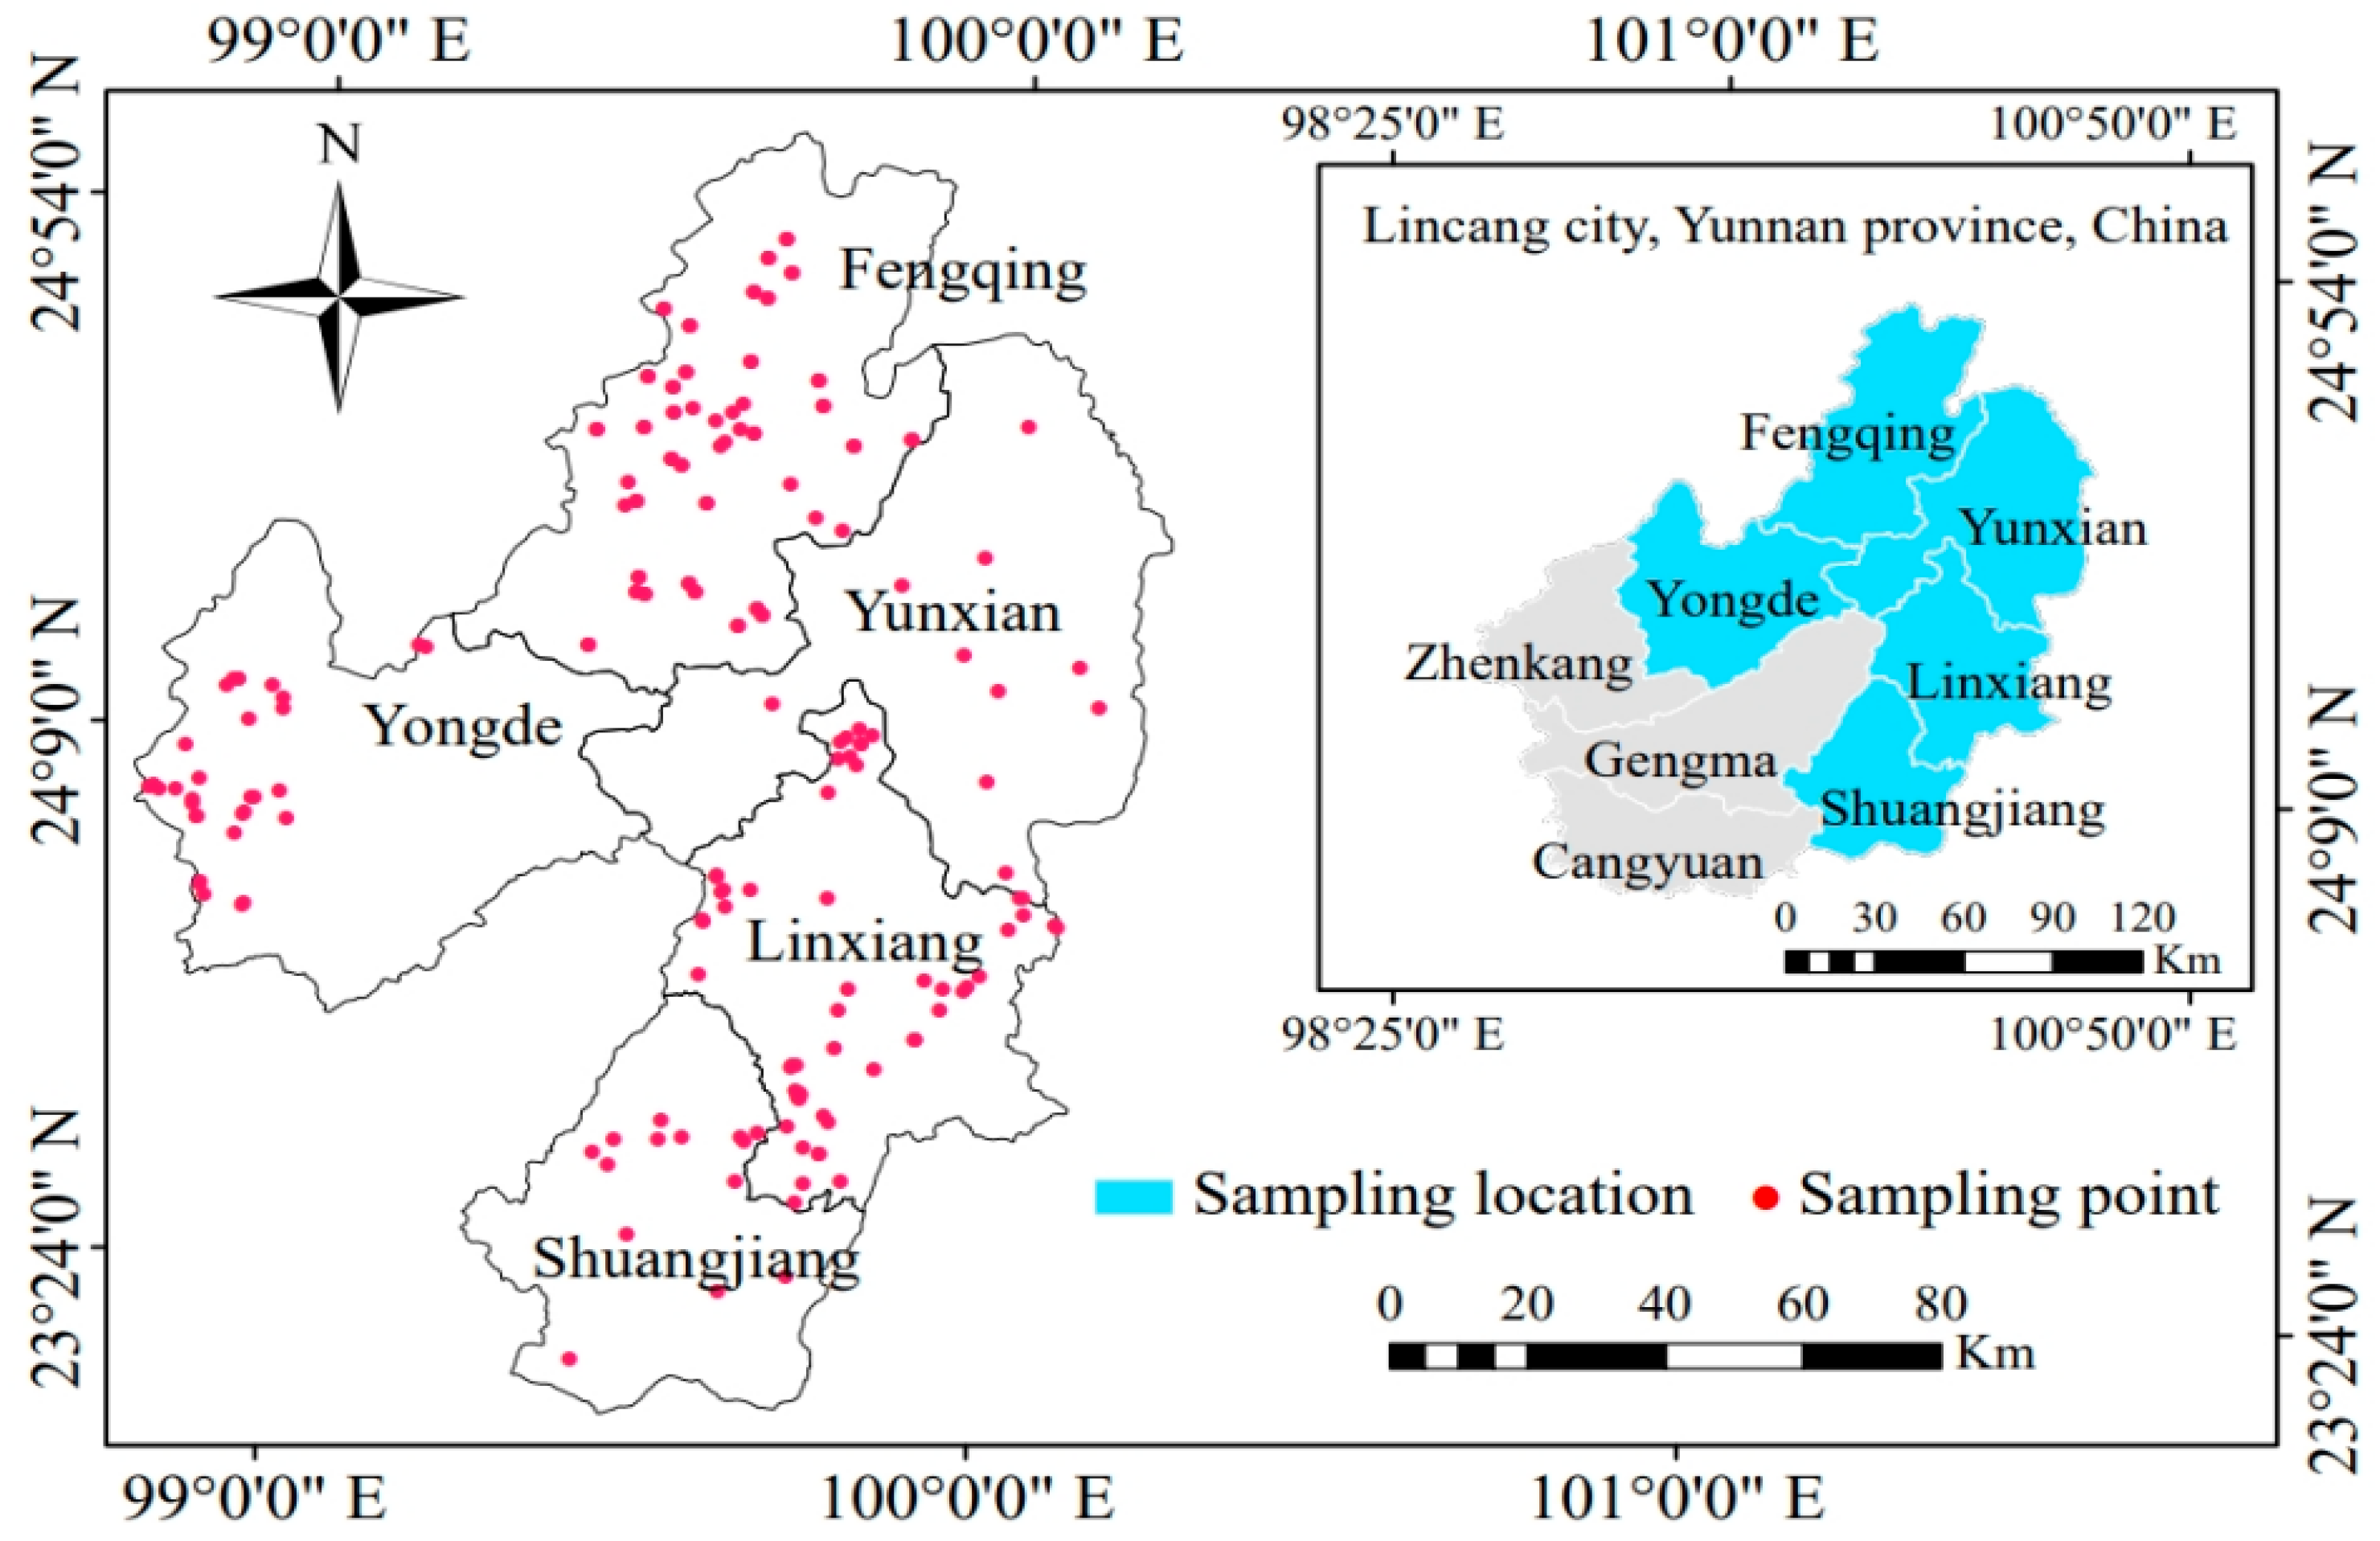
2.1. Sample Collection and Pretreatment

Lincang features a temperate climate with an annual mean value of 17.5 °C and 1400 mm precipitation. Surface soils (0–30 cm) (n = 190) in tea plantations were sampled in five regions from Lincang, southwest China, including Fengqing (n = 78), Linxiang (n = 52), Yongde (n = 30), Shuangjiang (n = 20) and Yunxian (n = 10) (Figure 1). Each soil sample was made up of six well-mixed subsamples, air-dried, ground and sieved (0.15 mm). The sample size of each region was set using the stratified random sampling method, which was determined according to tea plantation area and altitude across the five regions of Lincang. The spatial randomness of sampling points was assessed using ArcGIS 10.8 to confirm inter-sample independence and mitigate potential bias caused by spatial clustering.

2.2. Chemical Analysis

Soil pH was measured according to George [17]. Briefly, soil was mixed with Milli-Q water (Millipore, Billerica, MA, USA) at 1:2.5 (m/v) and shaken at 180 rpm and 25 °C for 1 h, then the supernatant was analyzed with a pH meter (Mettler-Toldo, Columbus, OH, USA). Soil-bioavailable N was extracted by 2 M KCl at solid/liquid ratio 1:10 (w/v), shaking at 200 rpm and 25 °C for 2 h, then analyzed using a semi-automatic micro-Kjeldahl (Behr2). N concentration was analyzed by Vario Max CN Analyzer (Elementar Analysensystem GmbH, Hanau, Germany). Bioavailable P was extracted with 0.03 M NH4F and 0.025 M HCl and analyzed by inductively coupled plasma emission spectroscopy (ICP-OES; Thermo Jarrell Ash Ltd., Waltham, MA, USA). Bioavailable Ca and Mg were extracted with Milli-Q water at 1:5 (m:v) and analyzed by inductively coupled plasma mass spectrometry (ICP-MS; NexION300X, PerkinElmer, Waltham, MA, USA). Bioavailable Fe, Mn, Cu and Zn were extracted by ammonium bicarbonate-diethylenetriaminepentaacetic (AB-DTPA) and analyzed by ICP-MS. Standards and samples were acidified with 0.1 M HNO3 (Suprapur; Merck, Darmstadt, Germany) [18]. Standard solution (2 µg L−1) was measured every 10 samples to monitor ICP-MS stability. Indium (In) was used as the internal standard to ensure accuracy and precision. The average recoveries were 101 ± 1.6–104 ± 1.2%. All experiments were performed in triplicates.

2.3. Soil Fertility Evaluation

Soil fertility was evaluated by integrated fertility index (IFI) via fuzzy mathematical membership analysis. Soil pH and bioavailable concentrations of N, P, Ca, Mg, Fe, Mn, Cu and Zn were used as the evaluation indices. The soil nutritional level of each index was classified into level I, II and III according to Environmental Quality of Green Food Production Areas of China [19] (Table 1A).

2.3.1. Membership Function Analysis

According to the relationship between the evaluation indexes and the intercrop effect, parabolic (Equation (1)) and S-type (Equation (2)) formulas were used to analyze the membership function of pH and metals’ bioavailable concentrations, respectively.
Parabolic type [20]:
N i = f ( x ) = 0.1   x x 4   or   x x 1 0.1 + 0.9 ( x x 1 ) x 2 x 1   x 1 < x < x 2 1.0   x 2 x x 3 1.0 0.9 ( x x 3 ) x 4 x 3   x 3 < x < x 4
S-type [21]:
N i = f ( x ) = 0.1   x x 1 0.1 + 0.9 ( x x 1 ) x 2 x 1   x 1 < x < x 2 1.0   x x 2
where x is the calculated value of each index of individual soil. x 1 to x 4 are the turning point values of the membership curve (Table 1B). Ni is the standardized membership value for each index (Table 1C).

2.3.2. Turning Point of Membership Curve

In order to solve the incompatibility of the different units among various indices, fuzzy membership functions were performed (Table 1B) [22,23]. The values ranging from 0.1 to 1.0 were allocated to each indicator based on the sensitivity. The maximum and minimum values of each indicator were used to establish the lower ( x 1) and upper ( x 2 or x 4) limits of parabolic and S-type membership functions (Table 1B).

2.3.3. Weight Coefficient of Individual Index

In soils, elements interact with each other, so the weight of an individual index can be established by the correlation coefficient among indices. The weight coefficient (Wi) of each index was calculated via Equation (3):
W i = V i V i
where Vi is the average value of the correlation coefficient between an individual index and the other indices (Table 1D). ΣVi is the sum of Vi of all indices. The calculated Wi values were showed in Table 1E.

2.3.4. Membership Value of Soil Fertility Index

Integrated fertility index (IFI) quantified soil fertility by integrating factors that closely related to plant growth, which was calculated via Equation (4):
I F I = N i × W i
where Ni is the membership value of soil fertility quality index calculated by Equations (1) and (2) (Table 1C). Wi is the weight coefficient of soil fertility quality index (i) calculated by Equation (3) (Table 1E). IFI ≥ 0.75, 0.5 ≤ IFI < 0.75, 0.25 ≤ IFI < 0.5 and IFI < 0.25 indicate soil fertility quality at levels I, II, III and IV, respectively [24].

2.4. Statistical Analysis

Significant differences and variances were established via one-way analysis of variance (ANOVA) and Duncan multiple range test at p < 0.05 (SPSS 16.0, SPSS Inc., Chicago, IL, USA). Pearson correlation was analyzed by SPSS 25.0 at p < 0.05 or p < 0.01. Principal component analysis (PCA) was built by Minitab version 17, which is a multivariate statistical tool to study the significance of multi-factors by minimizing multiple data into fewer components that retain the majority of the variance found in the main data [25]. The principal axis technique was utilized in defining the principal component and components with eigenvalue > 1 were utilized to interpret the principal components (PCs) [26]. The suitability of soil property data for PCA analysis was evaluated by Kaiser–Meyer–Olkin (KMO) and Barlett tests using SPSS (SPSS 27.0, SPSS Inc., USA). Figures were built using Origin 2021 (Origin Lab Corporation, Northampton, MA, USA).

3. Results and Discussion

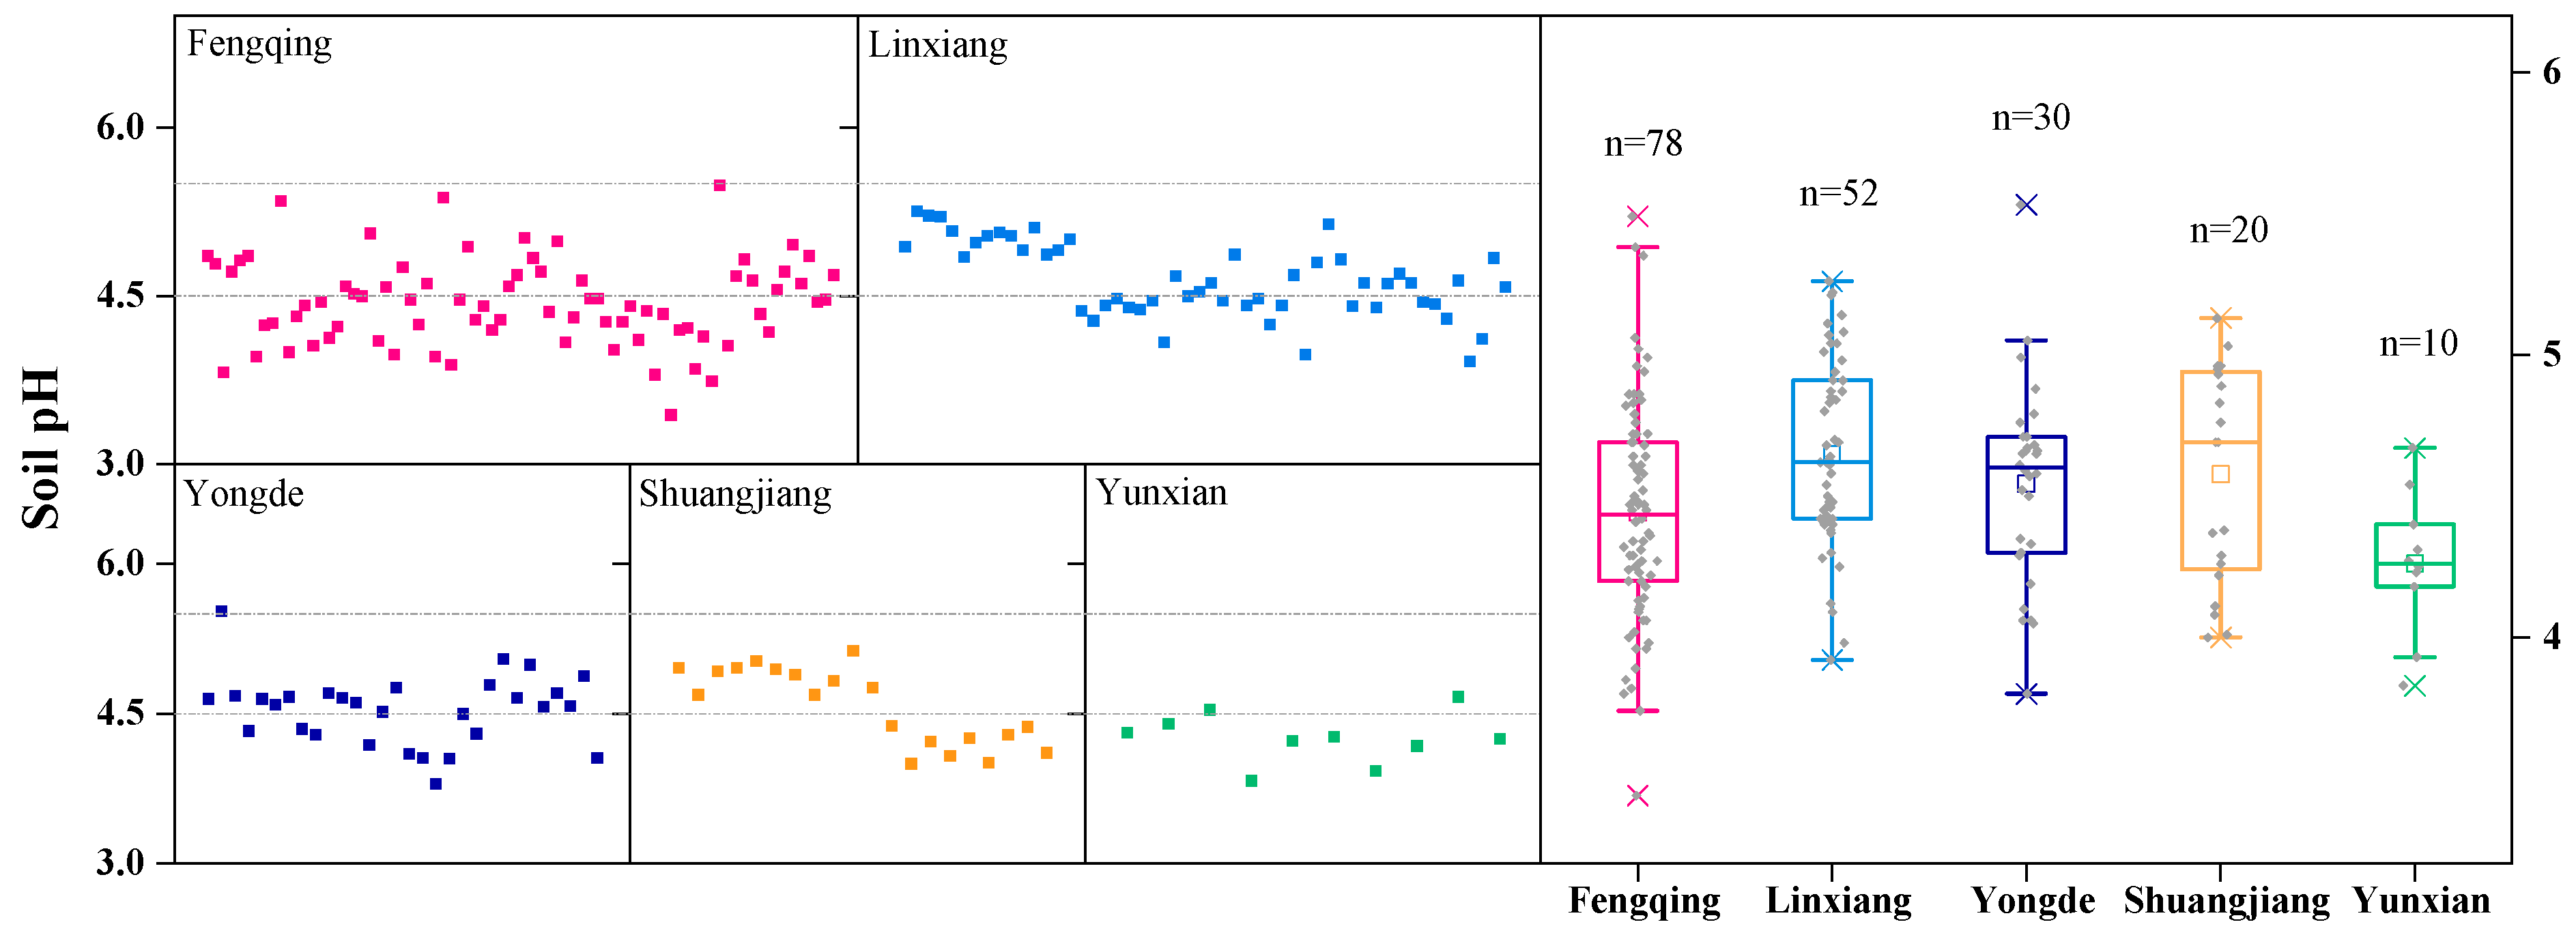
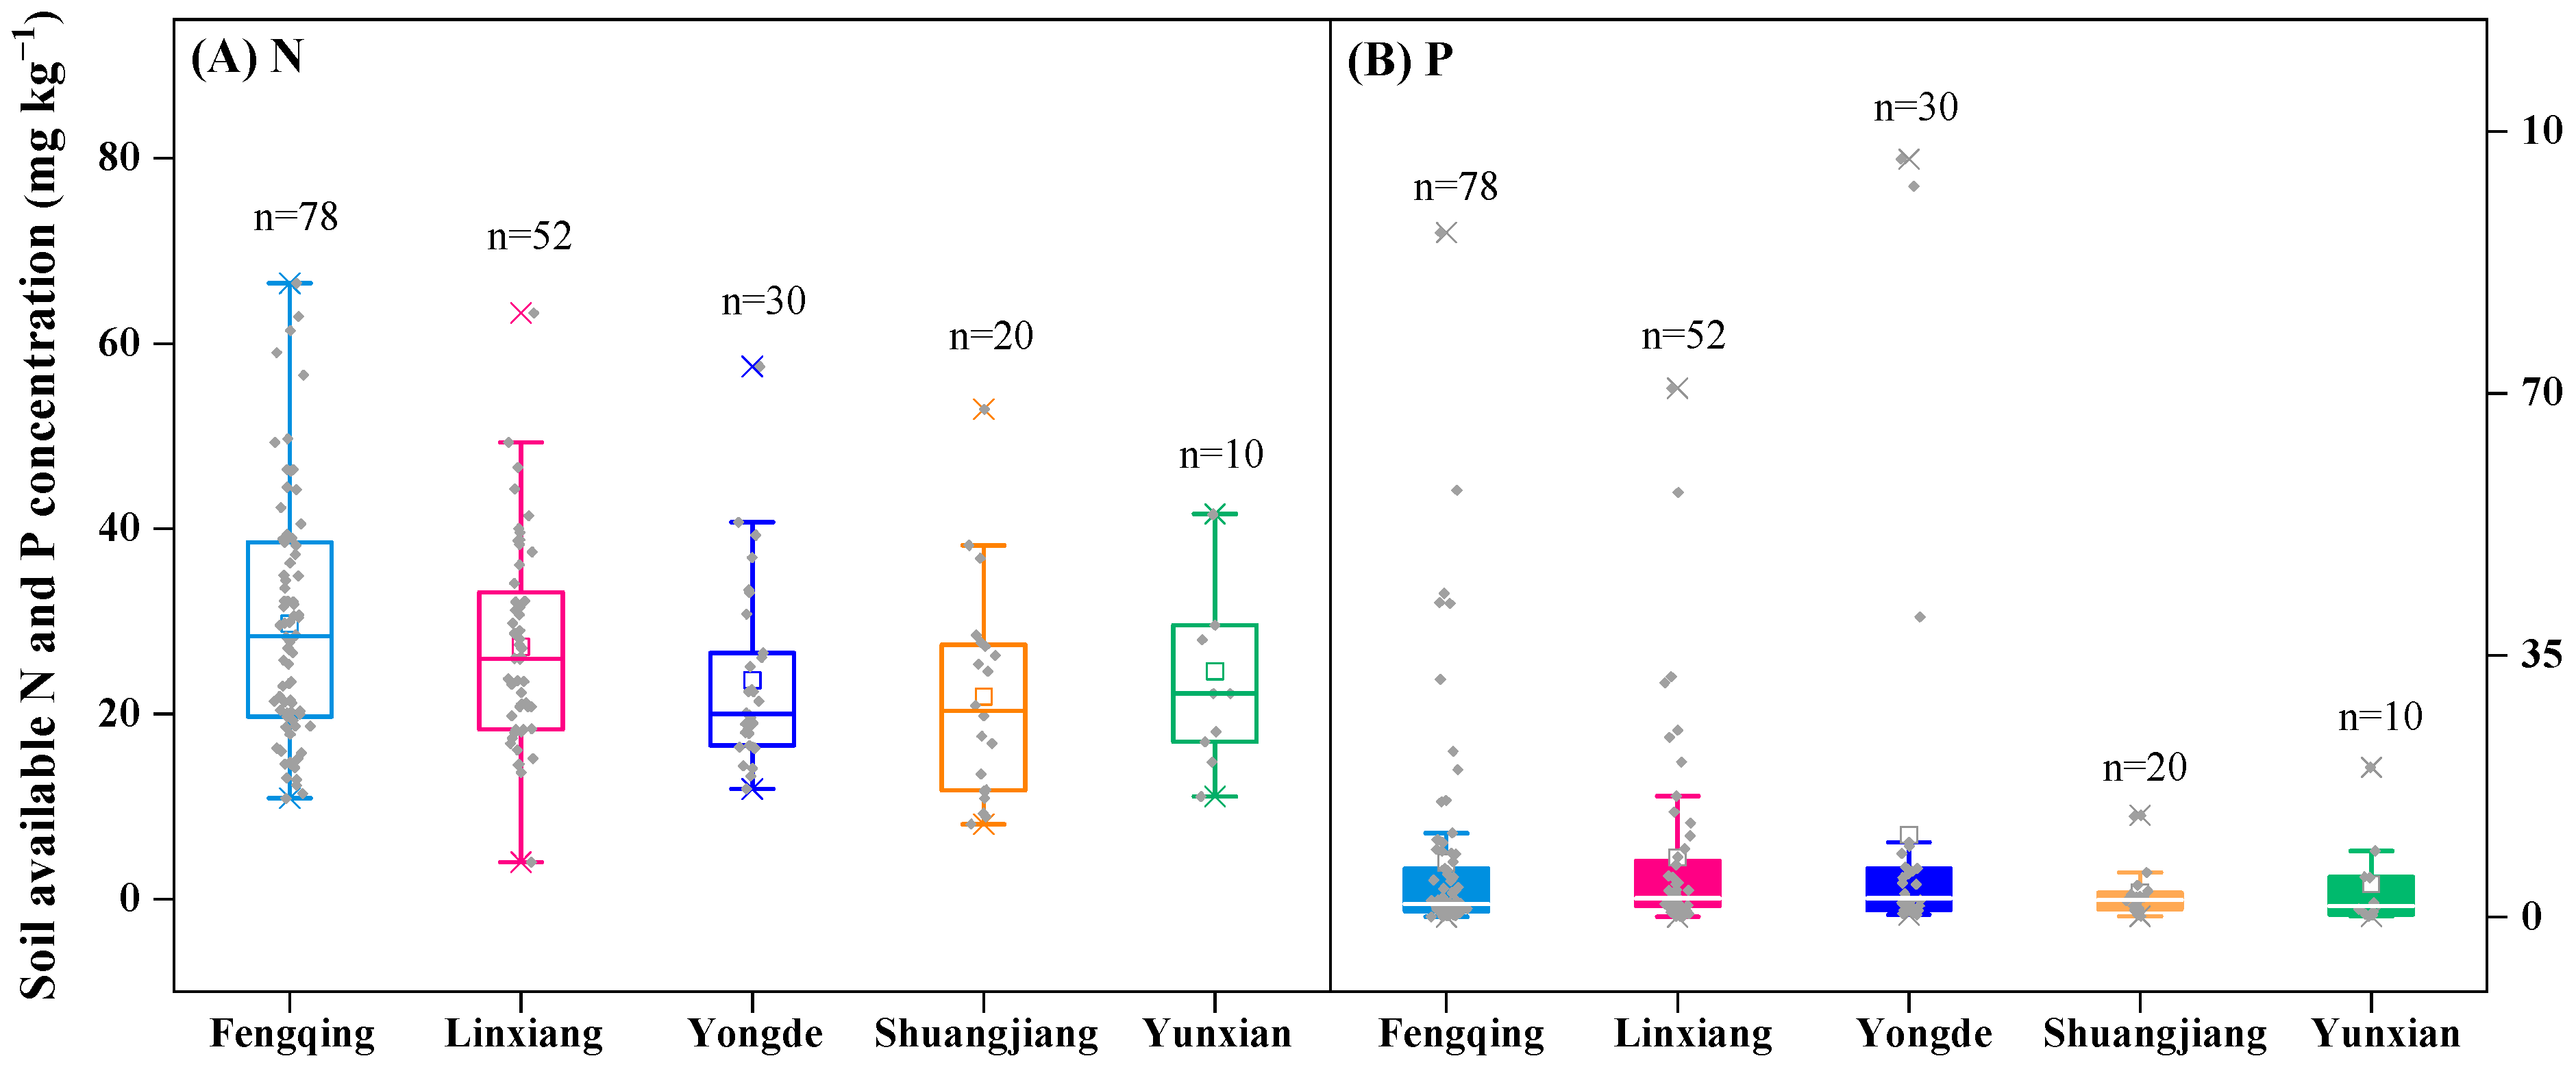
3.1. Soil pH and Bioavailable N and P Concentrations

Among soil characteristics, pH is critical in mediating metals’ bioavailability and transfer in tea agro-systems [27], which, however, is affected by N and P fertilization. Soil pH ranged 3.44–5.53 across the 190 sampling sties (Figure 2) and the average value of five regions was 4.26–4.65 (Table 2A), indicating that soil acidification occurred. According to Environmental Quality of Green Food Production Areas of China [19], 50% and 42.6% of soil pH in the studied tea plantations were at nutritional level I (4.5–5.5) and II (4.0–4.5 or 5.5–6.5) (Table 1A). Typically, tea plants prefer to grow in acidic to slightly acidic soils (4.0–6.5), with the optimal pH at 4.5–5.5 [12]. The data suggest that the present soil pH values are suitable for tea plant growth. Among the five regions, soil pH in Linxiang (3.92–5.26, n = 52) showed the highest ratio (69%) in reaching nutritional level I (Figure 2), while those for Yunxian (3.83–4.67, n = 10) and Fengqing (3.92–5.52, n = 78) were low at 20% and 41%, showing the lowest average pH at 4.26 and 4.44 (Table 2A).
The average pH of the studied tea plantations was 4.52, which was lower than those of cash crop and forest soils (5.58 and 5.74) and even lower than the average value of tea plantations in China (4.68) [28]. Generally, southwest China is a typical karst area, prevalent in calcareous soils (pH = 6.07–8.53) [13]. Soil acidification in tea plantations can be ascribed to long-term tea cultivation that produced organic acids (citrate, oxalate, pyruvate and malate) via root exudates [5,29], excessive N-based fertilization with low utilization efficiency [30,31], loss of base cations [32] and tea litter decomposition [11]. The strong acid environment causes metals to be dissolved or desorbed, leading to increased bioavailability.
Soil-bioavailable N and P concentrations showed strong heterogeneity, with ranges of 4–66.5 and 0.02–101 mg kg−1 (Figure 3), indicating 100% and 70% were at nutritional level III (<80 and <5 mg kg−1) (Table 1A and Table 2B), suggesting low N and P fertility based on the bioavailable concentration. Among the five regions, Fengqing showed the highest available N (10.8–66.4 mg kg−1, n = 78), while Shuangjiang contained the lowest (8.05–52.8 mg kg−1, n = 20) (Figure 3), with the mean values of 29.7 and 21.8 mg kg−1 (Table 2A). For tea plants, the desirable concentrations of bioavailable N and P are 120–150 and 20–40 mg kg−1 [10]. Soil-bioavailable N in the present study was comparable with tea plantations in Zhejiang province, China (21.8–29.7 vs. 24.3 mg kg−1) [5], but still should be enhanced or mobilized to ensure tea tree growth and production.
Soil-bioavailable P was more heterogeneous than N, especially in Fengqing, Linxiang and Yongde, ranging from 0.02 to 0.29 to 70.7 to 101 mg kg−1 (Figure 3B). The highest available P was observed in Yongde (0.29–101 mg kg−1, n = 30), which was 2.45–7.44-fold that of the lowest P in Shuangjiang (0.12–13.6 mg kg−1, n = 20) (Figure 2), with mean values of 11.0 and 3.31 mg kg−1 (Table 2A). Although Yongde was the highest in average available P (11.0 mg kg−1) (Table 2A), the ratio reaching nutritional level I (>20 mg kg−1) was lower than Linxiang (10% vs. 13.5%) (Table 2B). Normally, soils in southwest China are highly weathered and dominated by duricrust with high concentrations of Fe/Al oxy-hydroxides, which bind with P, leading to decreased bioavailability and low fertility [33]. Therefore, bioavailable concentrations of P in tea plantations in typical karst regions should be enhanced. To improve soil P nutrition without increasing exogenous P fertilization, soil endogenous organic P (Po) is an abundant and important P source, especially in tropical southwest China [34]. Po accounts for 40–70% of soil total P, which can be hydrolyzed by phosphatase to release inorganic P for direct uptake and utilization by plants [35]. Therefore, to improve soil P nutrition in tea plantations, strategies to enhance soil endogenous Po hydrolyzation and utilization can be developed, which can also avoid the pollution risk of intensive exogenous P fertilizations.

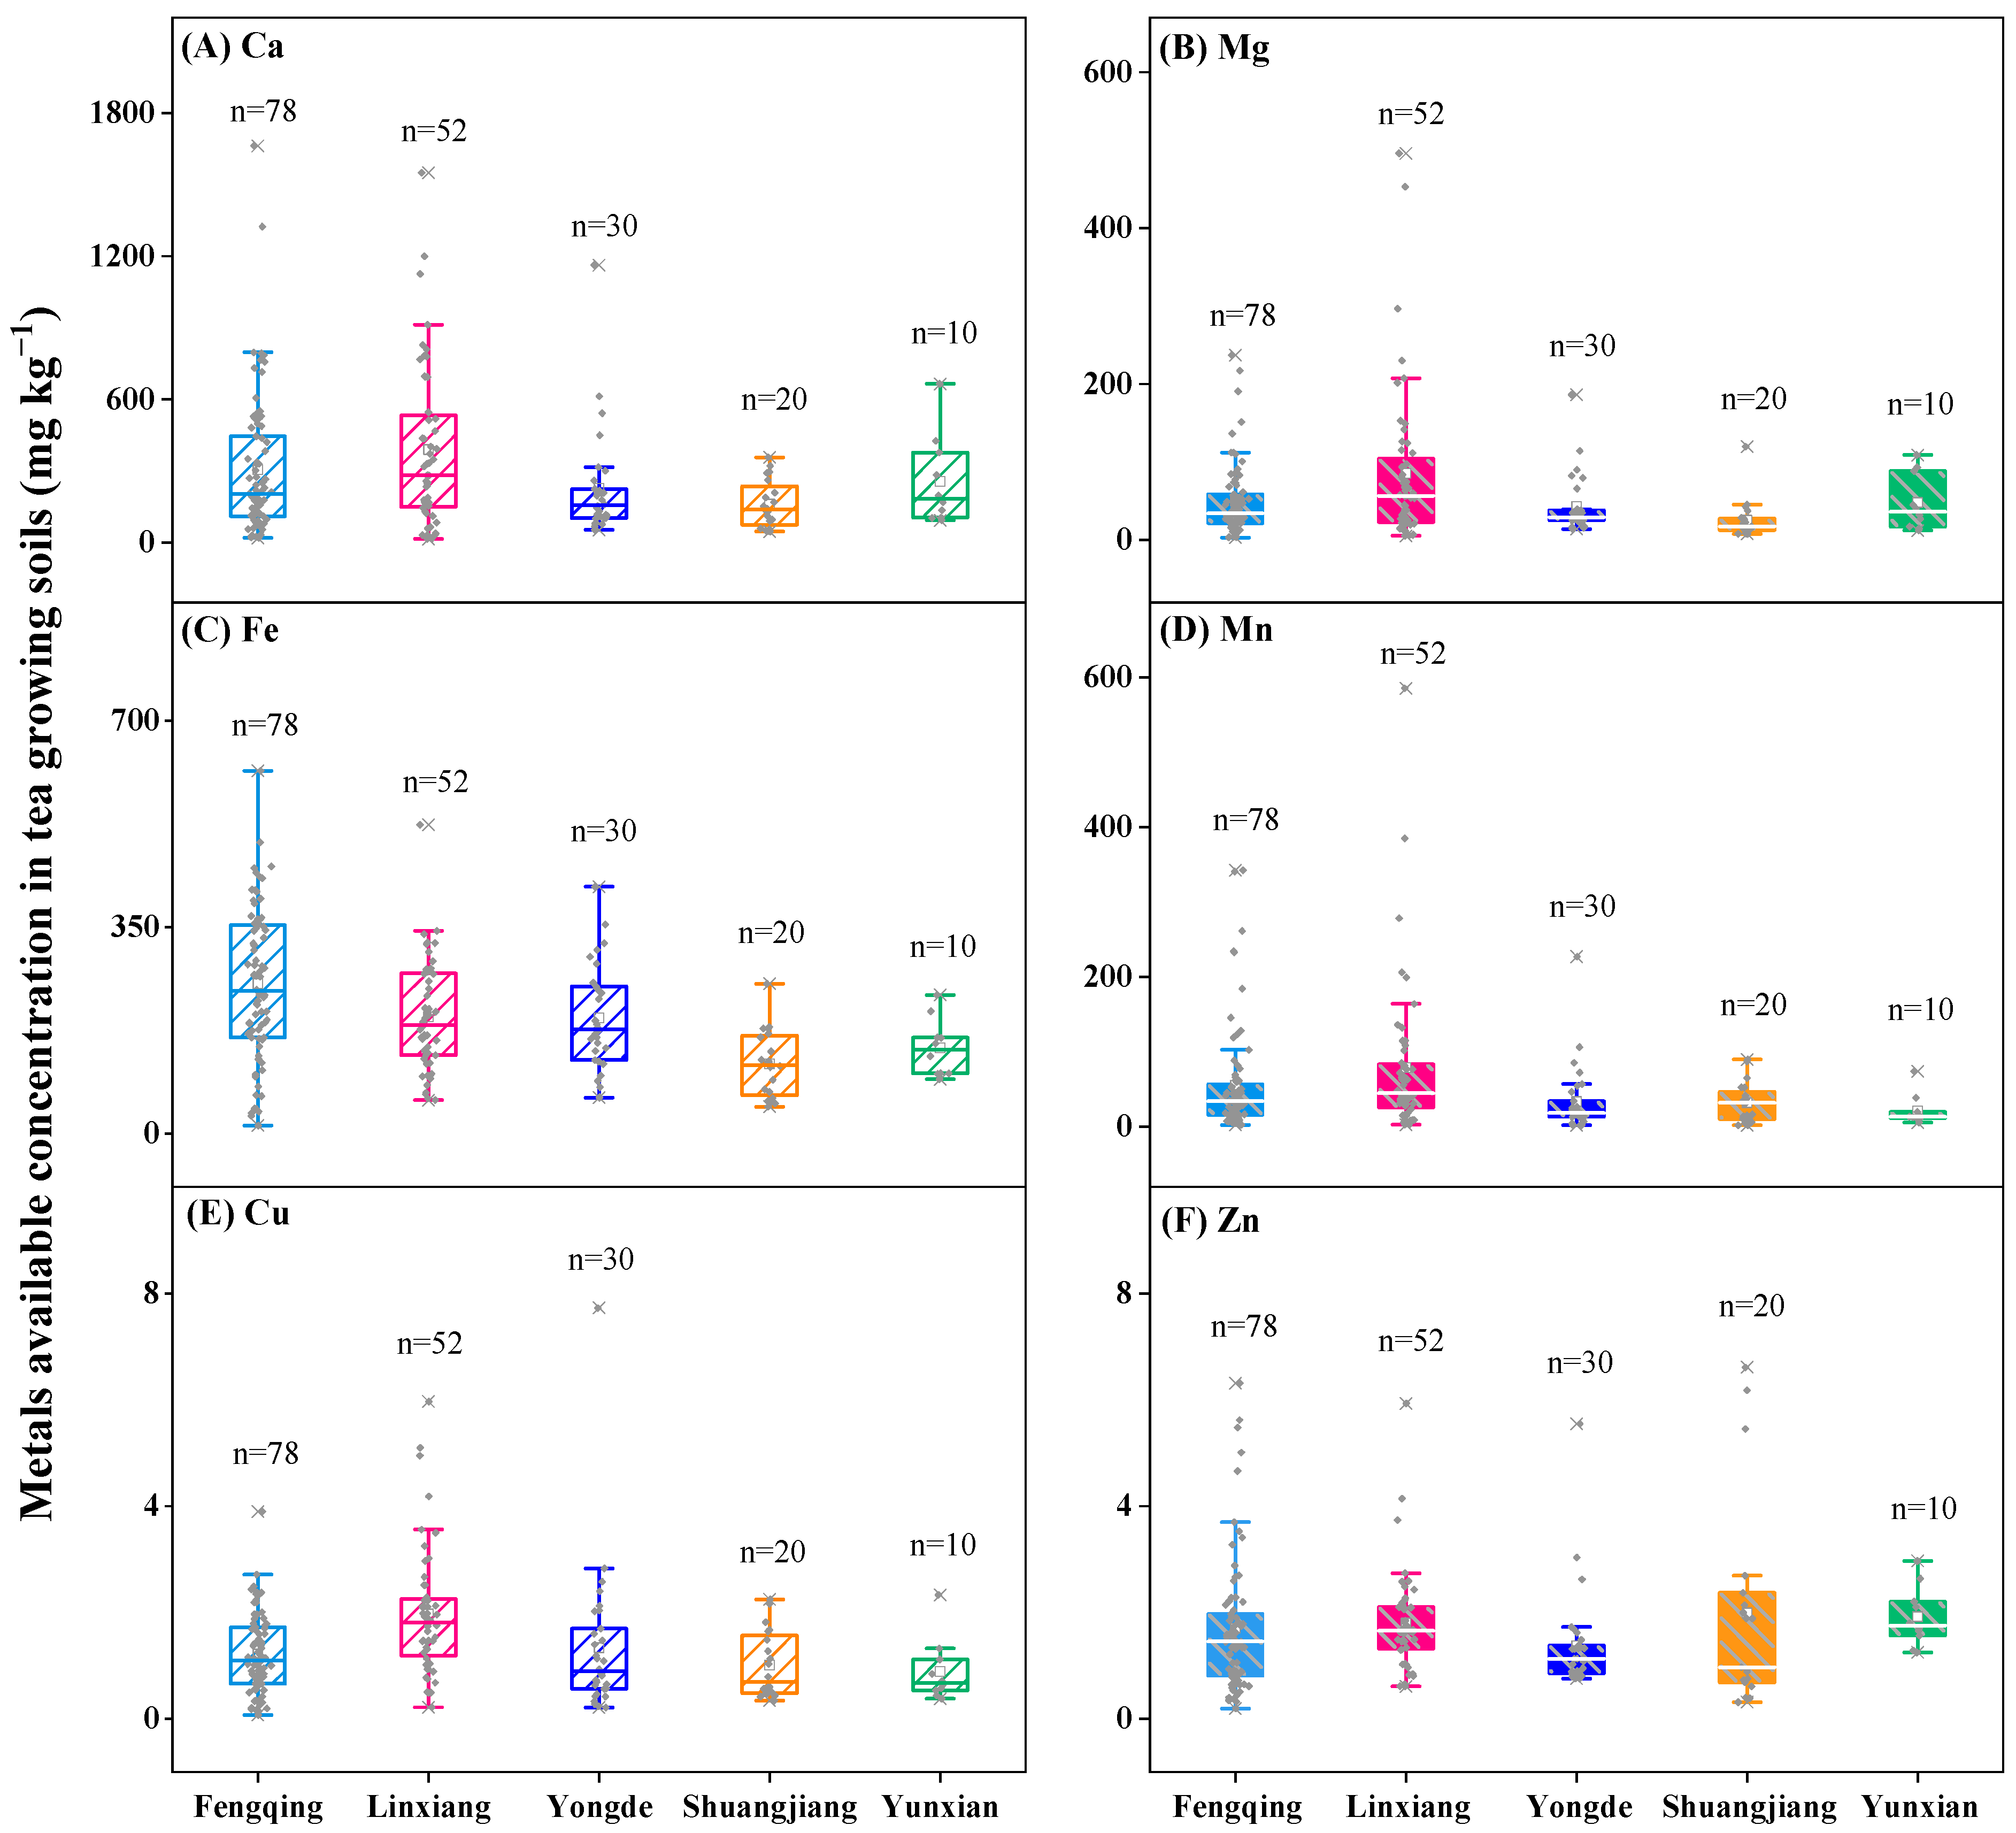
3.2. Soil-Available Metals Concentration

Given that soil pH and N/P fertilization strongly affect metal adsorption and complexation reactions, thus changing the speciation and chemical fractions, metals’ bioavailable concentrations were analyzed. Similarly to P, available Ca, Mg, Fe, Mn, Cu and Zn showed strong heterogeneity, ranging at 15.5–1664, 3.04–495, 13.9–614, 2.1–585, 0.07–28.8 and 0.2–22 mg kg−1 (Figure 4), with those in Fengqing and Linxiang being more heterogeneous than the other three regions. Among the six metals, 100% of Fe reached nutritional level I (>4.5 mg kg−1), followed by Mn (52.6%; >30 mg kg−1), Zn (26.8%; >2 mg kg−1) and Cu (22.1%; >2 mg kg−1), while values for Ca and Mg were low at 3.16% (>1000 mg kg−1) and 1.05% (>300 mg kg−1) (Table 2B). Specifically, the proposed bioavailable Mg concentration for crop growth and production is 60–300 mg kg−1 [36], while 72% of the studied soils were lower than this level (Figure 4B), suggesting bioavailable Mg should be enhanced in tea plantations.
Among the five regions, Linxiang was the highest in available Ca, Mg, Mn and Cu (Figure 4), with average values at 389, 85.1, 78.8 and 1.97 mg kg−1 (Table 2A). In contrast, Shuangjiang was the lowest in available Ca, Mg and Fe, which averaged at 161, 25.1 and 118 mg kg−1 (Table 2A). Though metals showed strong geochemical heterogeneity among different regions, bioavailable Ca and Mg should be enhanced in all the studied tea plantations. Ca plays important physiological roles in plant biochemical reactions, but high concentrations (>1500 mg kg−1) can reduce the bioavailability of P through fixation and sorption [36]. Therefore, bioavailable Ca at 1000–1500 mg kg−1 can be strategized to achieve both Ca and P nutrition levels in tea plantations.
The proposed bioavailable Fe concentration for crop growth is 0.3–10 mg kg−1 [36]. The studied plantations showed abundant available Fe (13.9–614 mg kg−1) (Figure 4C) for tea plant growth, which, however, can reduce the bioavailability of P, especially at soil pH < 5.5 [37]. This was supported by the low bioavailable concentrations of P, with 70% at nutritional level III (<5 mg kg−1) (Figure 3B).
The proposed deficiency level of bioavailable Mn is 2.0–5.0 mg kg−1, and >140 mg kg−1 is considered toxic to plants [11]. In this study, 86.3% of the samples were above nutritional level II (>15 mg kg−1) (Figure 4D). However, Fengqing (9%, 146–343 mg kg−1), Linxiang (11.5%, 164–585 mg kg−1) and Yongde (3%, 227 mg kg−1) showed excessive bioavailable Mn (Figure 4D), so its effect on tea plant growth and tea quality should be studied.
The proposed bioavailable Cu concentration for crop growth is 0.2 mg kg−1 [38], and 97.4% of the soils were higher than this level (Figure 4E). The deficiency and excessive levels of bioavailable Zn are 0.4–0.6 mg kg−1 and 10–20 mg kg−1, respectively [36], and 93.2% of the soils were within the suitable level (Figure 4F). The average Cu and Zn values (1.55 and 1.83 mg kg−1) (Table 2A) were higher than those in tea plantations of eastern Black Sea, Turkey (0.99 and 1.21 mg kg−1) [38]. As such, bioavailable Cu and Zn in tea plantations were suitable for tea plant growth, Ca and Mg should be enhanced without decreasing P bioavailability and the potential toxic effect of excessive Mn should be paid attention.

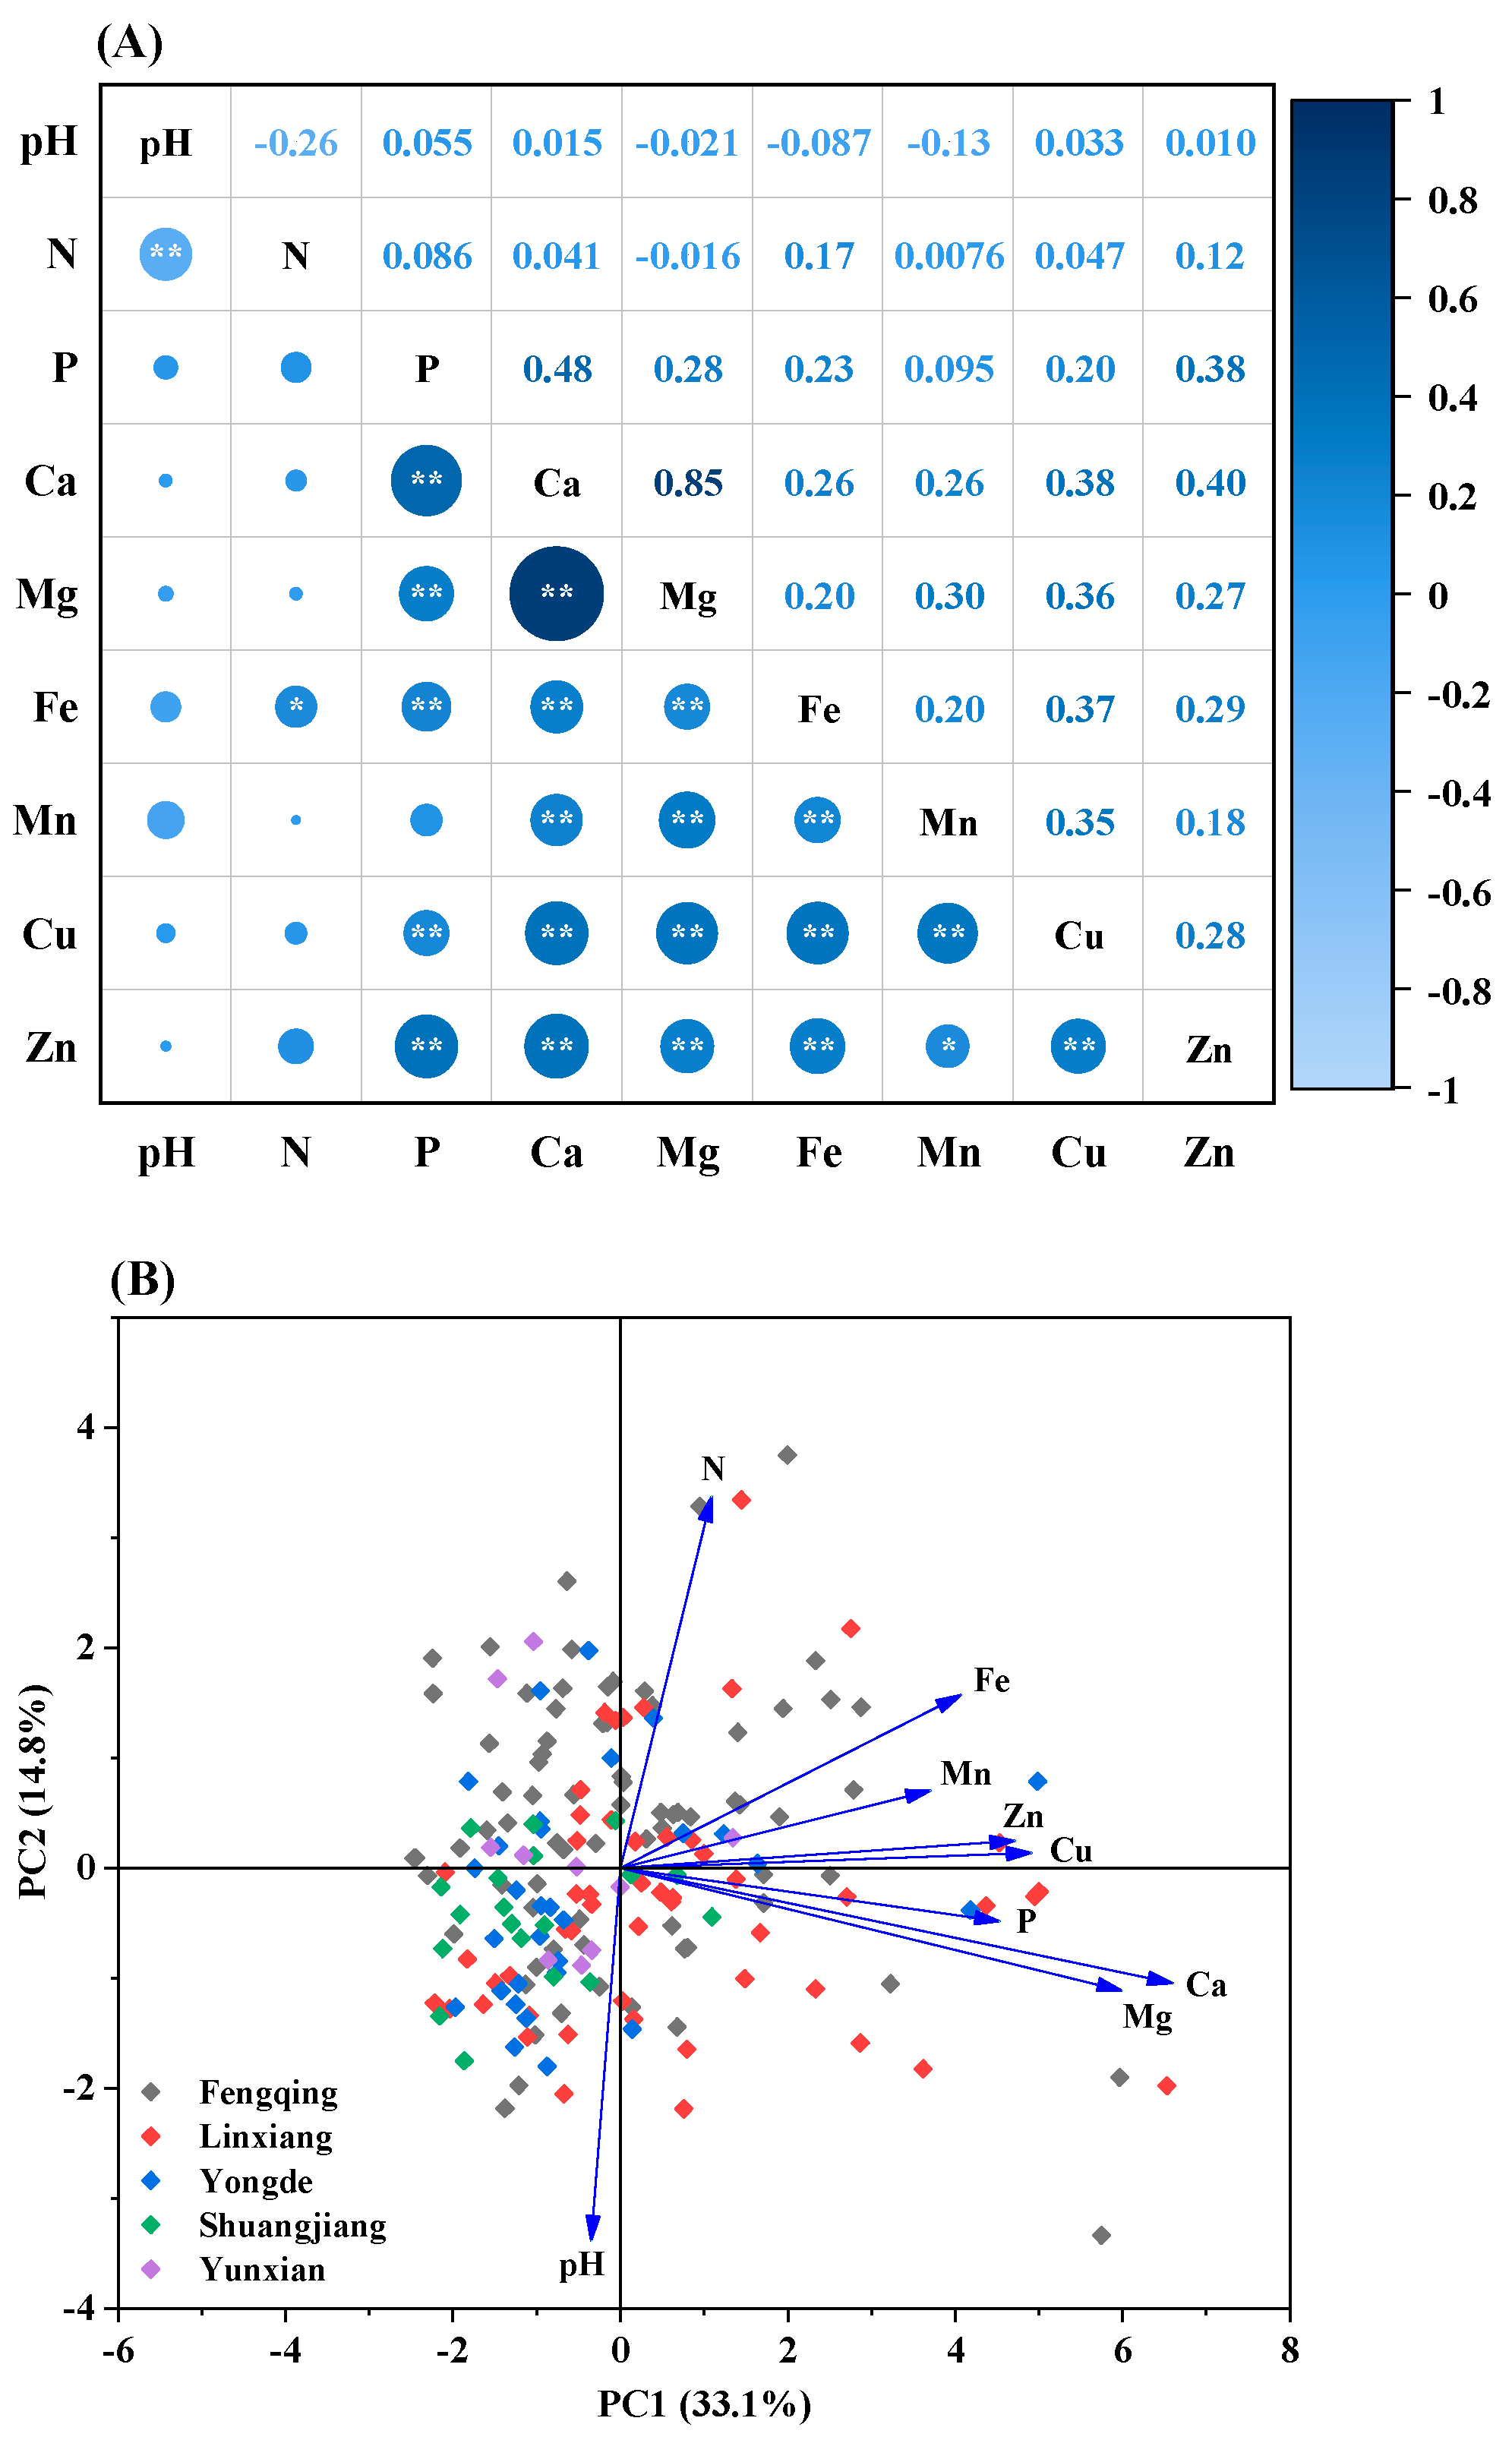
3.3. Correlation Analysis

Soil metallic elements’ bioavailability levels were affected by soil pH and fertilizers. Therefore, Pearson correlations of soil pH and fertilizers (N and P) with metals (Ca, Mg, Fe, Mn, Cu and Zn) were analyzed (Figure 5). Soil pH was significantly negatively correlated with bioavailable N (R = −0.26; p < 0.01). This indicated that intensive N fertilization accelerated soil acidification, which can improve metals’ bioavailability via dissolution [28,39]. This was supported by the significant negative correlations between soil pH and bioavailable Mg, Fe and Mn (R = −0.021, −0.087 and −0.13; p < 0.01). In addition, bioavailable Ca and Mg were significantly positively correlated (R = 0.85; p < 0.01), suggesting they originated from the same sources. Similarly, bioavailable P was significantly positively correlated with all metals excepting Mn (R = 0.20–0.48; p < 0.01), indicating the more important role of P than N in mediating metals’ bioavailability in tea plantations. P-induced cation mobilization was attributed to the decreased soil pH and chelation or adsorption reactions. After entering to soils, phosphoric acid in P fertilizers dissociated into H2PO4 and protons (H+), decreasing the surrounding pH to low levels (pH < 2) [40]. In addition, P can release cations from the soil solid matrix to labile forms via complexation or adsorption. Specifically, among the cations, Ca was the most significantly positively correlated with P (R = 0.38; p < 0.01), suggesting the important role of P in Ca mobilization. It has been reported that P can bind with Ca to form soluble humic acid-Ca-P complexes, which increase Ca bioavailability and facilitate nutrient cycling efficiency [41].
Given that incorporating all indices into one monitoring program is not feasible, principal component analysis (PCA) was performed, which can identify clusters among variables with a minimal data set [25,42]. The suitability of fertility indices data for PCA analysis was evaluated by KMO and Barlett tests [43], which showed values of 0.64 (>0.5) and 0.00 (<0.05), indicating feasible and reliable data [44]. The first principal component (PC1), accounting for 33.1% of the total data variance, showed strong positive loading on P (0.33), Ca (0.49), Mg (0.44), Cu (0.36) and Zn (0.35). The second principal component (PC2) accounted for 14.8% of the total data variance and showed strong positive loading with N (0.63) and negative loading with pH (−0.63), indicating that bioavailable N and soil pH were negatively correlated. In PCA variables, the longer arrows indicated greater effects, those with angle < 90° indicated positive correlations and the smaller the angle the stronger the correlation (Figure 5B). Soil pH and bioavailable N showed the largest angle (>90°), indicating a significant negative correlation, which was consistent with the Pearson correlation analysis (R = −0.26; p < 0.01) (Figure 5A). This, again, supported the finding that N fertilization is the driver of soil acidification. Bioavailable P showed a smaller angle with Ca than Mg, indicating a greater positive effect of P on Ca bioavailability. This was consistent with the Pearson correlation result (R = 0.48 vs. 0.28) (Figure 5A). In addition, the angles between bioavailable P and Fe, Zn and Cu were <90°, which was also consistent with the Pearson correlation analysis showing positive correlations (R = 0.20–0.38; p < 0.01).

3.4. Soil Fertility Assessment

Nine factors (soil pH, bioavailable N, P, Ca, Mg, Fe, Mn, Cu and Zn) closely related to tea plant growth, tea yield and quality were set as indices to calculate the integrated fertility index (IFI) to evaluate soil fertility. Given that different indices contribute differently to soil fertility, coefficient variation was introduced to determine the weight of each index, including membership value (Ni), average value of correlation coefficient (Vi) and weight coefficient (Wi) (Table 1C–E). The IFI of the studied tea plantations was 0.61–0.83 (Table 2B), indicating the overall fertility exceeded level II (IFI ≥ 0.5). Specifically, Fengqing (IFI = 0.77) and Linxiang (IFI = 0.83) reached fertility level I (IFI ≥ 0.75). However, the ratio and nutritional level distributions of individual indexes were complex and inconsistent. For example, the ratios of bioavailable Mn and Zn in Linxiang reaching nutritional level I were higher than Yongde (53.8% vs. 23.3% and 24.4% vs. 10%) (Table 2B). However, the ratios of bioavailable P, Ca and Cu in level I in Linxiang were lower than Yongde (2.56–16.7% vs. 3.33–23.3%). The IFI method was applied in soil quality assessment in a typical tea (Camellia sinensis L.)-growing area in Ortaçay Catchment, Rize province, east of the Black Sea [21]. This suggests that IFI can help in fertilization indication and agricultural management [45], but multi-indices should be involved to achieve more accurate assessment.

4. Conclusions

N and P are important fertilizers that are frequently applied to soils to ensure agricultural production, but excessive application leads to soil acidification. Compared to total metal content, the bioavailable fraction is readily available for uptake by plant roots and more contingent on soil fertility. This study features a survey on available fertilizers (N and P) and essential metals (Ca, Mg, Fe, Mn, Cu and Zn) in tea plantation soils (n = 190) from five major tea production regions (Fengqing, Linxiang, Yongde, Shuangjiang and Yunxian) in Lincang, Yunnan province, China. The results show that soils were acidified (pH = 3.44–5.53), with Linxiang and Yongde showing higher ratios, (57.7–63.3%) reaching nutritional level I (pH = 4.5–5.5), than the other three regions (20–50%). Soil-available N, P, Ca, Mg, Fe and Mn showed greater heterogeneity (4–66.5, 0.02–101, 15.5–1663, 3.03–496, 13.9–614 and 2.09–585 mg kg−1) than Cu and Zn (0.07–7.73 and 0.19–6.61 mg kg−1). Available Fe concentration in all soils reached nutritional level I (>4.5 mg kg−1), while 100% of available N was at level III (<80 mg kg−1). In addition, 70% of P, 66.3% of Ca, 65.3% of Mg and 41.1% of Cu were at level III, suggesting the five elements can be enhanced to improve soil fertility in tea plantations. Soil-available N was significantly negatively correlated with pH (R = −0.26), indicating excess N fertilization led to soil acidification. Nevertheless, P showed greater effects on available concentrations of Ca, Zn, Mg, Fe and Cu (R = 0.20–0.48; p < 0.01) than pH and N. This indicates that P is important in driving nutritional metals’ availability and P fertilization can be strategized to achieve optimal fertility for tea plant growth and production. Furthermore, bioavailable Cu and Zn were suitable for tea plant growth, Ca and Mg should be enhanced without decreasing P bioavailability and the potential toxic effect of excessive Mn should be paid attention. IFI analysis showed limitations by not taking the effects of soil type, redox potential (Eh), weather, seasonal variation and rainfall into account, indicating further efforts are required to make it more applicable.

Author Contributions

Conceptualization, Z.L. and X.L.; methodology, F.Y., Z.L. and Y.J.; software, Y.J. and Q.H.; formal analysis, Z.L.; investigation, F.Y. and Y.J.; resources, Z.L.; data curation, Y.J.; writing—original draft preparation, F.Y. and Z.L.; writing—review and editing, X.L.; supervision, X.L.; funding acquisition, Z.L. and X.L. All authors have read and agreed to the published version of the manuscript.

Funding

This research was funded by Yunnan Agricultural Joint Research Foundation (202301BD070001-154, 202101BD070001-043) and Special Foundation for Construction of Tea Industry Technology System (CARS-19), and the APC was funded by Yunnan Xingdian Talent Project (YNQR-QNRC-2019-027).

Institutional Review Board Statement

Not applicable.

Data Availability Statement

The data presented in this study are available on request from the corresponding author.

Conflicts of Interest

The authors declare no conflict of interest.

References

  1. Li, L.; Fu, Q.L.; Achal, V.; Liu, Y. A comparison of the potential health risk of aluminum and heavy metals in tea leaves and tea infusion of commercially available green tea in Jiangxi, China. Environ. Monit. Assess. 2015, 187, 228–239. [Google Scholar] [CrossRef] [PubMed]
  2. Li, Z.; Sun, J.; Shen, Y.; Yang, Y.; Wang, X.; Wang, X.; Tian, P.; Qian, Y. Deep migration learning-based recognition of diseases and insect pests in Yunnan tea under complex environments. Plant Methods 2024, 20, 101–116. [Google Scholar] [CrossRef] [PubMed]
  3. Tatiya, A.U.; Saluja, A.K.; Kalaskar, M.G.; Surana, S.J.; Patil, P.H. Evaluation of analgesic and anti-inflammatory activity of Bridelia retusa (Spreng) bark. J. Tradit. Complement. Med. 2017, 7, 441–451. [Google Scholar] [CrossRef] [PubMed]
  4. Stutter, M.I.; Shand, C.A.; George, T.S.; Blackwell, M.S.A.; Dixon, L.; Bol, R.; MacKay, R.L.; Richardson, A.E.; Condron, L.M.; Haygarth, P.M. Land use and soil factors affecting accumulation of phosphorus species in temperate soils. Geoderma 2015, 257–258, 29–39. [Google Scholar] [CrossRef]
  5. Yang, X.D.; Ni, K.; Shi, Y.Z.; Yi, X.Y.; Zhang, Q.F.; Fang, L.; Ma, L.F.; Ruan, J. Effects of long-term nitrogen application on soil acidification and solution chemistry of a tea plantation in China. Arg. Ecosyst. Environ. 2018, 252, 74–82. [Google Scholar] [CrossRef]
  6. Zeng, M.; de Vries, W.; Bonten, L.T.C.; Zhu, Q.; Hao, T.; Liu, X.; Xu, M.; Shi, X.; Zhang, F.; Shen, J. Model-based analysis of the long-term effects of fertilization management on cropland soil acidification. Environ. Sci. Technol. 2017, 51, 3843–3851. [Google Scholar] [CrossRef]
  7. Qiao, C.L.; Mia, S.; Wang, Y.Q.; Hou, J.J.; Xu, B. Assessing the effects of nitrification inhibitor DMPP on acidification and inorganic N leaching loss from tea (Camellia sinensis L.) cultivated soils with increasing urea–N rates. Sustainability 2021, 13, 994. [Google Scholar] [CrossRef]
  8. Ju, Y.; Luo, Z.; Bi, J.; Liu, C.; Liu, X. Transfer of heavy metals from soil to tea and the potential human health risk in a regional high geochemical background area in southwest China. Sci. Total Environ. 2024, 908, 168122–168134. [Google Scholar] [CrossRef]
  9. Han, W.; Kemmitt, S.J.; Brookes, P.C. Soil microbial biomass and activity in Chinese tea gardens of varying stand age and productivity. Soil Biol. Biochem. 2007, 39, 1468–1478. [Google Scholar] [CrossRef]
  10. Yan, P.; Shen, C.; Fan, L.; Li, X.; Zhang, L.; Zhang, L.; Han, W. Tea planting affects soil acidification and nitrogen and phosphorus distribution in soil. Arg. Ecosyst. Environ. 2018, 254, 20–25. [Google Scholar] [CrossRef]
  11. Li, Y.; Liu, K.; Zhu, J.; Jiang, Y.; Huang, Y.; Zhou, Z.; Chen, C.; Yu, F. Manganese accumulation and plant physiology behavior of Camellia oleifera in response to different levels of nitrogen fertilization. Ecotox. Environ. Safe. 2019, 184, 109603–109612. [Google Scholar] [CrossRef] [PubMed]
  12. Ruan, J.; Gerendás, J.; Härdter, R.; Sattelmacher, B. Effect of nitrogen form and root-zone pH on growth and nitrogen uptake of tea (Camellia sinensis) plants. Ann. Bot. 2007, 99, 301–310. [Google Scholar] [CrossRef] [PubMed]
  13. Qi, D.; Wieneke, X.; Tao, J.; Zhou, X.; Desilva, U. Soil pH is the primary factor correlating with soil microbiome in karst rocky desertification regions in the Wushan County, Chongqing, China. Front. Microbiol. 2018, 9, 1027–1039. [Google Scholar] [CrossRef] [PubMed]
  14. Alnaimat, A.S.; Barciela-Alonso, M.C.; Herbello-Hermelo, P.; Domínguez-González, R.; Bermejo-Barrera, P. In vitro assessment of major and trace element bioaccessibility in tea samples. Talanta 2021, 225, 122083. [Google Scholar] [CrossRef]
  15. Shukla, Y. Tea and cancer chemoprevention: A comprehensive review. Asian Pac. J. Cancer P. 2007, 8, 155–166. [Google Scholar]
  16. Kelepertzis, E. Accumulation of heavy metals in agricultural soils of Mediterranean: Insights from Argolida basin, Peloponnese, Greece. Geoderma 2014, 221, 82–90. [Google Scholar] [CrossRef]
  17. George, T.S.; Richardson, A.E.; Simpson, R.J. Behaviour of plant-derived extracellular phytase upon addition to soil. Soil. Biol. Biochem. 2005, 37, 977–988. [Google Scholar] [CrossRef]
  18. Liu, X.; Fu, J.W.; Tang, N.; Da Silva, E.B.; Cao, Y.; Turner, B.L.; Chen, Y.; Ma, L.Q. Phytate induced arsenic uptake and plant growth in arsenic-hyperaccumulator Pteris vittata. Environ. Pollut. 2017, 226, 212–218. [Google Scholar] [CrossRef]
  19. NY/T391-2021; Green Food-Environmental Quality for Production Area. Ministry of Agriculture and Rural Affairs of the People’s Republic of China: Beijing, China, 2021.
  20. Dos Santos, W.P.; Silva, M.L.N.; Avanzi, J.C.; Acuña-Guzman, S.F.; Cândido, B.M.; Cirillo, M.Â.; Curi, N. Soil quality assessment using erosion-sensitive indices and fuzzy membership under different cropping systems on a Ferralsol in Brazil. Geoderma Reg. 2021, 25, 385–394. [Google Scholar] [CrossRef]
  21. Dengiz, O.; İç, S.; Saygın, F.; İmamoğlu, A. Assessment of soil quality index for tea cultivated soils in ortaçay micro catchment in Black Sea Region. J. Agr. Sci-Sri. Lanka. 2020, 26, 42–53. [Google Scholar] [CrossRef]
  22. Qi, Y.; Darilek, J.L.; Huang, B.; Zhao, Y.; Sun, W.; Gu, Z. Evaluating soil quality indices in an agricultural region of Jiangsu Province, China. Geoderma 2009, 149, 325–334. [Google Scholar] [CrossRef]
  23. Rahmanipour, F.; Marzaioli, R.; Bahrami, H.A.; Fereidouni, Z.; Bandarabadi, S.R. Assessment of soil quality indices in agricultural lands of Qazvin Province, Iran. Ecol. Indic. 2014, 40, 19–26. [Google Scholar] [CrossRef]
  24. Wan, R.; Zhou, D. Soil nutrients and fertility quality evaluation of tea garden in Changning county. Southwest China J. Agric. Sci. 2022, 35, 2114–2123. (In Chinese) [Google Scholar]
  25. Guo, H.; Yao, J.; Cai, M.; Qian, Y.; Guo, Y.; Richnow, H.H.; Blake, R.E.; Doni, S.; Ceccanti, B. Effects of petroleum contamination on soil microbial numbers, metabolic activity and urease activity. Chemosphere 2012, 87, 1273–1280. [Google Scholar] [CrossRef]
  26. Chae, Y.; Cui, R.; Kim, S.W.; An, G.; Jeong, S.W.; An, Y.J. Exoenzyme activity in contaminated soils before and after soil washing: ß-glucosidase activity as a biological indicator of soil health. Ecotoxicol. Environ. Saf. 2017, 135, 368–374. [Google Scholar] [CrossRef]
  27. Wang, H.; Li, X.; Chen, Y.; Li, Z.; Hedding, D.W.; Nel, W.; Ji, J.; Chen, J. Geochemical behavior and potential health risk of heavy metals in basalt-derived agricultural soil and crops: A case study from Xuyi County, eastern China. Sci. Total Environ. 2020, 729, 139058–139066. [Google Scholar] [CrossRef]
  28. Guo, J.H.; Liu, X.J.; Zhang, Y.; Shen, J.L.; Han, W.X.; Zhang, W.F.; Christie, P.; Goulding, K.W.T.; Vitousek, P.M.; Zhang, F.S. Significant acidification in major Chinese croplands. Science 2010, 327, 1008–1010. [Google Scholar] [CrossRef]
  29. Yan, P.; Wu, L.; Wang, D.; Fu, J.; Shen, C.; Li, X.; Zhang, L.; Zhang, L.; Fan, L.; Wenyan, H. Soil acidification in Chinese tea plantations. Sci. Total Environ. 2020, 715, 136963–136970. [Google Scholar] [CrossRef]
  30. Mao, Q.; Lu, X.; Zhou, K.; Chen, H.; Zhu, X.; Mori, T.; Mo, J. Effects of long-term nitrogen and phosphorus additions on soil acidification in an N-rich tropical forest. Geoderma 2017, 285, 57–63. [Google Scholar] [CrossRef]
  31. Jahan, I.; Shopan, J.; Rahman, M.M.; Sarkar, A.; Baset, M.A.; Zhang, Z.; Li, X.; Ahammed, G.J.; Hasan, M.K. Long-term traditional fertilization alters tea garden soil properties and tea leaf quality in Bangladesh. Agronomy 2022, 12, 2128. [Google Scholar] [CrossRef]
  32. Duan, L.; Huang, Y.; Hao, J.; Xie, S.; Hou, M. Vegetation uptake of nitrogen and base cations in China and its role in soil acidification. Sci. Total Environ. 2004, 330, 187–198. [Google Scholar] [CrossRef] [PubMed]
  33. McKenzie, N.N.; Jacquier, D.D.; Isbell, R.R.F.; Brown, K.K. Australian Soils and Landscapes: An Illustrated Compendium; CSIRO: Collingwood, Australia, 2004; pp. 62–64. [Google Scholar]
  34. Turner, B.L.; Engelbrecht, B.M.J. Soil organic phosphorus in lowland tropical rain forests. Biogeochemistry 2011, 103, 297–315. [Google Scholar] [CrossRef]
  35. George, T.S.; Turner, B.L.; Gregory, P.J.; Cade-Menun, B.J.; Richardson, A.E. Depletion of organic phosphorus from Oxisols in relation to phosphatase activities in the rhizosphere. Eur. J. Soil. Sci. 2006, 57, 47–57. [Google Scholar] [CrossRef]
  36. Ndakidemi, P.A.; Semoka, J.M.R. Soil fertility survey in western Usambara Mountains, northern Tanzania. Pedosphere 2006, 16, 237–244. [Google Scholar] [CrossRef]
  37. Mhoro, L.; Semu, E.; Amuri, N.; Msanya, B.; Munishi, J.A.; Malley, Z. Growth and yield responses of rice, wheat and beans to Zn and Cu fertilizers in soils of Mbeya region, Tanzania. Int. J. Agric. Pol. Res. 2015, 3, 402–441. [Google Scholar]
  38. Özyazıcı, M.A.; Özyazıcı, G.; Dengiz, O. Determination of micronutrients in tea plantations in the eastern Black Sea Region, Turkey. Afr. J. Agric. Res. 2011, 6, 5174–5180. [Google Scholar]
  39. Tian, D.; Niu, S. A global analysis of soil acidification caused by nitrogen addition. Environ. Res. Lett. 2015, 10, 024019–024030. [Google Scholar] [CrossRef]
  40. Ware, G.W.; Albert, L.A.; Bro-Rasmussen, F.; Crosby, D.G.; de Voogt, P.; Frehse, H.; Hutzinger, O.; Mayer, F.L.; Morgan, D.P.; Park, D.L. Role of Phosphorus in (im) Mobilization and Bioavailability of Heavy Metals in the Soil-Plant System; Springer: New York, NY, USA, 2003. [Google Scholar]
  41. Nguyen, T.A.H.; Ngo, H.H.; Guo, W.S.; Nguyen, T.T.; Vu, N.D.; Soda, S.; Nguyen, T.H.H.; Nguyen, M.K.; Tran, T.V.H.; Dang, T.T.; et al. White hard clam (Meretrix lyrata) shells as novel filter media to augment the phosphorus removal from wastewater. Sci. Total Environ. 2020, 741, 140483–140495. [Google Scholar] [CrossRef]
  42. Wajda, Ł.; Duda-Chodak, A.; Tarko, T.; Kamiński, P. Application of principal component analysis for the optimisation of lead (II) biosorption. World J. Microbiol. Biotechnol. 2017, 33, 193. [Google Scholar] [CrossRef]
  43. Elemile, O.O.; Ibitogbe, E.M.; Folorunso, O.P.; Ejiboye, P.O.; Adewumi, J.R. Principal component analysis of groundwater sources pollution in Omu-Aran Community, Nigeria. Environ. Earth Sci. 2021, 80, 690–706. [Google Scholar] [CrossRef]
  44. Faloye, O.T.; Ajayi, A.E.; Kamchoom, V.; Akintola, O.A.; Oguntunde, P.G. Evaluating impacts of biochar and inorganic fertilizer applications on soil quality and maize yield using principal component analysis. Agronomy 2024, 14, 1761. [Google Scholar] [CrossRef]
  45. Cao, H.; Jia, M.; Song, J.; Xun, M.; Fan, W.; Yang, H. Rice-straw mat mulching improves the soil integrated fertility index of apple orchards on cinnamon soil and fluvo-aquic soil. Sci. Hortic. 2021, 278, 109837–109848. [Google Scholar] [CrossRef]
Figure 1. Study area and distribution of 190 sampling sites in 5 regions, including Fengqing (n = 78), Linxiang (n = 52), Yongde (n = 30), Shuangjiang (n = 20) and Yunxian (n = 10) in Yunnan province, southwest China.
Agriculture 15 00543 g001
Figure 2. Soil pH values of 190 tea plantation soils from 5 regions, including Fengqing (n = 78), Linxiang (n = 52), Yongde (n = 30), Shuangjiang (n = 20) and Yunxian (n = 10). Dashed line represents soil pH values at 4.5 and 5.5, which classifies soil nutritional levels into grade I (pH = 4.5–5.5), II (pH = 4–4.5 or 5.5–6.5) and III (pH > 6.5 or <4) (NT/T 391–2021).
Agriculture 15 00543 g002
Figure 3. Soil-available N (A) and P (B) concentrations in 190 tea plantation soils from five regions, including Fengqing (n = 78), Linxiang (n = 52), Yongde (n = 30), Shuangjiang (n = 20) and Yunxian (n = 10) in Lincang, southwest China. The solid line and square inside the box represent the median and mean value, respectively.
Agriculture 15 00543 g003
Figure 4. Soil-available Ca (A), Mg (B), Fe (C), Mn (D), Cu (E) and Zn (F) concentrations in 190 tea plantation soils from five regions including Fengqing (n = 78), Linxiang (n = 52), Yongde (n = 30), Shuangjiang (n = 20) and Yunxian (n = 10) in Lincang, southwest China. The solid line and square inside the box represent the median and mean value, respectively.
Agriculture 15 00543 g004
Figure 5. Pearson correlations (A) and principal component analysis (PCA) (B) among soil pH and available N, P and metallic element concentrations with significance at p < 0.05 (*) and p < 0.01 (**).
Agriculture 15 00543 g005
Table 1. Classification of soil nutritional levels based on pH using metallic elements available concentrations (A), turning point values of the membership curve (B), membership value Ni (C), correlation coefficient average value Vi (D) and weight coefficient Wi (E) in tea plantations from 5 regions.
(A) ClassificationpHNPCaMgFeMnCuZn
(mg kg−1)
I4.5–5.5>100>20>1000>300>4.5>30>2>2
II4.0–4.5 or 5.5–6.580–1005–20300–100050–300>4.515–301–20.5–2
III>6.5 or <4.0<80<5<300<50<4.5<15<1<0.5
(B) ClassificationpHTurning point value of membership curve (mg kg−1)
X14.060250105010.30.5
X24.520030300501501025
X35.5
X46.0
(C) RegionMembership value (Ni)
Fengqing0.8920.10.269 10.984 110.778 0.342
Linxiang10.10.292 11 110.984 0.36
Yongde10.10.389 0.737 0.838 110.651 0.274
Shuangjiang10.10.142 0.50.44 0.71210.476 0.6
Yunxian0.5680.10.177 0.842 0.951 0.95510.412 0.384
Overall10.10.276 0.993 1 110.762 0.366
(D) RegionAverage value of correlation coefficient (Vi)
Fengqing0.187 0.137 0.293 0.382 0.398 0.18 0.163 0.101 0.263
Linxiang0.326 0.122 0.211 0.407 0.332 0.271 0.268 0.332 0.388
Yongde0.184 0.316 0.43 0.438 0.481 0.335 0.174 0.121 0.319
Shuangjiang0.248 0.205 0.284 0.397 0.24 0.347 0.335 0.351 0.415
Yunxian0.346 0.187 0.408 0.408 0.412 0.309 0.295 0.198 0.286
Overall0.0840.0950.2220.3330.2930.1880.1710.1370.157
(E) RegionWeight coefficient (Wi)
Fengqing0.077 0.056 0.12 0.1560.163 0.074 0.067 0.041 0.108
Linxiang0.109 0.041 0.07 0.136 0.111 0.09 0.089 0.111 0.129
Yongde0.055 0.095 0.13 0.132 0.145 0.101 0.052 0.036 0.096
Shuangjiang0.079 0.065 0.091 0.127 0.077 0.111 0.107 0.112 0.132
Yunxian0.106 0.057 0.125 0.125 0.126 0.094 0.09 0.061 0.087
Overall0.042 0.048 0.112 0.168 0.148 0.095 0.086 0.069 0.079
Table 2. The mean value of soil pH, available concentrations of fertilizers (N and P) and metals (Ca, Mg, Fe, Mn, Cu and Zn) (A) and elements’ nutritional level distributions (percentage in level I, II and III; %) (B) in tea plantations from five regions, including Fengqing (n = 78), Linxiang (n = 52), Yongde (n = 30), Shuangjiang (n = 20) and Yunxian (n = 10) in Lincang, southwest China.
(A) RegionpHNPCaMgFeMnCuZn
(mg kg1)
Fengqing4.44 ± 0.3829.7 ± 13.17.26 ± 14.6305 ± 29249.3 ± 45.7254 ± 12855.9 ± 70.91.58 ± 0.751.71 ± 1.25
Linxiang4.65 ± 0.3327.2 ± 10.97.97 ± 13.8389 ± 33785.1 ± 100198 ± 92.178.8 ± 1011.97 ± 1.191.80 ± 0.91
Yongde4.54 ± 0.3523.6 ± 1011.0 ± 25.1227 ± 22242.8 ± 36.1196 ± 90.233.9 ± 44.21.34 ± 1.411.37 ± 0.94
Shuangjiang4.58 ± 0.3821.8 ± 11.63.31 ± 3.76161 ± 98.925.1 ± 24.7118 ± 56.532.1 ± 26.61.01 ± 0.623.00 ± 1.96
Yunxian4.26 ± 0.2524.6 ± 10.54.38 ± 6.23256 ± 18647.8 ± 35.7145 ± 48.621.5 ± 20.50.89 ± 0.581.92 ± 0.56
Overall4.52 ± 0.3727.0 ± 127.48 ± 15.5298 ± 28455.4 ± 65.5209 ± 11254.4 ± 74.61.55 ± 1.051.83 ± 1.19
(B) RegionpHNPCa
IIIIIIIIIIIIIIIIIIIII
Fengqing39.748.711.51008.9720.570.52.5633.364.1
Linxiang57.738.53.8510013.517.369.25.7742.351.9
Yongde63.333.33.331001026.763.33.3316.780
Shuangjiang5545 100 1585 1090
Yunxian206020100103060 3070
Overall5042.67.41009.4720.5703.1630.566.3
RegionMgFe aMnCuZnIFI bFertility level
IIIIIIIIIIIIIIIIIIIIIIIII
Fengqing 34.665.410053.821.824.416.739.743.624.467.97.690.77 II
Linxiang3.8551.944.210071.213.515.436.544.219.232.767.3 0.83 I
Yongde 208010023.346.73023.323.353.31090 0.69 II
Shuangjiang 5951005510351035554045150.61 II
Yunxian 30701002010701020704060 0.68 II
Overall1.0533.765.310052.621.126.322.136.841.126.868.44.740.81 I
a Available Fe concentrations in all soil samples were at grade I. b IFI: integrated fertility index. IFI ≥ 0.75, 0.5 ≤ IFI < 0.75, 0.25 ≤ IFI < 0.5 and IFI < 0.25 indicate soil fertility quality at levels I, II, III, and IV, respectively.
Disclaimer/Publisher’s Note: The statements, opinions and data contained in all publications are solely those of the individual author(s) and contributor(s) and not of MDPI and/or the editor(s). MDPI and/or the editor(s) disclaim responsibility for any injury to people or property resulting from any ideas, methods, instructions or products referred to in the content.

