Article

Evaluation of Genotype × Environment Interactions in Quinoa Genotypes (Chenopodium quinoa Willd.)

by
Ebrahim Souri Laki
1,*,
Babak Rabiei
1,
Vahid Jokarfard
1,
Mahboubeh Shahbazi Miyangaskari
1,
Hassan Marashi
2 and
Andreas Börner
3
1
Department of Plant Production and Genetic Engineering, Faculty of Agricultural Sciences, University of Guilan, Rasht 4199613776, Iran
2
Department of Biotechnology and Plant Breeding, Faculty of Agricultural Sciences, University of Ferdowsi, Mashhad 9177948944, Iran
3
Department of Gene Bank, Institute of Plant Genetics and Crop Plant Research, OT Gatersleben, Corrensstr. 3, 06466 Seeland, Germany
*
Author to whom correspondence should be addressed.
Agriculture 2025, 15(5), 515; https://doi.org/10.3390/agriculture15050515
Submission received: 1 September 2024 / Revised: 11 October 2024 / Accepted: 18 November 2024 / Published: 27 February 2025
(This article belongs to the Section Crop Genetics, Genomics and Breeding)

Abstract

:
Quinoa (Chenopodium quinoa Willd.), as one of the quasi-cereal crop plants with high nutritional value and yield potential, especially in stressful environments, has recently been proposed as a suitable alternative plant for sustainable nutrition of the world’s growing population. In Iran, this plant has been considered as a valuable crop for several years, but since quinoa is native to the South American region, therefore, while assessing the compatibility of different imported cultivars, it is necessary to introduce stable high-yielding cultivars for different regions of the country. The objective of the current study was to investigate the GEI and the adaptability and stability of grain yield of 20 Bolivian and Peruvian quinoa genotypes. The experiment layout was a randomized complete block design with three replications in Kuhdasht and Poldokhtar counties, Lorestan province, Iran, during two cropping years, 2020 and 2021. To evaluate the stability of genotypes, the methods of Roemer’s environmental variance, Francis and Kannenberg’s coefficient of variation, Shukla’s stability variance, Wricke’s equivalence, the regression coefficient of Finlay and Wilkinson, the deviation from regression line of Eberhart and Russell, the intra-location variance of Lin and Binns and the GGE-Biplot were used. The results of combined analysis of variance showed a significant difference between genotypes and environments as well as the genotype × environment interaction at 1% probability level. The results of stability analysis of the genotypes using different methods were also very different, but in total, using all studied stability criteria along with grain yield, four genotypes 7, 10, 14, and 15 were identified as the most stable and productive genotypes. In addition to low-yield fluctuations and mean grain yield of more than 3000 kg.ha−1, these genotypes had other suitable characteristics such as dwarfism, early maturity and low saponin content, and are introduced as the superior genotypes of this experiment for cultivation in the studied areas.

1. Introduction

Quinoa (Chenopodium quinoa Willd.) is from the amaranth family, more than 5000 years old, and native to the Andes in Bolivia, Chile, and Peru. The closest related species to quinoa are C. hircinum and C. berlandieri [1]. This plant is genetically an allotetraploid plant (2n = 4x = 36) which shows diploid behavior in most qualitative traits. Although quinoa is a self-pollinating species, there may be 3.81–19.88% cross-pollination in response to other flowering and pollen grains [2].
Quinoa is known for growing in difficult weather conditions and is resistant to drought, salinity, and cold. Depending on the cultivar and the environmental conditions of the cultivation area, the potential yield of quinoa has been reported as 470–3420 kg.ha−1 [3]. Stem diameter, plant height, grain length and diameter also vary in different cultivars [4]. The production cycle and the growth period of quinoa are associated with photoperiod sensitivity and last 125–240 days, while some cultivars reach physiological maturity 90 days after planting [5].
Grain is the major production of quinoa, and has been compared with powdered milk by the Food and Agriculture Organization (FAO) because of its high nutritional value [6]. The main importance of quinoa, known as a quasi-cereal plant worldwide, is due to the presence of protein in its grains, which, in addition to being quantitatively and qualitatively better than common cereals such as wheat and corn, is also very important in amino acid composition, bringing quinoa closer to FAO standards for human nutrition. Protein, fat, sugar, fiber, and ash are the main constituents of quinoa grains, which are about 12.9, 6.5, 63.7, 13.9, and 3.0 percent of the whole grain, respectively. Quinoa milling has little effect on the amount of these compounds. However, the amount of these compounds in quinoa seed embryos is 23.5, 10.2, 43.1, 18.9, and 4.3 percent, respectively, and, as noted, 57% and 49% of the protein and fat of the total grain are present in the embryo, respectively [7]. It also has high levels of lysine, methionine, and cysteine in the amino acid composition [8]. Quinoa grains have less sodium but more calcium, magnesium, phosphorus, potassium, iron, manganese, and zinc than wheat, barley, and corn [9].
For the past two decades, interest in this product has dramatically increased throughout the world because of its excellent nutritional profile and its potential as an alternative to sustainable nutrition for the world’s growing population [10,11]. Quinoa production in 2022 was 702,015 tons worldwide, most of which was produced in Peru, Bolivia, and Ecuador. The value of quinoa exports has also increased from USD 135.02 million to USD 209 million from 2012 to 2022 [12].
The existence of interaction between genotype and the environment causes different reactions of genotypes in different environments. One of the reasons for the slow process of breeding and introduction of cultivars in different regions is the interaction between genotype and the environment. Therefore, evaluating the compatibility and stability of cultivars in different environmental conditions is of special importance in breeding programs and can provide valuable information about the yield of cultivars in different environments [13]. In general, stability analysis methods can be divided into two general categories, including parametric (such as variance and regression) and non-parametric (such as ranking) methods. Since the results of different stability methods in selecting high-yielding and stable cultivars are very different, it is better to use the results of various methods to select the best genotypes for each of the studied locations.
There is limited research on the stability analysis of quinoa cultivars compared to other crops. Maliro et al. [14] evaluated yield and yield components of 11 diverse quinoa cultivars from Bolivia, Chile, Ecuador, USA, Canada, and Denmark in two central regions of Malawi under both rainfed and irrigated conditions, and reported that the effect of genotype, environment, and genotype × environment interaction (GEI) on grain yield and a number of related traits was significant. They showed that under irrigation conditions, the Titicaca cultivar, with a mean yield of 3019 kg.ha−1, produced the highest grain yield. Meanwhile, under dryland conditions, the black seed variety (originating from Colorado, USA), with a mean grain yield of 2050 kg.ha−1, was the most productive cultivar. Overall, the grain yield of all cultivars under irrigation conditions was higher than under rainfed conditions.
Mustafa et al. [15], in a study aimed at evaluating the compatibility of ten quinoa genotypes in two regions during two cropping years in Turkey, reported that the effect of genotype and GEI on most of the studied traits was significant. Among the studied genotypes, Q-52, Rainbow, and Red genotypes were introduced as high-yield and compatible genotypes to the studied areas. Thiam et al. [16] also studied 14 different quinoa genotypes in five central regions of Morocco to evaluate the compatibility and stability of quinoa genotypes for important traits related to yield and yield components. Their results showed that there was a great variation between genotypes and between locations for all studied traits. The results of stability analysis of genotypes using the AMMI method also showed that 23% and 32% of grain yield variability were explained by the effect of genotype and GEI, respectively. They finally identified two genotypes as high-yield genotypes with general adaptation in all five regions.
Climate change throughout the world in hot and dry areas, as well as the gradual salinization of the agricultural soils on the one hand, and the high quality and nutritional value and tolerance of quinoa to environmental stresses such as drought and salinity on the other hand, are a reasonable justification for using quinoa as a suitable plant to achieve sustainable agriculture and proper nutrition of the growing population. Iran is a large country with varied climatic conditions, most of which has a dry climate with an average annual rainfall of one-third of the world average. Soil in most parts of Iran is also limited in terms of texture and physical and chemical properties. The objective of the current study was to identify and introduce high-yielding and stable quinoa genotypes as a complementary or alternative plant to those whose cultivation has been reduced or stopped under the environmental conditions of the western regions of Iran.

2. Materials and Methods

2.1. Plant Materials and Experimental Conditions

The plant materials of this experiment were 20 quinoa genotypes (Table 1), all of which were obtained from the Gene Bank of the Leibniz Institute of Plant Genetics and Crop Plant Research, Gatersleben, Germany. The experiment was carried out in a randomized complete block design with three replications in two research fields in Kuhdasht (47°36′ E latitude and 33°32′ N longitude with an altitude of 1195 m) and Poldokhtar (47°42′ E latitude and 33°09′ N longitude with an altitude of 673 m) counties, Lorestan province, Iran, during the 2020 and 2021 cropping years. Agro-climatic properties of the studied areas are presented in Table 2. To provide suitable moisture for plowing, as well as to stimulate the germination and emergence of weed seeds buried in the soil for better control of weeds, the experimental field was irrigated twice before tillage. After irrigation and reaching the field capacity of soil moisture, field preparation including plowing, discing, and leveling was performed. Before planting and at the same time as plowing, 50 kg.ha−1 of potassium sulfate, 40 kg.ha−1 of triple superphosphate, and 50 kg.ha−1 of urea fertilizers were applied. Moreover, 50 kg.ha−1 of urea fertilizer was used as a topdress at two stages: half in the 6–8 leaf stage and the other half before the flowering stage. The amount of sown seeds used was between 0.2 and 0.4 g. based on the genotype. The seeds of each genotype were planted manually in three rows of 10 m at a depth of 2 cm. The distance between the rows was 40 cm, and between the plants in the rows it was 3–5 cm. Other agronomic operations, including thinning additional plants to achieve suitable plant density, irrigation, and weed, pest, and disease control, were carried out at the appropriate times. A rain system was used to irrigate quinoa plants. The first irrigation was carried out after sowing the genotypes, and the second and third irrigation were set 4 days apart, while subsequent irrigations were scheduled between 7 and 15 days later. Moreover, weeds were manually removed for the entire growing season, to keep the soil bare. To control pests, especially the Caradina armyworm (Spodoptera exigua), two Lit.ha−1 of 40% Cypermethrin pesticide were used. Different characteristics, including stem diameter, plant height, panicle length, number of panicles per plant, number of grains per panicle, 1000-grain weight, days to maturity, harvest index, and saponin content were measured. To measure grain yield, all plants in each plot were harvested and threshed, and then the grains were weighed and recorded based on 10% moisture content.

2.2. Statistical Analysis

For statistical analysis of the data, a simple analysis of variance was first performed separately for each location. Then, the uniformity of variance of experimental errors was investigated using Bartlett’s test, and in the case of uniform variances, a combined analysis of variance was performed, assuming the year was random while the location and cultivar were constant. The comparison of means was performed using Tukey’s test at a 5% probability level. To determine the grain yield stability, eight different stability statistics including Wricke’s equivalence [17], the regression coefficient of Finlay and Wilkinson [18], the deviation from regression line of Eberhart and Russell [19], the environmental variance of Romer [20], the stability variance of Shukla [21], the environmental coefficient of variation of Francis and Kannenberg [22], the years within location variance of Lin and Binns [23], and the GGE-Biplot [24] were evaluated, as follows.
Wricke [17] proposed the concept of equivalence as the contribution of each genotype to the GEI sum of squares. The following equation shows the mathematical process of this stability statistic:
W 2 = ( X i j X ¯ i . X ¯ . j + X ¯ . . ) 2
where Xij is the grain yield of genotype ith in environment jth; X - i . is the mean grain yield of genotype ith; X - . j is the mean grain yield of the environment jth; and X - . . is the grand mean.
Finlay and Wilkinson’s regression coefficient [18] was calculated using the following equation:
b i = i = 1 q ( X ij X - i . ) ( X - . j X - . . ) j = 1 q ( X - . j X - . . ) 2
where i is the genotype, j is the environment, ( X ij X - i . ) is the difference between the phenotype value of the ith genotype and the genotype means over all environments and ( X - . j X - . . ) is the effect of the jth environment.
Eberhart and Russell [19] used the mean square deviation (error) from the regression of the values of each genotype in different environments onto the environmental means as the stability parameter. The following equation shows the mathematical process of this stability statistic:
S di 2 = j = 1 q ( X ij X - i . ) 2 b i 2 j = 1 q ( X - . j X - . . ) 2 q 2
where ( X ij X - i . ) is the difference between the phenotype value of the ith genotype and the genotype means over all environments, ( X - . j X - . . ) is the effect of the jth environment, b i is the Finlay and Wilkinson regression coefficient and q is the number of environments.
Romer [20] proposed the variance of yield performance for test genotypes across environments as a stability parameter. The mathematical equation for this parameter is as follows:
S 2 = ( R i j m i ) 2 e 1
where Rij is the yield of the ith genotype in the jth environment, mi is the grand mean yield across all environments, and e is the number of environments. The minimum value of S2 refers to the greatest stability.
Shukla [21] suggested the stability variance of genotype ith as its variance across environments after the main effects of environmental means have been removed. According to this statistic, genotypes with minimum values are more stable. This statistic was calculated based on the following equation:
σ 2 = p p 2 q 1 W 2 W i 2 ( p 1 ) ( p 2 ) ( q 1 )
where W2 is Wricke’s equivalence, and p and q are the numbers of genotypes and environments, respectively.
The coefficient of variation was suggested by Francis and Kannenberg [22] as a parametric stability statistic through the combination of the coefficient of variation, mean grain yield, and environmental variance.
CV = SD x X -
where SDx is the standard deviation of a genotype mean across environments and is the grand mean. Genotypes with low CV, low environmental variance, and high mean yield are considered the most desirable.
The mean square of distance between the genotype’s response and the maximum response over environments is defined as the superiority index (P) [23]. A low value of Pi indicates high relative stability. Furthermore, the following equation shows mathematical relations for this statistic:
P = j = 1 n ( X ij M j ) 2 2 n
where n is the number of environments, Xij is the yield of the ith genotype in the jth environment, and Mj is the maximum response (Yield) among all genotypes in the jth environment.
Simultaneous study of the genotype plus genotype–environment interaction was performed using the GGE-Biplot, where the GGE-Biplot used a principal component consisting of a set of elite lines scores multiplied by environment scores, which give a two-dimensional biplot.
Graphical decomposition was made using the GGE-Biplot based on the individual quantities by the following formula [24]:
Yij − μ − βj = λ1 ξi1 ηj1 + λ2 ξi2 ηj2 + εij
where Yij is the mean of the genotype in the jth environment, μ is the mean of all genotypes, βj is the main effect of the jth environment, λ1 and λ2 are the special quantities for the first and second components, respectively, ξi1 and ξi2 are the special vectors of genotypes, and ηj1 and ηj2 are the environmental vectors of the first and second components, respectively, and εij is the remaining quantity for the ith genotype in the jth environment.
The sum of grain yield and stability rank was used to select high-yielding and stable genotypes. In this way, the rank of each genotype was first determined based on its grain yield in each environment (rank 1–20 for the genotype with the highest and lowest grain yield, respectively), and then the mean rank of each genotype in four environments was obtained. In addition, the rank of each genotype for each stability index was also determined, so that for all stability indices except the regression coefficient of Finlay and Wilkinson [18], rank 1 was given to the genotype with the lowest value and rank 20 to the genotype with the highest value, while for the regression coefficient of Finlay and Wilkinson [18], because the stable genotypes in this method have a regression line slope equal to one, the number one was used as the basis and the genotypes were ranked according to their distance from one. After ranking the genotypes based on all stability indices, the mean rank of each genotype was calculated. Finally, the sum of two ranks, yield and stability, was calculated, and the genotype with the lowest rank was introduced as a high-yielding and stable genotype.
The data were analyzed using SAS statistical software, version 9.4. Mean values of yield-related traits were compared using Tukey at a 5% significance level [25]. Parametric stability parameters such as Wricke’s equivalence, the regression coefficient of Finlay and Wilkinson, the deviation from the regression line of Eberhart and Russell, the environmental variance of Romer, the stability variance of Shukla, the environmental coefficient of variation of Francis and Kannenberg, and the years-within-location variance of Lin and Binns were analyzed by using the online software STABILITYSOFT (https://manzik.com/stabilitysoft/ accessed 10 February 2024) [26], and the GGE-Biplot method was performed using GenStat version 17 software [27].

3. Results

3.1. Analysis of Variance

The results of simple analysis of variance (Table 3) showed that there was a significant (p < 0.01) difference between grain yield of genotypes in all years and locations, and combined analysis of variance (Table 4) showed that the main effects of genotype, year and location and the interaction of genotype × location, genotype × year and genotype × environment were significant (p < 0.01). The results of combined analysis of variance in this experiment also showed that the contribution of genotype, environment and GEI in justifying the total variance of grain yield in the studied environments was about 85%, 10% and 5%, respectively (Table 4).
A comparison of grain yield separately, in each year and location (Table 5), showed that genotypes 7, 8, 15, and 19 (all of them Peruvian quinoa), and 16 (Bolivian quinoa) with a grain yield of more than 3000 kg.ha−1 in all environments, produced the highest grain yield. Among these genotypes, the highest grain yield belonged to genotype 16. This genotype had the highest grain yield in the first, third, and fourth environments (Kuhdasht in both years and Poldokhtar in the second year) and only in the second environment (Poldokhtar in the first year), did genotype 15 produce a higher yield. In contrast, the lowest grain yield in all four studied environments was related to genotype 1, so that the minimum, maximum and mean grain yield of this genotype were 660,992, and 833 kg.ha−1, respectively. A comparison of the means of quinoa genotypes in all environments (Table 5) also showed that genotypes 16 and 15 with a mean grain yield of 3528 and 3496 kg.ha−1, respectively, followed by genotypes 8, 19, 7, 10, and 14 with a mean grain yield of more than 3000 kg.ha−1, were the best genotypes in this experiment and had a significant advantage over the other studied genotypes.

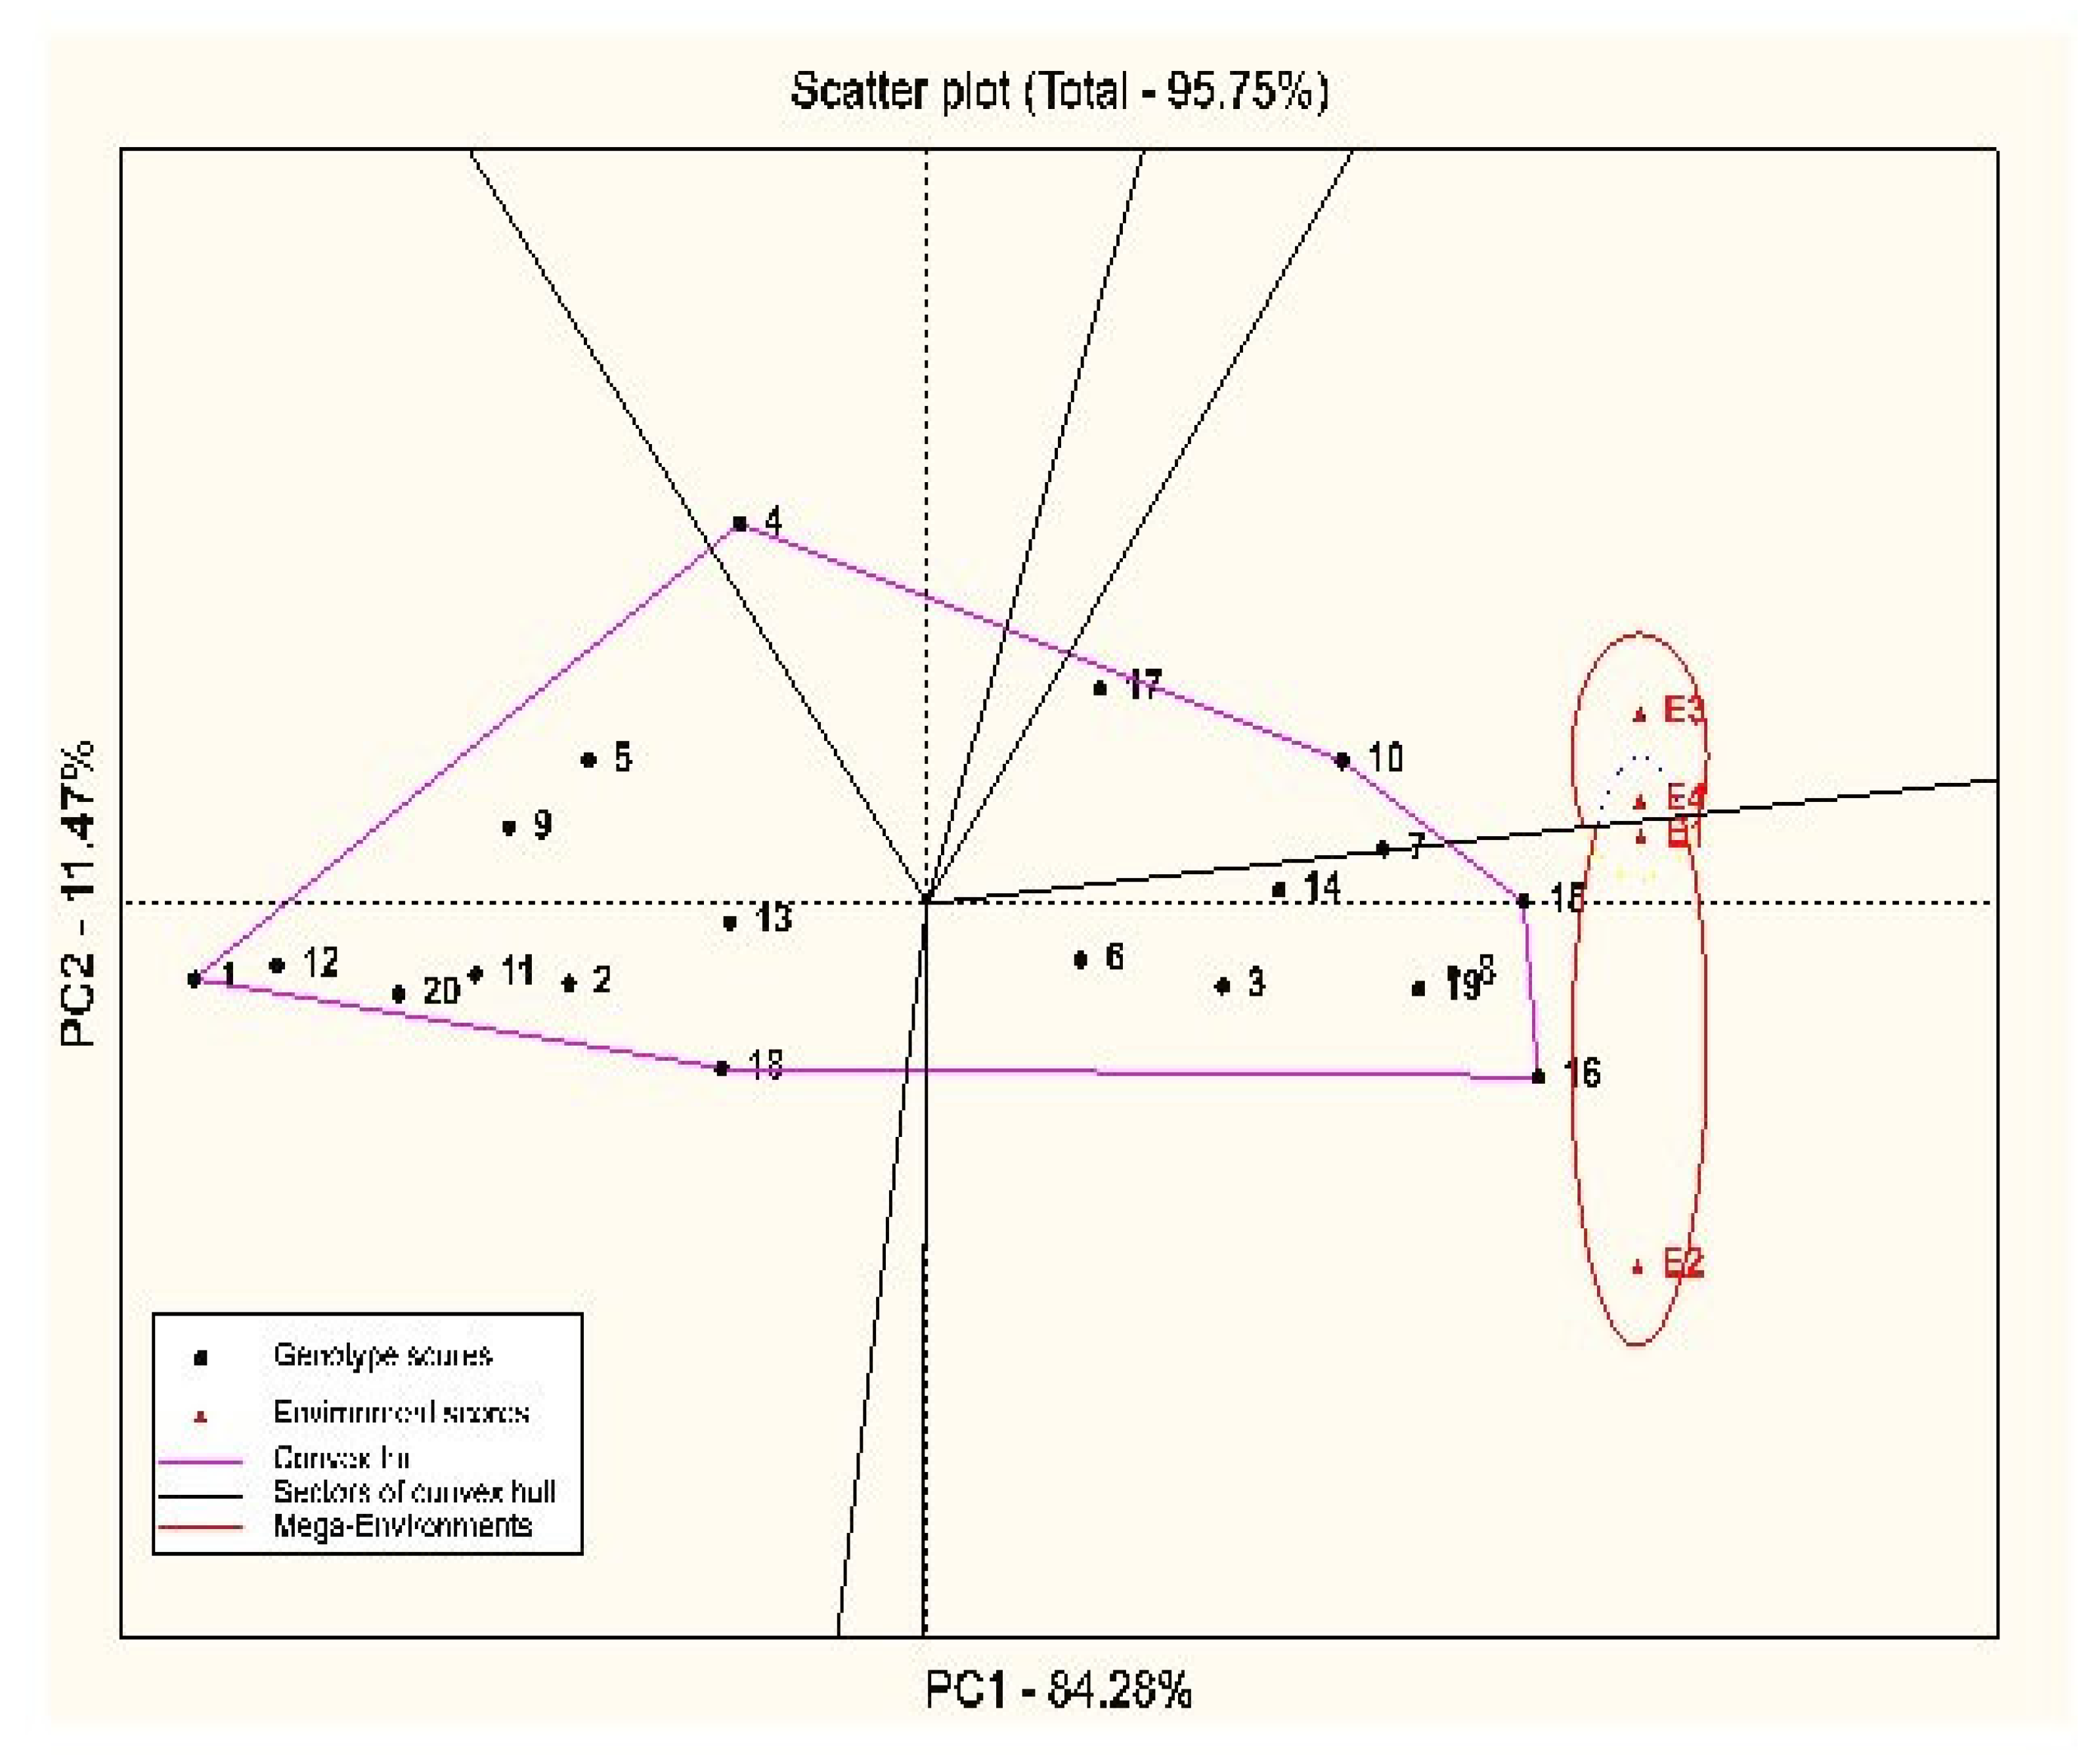
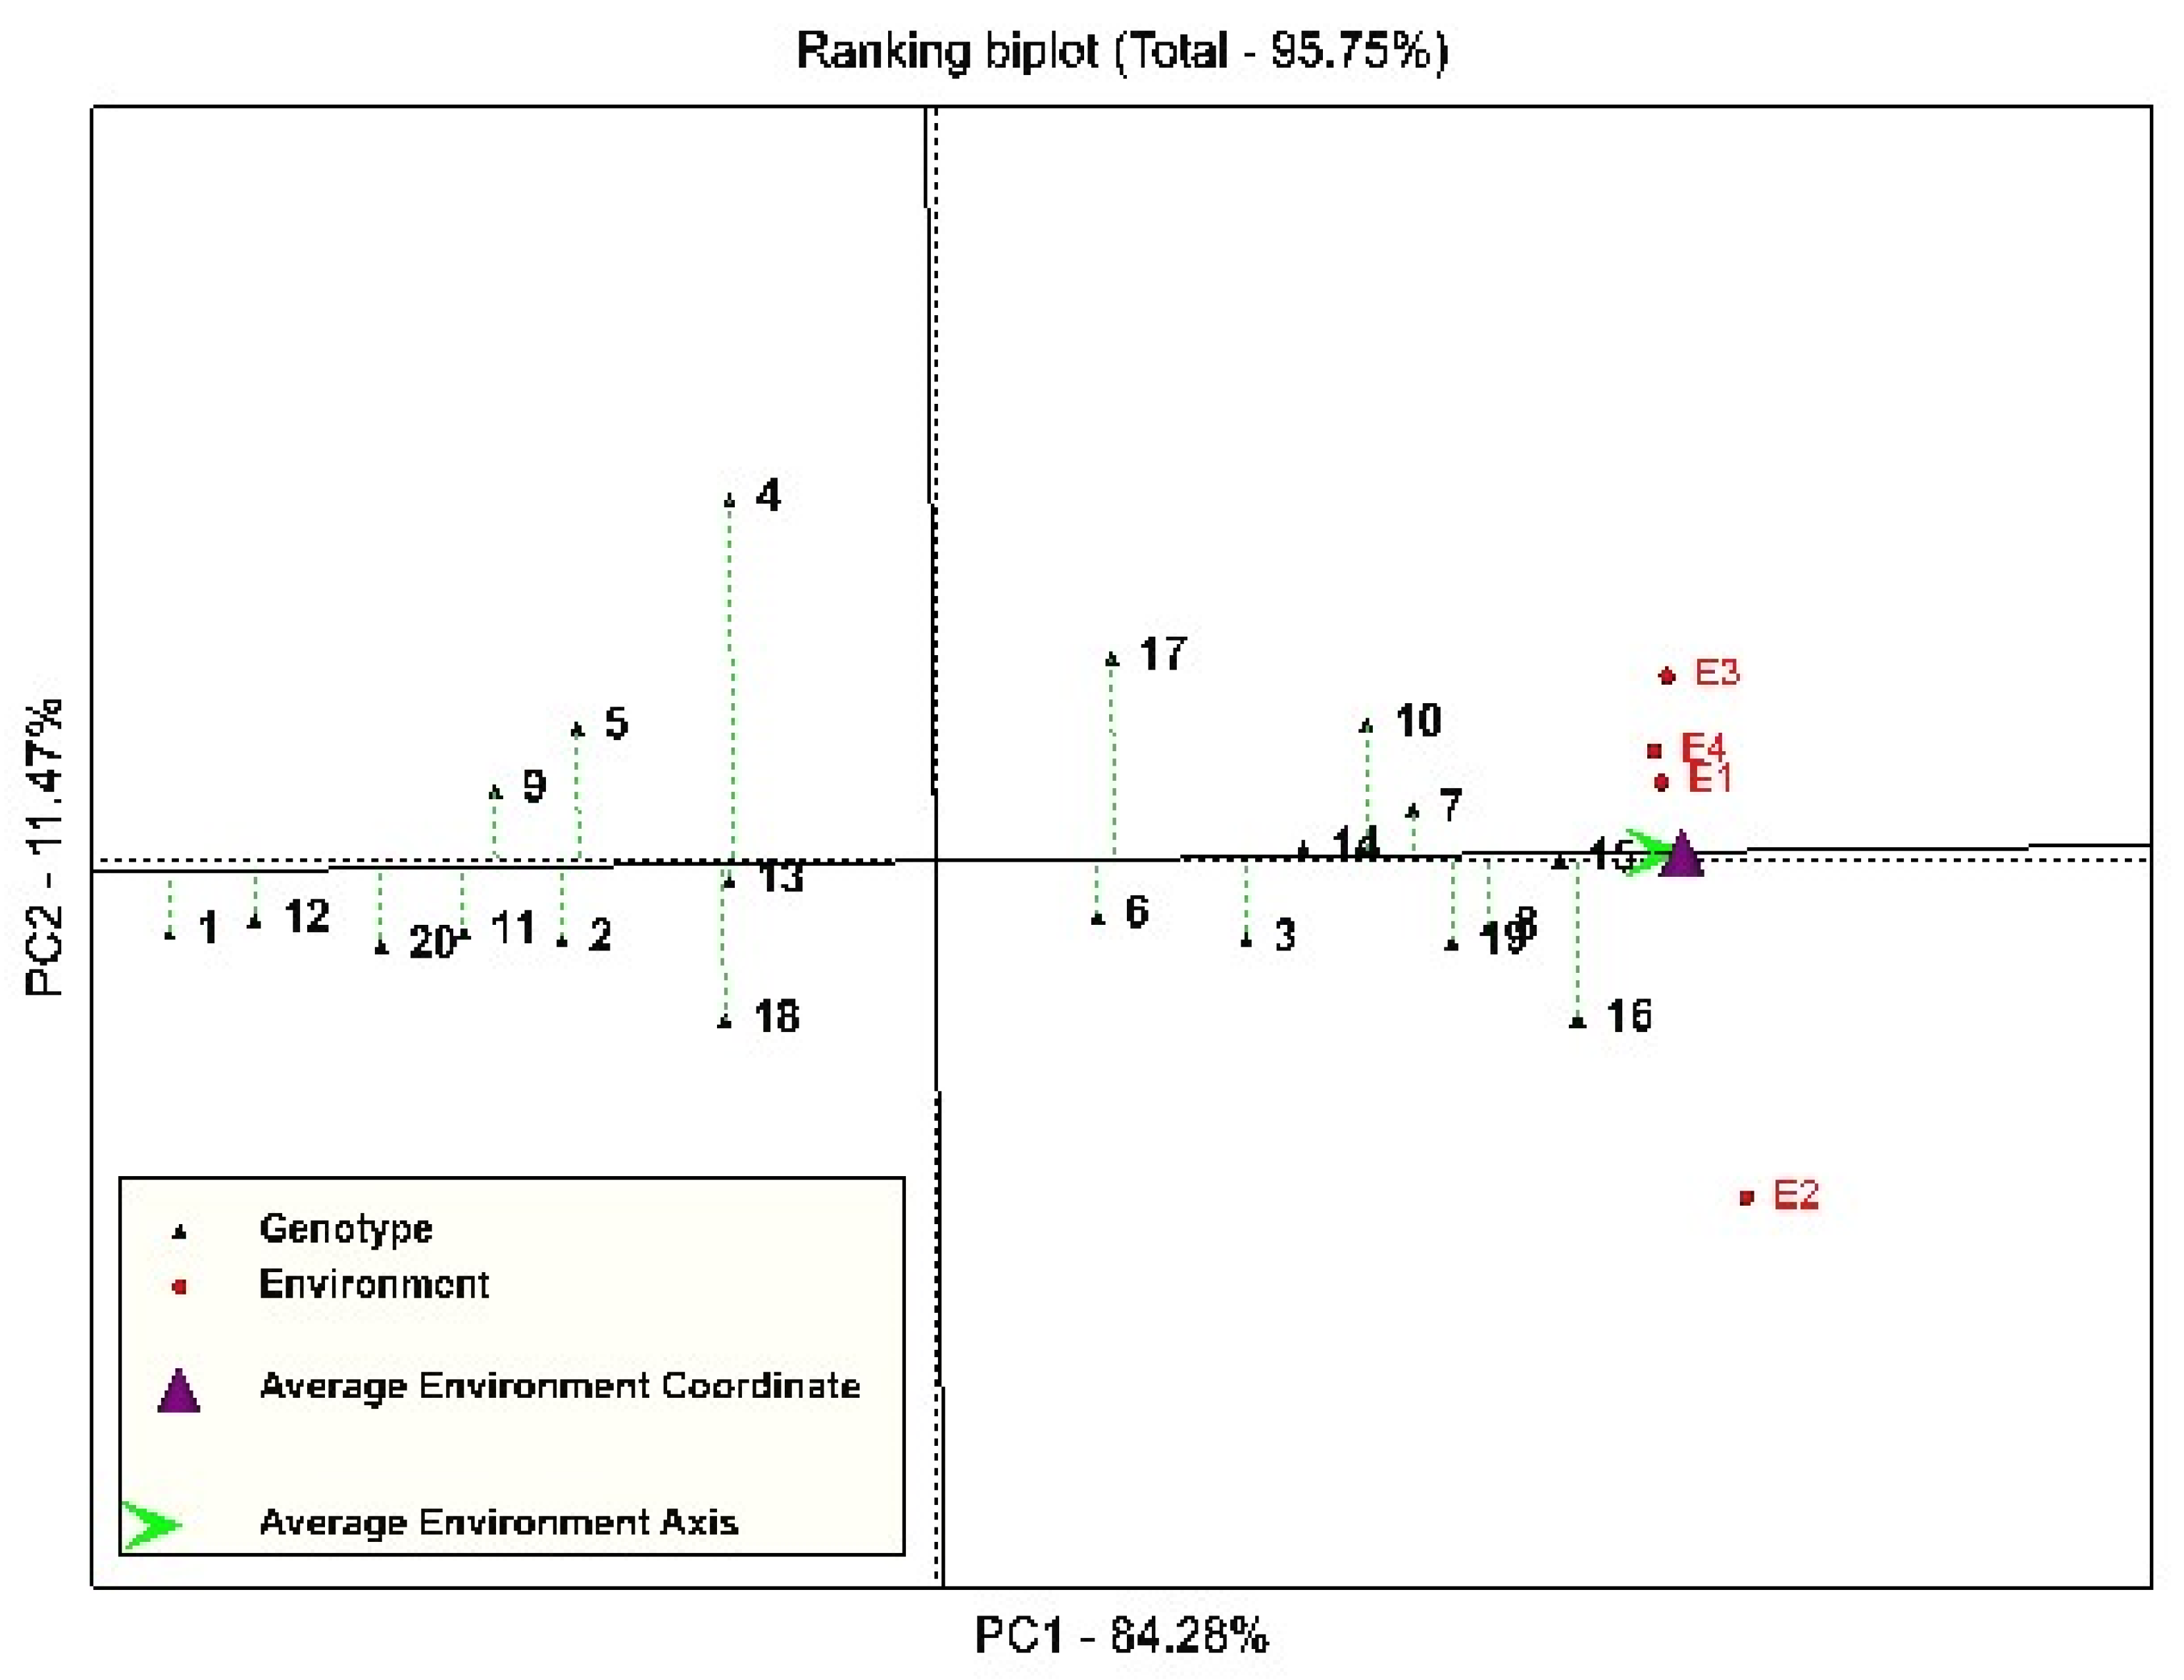
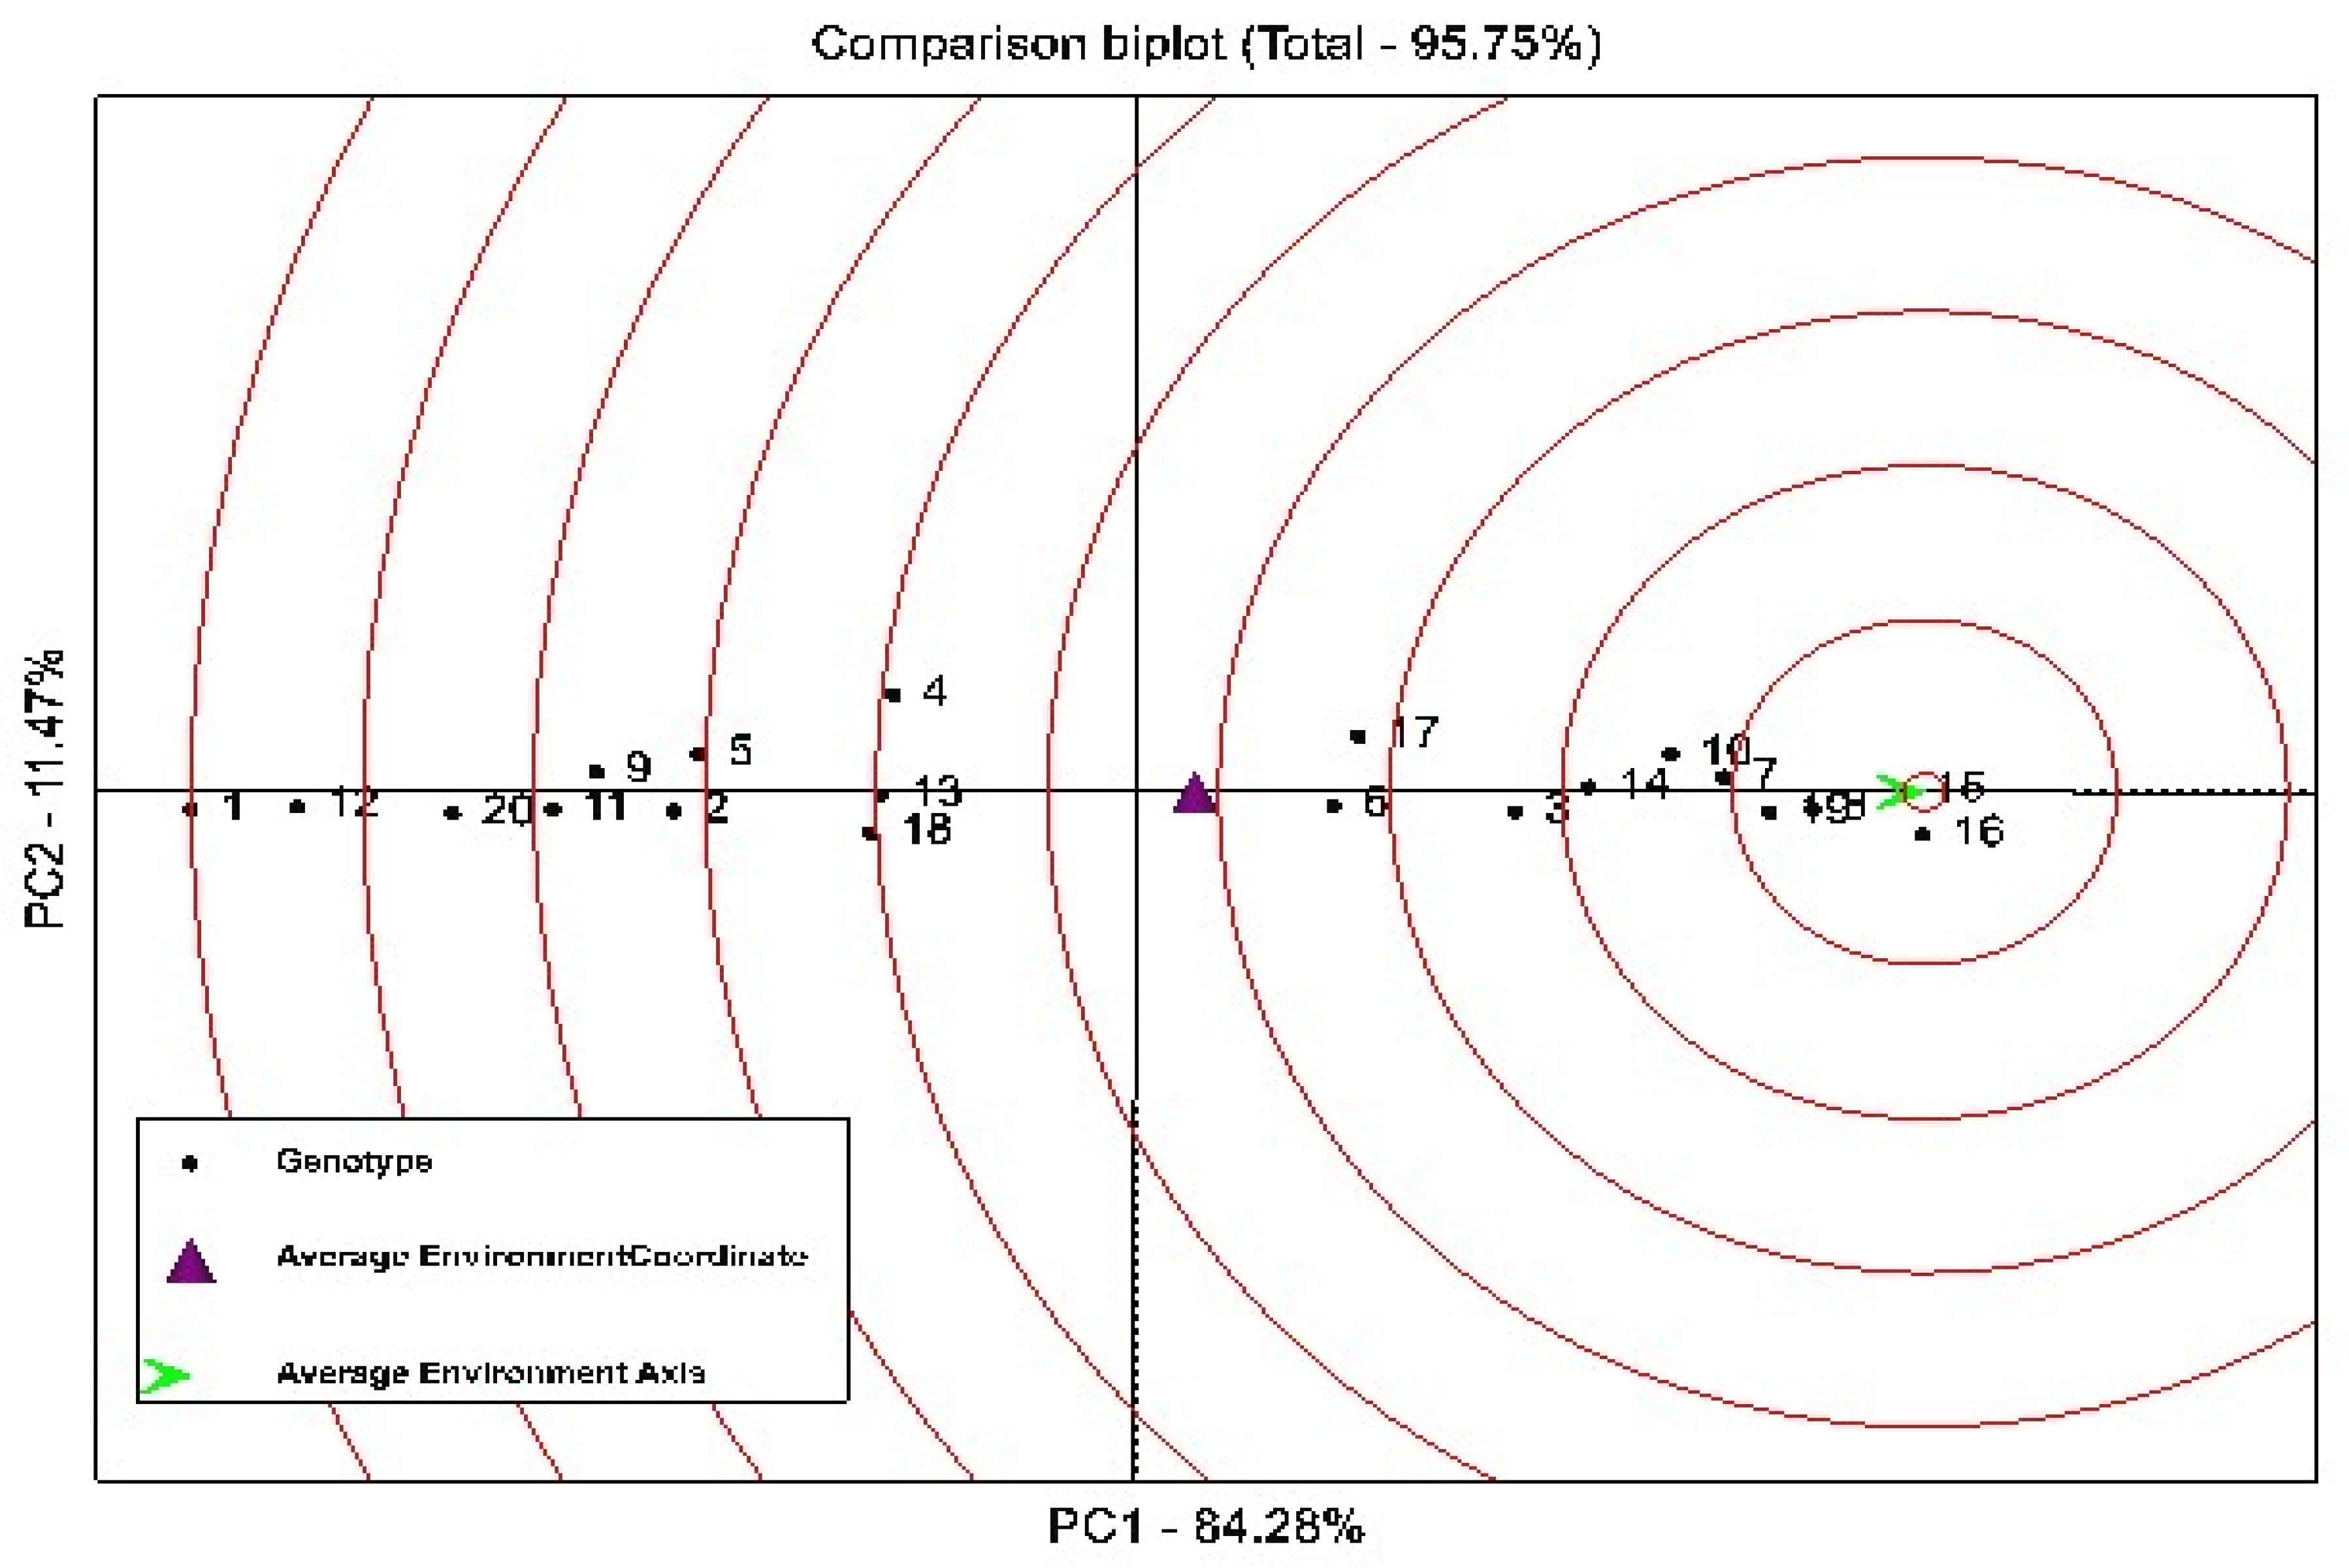
3.2. Stability Analysis

To evaluate the grain yield stability of the studied quinoa genotypes, seven different criteria were calculated (Table 6). The results of environmental variance [20], environmental coefficient of variation [22], and years-within-location variance [23] were the same, and all three methods introduced genotype 17 as the most stable genotype, with the lowest variance and coefficient of variation. However, the results of these three methods for identifying the subsequent stable genotypes were not the same, so that genotypes 9, 5, 1 and 13 in Romer’s method had the lowest variance and, therefore, were introduced as the stable genotypes, while genotypes 15, 10, 7, and 14 in Francis and Kannenberg’s method, and genotypes 4, 9, 5, and 1 in Lin and Binns’s method were stable.
The results of the stability analysis using Wricke’s equivalence [17] and Shukla’s stability variance [21] methods (Table 6) were identical, and all 20 quinoa genotypes, in terms of grain yield stability, were classified in the same way. In both methods, genotype 2, with the lowest value of variance and equivalence, was the most stable genotype. Following this, genotypes 11, 14, 13, and 10, respectively, were identified as the most stable genotypes among all studied genotypes in this experiment. In contrast, genotypes 4, 16, 17, 20, and 5, with the highest values for these two statistics, were the most unstable genotypes in terms of grain yield.
The results of the stability analysis using Wricke’s equivalence [17] and Shukla’s stability variance [21] methods (Table 6) were completely similar, and all 20 quinoa genotypes in terms of grain yield stability were separated in the same way. In both methods, genotype 2, with the lowest value of variance and equivalence, was the most stable genotype. Following this, genotypes 11, 14, 13, and 10, respectively, were identified as the most stable genotypes among all studied genotypes in this experiment. In contrast, genotypes 4, 16, 17, 20 and 5, with the highest values for these two statistics, were the most unstable genotypes in terms of grain yield.
Stability analysis by regression coefficient method [18] indicated that all quinoa genotypes studied in this experiment (except for genotype 3) had a non-significant regression coefficient compared to the regression coefficient of one. However, genotype 2, with a regression coefficient of 1.014, followed by genotypes 10, 12, 14, and 11, respectively, with the closest regression coefficient to 1 (Table 6), were genotypes with general stability in all four environments studied in this experiment. In contrast, genotypes 4, 17, 9, 5, and 1, which had the lowest regression coefficient and the lowest yield fluctuations among all genotypes, were the most stable genotypes, but their grain yield was also lower than the other genotypes. Additionally, genotypes 3, 16, and 8, with the highest regression line slope, were the most unstable and responsive genotypes in this experiment, and can be suggested for environments with more suitable conditions.
The other criterion used to evaluate the stability of genotypes in this study was the deviation from the regression line of Eberhart and Russell [19]. The main criterion of stability in this method is having a non-significant deviation from the regression line. In other words, genotypes in this method are introduced as stable when they have a regression coefficient close to one, non-significant deviation variance from the regression line, and high yield [19]. The results of this method (Table 6) showed that none of the genotypes had a significant deviation from the regression line, and all 20 genotypes studied in the present research were relatively stable in terms of Eberhart and Russell’s criterion. However, genotypes 3, 2, 11, 13, and 6, with the lowest deviation from the regression line and the lowest yield fluctuations, respectively, were the most stable genotypes, while genotypes 4, 16, and 20, with the highest deviation, respectively, were the most unstable genotypes.
To obtain the best results and identify the most stable and high-yielding genotypes, the mean rank of grain yield of each genotype in all environments (Table 7), and the mean stability rank of each genotype based on all stability methods (Table 8) were determined, and finally, the genotype with the lowest sum of yield and stability rank was introduced as a stable and high-yielding genotype. The results of the mean grain-yield rank of the studied quinoa genotypes (Table 7) showed that genotype 16 had the highest grain yield in three of the four environments, and only in environment 2 was it ranked second. After that, genotype 15 was ranked second in the three environments, except for environment 2, in which it had the highest grain yield and was ranked first. Thus, genotypes 16 and 15 had the highest yield in all environments (about 3500 kg.ha−1) and were ranked first and second, respectively. After them, the ranks from 3 to 5 belonged to genotypes 8, 19, and 7, respectively. In contrast, genotypes 1 and 12, with a mean grain yield of less than 1000 kg.ha−1, were the least productive genotypes in all four environments, and were ranked 20th and 19th, respectively (Table 7). The results of the stability rank of quinoa genotypes based on all studied stability criteria (Table 8) indicated that genotype 2, along with genotypes 11, 13, 14, and 10, were the most stable, while genotype 16 (with the highest grain yield and the best yield rank), along with genotypes 20, 4, 3, and 19, were the most unstable genotypes in this study, respectively. Considering the different results obtained from yield and stability ranks in the selection of superior genotypes, the sum of grain yield and stability ranks of genotypes was used. The results (Table 8) showed that genotype 14 had the lowest rank and was the most stable and productive genotype among all the studied genotypes. Also, three genotypes 7, 10, and 15, with the same ranks and ranks less than the other genotypes were the stable and high-yielding genotypes of this experiment. In contrast, genotype 20, which had the highest sum yield and stability rank, was identified as low-yielding, and is the most unstable. Subsequently, genotypes 12, 4, 1, 5, and 18 had the highest ranks, and were the unstable and low-yielding genotypes.
The results of the GGE-Biplot method showed that the first and second principal components accounted for about 96% of the variance of genotype and GEI, with contributions of 84.28% and 11.47%, respectively (Figure 1). Due to the high contribution of the first principal component to the sum of squares of the genotype and GEI, the use of this component can be highly effective in identifying stable genotypes. Using the polygon diagram (the which–won–where pattern), the genotypes that are far from the origin of the biplot (genotypes of the vertices) have the least or the most grain yield in the test environments, respond more to environmental changes, and are specifically considered as adapted genotypes. The GGE-Biplot identified two mega-environments, including Kuhdasht in both years (E1 and E2), and Poldokhtar in both years (E3 and E4), respectively (Figure 1).
For the simultaneous ranking of genotypes based on their grain yield and stability, the perpendicular line on the mean environment axis was used. Ranking based on the GGE-Biplot showed that genotypes 13, 14, and 15 were stable genotypes in terms of grain yield (Figure 2). However, among these genotypes, genotypes 14 and 15 had a higher mean grain yield than the total mean, and are introduced as stable and high-yielding genotypes in this study. Genotypes 4, 17, 18, and 16 were the most unstable genotypes studied, because they had the largest deviation from the mean environment axis (Figure 2). Also, genotypes 15, 16, 8, 19, and 7 were recognized as the most ideal genotypes in this study, because they are in the center of the concentric circles (Figure 3).

3.3. Morphological Traits

To describe better the genotypes in this experiment, several important traits of quinoa were also measured, besides grain yield. The results of the comparison of means between genotypes are presented in Table 9. The studied quinoa genotypes were significantly different for all measured traits. Comparison of stem diameter showed that the highest stem diameter was related to genotypes 8 and 16, which, along with genotypes 15, 10, and 7, had a mean stem diameter of more than 7 mm. In contrast, genotypes 5, 12, and 4 had the lowest stem diameter, with a mean of less than 5.5 mm. Comparison of plant height of genotypes showed that genotype 18, with a height of 132.16 cm, had the highest, while genotypes 7 and 8, with a height of less than 100 cm, had the lowest plant height among all genotypes. Genotypes 10, 14, and 15, with plant height of 117, 105, and 100 cm, respectively, were considered the dwarf genotypes. For main panicle length, genotypes 16 and 15, with a mean of 38.16 and 36.29 cm, respectively, had the highest, and genotype 1, with a mean of 12.24 cm, had the lowest main panicle length. Genotypes 16 and 15, with a mean of 17.41 and 17.16 panicles, respectively, had the highest number, while genotypes 1 and 12, with 11.23 and 11.58 panicles respectively, had the lowest number of panicles per plant among all studied genotypes. For the number of grains per panicle, genotypes 16 and 15 produced more than 40 grains, while genotype 1 produced about 14 grains, representing the highest and lowest numbers of grains per panicle, respectively. A comparison of the mean for 1000-grain weight also showed that genotypes 16 and 15 had the highest weights (3.96 and 3.85 g, respectively), while genotype 1 had the lowest 1000-grain weight (2.20 g).
There was a significant difference between quinoa genotypes for days to maturity, with genotypes 18, 12, and 9 having the highest number of days to maturity, at more than 125 days. In contrast, genotypes 16, 19, 7, and 15 with fewer than 100 days, along with genotypes 8, 3, and 14 with about 103–105 days, had the lowest number of days to maturity. The study of the harvest index also showed significant differences among the genotypes. Genotypes 16, 8, 10, 15, 19, 14, 7, and 17, with a mean of more than 50%, produced the highest economic yield and had the highest harvest index value, while genotypes 12, 11, and 1, with about 29–31%, had the lowest harvest index value.
The comparison of saponin content in the studied genotypes showed a significant difference between genotypes, with its content varying from 0.07% in genotypes 8, 15, and 16 to 1.78% in genotype 11. Genotypes 8, 15, 16, 19, 11, 3, and 7, all with a mean of less than 0.27%, had the lowest saponin content and higher nutritional value, compared to the other studied genotypes. In contrast, genotypes 11, 17, 4, 2, and 14, with a mean of more than 1.50%, had the highest saponin content and lower nutritional value and quality.

4. Discussion

4.1. Genetic Diversity

The results of a simple analysis of variance (Table 3) showed a significant (p < 0.01) difference between the grain yield of genotypes in all years and locations, indicating the existence of genetic diversity among the studied genotypes. Combined analysis of variance (Table 4) also showed significant effects (p < 0.01) of genotype, year, and location, and the interaction effects between them on grain yield for quinoa genotypes. Environmental factors such as latitude and longitude, day length, precipitation, minimum and maximum air and soil temperatures, physical and chemical properties of soil, etc., can cause differences between different years and locations. The existence of differences between the mean grain yield of genotypes in different environments indicates that the evaluation of genotypes in one environment (one location or one year) cannot be accurate, but the relevant genotypes should be evaluated over different environments and their compatibility and stability should be determined [28]. Genotype, environment and GEI justified 85%, 10% and 5% of the total variance of grain yield, respectively (Table 5). Thiam et al. [16], to evaluate the role of genotype and GEI in quinoa genotypes, indicated that 23%, 46%, and 32% of the total variance of quinoa grain yield were explained by genotype, environment and GEI, respectively. Also, Al-Naggar et al. [29] studied the GEI in quinoa genotypes and showed that the effect was 15.07%, the environment 48.75% and GEI explained 36.17% of the total variance of quinoa seed yield. In our research, due to the large number of genotypes (20 genotypes) compared to the number of environments (two environments in two years), a greater amount of variance was justified by genotype. Also, considering that the two tested environments are located in the same province and were similar in terms of climatic conditions, fewer changes were justified by the environment.

4.2. Identifying Stable Genotypes

To evaluate the stability and compatibility of quinoa genotypes in this study, eight stability analysis methods were investigated, based on the grain yield of 20 quinoa genotypes in two environments over two years. As noted above, different stability parameters not only did not present the same results, but also the results were completely different in many cases. For example, while genotype 17 was identified as the most stable genotype by three methods: Romer’s environmental variance, Francis and Kannenberg’s environmental coefficient of variation, and within-location variance of Lin and Binns, it was determined as one of the three unstable genotypes, based on the regression coefficient of Finlay and Wilkinson, Shukla’s stability variance, and Wricke’s equivalence methods. Also, genotype 3 was recognized as the most stable genotype, based on the deviation from the regression line method of Eberhart and Russell. However, it was the most unstable genotype based on the within-location variance of Lin and Binns, and was one of the unstable genotypes based on the other methods. Furthermore, evaluation of the stability rank of quinoa genotypes also showed their very different ranking based on different stability indices (Table 8). Thus, sum yield and stability rank, with the method described in this study, was introduced and used to identify the most stable and high-yielding genotypes. The results showed that genotype 14 had the lowest rank among all studied genotypes in this experiment, and was introduced as a high-yielding and stable genotype. This genotype was not the most productive genotype of this experiment, but, in addition to low grain-yield fluctuations in both locations over two years, it had a good and acceptable grain yield. With a mean grain yield of more than 3000 kg.ha−1, it was one of the most productive genotypes in this experiment. Subsequently, three genotypes, 7, 10, and 15, which had the lower ranks, can be recommended as genotypes with a high yield and general stability for cultivation in the studied areas. In contrast, genotype 20, along with genotypes 12, 4, 1, 5, and 18, had the highest ranks, and were the most unstable and low-yielding genotypes. This indicates that the final criterion (i.e., sum yield and stability rank with the method used in this study), is a suitable criterion for selecting superior genotypes with high yield and stability, and can be used in other studies.
Unlike other crops, not much research has been carried out on grain-yield stability or other important agronomic traits of quinoa under different environmental conditions. Bertero et al. [30] evaluated the effect of GEI on grain yield of quinoa in three regions, and reported that none of the studied genotypes in all environments performed well. They concluded that the GEI had an important role in the grain yield of genotypes in three studied environments. Curti et al. [31] evaluated the role of GEI on different traits of quinoa in Argentina, and reported that both genotype and GEI effects were significant in all traits. They also showed that the GEI had a more important role than the genotype main effect in explaining the total variance of grain yield. Ali et al. [32] used different stability methods, including additive main effect and multiplicative interaction (AMMI), Wricke’s equivalence, and the deviation from the regression line of Eberhart and Russell, to investigate the effect of genotype, environment and GEI on grain yield of five quinoa genotypes in ten different environments in Egypt, under both rainfed and irrigated conditions. They determined the best quinoa genotype for cultivation in each region of Egypt, and showed that the environment, genotype and GEI justified 78%, 14%, and 8% of the total variance, respectively. Vasconcelos et al. [33], with the aim of selecting the best quinoa genotypes based on grain-yield stability and compatibility, evaluated 13 quinoa genotypes during two growing seasons in two western regions in Brazil, using the harmonic mean method of the relative yield of genotypic values. They introduced two genotypes, Q1317 and Q2014, as moderate-yield and -stability genotypes for summer cultivation, and genotype Q1318 for winter cultivation. Thiam et al. [16] studied the compatibility and stability of quinoa genotypes for important traits related to yield and yield components, evaluating 14 quinoa genotypes in five central regions of Morocco. They showed that 23% and 32% of grain-yield diversity was justified by genotype and GEI, respectively, and finally introduced two high-yield genotypes with general adaptation for all five regions.
The GGE-Biplot helps us to understand GEI effects and identify genotypes for specific environments, adaptation, and stability, as genotypes cannot perform or win in all environments, and are always dependent on the GEI effect. In the present study, the 20 quinoa genotypes responded differently in the environments of Kuhdasht and Poldokhtar. Therefore, the GEI effects are based on the 20 genotypes and the four environment assessment using representativeness and discriminativeness abilities, stability vs. mean grain yield, the “which–won–where” pattern, and ranking genotypes, as explained in the following paragraphs. The influence of GEI on genotypes requires multi-environment trials as a paramount step in plant breeding. The presence of the interaction among genotypes and the environment means that the decision on desired genotypes should be based not only on the mean performance of the traits, but should also be associated with the stability of the genotypes, to avoid considerable commercial losses. Genotypes 14 and 15 have the best combination of high yield and stability, and therefore were considered the most desirable for the four environments used.
In the ranking of genotypes, we identified the ideal genotypes, in contrast to other genotypes evaluated. Typically, an ideal genotype is always placed in the innermost circle and nearer the head of the arrow at the center of the circular ring. The genotypes placed in the inner circle were highly appropriate, compared to the genotypes of the outer circle. Consequently, genotypes closer to the inner circle are considered to be the ideal ones [34]. Thus, the following are regarded as ideal genotypes in the tested environment because they were positioned closer to the center of the biplot origin, indicating that genotypes 15, 8, and 19 are stable genotypes. For effective selection, an ideal and best genotype is required to have both a high mean and high stability properties [35].
The “which–won–where” pattern is also one of the important components of the GGE biplot for the GEI analysis. The “which–won–where” biplot identifies mega-environment disparity for an environment suitable for the genotypes’ adaptability, the best genotypes in each mega-environment, and the ideal genotype with high agronomic performance and stability [36]. From the GGE-Biplot, it was shown that genotypes were well adapted to each environment, and it confirmed the presence of interaction differentiation between genotypes and environments. The vertex genotypes were identified, indicating their performance and adaptability in the mega-environment. This infers that the vertex genotypes were most favored by the environments, and, therefore, they were the most responsive and exceptional genotypes when considering their potential yield in their respective mega-environments [37]. However, vertex genotypes with no environment in the sector are not desirable because of their poor performance across the environments [34].
The 20 quinoa genotypes used in the current investigation showed different variations in their responses to the four test environments, due to the effects of GEI and different expressions of genes that regulate the agronomic traits. Genotype 16 and 15 were the topmost yielding genotypes among the 20 genotypes. Genotypes 14, and 15 were high-yielding, and the most stable across the environments. Genotypes 16 and 17 were unstable, but they had above-mean yields. Genotypes 4, 18, and 5 were unstable, and had below-mean yields.

4.3. Comparison of Morphological Traits

Quinoa is a new plant in Iran and, therefore, limited research has been carried out on it and very little information is available about its various genotypes. Twenty new quinoa genotypes with different characteristics were evaluated in this study, and the results from these genotypes are published for the first time; in addition to grain yield, a number of other traits were also measured (Table 9). The comparison of means showed that there was a significant difference between genotypes in all measured traits. Genotypes 8, 16, 15, 10, and 7, with a mean of more than 7 mm, had the highest stem diameter. Genotypes 7 and 8, with a plant height of less than 100 cm, along with genotypes 10, 14, and 15, with plant heights of 117, 105, and 100 cm, respectively, had the lowest plant height among all genotypes, and are introduced as the dwarf genotypes. As mentioned above, genotype 14, along with genotypes 7, 10, and 15, had the lowest sum yield and stability rank and were identified as the most stable and productive genotypes among all the studied genotypes in this experiment. Genotypes 15 and 16 also had the highest main-panicle length. Bertero et al. [30] reported that quinoa genotypes with lower plant height had higher grain yield due to a greater main-panicle length and number of panicles per m2. Bhargava et al. [38] reported a positive and significant correlation between panicle length and grain yield in quinoa genotypes, so that genotypes with longer panicle length had higher grain yield.
The comparison of mean of the quinoa genotypes for number of panicles per plant, number of grains per panicle, and 1000-grain weight, also indicated that genotypes 16 and 15 had the highest values and genotype 1 (one of the unstable genotypes in the current study) had the lowest values among all studied genotypes. The results of the present study showed genotypes with higher 1000-grain weight had higher grain yield, and the results of other studies have also shown that there is a positive and significant relationship between a 1000-grain weight and a growing period with grain yield in quinoa, because genotypes with a longer growing period due to more opportunity and time to assimilate and store nutrients also have higher 1000-grain weight and grain yield [39,40].
The study of the days to maturity and harvest index also showed that quinoa genotypes had significant differences. Days to maturity in the studied genotypes ranged from 96 to 132 days in genotypes 16 and 18, respectively, and the harvest index varied from 29% to 58.7% in genotypes 12 and 16, respectively. Additionally, for days to maturity, genotypes 16, 19, 7, 15, 8, 3, and 14, with a mean of less than 105 days, and for the harvest index, genotypes 16, 8, 10, 15, 19, 14, 7, and 17, with a mean of more than 50%, were the most valuable genotypes in terms of growth period and economic performance. Maliro et al. [14], in evaluating the yield and yield components of 11 different quinoa cultivars originating from North America, South America, and Europe in two central regions of Malawi under both rainfed and irrigated conditions also showed that the harvest index was significantly affected by genotype and GEI. They also reported a significant positive correlation between grain yield and plant height, days to maturity, and biological yield.
Another important characteristic measured in this study was saponin content. Saponin is one of the most important essential ingredients in quinoa, and has a negative relationship with the quality and nutritional value of quinoa, so that genotypes with less saponin have higher nutritional value and quality [41]. The results of a comparison of means showed that the studied quinoa genotypes showed a significant difference, and genotypes 8, 15, and 16, with a mean of 0.07%, had the lowest saponin content and the highest nutritional value.

5. Conclusions

The results of different stability analysis methods indicated that four genotypes, 7, 10, 14 and 15, had the lowest sum yield and stability rank, and were identified as the most stable and high-yield genotypes among all genotypes studied in this experiment. Each of these genotypes, in addition to low-yield fluctuations, with a mean grain yield of more than 3000 kg.ha−1 and the other suitable characteristics, such as dwarfism and early maturity, as well as high number of panicles, number of grains, 1000-grain weight, and harvest index, along with low saponin content, were the superior genotypes in this experiment. In contrast, genotypes 20, 12, 4, 1, 5, and 18, with the highest sum yield and stability rank, as well as unstable values of the other agronomic characteristics such as plant height, days to maturity, and saponin content, were the most unsuitable, low-yield, and unstable genotypes in this study. This indicates that the sum yield and stability rank and GGE-Biplot are suitable criteria for selecting superior genotypes with high yield and stability, and can be used in other studies. However, the GGE-Biplot method, due to presenting different graphs, determining mega-environments, and identifying ideal genotypes, was a more useful tool for stability analysis. Finally, high-yielding and stable genotypes identified in this experiment can be introduced as suitable cultivars for the studied environments.

Author Contributions

Conceptualization, E.S.L., B.R., V.J., M.S.M., H.M. and A.B.; data curation, E.S.L., V.J. and M.S.M.; formal analysis, E.S.L., B.R., M.S.M. and A.B.; investigation, H.M.; methodology, E.S.L.; project administration, E.S.L.; resources, A.B.; software, B.R., V.J. and M.S.M.; supervision, B.R. and H.M.; validation, E.S.L.; writing—original draft, E.S.L.; writing—review and editing, E.S.L., B.R., V.J., H.M. and A.B. All authors have read and agreed to the published version of the manuscript.

Funding

This research was supported by the University of Guilan, Iran. The seeds of all quinoa genotypes were obtained from the Gene Bank, Leibniz Institute of Plant Genetics and Crop Plant Research, Gatersleben, Germany.

Institutional Review Board Statement

Not applicable.

Data Availability Statement

The original contributions presented in the study are included in the article, further inquiries can be directed to the corresponding author.

Conflicts of Interest

The authors declare that they have no conflicts of interest.

References

  1. Maughan, P.J.; Kolano, B.A.; Maluszynska, J.; Coles, N.D.; Bonifacio, A.; Rojas, J.; Coleman, C.E.; Stevens, M.R.; Fairbanks, D.J.; Parkinson, S.E.; et al. Molecular and cytological characterization of ribosomal RNA genes in Chenopodium quinoa and Chenopodium berlandieri. Genome 2006, 49, 825–839. [Google Scholar] [CrossRef]
  2. Anchico-Jojoa, W.; Peixoto, J.R.; de Oliveira Júnior, A.A. Agronomic characterization and interaction of genotype by environment of quinoa under conditions of Brazil and Colombia. Hortic. Bras. 2023, 41, e2629. [Google Scholar] [CrossRef]
  3. De Bock, P.; Van Bockstaele, F.; Muylle, H.; Quataert, P.; Vermeir, P.; Eeckhout, M.; Cnops, G. Yield and nutritional characterization of thirteen quinoa (Chenopodium quinoa Willd.) varieties grown in North-West Europe—Part I. Plants 2021, 10, 2689. [Google Scholar] [CrossRef]
  4. Manjarres-Hernández, E.H.; Arias-Moreno, D.M.; Morillo-Coronado, A.C.; Ojeda-Pérez, Z.Z.; Cárdenas-Chaparro, A. Phenotypic characterization of quinoa (Chenopodium quinoa Willd.) for the selection of promising materials for breeding programs. Plants 2021, 10, 1339. [Google Scholar] [CrossRef]
  5. Taaime, N.; El Mejahed, K.; Moussafir, M.; Bouabid, R.; Oukarroum, A.; Choukr-Allah, R.; El Gharous, M. Early sowing of quinoa cultivars, benefits from rainy season and enhances quinoa development, growth, and yield under arid condition in Morocco. Sustainability 2022, 14, 4010. [Google Scholar] [CrossRef]
  6. FAO FAOSTAT. Quinoa 2013 International Year. Food and Agriculture Organization of the United Nations (FAO). Available online: https://www.fao.org/quinoa-2013 (accessed on 4 October 2013).
  7. Ando, H.; Chen, Y.C.; Tang, H.; Shimizu, M.; Watanabe, K.; Mitsunaga, T. Food components in fractions of quinoa seed. Food Sci. Technol. Res. 2002, 8, 80–84. [Google Scholar] [CrossRef]
  8. Pathan, S.; Eivazi, F.; Valliyodan, B.; Paul, K.; Ndunguru, G.; Clark, K. Nutritional composition of the green leaves of quinoa (Chenopodium quinoa Willd.). J. Food Res. 2019, 8, 55–65. [Google Scholar] [CrossRef]
  9. Abdelshafy, A.M.; Rashwan, A.K.; Osman, A.I. Potential food applications and biological activities of fermented quinoa: A review. Trends Food Sci. Technol. 2024, 144, 104339. [Google Scholar] [CrossRef]
  10. Alandia, G.; Odone, A.; Rodriguez, J.P.; Bazile, D.; Condori, B. Quinoa—Evolution and future perspectives. In The Quinoa Genome; Springer Nature: Cham, Switzerland, 2021; pp. 179–195. [Google Scholar]
  11. Cui, H.; Yao, Q.; Xing, B.; Zhou, B.; Shah, S.S.; Qin, P. The performance of agronomic and quality traits of quinoa under different altitudes in Northwest of China. Agronomy 2024, 14, 1194. [Google Scholar] [CrossRef]
  12. FAO FAOSTAT. Available online: https://www.fao.org/faostat/en/#data/QCL/visualize (accessed on 1 September 2024).
  13. Baker, R.J. Test for cross over genotype-environment interactions. Can. J. Plant Sci. 1988, 68, 405–441. [Google Scholar] [CrossRef]
  14. Maliro, M.F.; Guwela, V.F.; Nyaika, J.; Murphy, K.M. Preliminary studies of the performance of quinoa (Chenopodium quinoa Willd.) genotypes under irrigated and rainfed conditions of central Malawi. Front. Plant Sci. 2017, 8, 227. [Google Scholar] [CrossRef]
  15. Mustafa, T.A.N.; Temel, S. Studies on the adaptation of quinoa (Chenopodium quinoa Willd.) to Eastern Anatolia Region of Turkey. Agrofor 2017, 2, 33–39. [Google Scholar]
  16. Thiam, E.; Allaoui, A.; Benlhabib, O. Quinoa productivity and stability evaluation through varietal and environmental interaction. Plants 2021, 10, 714. [Google Scholar] [CrossRef] [PubMed]
  17. Wricke, G. Übereine methode zur erfassung der ökologischen streubreite in feldversuchen. Z. Pflanzenzücht. 1962, 47, 92–96. [Google Scholar]
  18. Finlay, K.W.; Wilkinson, G.N. Adaptation in a plant breeding programme. Aust. J. Agric. Res. 1963, 14, 742–754. [Google Scholar] [CrossRef]
  19. Eberhart, S.A.T.; Russell, W.A. Stability parameters for comparing varieties. Crop Sci. 1966, 6, 36–40. [Google Scholar] [CrossRef]
  20. Roemer, J. Sinde die ertagdreichen sorten ertagissicherer? Mitt DLG 1917, 32, 87–89. [Google Scholar]
  21. Shukla, G.K. Some statistical aspects of partitioning genotype-environmental components of variability. Heredity 1972, 28, 237–245. [Google Scholar] [CrossRef]
  22. Francis, T.R.; Kannenberg, L.W. Yield stability studies in short-season maize. I. A descriptive method for grouping genotypes. Can. J. Plant Sci. 1978, 58, 1029–1034. [Google Scholar] [CrossRef]
  23. Lin, C.S.; Binns, M.R. A superiority measure of cultivar performance for cultivar x location data. Can. J. Plant Sci. 1988, 68, 193–198. [Google Scholar] [CrossRef]
  24. Yan, W.; Kang, M.S.; Ma, B.; Woods, S.; Cornelius, P.L. GGE biplot vs. AMMI analysis of genotype-by-environment data. Crop Sci. 2007, 4, 643–653. [Google Scholar] [CrossRef]
  25. SAS Institute. SAS® 9.4 System Options: Reference; SAS Institute Inc.: Cary, NC, USA, 2019. [Google Scholar]
  26. Pour-Aboughadareh, A.; Yousefian, M.; Moradkhani, H.; Poczai, P.; Siddique, K.H. STABILITYSOFT: A new online program to calculate parametric and non-parametric stability statistics for crop traits. Appl. Plant Sci. 2019, 7, e01211. [Google Scholar] [CrossRef]
  27. Payne, R.W.; Baird, D.B.; Cherry, M.; Gilmour, A.R.; Harding, S.A.; Lane, P.W.; Morgan, G.W.; Murray, D.A.; Soutar, D.M.; Thompson, R.; et al. GenStat Release 6.1 Reference Manual; Directives; Hemel Hempstead VSN International: Hemel Hempstead, UK, 2002; 404p. [Google Scholar]
  28. Miranda, M.; Vega-Gálvez, A.; Quispe-Fuentes, I.; Rodríguez, M.J.; Maureira, H.; Martínez, E.A. Nutritional aspects of six quinoa (Chenopodium quinoa Willd.) ecotypes from three geographical areas of Chile. Chil. J. Agric. Res. 2012, 72, 175–181. [Google Scholar] [CrossRef]
  29. Al-Naggar, A.M.M.; Younis, A.E.S.M.; Atta, M.M.; El-Moneim, M.L.A.; Al-Metwally, M.S. Stability of Chenopodium quinoa genotypes under different nitrogen fertilizer source and level using AMMI and GGE-biplot models. Plant Cell Biotechnol. Mol. Biol. 2022, 23, 1–20. [Google Scholar] [CrossRef]
  30. Bertero, H.D.; de la Vega, A.J.; Correa, G.; Jacobsen, S.E.; Mujica, A. Genotype and genotype-by-environment interaction effects for grain yield and grain size of quinoa (Chenopodium quinoa Willd.) as revealed by pattern analysis of international multi-environment trials. Field Crop. Res. 2004, 89, 299–318. [Google Scholar] [CrossRef]
  31. Curti, R.N.; de la Vega, A.J.; Andrade, A.J.; Bramardi, S.J.; Bertero, H.D. Multi-environmental evaluation for grain yield and its physiological determinants of quinoa genotypes across Northwest Argentina. Field Crop. Res. 2014, 166, 46–57. [Google Scholar] [CrossRef]
  32. Ali, M.; Elsadek, A.; Salem, E.M. Stability parameters and AMMI analysis of quinoa (Chenopodium quinoa Willd.). Egypt. J. Agron. 2018, 40, 59–74. [Google Scholar] [CrossRef]
  33. Vasconcelos, E.S.; Echer, M.M.; Kliemann, M.A.; Lang, M.J. Selection and recommend of quinoa (Chenopodium quinoa) genotypes based on the yield genotypic adaptability and stability. Rev. Ceres Viçosa 2019, 66, 117–123. [Google Scholar] [CrossRef]
  34. Khan, M.M.H.; Rafii, M.Y.; Ramlee, S.I.; Jusoh, M.; Mamun, M.A.; Halidu, J. DNA fingerprinting, fixation-index (Fst), and admixture mapping of selected bambara groundnut (Vigna subterranea [L.] verdc) accessions using ISSR markers system. Sci. Rep. 2021, 11, 14527. [Google Scholar]
  35. Yan, W.; Tinker, N.A. Biplot analysis of multi-environment trial data: Principles and applications. Can. J. Plant Sci. 2006, 86, 623–645. [Google Scholar] [CrossRef]
  36. Yan, W. GGE biplot: A windows application for graphical analysis of multi-environment trial data and other types of two-way data. Agron. J. 2001, 93, 1111–1118. [Google Scholar] [CrossRef]
  37. Hashim, N.; Rafii, M.Y.; Oladosu, Y.; Ismail, M.R.; Ramli, A.; Arolu, F.; Chukwu, S. Integrating multivariate and univariate statistical models to investigate genotype–environment interaction of advanced fragrant rice genotypes under rainfed condition. Sustainability 2021, 13, 4555. [Google Scholar] [CrossRef]
  38. Bhargava, A.; Shukla, S.; Ohri, D. Genetic variability and interrelationship among various morphological and quality traits in quinoa (Chenopodium quinoa Willd.). Field Crops Res. 2007, 101, 104–116. [Google Scholar] [CrossRef]
  39. Jorfi, A.; Alavifazel, M.; Gilani, A.; Ardakani, M.R.; Lak, S. Yield and morpho-physiological performance of quinoa (Chenopodium quinoa) genotypes as affected by phosphorus and zinc. J. Plant Nutr. 2022, 45, 2432–2446. [Google Scholar] [CrossRef]
  40. Shah, S.S.; Shi, L.; Li, Z.; Ren, G.; Zhou, B.; Qin, P. Yield, agronomic and forage quality traits of different quinoa (Chenopodium quinoa Willd.) genotypes in Northeast China. Agronomy 2020, 10, 1908. [Google Scholar] [CrossRef]
  41. Mastebroek, H.D.; Van Loo, E.N.; Dolstra, O. Combining ability for seed yield traits of Chenopodium quinoa breeding lines. Euphytica 2002, 125, 427–432. [Google Scholar] [CrossRef]
Figure 1. Polygon diagram of GGE-Biplot to determine superior genotypes in different environments. Numbers 1–20 (black color) of the studied quinoa genotypes; numbers 1 and 2 (red color) show the environment of Kuhdasht in 2020 and 2021, respectively, and numbers 3 and 4 (red color) show the environment of Poldokhtar in 2020 and 2021, respectively.
Agriculture 15 00515 g001
Figure 2. The ranking diagram of genotypes based on the mean grain yield of environments and their stability. Numbers 1–20 (black color) of the studied quinoa genotypes; numbers 1 and 2 (red color) show the environment of Kuhdasht in 2020 and 2021, respectively, and numbers 3 and 4 (red color) show the environment of Poldokhtar in 2020 and 2021, respectively.
Agriculture 15 00515 g002
Figure 3. GGE-Biplot to compare the studied quinoa genotypes with the hypothetical ideal genotype. Numbers 1–20 (black color) of the studied quinoa genotypes; numbers 1 and 2 (red color) show the environment of Kuhdasht in 2020 and 2021, respectively, and numbers 3 and 4 (red color) show the environment of Poldokhtar in 2020 and 2021, respectively.
Agriculture 15 00515 g003
Table 1. Quinoa genotypes studied in this experiment.
No.GenotypeAccession
Number a
OriginSeed Color
1CHEN67D2190PeruBrown
2CHEN68D2191PeruGolden-brown
3CHEN71D2196BoliviaLight brown
4CHEN83D2194PeruBright-white
5CHEN84D2195PeruWhite
6CHEN89D5078PeruBright
7CHEN90D5079PeruWhite
8CHEN112D11899PeruGolden
9CHEN119D9319BoliviaWhite
10CHEN126D9339BoliviaWhitish-yellow
11CHEN128D9320BoliviaYellow
12CHEN133D9361BoliviaWhite
13CHEN151D9382BoliviaBright
14CHEN159D9376BoliviaWhitish-yellow
15CHEN167D9346PeruYellow
16CHEN171D9350BoliviaBright-white
17CHEN182D9392PeruWhite
18CHEN189D9400PeruWhite
19CHEN212D9426PeruGolden
20CHEN223D9442PeruBrown
a The accession numbers are according to the IPK Genebank, Germany.
Table 2. Agro-climatic properties of the experimental area.
LocationYearSpring Temperature
(°C)
Summer Temperature
(°C)
Spring Rainfall
(mm)
Summer Rainfall
(mm)
Total Rainfall (mm)
MinMaxAverageMinMaxAverage
Kuhdasht20209.12923.117.635.428.2127.12.9454.6
20219.329.222.218.136.528.91421.7507.2
Poldokhtar202019.233.827.524.238.233.3103.51.4368.8
202118.132.726.321.138.731.8119.20.9425.7
LocationYearSoil typeEC
(ds.m−1)
pHN
(%)
P
(ppm)
K
(mg.kg−1)
OC (%)
Kuhdasht2020Loam0.457.570.094.63250.87
2021Loam0.517.760.13.42601.07
Poldokhter2020Loam0.467.50.113.22950.91
2021Loam0.497.660.1112.482301.15
Table 3. Simple analysis of variance of grain yield of quinoa genotypes in two years and locations.
Source of
Variations
DfMean Squares
20202021
KuhdashtPoldokhtarKuhdashtPoldokhtar
Replication220,235.82 **13,495.22 **28,913.15 ns39,516.12 **
Genotype192,327,079.39 **2,359,481.80 **2,161,112.64 **2,015,355.29 **
Error387033.1945,278.573926.5763,043.16
CV (%)-4.109.652.4210.36
ns and ** non-significant and significant at 1% probability level, respectively.
Table 4. Combined analysis of variance of grain yield of quinoa genotypes in two years and locations.
Source of VariationsDfMean Squares
Year (Y)19,177,552.65 **
Location (L)1575,456.33 **
Y × L14,129,126.75 **
Replication/GY835,871.33
Genotype (G)198,374,364.65 **
G × Y19204,816.03 **
G × L19137,420.84 **
G × Y × L19147,440.05 **
Experimental error15231,232.23
Coefficient of variation 7.21
Contribution of genotype to total variation (%) 84.94
Contribution of environment to total variation (%) 10.09
Contribution of GEI to total variation (%) 4.97
** Significant at 1% probability level.
Table 5. Mean grain yield of quinoa genotypes in each environment.
Genotype a20202021Total Mean b
KuhdashtPoldokhtarKuhdashtPoldokhtar
1660.65716.63992.74964.36833.60 k
21311.661511.661829.561687.531585.10 j
32541.662731.433243.373058.852893.83 e
41724.651929.481808.822201.421916.09 g
51401.581600.521683.341789.231618.67 i
62312.332510.732921.182698.122610.59 f
72900.423160.613494.493306.703215.56 c
83028.663213.383736.653446.643356.33 b
91277.341415.331560.531590.091460.82 h
102840.623040.533317.713321.293130.04 c
111143.121343.341620.181480.521396.79 h
12773.33853.331158.341206.23997.81 k
131662.211862.662129.951968.211905.76 j
142725.442925.463293.363080.353006.15 d
153217.253415.513836.633517.763496.79 a
163309.393216.333968.863619.163528.44 a
172460.762656.392738.282716.582643.00 f
181611.651811.762236.611915.461893.87 h
193012.433136.523670.763335.383288.77 b
20942.421035.281440.341543.311240.34 i
Mean2042.882204.342534.092422.362300.91
a The characteristics of genotypes are presented in Table 1. b Means followed by similar letters in each column are not significantly different according to Tukey’s test at 5% probability level.
Table 6. Stability indices of the studied quinoa genotypes.
Genotype aECV b S e 2 S y / l 2 Finlay–Wilkinson S di 2 σ i 2 W i 2
bit-Value (H0: b = 1)
120.3128,672.47984.800.7511.799 ns2777.67 ns4407.7913,223.36
214.1350,138.4974,787.671.0140.215 ns616.06 ns420.491261.46
310.9299,935.76149,900.201.4356.752 *601.89 ns9544.6428,633.92
410.8543,249.5420,258.990.3980.992 ns53,378.61 ns 53,096.10159,288.30
510.1326,910.1428,750.040.6451.340 ns10,184.93 ns12,877.7338,633.19
69.9767,686.23101,453.331.1701.350 ns2294.78 ns2924.058772.15
77.7962,813.7293,565.361.1220.860 ns2922.22 ns2668.518005.53
89.1193,533.84138,915.021.3651.941 ns5134.70 ns9344.2428,032.72
99.8720,795.6927,684.410.6252.677 ns2840.28 ns8680.7526,042.26
107.4654,524.1976,610.261.0360.222 ns3890.97 ns2659.467978.37
1114.5641,373.0661,601.150.9160.925 ns1189.29 ns1132.333396.99
1221.6946,824.8468,192.780.9280.310 ns7757.90 ns5420.9216,262.77
1310.2938,445.1257,480.380.8751.022 ns2178.08 ns2210.186630.53
148.0057,768.0786,631.011.0770.584 ns2528.35 ns1972.795918.36
157.4066,893.3498,521.661.1150.437 ns10,118.25 ns7389.6822,169.05
169.65115,865.15149,293.171.3820.773 ns35,373.16 ns30,623.2391,869.68
174.7815,961.0020,160.050.4302.998 ns3562.20 ns16,993.5750,980.71
1813.7868,109.01100,332.171.1260.474 ns10,234.73 ns7589.88722,769.66
198.7482,544.24118,235.921.2460.886 ns11,193.65 ns10,393.6531,180.96
2023.8587,532.25126,504.701.2420.660 ns19,463.60 ns15,803.947,411.71
Mean11.6658478.807579,993.15350.99491.36079412.06610,307.6930,923.084
a The characteristics of genotypes are presented in Table 1. b Environmental coefficient of variation of Francis and Kannenberg. S e 2 , Romer’s environmental variance; S y / l 2 , years-within-location mean square of Lin and Binns; bi, regression coefficient of Finlay and Wilkinson; S di 2 , deviation from regression line of Eberhart and Russell; σ i 2 , Shukla’s stability variance; W i 2 , Wricke’s equivalence. ns and * non-significant and significant at 5% probability level, respectively.
Table 7. Grain-yield rank of the quinoa genotypes in each environment, along with mean and final yield rank of each genotype in all environments.
Genotype aEnvironment 1Environment 2Environment 3Environment 4AYR bFYR c
1202020202020
21515131514.515
3888888
41111141111.7511
51414151414.2514
610109109.7510
7545655
8333333
91616171616.2516
1066655.756
11171716181717
12191919191919
13121212121212
14777777
1521221.752
1612111.251
17991099.259
181313111312.513
1945444.254
201818181717.7518
a The characteristics of genotypes are presented in Table 1. b Mean grain-yield rank of each genotype in four environments. c Final yield rank of each genotype, based on mean grain yield in four environments.
Table 8. Stability rank of quinoa genotypes, based on evaluated stability indices.
Genotype a S e 2 CV S y / l 2 bi S di 2 σ i 2 W i 2 ASRFSRFYR + FSR
14185137889.00828
2916912115.57116
3191420181141414.291725
471322020202014.571829
531141415161611.291327
6141015105779.71919
71241279668.00611
8187181512131313.711518
929316812128.86723
1010310211556.57511
11617753226.00219
128198313999.861231
13512684446.14315
141151146336.14310
151321361410109.71911
16208191719191917.292021
17111191018189.71918
18151514916111113.001427
19166161217151513.861620
201720171118171716.711937
a The characteristics of genotypes are presented in Table 1. S e 2 , Romer’s environmental variance; CV, coefficient of variation; S y / l 2 , years-within-location mean square of Lin and Binns; bi, regression coefficient of Finlay and Wilkinson; S di 2 , deviation from regression of Eberhart and Russell; σ i 2 , Shukla’s stability variance; W i 2 , Wricke’s equivalence; ASR, average stability rank; FSR, final stability rank; FYR + FSR, sum yield and stability rank.
Table 9. Comparison of means of the quinoa genotypes for the studied agronomic traits.
Genotype aSD
(mm)
PH
(cm)
PL
(cm)
NPPNGPTGW
(g)
DM
(Day)
HI
(%)
SP
(%)
15.86 j109.75 i12.24 n11.23 h14.82 i2.2 m112.29 i31.21 kij1.41 e
25.96 g115.25 h17.4 k13.91 ef20.44 h2.44 l116.34 h35.20 hi1.59 c
36.56 e105.91 j29.86 f15.25 dc27.74 d2.88 f103.77 k48.98 dc0.21 1 m
45.47 k119.41 e21.24 ij12.66 g19.86 h2.48 jlk120.18 f39.95 fg1.64 b
55.34 l118.91 ef18.44 k12.75 g24.62 efg2.55 jhki119.04 fg34.21 hij1.02 h
66.18 f116.91 hg27.93 g13.91 ef22.86 g2.58 hi117.79 gh45.91 de1.21 f
77.12 b99.08 m32.16 cd16.08 bc34.19 c3.41 d99.28 m54.36 b0.27 l
87.31 a99.58 m34.11 b17.33 a38.71 b3.67 c101.72 l58.21 ab0.07 n
95.73 ij125.5 c16.17 l13.16 gf26.65 de2.73 g126.42 c37.79 hg1.36 e
107.16 b117.33 fg31.15 de16.5 ab38.64 b3.67 c118.46 fg58.12 ab0.18 m
115.82 hi124.41 c15.22 lm13.58 efg23.55 fg2.56 ihj124.59 d31.07 jk1.78 a
125.38 kl129 b14.48 mn11.58 h23.00 fg2.48 kl129.75 b29.37 k0.59 j
135.91 hg116.25 hg20.62 j13.33 gef25.15 ef2.51 iklj117.56 gh39.62 fg1.14 g
146.82 d105.16 j30.27 ef15.91 bc34.19 c3.30 e105.85 j55.56 ab1.52 d
157.20 b100.16 ml36.29 a17.16 a40.68 b3.85 b99.55 m57.93 ab0.07 n
167.32 a103.25 k38.16 a17.41 a43.84 a3.96 a96.33 o58.70 a0.07 n
176.13 f122.50 b25.11 h14.33 de23.75 fg2.54 jki122.84 e50.07 c1.68 b
185.76 ji132.16 a20.4 j13.08 gf24.47 efg2.63 h132.58 a45.88 ef0.80 i
196.99 c101.83 kl33.07 bc16.66 ab40.85 b3.70 c98.33 n56.02 ab0.08 n
206.19 f124.41 c22.14 i13.91 ef23.86 fg2.54 jki124.55 d43.06 ef0.50 k
a The characteristics of genotypes are presented in Table 1. SD, stem diameter; PH, plant height; PL, panicle length; NPP, number of panicles per plant; NGP, number of grains per panicle; TGW, 1000-grain weight; DM, days to maturity; HI, harvest index; SP, saponin content. Means followed by similar letters in each column are not significantly different according to Tukey’s test at 5% probability level.
Disclaimer/Publisher’s Note: The statements, opinions and data contained in all publications are solely those of the individual author(s) and contributor(s) and not of MDPI and/or the editor(s). MDPI and/or the editor(s) disclaim responsibility for any injury to people or property resulting from any ideas, methods, instructions or products referred to in the content.

