Article

Unmanned Aerial Vehicle Remote Sensing for Monitoring Fractional Vegetation Cover in Creeping Plants: A Case Study of Thymus mongolicus Ronniger

1
Inner Mongolia Key Laboratory of Grassland Ecology, School of Ecology and Environment, Inner Mongolia University, Hohhot 010010, China
2
Key Laboratory of Forage Breeding and Seed Production of Inner Mongolia, National Grass Seed Technology Innovation Center (Preparation), Hohhot 010010, China
*
Author to whom correspondence should be addressed.
Agriculture 2025, 15(5), 502; https://doi.org/10.3390/agriculture15050502
Submission received: 16 January 2025 / Revised: 18 February 2025 / Accepted: 25 February 2025 / Published: 26 February 2025
(This article belongs to the Section Digital Agriculture)

Abstract

:
Fractional vegetation cover (FVC) is a key indicator of plant growth. Unmanned aerial vehicle (UAV) imagery has gained prominence for FVC monitoring due to its high resolution. However, most studies have focused on single phenological stages or specific crop types, with limited research on the continuous temporal monitoring of creeping plants. This study addresses this gap by focusing on Thymus mongolicus Ronniger (T. mongolicus). UAV-acquired visible light and multispectral images were collected across key phenological stages: green-up, budding, early flowering, peak flowering, and fruiting. FVC estimation models were developed using four algorithms: multiple linear regression (MLR), random forest (RF), support vector regression (SVR), and artificial neural network (ANN). The SVR model achieved optimal performance during the green-up (R2 = 0.87) and early flowering stages (R2 = 0.91), while the ANN model excelled during budding (R2 = 0.93), peak flowering (R2 = 0.95), and fruiting (R2 = 0.77). The predictions of the best-performing models were consistent with ground truth FVC values, thereby effectively capturing dynamic changes in FVC. FVC growth rates exhibited distinct variations across phenological stages, indicating high consistency between predicted and actual growth trends. This study highlights the feasibility of UAV-based FVC monitoring for T. mongolicus and indicates its potential for tracking creeping plants.

1. Introduction

Fractional vegetation cover (FVC) represents the proportion of a unit area covered by the vertical projection of vegetation, including leaves, stems, and branches [1]. Monitoring of FVC provides valuable insights into plant growth, stress tolerance, and adaptation, making it a key factor in selecting and breeding superior plant varieties. Additionally, FVC is crucial for assessing ecosystem health, soil erosion, and climate change, providing key guidelines for ecological protection and soil and water conservation management [2,3]. The dynamic changes in FVC reflect vegetation growth patterns, spatial distribution, and evolutionary trends over time [4]. With the increasing demand for agricultural management and ecosystem protection, developing rapid and accurate methods for FVC measurement has become crucial.
Traditional FVC measurement methods rely on field estimation, which, despite being flexible, is highly influenced by subjective biases, often resulting in significant discrepancies among observers and deviations from ground truth values. In large-scale plots, field estimation depends on sampling, which may fail to capture spatial vegetation heterogeneity, resulting in incomplete representations of actual conditions [5]. With technological advancements, satellite remote sensing has partially replaced traditional field estimation methods, providing extensive coverage and long-term data. However, satellite-based methods have limitations in spatial resolution and temporal frequency, which worsen with the growing need for precise vegetation measurements, thereby restricting their effectiveness in monitoring small-scale vegetation changes [6]. In recent years, unmanned aerial vehicles (UAVs) have emerged as vital tools for ecological monitoring. UAVs provide advantages such as ease of operation, low cost, and suitability for large-scale detection [7]. UAV platforms integrate various sensors, including RGB (red, green, and blue) and multispectral cameras, enabling comprehensive vegetation monitoring through the capture of structural and physiological parameters. Previous studies have shown that UAV-based monitoring effectively tracks vegetation changes across different ecosystems, providing valuable insights into vegetation responses to environmental changes [8,9,10]. This technology addresses the limitations of traditional field estimation by providing comprehensive and accurate representations of FVC’s spatial distribution and dynamic changes.
Current UAV-based vegetation coverage monitoring studies mainly focus on large regions and crop species [11], with notable advancements in monitoring upright crops such as maize [12], rice [13], and wheat [14]. However, monitoring creeping plants presents unique challenges: (1) Unlike traditional upright crops, creeping plants grow close to the ground and expand horizontally, forming complex surface coverage that can cause mixed signals between vegetation and the soil background. (2) The interweaving and overlapping of individual creeping plants on the horizontal plane further complicate FVC estimation, which limits the effectiveness of UAV-based monitoring for this vegetation. (3) Temporal variations in coverage patterns due to rapid lateral expansion during different growth stages complicate FVC estimation. Although UAV technology has been successfully used to monitor low-growing vegetation such as Cirsium arvense (L.), these challenges have limited its broader application to creeping plants [15]. Additionally, traditional models designed for upright crops may not accurately capture the unique growth characteristics of creeping vegetation, highlighting the need for further exploration and validation. Thymus mongolicus Ronniger (T. mongolicus) is an ideal model species for investigating the UAV-based FVC monitoring of creeping vegetation. As a small half-shrub in the Labiatae family and Thymus genus, T. mongolicus exhibits a characteristic creeping growth pattern [16]. T. mongolicus exhibits strong environmental adaptability through well-developed adventitious roots and dense patch formation, forming a complex root–soil matrix [17]. Throughout its phenological stages, from green-up to fruiting, T. mongolicus displays complex surface coverage patterns and temporal dynamics, posing unique challenges for FVC estimation. Studies have shown that thyme oil contains various alkenes and terpenes with potential applications in treating conditions such as cancer and obesity [18,19]. Consequently, thyme has received increasing attention owing to its medicinal and other uses. T. mongolicus is mainly found in Gansu, Shaanxi, and Inner Mongolia, China, and is common in northern grasslands, mountains, and sand dunes [20]. However, improper exploitation of T. mongolicus has led to a rapid decline in wild populations, which threatens its role in soil conservation, ecological restoration, and sustainable use as a spice and a medicinal resource. Therefore, monitoring the dynamic FVC of T. mongolicus is crucial for its conservation and long-term sustainability.
UAV-based FVC estimation methods mainly include the empirical model (EM) and the pixel dichotomy model (PDM) [21,22]. EM derives vegetation indices from canopy reflectance and utilizes models to estimate FVC. EM exhibits high accuracy and stability across different times and locations [23,24]. EM accuracy is further enhanced through the integration of vegetation indices with machine learning algorithms such as random forest (RF), gradient boosting, and support vector regression (SVR) [25]. In contrast, PDM assumes that each pixel comprises two components—vegetation and soil—and estimates FVC based on their respective proportions. This method effectively reduces interference from atmospheric conditions and soil backgrounds, ensuring stability and broad applicability [26]. Accurate vegetation–soil differentiation is crucial for PDM, with vegetation index thresholding commonly used for classification. Variations in vegetation indices are examined to determine suitable thresholds for classifying image pixels. Studies have shown that selecting optimal thresholds enhances classification accuracy and PDM performance [27]. However, manual interpretation of visuals or sample analysis to determine thresholds increases workload and processing time. Despite these challenges, PDM remains a reliable method for FVC estimation owing to its accuracy and repeatability. Integrating multi-source remote sensing data and advanced classification algorithms further enhances the effectiveness of PDM [28].
This study aims to monitor the dynamic changes in T. mongolicus FVC using UAV remote sensing technology, providing valuable insights for its conservation and sustainable utilization. UAV technology enhances the efficiency and accuracy of FVC monitoring compared with traditional methods. This research quantitatively estimates T. mongolicus FVC to provide essential data on its growth dynamics and explores the use of UAV technology for monitoring creeping and semi-erect plants. The findings provide practical guidance for managing similar crops and vegetation. This study includes the following components: (1) Selection of feature variables, including the normalized difference vegetation index (NDVI), green normalized difference vegetation index (GNDVI), ratio vegetation index (RVI), and difference vegetation index (DVI). FVC modeling was performed using four algorithms—multiple linear regression (MLR), RF, SVR, and artificial neural network (ANN). Models were evaluated based on the coefficient of determination (R2), root mean square error (RMSE), and normalized root mean square error (NRMSE) to determine the optimal model for each phenological stage. (2) FVC estimation using the optimal model, with results compared against ground truth data to assess dynamic changes across different phenological stages. (3) Growth dynamics analysis through the examination of FVC variation rates throughout different developmental stages.

2. Materials and Methods

2.1. Research Plot

This study was conducted in Helinger County, Hohhot City, Inner Mongolia Autonomous Region, China (40°28′55″ N, 111°49′37″ E) in 2024 (Figure 1). Helinger County is located in central Inner Mongolia on the Loess Plateau. The research site has an altitude of ~1351 m and exhibits a temperate continental monsoon climate characterized by distinct seasonal changes and considerable annual temperature variations. The mean annual temperature ranges from 3.5 °C to 8 °C, while annual precipitation varies between 335.2 mm and 534.6 mm. The T. mongolicus materials used in the research were collected from Hohhot City, Inner Mongolia, and transplanted between July and August 2023. The research plot measures 34 m from east to west and 10 m from north to south, with a 0.5 m spacing between individual plants. A total of 275 T. mongolicus plants were cultivated for inverse modeling, all managed under standard field practices.

2.2. UAV Imagery Collection and Preprocessing

This study utilized the DJI MAVIC 3M UAV, manufactured by SZ DJI Technology Co., Ltd. (Shenzhen, China). The UAV was equipped with a visible light camera and a four-band multispectral camera (Table 1). Flight routes were planned using the DJI Pilot 2 App. Based on preliminary tests to optimize both spatial resolution and coverage efficiency, the flight altitude was set to 15 m with side and forward overlap rates of 70% and 80%, respectively. All flights were conducted between 10:00 and 14:00 local time under clear sky conditions. UAV image collection was performed during the green-up, budding, early flowering, peak flowering, and fruiting stages of T. mongolicus from April to July 2024.
The data preprocessing mainly included image mosaicking, radiometric calibration, and geometric correction. Before each flight, a calibrated reflectance panel was used for radiometric calibration to convert digital numbers into surface reflectance values. After image acquisition, DJI Terra software (version 4.2.5) was utilized for visible light and multispectral reconstruction, generating UAV images with a ground resolution of 0.69 cm. Geometric correction was performed using RTK-GPS ground control points, with the World Geodetic System 1984 as the coordinate reference.

2.3. Research Methodology

2.3.1. Ground Truth Values

This study utilized the thresholding method to obtain ground truth values, a widely used approach for distinguishing vegetation from soil pixels. Although NDVI is a commonly used vegetation index, it is highly sensitive to background interference in areas with sparse vegetation and high-reflectance soils. The sandy loam soil in the research plot exhibits strong NIR reflectance owing to its coarse texture and high mineral content, which can cause sensor saturation and reduce vegetation extraction accuracy [29]. In contrast, the optimized soil-adjusted vegetation index (OSAVI) incorporates a soil adjustment factor to reduce soil background interference, thereby enhancing the accuracy of FVC extraction [30,31]. The OSAVI formula is presented in the following Equation (1):
OSAVI = 1.16 × N I R R N I R + R + 0.16
where NIR represents the reflectance in the near-infrared band and R denotes the reflectance in the red-light band.
To improve segmentation accuracy between vegetation and soil, OSAVI was selected as the key index. Ground truth values were determined using a combination of visual interpretation and the vegetation index time–series intersection method [32,33]. First, OSAVI values were extracted for all pixels across different phenological stages, and MATLAB R2023b was used to plot the OSAVI time series. This analysis identified two key characteristics: (1) The intersection points of OSAVI frequency distribution curves across phenological stages provided reference thresholds for discriminating between vegetation and soil signals. (2) The OSAVI value distribution range at each stage highlighted spectral differences between vegetation and soil. These features formed the basis for establishing thresholds to effectively distinguish vegetation from soil. High-resolution RGB images and visual interpretation were used to verify and optimize these thresholds. First, clear vegetation boundaries were identified, followed by the application of initial thresholds to generate masks. Classification results were compared with visual observations, and thresholds were iteratively adjusted (±0.05) until an optimal match with observed vegetation was achieved. The threshold segmentation method provides an objective and effective approach for FVC estimation [34], and this method was adequate for monitoring the dynamic changes in FVC in this study. Using this method, vegetation and soil pixels in the research plot were counted to calculate ground truth values for each phenological stage. The calculation formula is as follows (Equation (2)):
FVC = N v e g N v e g + N s o i l
where N v e g represents the number of vegetation pixels and N s o i l denotes the number of soil pixels.

2.3.2. Vegetation Index-Based FVC Extraction

After preprocessing, the images were imported into ENVI 5.3 software (L3Harris Technologies, Melbourne, FL, USA) to calculate vegetation indices based on spectral reflectance. Four vegetation indices—NDVI, GNDVI, RVI, and DVI—were selected for analysis (Table 2). These indices effectively assess vegetation status and are widely used in land cover classification, vegetation monitoring, and environmental change analysis at regional and global scales. NDVI, the most commonly used index, reflects overall vegetation growth, while GNDVI is more sensitive to green vegetation, providing higher accuracy in certain applications. To estimate FVC, RVI and DVI utilize the differences between NIR and red-light bands. Although OSAVI enhances segmentation accuracy between vegetation and soil, it was used only for ground truth value calculation and not as an input variable in the machine learning models. Therefore, this study focused on NDVI, GNDVI, RVI, and DVI for model construction using ground truth values to assess model accuracy.
To extract effective vegetation information from the images, ArcGIS 10.8 software (Esri, Redlands, CA, USA) was used to segment all T. mongolicus plants in the research plot and assign unique IDs to each plant for distinguishing different germplasm resources. The location and shape information for each individual plant were recorded. A spectral band extraction tool was then employed to extract vegetation indices for each plant at various phenological stages.

2.3.3. Construction and Accuracy Assessment of FVC Inversion Models

In this study, FVC inversion models were developed using vegetation index data from individual plants. To enhance accuracy, four commonly used machine learning and regression algorithms—MLR, RF, SVR, and ANN—were applied. These models used NDVI, GNDVI, RVI, and DVI as input variables, with FVC as the output variable. To ensure model generalization and stability, 80% of the data was randomly selected for training, and the remaining 20% was reserved for validation.
To ensure the reliability and reproducibility of model performance, a systematic parameter sensitivity analysis was conducted for each algorithm. For the RF model, three key parameters were optimized: the number of decision trees, maximum depth, and minimum samples required for a split. In the SVR model, the effects of the regularization parameter (C), kernel coefficient (gamma), and error tolerance (epsilon) were analyzed. The ANN model utilized a multi-layer neural network structure with dropout layers between hidden layers to prevent overfitting. Dropout rates were optimized accordingly, and early stopping was implemented during training. If the model validation loss did not improve after 10 consecutive epochs, training was terminated.
During model evaluation, R2, RMSE, and NRMSE were used to quantitatively assess the accuracy of each model. R2 measures the goodness of fit between the predicted and actual values, while RMSE represents the average error margin. NRMSE standardizes RMSE to eliminate the effect of magnitude, enabling comparisons across different models. The predictive accuracy of each model was evaluated across various phenological stages, and the most accurate model was selected for subsequent FVC estimation to ensure reliable predictions throughout the growth stages.

3. Results

3.1. Determination of Ground Truth Values and Optimization of Model Parameters

3.1.1. FVC Ground Truth at Different Phenological Stages

Vegetation index values were extracted for different phenological periods, and MATLAB R2023b was used to plot the OSAVI time series (Figure 2). During the green-up stage, OSAVI values were mainly concentrated in the lower range, with a notable frequency peak at 0.10 and a sharp decline around 0.20, marking the threshold between soil and T. mongolicus. As T. mongolicus progressed through its reproductive stages, the OSAVI distribution gradually shifted to the right. Moreover, multiple intersection regions emerged between consecutive phenological stages: 0.10–0.15 between the green-up and budding stages, 0.15–0.20 between the budding and early flowering stages, and 0.20–0.25 between the early flowering and peak flowering stages and between the peak flowering and fruiting stages. These intersection regions reflect the gradual transition of vegetation growth states. According to these distribution characteristics and the visual interpretation method, stage-specific thresholds were established as follows: 0.20 for green-up, 0.32 for budding, 0.30 for early flowering, 0.32 for peak flowering, and 0.40 for fruiting. These thresholds were used to calculate the ground truth FVC values for each phenological stage.
Table 3 presents the FVC values of T. mongolicus across different phenological stages. During the green-up stage, FVC was relatively low, with a mean of 9.21% and a standard deviation (SD) of 0.05. In the budding stage, FVC significantly increased to a mean of 24.69% with an SD of 0.09. At the early flowering stage, FVC continued to increase, with a mean of 35.37% and an SD of 0.11. In the peak flowering stage, FVC reached an average of 50.80%, with an SD of 0.15. Finally, during the fruiting stage, as T. mongolicus approached maturity, FVC peaked at a mean of 64.63% with an SD of 0.17, indicating stable vegetation growth and near-maximum coverage.

3.1.2. Parameter Sensitivity Analysis Results

The parameter sensitivity analysis revealed distinct variations in model performance across different phenological stages (Tables S1–S3).
  • The RF model achieved optimal performance during the peak flowering stage (R2 = 0.93, max_depth = 5) but exhibited relatively lower accuracy in the fruiting stage (R2 = 0.77, n_estimators = 50). The model sensitivity to key parameters varied, with n_estimators ranging from 50 to 500. Additionally, max_depth values between 5 and 10 yielded better performance.
  • The SVR model exhibited high prediction accuracy during the peak flowering stage (R2 = 0.95, gamma = 0.1) and maintained strong performance during the early flowering stage (R2 = 0.92, C = 5.0). The regularization parameter C considerably influenced model performance, with optimal values ranging from 1.0 to 10.0 across different stages. The epsilon parameter consistently exhibited optimal performance at 0.1 across all phenological stages.
  • The ANN model achieved the highest accuracy during the peak flowering stage (R2 = 0.95, dropout = 0.1) and the budding stage (R2 = 0.93, dropout = 0.1). Lower dropout rates (0.1–0.2) generally yielded better results across most phenological stages, while higher dropout values resulted in decreased model performance. During the fruiting stage, optimal performance was achieved with a slightly higher dropout rate of 0.2 (R2 = 0.77).
Overall, the models achieved the highest prediction accuracy during the peak flowering stage, with comparatively lower accuracy observed during the fruiting stage. The sensitivity analysis provided valuable insights for selecting the most suitable model for each phenological stage.

3.2. Establishment and Validation of Best Models for Different Phenological Stages

3.2.1. Validation Set Results for Different Models Across Phenological Stages

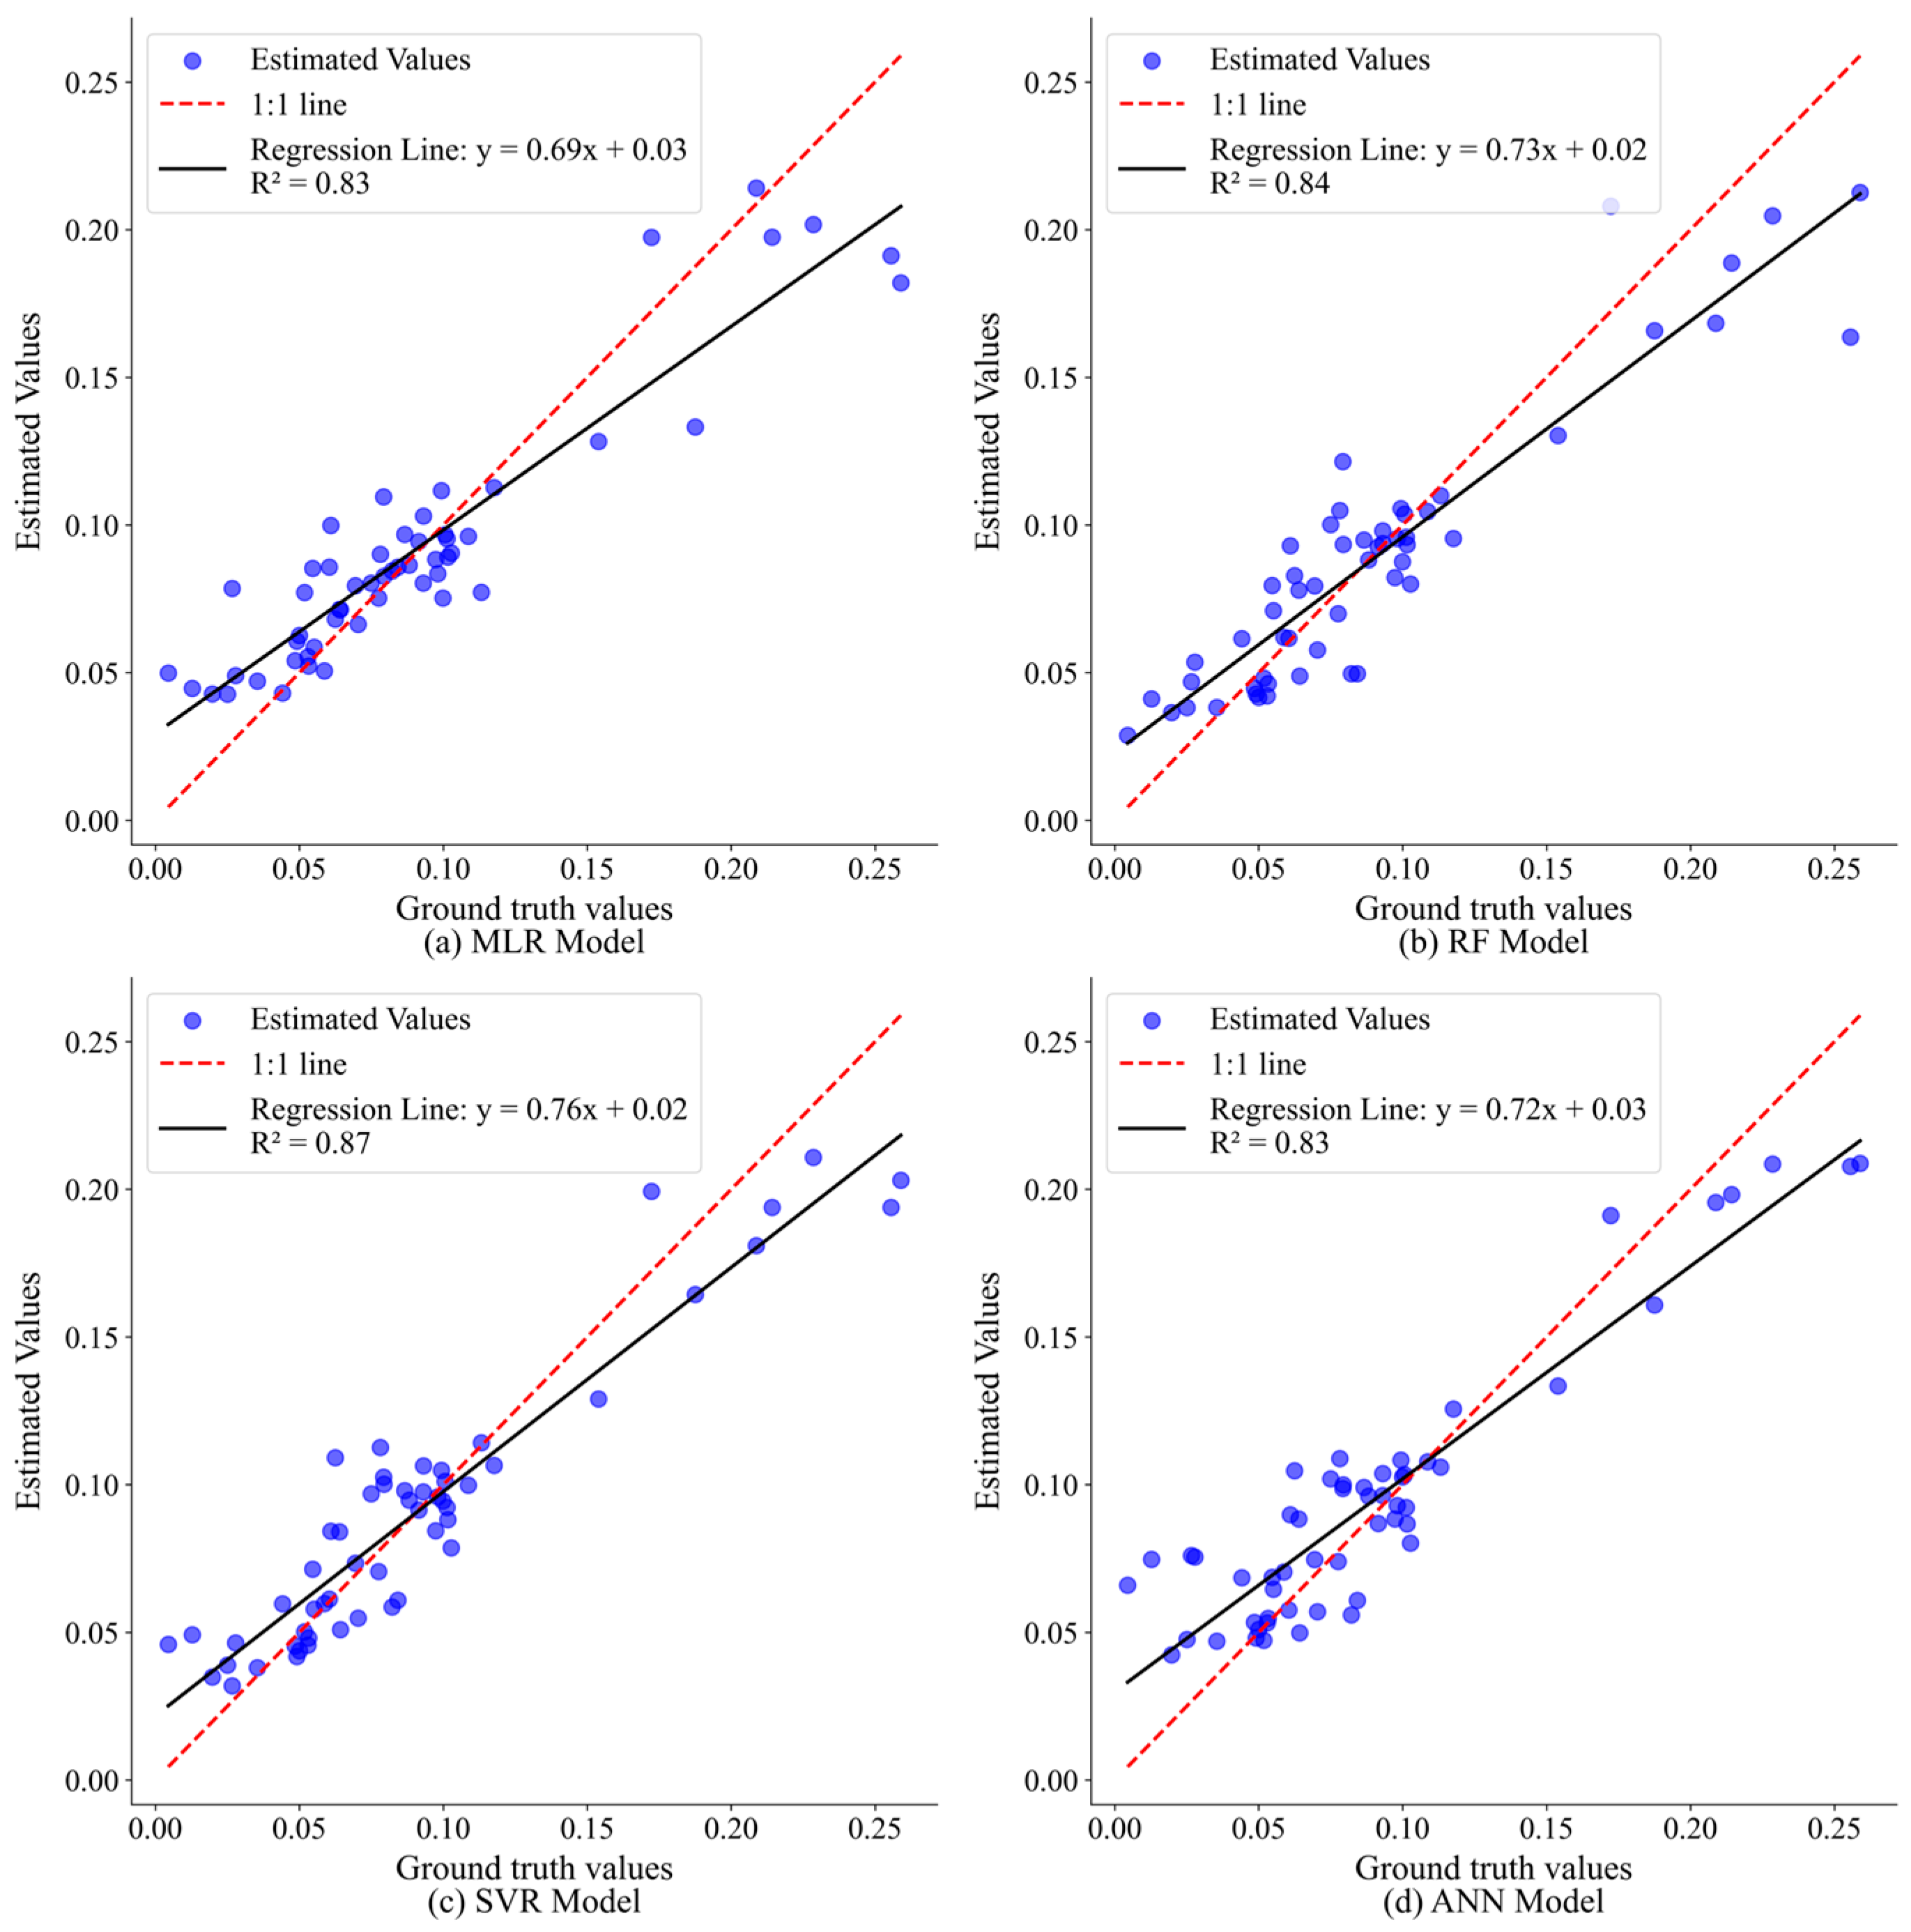
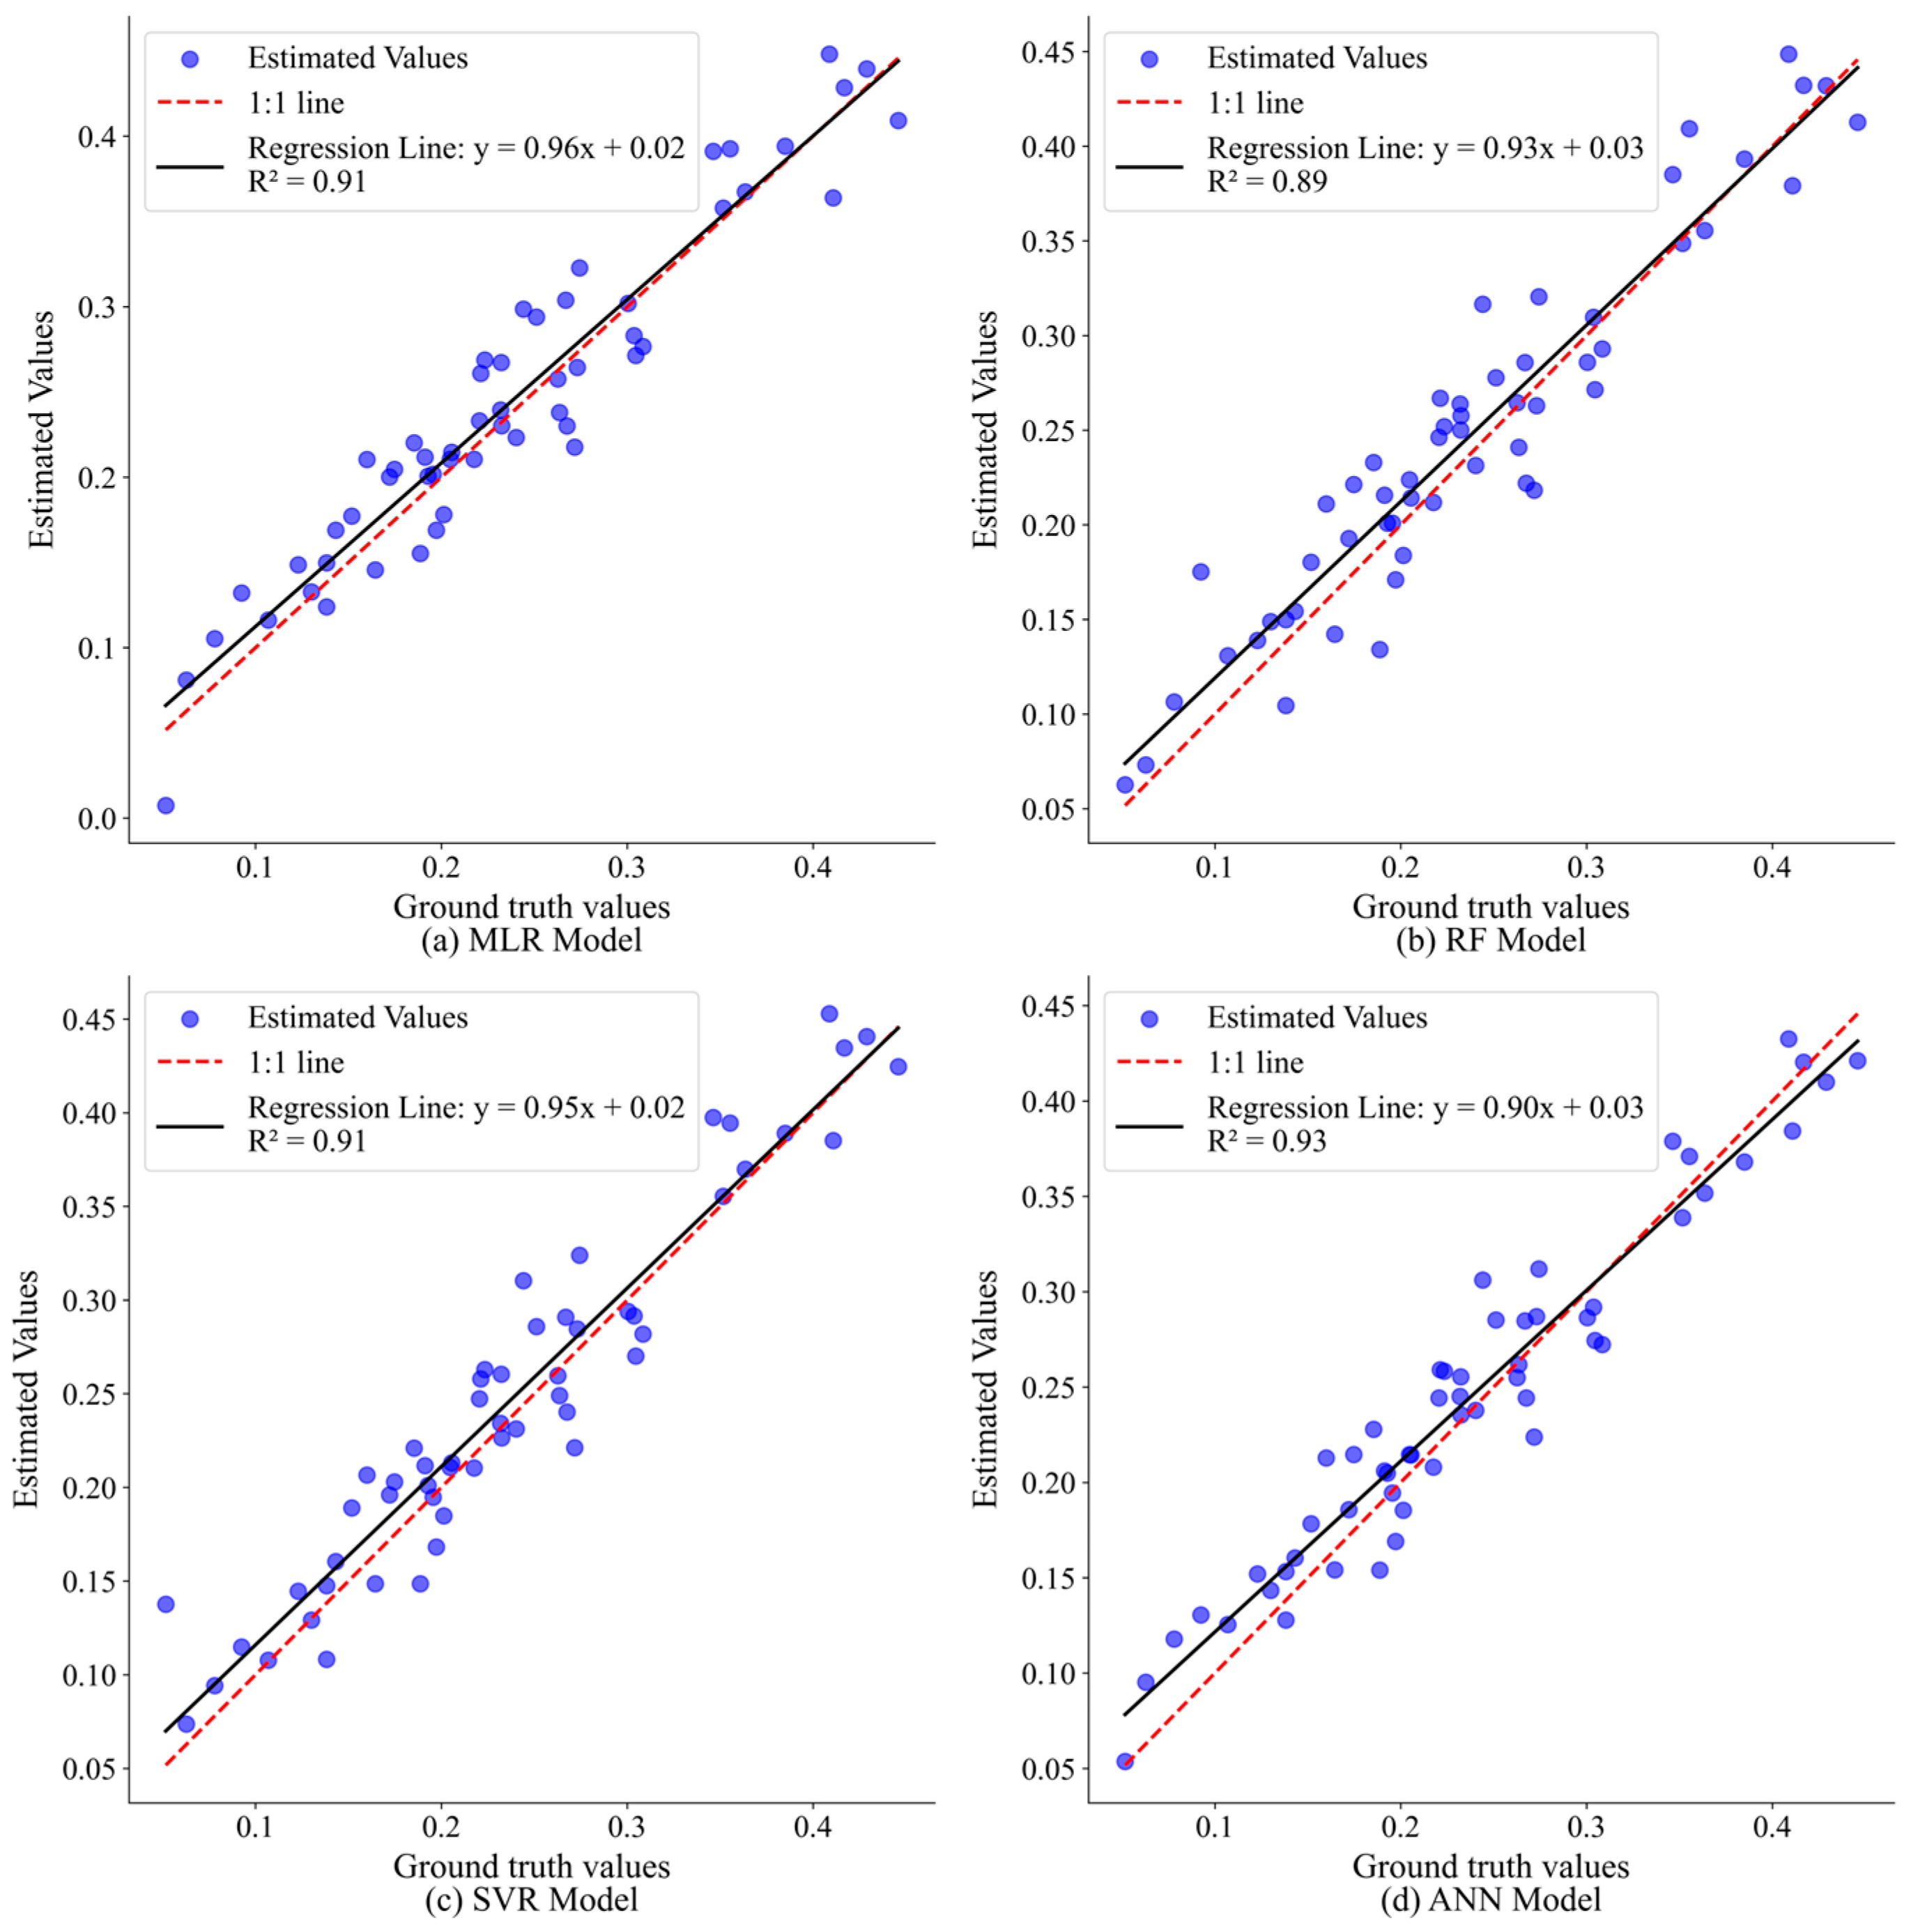
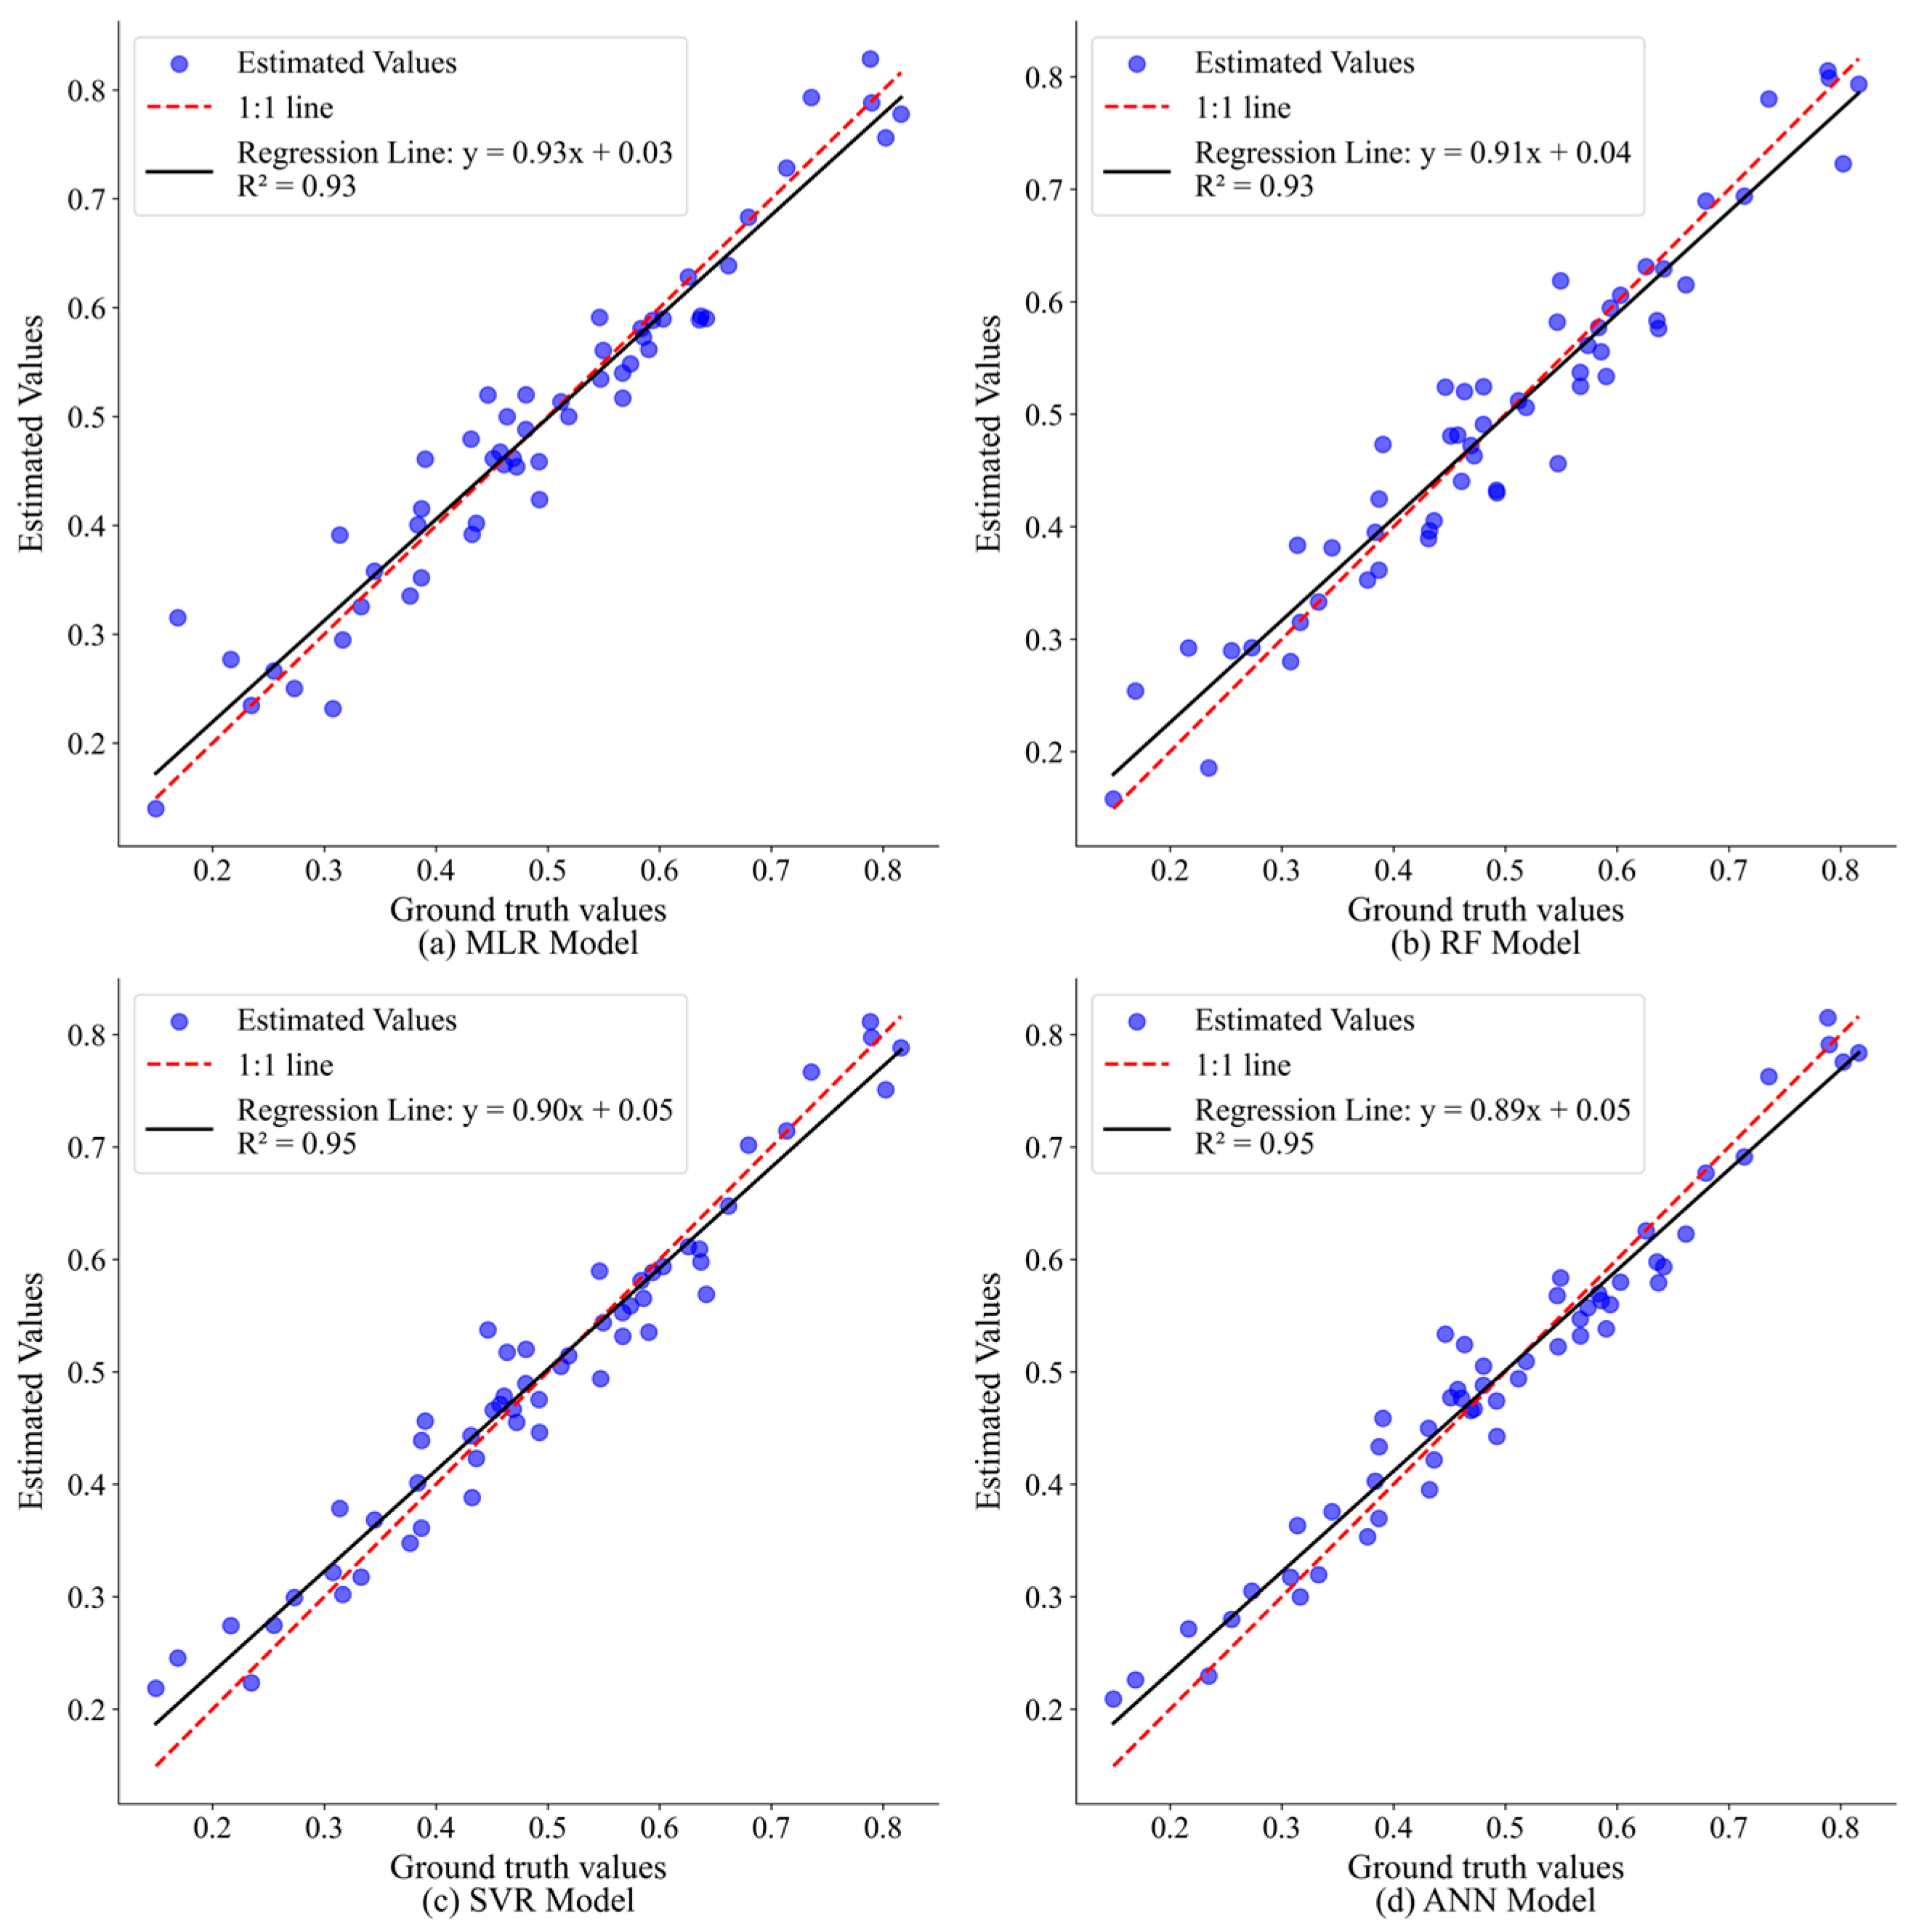
Four algorithms—MLR, RF, SVR, and ANN—were used to model FVC across different phenological stages. Validation results (Figure 3) revealed that during the green-up stage, the SVR model achieved the highest accuracy, with an R2 of 0.87, the lowest RMSE (0.02), and an NRMSE of 8.19%. In contrast, the MLR model exhibited the lowest accuracy and a poor fit, with an R2 of 0.83 (Figure 4). During the budding stage, the ANN model outperformed the other models, achieving an R2 of 0.93 and an NRMSE of 6.55% (Figure 5). In the early flowering stage, the SVR model maintained strong predictive performance, with R2, RMSE, and NRMSE values of 0.91, 0.04, and 6.07%, respectively (Figure 6). The ANN model exhibited the highest accuracy during the peak flowering stage, with an R2 of 0.95 and the lowest NRMSE (5.11%) for FVC estimation (Figure 7). Although accuracy slightly decreased in the fruiting stage, the ANN model achieved excellent performance, with R2, RMSE, and NRMSE values of 0.77, 0.09, and 11.61%, respectively (Figure 8).

3.2.2. Best Model Results Validation

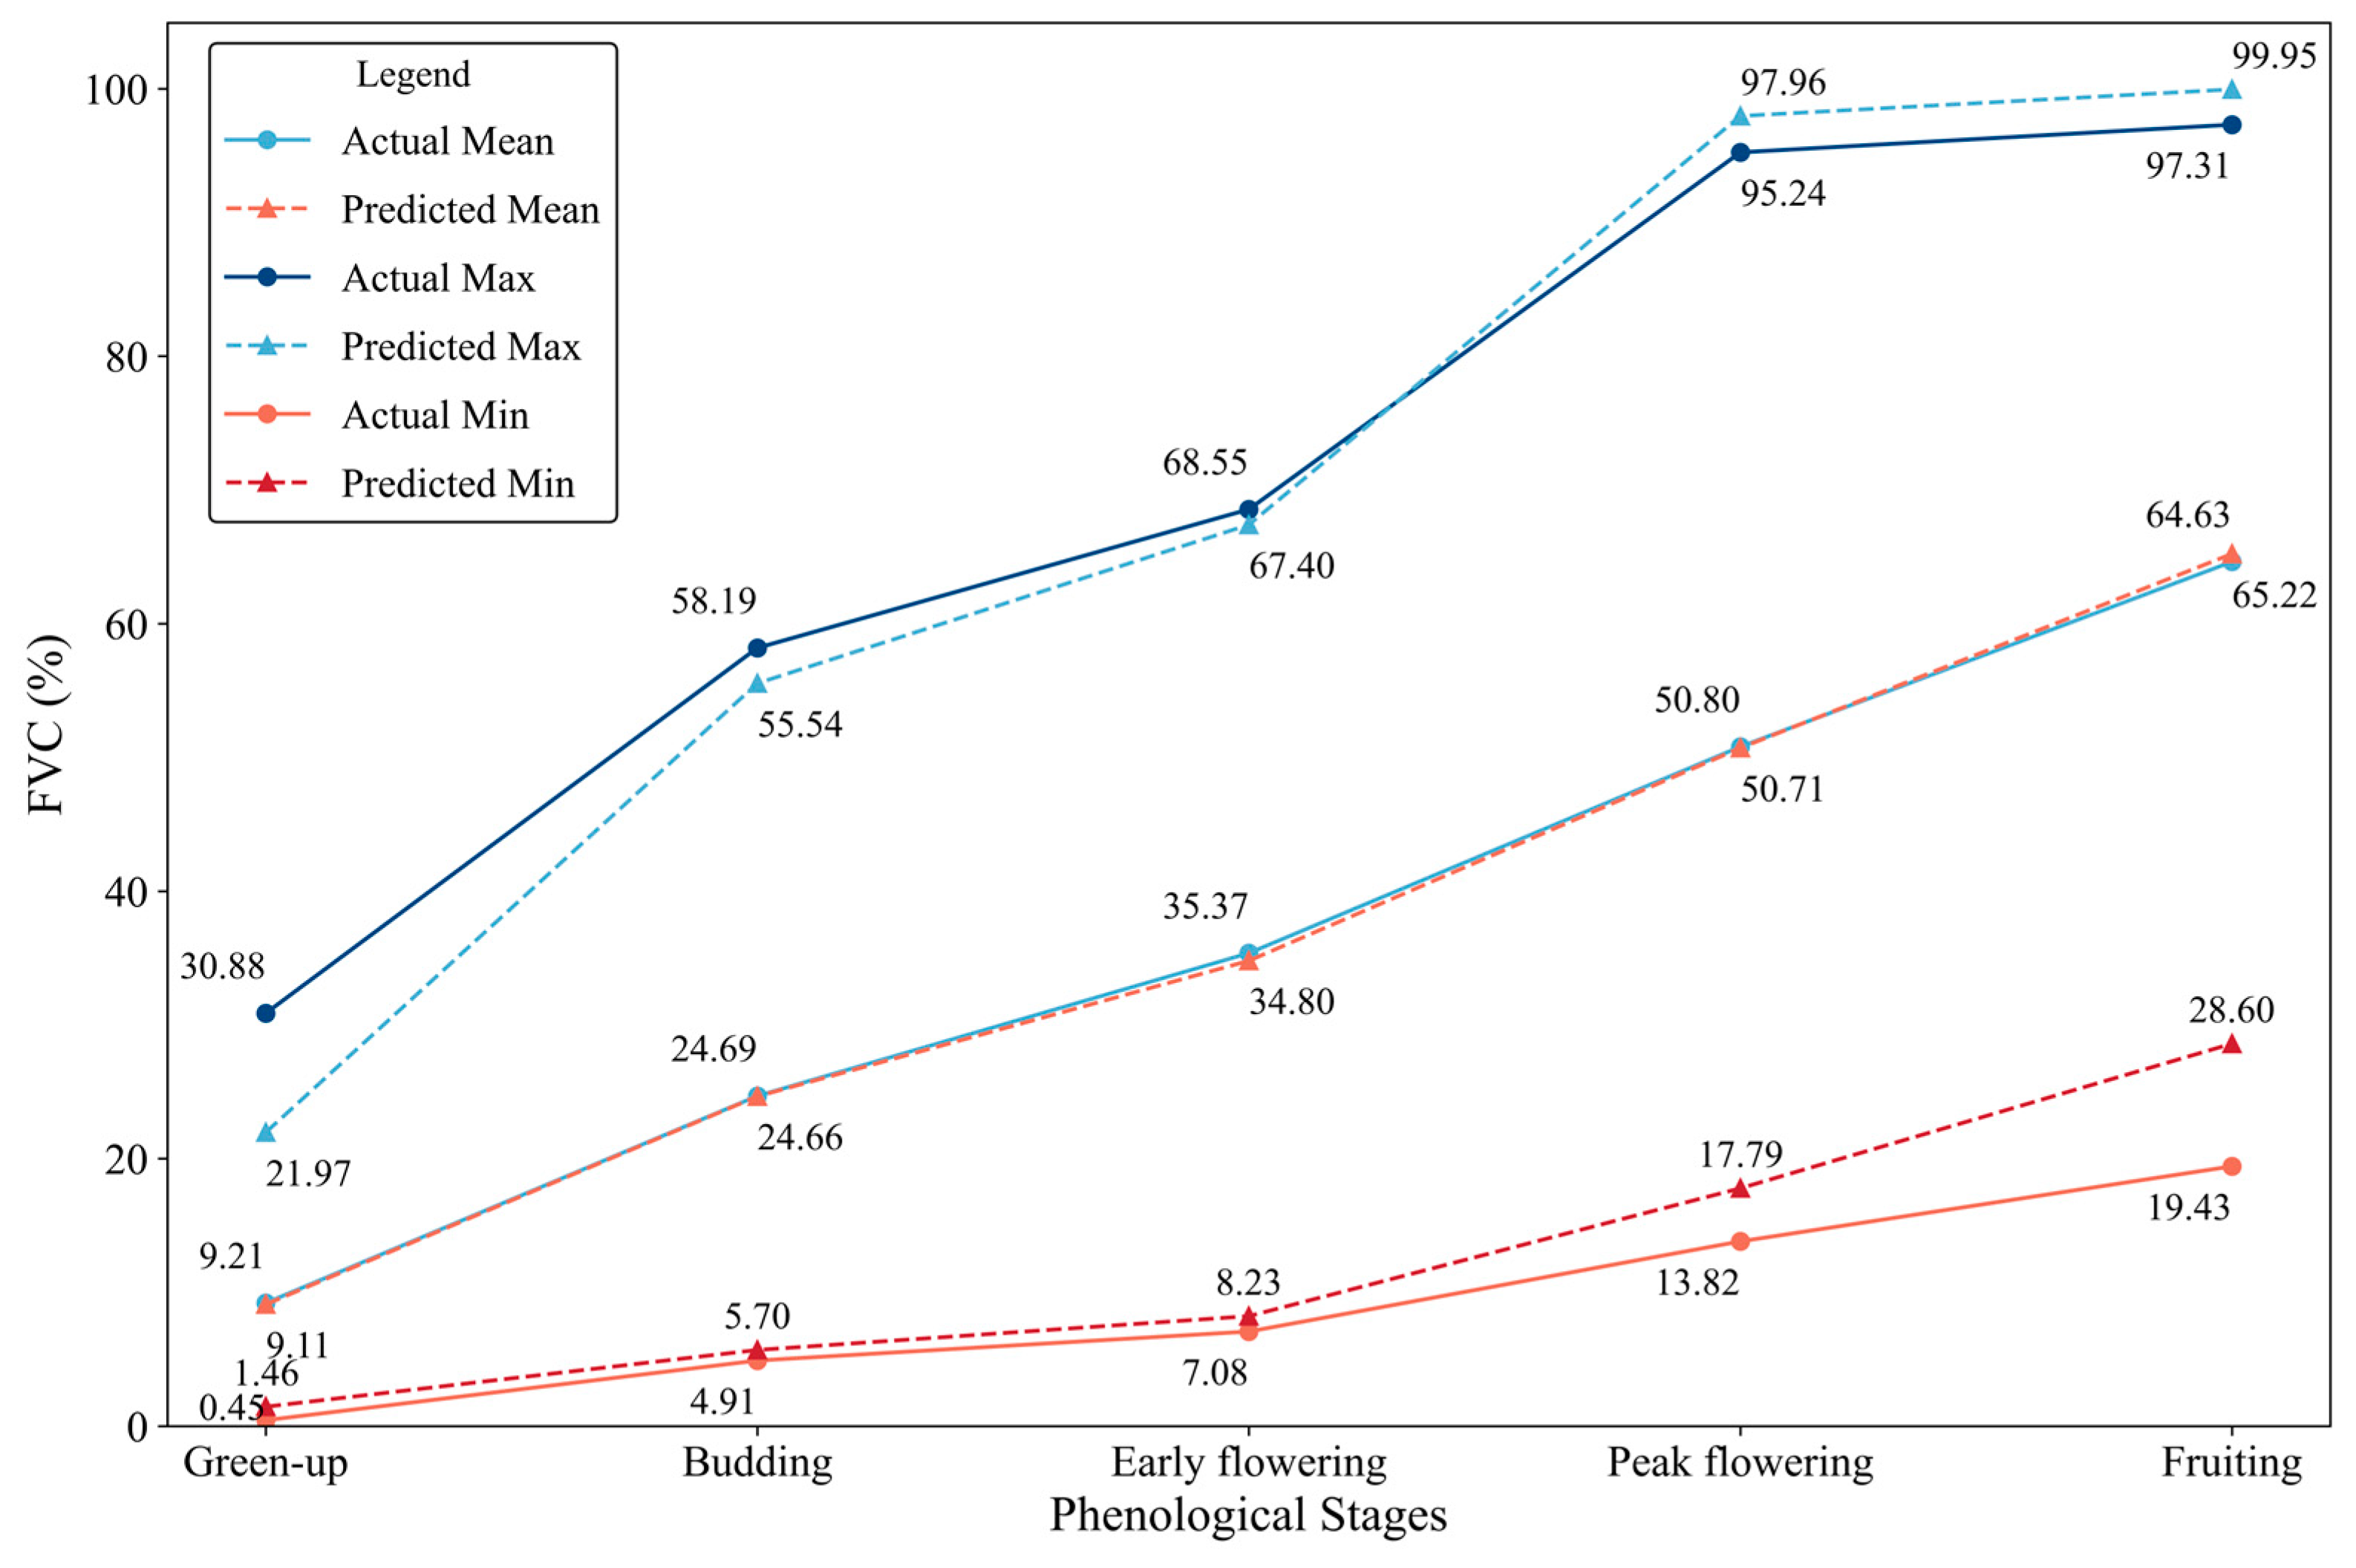
To assess model accuracy at different phenological stages, estimates from the best-performing models were compared with ground truth values (Table 3). During the green-up stage, ground truth FVC values ranged from 0.45% to 30.80%, while SVR estimates varied from 1.46% to 21.97%, with SDs of 0.05 and 0.04, respectively. In the budding stage, ground truth values ranged from 4.91% to 58.19%, and ANN estimates ranged from 5.70% to 55.54%, both with an SD of 0.09. In the early flowering stage, ground truth FVC values ranged from 7.08% to 68.55% (SD = 0.11), while SVR estimates ranged from 8.23% to 67.40% (SD = 0.11). During the peak flowering stage, ground truth values ranged from 13.82% to 95.24%, while ANN estimates varied from 17.79% to 97.96%, with SDs of 0.15 and 0.14, respectively. In the fruiting stage, ground truth values ranged from 19.43% to 97.31% (SD = 0.17), while ANN estimates ranged from 28.60% to 99.95% (SD = 0.15).

3.3. Dynamic Changes in T. mongolicus Across Phenological Stages

Dynamic changes in FVC across phenological stages exhibited strong agreement between ground truth and estimated values (Figure 9). During the green-up stage, FVC was mainly concentrated in the lower range. The SVR model estimated a maximum FVC of 21.97%, which was lower than the ground truth maximum of 30.88%. The mean values were 9.21% for ground truth and 9.11% for SVR. In the budding stage, FVC significantly increased, with ground truth reaching a maximum of 58.19% (mean = 24.69%), while ANN estimated a maximum of 55.54% (mean = 24.66%). Despite slight differences in maximum values, the mean predictions were consistent with ground truth measurements. During the early and peak flowering stages, FVC continued to increase, with ground truth maxima of 68.55% and 95.24%. SVR and ANN estimates reached 67.40% and 97.96%, respectively. The average FVC values exhibited high accuracy, with SVR estimates of 34.80% closely matching the ground truth mean of 35.37% in the early flowering stage. In the peak flowering stage, ANN estimates were similarly precise, with a ground truth mean of 50.80% and an ANN mean of 50.71%. During the fruiting stage, FVC approached near-maximum coverage, with only slight differences between ground truth and ANN estimates. Ground truth had a maximum of 97.31% and a mean of 64.63%, while ANN reached a maximum of 99.95% and a mean of 65.22%.
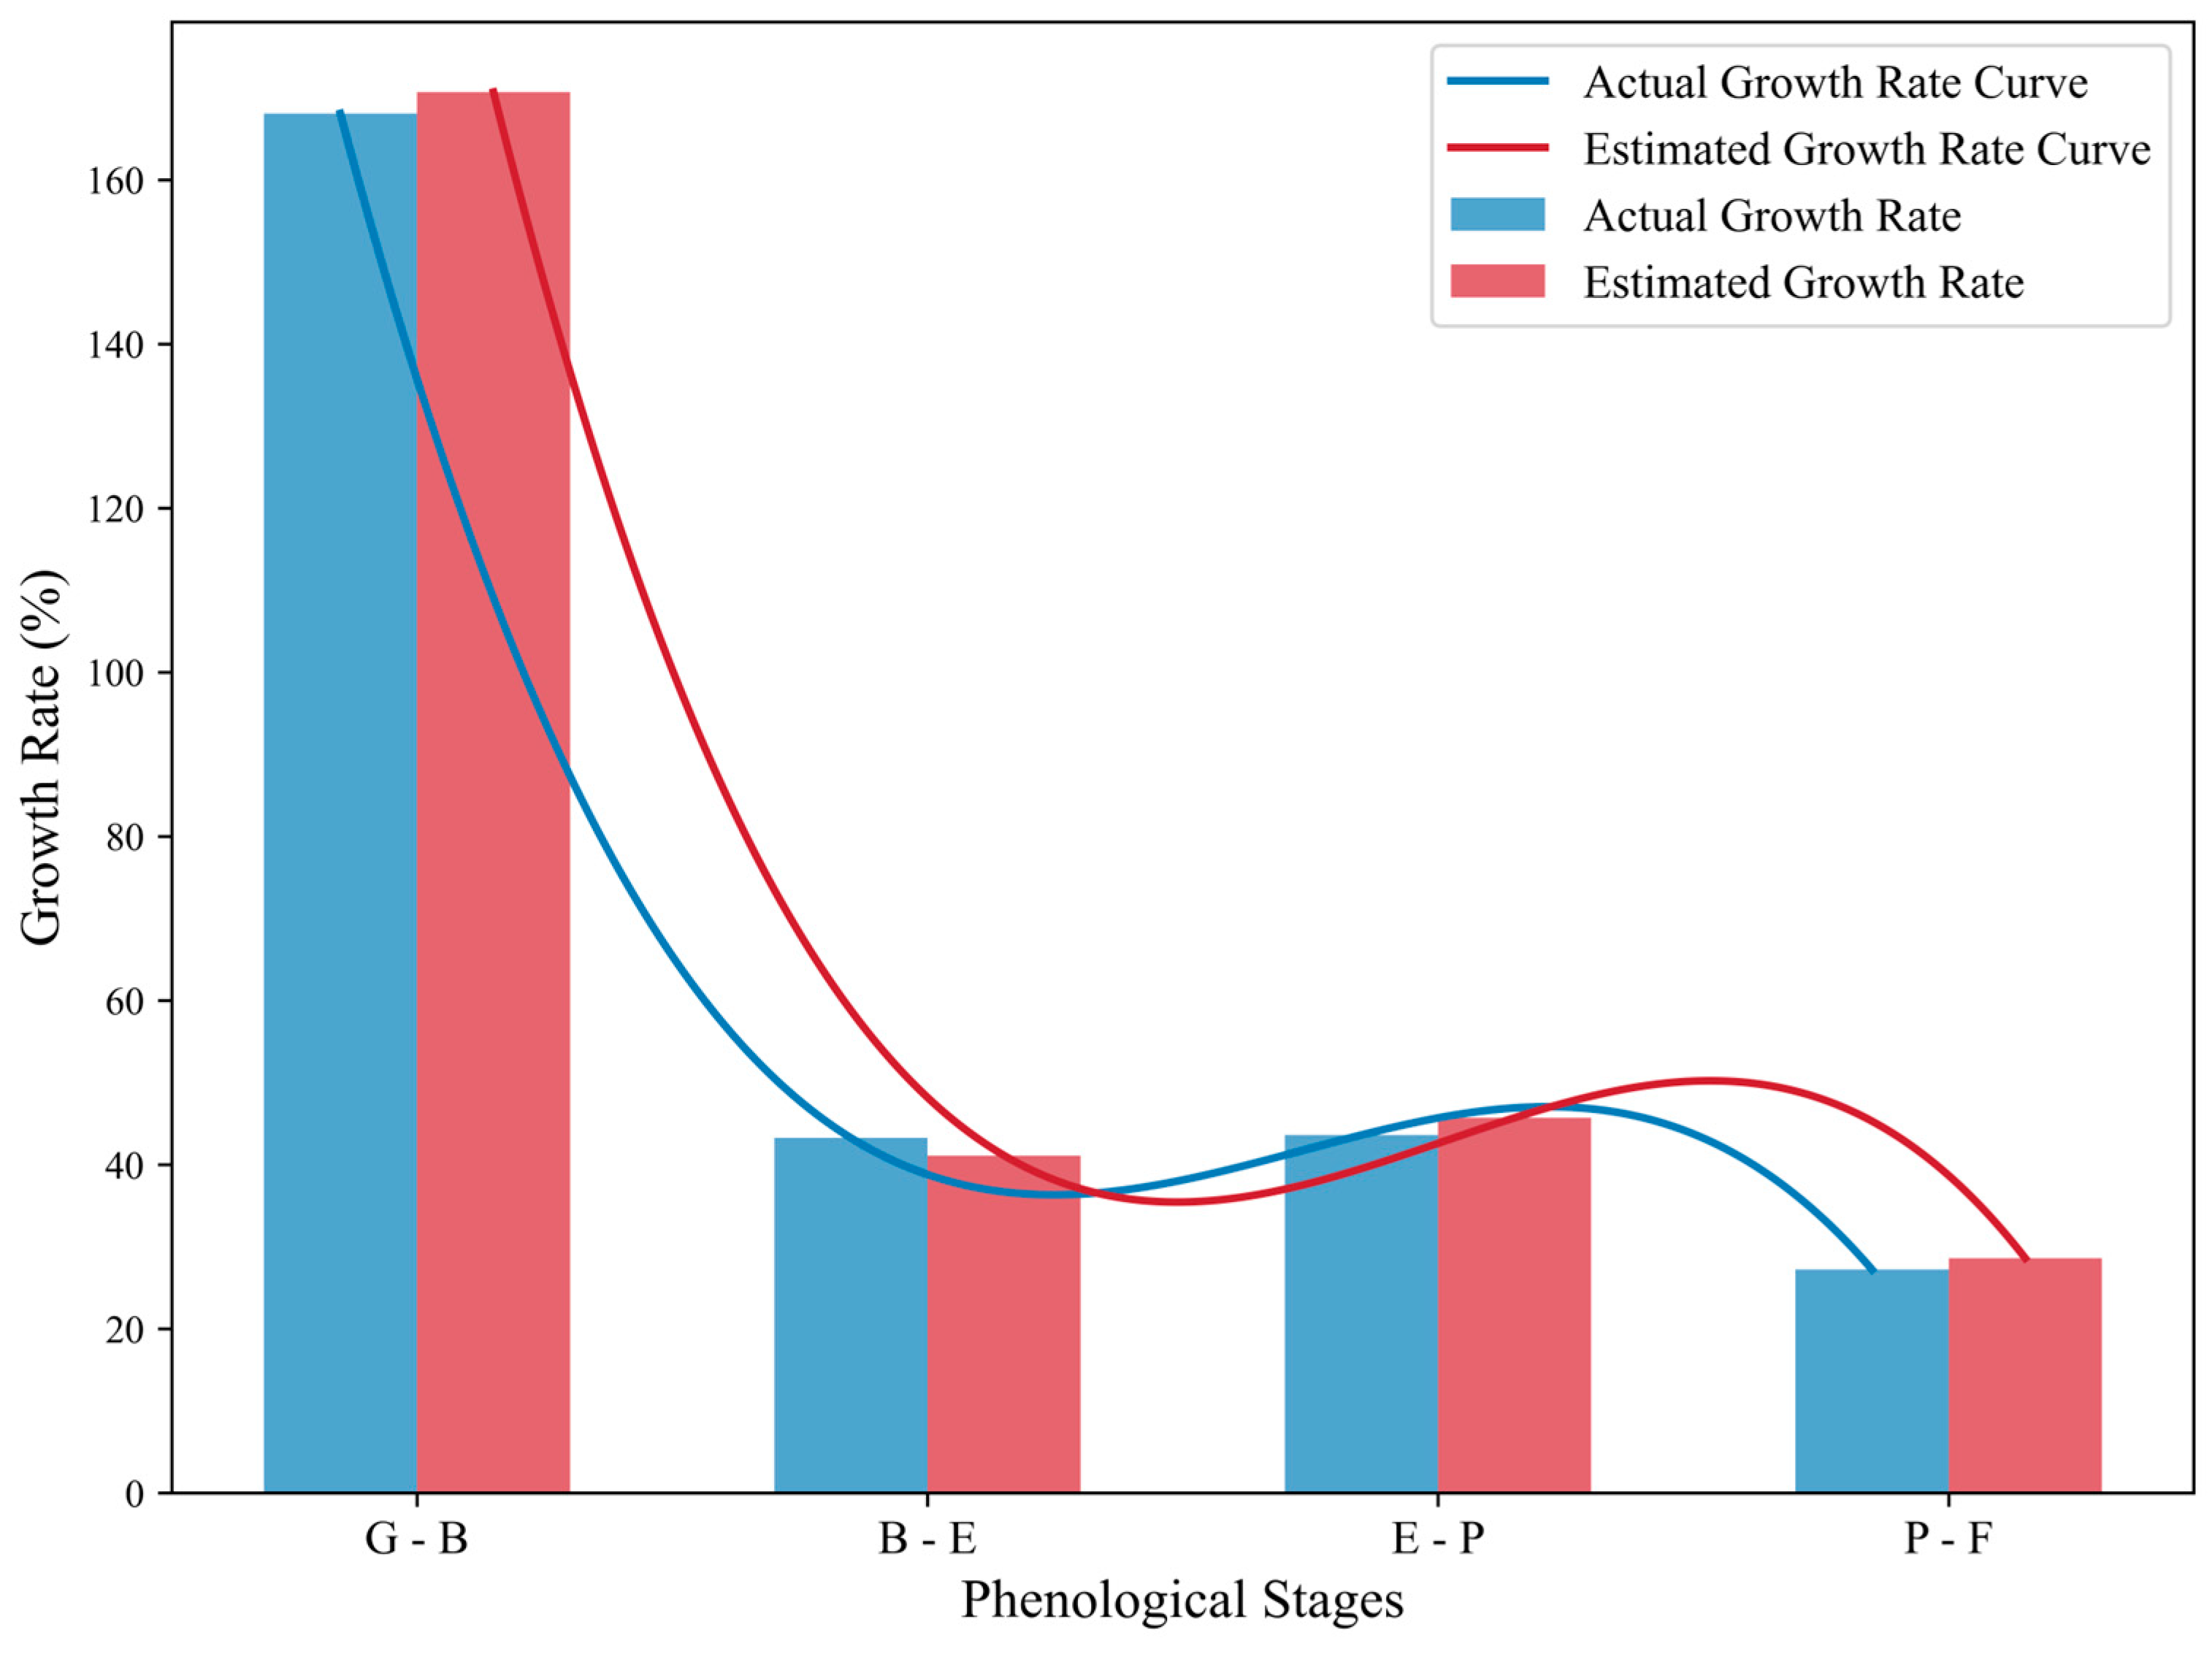
This study derived growth rate curves using the mean FVC values for each phenological stage, enabling a detailed analysis of the dynamic changes in T. mongolicus FVC and an assessment of model estimation accuracy. The results revealed distinct trends in FVC growth rates across phenological stages (Figure 10). From green-up to budding, the ground truth FVC growth rate reached 168.08%, indicating the most rapid growth phase. From budding to early flowering, the growth rate decreased progressively to 43.26%. From early flowering to peak flowering, the growth rate slightly decreased to 43.62%. From peak flowering to fruiting, the growth rate further slowed to 27.22%. The model-predicted FVC growth rates were consistent with the measured values. The predicted growth rates were 170.69% from green-up to budding, 41.12% from budding to early flowering, 45.72% from early flowering to peak flowering, and 28.61% from peak flowering to fruiting. Across all phenological stages, the differences between ground truth and estimated growth rates remained minimal. Notably, during the green-up to budding and early to peak flowering phases, the model predictions nearly match the measured growth rates. This indicates the high accuracy and stability of the model in simulating FVC growth trends.

4. Discussion

4.1. FVC Changes Across Key Phenological Stages of T. mongolicus

The FVC of T. mongolicus exhibited notable dynamic changes across phenological stages (Figure 10). From the green-up to the budding phase, the FVC growth rate peaked at 168.1%, consistent with the findings of previous studies. This highlights the high growth potential of the plant during the early stages. Like many herbaceous plants, this period corresponds to the most intense photosynthetic activity [39,40], driven by favorable environmental conditions, including adequate light, temperature, and moisture. These factors accelerated FVC growth. As T. mongolicus transitions into the reproductive phase, nutrient allocation shifts toward above-ground structures such as leaves and stems, thereby supporting continued growth [41]. However, photosynthetic intensity decreased as nutrient demands shifted to support reproduction, including seed development [42,43]. Consequently, leaf growth diminished, leading to a moderation in FVC growth. During the green-up stage, T. mongolicus exhibited a low initial FVC owing to underdeveloped leaves but displayed considerable growth potential. As the plant progressed through the flowering and fruiting stages, FVC growth potential decreased and approached saturation. Resource allocation increasingly shifted toward reproductive structures, causing FVC to stabilize.

4.2. Best Models for Different Phenological Stages

The performance of FVC estimation models based on UAV remote sensing imagery varied considerably across different phenological stages (Figure 3). As T. mongolicus progressed from green-up to fruiting, dynamic changes in leaf coloration, canopy density, and spectral reflectance contrast between vegetation and background were observed. These variations affected the acquisition of remote sensing images and the prediction accuracy of FVC estimation models across different phenological periods.
The SVR model demonstrated superior learning and prediction capabilities during the green-up and early flowering stages, achieving R2 values of 0.87 and 0.91, respectively. During the green-up stage, when vegetation coverage was sparse and the canopy had not fully developed, soil background significantly influenced spectral reflectance patterns. This influence resulted in reduced reflectance in the NIR band [44], leading to lower NDVI and GNDVI values with concentrated distribution [45]. The SVR model’s kernel mapping capabilities effectively addressed these small-range variations in data features, successfully identifying the optimal hyperplane in high-dimensional feature space and distinguishing spectral differences between vegetation and soil background. During the early flowering stage, as plants transitioned to reproductive growth, increased chlorophyll content resulted in more complex spectral reflection characteristics [46]. The SVR model efficiently handled emerging nonlinear features through adaptive kernel function parameter adjustment [47] while maintaining robust prediction stability and minimizing overfitting risks in sparse data conditions [48].
The ANN model exhibited exceptional prediction accuracy during the budding and peak flowering stages, with R2 values of 0.93 and 0.77, respectively. During the budding stage, increased canopy density and rapid above-ground expansion, combined with elevated chlorophyll content, enhanced photosynthetic activity. These changes led to stronger absorption of red and green light while gradually increasing NIR band scattering [49,50]. Consequently, vegetation indices showed significant increases and greater data dispersion. As vegetation continued to develop through the peak flowering stage, the expanding FVC further increased data variability. The ANN model effectively captured these complex patterns through its nonlinear mapping capabilities and multi-layer network structure, while its backpropagation optimization ensured adaptive response to these changes [51].
The ANN model maintained robust prediction accuracy during the fruiting stage (R2 = 0.77), despite challenges posed by high FVC conditions. During this period, several vegetation indices (including NDVI, GNDVI, and RVI) exhibited upward trends approaching saturation. The declining chlorophyll content and reduced photosynthetic intensity [52] resulted in decreased red light absorption. Additionally, leaf senescence and moisture variations likely contributed to reduced NIR band reflectance, resulting in lower DVI values. These factors introduced complexity to the relationship between vegetation indices and FVC, manifesting in highly nonlinear data characteristics and varying degrees of accuracy decline across models. The ANN model’s nonlinear activation functions effectively mitigated saturation effects, while its network architecture adapted to the complex spectral patterns of mature vegetation. In contrast, the SVR model showed reduced performance during these stages, suggesting limitations of kernel-based methods in handling high FVC conditions.
These stage-specific variations in model performance highlight the need to align algorithmic characteristics with vegetation phenological traits. SVR exhibited excellent performance in early growth stages owing to its effective noise handling and nonlinear mapping capabilities. ANN achieved superior performance in peak growth periods with adaptive feature learning and robustness to spectral saturation.

4.3. Error Source Analysis Across FVC Ranges

Despite the overall strong consistency between predicted and measured values, FVC estimates exhibited some deviations across different FVC ranges (Figure 9).
During the green-up stage with a low FVC, the SVR model tended to slightly overestimate minimum values. This overestimation likely occurred owing to sparse canopy coverage and minimal foliage, which reduced the spectral contrast between vegetation and background. Under these conditions, regression models were more prone to interference from background noise, illumination variations, and other image disturbances, leading to the misinterpretation of background signals as vegetation. Because the models relied only on spectral features without integrating physiological or structural factors, they tended to exhibit larger estimation errors in cases of extremely sparse canopy coverage [53].
During the peak flowering and fruiting stages, with a high FVC, the ANN model tended to overestimate maximum FVC values. At these stages, the increased canopy density and saturated vegetation indices [54] made it difficult for the model to capture minimal variations owing to the growing complexity and nonlinear characteristics of data [55]. Additionally, the network structure of ANN made it more prone to overfitting, which reduced its generalization ability in extreme value ranges, leading to overestimated predictions [56]. Furthermore, the minimum FVC values during these stages exhibited greater deviations, indicating reduced model accuracy in detecting minimal changes in vegetation coverage.
The models exhibited high estimation accuracy in the medium FVC range, particularly during the early flowering stage. This range effectively minimized background interference at low FVC and saturation effects at high FVC, enabling a stable relationship between vegetation indices and actual FVC. This stability ensured strong consistency between model predictions and measured values.
Discrepancies in FVC estimation may result from imbalanced or sparse training data [57]. The random selection of training samples (80% of the dataset) may lead to insufficient representation of extreme FVC values, thereby limiting the ability of the model to fully capture vegetation characteristics and affecting the accuracy of maximum and minimum FVC predictions. Further improvements could involve incorporating environmental factors, such as climate and soil data [58,59], to mitigate background interference under sparse vegetation conditions and optimize algorithms to effectively handle spectral saturation in dense canopy scenarios.

5. Conclusions

This study estimated the FVC of T. mongolicus across various phenological stages using UAV remote sensing imagery and monitored its dynamic changes. Remote sensing data were collected during the green-up, budding, early flowering, peak flowering, and fruiting stages. Four machine learning algorithms (MLR, RF, SVR, and ANN) were used to develop and analyze FVC estimation models. Model accuracies were compared to identify the best-performing algorithms, and FVC growth rates and dynamic changes were assessed. The key findings of this study are as follows:
(1)
The mean FVC of T. mongolicus exhibited notable dynamic changes across phenological stages. Particularly, the mean FVC increased from 9.21% during the green-up stage to 64.63% at the fruiting stage. The growth rate peaked at 168.08% during the transition from green-up to budding and then gradually decreased rates in subsequent stages, reflecting distinct temporal patterns in vegetation development.
(2)
The SVR model outperformed the other models during the green-up (R2 = 0.87) and early flowering (R2 = 0.91) stages. Moreover, the ANN model exhibited superior performance during the budding (R2 = 0.93), peak flowering (R2 = 0.95), and fruiting stages (R2 = 0.77). These findings highlight the varying effectiveness of different models across the phenological stages of T. mongolicus.
(3)
Across all phenological stages, the models effectively captured the dynamic changes in FVC, with estimated values being consistent with ground truth measurements. The predicted growth rates were highly consistent with actual measurements, indicating the reliability of models in dynamically monitoring FVC changes.
These findings provide strong technical support for long-term, continuous FVC monitoring using UAV remote sensing data. Additionally, the results confirm the strong feasibility of using UAVs to dynamically detect FVC in creeping plants. However, this study was limited to a single site and one growth cycle, which may not fully capture FVC variations under different climatic conditions. Future research will expand data collection across multiple regions and growth cycles. Future studies should integrate multi-temporal and spatial observation data to explore the influence of climatic factors on FVC dynamics.

Supplementary Materials

The following supporting information can be downloaded at: https://www.mdpi.com/article/10.3390/agriculture15050502/s1, Table S1: Ablation study results of Random Forest (RF) model in different phenological stages; Table S2: Ablation study results of Support Vector Regression (SVR) model in different phenological stages; Table S3: Ablation study results of Artificial Neural Network (ANN) model in different phenological stages.

Author Contributions

Conceptualization, W.R.; Data curation, H.Z.; Formal analysis, H.Z. and W.M.; Funding acquisition, W.R.; Methodology, H.Z. and W.R.; Supervision, W.R.; Visualization, K.C., Y.C., F.Y. and Y.L.; Writing—original draft, H.Z.; Writing—review & editing, H.Z., W.M., K.C. and W.R. All authors have read and agreed to the published version of the manuscript.

Funding

This research was funded by the Major Special Foundation of the Science and Technology Plan of Inner Mongolia, grant number 2023JBGS0008, 2023-JBGS-S-1; STI 2023-Major Projects, grant number 2022ZD04017; and the Project for Young Talent Scientists of Inner Mongolia, grant number NMGIRT2316.

Institutional Review Board Statement

Not applicable.

Data Availability Statement

The data presented in this study are available on request from the corresponding author.

Conflicts of Interest

The authors declare no conflicts of interest.

References

  1. Gitelson, A.; Kaufman, Y.J.; Stark, R.; Rundquist, D. Novel algorithms for remote estimation of vegetation fraction. Remote Sens. Environ. 2002, 80, 76–87. [Google Scholar] [CrossRef]
  2. Kooch, Y.; Kartalaei, Z.M.; Amiri, M.; Zarafshar, M.; Shabani, S.; Mohammady, M. Soil health reduction following the conversion of primary vegetation covers in a semi-arid environment. Sci. Total Environ. 2024, 921, 171113. [Google Scholar] [CrossRef] [PubMed]
  3. Kaufmann, R.K.; Zhou, L.; Myneni, R.B.; Tucker, C.J.; Slayback, D.; Shabanov, N.V.; Pinzon, J. The effect of vegetation on surface temperature: A statistical analysis of NDVI and climate data. Geophys. Res. Lett. 2003, 30, 1234–1237. [Google Scholar] [CrossRef]
  4. Cao, W.; Xu, H.; Zhang, Z. Vegetation growth dynamic and sensitivity to changing climate in a watershed in northern China. Remote Sens. 2022, 14, 4198. [Google Scholar] [CrossRef]
  5. Marsett, R.C.; Qi, J.; Heilman, P.; Biedenbender, S.H.; Watson, M.C.; Amer, S.; Weltz, M.; Goodrich, D.; Marsett, R. Remote sensing for grassland management in the arid southwest. Rangel. Ecol. Manag. 2006, 59, 530–540. [Google Scholar] [CrossRef]
  6. Zhao, X.; Zhou, D.; Fang, J. Satellite-based studies on large-scale vegetation changes in China. J. Integr. Plant Biol. 2012, 54, 713–728. [Google Scholar] [CrossRef]
  7. Wang, Z.; Ma, Y.; Zhang, Y.; Shang, J. Review of remote sensing applications in grassland monitoring. Remote Sens. 2022, 14, 2903. [Google Scholar] [CrossRef]
  8. Robinson, J.M.; Harrison, P.A.; Mavoa, S.; Breed, M.F. Existing and emerging uses of drones in restoration ecology. Methods Ecol. Evol. 2022, 13, 1899–1911. [Google Scholar] [CrossRef]
  9. Rahman, D.A.; Sitorus, A.B.Y.; Condro, A.A. From coastal to montane forest ecosystems, using drones for multi-species research in the tropics. Drones 2022, 6, 6. [Google Scholar] [CrossRef]
  10. Tait, L.W.; Orchard, S.; Schiel, D.R. Missing the forest and the trees: Utility, limits and caveats for drone imaging of coastal marine ecosystems. Remote Sens. 2021, 13, 3136. [Google Scholar] [CrossRef]
  11. Chen, R.; Han, L.; Zhao, Y.; Zhao, Z.; Liu, Z.; Li, R.; Xia, L.; Zhai, Y. Extraction and monitoring of vegetation coverage based on uncrewed aerial vehicle visible image in a post gold mining area. Front. Ecol. Evol. 2023, 11, 1171358. [Google Scholar] [CrossRef]
  12. Zhai, L.; Yang, W.; Li, C.; Ma, C.; Wu, X.; Zhang, R. Extraction of maize canopy temperature and variation factor analysis based on multi-source unmanned aerial vehicle remote sensing data. Earth Sci. Inform. 2024, 17, 5079–5094. [Google Scholar] [CrossRef]
  13. Sato, Y.; Tsuji, T.; Matsuoka, M. Estimation of rice plant coverage using Sentinel-2 based on UAV-observed data. Remote Sens. 2024, 16, 1628. [Google Scholar] [CrossRef]
  14. Yang, S.; Li, S.; Zhang, B.; Yu, R.; Li, C.; Hu, J.; Liu, S.; Cheng, E.; Lou, Z.; Peng, D. Accurate estimation of fractional vegetation cover for winter wheat by integrated unmanned aerial systems and satellite images. Front. Plant Sci. 2023, 14, 1220137. [Google Scholar] [CrossRef] [PubMed]
  15. Weigel, M.M.; Andert, S.; Gerowitt, B. Monitoring patch expansion amends to evaluate the effects of non-chemical control on the creeping perennial Cirsium arvense (L.) Scop. in a spring wheat crop. Agronomy 2023, 13, 1474. [Google Scholar] [CrossRef]
  16. Editorial Committee of the Flora of China, Chinese Academy of Sciences. Flora of China; Science Press: Beijing, China, 1977; pp. 258–259. [Google Scholar]
  17. Talovskaya, E.B.; Cheryomushkina, V.; Astashenkov, A.; Gordeeva, N.I. State of coenopopulations of Thymus mongolicus (Lamiaceae) depending on environmental conditions. Bot. Zhurnal 2023, 108, 3–12. [Google Scholar] [CrossRef]
  18. Liu, M.; Luo, F.; Qing, Z.; Yang, H.; Liu, X.; Yang, Z.; Zeng, J. Chemical composition and bioactivity of essential oil of ten labiatae species. Molecules 2020, 25, 4862. [Google Scholar] [CrossRef]
  19. Li, X.; He, T.; Wang, X.; Shen, M.; Yan, X.; Fan, S.; Wang, L.; Wang, X.; Xu, X.; Sui, H.; et al. Traditional uses, chemical constituents and biological activities of plants from the genus Thymus. Chem. Biodivers. 2019, 16, e1900254. [Google Scholar] [CrossRef] [PubMed]
  20. Yang, M. Research advances on Thymus mongolicus. Hortic. Seed. 2018, 11, 68–70. [Google Scholar]
  21. Jiapaer, G.; Chen, X.; Bao, A. A comparison of methods for estimating fractional vegetation cover in arid regions. Agric. For. Meteorol. 2011, 151, 1698–1710. [Google Scholar] [CrossRef]
  22. Yue, J.; Guo, W.; Yang, G.; Zhou, C.; Feng, H.; Qiao, H. Method for accurate multi-growth-stage estimation of fractional vegetation cover using unmanned aerial vehicle remote sensing. Plant Methods 2021, 17, 51. [Google Scholar] [CrossRef] [PubMed]
  23. Li, X.; Liu, Y.; Wang, L. Change in Fractional Vegetation Cover and Its Prediction during the Growing Season Based on Machine Learning in Southwest China. Remote Sens. 2024, 16, 3623. [Google Scholar] [CrossRef]
  24. Yang, L.; Jia, K.; Liang, S.; Wei, X.; Yao, Y.; Zhang, X. A Robust Algorithm for Estimating Surface Fractional Vegetation Cover from Landsat Data. Remote Sens. 2017, 9, 857. [Google Scholar] [CrossRef]
  25. Saini, R. Integrating vegetation indices and spectral features for vegetation mapping from multispectral satellite imagery using AdaBoost and random forest machine learning classifiers. Geomat. Environ. Eng. 2022, 17, 57–74. [Google Scholar] [CrossRef]
  26. Ma, X.; Ding, J.; Wang, T.; Lu, L.; Sun, H.; Zhang, F. A pixel dichotomy coupled linear Kernel-Driven model for estimating fractional vegetation cover in arid areas from high-spatial-resolution images. IEEE Trans. Geosci. Remote Sens. 2023, 61, 1–15. [Google Scholar] [CrossRef]
  27. Andini, S.W.; Prasetyo, Y.; Sukmono, A. Analysis of vegetation distribution using sentinel satellite imagery with NDVI and segmentation methods. J. Geod. Undip 2017, 7, 14–24. [Google Scholar]
  28. Zhao, J.; Li, J.; Liu, Q.; Zhang, Z.; Dong, Y. Comparative study of fractional vegetation cover estimation methods based on fine spatial resolution images for three vegetation types. IEEE Geosci. Remote Sens. Lett. 2022, 19, 1–5. [Google Scholar] [CrossRef]
  29. Fern, R.R.; Foxley, E.A.; Bruno, A.; Morrison, M.L. Suitability of NDVI and OSAVI as estimators of green biomass and coverage in a semi-arid rangeland. Ecol. Indic. 2018, 94, 16–21. [Google Scholar] [CrossRef]
  30. Rondeaux, G.; Steven, M.; Baret, F. Optimization of soil-adjusted vegetation indices. Remote Sens. Environ. 1996, 55, 95–107. [Google Scholar] [CrossRef]
  31. Nguyen, H.H. Comparison of various spectral indices for estimating mangrove covers using PlanetScope data: A case study in Xuan Thuy National Park, Nam Dinh Province. J. For. Sci. Technol. 2017, 5, 74–83. [Google Scholar]
  32. Yin, L.; Zhou, Z.; Li, S.; Huang, D. Research on vegetation extraction and fractional vegetation cover of Karst area based on visible light image of UAV. Acta Agrestia Sin. 2020, 28, 1664–1672. [Google Scholar]
  33. Li, B.; Liu, R.; Liu, S.; Liu, Q. Monitoring vegetation coverage variation of winter wheat by low-altitude UAV remote sensing system. Trans. Chin. Soc. Agric. Eng. 2012, 28, 160–165. [Google Scholar]
  34. Liu, J.; Pattey, E. Retrieval of leaf area index from top-of-canopy digital photography over agricultural crops. Agric. For. Meteorol. 2010, 150, 1485–1490. [Google Scholar] [CrossRef]
  35. Rouse, J.; Haas, R.H.; Schell, J.A.; Deering, D. Monitoring vegetation systems in the great plains with ERTS. In Third ERTS Symposium; NASA Scientific and Technical Information: Washington, DC, USA, 1974; pp. 309–317. [Google Scholar]
  36. Daughtry, C.S.T.; Gallo, K.P.; Goward, S.N.; Prince, S.D.; Kustas, W.P. Spectral estimates of absorbed radiation and phytomass production in corn and soybean canopies. Remote Sens. Environ. 1992, 39, 141–152. [Google Scholar] [CrossRef]
  37. Pearson, R.; Miller, L.D. Remote mapping of standing crop biomass for estimation of the productivity of the short-grass prairie. Remote Sens. Environ. 1972, 2, 1357–1381. [Google Scholar]
  38. Tucker, C.J. Red and photographic infrared linear combinations for monitoring vegetation. Remote Sens. Environ. 1979, 8, 127–150. [Google Scholar] [CrossRef]
  39. Tanphiphat, K.; Appleby, A.P. Growth and development of Bulbous oatgrass (Arrhenatherum elatius var. bulbosum). Weed Technol. 1990, 4, 843–848. [Google Scholar] [CrossRef]
  40. Maurice, I.; Gastal, F.; Durand, J.-L. Generation of form and associated mass deposition during leaf development in grasses: A kinematic approach for non-steady growth. Ann. Bot. 1997, 80, 673–683. [Google Scholar] [CrossRef]
  41. Kawagishi, Y.; Miura, Y. Growth characteristics and effect of nitrogen and potassium topdressing on thickening growth of bulbs in spring-planted edible lily (Lilium leichtlinii var. maximowiczii Baker). Jpn. J. Crop Sci. 1996, 65, 51–57. [Google Scholar] [CrossRef]
  42. Pitelka, L.F. Energy allocations in annual and perennial lupines (Lupinus: Leguminosae). Ecology 1977, 58, 1055–1065. [Google Scholar] [CrossRef]
  43. Zohner, C.M.; Renner, S.S.; Sebald, V.; Crowther, T.W. How changes in spring and autumn phenology translate into growth-experimental evidence of asymmetric effects. J. Ecol. 2021, 109, 2717–2728. [Google Scholar] [CrossRef]
  44. Curran, P.J. The Estimation of the Surface Moisture of a Vegetated Soil Using Aerial Infrared Photography. Remote Sens. 1981, 2, 369–378. [Google Scholar] [CrossRef]
  45. Fernandes, A.M.; Fortini, E.A.; Müller, L.A.d.C.; Batista, D.S.; Vieira, L.M.; Silva, P.O.; Amaral, C.H.d.; Poethig, R.S.; Otoni, W.C. Leaf Development Stages and Ontogenetic Changes in Passionfruit (Passiflora edulis Sims.) are Detected by Narrowband Spectral Signal. J. Photochem. Photobiol. B Biol. 2020, 209, 111931. [Google Scholar] [CrossRef]
  46. Sims, D.A.; Gamon, J.A. Relationships between leaf pigment content and spectral reflectance across a wide range of species, leaf structures and developmental stages. Remote Sens. Environ. 2002, 81, 337–354. [Google Scholar] [CrossRef]
  47. Si, W.; Amari, S.I. Conformal Transformation of Kernel Functions: A Data-Dependent Way to Improve Support Vector Machine Classifiers. Neural Process. Lett. 2002, 15, 59–67. [Google Scholar]
  48. Zhou, S. Sparse SVM for Sufficient Data Reduction. IEEE Trans. Pattern Anal. Mach. Intell. 2022, 44, 5560–5571. [Google Scholar] [CrossRef]
  49. Xie, Q.; Dash, J.; Huang, W.; Peng, D.; Qin, Q.; Mortimer, H. Vegetation indices combining the red and red-edge spectral information for leaf area index retrieval. IEEE J. Sel. Top. Appl. Earth Obs. Remote Sens. 2018, 11, 1482–1493. [Google Scholar] [CrossRef]
  50. Zhang, Y.; Zheng, L.; Li, M.; Deng, X.; Ji, R. Predicting apple sugar content based on spectral characteristics of apple tree leaf in different phenological phases. Comput. Electron. Agric. 2015, 112, 20–27. [Google Scholar] [CrossRef]
  51. Gardner, M.; Dorling, S. Artificial neural networks (the multilayer perceptron)—A review of applications in the atmospheric sciences. Atmos. Environ. 1998, 32, 2627–2636. [Google Scholar] [CrossRef]
  52. Sheehy, J.E. Microclimate, canopy structure, and photosynthesis in canopies of three contrasting temperate forage grasses: III. canopy photosynthesis, individual leaf photosynthesis and the distribution of current assimilate. Ann. Bot. 1977, 41, 593–604. [Google Scholar] [CrossRef]
  53. Gao, L.; Wang, X.; Johnson, B.A.; Tian, Q.; Wang, Y.; Verrelst, J.; Mu, X.; Gu, X. Remote sensing algorithms for estimation of fractional vegetation cover using pure vegetation index values: A review. ISPRS J. Photogramm. Remote Sens. 2020, 159, 364–377. [Google Scholar] [CrossRef]
  54. Gu, Y.; Wylie, B.K.; Howard, D.M.; Phuyal, K.P.; Ji, L. NDVI saturation adjustment: A new approach for improving cropland performance estimates in the Greater Platte River Basin, USA. Ecol. Indic. 2013, 30, 1–6. [Google Scholar] [CrossRef]
  55. Yuan, H.; Yang, G.; Li, C.; Wang, Y.; Liu, J.; Yu, H.; Feng, H.; Xu, B.; Zhao, X.; Yang, X. Retrieving soybean leaf area index from unmanned aerial vehicle hyperspectral remote sensing: Analysis of RF, ANN, and SVM regression models. Remote Sens. 2017, 9, 309. [Google Scholar] [CrossRef]
  56. de Souza, A.V.; Bonini Neto, A.; Cabrera Piazentin, J.; Dainese Junior, B.J.; Perin Gomes, E.; dos Santos Batista Bonini, C.; Ferrari Putti, F. Artificial neural network modelling in the prediction of bananas’ harvest. Sci. Hortic. 2019, 257, 108724. [Google Scholar] [CrossRef]
  57. Ramezan, C.A.; Warner, T.A.; Maxwell, A.E.; Price, B.S. Effects of training set size on supervised machine-learning land-cover classification of large-area high-resolution remotely sensed data. Remote Sens. 2021, 13, 368. [Google Scholar] [CrossRef]
  58. Cao, J.; Zhang, Z.; Tao, F.; Zhang, L.; Luo, Y.; Han, J.; Li, Z. Identifying the contributions of multi-source data for winter wheat yield prediction in China. Remote Sens. 2020, 12, 750. [Google Scholar] [CrossRef]
  59. Kamir, E.; Waldner, F.; Hochman, Z. Estimating wheat yields in Australia using climate records, satellite image time series and machine learning methods. ISPRS J. Photogramm. Remote Sens. 2020, 160, 124–135. [Google Scholar] [CrossRef]
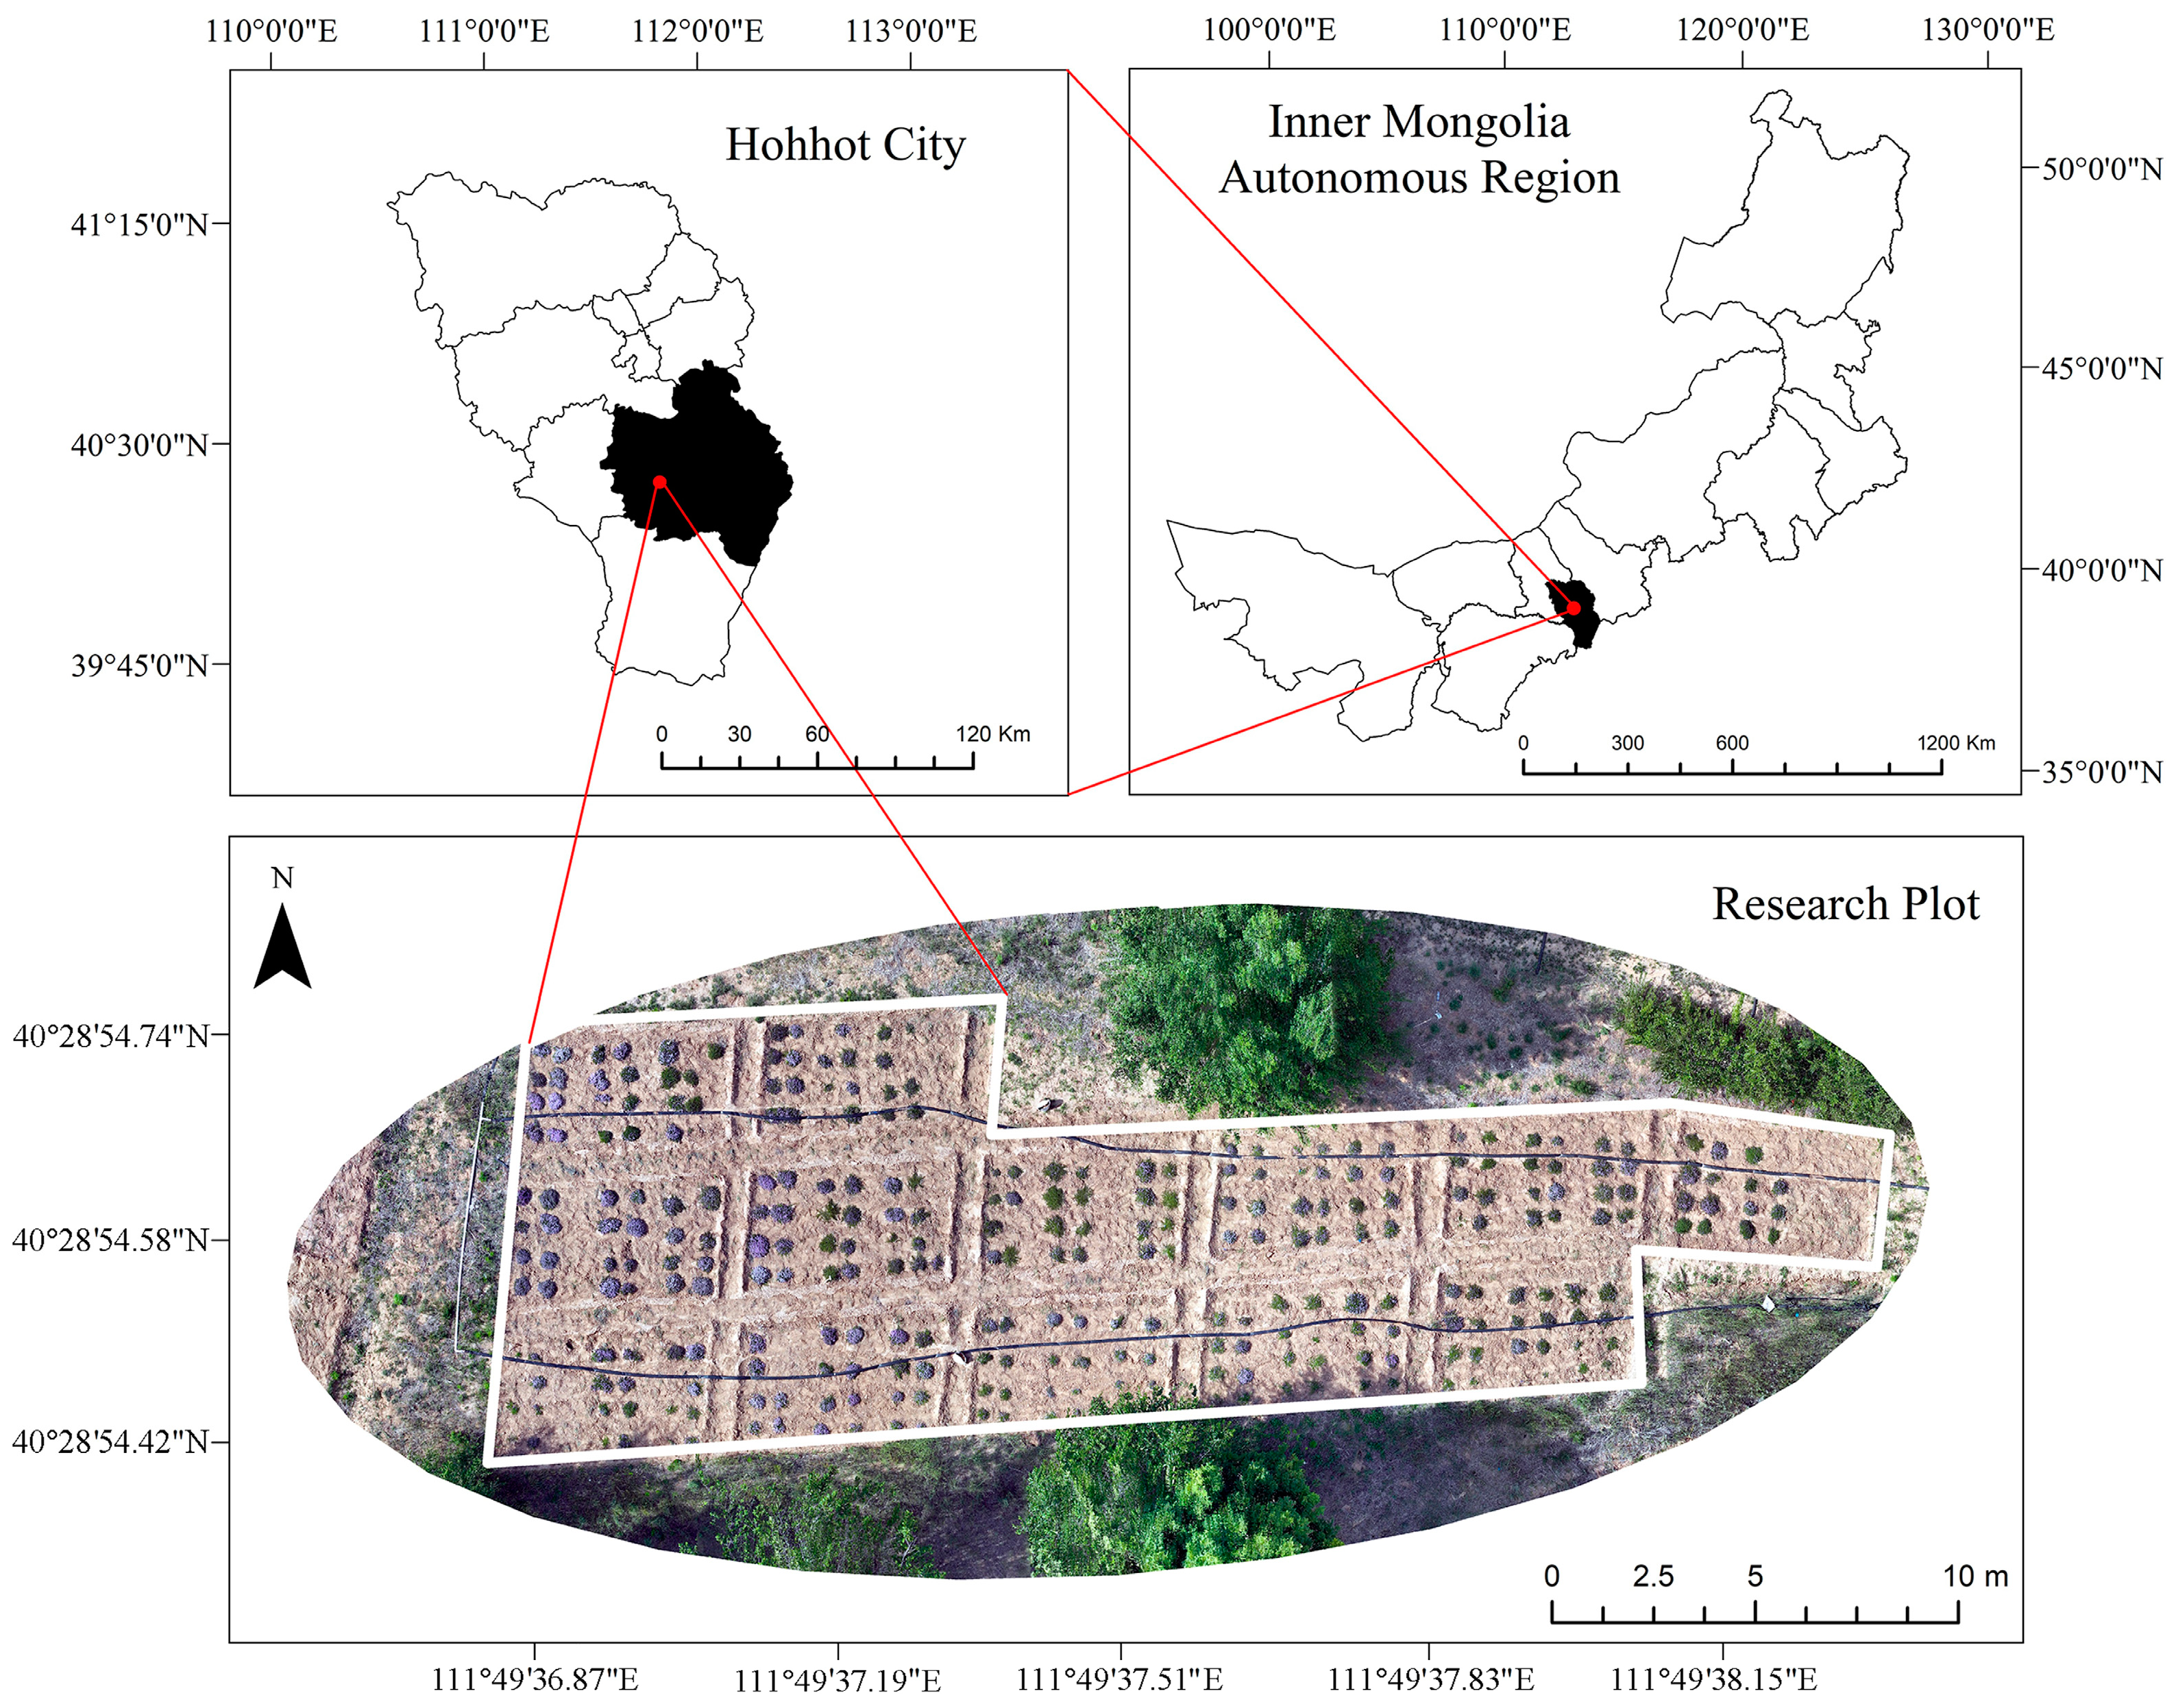
Figure 1. Location of the research plot (Hohhot City and Helinger County, Inner Mongolia Autonomous Region, China).
Agriculture 15 00502 g001
Figure 2. Optimized soil-adjusted vegetation index (OSAVI) time series graph for different phenological stages.
Agriculture 15 00502 g002
Figure 3. Trend analysis of model performance metrics (R2, RMSE, and NRMSE) across phenological stages. (a) R2 values illustrate the accuracy trends for MLR, RF, SVR, and ANN models. (b) Visualization of RMSE and NRMSE values to display error metrics for each model across different phenological stages.
Agriculture 15 00502 g003
Figure 4. Regression analysis results for different model validation sets during the green-up stage.
Agriculture 15 00502 g004
Figure 5. Regression analysis results for different model validation sets during the budding stage.
Agriculture 15 00502 g005
Figure 6. Regression analysis results for different model validation sets during the early flowering stage.
Agriculture 15 00502 g006
Figure 7. Regression analysis results for different model validation sets during the peak flowering stage.
Agriculture 15 00502 g007
Figure 8. Regression analysis results for different model validation sets during the fruiting stage.
Agriculture 15 00502 g008
Figure 9. Dynamics of fraction vegetation cover (FVC) for different phenological stages of T. mongolicus: actual and estimated values (green-up—SVR, budding—ANN, early flowering—SVR, peak flowering—ANN, fruiting—ANN).
Agriculture 15 00502 g009
Figure 10. Variation in the rate of fraction vegetation cover (FVC) growth of T. mongolicus across different phenological stages and a comparison of actual and estimated values (G-B: green-up to budding; B-E: budding to early flowering; E-P: early flowering to peak flowering; P-F: peak flowering to fruiting).
Agriculture 15 00502 g010
Table 1. Partial specifications of the DJ MAVIC 3M.
ParameterDescriptionSpecifications
UAVTakeoff weight1050 g
Flight speed1 m/s
RTK positioning accuracyHorizontal: 1 cm + 1 ppm
Vertical: 1.5 cm + 1 ppm
Lens.Visible light imagingRGB composite
Multispectral imagingGreen (G): 560 nm ± 16 nm
Red (R): 650 nm ± 16 nm
Red edge (RE): 730 nm ± 16 nm
Near infrared (NIR): 860 nm ± 26 nm
Maximum resolution20 Megapixels
Photo formatJPEG; TIFF
Table 2. Vegetation index equations.
VIsVegetation IndexEquationReference
NDVINormalized difference vegetation index NDVI = N I R R E D N I R + R E D [35]
GNDVIGreen normalized difference vegetation index GNDVI = N I R G R E E N N I R + G R E E N [36]
RVIRatio vegetation index RVI = N I R R [37]
DVIDifference vegetation index DVI = N I R R [38]
Note: N I R represents the reflectance in the near-infrared band, R denotes the reflectance in the red-light band, and G R E E N indicates the reflectance in the green-light band.
Table 3. Statistical analysis of fraction vegetation cover (FVC) at different phenological stages.
ParametersMetricsGreen-UpBuddingEarly
Flowering
Peak
Flowering
Fruiting
Ground truth valuesMean9.21%24.69%35.37%50.80%64.63%
Min0.45%4.91%7.08%13.82%19.43%
Max30.88%58.19%68.55%95.24%97.31%
SD0.050.090.110.150.17
Estimated
values
Mean9.11%24.66%34.80%50.71%65.22%
Min1.46%5.70%8.23%17.79%28.60%
Max21.97%55.54%67.40%97.96%99.95%
SD0.040.09 0.110.140.15
Note: “Mean” represents the average vegetation cover; “Min” and “Max” denote the minimum and maximum vegetation cover, respectively; “SD” indicates the standard deviation of the data. Estimated values are derived from the optimal models: SVR for the green-up and early flowering stages and ANN for the budding, peak flowering, and fruiting stages.
Disclaimer/Publisher’s Note: The statements, opinions and data contained in all publications are solely those of the individual author(s) and contributor(s) and not of MDPI and/or the editor(s). MDPI and/or the editor(s) disclaim responsibility for any injury to people or property resulting from any ideas, methods, instructions or products referred to in the content.