Article

Continuous and Intermittent Drying of Osmotically Pretreated Melon Pieces: Analysis of Energy Savings and Preservation of Bioactive Compounds

by
Joan Carlos Alves Pereira
1,
Wilton Pereira da Silva
1,*,
Josivanda Palmeira Gomes
1,
Alexandre José de Melo Queiroz
1,
Rossana Maria Feitosa de Figueirêdo
1,
Yaroslávia Ferreira Paiva
2,
Francislaine Suelia dos Santos
1,
Bruno Adelino de Melo
1,
Aluizio Freire da Silva Júnior
3,
Leidjane Matos de Souto
4,
Dyego da Costa Santos
5,
Juanne Queiroz Farias
1 and
Antonio Gilson Barbosa de Lima
6
1
Department of Agricultural Engineering, Federal University of Campina Grande, Campina Grande 58429-900, Brazil
2
Unit of Food Technology Academic, Federal University of Campina Grande, Pombal 58840-000, Brazil
3
Academic Unit of Physics and Mathematics, Federal University of Campina Grande, Campina Grande 58429-900, Brazil
4
Center for Education and Health (CES), Federal University of Campina Grande, Campina Grande 58429-900, Brazil
5
Federal Institute of Rio Grande do Norte, Pau dos Ferros Campus, Pau dos Ferros 59900-000, Brazil
6
Department of Mechanical Engineering, Federal University of Campina Grande, Campina Grande 58429-900, Brazil
*
Author to whom correspondence should be addressed.
Agriculture 2025, 15(5), 480; https://doi.org/10.3390/agriculture15050480
Submission received: 17 January 2025 / Revised: 13 February 2025 / Accepted: 22 February 2025 / Published: 23 February 2025

Abstract

:
The objective of this study was to carry out a study on continuous and intermittent drying (intermittency ratio α = 2/3) of osmotically pretreated melon pieces, cut in the form of a parallelepiped. An osmotic dehydration pretreatment was performed using an incubator with mechanical shaking. Drying processes were carried out using an oven with forced air circulation at temperatures of 50 and 70 °C. The data were modeled by means of empirical equations, in order to compare the drying kinetics and analyze the impact of the intermittent process on energy savings and preservation of bioactive compounds in the final product. The experiments were also described using a diffusion model in Cartesian coordinates, with a third-kind boundary condition, in order to analyze the moisture distribution inside each piece of fruit over time. Among the empirical equations analyzed, Page’s was the one that best described the continuous and intermittent drying of osmotically pretreated melon pieces. In order to obtain dried melon, intermittent drying significantly reduced the effective processing time and, consequently, energy consumption, preserving the bioactive compounds more intensely (particularly at a temperature of 50 °C), compared to continuous drying. The diffusion model adequately described all the drying experiments, and it was found that the effective mass diffusivity increased significantly with the application of intermittency.

1. Introduction

In the current context, the production of fruits has been increasing, as well as the population’s demand to consume them. Fruit growing is one of the sectors that stand out the most in Brazilian agribusiness, driven by a wide variety of crops produced in all regions of the country and in different climates. Among the numerous varieties of fruits produced in Brazil, melon is one of the most economically important crops, with a production of 613.9 thousand tons and exports of 236.2 thousand tons in 2020, which corresponds to an export volume of about 38.5% of production [1].
Loss of agricultural products after harvest is a problem of great importance in efforts to fight hunger, increase producers’ incomes, and improve food security not only in Brazil, but also around the world. In general terms, fruit waste can occur at all stages of the production chain, mainly during the harvest, post-harvest, and transportation stages. According to the Food and Agriculture Organization of the United Nations [2], about 30% of the food produced in the world is lost or wasted every year, which is equivalent to approximately 1.3 billion tons. In this context, technological development in the post-harvest stage plays a fundamental role in the rational use of food, making it possible to preserve it for long periods of time, thus minimizing waste.
Many techniques are used to reduce losses and extend the shelf life of food. Among these techniques, drying is the most common and widely used method in the preservation of agricultural products. This type of processing aims to reduce the moisture content of the product and, consequently, its water activity, avoiding the development of microorganisms and undesirable chemical reactions that can cause deterioration of the product. This enables storage for longer periods [3]. Another alternative widely used in the commercial processing of agricultural products, which makes it possible to obtain lightly processed products, is the osmotic dehydration technique [4,5]. This technique can be used, in some cases, as a pretreatment step, in which the product is subjected to subsequent complementary processes, such as drying or freezing. In view of this, osmotic treatment followed by convective drying results in products with better sensory (color, texture, flavor, and odor) and physical qualities than those obtained through simpler treatments, preserving the nutritional components as much as possible [6].
Intermittent drying has been considered by many authors as a more efficient drying method in terms of energy consumption and nutritional quality of the dried product, compared to continuous drying. The essence of this method is to alternate periods of continuous drying with periods of rest, allowing the diffusion of moisture from the center to the surface of the material and the evaporation of surface moisture to occur in a more balanced way [7,8,9]. Therefore, the main reason for the use of intermittent drying is precisely to minimize thermal and water gradients and, consequently, reduce processing time, reducing production costs (energy) and possible structural damage, thus improving the final quality of the product [10].
Continuous drying of agricultural products, using hot air, is an expensive process and reduces the nutritional quality of these products. For this reason, it is important to adopt technologies to increase energy efficiency and enable the quality and value of the final product. Excessive drying implies a waste of energy and can lead to degradation of the product in terms of nutrients [3]. In this context, many studies on various methods of fruit drying can be found in the literature. However, there are few studies in Brazil and in the world evaluating the continuous and especially the intermittent drying of melon cut into pieces in the form of parallelepipeds, osmotically pretreated. A study of this type should use mathematical models that enable the implementation of economic drying strategies, with a reduction in the time of exposure of the product to the heat source, and that predict a more homogeneous moisture distribution over time, contributing to the nutritional quality of the final product, with the corresponding addition of value to this product. In this context, the objectives of this article were defined as follows.
The objective of this study was to compare the continuous and intermittent drying of melon pieces cut in the form of parallelepipeds, osmotically pretreated by immersion in water and sucrose solutions. In both cases, the kinetics of continuous and intermittent drying were described by means of empirical and diffusive models, aiming to determine energy savings, with reduction of water gradients. Such descriptions make it possible to evaluate not only the energy savings of intermittent drying as compared to continuous drying but also the nutritional quality of the final product, in terms of bioactive compounds.

2. Materials and Methods

2.1. Experimental Materials and Procedures

2.1.1. Materials Preparation

The experiments were conducted from March to November 2024 at the Laboratory of Storage and Processing of Agricultural Products (LAPPA) of the Academic Unit of Agricultural Engineering (UAEA) and at the Laboratory of Heat and Mass Transfer (LTCM) of the Academic Unit of Physics (UAF), both of the Federal University of Campina Grande (UFCG), in the city of Campina Grande, Paraíba state, Brazil.
The raw material used was melon (Cucumis melo L.), cultivar Cantaloupe, acquired at the local market in the city of Campina Grande, PB. Ripe fruits, in good physical conditions and with a similar degree of maturation, were selected. The melons were properly sanitized, peeled and cut into a parallelepiped shape with edges measuring, on average (for all experiments), 1.05, 1.10, and 2.10 cm (thickness, height, and length, respectively).

2.1.2. Pre-Treatment

In order to improve the sensory properties and prepare the samples for subsequent drying, the melon pieces were subjected to osmotic dehydration, performed by immersing fruit pieces in a solution composed of water and sucrose, with a concentration of 60 °Brix, measured with a refractometer. The samples were placed in Erlenmeyer® flasks with a capacity of 500 mL, and the amount of solution was stipulated to maintain the initial fruit/solution ratio of 1:4 (mass ratio). Based on the literature for similar products and also on preliminary tests, the duration of the osmotic process was stipulated at 90 min, and the samples were kept at a temperature of 30 °C, with constant shaking of 120 RPM, using a refrigerated incubator with shaking (TECNAL, TE-421, Brazil). After the osmotic dehydration, the product was rinsed with water to remove the osmotic solution adhered to the samples’ surface. Then, the edges of the melon pieces were measured again for all experiments, and the values obtained were, on average, 0.84, 0.86, and 1.68 cm (thickness, height, and length, respectively).

2.1.3. Drying

After osmotic dehydration, continuous and intermittent drying of the previously dehydrated melon pieces were carried out, in triplicate, using two different temperatures (50 and 70 °C). Samples of dehydrated melon with a mass of approximately 15 g were placed in thin aluminum mesh baskets so that air flowed easily between the pieces of the product. The baskets were identified (1, 2, and 3) and weighed, initially empty. Then, the set (melon + basket) was also weighed to measure the initial total mass. During each experiment, the moisture content was obtained over time by the gravimetric method using a digital scale with precision of 0.001 g. All drying experiments were carried out in an oven (Fanem, model 315 SE) with forced air circulation (speed of 1.0 m·s−1), with transverse direction of flow and removable trays.
In the intermittent drying process, each of the three baskets, after weighing, was sent to the oven alternately, following the stipulated intermittency time. That is, while sample number 1 dried in the oven, samples 2 and 3 remained at rest, in a desiccator containing blue silica gel at room temperature. Due to the desiccator with silica, it is expected to eliminate the possible effect of reabsorption of moisture by the product during the tempering period, over the cycles, which can be verified, or not, through the experiments. After 1/3 of the stipulated time for the cycle, sample number 2 was placed in the oven, at the same position and time that sample number 1 was removed, weighed and placed in the desiccator, for its tempering period. At the end of another 1/3 of the cycle time, sample number 3 was placed in the oven, simultaneously with the removal of sample number 2, which was weighed and then placed in the desiccator. At the end of the exposure time of sample number 3 to the heat source, completing the last 1/3 of the time of one cycle, this sample was removed from the oven and, after weighing, placed in the desiccator, while sample number 1 was placed back in the oven, starting a new cycle. Therefore, in the case of intermittent drying evaluated in this study, at each instant only one sample remained in the oven, at the established temperature, while the other two samples remained in the desiccator, at room temperature. The process was repeated, starting a new cycle, and so on, until the equilibrium was reached. These procedures were performed for the oven temperatures of both 50 °C and 70 °C. The time stipulated for each cycle is presented in Table 1. On the other hand, it should be noted that, for continuous drying, the three baskets containing the samples were simultaneously taken to the oven and, at pre-established instants of time, the samples were removed from the oven, weighed, and returned to the oven until there was no more mass variation. Once the equilibrium moisture content (characterized by constant mass) was reached, the samples were taken to an incubator at a temperature of 105 °C and left there for a period of 24 h to obtain the dry mass, md, of each sample.
For each stipulated time instant, the mass m of the wet sample was measured, and the average moisture content on a dry basis (d.b.), X ¯ , was determined by the expression:
X ¯ = m m d m d
Thus, the moisture ratio over time could be determined by the following expression:
X ¯ * = X ¯ X e q X i X e q
where
X ¯ * —Moisture ratio of the product, dimensionless;
X ¯ —Average moisture content of the product, on a dry basis;
Xeq—Equilibrium moisture content of the product, on a dry basis;
Xi—Initial moisture content of the product, on a dry basis.
Eight drying experiments (from E1 to E8) were carried out, six of which were intermittent drying with intermittency ratios α = 2⁄3 and two were continuous drying at temperatures of 50 and 70 °C. Based on the literature [7], the definition of intermittency ratio, α, was adopted as the ratio between the tempering period and the total time of one cycle. Thus, the expression considered is α = tout/(tin + tout), in which tin + tout corresponds to the total time of one cycle. In each cycle, the terms “tin” and “tout” represent the times of the samples in and out of the oven, respectively. Information about each experiment is presented in Table 1.
It is interesting to note that not only the intermittency ratio but also the duration of each drying period presented in Table 1 were chosen based on the literature for similar products.

2.2. Drying Described by Empirical Models: Energy Savings

Initially, six empirical equations were fitted to the experimental data obtained. These equations are frequently used to represent experimental data on the drying of agricultural products and are presented in Table 2. To describe the intermittent drying with these empirical models, the tempering periods were eliminated, analyzing only the period in which the samples actually remained inside the oven receiving heat (effective drying time).
The description of the drying kinetics by means of empirical models was carried out using the LAB Fit Curve Fitting Software, developed at the Federal University of Campina Grande, Paraíba, Brazil, by Silva and Silva (2009a) [15]. To evaluate the quality of the fits of the different mathematical models to the experimental data, the following statistical indicators were used: coefficient of determination (R2) and chi-squared (χ2).

2.3. Drying Described by a Diffusion Model: Moisture Distribution

The equation that describes the phenomenon of diffusion of a quantity described by a generic variable Φ, with the medium at rest, can be expressed as follows [16,17,18]:
( λ Φ ) t = . Γ Φ Φ + S
where Φ is the dependent variable of interest. This variable can mean both the moisture content during water migration in a porous medium and the temperature in a medium during heat migration. The parameters λ and ΓΦ are transport coefficients (mass or heat), t is the time, and S is the source term.
For the specific case of water diffusion in a porous medium, one should define λ = 1, S = 0, ΓΦ = D (effective mass diffusivity), and Φ = X (moisture content on a dry basis [18,19]) in Equation (9). Thus, Equation (9) can be rewritten as
X t = . D X
The melon pieces were cut into a parallelepiped shape with Lx, Ly, and Lz edges, as shown in Figure 1.
The diffusion equation applied to three-dimensional mass transport can be written, in Cartesian coordinates, from Equation (10), as follows
X t = x D X x + y D X y + z D X z ,
where x, y, and z define the system of coordinate axes originating in the center of the melon pieces cut in the shape of a parallelepiped, as shown in Figure 1.
The analytical solution to be presented for the three-dimensional diffusion equation for the geometry of a parallelepiped assumes the following hypotheses: (1) liquid diffusion is the only mechanism of water transport inside the solid; (2) moisture distribution at the beginning of the process is uniform; (3) the dimensions of the solid can be considered constant during the whole drying process; (4) for each drying temperature, the convective mass transfer coefficient, effective mass diffusivity, and equilibrium moisture content were considered to be constant throughout the process; and (5) melon pieces are considered homogeneous and isotropic.

2.4. Three-Dimensional Analytical Solution of the Diffusion Equation: Local Value and Mean Value

The third-kind boundary condition was used in the solution of Equation (11). This boundary condition is expressed by imposing equality between the internal (diffusive) flow at the boundary of the solid and the external (convective) flow in the vicinity of this boundary. For a parallelepiped, this imposition results in
D X x , y , z , t x x = ± L x / 2 = h X x , y , z , t x = ± L x / 2 X e q
D X x , y , z , t y y = ± L y / 2 = h X x , y , z , t y = ± L y / 2 X e q
D X x , y , z , t z z = ± L z / 2 = h X x , y , z , t z = ± L z / 2 X e q
In Equations (12)–(14), h is the convective mass transfer coefficient; X(x, y, z, t) represents the local value of moisture content at the position defined by the x, y, and z coordinates at the instant t; Xeq is the equilibrium moisture content (d.b.); and Lx, Ly, and Lz are the lengths of the edges of the parallelepiped along the x, y, and z axes, respectively. Thus, the analytic solution of Equation (11), considering the boundary condition defined by Equations (12)–(14), is obtained by separation of variables given, for example, in [20,21]:
X x , y , z , t = X e q X e q X i n = 1 m = 1 k = 1 A n A m A k cos µ n x L x / 2   × cos µ m y L y / 2 × cos µ k z L z / 2 e x p [ ( µ n 2 L x / 2 2 + µ m 2 L y / 2 2   + µ k 2 L z / 2 2 ) D t ]
where Xi is the initial moisture content and n, m, and k represent positive integers. The expressions for the coefficients An, Am, and Ak are
A j = 4 sen µ j 2 µ j + sen 2 µ j ,
where j represents the indices n, m, and k of Equation (15); μj are roots of the characteristic equation for the third-kind boundary condition, which can be obtained by the following transcendental equation:
cotg µ j = µ j B i ,
where Bi is the Biot number for mass transfer, defined as follows:
B i = h ( L / 2 ) D
where L represents the Lx, Ly, and Lz edges of the parallelepiped. For the physical situation analyzed (thin-layer drying), it is reasonable to assume the same value of h for all sides of the parallelepiped. Therefore, Equation (18), for the three dimensions of the parallelepiped, can be written as
B i x = h L x / 2 D ,
B i y = B i x L y L x ,
B i z = B i x L z L x
From Equation (15), it is possible to determine the value of the moisture content for any position (x, y, z) at any instant t, which makes it possible to know the profile of X(x, y, z, t) throughout the interior of the parallelepiped. On the other hand, the expression for the mean value of the moisture content of melon pieces at instant t can be written as
X ¯ t = 1 V X x , y , z , t d V
where V is the volume of the parallelepiped.
After substituting Equation (15) into Equation (22), the expression for the average moisture content at time t, X ¯ t , is given by
X ¯ t = X e q X e q X i × n = 1 m = 1 k = 1 B n B m B k exp µ n 2 L x / 2 2 + µ m 2 L y / 2 2 + µ k 2 L z / 2 2 D t
where the expressions for the coefficients Bn, Bm, and Bk are written as follows:
B j = 2 B i 2 µ j 2 B i 2 + B i + µ j 2
On the other hand, Equation (17) is a transcendental equation, which can be rewritten as follows:
µ j sen µ j B i cos µ j = 0
In Equation (25), the values of the roots µ j can be calculated for any Biot number specified. The bisection method was used to calculate the first 16 roots of this Equation (25), for each value to be specified for Bi. A total of 826 values were specified for the Biot number, ranging from 0, which corresponds to an infinite resistance to moisture flow at the surface, to 200, which in practice corresponds to the first-kind boundary condition.

2.5. Optimizer for Determining the Parameters of Equation (23)

The algorithm proposed by Silva et al. (2010) [22] makes it possible to determine the process parameters (h or Bi and D), from a set of experimental data, using the general principle of minimization of an objective function. In many studies, the objective function is defined by the chi-squared (χ2), obtained by fitting the analytical solution to the experimental points [22,23,24,25], as follows:
χ 2 = i = 1 N P X ¯ i e x p X ¯ i a n a ( D , B i ) 2 1 σ i 2
where X ¯ i e x p is the average experimental moisture content, referring to point i; X ¯ i a n a ( D , B i ) is the average moisture content corresponding to point i obtained from the analytical solution, Equation (23), using a sufficiently large number of terms of the infinite series so that truncation errors can be considered negligible; σ i is the standard deviation of the experimental moisture content; and Np is the number of experimental points. In general, in the absence of information, the statistical weights can all be considered equal to 1 (the same statistical weight for all experimental points), as was done in this article. For each of the 826 values of the Biot number (Bi) that were stipulated (between 0 and 200), an optimal value of the effective mass diffusivity D and the corresponding chi-squared were determined. These calculations made it possible to identify the smallest chi-squared among the 826 chi-squared values calculated, as well as the effective mass diffusivity and the Biot number corresponding to that minimum value. Details about the optimizer, which was developed by the second author of the present article for a product with cylindrical geometry, are available in Silva et al. (2010) [22]. In the present article, the optimizer presented in reference [22] was adapted to the geometry of a parallelepiped.

2.6. Characterization of Bioactive Compounds

Analyses of the bioactive compounds of the melon pieces were carried out in triplicate after osmotic dehydration followed by drying in an oven. For characterization, regardless of the treatment, the melon samples were dried as described in Section 2.1.3 until they reached an average moisture content of 0.18 (wet basis). The analyses were as follows: ascorbic acid content (mg/100 g), determined by titration with 2,6-dichlorophenolindophenol sodium salt (DCPIP), as described by AOAC (1997) [26], modified by Benassi and Antunes (1998) [27], using oxalic acid as an extractive solution; total carotenoids, determined following the methodology proposed by Lichtenthaler (1987) [28]; total flavonoids and anthocyanins, determined according to the methodology described by Francis (1982) [29].
The data obtained from the analyses of the bioactive compounds were statistically evaluated through a completely randomized design. Comparison between means was performed using Tukey test at 5% probability level, with the statistical program ASSISTAT version 7.7 beta [30].

3. Results

3.1. Experimental Results of Convective Drying

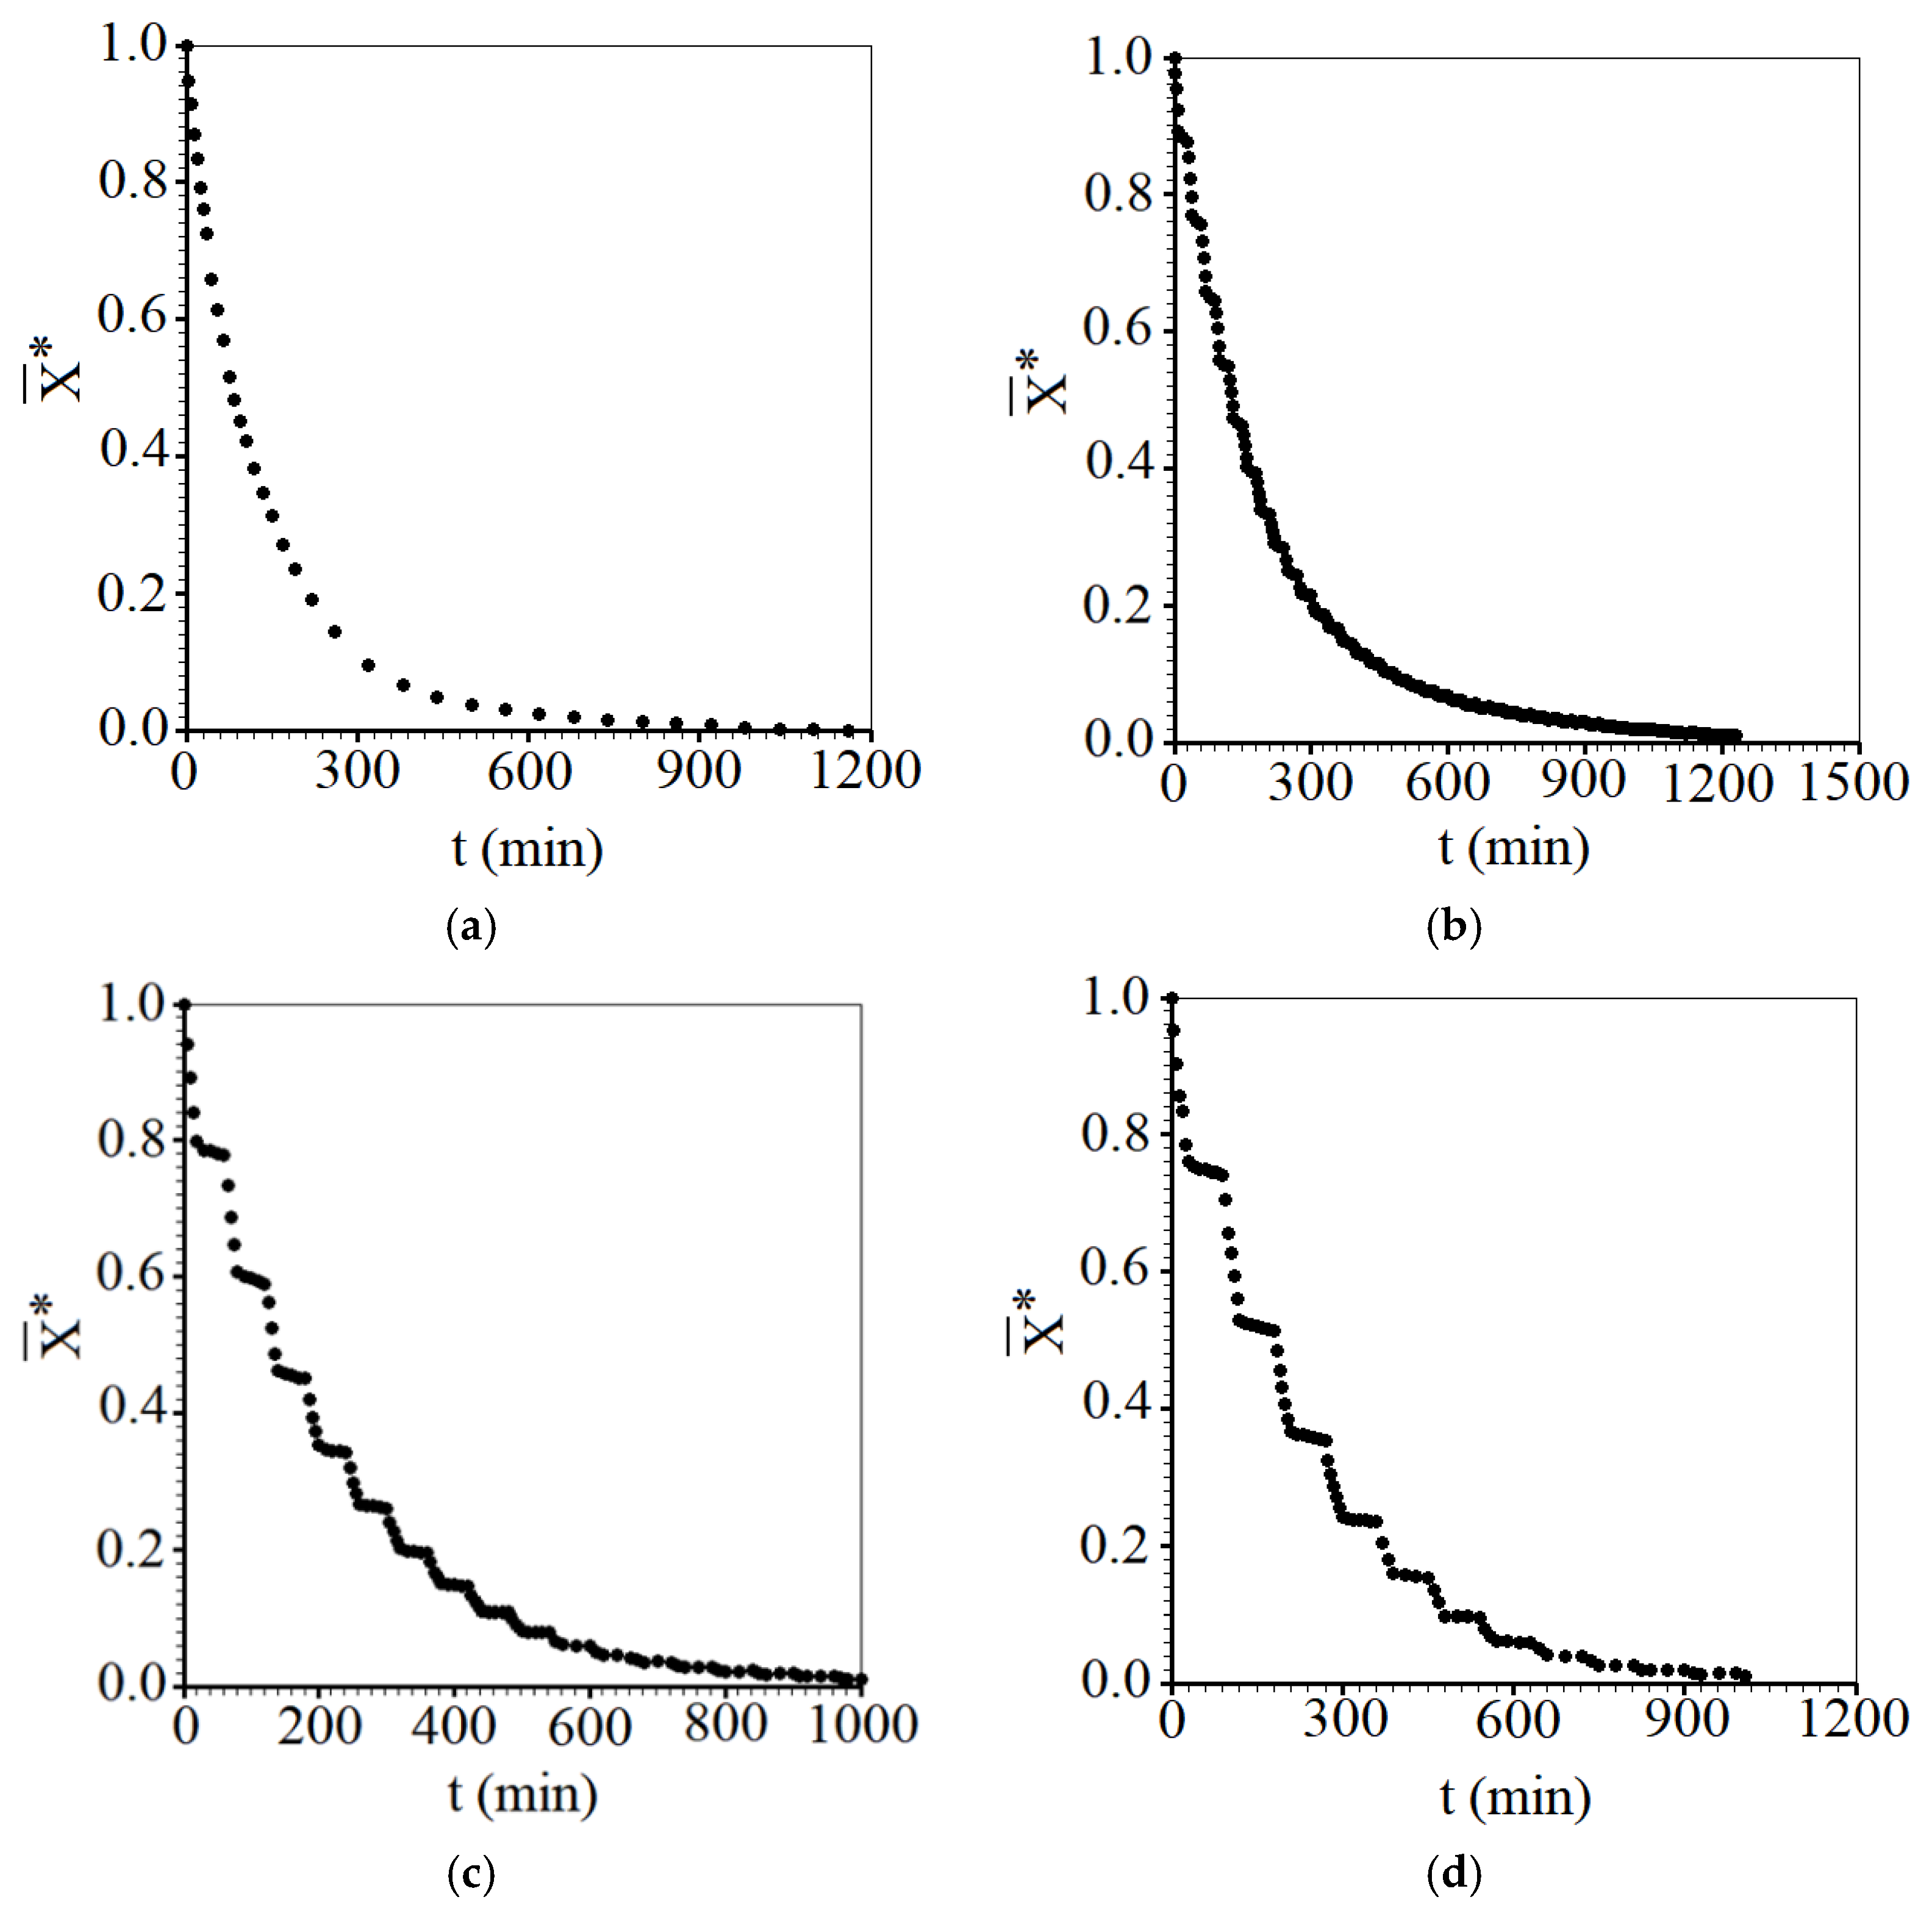
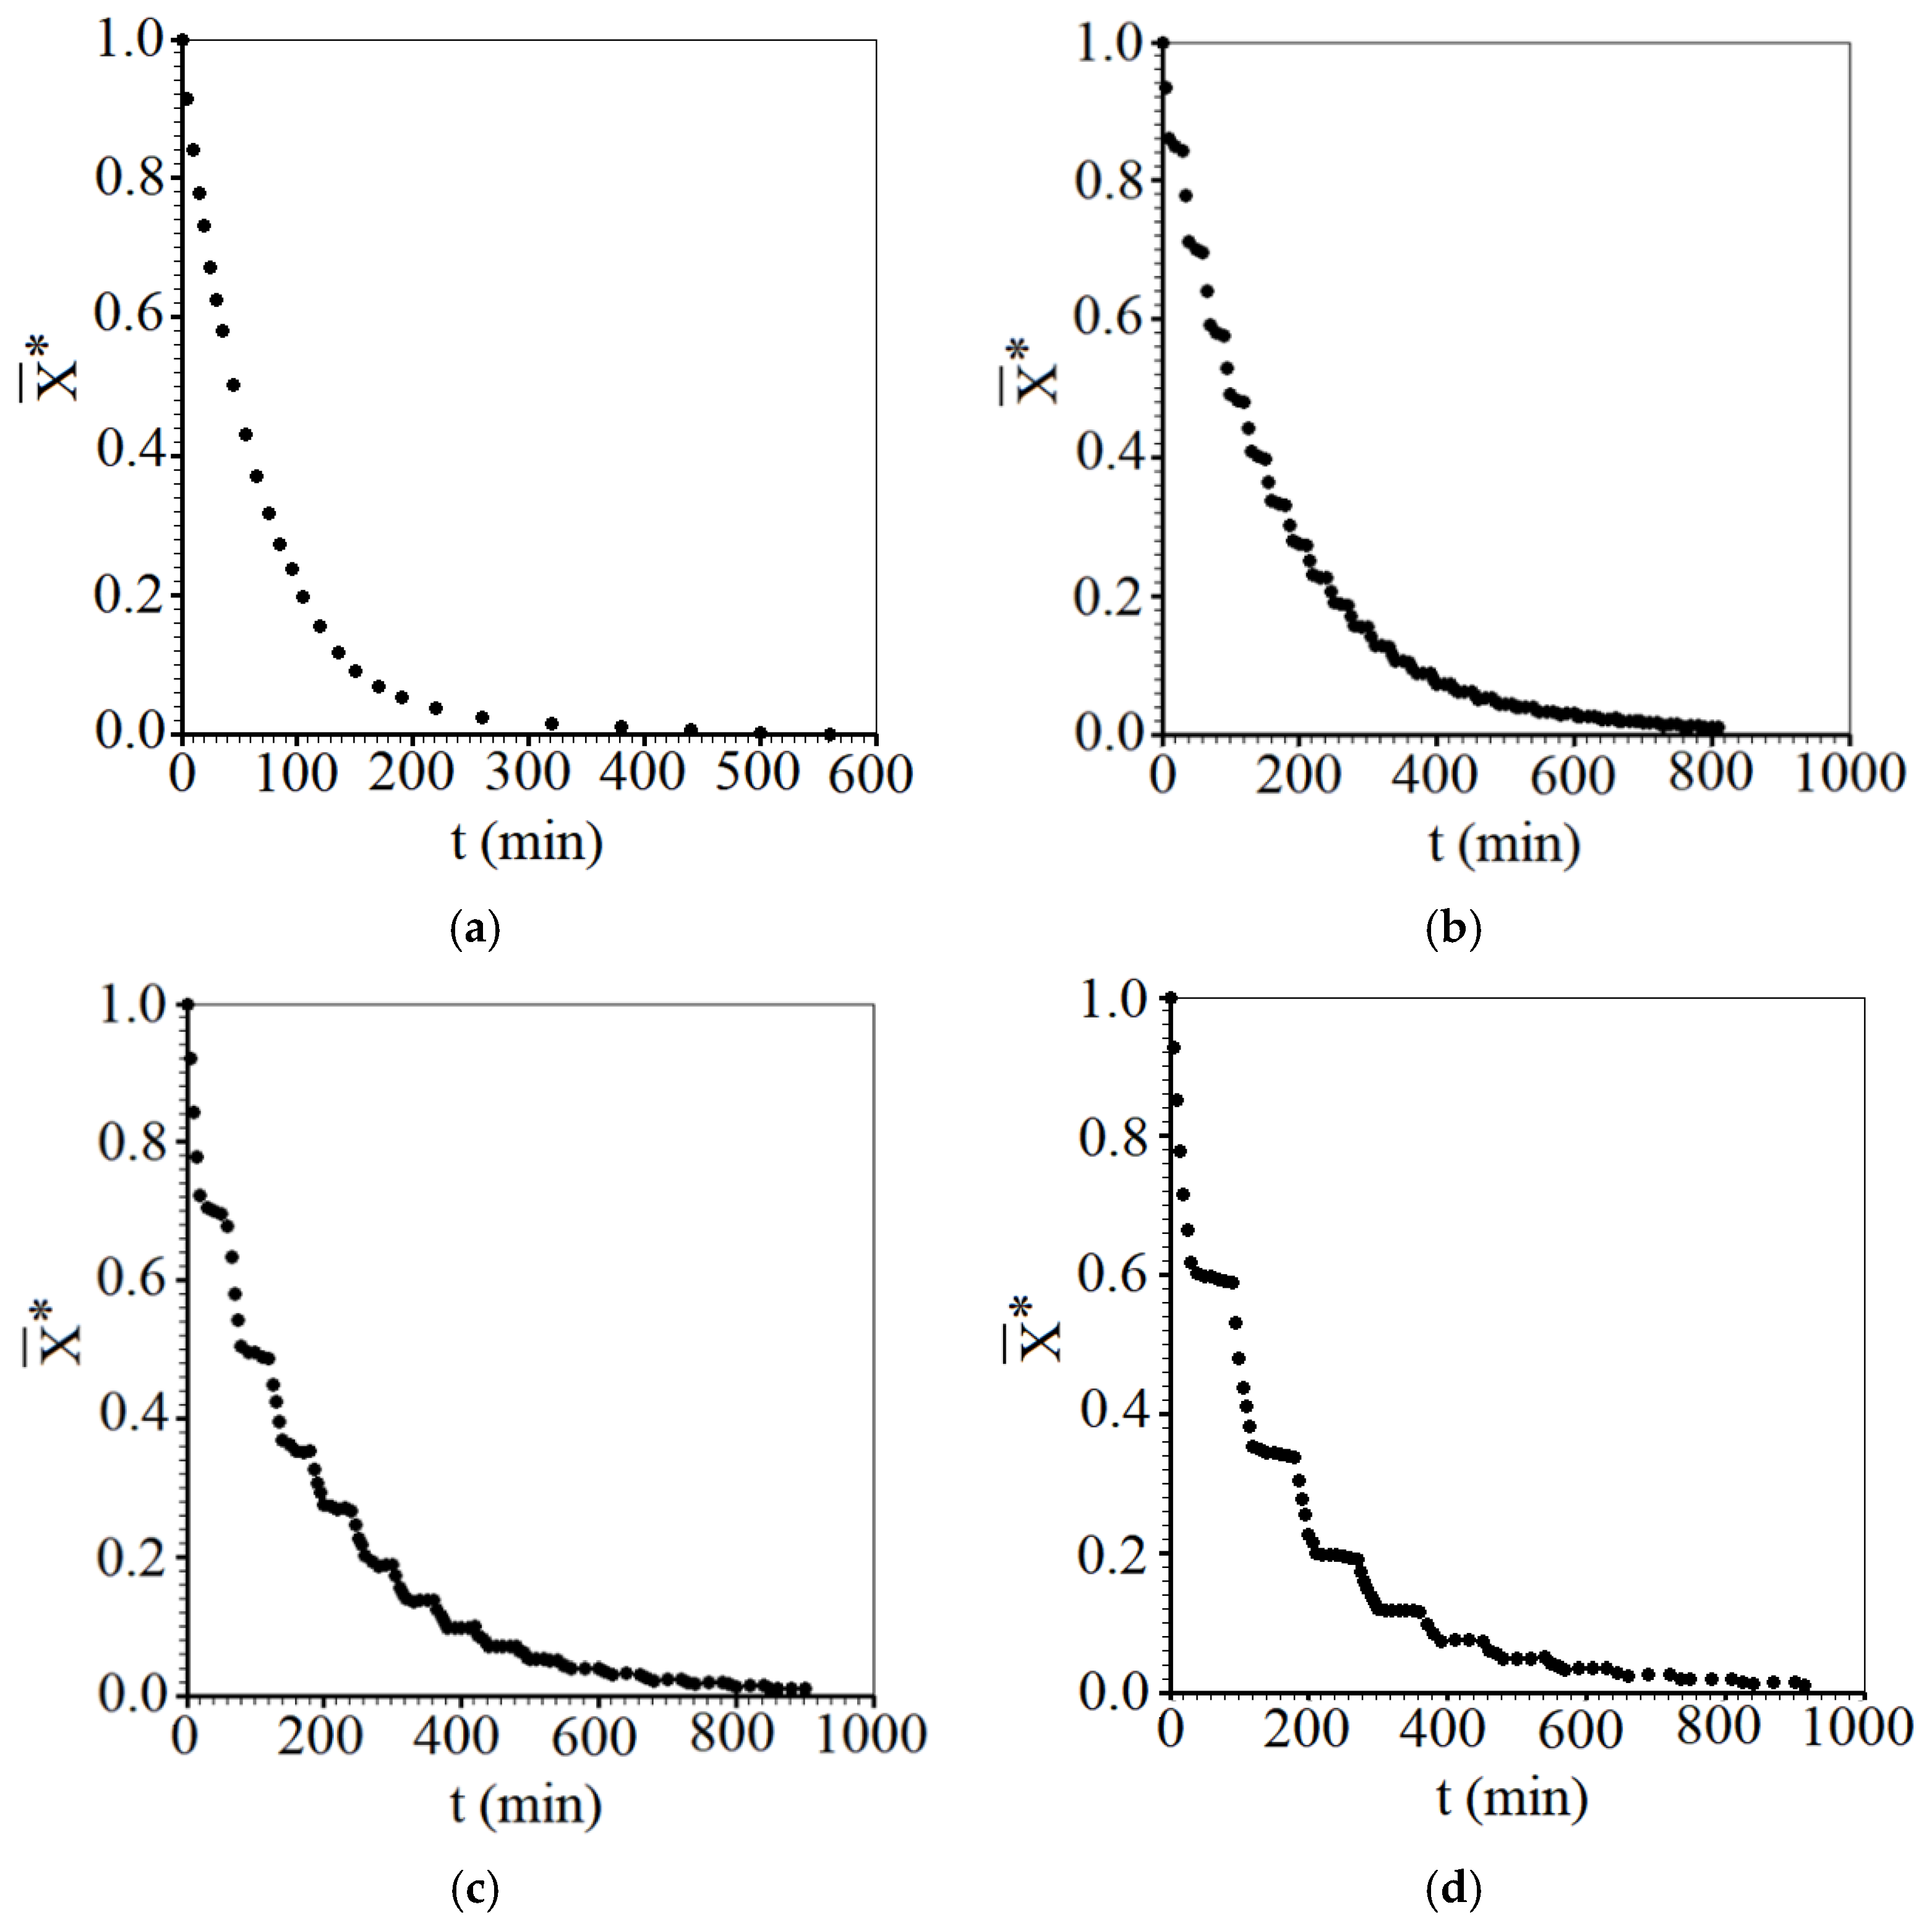
The initial moisture content of the fresh samples was equal to 11.60 on a dry basis (d.b.). Regarding drying, the mean value of the initial moisture content (Xi) of melon pieces after osmotic treatment was 2.556 (d.b.). The time required for each sample subjected to drying to reach equilibrium varied, particularly with the temperature of the drying air and the type of drying (continuous or intermittent). The mean values of the equilibrium moisture content, Xeq, obtained for each experiment at 50 °C were 0.148, 0.173, 0.190, and 0.197 (d.b.) for continuous drying, intermittent drying with tin = 10 min, intermittent drying with tin = 20 min, and intermittent drying with tin = 30 min, respectively. For 70 °C, these values were 0.115, 0.163, 0.125, and 0.144 (d.b.) for the same drying processes. Thus, it can be noted that the equilibrium moisture content was lower on average for the higher drying temperature, as expected. In addition, it is interesting to mention that, during the eight experiments (E1 to E8), the room temperature was, on average, approximately 26.0 °C and the relative humidity was, on average, 61%.
For the temperature of 50 °C, the experimental data obtained can be presented through Figure 2.
For the temperature of 70 °C, the experimental data obtained are presented in Figure 3.
As can be seen in Figure 2 and Figure 3, for intermittent drying, the melon pieces resting in the desiccator continue to lose moisture at room temperature, during the intermittent period (tout). As can be seen in the figures mentioned, this process of moisture loss occurs at much lower rates than those that occur during the period of heat supply to the product (tin).

3.2. Drying Described by Empirical Models

The results for the continuous drying of melon pieces, obtained by means of empirical models, are presented in Table 3, which shows the proposed models, their respective parameters (with uncertainties), coefficients of determination (R2), and chi-squared (χ2).
According to the statistical indicators presented in Table 3, only the Wang and Singh model showed R2 values lower than 0.900, indicating an unsatisfactory fit to the experimental data obtained. On the other hand, the other models evaluated showed good fits to the experimental data, with R2 values higher than 0.988 and low χ2 values. Thus, these models could be used to predict the drying kinetics of melon pieces, especially the models of Page and Silva et al. ii, which showed the highest coefficients of determination and the lowest chi-squared values at both temperatures studied. In line with this analysis, Silva et al. (2014c) [31] also considered the models of Page and Silva et al. ii to be the most suitable for describing the kinetics of convective drying of whole bananas, at all temperatures investigated in that study (40, 50, 60, and 70 °C). In the present study, Page’s model was chosen to represent the drying, because it showed the lowest values of χ2, the highest values of R2, and also because of its simplicity.
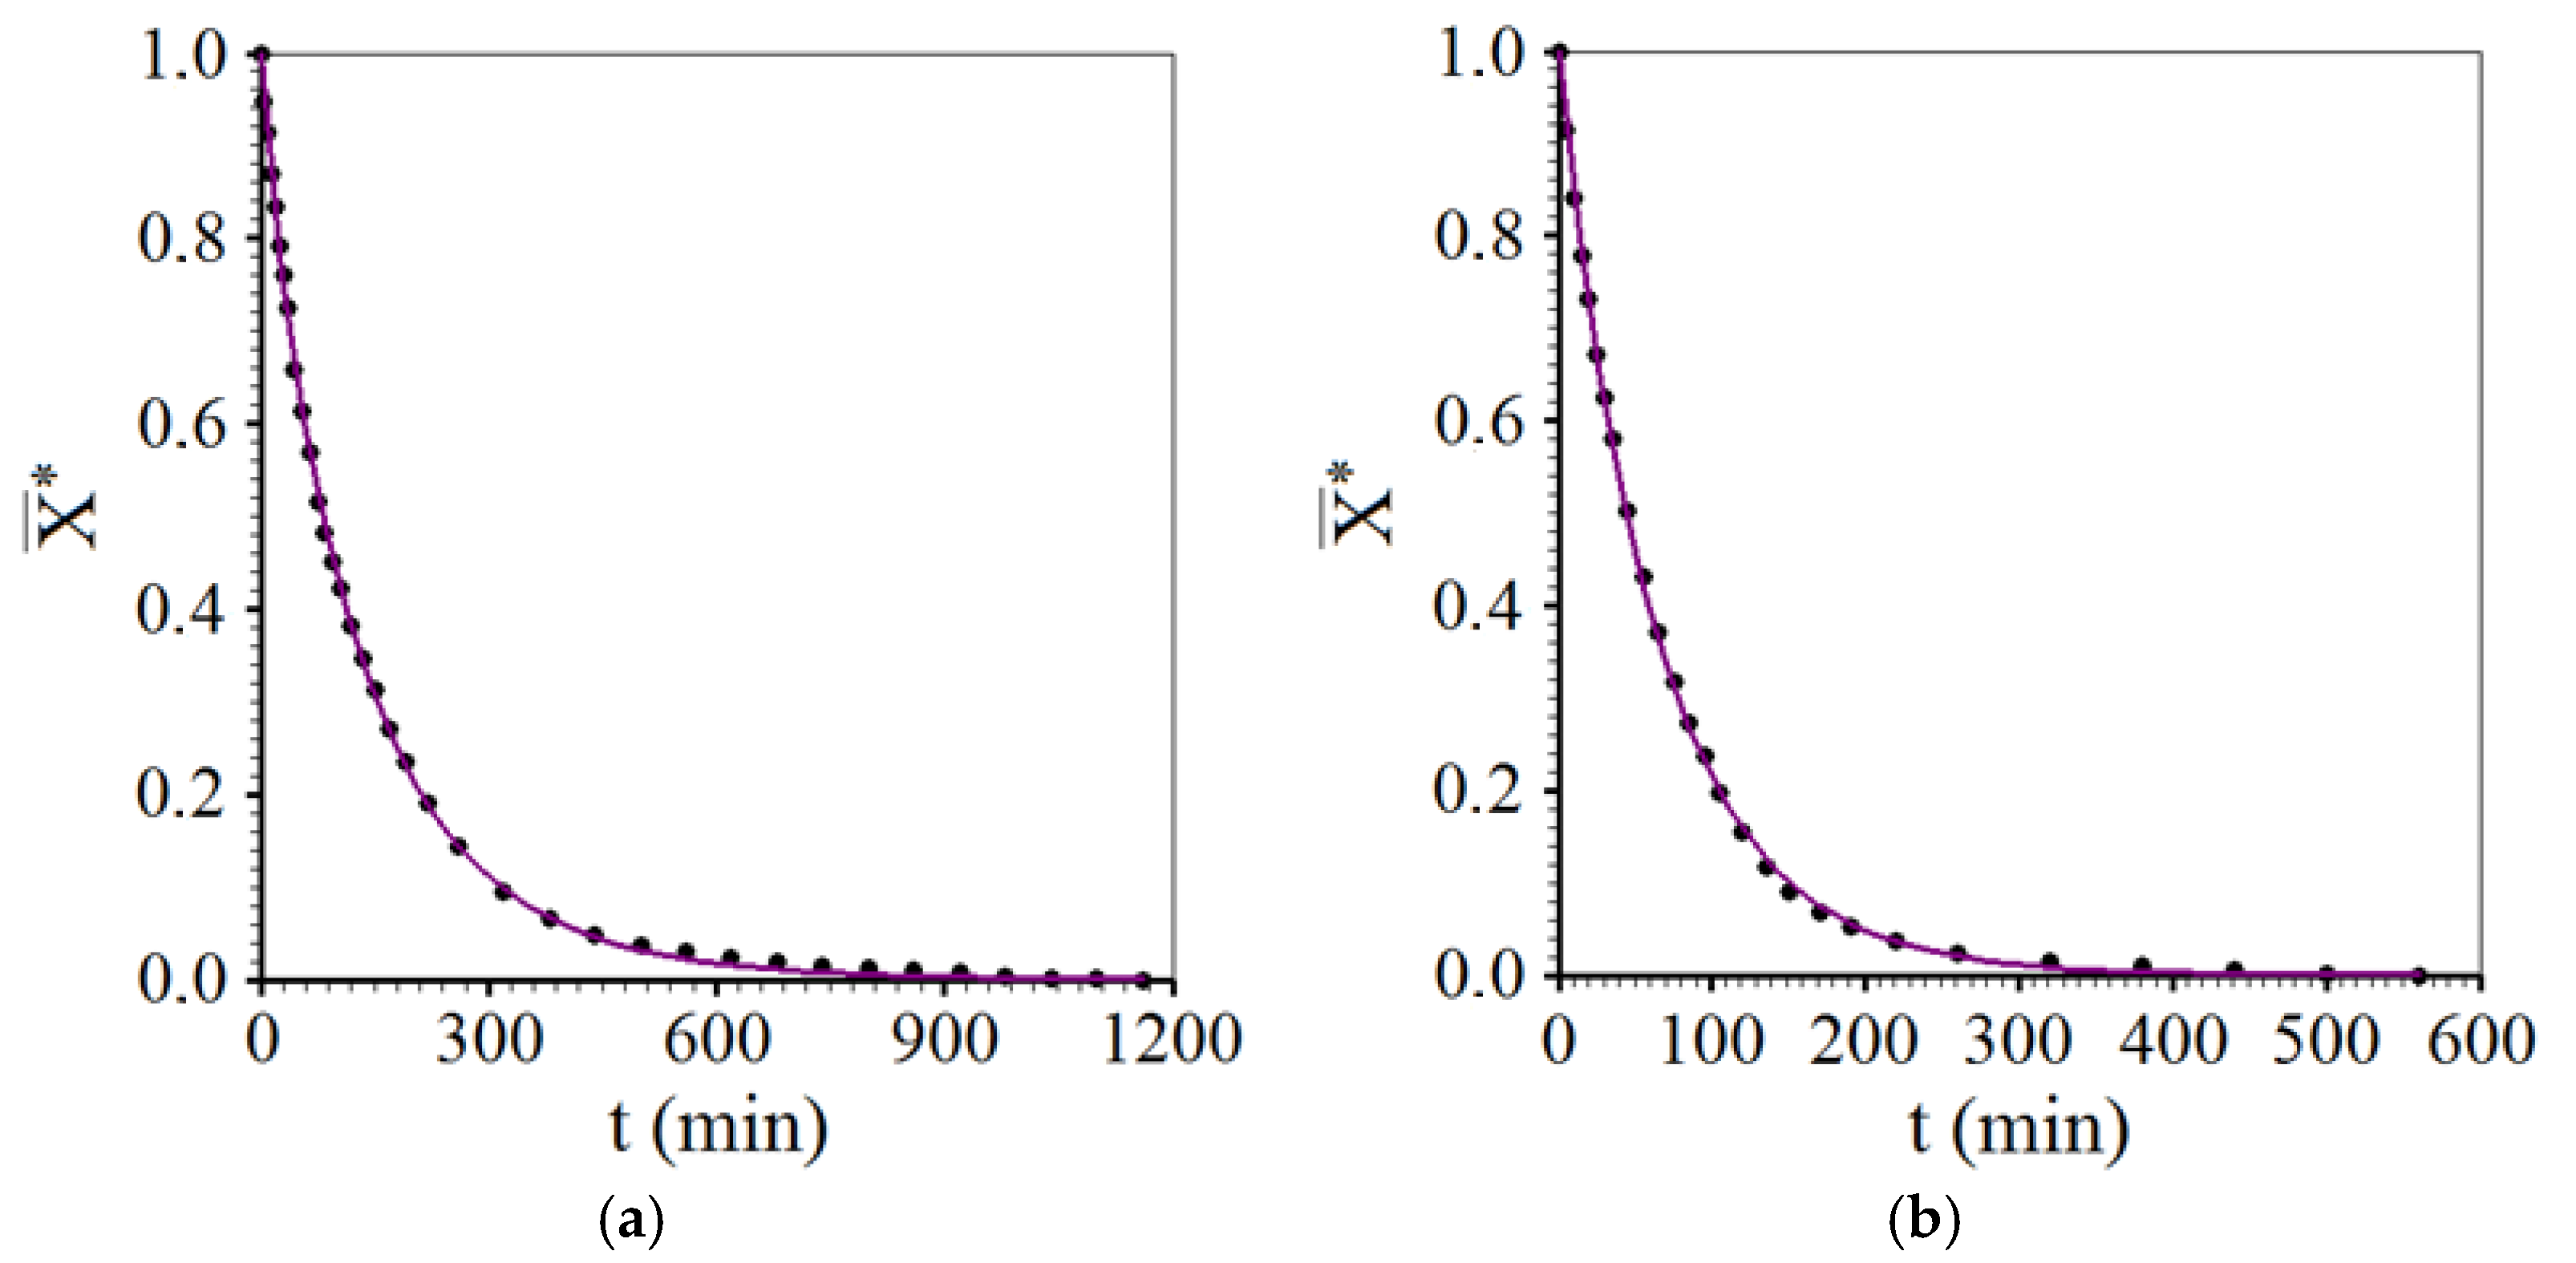
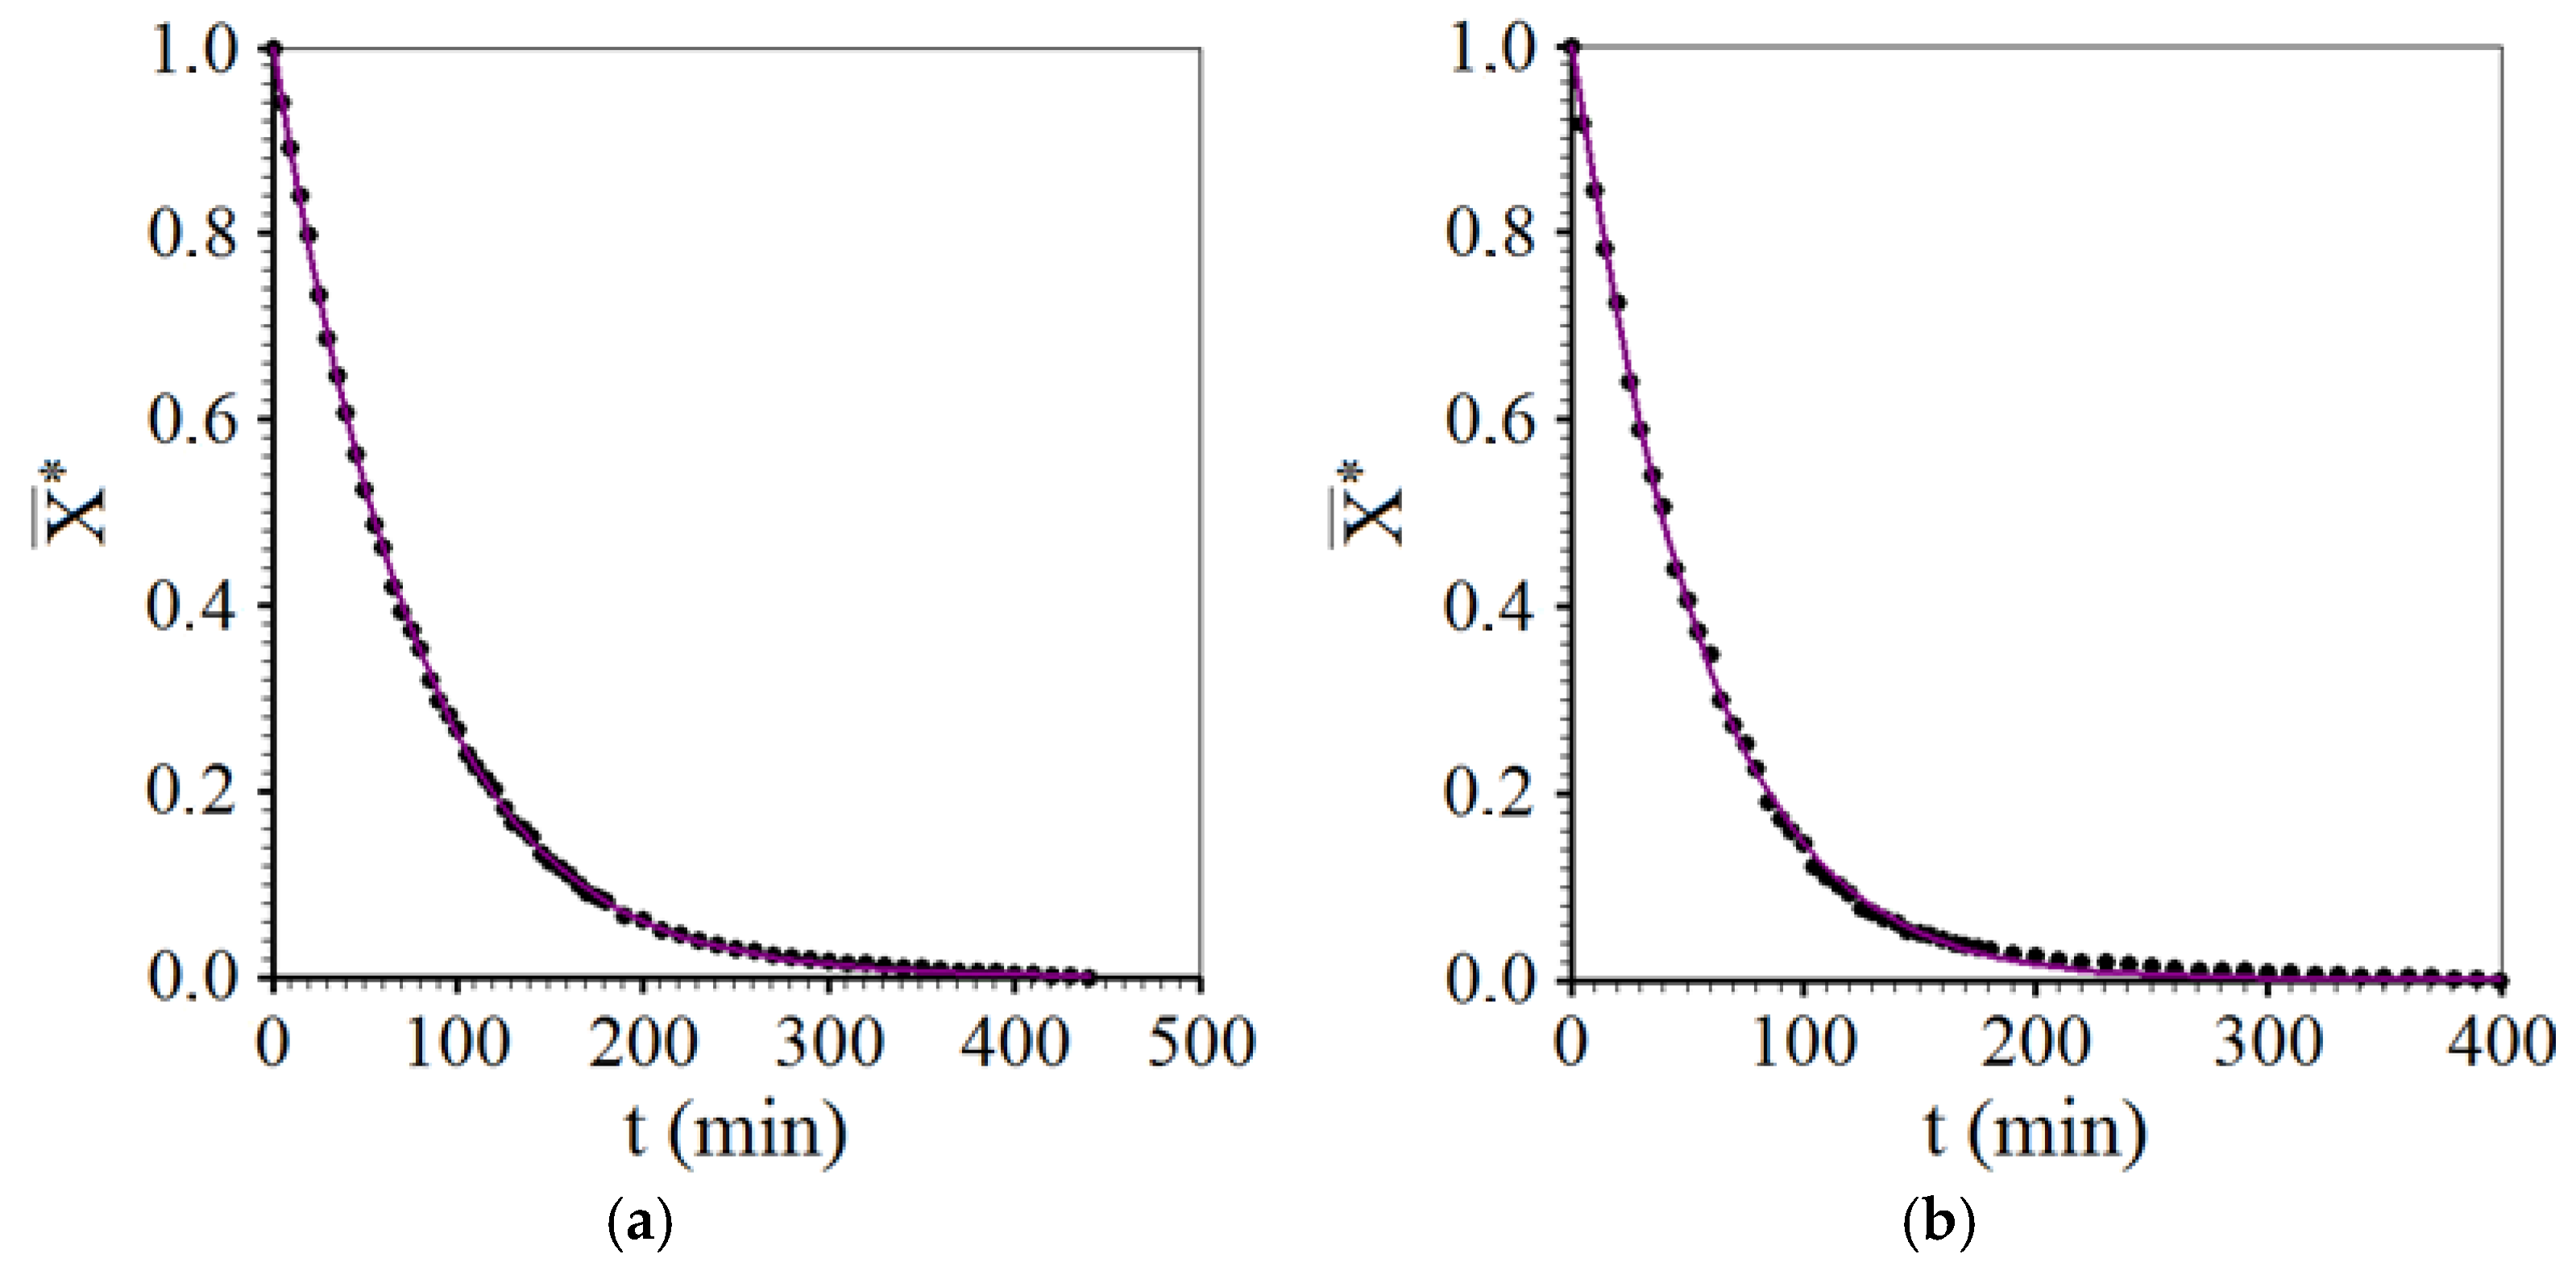
Figure 4 presents the graphs representing the continuous drying kinetics described by Page’s empirical equation, at the two temperatures defined in this study.
Page’s model was also selected to describe the intermittent drying processes. In this case, only the “effective operating time” was considered, i.e., the tempering period was eliminated and only the times in which the samples remained inside the oven were considered. Thus, each intermittent drying was simulated as a “pseudo-continuous” process, and the results obtained are presented in Table 4.
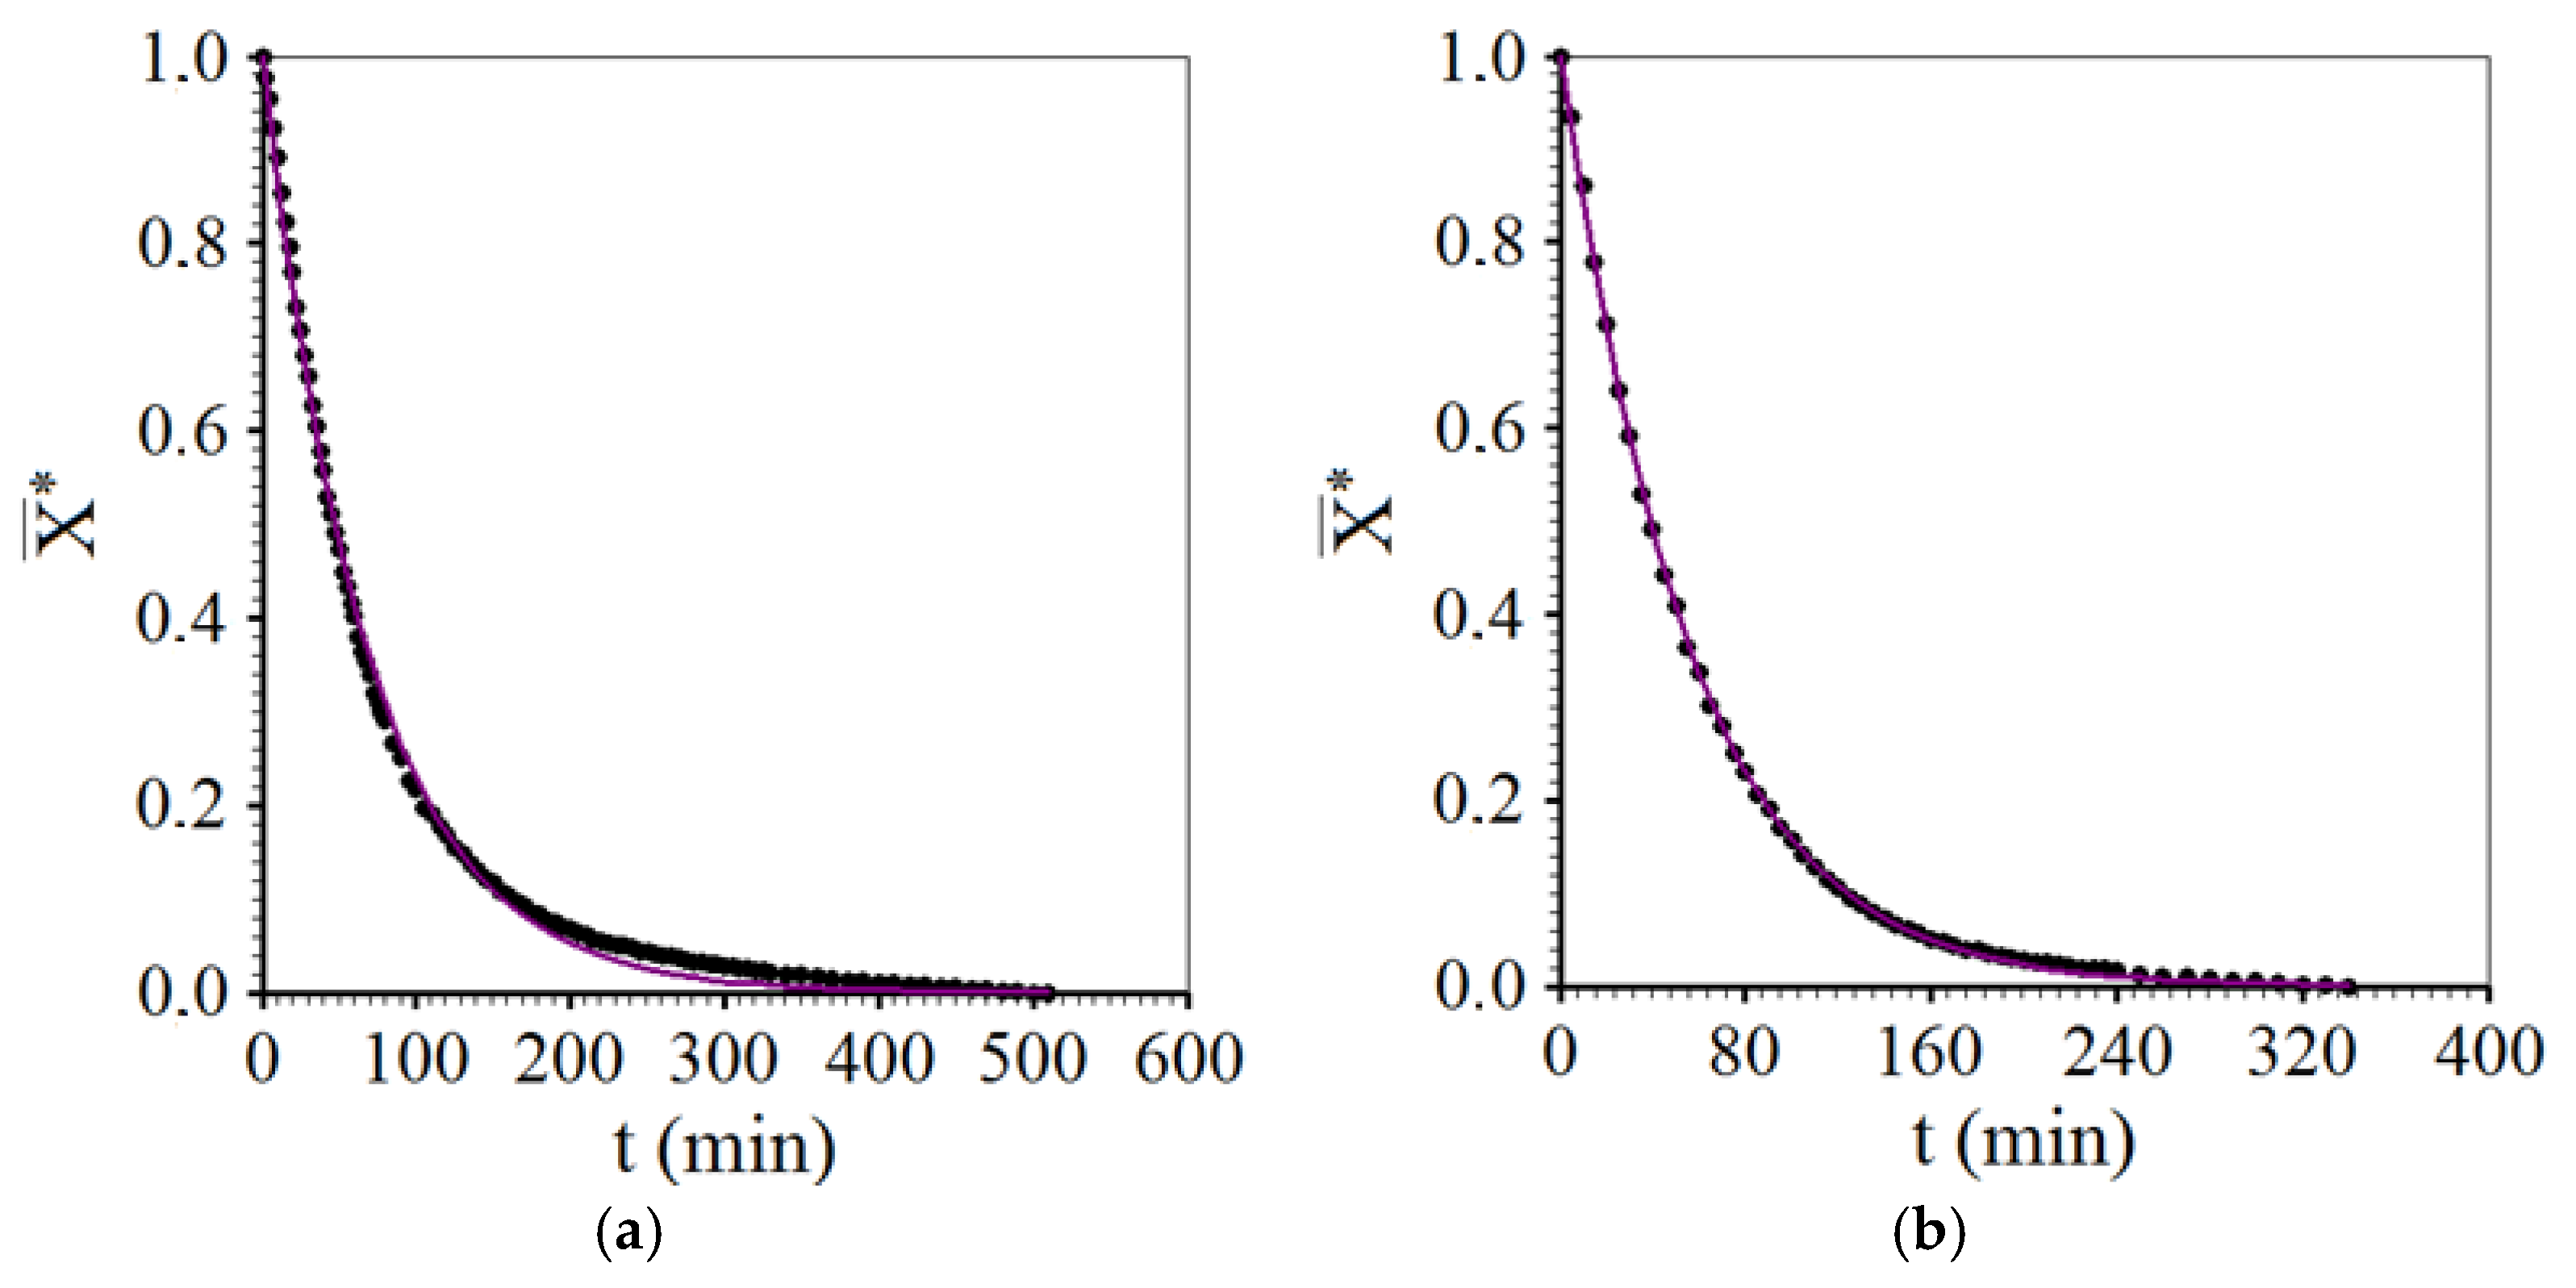
Simulations of the kinetics of intermittent (pseudo-continuous) drying, with cycles involving the times of 10 min inside the dryer (tin = 10 min) and 20 min outside the dryer (tout = 20 min) for temperatures of 50 and 70 °C are presented in Figure 5.
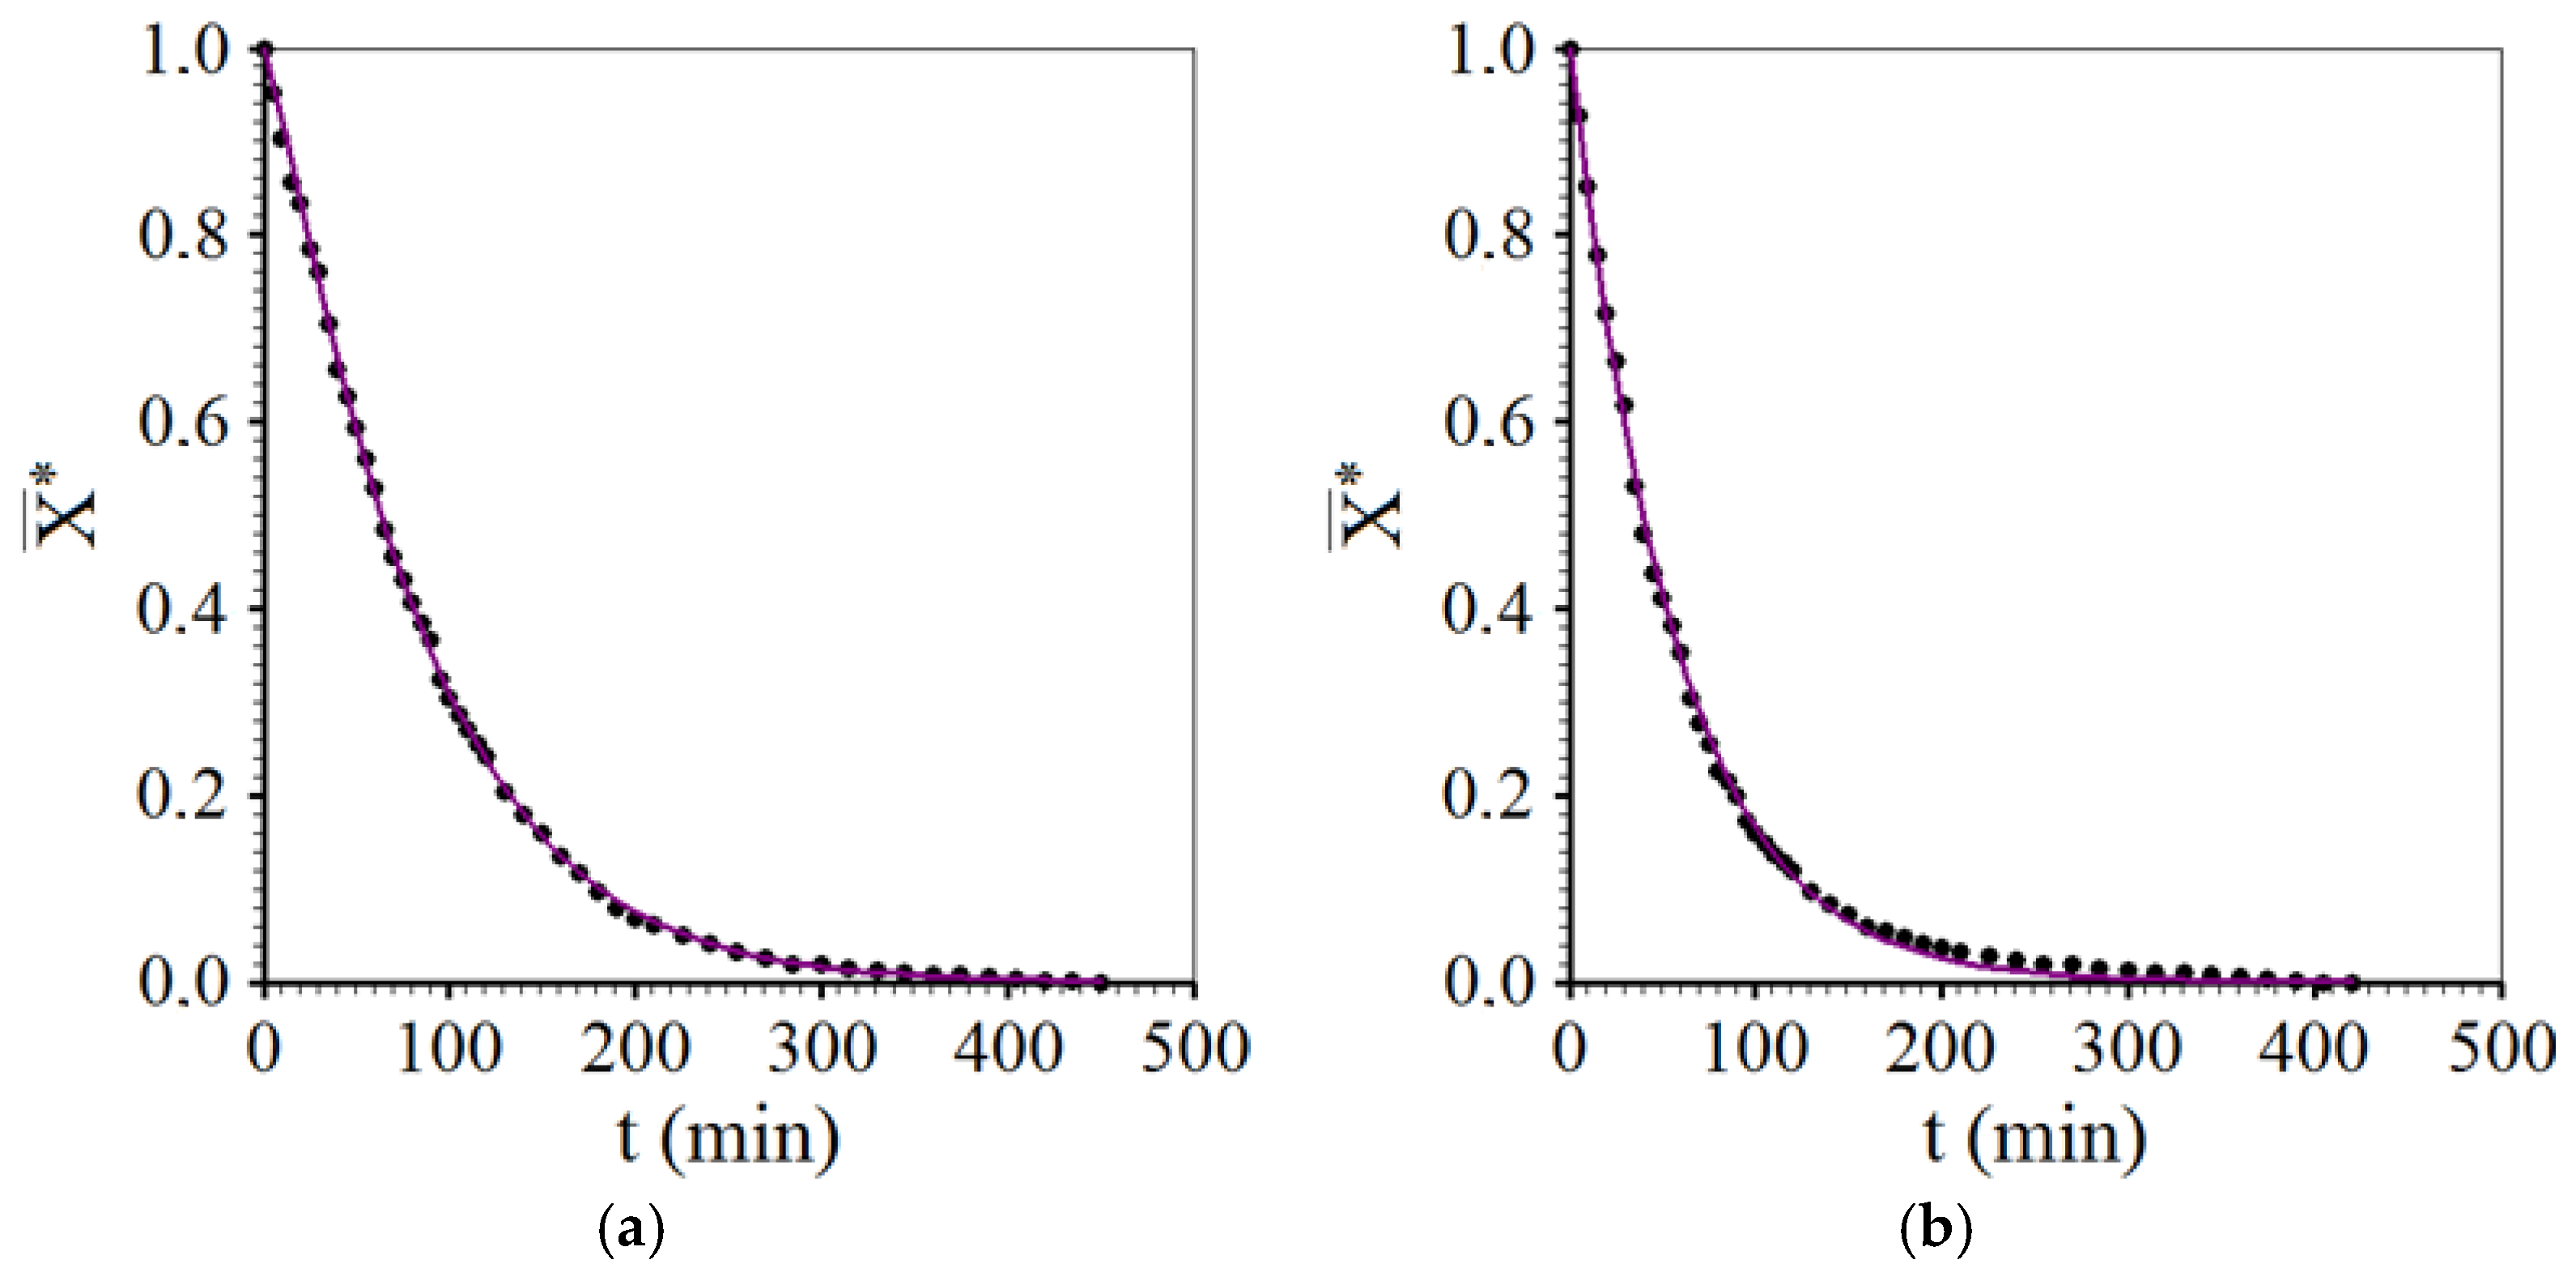
For tin = 20 min and tout = 40 min, the simulations of intermittent drying, with the elimination of the tempering period, can be observed in Figure 6, for the two stipulated temperatures.
For tin = 30 min and tout = 60 min, the simulations of intermittent drying, also with the elimination of the tempering period, can be observed in Figure 7, for the two stipulated temperatures.
Regarding intermittent drying, the values obtained in Table 4 for the statistical indicators and the observation of Figure 5, Figure 6 and Figure 7 make it possible to affirm that the use of Page’s model resulted in excellent fits (with R2 > 0.997 and with χ2 < 0.203 × 10⁻²), with good agreement between the experimental data and the corresponding simulated curves. This performance was repeated for the three distinct cycles of intermittent drying at the two temperatures studied. Thus, Page’s model could be used to describe the kinetics of intermittent drying (with the elimination of the tempering period) of osmotically dehydrated melon pieces at temperatures of 50 and 70 °C. It is interesting to note that Page’s model is often successfully applied in the description of convective drying of different agricultural products [31,32,33,34,35].
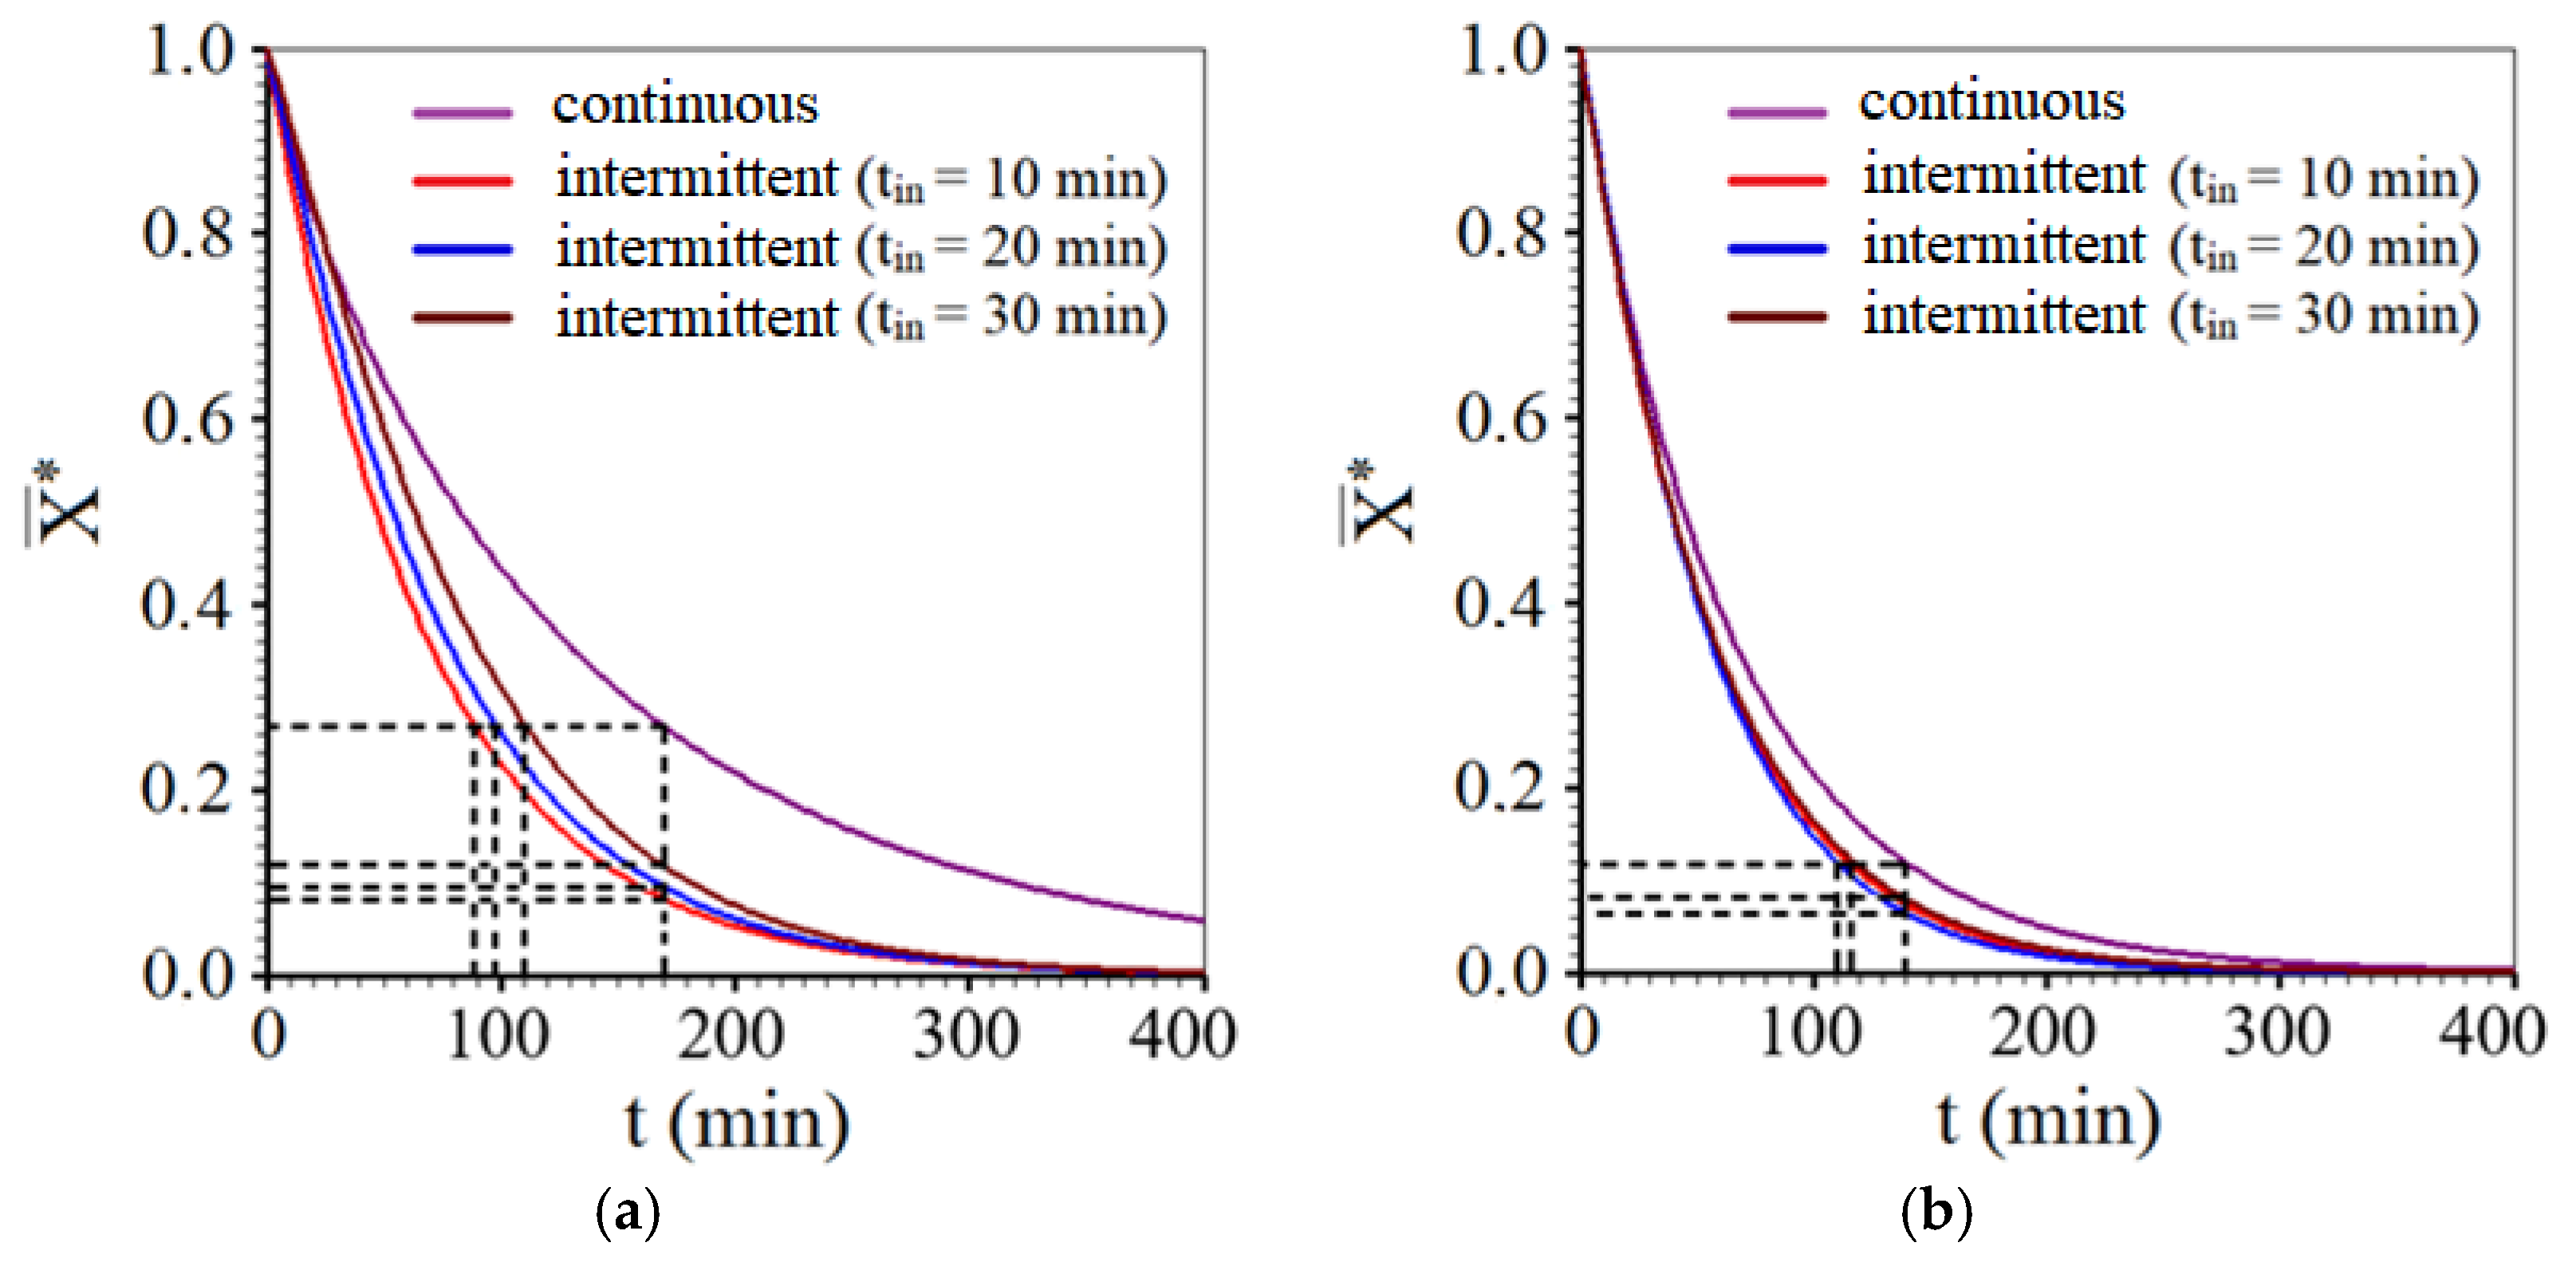
To make a comparison between the moisture loss of melon pieces over time in the different drying treatments, Figure 8 presents the superposition of the four simulations obtained using Page’s model, for each temperature. For better visualization and analysis of kinetics, the effective operating time limit was set at 400 min.
It can be observed in Figure 8 that the intermittent drying kinetics were significantly different from the continuous drying kinetics at both temperatures analyzed, especially at 50 °C. In the intermittent drying processes, the melon pieces showed greater moisture loss when compared to the corresponding continuous drying at the same time instant. For example, in Figure 8a, at 50 °C, it can be seen that the time required for the samples to reach the moisture ratio of approximately 0.27 was 170 min for continuous drying and only about 90 min for intermittent drying with tin = 10 min. This means an effective time saving of around 80 min, which corresponds to a 47.1% reduction in effective drying time and, consequently, in energy consumption, since the oven ran close to a constant power, as an infinite source in the heat supply to the product in its interior. Also, regarding Figure 8a, it can be seen that for intermittent drying with tin = 20 min and also with tin = 30 min, at a temperature of 50 °C, the reductions in effective drying time, compared to continuous drying, were 41.2 and 35.3%, respectively. Studies available in the literature show that the reduction of intermittent drying time depends on the operating conditions and on the type of biological material. For example, under different intermittency conditions and for different products, intermittent drying of soybeans, melon seeds, and apple slices has time reductions of 29.2, 28.0, and 35.0%, respectively, compared to the corresponding continuous drying [36,37,38].
In addition, the duration of the intermittency time (tout) also has a significant impact on reducing the effective time. Although in the present study the intermittency ratio was the same for all intermittent drying processes (α = 2/3), the greatest savings in effective time were obtained in the intermittent treatment with drying time of tin = 10 min and tempering time of tout = 20 min, in each cycle, i.e., in the present study, the shortest tempering period led to a higher moisture removal rate compared to the longest periods, at the temperature of 50 °C. This finding is in line with the results obtained by Silva et al. (2019) [39], who conducted a comparative study on continuous and intermittent drying of apple pieces. The authors also found that, considering only the effective operating time and using the same intermittency ratio, α = 2⁄3, intermittent kinetics with a shorter drying period (tin = 15 min) led to better results when compared to a longer drying period (tin = 60 min). On the other hand, Silva et al. (2015) [40] found reductions in effective time very similar to each other for intermittent drying processes (tout = 0.5, 1.0, and 2.0 h). These reductions in effective time were close to 50% when compared to the continuous drying time at the same temperature of 70 °C. It is worth mentioning that the aforementioned authors adopted an intermittency ratio α equal to 1/2 in all experiments of intermittent drying of whole bananas, while in the present study, α = 2⁄3 was used and the fruit studied was melon.
The reason for these reductions in effective time with the use of intermittency is given below. The tempering period allows moisture to be transferred from the center of the product to its surface, at room temperature, without energy expenditure. Therefore, the moisture and temperature gradients within the product, created during the heat supply period, in each cycle, tend to decrease during intermittency, at room temperature. This decrease causes a more uniform moisture distribution inside the material, which results in a higher moisture content on the surface and, consequently, an increase in the drying rate [10,35,37]. This effect is responsible for speeding up the drying process, reducing energy consumption.
Regarding the temperature of 70 °C (Figure 8b), the curves representing intermittent drying showed a behavior similar to each other, but considerably different from the behavior of continuous drying. As an example, 140 min of continuous drying was necessary to obtain a moisture ratio of approximately 0.12. For this same moisture ratio, intermittent drying with tin = 20 min required 110 min of effective operation, which corresponds to a reduction of 21.4%. Regarding intermittent drying with tin = 10 min and with tin = 30 min, the reductions in effective time were virtually identical, and equal to about 18.0%, compared to continuous drying. It is interesting to note that results obtained at 50 and 70 °C suggest that the efficiency of intermittent drying, in terms of energy savings, is greater at lower temperatures. In the present study, for the temperature of 50 °C, Figure 9 presents the curves of the drying rates obtained by deriving Equation (5), which is Page’s equation, with respect to time.
Figure 9 shows that, in the initial part of the process, the highest drying rate refers to intermittent drying with tin = 10 min (and tout = 20 min), and the lowest rate refers to continuous drying.

3.3. Drying Described by Diffusion Model

In this study, moisture migration in melon pieces was also described by a diffusion model with a third-kind boundary condition. The optimizations were obtained through the Convective Adsorption–Desorption software, developed by Silva and Silva (2009b) [41]. The results are presented in Table 5, which shows the mass diffusivity D; the convective mass transfer coefficient h; the Biot number in the x-direction, Bix; and the statistical indicators. Table 5 was generated considering only the effective times of intermittent drying.
When analyzing Table 5, particularly the statistical indicators, it can be observed that the third-kind boundary condition is really adequate to describe the continuous and intermittent drying of melon pieces, since the model showed excellent statistical indicators: R2 > 0.998 and χ2 < 1.14 × 10⁻². Rodrigues et al. (2015) [42], Aires et al. (2019) [43], Lima et al. (2020) [34], and Pinheiro et al. (2020) [44] also corroborated results such as these, stating that the third-kind boundary condition is appropriate to describe the drying process of different fruits, since this model considers the effect of resistance to mass flow on the surface of the product. On the other hand, when comparing the statistical indicators of the diffusion model (Table 5) to those obtained with the empirical models (Table 3 and Table 4), it can be observed that, in practical terms, the results were equivalent in the description of kinetics. Moreover, both the three-dimensional diffusion model and Page’s empirical model involve only two fitting parameters. Therefore, it is unnecessary to re-present the graphs simulated for the drying kinetics by the diffusion model, because they are virtually identical to the graphs already presented using Page’s empirical model (Figure 4, Figure 5, Figure 6 and Figure 7). Thus, an analysis of energy savings using the diffusion model would present results similar to those already obtained through Page’s model.
As shown in Table 5, the values of effective mass diffusivity, D, at 50 °C, were 4007 × 10−8 m2 min−1 (continuous drying), 4818 × 10−5 m2 min−1 (intermittent drying with tin = 10 min), 3540 × 10−5 m2 min−1 (intermittent drying with tin = 20 min), and 4115 × 10−5 m2 min−1 (intermittent drying with tin = 30 min). The values obtained are compatible with those reported in the literature for another variety of melon and several biological products: yellow melon [44], papaya [45], pear [46], banana, and apple [47]. What is interesting and important to note here is that intermittency increased the effective mass diffusivity in an extremely significant way, compared to continuous drying at the same temperature (on the order of 10−8 to 10−5, at 50 °C, as shown in Table 5). Obviously, this observation corroborates the reduction in the effective operating time, which had already been determined through Figure 8, which depicts continuous and intermittent drying with the elimination of the tempering period. In relation to the temperature of 70 °C, a similar behavior can be observed in Table 5, in which the value of the effective mass diffusivity for continuous drying (on the order of 10−7) was significantly increased with the intermittences studied (on the order of 10−5). Also, when comparing the results for the two temperatures in Table 5, it can be observed that the effective mass diffusivity also increased with the increase in temperature, i.e., it was higher at the temperature of 70 °C, both for continuous drying processes and for the corresponding intermittent drying processes, as expected. On the other hand, the value of the convective mass transfer coefficient, h, did not depend on the type of drying, but on the air temperature in the oven and on other physical parameters, such as the small variations in the dimensions of the edges of the melon pieces, in each experiment. It is also interesting to remember that, in the present study, air speed in the oven was maintained as close as possible to 1.0 m·s−1 in all eight drying processes, but small variations in this value may have influenced the small differences observed in the h values for each temperature.
It was also observed, as shown in Table 5, that the values of the Biot numbers (Bix) referring to continuous drying were 2.25 and 0.53 for the temperatures of 50 and 70 °C, respectively. For intermittent drying, much lower values were obtained for the Biot number, on the order of 10−3. This indicates that the effect of intermittency caused a significant reduction in the value of this parameter, when compared to its value referring to continuous drying. According to da Silva et al. (2017) [48], this effect can be interpreted as a more homogeneous moisture distribution in intermittent drying than in continuous drying, which favors the quality of the final product, exposed to lower water tensions. Based on a numerical solution of the diffusion equation proposed to describe intermittent drying, these authors [48] presented an animation for the redistribution of moisture related to the second tempering period (180–240 min), during intermittent drying of whole bananas, with an intermittency ratio equal to 1/2 (tin = 1 h and tout = 1 h). Over 1 h of intermittency, at room temperature, it was possible to observe migration of moisture from the central region of the banana cross-section to the peripheral region, making its distribution more homogeneous, as shown by the authors through the following link [48]: https://labfit.net/Temperin_B.gif, accessed on 2 November 2024.
It is important to note that the diffusion model used in this study did not consider product shrinkage and assumed constant mass effective diffusivity during the processes. However, the results obtained were satisfactory, since a significant part of the moisture of the fresh product had already been removed during the pretreatment of osmotic dehydration [40]. At this point in the article, it is worth questioning the following: if the descriptions of the kinetics of drying through an empirical model and a diffusion model are virtually equivalent, why present the results of the latter? The main reason is that Page’s model is unable to predict the moisture distributions inside the melon pieces. The diffusion model, on the other hand, can predict this distribution, as will be shown and discussed below.
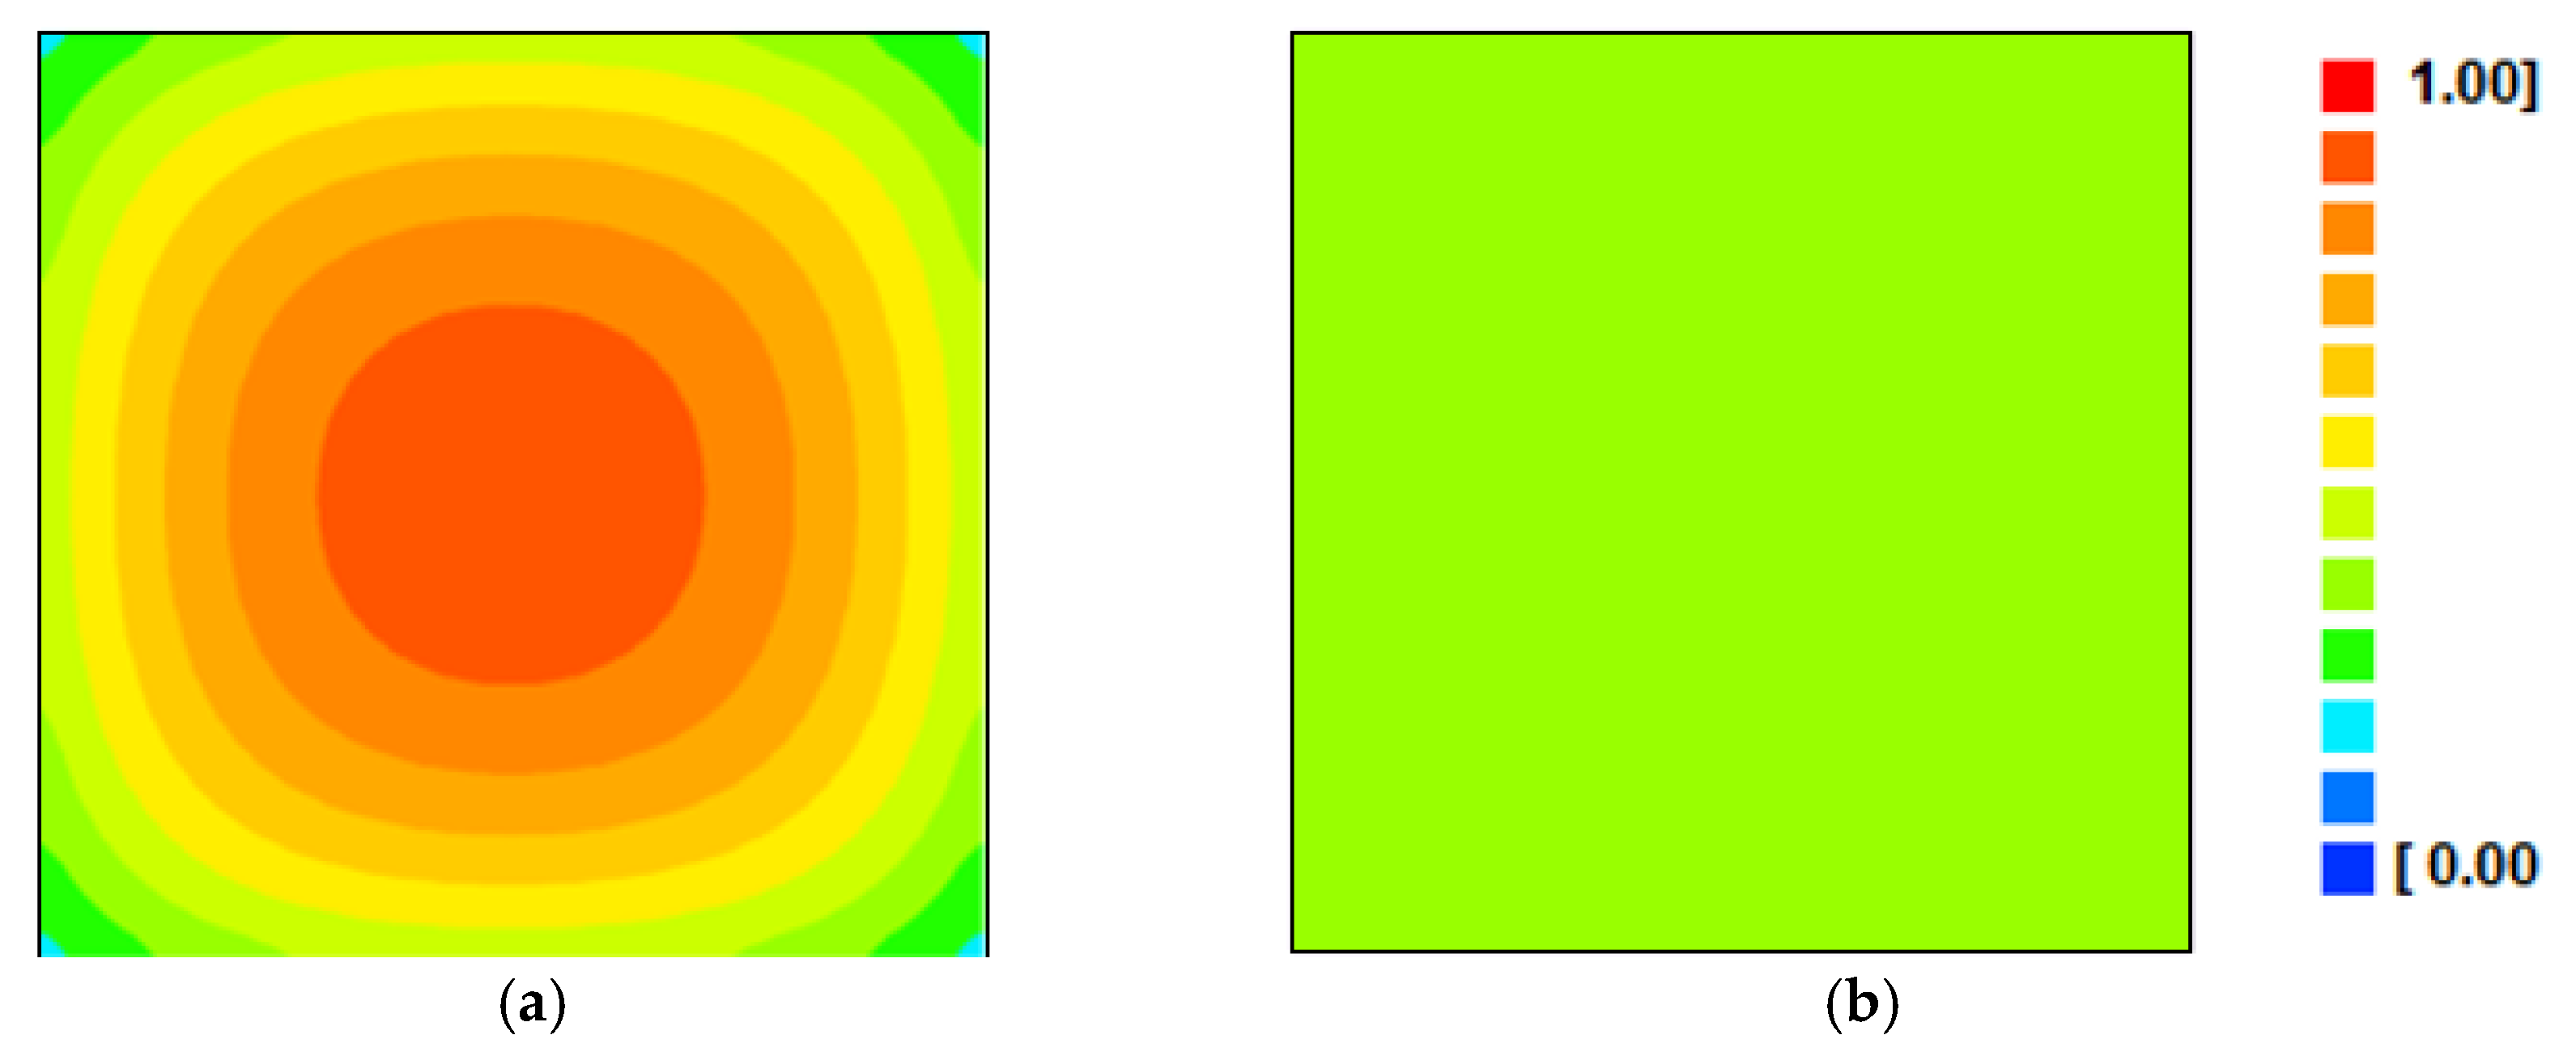
Once the process parameters have been determined by optimization, as presented in Table 5, the proposed diffusion model makes it possible to determine the moisture distribution at any position of the parallelepiped representing the melon pieces, at any instant, through Equation (15). Thus, this distribution can be shown, for example, in the vertical plane xy that contains the origin of the axis system (see Figure 1), at the effective time t = 60 min, for the experiments with continuous and intermittent drying (tin = 10 min), at the temperature of 50 °C. Such distributions are presented in Figure 10.
It is interesting to note that the objective of Figure 10 was not to extract “values” of moisture content, but rather to present a qualitative idea of the distribution of water at a given moment for each type of drying. Thus, it should be noted that these moisture distributions inside the product are important because they enable the determination of water gradients, which can produce deformations in the product during the drying process, negatively influencing its quality. The effect of intermittency on moisture distribution within the parallelepiped representing the melon pieces can be clearly seen in Figure 10: with intermittency, the melon pieces have, at a given instant, a considerably lower amount of moisture (Figure 10b) which results in faster drying. It can also be seen, in Figure 10, that intermittent drying produces a much more homogeneous moisture distribution (Figure 10b), which reduces the water gradients inside the product, when compared to continuous drying (Figure 10a).
It is interesting to observe that the feasibility of determining parameters of a phenomenon by optimization is strongly linked to the correlation between such parameters. High correlation is the main reason it is often difficult to estimate all the parameters that describe such a phenomenon, via the inverse method applied, for example, to the diffusion equation. For the drying processes analyzed in this article, it should be noted that the simultaneous determination of D and h depends on the Biot number, Bi. As is widely known in the literature, when Bi < 0.1, it will be easier to determine h. When Bi > 40.0, it will be easier to determine D. Simultaneous determination of both parameters by means of an inverse method using the diffusion equation is simpler if the Biot number is between these two values, as in the case of the two continuous drying processes studied in this article (Table 5). Even so, for the intermittent drying processes studied, which have low Biot numbers, the optimization algorithm proposed in this article also allowed estimating the two parameters (D and h), with good statistical indicators. However, it should be noted that the time spent in determining such parameters via optimization, using the diffusion equation, was considerably longer for intermittent drying than the time spent for continuous cases. As the optimizer proposed in this article was also able to determine the parameters D and h of the diffusion equation for the intermittent cases, it becomes obvious that the moisture distribution at a given instant t, during the transient process, is not completely uniform. If it were completely uniform, the effective mass diffusivity would tend to infinity, and in this case, only the determination of the convective mass transfer coefficient h would remain to be determined, in each case studied. Sir Isaac Newton modeled a similar problem for heat transfer in a body, assuming that the temperature distribution inside it was completely uniform [49]. On the other hand, Lewis’ model for the moisture ratio (Equation (4), Table 2), similar to Newton’s Law of Cooling, was obtained assuming a uniform moisture distribution inside the product, at an instant t of the transient process. In this case, the moisture migration process is described by the following first-order ordinary differential equation
d X ¯ * / d t = a X ¯ * ,
whose integration, after separating variables, from an instant t = 0 (when X ¯ * = 1) to an instant t, when the moisture ratio is X ¯ * (t), results in Equation (4), given in Table 2. The constant “a” of Equations (4) and (27) must reflect two effects: the effect of the convective mass transfer coefficient, h, on the surface of the product and also the effect of the surface area of the product, A, with respect to its volume, V, i.e., the geometric effect [50]:
a = h A / V
Just as an additional piece of information, the A/V ratio is also known as the inverse of the characteristic length referring to the product’s geometry. As an example, for intermittent drying with tin = 10 min and T = 50 °C, the specific dimensions of each piece of melon in this drying were Lx = 8.04 × 10⁻³, Ly = 8.04 × 10⁻³, and Lz = 16.08 × 10⁻³, in meters. On the other hand, the fitting of Equation (4) to the data of the mentioned intermittent drying results in a = 0.01476 min−1 (R2 = 0.9980; χ2 = 2.019 × 10⁻²). Thus, after calculating the surface area and the volume of the parallelepiped representing the melon pieces for the intermittent drying mentioned, the convective mass transfer coefficient can be determined using parameter “a” of Lewis’ equation (Equation (28))
h = 2.376 × 10⁻⁵ m min−1,
which is compatible with the result obtained in Table 5 (using the diffusion equation and the proposed optimizer, h = 2.563 × 10⁻⁵ m min−1), with a percentage discrepancy of 7.3%. It can be observed that the statistical indicators related to the Lewis’ model, previously given, are slightly worse than those obtained with the diffusion equation with tin = 10 min and T = 50 °C (Table 5, R2 = 0.9986; χ2 = 1.718 × 10⁻²). This indicates, once again, that the moisture distribution in the product is not completely homogeneous, since the fit of the Lewis’ equation to the same dataset was slightly worse than the fit of the diffusion equation to the same dataset.
Last but not least, an analysis of the preservation of the bioactive compounds in the dried melon product, considering the effects of intermittency and temperature, is presented below.

3.4. Bioactive Characterization of Dried Melon

Table 6 shows the results obtained in the characterization of bioactive compounds of melon parallelepipeds after osmotic dehydration and subsequent convective drying, continuously and intermittently, at temperatures of 50 and 70 °C.
According to the results for ascorbic acid presented in Table 6, there was no statistical difference between the treatments with drying at 50 °C. However, the experiments with intermittent drying at 70 °C obtained higher contents of ascorbic acid compared to continuous drying, indicating that this type of drying caused less degradation of this compound at this temperature, since in these cases, a shorter effective drying time was required, and the product was exposed to high temperature for less time. Regarding the two temperatures, higher contents of ascorbic acid were observed in the samples at 50 °C; a similar behavior was also verified by Demiray et al. (2013) [51], who found that high temperatures of the drying air cause greater deterioration of ascorbic acid in tomatoes. It can be observed that ascorbic acid, as well as other bioactive compounds, is a sensitive compound and can be degraded by several factors, such as light, humidity, pH, and time/temperature applied to the process.
Regarding the contents of total flavonoids and anthocyanins [52], Table 6 shows statistical differences between the mean contents of these parameters in the samples of dried melon obtained by different drying methods. The highest concentrations for flavonoids and anthocyanins were observed in the intermittently dried samples (tin = 10 min and tout = 20 min), with mean values of 15.32 and 2.83 mg/100 g for flavonoids and anthocyanins, respectively, at temperatures of 50 °C, and 11.65 and 2.43 mg/100 g for flavonoids and anthocyanins, respectively, at temperature of 70 °C. These values indicate that shorter intermittency cycles have a beneficial effect on the preservation of these compounds, i.e., intermittency with heat exposure time of 10 min and tempering time of 20 min reduced the negative impact of the deterioration of these compounds during the drying process, resulting in a good characteristic for the dried product, since these compounds have antioxidant activity that act in the reduction of free radicals associated with reductions in the risk of cardiovascular and neurodegenerative diseases [53,54]. Except in the intermittent treatment with tin = 10 min and intermittent treatment with tin = 30 min for the anthocyanin content, there was a significant reduction of these two compounds (flavonoids and anthocyanins) with the increase in drying temperature. This reduction is due to the thermosensitivity of these bioactives, which can degrade when subjected to high temperatures for a long period [55].
Among the drying treatments, all samples differed statistically from each other in relation to carotenoid content, ranging from 126.76 to 307.18 μg/100 g, with the highest value for the sample of dried melon subjected to intermittent drying (tin = 20 min tout = 40 min) at 50 °C. The use of intermittent treatment during the drying stage of the dried melon samples was able to reduce the loss of carotenoids, as these samples had higher carotenoid content when compared to the continuously dried samples. The reduced value of carotenoids obtained for the continuous process can be attributed to the constant supply of heat throughout the drying process, since these natural pigments are unstable compounds, sensitive to heat and susceptible to degradation or the isomerization process [56,57]. According to Md Saleh et al. (2020) [58], drying processes carried out with a shorter time of exposure of carotenoids to heat result in greater conservation of these bioactive compounds. The authors also pointed out that greater degradation occurs at very low moisture contents (<30%), which indicates that water has a suppressive and protective effect, preventing the degradation of carotenoids. Therefore, intermittent drying in this study allows the establishment of energy saving strategies and favorable conditions for product quality, without necessarily having to increase the temperature of the product. The best intermittency technique should be chosen based on the desired quality attributes, so that better process control can be developed with respect to the desired quality for the product.

4. Conclusions

The results obtained in this research, in terms of energy savings and preservation of bioactive compounds, suggest that intermittent drying can be used on an industrial scale in the production of dried melon for consumption as nutritious snacks. According to the analysis of the results obtained for the experiments of continuous and intermittent drying of osmotically pretreated melon pieces, it is possible to conclude that
(1)
Considering all the drying experiments, the greatest savings in effective operating time were obtained for the intermittent drying experiment with tin = 10 min, at 50 °C, resulting in a reduction of 47.1% compared to the time taken by continuous drying at the same temperature.
(2)
It was found that not only the intermittency is important for the reduction in the effective time, but also the tempering period, which considerably affected the drying kinetics, especially at the temperature of 50 °C. On the other hand, for the temperature of 70 °C, the tempering periods influenced the intermittent drying kinetics a little less. Even so, intermittent kinetics promoted an average reduction of approximately 21.4% in effective operating time compared to the time of continuous drying.
(3)
The three-dimensional diffusion model with third-kind boundary condition adequately described all the drying processes of melon pieces. In addition, the model clearly indicated the effect of intermittency compared to continuous drying: large increase in the effective mass diffusivity. This effect was responsible for increasing the drying rate and, consequently, reducing the energy consumption of the oven running at constant power.
(4)
Another effect of intermittency, compared to continuous drying, noticeable with the use of the diffusion model, consisted of the strong decrease in the Biot number for mass, as a consequence of the increase in effective diffusivity, indicating a more homogeneous distribution of moisture inside the product over time.
(5)
It was found that the type of drying influenced the bioactive properties of the final product. In general, there was a greater preservation of bioactive compounds in intermittent drying than in continuous drying. Regarding temperature, drying processes at 50 °C were, in general, the ones that most preserved these compounds.

Author Contributions

Conceptualization, J.C.A.P. and W.P.d.S.; data curation, Y.F.P., F.S.d.S., R.M.F.d.F. and A.J.d.M.Q.; formal analysis, A.G.B.d.L. and J.Q.F.; investigation, L.M.d.S. and D.d.C.S.; methodology, W.P.d.S.; software, J.P.G., A.F.d.S.J. and B.A.d.M.; supervision, W.P.d.S.; writing—original draft, J.C.A.P. and W.P.d.S.; writing—review and editing, J.P.G. and W.P.d.S. All authors have read and agreed to the published version of the manuscript.

Funding

This research received no external funding.

Institutional Review Board Statement

Not applicable.

Data Availability Statement

Data will be made available upon request to the corresponding author.

Acknowledgments

The second author would like to thank CNPq (Conselho Nacional de Desenvolvimento Científico e Tecnológico) for supporting this study and for providing his research grant (Process Number 301708/2019-3; PQ-1A).

Conflicts of Interest

On behalf of all authors, the corresponding author states that there are no conflicts of interest.

References

  1. Kist, B.B. Anuário Brasileiro de Horti&Fruti 2022; Editora Gazeta Santa Cruz: Santa Cruz do Sul, Brazil, 2022; 96p. [Google Scholar]
  2. FAO. Food and Agriculture Organization of the United Nations. 2017. Available online: https://brasil.un.org/pt-br/78207-fao-30-de-toda-comida-produzida-no-mundo-vai-parar-no-lixo (accessed on 9 June 2024).
  3. Martins, F.P.; Neto, J.C.B.; Silva, A.J.O.; Siqueira, A.M.O. Drying: A Review. J. Eng. Exact Sci. 2020, 6, 4. [Google Scholar] [CrossRef]
  4. Silva, W.P.; Aires, J.E.F.; Castro, D.S.; Silva, C.M.D.P.S.; Gomes, J.P. Numerical description of guava osmotic dehydration including shrinkage and variable effective mass diffusivity. LWT-Food Sci. Technol. 2024, 59, 859–866. [Google Scholar] [CrossRef]
  5. Silva, W.P.; Silva, C.M.D.P.S.; Aires, J.E.F.; Silva Junior, A.F. Osmotic dehydration and convective drying of coconut slices: Experimental determination and description using one-dimensional diffusion model. J. Saudi Soc. Agric. Sci. 2014, 13, 162–168. [Google Scholar] [CrossRef]
  6. Salehi, F. Recent advances in the ultrasound-assisted osmotic dehydration of agricultural products: A review. Food Biosci. 2023, 51, 102307. [Google Scholar] [CrossRef]
  7. Kumar, C.; Karim, M.A.; Joardder, M.U.H. Intermittent drying of food products: A critical review. J. Food Eng. 2014, 121, 48–57. [Google Scholar] [CrossRef]
  8. Pham, N.D.; Khan, M.I.H.; Joardder, M.U.H.; Rahman, M.M.; Mahiuddin, M.D.; Abesinghe, A.M.N.; Karim, M.A. Quality of plant-based food materials and its prediction during intermittent drying. Crit. Rev. Food Sci. Nutr. 2019, 59, 1197–1211. [Google Scholar] [CrossRef] [PubMed]
  9. Van Engeland, C.; Spreutels, L.; Legros, R.; Haut, B. Comprehensive analysis of intermittent drying. A theoretical approach. Food Bioprod. Process. 2022, 13, 86–101. [Google Scholar] [CrossRef]
  10. Golmohammadi, M.; Foroughi-Dahr, M.; Rajabi-Hamaneh, M.I.; Shojamoradi, A.; Hashemi, S. Study on Drying Kinetics of Paddy Rice: Intermittent Drying. Iran. J. Chem. Chem. Eng. 2016, 35, 105–117. [Google Scholar]
  11. Diamante, L.M.; Ihns, R.; Savage, G.P.; Vanhanen, L. A new mathematical model for thin layer drying of fruits. Int. J. Food Sci. Technol. 2010, 45, 1956–1962. [Google Scholar] [CrossRef]
  12. Kaleta, A.; Górnicki, K. Evaluation of drying models of apple (var. McIntosh) dried in a convective dryer. Int. J. Food Sci. Technol. 2010, 45, 891–898. [Google Scholar] [CrossRef]
  13. Mercali, G.D.; Tessaro, I.C.; Norena, C.P.Z.; Marczak, L.D.F. Mass transfer kinetics during osmotic dehydration of bananas (Musa sapientum, Shum.). Int. J. Food Sci. Technol. 2010, 45, 2281–2289. [Google Scholar] [CrossRef]
  14. Silva, C.M.D.P.S.; Silva, W.P.; Farias, V.S.O.; Gomes, J.P. Effective diffusivity and convective mass transfer coefficient during the drying of bananas. Eng. Agrícola 2012, 32, 342–353. [Google Scholar] [CrossRef]
  15. Silva, W.P.; Silva, C.M.D.P.S. LAB Fit Curve Fitting Software, 2009, 7.2.46. Available online: www.labfit.net (accessed on 3 April 2024).
  16. Patankar, S.V. Numerical Heat Transfer and Fluid Flow; Hemisphere Publishing Corporation: New York, NY, USA, 1980; Volume 1, p. 193. [Google Scholar]
  17. Beck, J.V.; Cole, K.D.; Haji-Sheikh, A.; Litkouhi, B. Heat Conduction Using Green’s Functions; Chapter Ten: Galerkin-Based Green’s Functions and Solutions; Hemisphere Publishing Corporation: New York, NY, USA, 1992; Volume 1, pp. 293–335. [Google Scholar]
  18. Maliska, C.R. Transferência de Calor e Mecânica dos Fluidos Computacional; LTC Editora S.A.: Rio de Janeiro, Brazil, 2004; p. 453. [Google Scholar]
  19. Bird, R.B.; Stewart, W.E.; Lightfoot, E.N. Transport Phenomena, 2nd ed.; John Wiley & Sons, Inc.: New York, NY, USA, 2001; p. 912. [Google Scholar]
  20. Luikov, A.V. Analytical Heat Diffusion Theory; Academic Press, Inc. Ltd.: London, UK, 1992. [Google Scholar]
  21. Crank, J. The Mathematics of Diffusion; Clarendon Press: Oxford, UK, 1992; p. 414. [Google Scholar]
  22. Silva, W.P.; Precker, W.J.; Silva, C.M.D.P.S.; Gomes, J.P. Determination of effective diffusivity and convective mass transfer coefficient for cylindrical solids via analytical solution and inverse method: Application to the drying of rough rice. J. Food Eng. 2010, 98, 302–308. [Google Scholar] [CrossRef]
  23. Bevington, P.R.; Robinson, D.K. Data Reduction and Error Analysis for the Physical Sciences, 2nd ed.; WCB-McGraw-Hill: Boston, MA, USA, 1992. [Google Scholar]
  24. Taylor, J.R. An Introduction to Error Analysis, 2nd ed.; University Science Books: Sausalito, CA, USA, 1997. [Google Scholar]
  25. Silva, W.P.; Precker, W.J.; Silva, C.M.D.P.S.; Silva, D.D.P.S. Determination of the effective via minimization of the objective function by scanning: Application to drying of cowpea. J. Food Eng. 2009, 95, 298–304. [Google Scholar] [CrossRef]
  26. AOAC. Official Methods of Analysis, 43rd ed.; Association Official Analytical Chemistry: Washington, DC, USA, 1997; 1018p. [Google Scholar]
  27. Benassi, M.T.; Antunes, A.J. A comparison of metaphosphoric and oxalic acids as extractant solutions for the determination of vitamin C in selected vegetables. Arq. Biol. Tecnol. 1998, 31, 507–513. [Google Scholar]
  28. Lichtenthaler, H.K. Chlorophylls and carotenoids: Pigments of photosynthetic biomembranes. Methods Enzymol. 1987, 148, 350–382. [Google Scholar] [CrossRef]
  29. Francis, F.J. Analysis of anthocyanins. In Anthocyanins as Food Colors; Markakis, P., Ed.; Academic Press: New York, NY, USA, 1982; pp. 181–207. [Google Scholar]
  30. Silva, F.A.S.; Azevedo, C.A.V. The Assistat Software Version 7.7 and its use in the analysis of experimental data. Afr. J. Agric. Res. 2016, 11, 3733–3740. [Google Scholar]
  31. Silva, W.P.; Silva, C.M.D.P.S.; Gama, F.J.A.; Gomes, J.P. Mathematical models to describe thin-layer drying and to determine drying rate of whole bananas. J. Saudi Soc. Agric. Sci. 2014, 13, 67–74. [Google Scholar] [CrossRef]
  32. Mendonça, A.P.; Sampaio, P.T.B.; Almeida, F.A.C.; Ferreira, R.F.; Novais, J.M. Determinação das curvas de secagem das sementes de andiroba em secador solar. Rev. Bras. Eng. Agrícola Ambient. 2015, 19, 382–387. [Google Scholar] [CrossRef]
  33. Santos, N.C.; Barros, S.L.; Monteiro, S.S.; Silva, S.N.; Ribeiro, V.H.A.; Silva, V.M.A.; Gomes, J.P.; Santiago, A.M.; Luiz, M.R.; Vieira, D.M.; et al. Kinetics of drying and physical-chemical quality of peach cv. Hubimel. J. Agric. Sci. 2019, 11, 223–232. [Google Scholar] [CrossRef]
  34. Lima, L.S.L.; SILVA, W.P.; Pereira, J.C.A.; Gomes, J.P.; Silva, C.M.D.P.S.; Júnior, A.F.S. Description of continuous and intermittent drying of sapodilla with elimination of tempering period: Saving in drying time. Sylwan 2020, 164, 444–459. [Google Scholar]
  35. Pereira, J.C.A.; Silva, W.P.; Gomes, J.P.; Queiroz, A.J.M.; Figueirêdo, R.M.F.; Melo, B.A.; Santiago, A.M.; Lima, A.G.B.; Macedo, A.D.B. Continuous and intermittent drying of rough rice: Effects on process effective time and effective mass diffusivity. Agriculture 2020, 10, 282. [Google Scholar] [CrossRef]
  36. Zhu, Z.; Yang, Z.; Wang, F. Experimental research on intermittent heat pump drying with constant and time-variant intermittency ratio. Dry. Technol. 2016, 34, 1630–1640. [Google Scholar] [CrossRef]
  37. Silva, R.C.; Silva, W.P.; Gomes, J.P.; Queiroz, A.J.M.; Figueirêdo, R.M.F.; Lima, A.G.B.; Rocha, A.P.T.; Silva, L.D.; Ferreira, J.P.L.; Santos, D.C.; et al. A New Empirical Model for Predicting Intermittent and Continuous Drying of “Neve” Melon (Cucumis melo sp.) Seeds. Agriculture 2022, 12, 328. [Google Scholar] [CrossRef]
  38. Filippin, A.P.; Filho, L.M.; Fadel, V.; Mauro, M.A. Thermal intermittent drying of apples and its effects on energy consumption. Dry. Technol. 2018, 36, 1662–1677. [Google Scholar] [CrossRef]
  39. Silva, W.P.; Galvão, I.B.; Silva, C.M.D.P.S.; Aires, J.E.F.; Figuêiredo, R.M.F. Empirical model for describing continuous and intermittent drying kinetics of apple pieces. Heat Mass Transf. 2019, 56, 1263–1274. [Google Scholar] [CrossRef]
  40. Silva, W.P.; Rodrigues, A.F.; Silva, C.M.D.P.S.; Castro, D.S.; Gomes, J.P. Comparison between continuous and intermittent drying of whole bananas using empirical and diffusion models to describe the processes. J. Food Eng. 2015, 166, 230–236. [Google Scholar] [CrossRef]
  41. Silva, W.P.; Silva, C.M.D.P.S. Convective Adsorption-Desorption Software. 2009. Available online: https://www.labfit.net/Convective.htm (accessed on 3 April 2024).
  42. Rodrigues, A.F.; Silva, W.P.; Gomes, J.P.; Silva, C.M.D.P.S.; Ramos, I.C.C. Estudo da Secagem de Bananas Através do Modelo de Difusão Usando Soluções Analíticas. In Proceedings of the Convibra 2015—Agronmy Congress, Virtual, 20–24 September 2015. [Google Scholar]
  43. Aires, K.L.C.A.F.; Silva, W.P.; Aires, J.E.F.; Silva Júnior, A.F.; Silva, C.M.D.P. Convective drying of osmotically dehydrated apples described by three-dimensional numerical solution of the diffusion equation with analysis of water effective diffusivity spatial distribution. Dry. Technol. 2019, 37, 2034–2046. [Google Scholar]
  44. Pinheiro, R.M.M.; Silva, W.P.; Miranda, D.S.A.; Silva, C.M.D.P.S.; Pessoa, T. Osmotic dehydration of cubic pieces of melon: Description through a three-dimensional diffusion model considering the resistance to mass flows on the surface. Heat Mass Transf. 2020, 57, 405–415. [Google Scholar] [CrossRef]
  45. Ferreira, J.P.L.; Castro, D.S.; Moreira, I.S.; Silva, W.P.; Figueirêdo, R.M.F.; Queiroz, A.J.M. Convective drying kinetics of osmotically pretreated papaya cubes. Rev. Bras. Eng. Agrícola Ambient. 2020, 24, 200–208. [Google Scholar] [CrossRef]
  46. Lima, L.S.L.; Silva, W.P.; Pereira, J.C.A.; Silva, C.M.D.P.S. Study of Continuous and Intermittent Drying of Pear Through Mathematical and Diffusion Models. J. Agric. Stud. 2022, 10, 1. [Google Scholar] [CrossRef]
  47. Pinheiro, M.N.C.; Castro, L.M.M.N. Conductive hydro-drying of cayenne chili paste: Effects of intermittency, temperature and salt concentration on product quality and energy efficiency. Food Sci. Technol. 2023, 9, 7. [Google Scholar] [CrossRef]
  48. Silva, W.P.; Rodrigues, A.F.; Silva, C.M.D.P.S.; Gomes, J.P. Numerical approach to describe continuous and intermittent drying including the tempering period: Kinetics and spatial distribution of moisture. Dry. Technol. 2017, 35, 72–280. [Google Scholar] [CrossRef]
  49. Silva, W.P.; Precker, J.W.; Silva, C.M.D.P.S.; Silva, D.D.P.S.; Silva, C.D.P.S. Measurement of Specific Heat and Newton’s Law of Cooling: A Refinement in the Analysis of the Experimental Data. Rev. Bras. Ensino Física 2003, 25, 4. [Google Scholar] [CrossRef]
  50. Nanadegani, F.S.; Sunden, B. Prediction of mass transfer coefficient of the continuous phase in a structured packed extraction column in the presence of SiO2 nanoparticles. Front. Heat Mass Transf. 2020, 14, 21. [Google Scholar] [CrossRef]
  51. Demiray, E.; Tulek, Y.; Yilmaz, Y. Degradation kinetics of lycopene, b-carotene and ascorbic acid in tomatoes during hot air drying. LWT-Food Sci. Technol. 2013, 50, 172–176. [Google Scholar] [CrossRef]
  52. Silva, W.P.; Nunes, J.S.; Gomes, J.P.; Silva, C.M.D.P.S. Obtaining anthocyanin from jambolan fruit: Kinetics, extraction rate, and prediction of process time for different agitation frequencies. Food Sci. Nutr. 2018, 6, 1664–1669. [Google Scholar] [CrossRef]
  53. Aboul-Enein, H.Y.; Berczynski, D.X.; Kruk, I. Phenolic compounds: The role of redox regulation in neurodegenerative disease and cancer. Mini Rev. Med. Chem. 2013, 13, 385–398. [Google Scholar] [CrossRef] [PubMed]
  54. Amadeu, L.T.S.; Figueirêdo, R.M.F.; Queiroz, A.J.M.; Reis, C.G.; Lima, T.L.B.; Costa, P.S. Resíduos de frutas na elaboração de geleia de melão Pele de Sapo. Rev. Verde 2020, 15, 153–159. [Google Scholar] [CrossRef]
  55. Castro, D.S.; Oliveira, T.K.B.; Lemos, D.M.; Rocha, A.P.T.; Almeida, R.D. Efeito da temperatura sobre a composição físico-química e compostos bioativos de farinha de taro obtida em leito de jorro. Braz. J. Food Technol. 2017, 20, e2016060. [Google Scholar] [CrossRef]
  56. Silva, G.D.; Barros, Z.M.P.; Medeiros, R.A.B.; Carvalho, C.B.O.; Brandão, S.C.R.; Azoubel, P.M. Pretreatments for melon drying implementing ultrasound and vacuum. LWT 2016, 74, 114–119. [Google Scholar] [CrossRef]
  57. Cunha, R.M.C.; Brandão, S.C.R.; Medeiros, R.A.B.; Júnior, E.V.S.; Silva, J.H.F.; Azoubel, P.M. Effect of ethanol pretreatment on melon convective drying. Food Chem. 2020, 333, 127502. [Google Scholar] [CrossRef] [PubMed]
  58. Saleh, R.M.; Kulig, B.; Emiliozzi, A.; Hensel, O.; Sturm, B. Impact of critical control-point based intermittent drying on drying kinetics and quality of carrot (Daucus carota var. laguna). Therm. Sci. Eng. Prog. 2020, 20, 100682. [Google Scholar] [CrossRef]
Figure 1. Parallelepiped with edges Lx, Ly, and Lz representing the melon pieces.
Agriculture 15 00480 g001
Figure 2. Experimental data at 50 °C: continuous (a); intermittent with tin = 10 min (b); intermittent with tin = 20 min (c); intermittent with tin = 30 min (d).
Agriculture 15 00480 g002
Figure 3. Experimental data at 70 °C: continuous (a); intermittent with tin = 10 min (b); intermittent with tin = 20 min (c); intermittent with tin = 30 min (d).
Agriculture 15 00480 g003
Figure 4. Continuous drying kinetics described by Page’s model at temperatures of 50 °C (a) and 70 °C (b).
Agriculture 15 00480 g004
Figure 5. Intermittent drying kinetics with tin = 10 min, at temperatures of 50 °C (a) and 70 °C (b), described by Page’s equation, using only the effective time.
Agriculture 15 00480 g005
Figure 6. Intermittent drying kinetics (tin = 20 min) at temperatures of 50 °C (a) and 70 °C (b), described by Page’s equation.
Agriculture 15 00480 g006
Figure 7. Intermittent drying kinetics (tin = 30 min) at temperatures of 50 °C (a) and 70 °C (b), described by Page’s equation.
Agriculture 15 00480 g007
Figure 8. Superposition and comparison of continuous and intermittent drying kinetics for drying air temperatures of 50 °C (a) and 70 °C (b), described by Page’s equation.
Agriculture 15 00480 g008
Figure 9. Drying rates for the four experiments carried out at 50 °C.
Agriculture 15 00480 g009
Figure 10. Moisture distribution in the vertical plane xy that contains the origin of the axis system of the parallelepiped representing the melon pieces, at the effective time t = 60 min, at 50 °C: continuous drying (a); intermittent drying, with tin = 10 min (b).
Agriculture 15 00480 g010
Table 1. Parameters for each drying experiment of osmotically pretreated melon.
ExperimentDryingtin (min)tout (min)Temperature (°C)
E1Continuous--50
E2Intermittent102050
E3Intermittent204050
E4Intermittent306050
E5Continuous--70
E6Intermittent102070
E7Intermittent204070
E8Intermittent306070
Table 2. Empirical models used to predict drying kinetics.
ModelExpressionReferenceEquation
Henderson and Pabis X ¯ * = a   e x p ( b t ) [11](3)
Lewis X ¯ * = e x p ( a t ) [12](4)
Page X ¯ * = e x p ( a t b ) [11](5)
Peleg X ¯ * = 1 t / ( a + b t ) [13](6)
Silva et al. ii X ¯ * = e x p ( a t b t 1 / 2 ) [14](7)
Wang and Singh X ¯ * = 1 + a t + b t 2 [12](8)
X ¯ * is the moisture ratio of the product, dimensionless; t is time; a and b are fitting parameters.
Table 3. Results for continuous drying at temperatures of 50 and 70 °C, using empirical models.
ModelReferenceT (°C)ParametersR2χ2
a × 10−1b × 10−3
Henderson and Pabis[11]509.705 ± 0.0647.81 ± 0.120.99867.235 × 10−3
709.890 ± 0.03115.289 ± 0.0950.99977.885 × 10−4
Lewis[12]500.082 ± 0.001-0.99871.140 × 10−2
700.155 ± 0.001-0.99971.181 × 10−3
Page[11]500.135 ± 0.004892.1 ± 6.30.99971.386 × 10−3
700.169 ± 0.005979.7 ± 7.20.99979.066 × 10−4
Peleg[13]50867 ± 22891.4 ± 7.40.99601.759 × 10−2
70469 ± 22857 ± 160.98863.300 × 10−2
Silva et al.ii[14]500.067 ± 0.00114.5 ± 1.40.99943.070 × 10−3
700.148 ± 0.0025.2 ± 1.40.99977.470 × 10−4
Wang and Singh[12]50−0.034 ± 0.0020.002 ± 0.0020.88341.148 × 100
70−0.073 ± 0.0040.011 ± 0.0010.89016.620 × 10−1
Table 4. Parameters of Page’s model for intermittent drying at temperatures of 50 and 70 °C, using the effective time (tin).
IntermittentT (°C)ParametersR2χ2
a × 10−1b × 10−3
tin = 10 min500.148 ± 0.0061000 ± 100.99792.019 × 10−2
700.154 ± 0.0031039.2 ± 4.90.99971.329 × 10−3
tin = 20 min500.099 ± 0.0011066 ± 3.50.99987.974 × 10−4
700.131 ± 0.0041083.0 ± 7.60.99951.991 × 10−3
tin = 30 min500.060 ± 0.0021146.15 ± 6.50.99971.668 × 10−3
700.159 ± 0.0071027 ± 100.99913.849 × 10−3
Table 5. Parameters obtained by optimizations of the drying processes using the diffusion model.
T (°C)DryingD (m2 min−1)h (m min−1)BixR2χ2
50Continuous4.007 × 10−82.243 × 10−52.250.99961.830 × 10−3
Inter. (tin = 10 min)4.818 × 10−52.563 × 10−52.25 × 10−30.99861.718 × 10−2
Inter. (tin = 20 min)3.540 × 10−52.318 × 10−52.75 × 10−30.99962.119 × 10−3
Inter. (tin = 30 min)4.115 × 10−51.928 × 10−51.75 × 10−30.99781.130 × 10−2
70Continuous2.460 × 10−73.082 × 10−50.5350.99977.662 × 10−4
Inter. (tin = 10 min)5.952 × 10−53.271 × 10−52.50 × 10−30.99986.316 × 10−4
Inter. (tin = 20 min)5.706 × 10−53.353 × 10−52.50 × 10−30.99875.259 × 10−3
Inter. (tin = 30 min)5.742 × 10−53.076 × 10−52.25 × 10−30.99923.295 × 10−3
Table 6. Mean values and standard deviation of the contents of ascorbic acid, flavonoids, anthocyanins, and carotenoids of melon samples subjected to different drying experiments.
ParametersExperiments
50 °C70 °C
Ascorbic acid
(mg/100 g)
Continuous13.89 aA ± 0.7510.0 bB ± 1.0
Inter. tin = 10 min14.57 aA ± 0.4112.2 bA ± 1.6
Inter. tin = 20 min14.91 aA ± 0.8512.22 bA ± 0.49
Inter. tin = 30 min14.8 aA ± 1.712.1 bA ± 1.2
Flavonoids
(mg/100 g)
Continuous8.37 aB ± 0.013.98 bC ± 0.02
Inter. tin = 10 min15.32 aA ± 0.0311.65 bA ± 0.04
Inter. tin = 20 min8.38 aB ± 0.023.95 bC ± 0.02
Inter. tin = 30 min9.39 aB ± 0.076.80 bB ± 0.04
Anthocyanins
(mg/100 g)
Continuous1.23 aB ± 0.020.50 bC ± 0.01
Inter. tin = 10 min2.83 aA ± 0.032.43 aA ± 0.08
Inter. tin = 20 min1.70 aAB ± 0.020.47 bC ± 0.01
Inter. tin = 30 min1.38 aAB ±0.021.12 aB ± 0.01
Carotenoids (μg/100 g)Continuous126.76 bD ± 0.83166.11 aD ± 0.21
Inter. tin = 10 min143.32 bC ± 0.42180.01 aA ± 0.88
Inter. tin = 20 min307.18 aA ± 0.49266.13 bB ± 0.19
Inter. tin = 30 min200.48 aB ± 0.89206.98 aC ± 2.40
Means followed by the same uppercase letter in the columns and lowercase letters in the rows do not differ statistically from each other by the Tukey test at a 5% probability level.
Disclaimer/Publisher’s Note: The statements, opinions and data contained in all publications are solely those of the individual author(s) and contributor(s) and not of MDPI and/or the editor(s). MDPI and/or the editor(s) disclaim responsibility for any injury to people or property resulting from any ideas, methods, instructions or products referred to in the content.