Article

Relationship of Genetic Connectedness Among Flocks with Effective Population Size in Dairy-Oriented Pag Sheep

1
Croatian Agency for Agriculture and Food, Svetošimunska 25, 10000 Zagreb, Croatia
2
Faculty of Agriculture, University of Zagreb, Svetošimunska 25, 10000 Zagreb, Croatia
3
Ministry of Agriculture, Vukovarska 78, 10000 Zagreb, Croatia
*
Author to whom correspondence should be addressed.
Agriculture 2025, 15(5), 474; https://doi.org/10.3390/agriculture15050474
Submission received: 16 January 2025 / Revised: 19 February 2025 / Accepted: 20 February 2025 / Published: 22 February 2025
(This article belongs to the Special Issue Challenges and Opportunities in Genetic Improvement of Livestock)

Abstract

:
Development of any trait-directed selection strategy requires basic knowledge about some important population-specific parameters such as the effective population size N e and genetic connectedness among flocks. The N e , as an indirect measure of genetic variability, is important for the conservation of the genome, while genetic connectedness is necessary for unbiased across-flock genetic evaluation. The average number of full generations (NFG) in the reference population of the Pag sheep under selection for dairy traits was 3.05. The N e estimated from individual coancestry rate C i j in the last generation was 127 animals, and the average prediction error variance of the difference in EBVs between animals belonging to different flocks ( P E V D i , j   ¯ ) was 0.81. Although conceptually different, these two population genetic parameters may be related in the populations under selection. Although it is difficult to prove this hypothesis, we decided to test it by regressing the partial (generational) estimates of N e on P E V D i , j   ¯ . It was estimated that P E V D i , j   ¯ of −0.01 was accompanied by N e of +5.5 animals. The results suggest that strengthening genetic connectedness among flocks in populations might have a positive impact on genetic diversity; however, more research is needed before generalization.

1. Introduction

The Pag sheep breed is a Croatian indigenous dual-purpose breed (milk–meat). Most of the income for flocks of this population comes from milk (cheese) production; therefore, great efforts have been made to increase the milk yield of the ewes through better management and genetics (selection). Since the breed has great traditional, cultural, and gastronomic importance, it is also important to preserve its genetic variability, which is crucial for its long-term survival in unpredictable future environments. Seeking genetic gain for one or more economically important traits, modern breeding programs are usually successful, especially when selection is based on best linear unbiased prediction (BLUP). However, by focusing only on selection gain (by selecting animals with the highest breeding values without considering their additive genetic relationship), populations are inevitably exposed to the loss of genetic diversity, especially in small “closed” populations such as the Pag sheep breed. The best known strategy for balancing between selection gain and genetic erosion is optimum contribution selection (OCS) [1,2].
The population size of the Pag sheep is estimated to be ~30,000 (3627 under selection) [3]. So far, studies on conformation [4], milk and cheese production [5,6], slaughter indicators, and lamb meat quality [7,8] have been carried out in this population. Systematic recording of genealogical and performance data [9] began about two decades ago with the intention of introducing a BLUP-based genetic evaluation system [10]. From the beginning, the evaluation relied on the test–day repeatability animal model. The latest estimates of heritability for daily milk yield, fat content, and protein content obtained by the multi-trait model were 0.32, 0.19, and 0.40, respectively [11].
In order to provide more accurate selection [12,13,14,15] and conservation of the breed, the initial steps toward genomic selection have recently been made. In order to utilize all recent and historical information and to provide breeding values for non-genotyped animals, the method of choice is likely to be the single-step genomic BLUP [16]. However, prior to transition to genomic selection, especially under the framework of OCS, some important population genetic parameters must be examined.
Genetic connectedness among flocks directly determines the success of the BLUP genetic evaluation by reducing bias when comparing estimated breeding values (EBVs) of animals from different flocks [17,18]. Therefore, various methods were developed to examine the degree of connectedness [19,20]. Monitoring the degree of connectedness is useful not only to assess the risk of comparing EBVs among flocks, but also to design schemes for consistent, long-term provision of connectedness [21,22]. Traditionally, the degree of connectedness has been estimated exclusively from pedigrees [19,20,23,24], but more recently, it can also be estimated from genomic SNP markers [25,26]. Due to the complexity of the calculations, the estimation of connectedness has been a challenging task for many breeders and scientists, and is often neglected in many genetic evaluation systems and studies in quantitative genetics. The purposely developed R package for genetic connectedness analysis “GCA” [27] is a great recent contribution in tackling these issues.
The effective population size ( N e ) represents the size of an idealized population (no migration, no selection, constant size, and large enough) that would produce the same genetic variation as the population under consideration [28]. However, it is important to remember that idealized populations are simplifications of reality. Real populations are often influenced by factors such as non-random mating, mutations, gene flow, natural selection, and small population size. These factors can cause the genetic makeup of real populations to deviate from the predictions of idealized models. Although this parameter relies on the theoretical expectations from pedigree [29,30] or genomic data [31], or both [32], it is very useful for obtaining indications about direction and magnitude of change in genetic variability in the population of interest. A variety of methods [30] can be used to estimate N e . The most commonly used approach is the regression of pedigree-based IBD (identical by descent) coefficients of inbreeding or coancestry on time or generation [33,34,35].
Both genetic parameters discussed above are important for breeding activities in the populations under selection, especially if the basic principles of OCS are followed. Neglecting connectedness can cause problems in ranking animals based on their EBVs, and mating closely related animals can lead to severe reduction in genetic variability. Prior to setting a new selection strategy in this population, we aimed to estimate these parameters in Pag sheep to detect gene flow among flocks and overuse of some individuals in reproduction. In addition, since there have been no previous reports on how genetic connectedness between flocks and N e relate to each other, we decided to investigate this relationship. The results of the study provide some basic insights into what to expect from a conservation perspective when connectedness is strengthened or weakened.

2. Materials and Methods

2.1. Data

All data used in the analysis (pedigree, flock allocation, and information on phenotype availability) were provided by the Croatian Ministry of Agriculture. Pedigree comprised 10,451 animals initially belonging to 74 flocks (born from 1981 to 2019). All pedigree data were used for estimation of individual specific genetic parameters such as coefficient of inbreeding and coancestry. However, stringent quality control measures were applied, and only a subset of animals (n = 1446) with more than three fully known generations was retained for subsequent analyses concerning the estimation of effective population size ( N e ) and connectedness between flocks.

2.2. Statistical Analysis

2.2.1. Pedigree Quality

Number of fully traced generations (NFG) represented the number of the earliest ancestral generation with known sire and dam.
Number of maximum known generations (NMG) represented the number of maximum generations traced (whether or not both parents are known).
Number of equivalent generations (NEG) was obtained as the sum of the proportions of known ancestors of an individual over all traced generations, as follows:
i = 1 n j 1 2 g i j ,
where n j is the number of ancestors of individual j, and g i j is the number of generations between individual j and its ancestor i [36]. In this way, 1/2 is added for each known parent, 1/4 for each known grandparent, 1/8 for each known great-grandparent and so on.
Pedigree completeness index (PCI), i.e., the harmonic mean of the pedigree completeness of the parents, was calculated using the following formula:
P C I = 2 C f C m 2 C f + C m ,
with C f and C m being proportions of paternal and maternal ancestors estimated, based on:
C = 1 d i = 1 d a i ,
where a i was the ratio of known to unknown ancestors in each generation and d was the number of generations [37].
Completeness was calculated for individuals and for groups of individuals in each ancestral generation representing the proportion of known ancestors in each generation (Figure 1).
Reference population was set to animals born between 2008 and 2018 with constraint imposed on animals with NFG ≥ 3. The sliding window approach set to 4-year long periods (in accordance with the estimated generation interval) was used to estimate rate of effective population size, rate of connectedness, and relationship between these two variables.

2.2.2. Effective Population Size (Rates)

Effective population size ( N e ) was estimated from the mean rate of increase in coancestry, where the increase in coancestry between any pair of individuals i and j was computed as:
C i j = 1 1 C i j g i + g j 2
where C i j is the kinship between i and j, and g i and g j are the numbers of equivalent complete generations of individuals i and j [35]. The effective size was then estimated as
N e = 1 2 C ¯
The effective population size rate ( N e ) was estimated by regressing N e on generation number. Quality control of the pedigree and estimation N e were conducted with the package “optiSel” [1].

2.2.3. Connectedness Analysis

Genetic connectedness between flocks, as an indirect measure of unbiased comparison of EBVs across flocks [18], was estimated with the “GCA” package [27] under the framework of genetic animal model (pedigree based BLUP). A prediction error variance (PEV) matrix was obtained from mixed model equations by assuming a standard linear mixed model y = Xb + Zu + e, where y, b, u, and e referred to a vector of phenotypes, fixed effects, random additive genetic effects, and residuals, respectively. The X and Z were incidence matrices associating fixed effects (flock) and additive genetic effect (animals) to observations, respectively. The mixed model equation of the linear mixed model was
X X X Z Z X Z Z + K 1 λ b ^ u ^ = X y Z y ,
where K was a relationship matrix and λ = σ e 2 σ u 2 was the ratio of residual and additive genetic variance. The observations (phenotypes) were simulated with heritability set to 0.6. The inverse of the coefficient matrix was given by
C 1 = X X X Z Z X Z Z + K 1 λ 1 = C 11 C 12 C 21 C 22
Then, the PEV of u was derived as:
P E V u = V a r u ^ u = V a r u | u ^ = ( Z M Z + K 1 λ ) 1 σ e 2 = C 22 σ e 2
where M = I X ( X X ) X was the absorption (projection) matrix for fixed effects. P E V u = V a r u | u ^ can be viewed as the posterior variance of u . The matrix C 22 was the sub-matrix (right quadrant) of the inverse of coefficient matrix. The following connectedness statistics were obtained and examined:
PEVD—prediction error variance of differences in EBVs [23]. The prediction error variance (PEV) of the EBVs was obtained from the diagonal elements of the inverse of the coefficient matrix ( C 1 ) , and prediction error covariance ( P E C i j ) from the off-diagonal elements. Using this method, the pairwise PEVDs between two individuals i and j were calculated as shown below:
P E V D ( u ^ i - u ^ j ) = P E V u ^ i + P E V u ^ j 2 P E C u ^ i , u ^ j = C i i 22 C i j 22 C j i 22 C j j 22 σ e 2
and thereafter aggregated and summarized at the unit (flock) level as follows:
P E V D i j = 1 n i n j   P E V D i j ,
where and n i and n j were the total number of records in flocks i and j, respectively; and P E V D i j was the sum of all pairwise differences between the two flocks.
CD—coefficient of determination [20]. This statistic was obtained by scaling the inverse of the coefficient matrix with corresponding coefficients from the relationship matrix. CD between individuals i and j was calculated as follows:
C D i j = 1 λ C i i 22 + C j j 22 2 C i j 22 K i i + K j j 2 K i j ,
where K i i and K j j are the ith and jth diagonal elements of K, and K i j is the relationship between the ith and jth animal. The individual average CD was derived from the average of CD between individuals across two units, as follows:
C D i j = 1 λ * 1 n i n j   C i i 22 + C j j 22 2 C i j 22 1 n i n j ( K i i + K j j 2 K i j )   = 1 P E V D i j σ u 2 ( K i i + K j j 2 K i j ) .

3. Results

3.1. Quality Control of the Pedigree and Formation of the Reference Population

Rams and ewes had very similar completeness of the pedigree, especially in the reference population (Figure 1). The average NEG, NFG, NMG, and PCI were 1.36, 0.89, 2.26, and 0.29 for the whole population, and 4.12, 3.05, 6.39, and 0.79 for the reference population, respectively (Table 1).
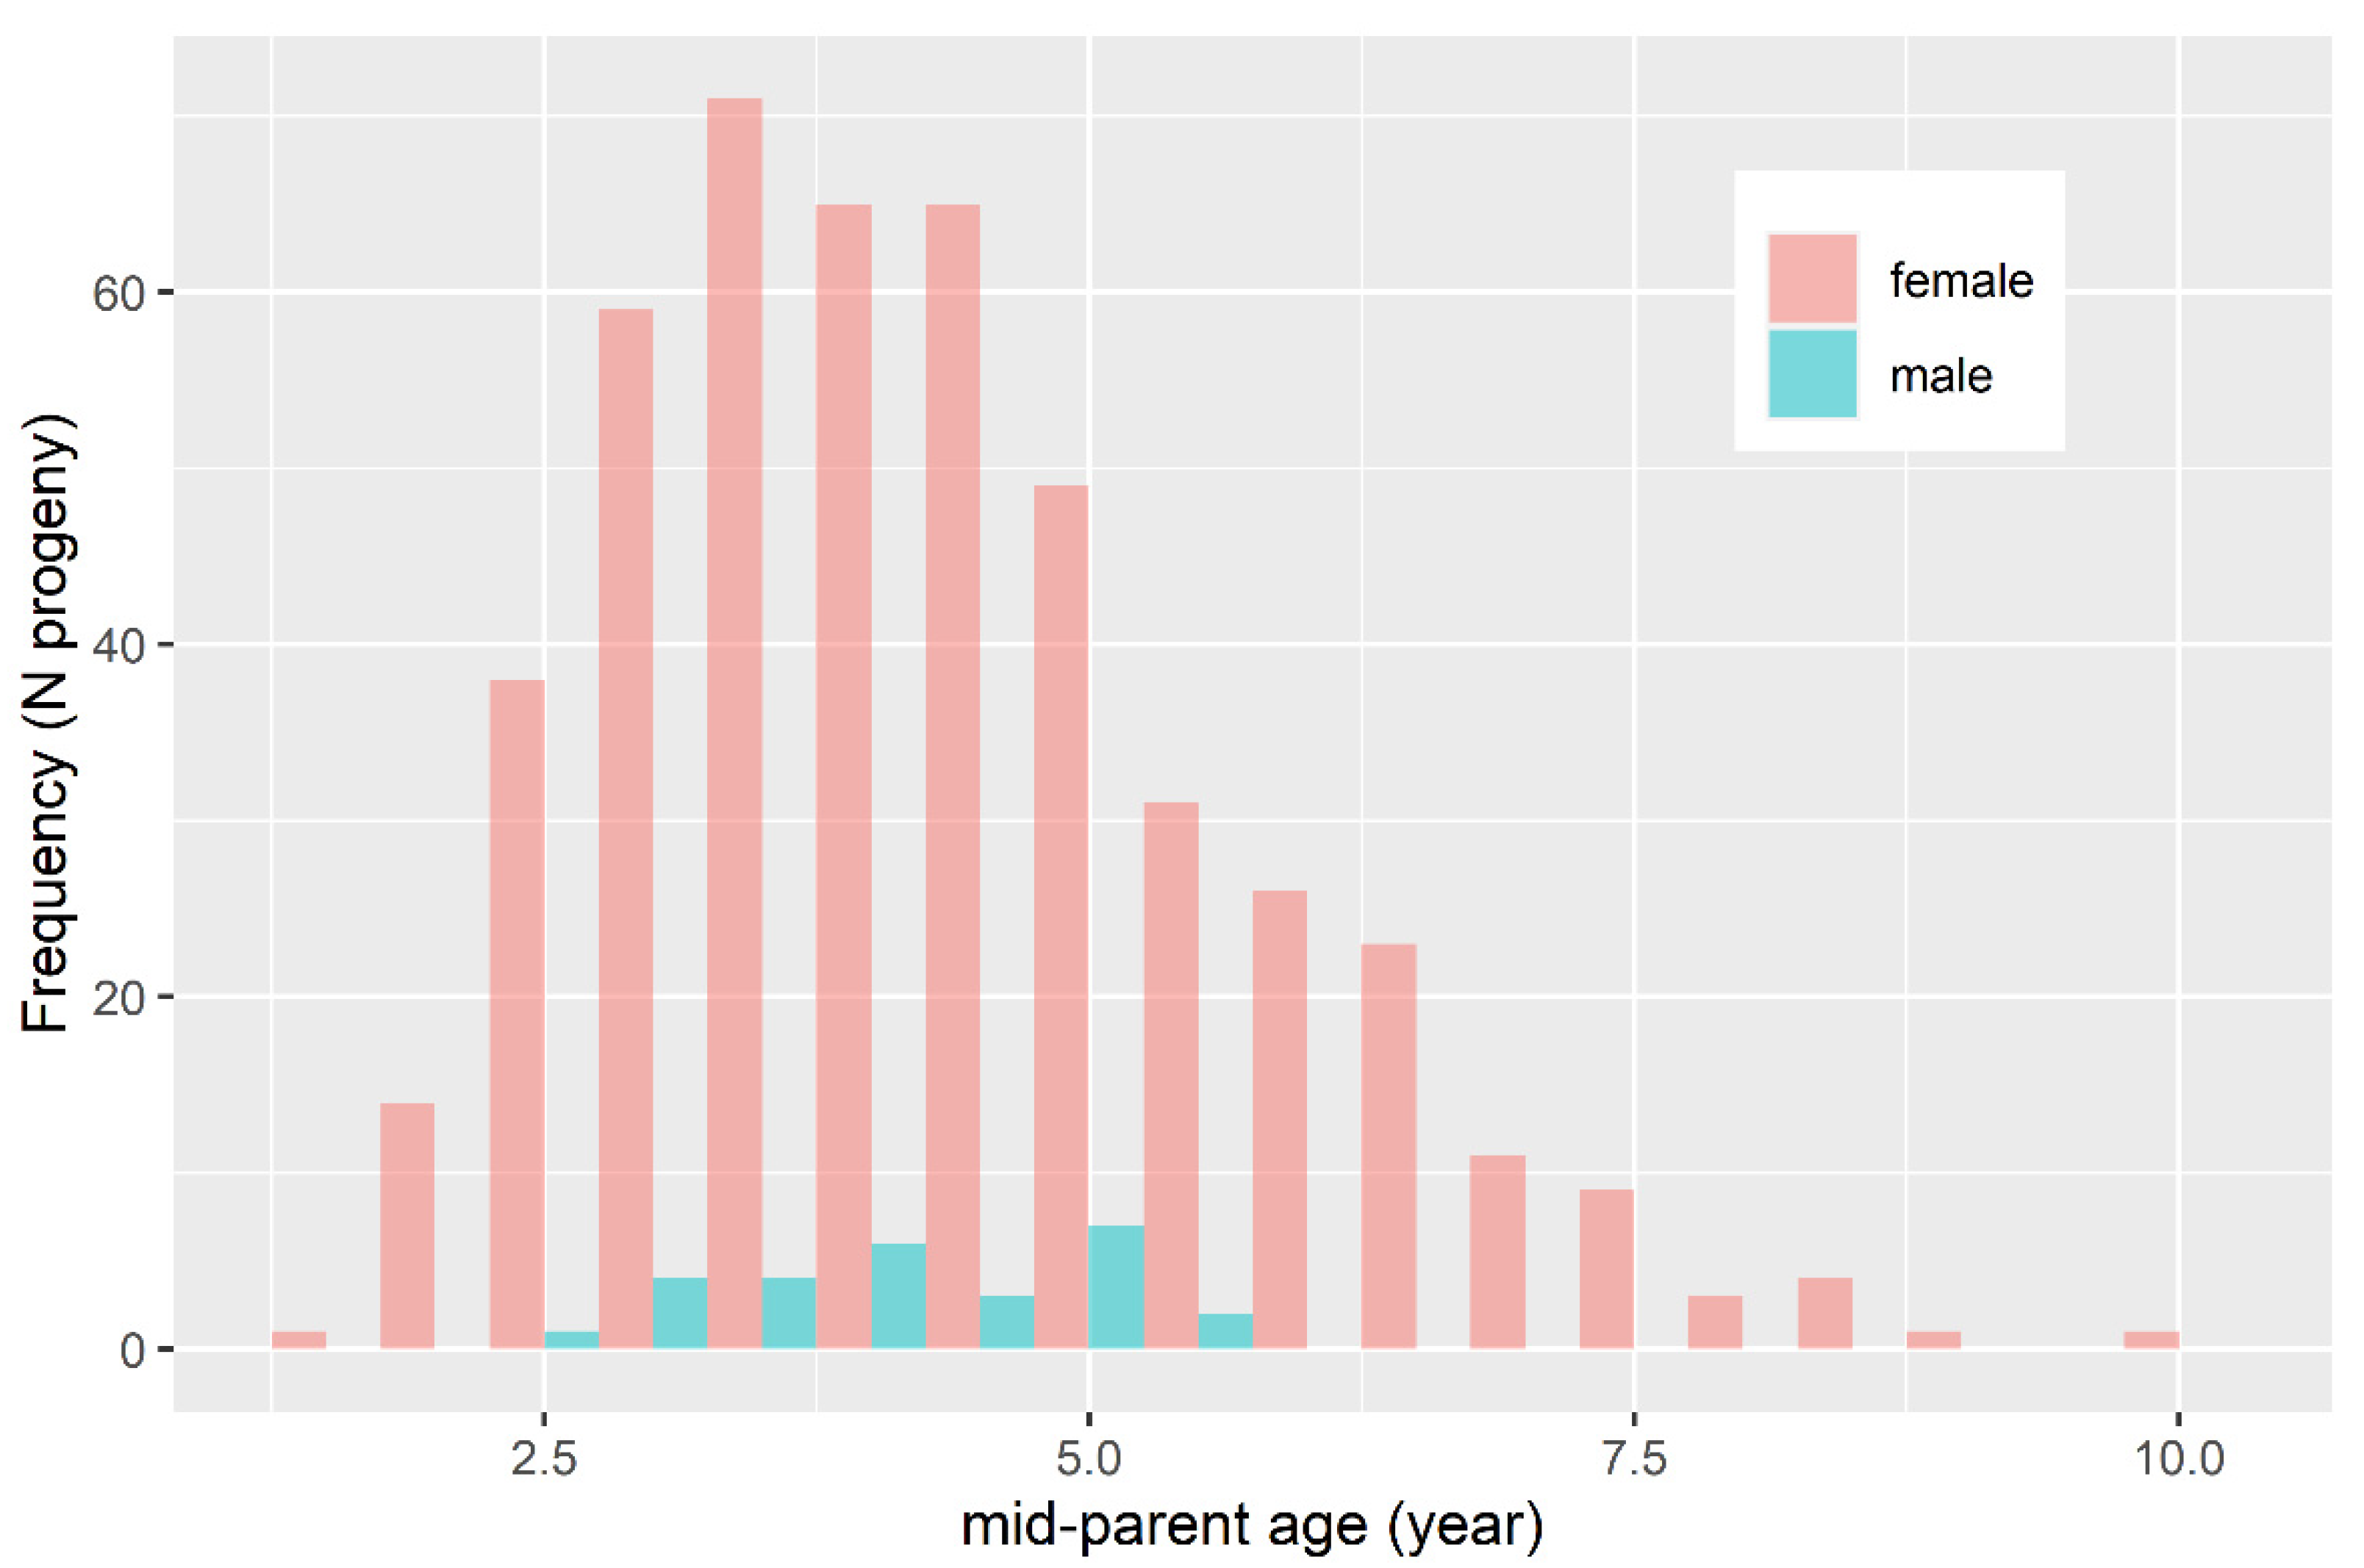
The “bell-shaped” distribution of mid-parent age in the reference population is presented in Figure 2. The overall generation interval (all four paths included) was estimated to be 4.34 years. This information was used in further analysis to create 4-year spanning generations in the estimation of effective population size rate ( N e ).

3.2. Effective Population Size

The estimated N e obtained from the individual coancestry rate C i j ranged from 52 ( G I 8 ) to 127 ( G I 1 ) animals. The positive rate of the effective population size ( N e ) was estimated at ~11 animals per year (sliding window). The N e / N r e f also had a positive rate, additionally proving the positive trend of N e due to decrease in C ¯ (not due to change in the “census” population size N r e f ) (Table 2).

3.3. Connectedness

3.3.1. Prediction Error Variance of Differences in EBVs Between Animals Belonging to Different Flocks (PEVD)

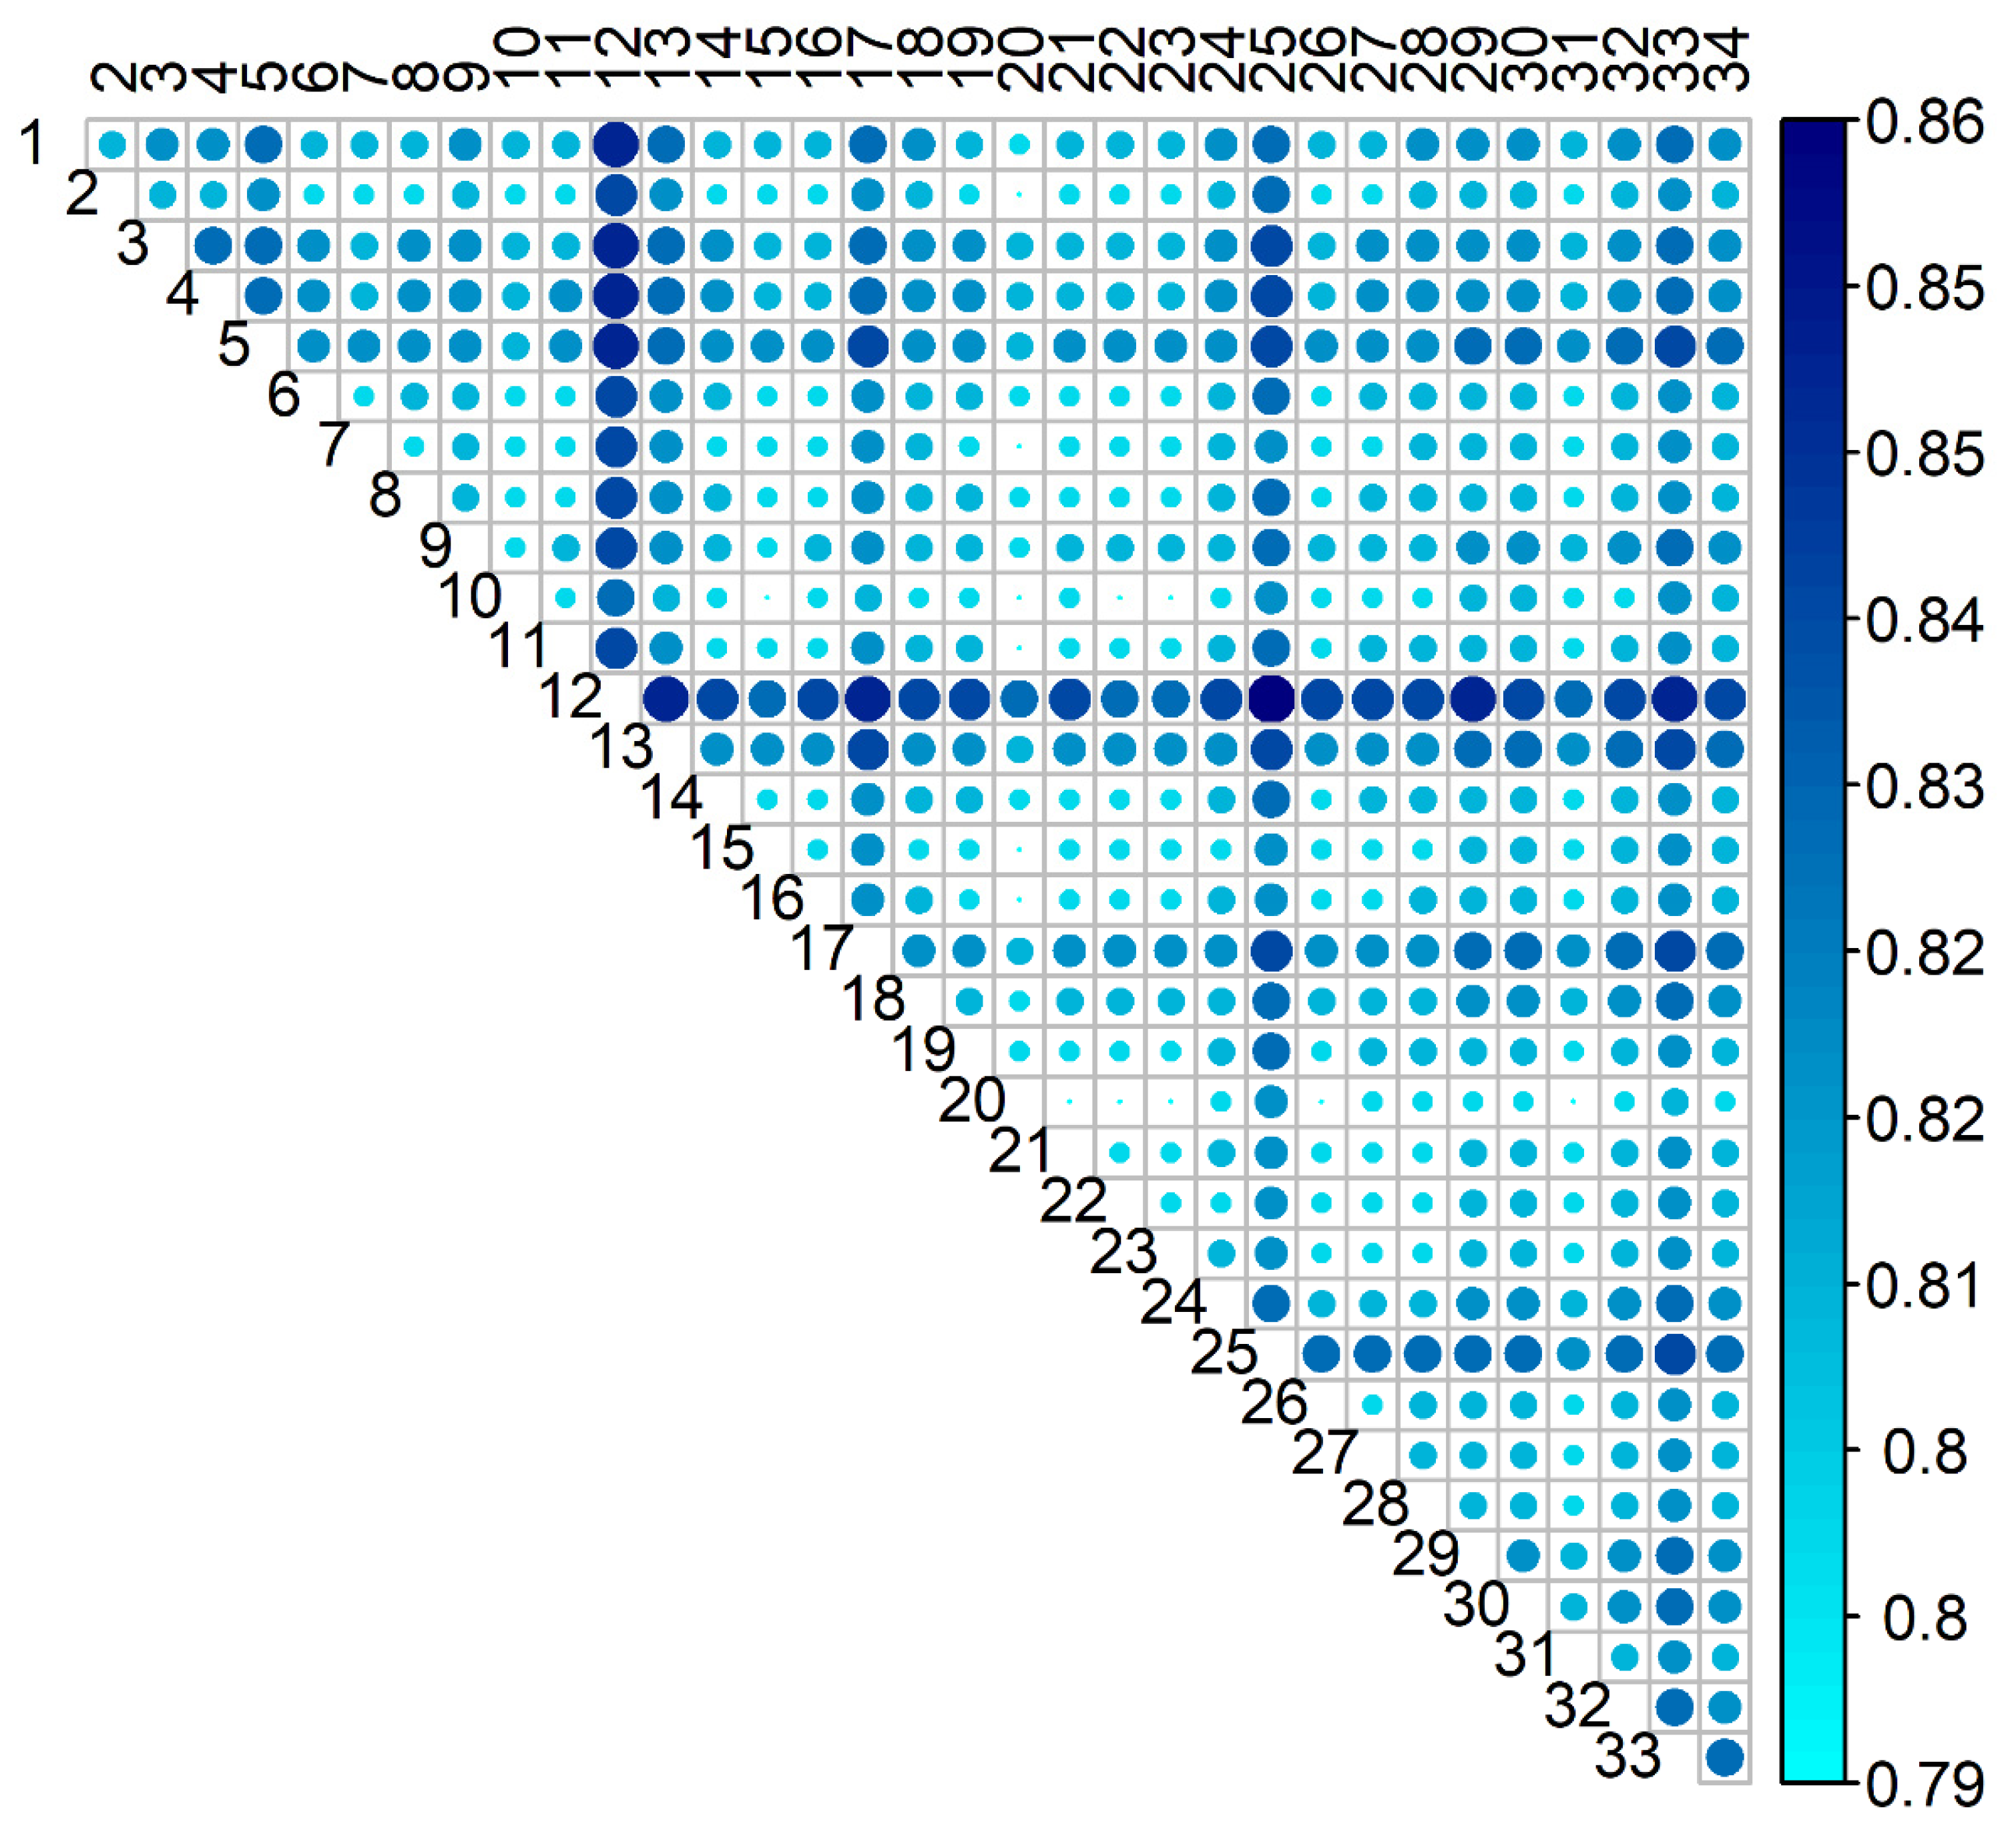
Estimates of genetic connectedness among flocks obtained with the prediction error variance of the difference in EBVs between animals belonging to different flocks ( P E V D i , j ) are presented in Figure 3. Only flocks currently included in the national selection program were plotted in the figure, but more flocks were included in the analysis as they contribute to formation of indirect genetic links among flocks of interest. The PEVD statistics ranged from 0.77 to 0.86, with lower values indicating more connectedness between flocks. The overall P E V D i , j ¯ was 0.81. Flock 20 was the most ( P E V D 20 , j ¯ = 0.80), and flock 12 the least, connected ( P E V D 12 , j ¯ = 0.84) to the rest of the population.

3.3.2. Coefficient of Determination of the Difference Between Predicted Breeding Values (CD)

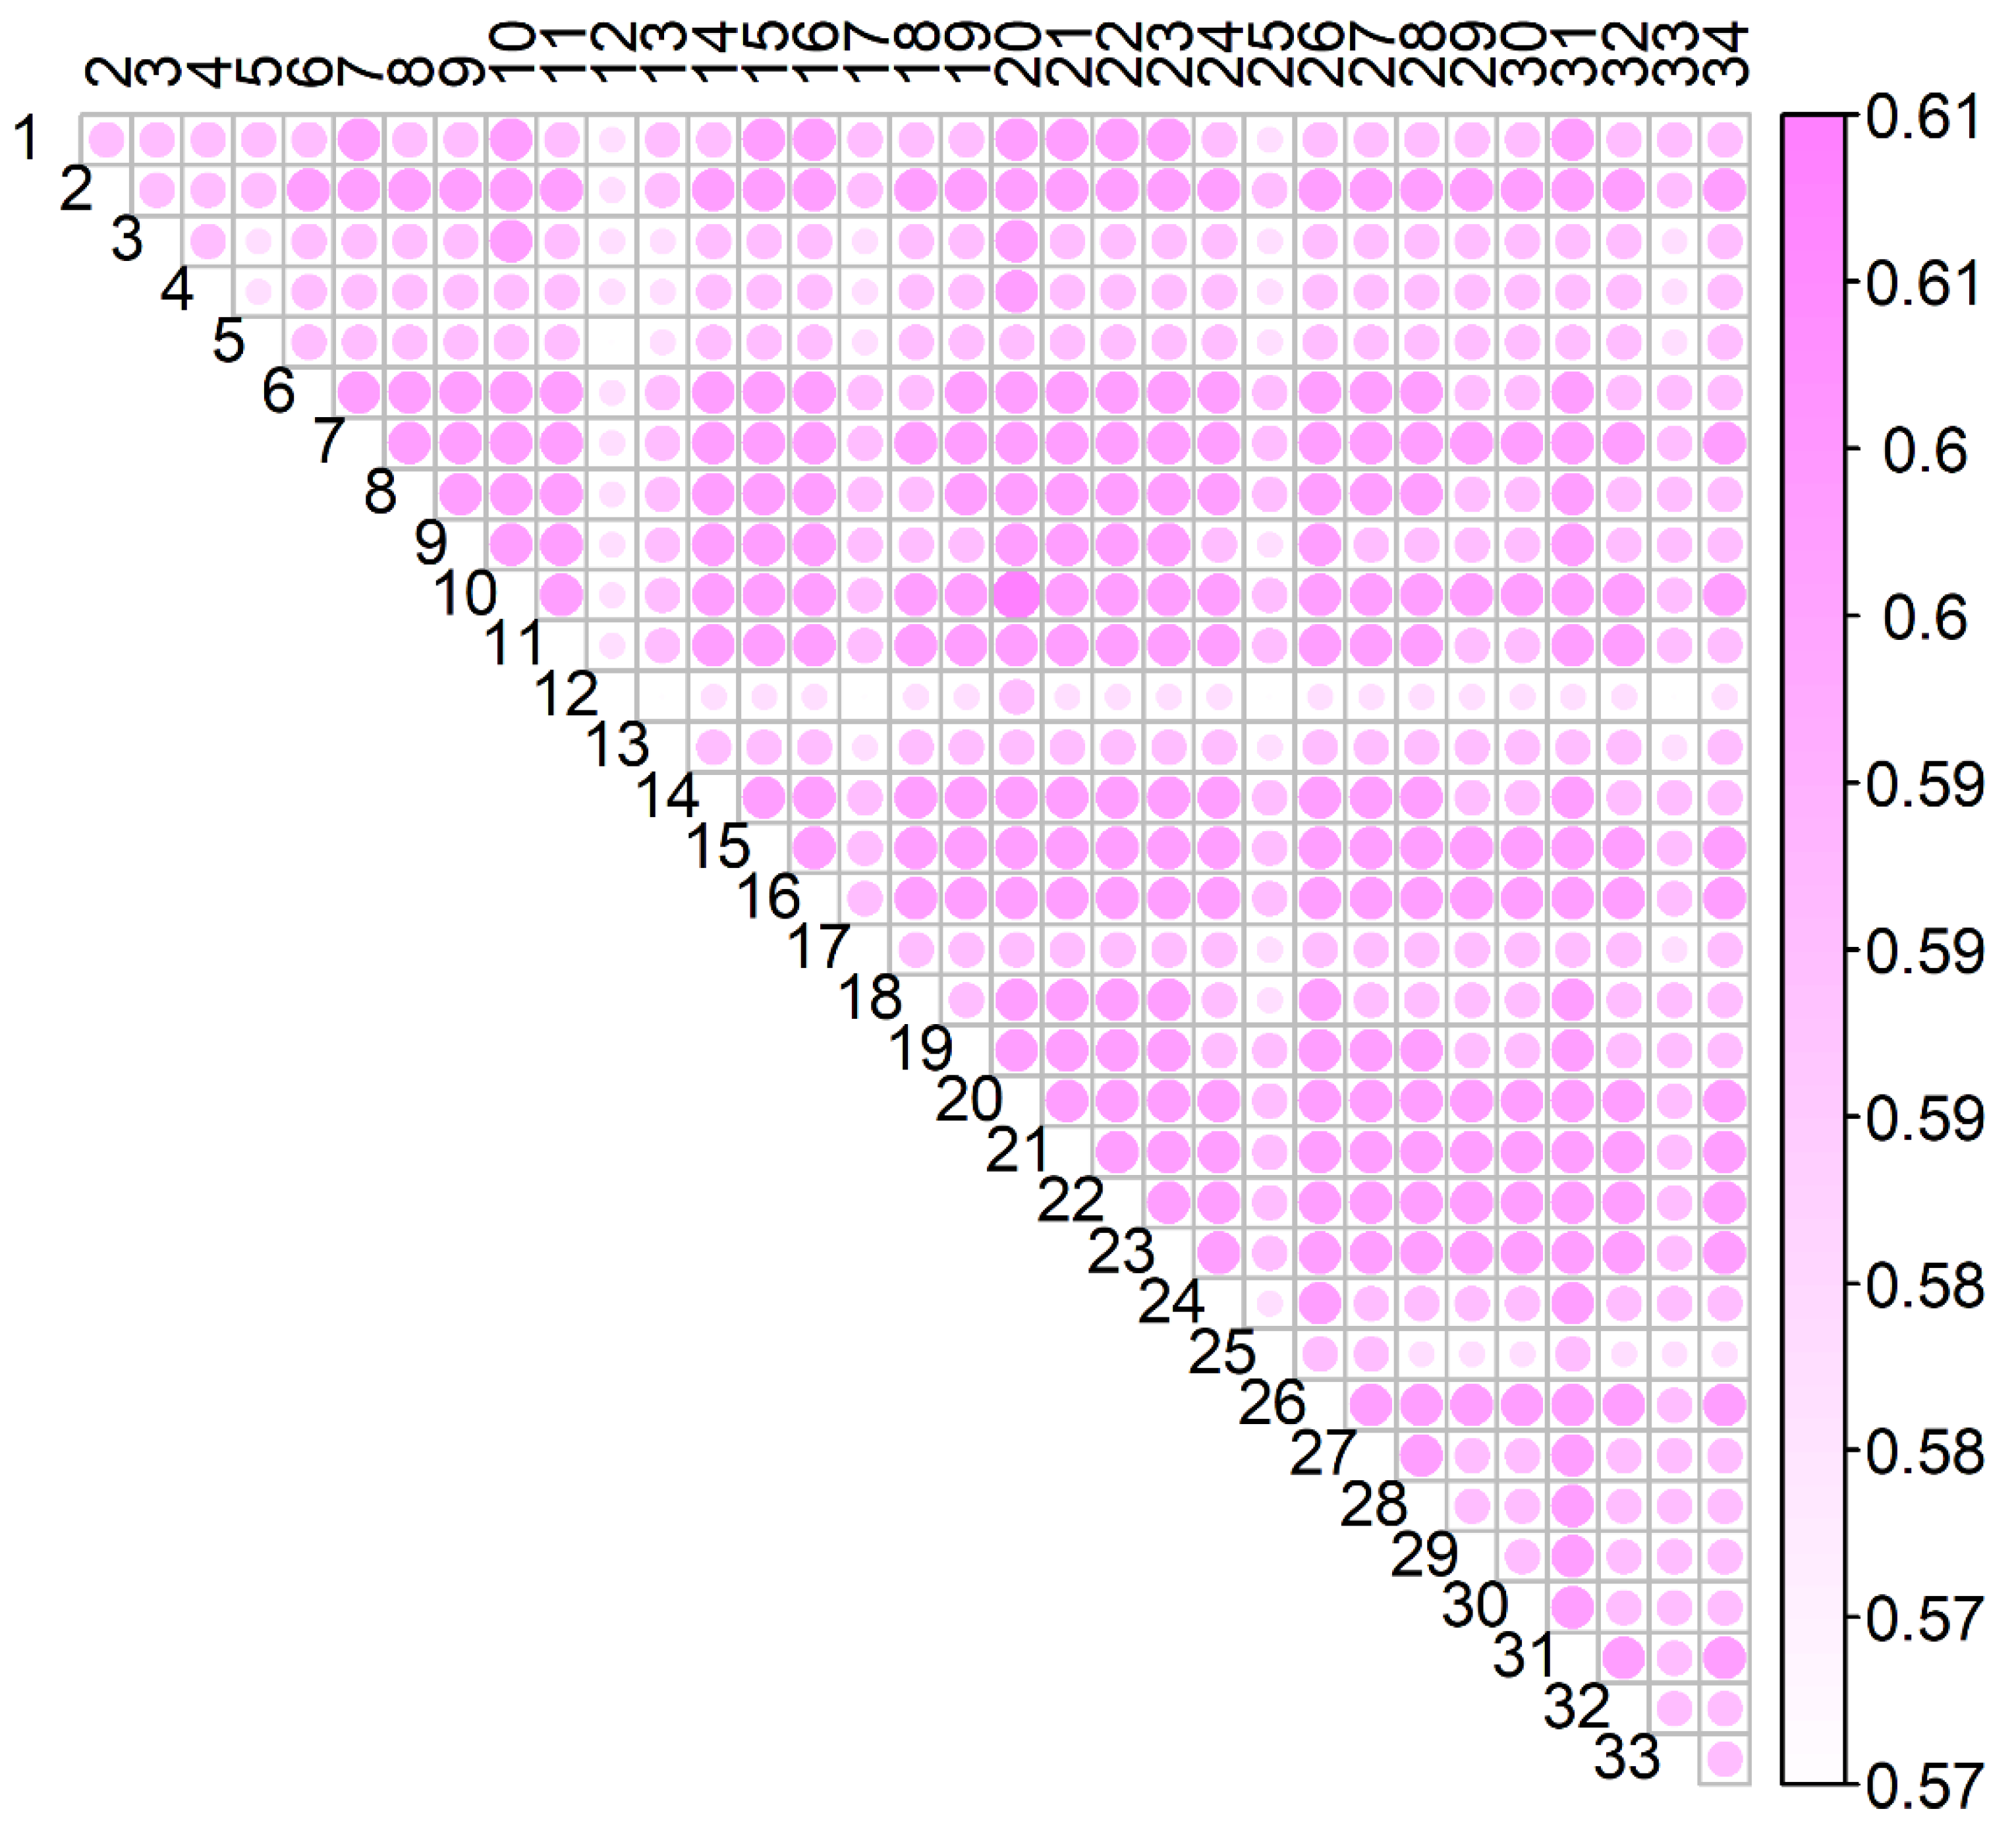
The CD statistics ranged from 0.57 to 0.61, with lower values indicating less-connected flocks. The overall C D i , j ¯ was 0.59. As determined by the PEVD statistics, flock 20 was the most connected ( C D 20 , j ¯ = 0.61) and flock 12 was the least connected ( C D 12 , j ¯ = 0.56) to the rest of the population (flocks). Correlation between PEVD and CD statistics was practically perfect ( r P E V D ,   C D = 1 ), indicating that these two statistics assess connectedness equally (Figure 4).

3.4. Relationship Between Connectedness Rate and Effective Population Size Rate

The aim of this part of the study was to examine if rates of connectedness and effective population size were related to some extent. After being convinced in equity of PEVD and CD statistics in assessing connectedness, only the PEVD statistic was used for this purpose. Partial connectedness per generation in the reference population ( P E V D i , j   ( 2008 : 2018 ) ¯ ) was obtained by splitting the reference population in the same manner as in the analysis of N e (“sliding window” approach). Regression of N e   ( 2008 2011 , , 2015 2018 ) on P E V D i , j   ( 2008 2011 , ,   2015 2018 ) ¯ revealed a negative relationship between P E V D i , j ¯ and N e . It was estimated that a 0.01 decrease in P E V D i , j   ¯ increased N e by 5.5 animals on average. Since smaller values of P E V D i , j   ¯ represent better connectedness, this result actually implies a positive relationship between connectedness rate and effective population size rate. The estimated relationship was on the edge of conventionally accepted statistical significance (p = 0.054). Due to discrepancies in number of animals per generation used in the estimation of connectedness rate and effective population size rate, this result is not completely conclusive and only represents preliminary indication on this issue. Although it seems logical, caution is needed in inferring that this result (relationship) holds for other populations of domestic animals, especially those subjected to strong selection pressure via usage of artificial insemination (small number of superior sires). Generalization of this relationship still needs to be proven, even in this population, preferably by including genomic data of the rates of connectedness and effective population size in the analysis.

4. Discussion

Since its conceptualization by Wright [28], N e has been one of the key parameters in population and quantitative genetics. Since the rate of coancestry and, consequently, the estimates of N e and N e obtained from genealogical records are accurate insofar as the quality of the pedigree, a thorough control of the pedigree completeness had to be carried out in order to establish a reference population of animals with sufficient ancestral information. “Poor” completeness of the overall pedigree was in accordance with our expectations, since the recording of genealogical data and performance records in this population started only two decades ago. The main reason for low-numbered quality parameters was the very old animals with no prior ancestral information, but these were discarded from the reference population used in the estimation of population-specific genetic parameters such as C , N e , and N e . The reference population comprised animals born from 2008 onwards, with the NEG and NFG averaged at 4.1 and 3.0 generations, respectively. The GI estimated in this population (4.34 years) was consistent with the GI found in Spanish and French dairy sheep breeds, as reported by Granado-Tajada et al. [31] and Rodríguez-Ramilo et al. [38], respectively. However, it was notably higher than the average GI reported for the majority of meat and multi-purpose breeds globally [39,40,41].
Thinking of the N e as the size of a population that would experience the same rate of genetic drift as in the observed population, we had no prior expectations about the true value of N e . In the most recent 4-year period, the N e was estimated at 127 animals, representing 9% of the census population. In the most distant period, these numbers were 52 and 3%, respectively. The effective population size rate ( N e ) was estimated at ~11 animals per year. This value exceeded our expectations given prior observations of this parameter in the more inbred Istrian sheep population [42]. After double checking and looking for additional information from the “field”, it has been confirmed that this positive rate has been a resultant of breeders’ awareness about potentially negative impacts of inbreeding, i.e., their actions to avoid close inbreeding in their flocks. Given our advocacy for inbreeding avoidance to prevent genetic erosion, we are encouraged by the observation that many breeders appear to be incorporating basic optimal contribution selection (OCS) principles into their mating plans. The observed adherence to basic optimal contribution selection (OCS) principles in mating plans by some breeders promises to contribute positively to minimizing inbreeding and mitigating genetic erosion within the breed.
Even though the breeders are regularly (1) provided with the EBVs for several dairy traits, (2) advised how to select replacement animals to improve a particular trait, and (3) advised how to mate animals to avoid inbreeding, they are not obliged in any way to follow the recommendations, and practically have full autonomy in their selection decisions. However, the results imply that breeders take care of relationships among the animals they mate. By carefully planning the selection of replacements (rams), either from their own flocks or purchasing them from other, usually nearby, flocks they reduced the level of inbreeding in the last couple of years. However, with OCS, genetic contributions of selection candidates to the next generation could be optimized by balancing between maximizing genetic gain and restricting mating of closely related animals. We could debate here whether such estimated N e truly reflects its core definition and whether some other statistics represent a better choice. The observed increase in N e warrants some serious considerations. While theoretically, in a closed population without immigration or strong mutation occurrences, N e should not increase and is more likely to decrease due to genetic drift and inbreeding, the pedigree-based methodology could allow such counterintuitive results. Namely, pedigree methods for estimation of N e rely on coancestry or inbreeding rates, which can undoubtedly produce results that appear illogical. In this case, it might be more accurate to suggest that the avoidance of closely related animals led to a lower inbreeding rate rather than a true increase in N e . This perceived increase may be an overestimation of the true N e in the recent period, and vice versa, underestimation in distant periods. A contributing factor for lower N e in distant periods might be to incomplete pedigree records, but we tried to minimize this by carefully constructing the reference population. Since missing ancestral data can lead to an underestimation of past diversity and population size, the apparent increase in N e might reflect improvements in pedigree completeness and data quality over time, rather than a real biological change in the population’s effective size. While pedigree-based methods have been useful, it seems that genomic approaches will be essential for more accurate and reliable estimation of population genetic parameters.
The second part of the study was devoted to the analysis of connectedness between flocks. In any between-flock genetic evaluation system, it would be ideal if breeders could compare genetic merits of all individuals in the population, regardless of their belonging to different contemporary groups. This is often problematic in many breeding programs for sheep due to little or no genetic connectedness between contemporary groups (flocks). Hypothetically speaking, this issue could be neglected only under the belief that genetic relationships between animals completely describe phenotypic variability of the population in question, which is never the case (the expression of the phenotypes of complex traits is highly affected by environmental effects). The repercussions of disconnected flocks in a between-flock BLUP genetic evaluation system, and the question of how to strengthen connectedness have been discussed in several previous studies [21,22,43,44], so our intention here was not to address the same question. Our hypothetical question within this study was “Can genetic conservation programs collaterally benefit from actions taken to genetically connect flocks for the purposes of more accurate genetic evaluation?” Even though the connectedness was examined in this study by two statistics, due to their high correlation, only the PEVD was used to answer the above question. Before proceeding to the main finding of the study, we would like to address the problem of “benchmarking” a pairwised connectedness based on PEVD and the CD statistics that present the most accurate measures of connectedness. Although being useful in revealing which flocks are more connected in the population under consideration, they do not quantify the absolute bias in ranking EBVs (animals) from different flocks. The results obtained pertaining to connectedness analysis were therefore inconclusive in terms of bias of genetic evaluation in this population, but fortunately, we could still use them to answer our basic question by considering only their estimated rates (pairwise change in connectedness and N e per generation). Regressing N e ( i ) on P E V D i , j ¯ ( i ) (i = 1.8) revealed a positive relationship between these two variables. However, the estimated slope of the above regression differed insignificantly from 0 (p = 0.054). The estimated increase of 5.5 animals ( N e ) for every 0.01 decrease in P E V D i , j ¯ in this population could have occurred by chance or due to an unknown temporal factor, and, to avoid any misinterpretation, we detected here only relationship, not causality. Even though we tried to keep the same animals included in the estimation of N e ( i ) and P E V D i , j ¯ ( i ) , some discrepancies still occurred due to computational reasons which could have compromised the results to some extent. However, most of the information overlapped and probably provided enough conclusive evidence. In such a constellation of the data, and according to our results, we can only hypothesize that exchange of sires among flocks (measured in the connectedness statistics) reduced the chances of breeding genetically related animals, which led to a lower rate of inbreeding. In order to get more straightforward answers to our scientific question, the best option would probably be to conduct a specially designed simulation study. We would like to emphasize that this result was obtained in a population under natural service and moderate selection pressure. Populations subjected to strong selection pressure through artificial insemination could “behave” differently on this issue, but this remains to be answered. Based on these results, we can still only hypothesize that strengthening connectedness could be beneficial from a conservation point of view, but generalization of this relationship remains to be proven in some other livestock populations or via simulation.
Estimation of connectedness is challenging, but novel solutions such as the GCA package [27] should ease this task, so we hereby encourage scientists and breeders to conduct these analyses in their populations. Also, we hereby advocate the need to strengthen connectedness in any population subjected to BLUP genetic evaluation, and the best-known schemes purposely designed to do so in the populations under natural service are the “circle rams” [21] and the “sire referencing scheme” [22]. According to some claims related to the benefits of genomic selection, usage of SNP marker information in genetic evaluation can compensate for poor connectedness, but this has not been scientifically proven yet, especially under the framework of the most-used methodology in contemporary breeding programs (single-step genomic BLUP). Transition to genomic selection in this population, which will take place in the very near future, will probably provide more answers on this issue.

5. Conclusions

The results of the study show that breeders of the Pag sheep breed exchange breeding animals (rams) between the flocks and avoid close inbreeding in their flocks, but to take full advantage of modern science in order to provide selection gain on milk yield with minimal loss of genetic variability, the implementation of systematic OCS is recommended. These are the first scientifically based results on the relationship between rates of connectedness and effective population size in animal populations. According to the present results, strengthening genetic connectedness has a positive impact on the conservation of genetic variability in populations under selection. However, it remains unclear if this phenomenon is being limited to the initial stages of ram replacement, and potentially reversing later. Therefore, for generalization of the results, additional research is needed, preferably on simulated data, in other sheep populations, and under the framework of genomic selection.

Author Contributions

Conceptualization and methodology, A.K.; software, A.K.; validation, J.R.; formal analysis, A.K. and M.Š.; investigation, A.K., V.D., J.R., B.M., Z.B. and M.Š.; data curation, A.K. and M.Š.; writing—original draft preparation, A.K. and M.Š.; writing—review and editing, A.K., M.Š., V.D., B.M., Z.B. and J.R.; visualization, A.K., M.Š. and V.D.; supervision, J.R. and M.Š.; project administration, J.R.; and funding acquisition, J.R. All authors have read and agreed to the published version of the manuscript.

Funding

This research was funded by the Croatian Science Foundation (Genomic characterization, preservation, and optimum contribution selection of Croatian dairy sheep, OPTI-SHEEP) under grant number IP-2019-04-3559. The publication was supported financially by the Croatian Agency for Agriculture and Food.

Institutional Review Board Statement

Not applicable.

Data Availability Statement

The data presented in this study are available on request from the corresponding author. The data are not publicly available, to preserve privacy of the data.

Acknowledgments

The authors appreciate support from Pag sheep breeders, the Croatian Agency for Agriculture and Food, and the Ministry of Agriculture. The authors gratefully acknowledge grants provided by the Croatian Science Foundation.

Conflicts of Interest

The authors declare no conflicts of interest. The funders had no role in the design of the study; in the collection, analyses, or interpretation of data; in the writing of the manuscript, or in the decision to publish the results.

References

  1. Wellmann, R. OptiSel: Optimum Contribution Selection and Population Genetics; Version 2.0.5; ACM Digital Library: New York, NY, USA, 2021. [Google Scholar]
  2. Woolliams, J.A.; Berg, P.; Dagnachew, B.S.; Meuwissen, T.H.E. Genetic Contributions and Their Optimization. J. Anim. Breed. Genet. 2015, 132, 89–99. [Google Scholar] [CrossRef] [PubMed]
  3. CAAF—Croatian Agency for Agriculture and Food. Annual Report for Year 2023; CAAF: Osijek, Croatia, 2024. [Google Scholar]
  4. Pavić, V.; Mioč, B.; Barać, Z.; Vnučec, I.; Sušić, V.; Antunac, N.; Samaržija, D. Vanjština paške ovce. Stočarstvo 2005, 59, 83–90. [Google Scholar]
  5. Antunac, N.; Hudik, S.; Mikulec, N.; Maletić, M.; Horvat, I.; Radeljević, B.; Havranek, J. Proizvodnja i kemijski sastav istarske i paške skute. Mljekarstvo 2011, 61, 226–233. [Google Scholar]
  6. Barać, Z.; Mioč, B.; Špehar, M. Utjecaj stadija i redoslijeda laktacije, sezone janjenja i stada na udjele mliječne masti i bjelančevina u mlijeku paške ovce. Mljekarstvo 2013, 63, 81–90. [Google Scholar]
  7. Mioč, B.; Držaić, V.; Vnučec, I.; Barać, Z.; Prpić, Z.; Pavić, V. Utjecaj spola na klaoničke pokazatelje paške janjadi. Stočarstvo 2012, 66, 95–106. [Google Scholar]
  8. Vnučec, I.; Držaić, V.; Mioč, B.; Prpić, Z.; Antunović, Z.; Kegalj, A. Effect of Sex on Meat Chemical Composition and Fatty Acid Composition in Suckling Pag Sheep Lambs. Vet. Arhiv 2016, 86, 217–227. [Google Scholar]
  9. ICAR—International Committee for Animal Recording. Section 16. In Guidelines for Performance Recording in Dairy Sheep and Dairy Goats; ICAR: Utrecht, The Netherlands, 2018. [Google Scholar]
  10. CAAF (Croatian Agency for Agriculture and Food). Annual Report for Year 2019; Croatian Agency for Agriculture and Food: Osijek, Croatia, 2020. [Google Scholar]
  11. Špehar, M.; Mulc, D.; Barać, Z.; Mioč, B.; Kasap, A. Estimation of Genetic Parameters for Dairy Traits in Pag Sheep with Single and Multi-Trait Test–Day Models. Small Rumin. Res. 2019, 183, 106029. [Google Scholar] [CrossRef]
  12. Usai, M.G.; Salaris, S.; Casu, S.; Sechi, T.; Miari, S.; Carta, P.; Carta, A. Feasibility of Genomic Predictions of Sarda Breed Rams Using a Female Reference Population. In Proceedings of the 11th World Congress on Genetics Applied to Livestock Production, Auckland, New Zealand, 7 February 2018. [Google Scholar]
  13. Cesarani, A.; Gaspa, G.; Correddu, F.; Cellesi, M.; Dimauro, C.; Macciotta, N.P.P. Genomic Selection of Milk Fatty Acid Composition in Sarda Dairy Sheep: Effect of Different Phenotypes and Relationship Matrices on Heritability and Breeding Value Accuracy. J. Dairy Sci. 2019, 102, 3189–3203. [Google Scholar] [CrossRef] [PubMed]
  14. Baloche, G.; Legarra, A.; Sallé, G.; Larroque, H.; Astruc, J.-M.; Robert-Granié, C.; Barillet, F. Assessment of Accuracy of Genomic Prediction for French Lacaune Dairy Sheep. J. Dairy Sci. 2014, 97, 1107–1116. [Google Scholar] [CrossRef]
  15. Legarra, A.; Baloche, G.; Barillet, F.; Astruc, J.M.; Soulas, C.; Aguerre, X.; Arrese, F.; Mintegi, L.; Lasarte, M.; Maeztu, F.; et al. Within- and across-Breed Genomic Predictions and Genomic Relationships for Western Pyrenees Dairy Sheep Breeds Latxa, Manech, and Basco-Béarnaise. J. Dairy Sci. 2014, 97, 3200–3212. [Google Scholar] [CrossRef] [PubMed]
  16. Legarra, A.; Aguilar, I.; Misztal, I. A Relationship Matrix Including Full Pedigree and Genomic Information. J. Dairy Sci. 2009, 92, 4656–4663. [Google Scholar] [CrossRef] [PubMed]
  17. Foulley, J.L.; Schaeffer, L.R.; Song, H.; Wilton, J.W. Progeny Group Size In An Organized Progeny Test Program of Ai Beef Bulls Using Reference Sires. Can. J. Anim. Sci. 1983, 63, 17–26. [Google Scholar] [CrossRef]
  18. Foulley, J.L.; Bouix, J.; Goffinet, B.; Elsen, J.M. Connectedness in Genetic Evaluation. In Advances in Statistical Methods for Genetic Improvement of Livestock; Advanced Series in Agricultural Sciences; Springer: Berlin/Heidelberg, Germany, 1990; Volume 18. [Google Scholar]
  19. Foulley, J.L.; Hanocq, E.; Boichard, D. A Criterion for Measuring the Degree of Connectedness in Linear Models of Genetic Evaluation. Genet. Sel. Evol. 1992, 24, 315–330. [Google Scholar] [CrossRef]
  20. Laloë, D. Precision and Information in Linear Models of Genetic Evaluation. Genet. Sel. Evol. 1993, 25, 557–576. [Google Scholar] [CrossRef]
  21. Eikje, L.S.; Ådnøy, T.; Klemetsdal, G. The Norwegian Sheep Breeding Scheme: Description, Genetic and Phenotypic Change. Animal 2008, 2, 167–176. [Google Scholar] [CrossRef] [PubMed]
  22. Simm, G.; Lewis, R.M.; Collins, J.E.; Nieuwhof, G.J. Use of Sire Referencing Schemes to Select for Improved Carcass Composition in Sheep. J. Anim. Sci. 2001, 79, E255. [Google Scholar] [CrossRef]
  23. Kennedy, B.W.; Trus, D. Considerations on Genetic Connectedness between Management Units under an Animal-Model. J. Anim. Sci. 1993, 71, 2341–2352. [Google Scholar] [CrossRef] [PubMed]
  24. Lewis, R.M.; Crump, R.E.; Simm, R.E.; Thompson, R. Assessing Connectedness in Across-Flock Genetic Evaluations. Proc. Br. Soc. Anim. Sci. 1999, 1999, 121. [Google Scholar] [CrossRef]
  25. Yu, H.; Spangler, M.L.; Lewis, R.M.; Morota, G. Genomic Relatedness Strengthens Genetic Connectedness Across Management Units. G3 2017, 7, 3543–3556. [Google Scholar] [CrossRef]
  26. Yu, H.; Spangler, M.L.; Lewis, R.M.; Morota, G. Do Stronger Measures of Genomic Connectedness Enhance Prediction Accuracies across Management Units? J. Anim. Sci. 2018, 28, 4490–4500. [Google Scholar] [CrossRef]
  27. Yu, H.; Morota, G. GCA: An R Package for Genetic Connectedness Analysis Using Pedigree and Genomic Data. BMC Genom. 2021, 22, 119. [Google Scholar] [CrossRef] [PubMed]
  28. Wright, S. Evolution in Mendelian Populations. Genetics 1931, 16, 97–159. [Google Scholar] [CrossRef]
  29. Leroy, G.; Gicquel, E.; Boettcher, P.; Besbes, B.; Furre, S.; Fernandez, J.; Danchin-Burge, C.; Alnahhas, N.; Baumung, R. Coancestry Rate’s Estimate of Effective Population Size for Genetic Variability Monitoring. Conserv. Genet. Resour. 2020, 12, 275–283. [Google Scholar] [CrossRef]
  30. Leroy, G.; Mary-Huard, T.; Verrier, E.; Danvy, S.; Charvolin, E.; Danchin-Burge, C. Methods to Estimate Effective Population Size Using Pedigree Data: Examples in Dog, Sheep, Cattle and Horse. Genet. Sel. Evol. 2013, 45, 1. [Google Scholar] [CrossRef] [PubMed]
  31. Granado-Tajada, I.; Rodríguez-Ramilo, S.T.; Legarra, A.; Ugarte, E. Inbreeding, Effective Population Size, and Coancestry in the Latxa Dairy Sheep Breed. J. Dairy Sci. 2020, 103, 5215–5226. [Google Scholar] [CrossRef] [PubMed]
  32. Deniskova, T.; Dotsev, A.; Lushihina, E.; Shakhin, A.; Kunz, E.; Medugorac, I.; Reyer, H.; Wimmers, K.; Khayatzadeh, N.; Sölkner, J.; et al. Population Structure and Genetic Diversity of Sheep Breeds in the Kyrgyzstan. Front. Genet. 2019, 10, 1311. [Google Scholar] [CrossRef]
  33. Falconer, D.S.; Mackay, T.F.C. Introduction to Quantitative Genetics, 4th ed.; Longman: Essex, UK, 1996. [Google Scholar]
  34. Gutiérrez, J.P.; Cervantes, I.; Molina, A.; Valera, M.; Goyache, F. Individual Increase in Inbreeding Allows Estimating Effective Sizes from Pedigrees. Genet. Sel. Evol. 2008, 40, 359. [Google Scholar] [CrossRef] [PubMed]
  35. Cervantes, I.; Goyache, F.; Molina, A.; Valera, M.; Gutiérrez, J.P. Estimation of Effective Population Size from the Rate of Coancestry in Pedigreed Populations: Effective Population Size from Rate of Coancestry. J. Anim. Breed. Genet. 2011, 128, 56–63. [Google Scholar] [CrossRef] [PubMed]
  36. Maignel, L.; Boichard, D.; Boichard, E. Genetic Variability of French Dairy Breeds Estimated from Pedigree Information. In Proceedings of the Open Session of the Interbull Annual Meeting, Veldhoven, The Netherlands, 23–24 June 1996; pp. 49–54. [Google Scholar]
  37. MacCluer, J.W.; Boyce, A.J.; Dyke, B.; Weitkamp, L.R.; Pfenning, D.W.; Parsons, C.J. Inbreeding and Pedigree Structure in Standardbred Horses. J. Hered. 1983, 74, 394–399. [Google Scholar] [CrossRef]
  38. Rodríguez-Ramilo, S.T.; Elsen, J.M.; Legarra, A. Inbreeding and Effective Population Size in French Dairy Sheep: Comparison between Genomic and Pedigree Estimates. J. Dairy Sci. 2019, 102, 4227–4237. [Google Scholar] [CrossRef] [PubMed]
  39. Hashemi, M.; Ghavi Hossein-Zadeh, N. Population Genetic Structure Analysis of Shall Sheep Using Pedigree Information and Effect of Inbreeding on Growth Traits. Ital. J. Anim. Sci. 2020, 19, 1195–1203. [Google Scholar] [CrossRef]
  40. Rafter, P.; McHugh, N.; Pabiou, T.; Berry, D.P. Inbreeding Trends and Genetic Diversity in Purebred Sheep Populations. Animal 2022, 16, 100604. [Google Scholar] [CrossRef] [PubMed]
  41. Kárpáti, E.; Gulyás, L.; Posta, J.; Sáfár, L.; Gáspárdy, A. The First In-Deep Pedigree Analysis of Repatriated Gyimes Racka Sheep for a Sustainable Preservation of Its Genetic Resource. Chem. Eng. Trans. 2023, 107, 343–348. [Google Scholar] [CrossRef]
  42. Kasap, A.; Ramljak, J.; Špehar, M. Estimation of Population-Specific Genetic Parameters Important for Long-Term Optimum Contribution Selection—Case Study on a Dairy Istrian Sheep Breed. Animals 2021, 11, 2356. [Google Scholar] [CrossRef]
  43. Kuehn, L.A.; Lewis, R.M.; Notter, D.R. Connectedness in Targhee and Suffolk Flocks Participating in the United States National Sheep Improvement Program1. J. Anim. Sci. 2009, 87, 507–515. [Google Scholar] [CrossRef] [PubMed]
  44. Kominakis, A.P. Effect of Unfavourable Population Structure on Estimates of Heritability, Systematic Effects and Breeding Values. Arch. Anim. Breed. 2008, 51, 601–610. [Google Scholar] [CrossRef]
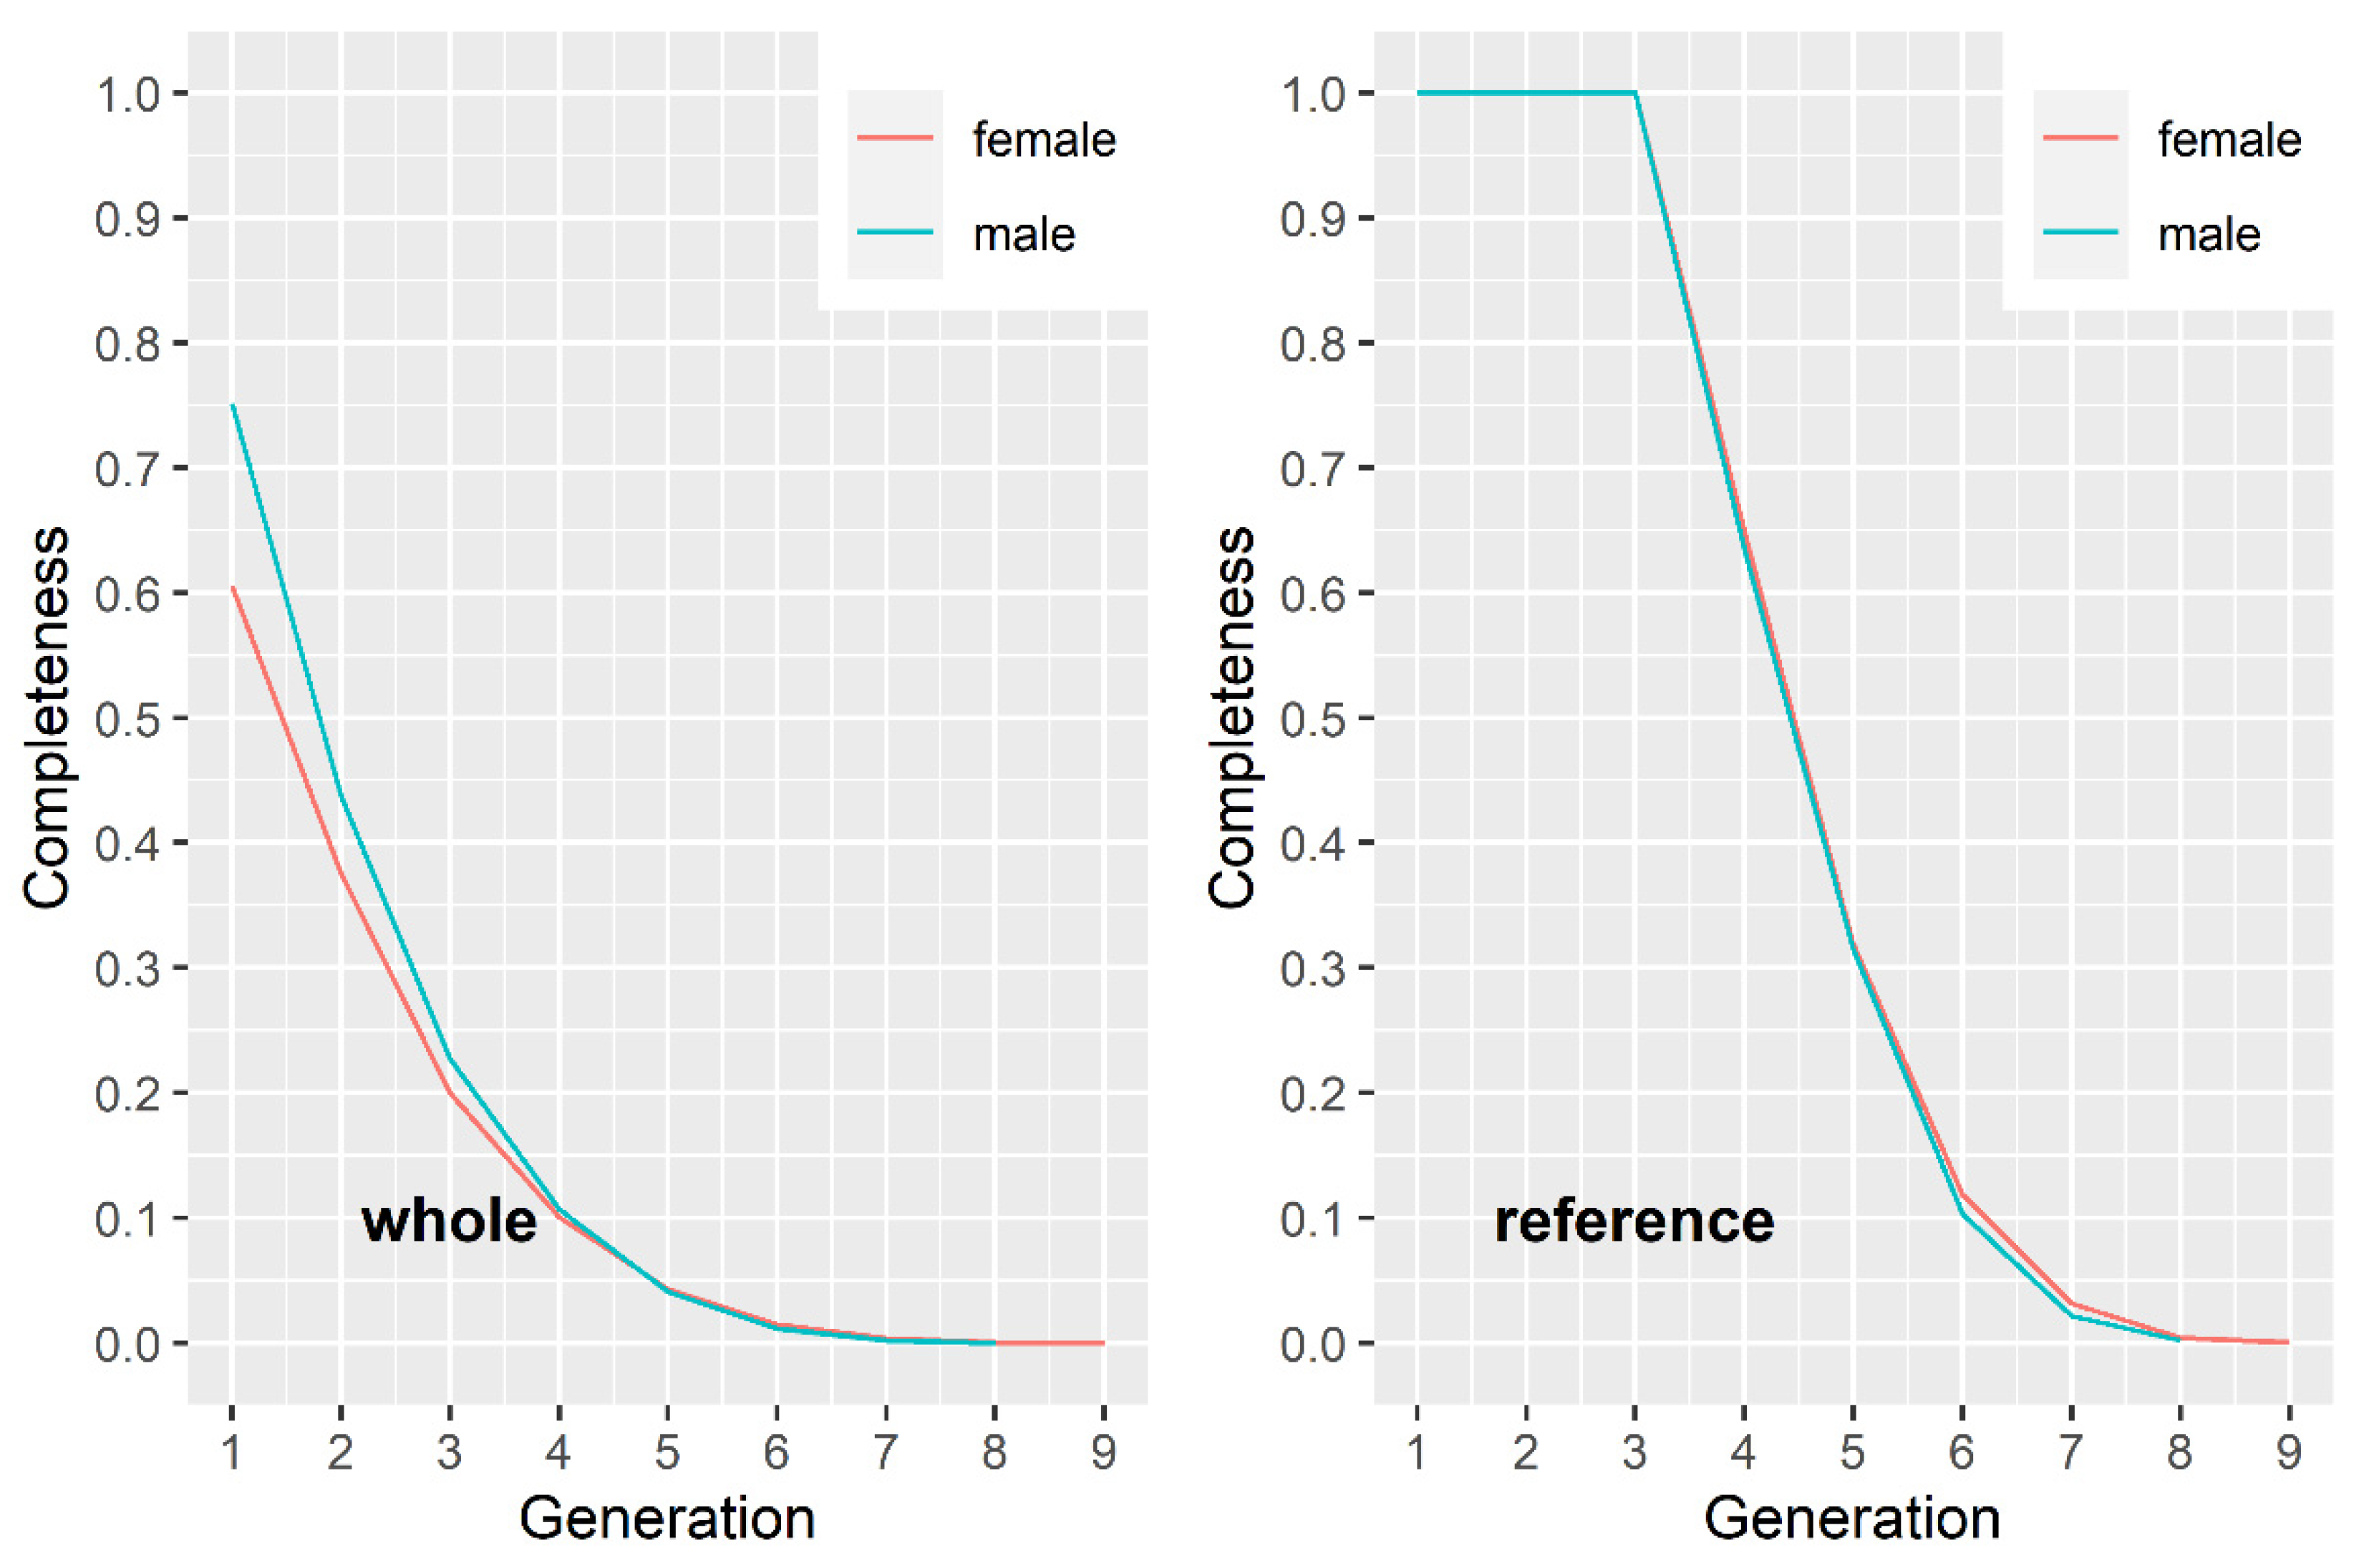
Figure 1. Completeness of the pedigree for the whole and reference Pag sheep breed population.
Agriculture 15 00474 g001
Figure 2. Distribution of mid-parent age in the reference population.
Agriculture 15 00474 g002
Figure 3. Estimates of connectedness (PEVD) among flocks (1, …, 34) of Pag sheep breed. Lightly colored and smaller dots (lower values of PEVD statistics) represent inversely related connectivity, meaning more-connected flocks.
Agriculture 15 00474 g003
Figure 4. Estimates of connectedness (CD) among flocks (1, …, 34) of Pag sheep breed. Darkly colored and bigger dots (lower values of CD statistics) represent more-connected flocks.
Agriculture 15 00474 g004
Table 1. Quality control parameters of the pedigree.
PopulationStatisticsNEGNFGNMGPCI
Whole populationmax5.744.009.001.00
median11.002.000.25
mean1.360.892.260.29
Reference populationmax5.744.009.000.97
median4.093.006.000.79
mean4.123.056.390.79
NEG—number of equivalent generations; NFG—number of fully traced generations; NMG—number of maximum known generations; PCI—pedigree completeness index.
Table 2. Estimates of the effective population size ( N e ) in the reference population (sliding window approach).
GI (Years) N r e f C ¯ N e N e / N r e f
8 (2008–2011)18330.0096520.03
7 (2009–2012)17030.0083600.04
6 (2010–2013)17210.0069730.04
5 (2011–2014)17000.0066760.04
4 (2012–2015)17190.0058860.05
3 (2013–2016)17400.00501000.06
2 (2014–2017)17150.00431170.07
1 (2015–2018)14570.00391270.09
GI—generation interval; N r e f —census population size; C ¯ —average kinship rate; N e —effective population size.
Disclaimer/Publisher’s Note: The statements, opinions and data contained in all publications are solely those of the individual author(s) and contributor(s) and not of MDPI and/or the editor(s). MDPI and/or the editor(s) disclaim responsibility for any injury to people or property resulting from any ideas, methods, instructions or products referred to in the content.