Abstract
In response to the issues of high energy consumption, limited functionality, and uneven soil–fertilizer mixing in mechanical operations for trenching and fertilizing in hilly orchards, this study proposes the design of a crawler-type self-propelled machine, integrating three main functions: trenching, fertilizing, and soil covering. The key components of the trenching device, fertilizing device, and soil-covering device were designed. Three fertilizing simulation models (pre-plant, mid-plant, and post-plant) were established using EDEM discrete element software. The soil–fertilizer mixing effects under each mode were analyzed, with results indicating that the post-plant fertilizing mode better meets the soil–fertilizer mixing requirements for deep organic fertilizer application. Using trenching speed, forward speed, and bending angle of the trenching knife as experimental factors, with operating power consumption and soil–fertilizer mixing uniformity as evaluation indicators, a Box–Behnken experiment was conducted to optimize the parameters of the trenching and fertilizing components. A regression model was established to analyze the interaction between experimental factors and indicators. The optimal operational parameter combination was determined as follows: trenching speed of 265.03 r/min, forward speed of 0.40 m/s, and bending angle of trenching knife of 130°. Under these parameters, the trenching power consumption and soil–fertilizer mixing uniformity were 1.74 kW and 77.15%, respectively. Orchard verification tests on the machine showed that under the optimal parameters, the relative errors in trenching power consumption and soil–fertilizer mixing uniformity between the field tests and simulations were 7.40% and 4.50%, respectively. These results meet the agronomic requirements for trenching and fertilizing, and the study provides valuable references for the application of related technologies in orchard trenching and fertilizing operations.
1. Introduction
Fertilization is an essential component of orchard management, playing a pivotal role in promoting the growth and development of fruit trees. Efficient and rational fertilization is fundamental to ensuring fruit yield, quality, and economic benefits [1,2]. Currently, issues such as over-fertilization, nutrient imbalances in the soil, and environmental pollution arise in the daily management and use of fertilizers in orchards. To achieve precise fertilization and optimize soil properties in orchard environments, the use of mechanical systems to replace traditional manual methods for deep fertilizer application and soil mixing has gained considerable attention in recent years [3]. Research indicates that compared to surface broadcasting, deep fertilization can increase rice yields by 10% [4]. The use of mechanical side-deep fertilization not only saves labor but also reduces the loss of essential elements such as nitrogen, phosphorus, and potassium, while improving fertilizer utilization efficiency. Developed countries have long been engaged in the research of orchard fertilization machinery, integrating agricultural machinery design with agronomic requirements. These nations have established high standards in orchard construction and management. Their trench fertilization machinery is now more large-scale, specialized, and standardized [3]. The development of orchard trench fertilization machinery in China started later and primarily uses rotary tillage fertilizers for operations. Additionally, many orchards are located in hilly and mountainous areas where problems such as rugged terrain and poor soil conditions are prominent. Therefore, soil loosening and fertilization are especially important [5]. Given the aging rural population, labor shortages, and high labor costs, particularly in hilly orchards, the development of mechanized and intelligent trench fertilization machinery is critical to addressing these issues. This represents a key trend in the future development of Chinese orchards and is of significant importance for the advancement of the orchard industry.
In recent years, the development of the equipment and the evaluation of the operation effect of the prototype have been the subject of extensive research among scholars in Table 1 [6,7]. To analyze the interaction between tools and soil, researchers have established interaction models. Li et al. [8] proposed a dynamic vibration model for self-excited trenching tools, effectively reducing power consumption during trenching. Zeng et al. [9] analyzed the trenching and cutting process and established a dynamic model for soil particles on the thrower blade, with field trials showing a power consumption of 25.96 kW and a furrow depth stability factor of 88.31%, meeting national technical standards. In addition, trenching is a crucial aspect of orchard management, playing a vital role in optimizing the structure of trenching equipment to reduce trench resistance during the operation. Scholars have conducted in-depth research on optimizing the structural parameters of trenching machinery to reduce operational power consumption, improve agricultural productivity, and enhance the quality of trenching. However, existing trenching and fertilizing systems are relatively complex, and prototype machines often serve a single function [10,11,12,13]. Furthermore, soil–fertilizer mixing uniformity is another key indicator of fertilization effectiveness [14,15,16]. Niu et al. [17] designed a soil–fertilizer collision mixing and covering device that simultaneously mixes and covers soil and fertilizer, achieving a uniformity of 87.02% for soil–fertilizer mixing and 94.37% for coverage. Zhang et al. [18] designed a spiral fertilizer mixing device for furrowing fertilization with a Lacey index of 0.76, meeting the operational requirements for trench fertilization. Yuan et al. [19] developed a layered backfilling device for soil–fertilizer mixing, with an organic fertilizer ratio relative standard deviation of 0.11% in bench tests, meeting the requirements for deep organic fertilizer application. Despite these efforts made by scholars, trenching and fertilizing machines still face challenges in practice, such as high power consumption, large volume, and limited functionality. Orchards in China are mostly located in hilly areas, requiring smaller, more adaptable machines that are not affected by the terrain. Reducing trenching power consumption, improving fertilizer utilization, and achieving mechanized fertilization are urgent issues that need to be addressed.

Table 1.
Several trenching, fertilizing, and soil-covering machines at home and abroad.
With the widespread application of computer-based virtual simulation technology in the agricultural sector, simulation techniques have provided an efficient and feasible method for studying the soil disturbance process during deep tillage. The discrete element method (DEM) simulation technology has become an effective tool in trench fertilization research. On the one hand, it can effectively reveal the impact of the machinery on soil fragmentation, soil–fertilizer mixing, and other processes during the trenching operation, as well as visualize the internal interactions between soil particles and the machine surface. On the other hand, it effectively assists designers in the design, testing, and optimization of various discrete material-handling equipment [20,21,22]. Chen et al. [23] designed a small vertical spiral trenching–fertilizing machine suitable for hilly terrains with a 25° slope, integrating three functions—trenching, fertilizing, and soil covering—and optimized the structure of the trenching tool based on an EDEM simulation model. Zhu et al. [24] developed an organic fertilizer application machine with three integrated functions: fertilizing, soil–fertilizer mixing, and soil covering, and optimized the tool speed ratio based on EDEM simulations. Tan et al. [25] designed a chain-type reversible trenching–fertilizing machine for integrated trenching, fertilizing, and backfilling, optimizing the structure of the scraper blade using EDEM simulation. The application of virtual simulation technology in agricultural machinery not only shortens the trial production cycle but also reduces market response time and development costs, providing substantial practical value.
In summary, this study designed a crawler-type self-propelled machine that integrates trenching, fertilizing, and soil covering operations in a single cycle, which was suitable to the hilly orchards. Through theoretical analysis, various key mechanisms such as trenching, fertilizing, and soil covering devices were designed. Subsequently, simulation models for three fertilization modes (pre-plant, mid-plant, and post-plant) were proposed and established using EDEM software, and the effects of soil–fertilizer mixing uniformity under these three modes were analyzed. Furthermore, the study also used EDEM to simulate the trenching and fertilizing process and employed a Box–Behnken experimental design to optimize component parameters and identify the optimal parameter combination. Definitively, the efficacy of the structural parameters was verified through field trials. This research provides a theoretical foundation for the mechanization of orchard operations.
2. Materials and Methods
2.1. Structure and Working Principle of the Whole Machine
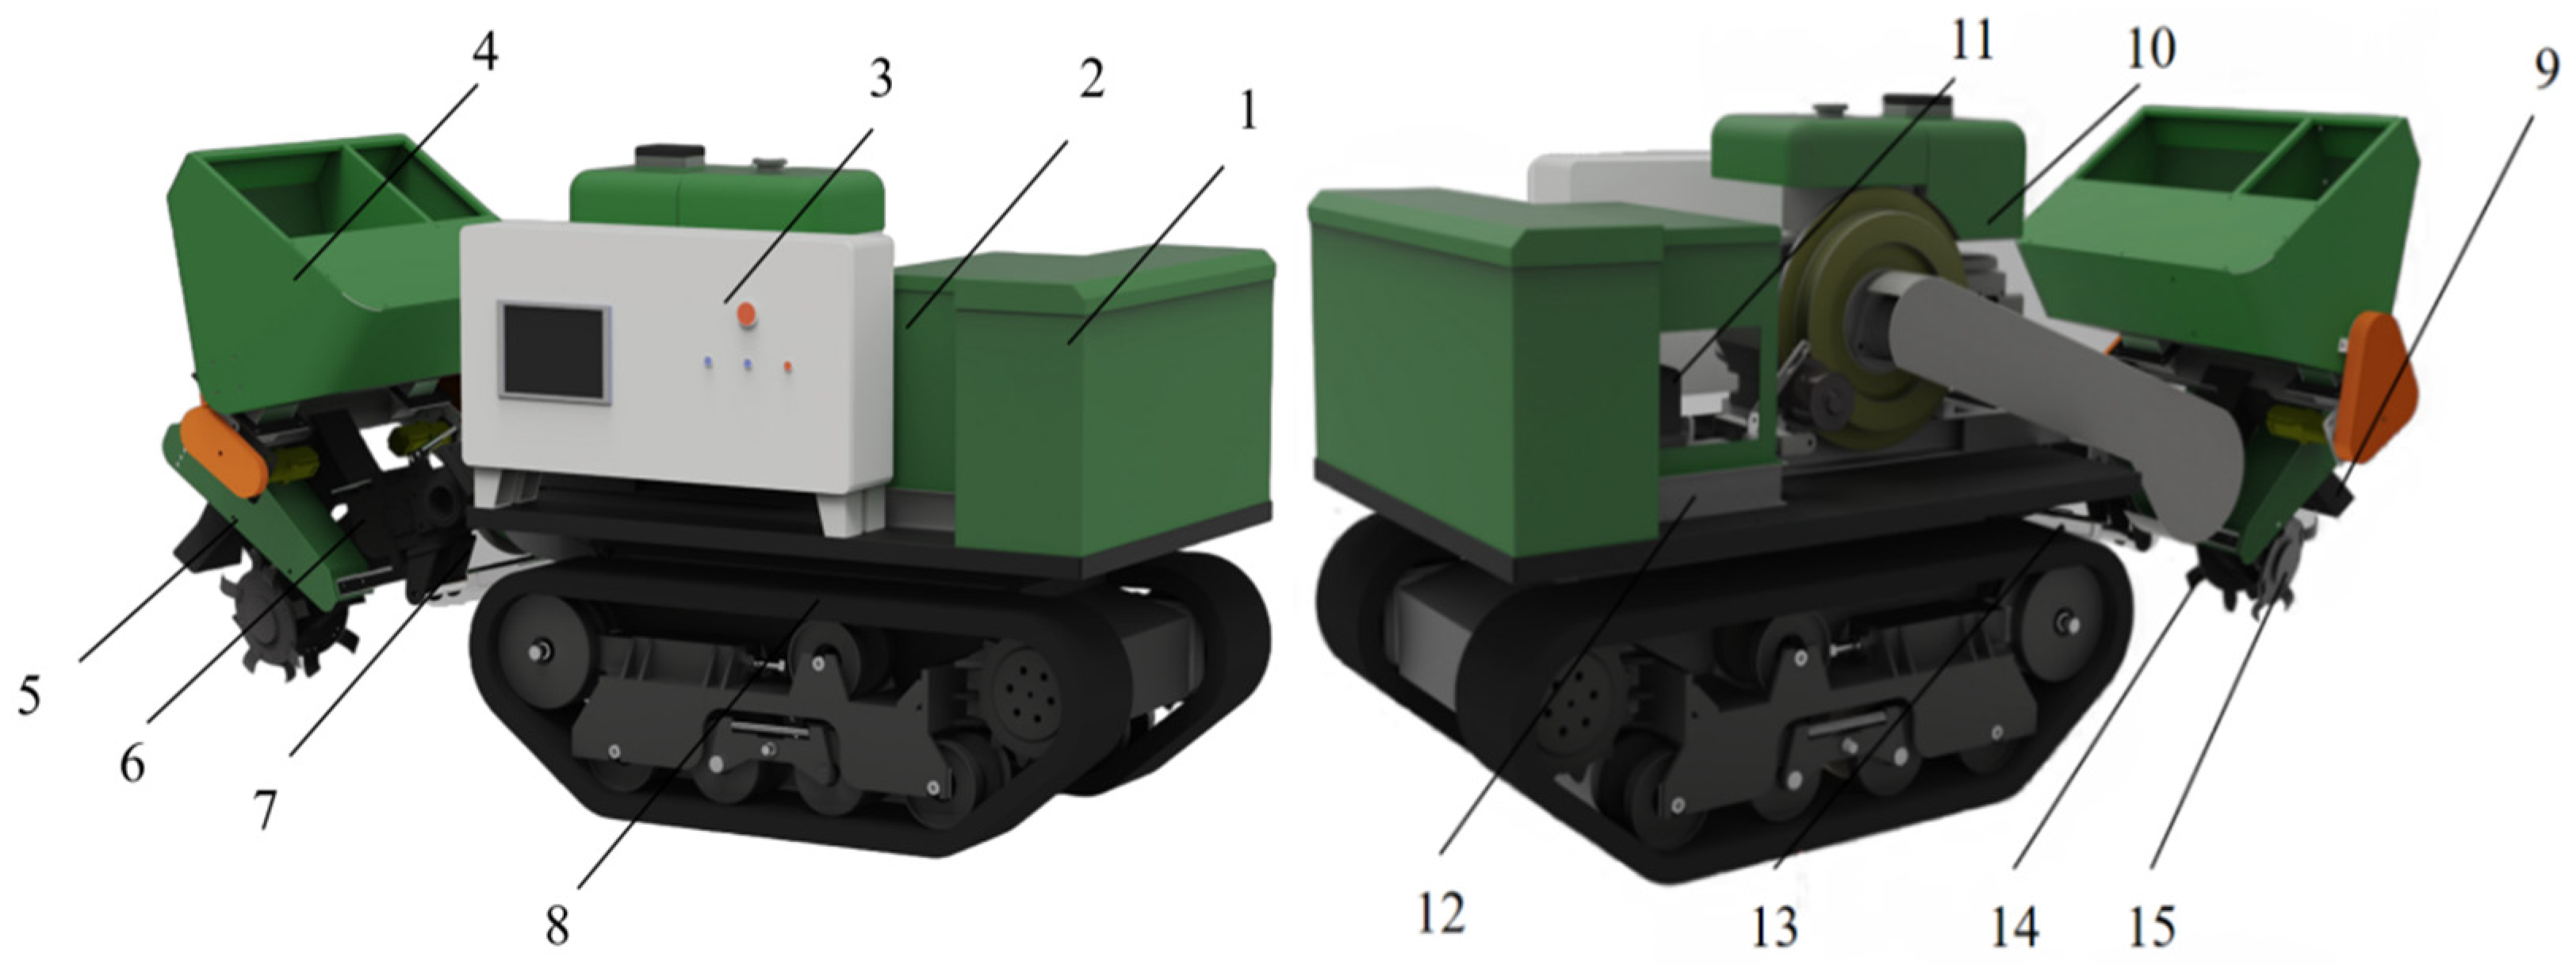
Figure 1 illustrates the design of the crawler-type self-propelled trenching, fertilizing, and soil-covering machine, with its key technical parameters summarized in Table 2. The machine consists primarily of a crawler chassis, trenching device, fertilizing device, soil-covering device, fertilizer box, and control system.

Figure 1.
Structure of the crawler-type self-propelled orchard trenching, fertilizing, and soil-covering machine. (1) Counterweight box; (2) battery case; (3) control box; (4) fertilizer box; (5) soil covering plate; (6) trenching drive box; (7) lifting mechanism; (8) crawler chassis; (9) fertilizer conveyor channel; (10) engine; (11) power supply; (12) connection frame; (13) lifting mechanism; (14) trenching cutter disc; (15) trenching curved blade.
Table 2.
Key technical parameters of the trenching and fertilizing machine.
Figure 2 shows the working principle of the crawler-type self-propelled trenching, fertilizing, and soil-covering machine in the orchard. Before the trenching and fertilizing operation, the trenching cutter is activated and begins to rotate. The depth of trenching is adjusted by modifying the extension and retraction of the electric push rod on the trenching device. The trenching device is then lowered to the preset trenching position. The trenching cutter enters the soil, cutting and throwing the soil upward. Simultaneously, the fertilizer spiral conveyor transports organic fertilizer from the fertilizer box to the fertilizer discharge channel above the trenching mechanism. The discharge fertilizer spiral conveyor then moves the fertilizer from the discharge channel into the fertilizing tray above the trenching device, where it falls into the trench created by the trenching device. After trenching and fertilizing, the soil thrown up by the trenching cutter is blocked by the soil-covering device and falls back into the trench, thus completing the integrated operation of self-propelled forward movement, single-line trenching, deep organic fertilizer application, and soil covering.
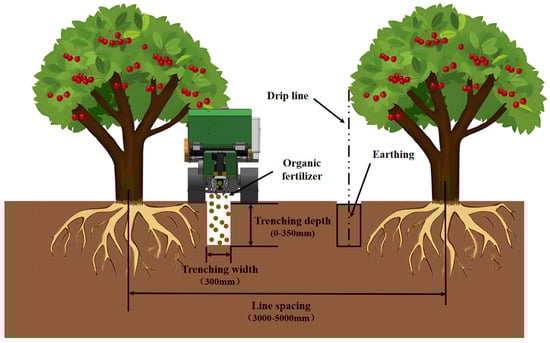
Figure 2.
Principle diagram of the whole machine.
2.2. Key Component Design of Whole Machine
2.2.1. Design of Trenching Device
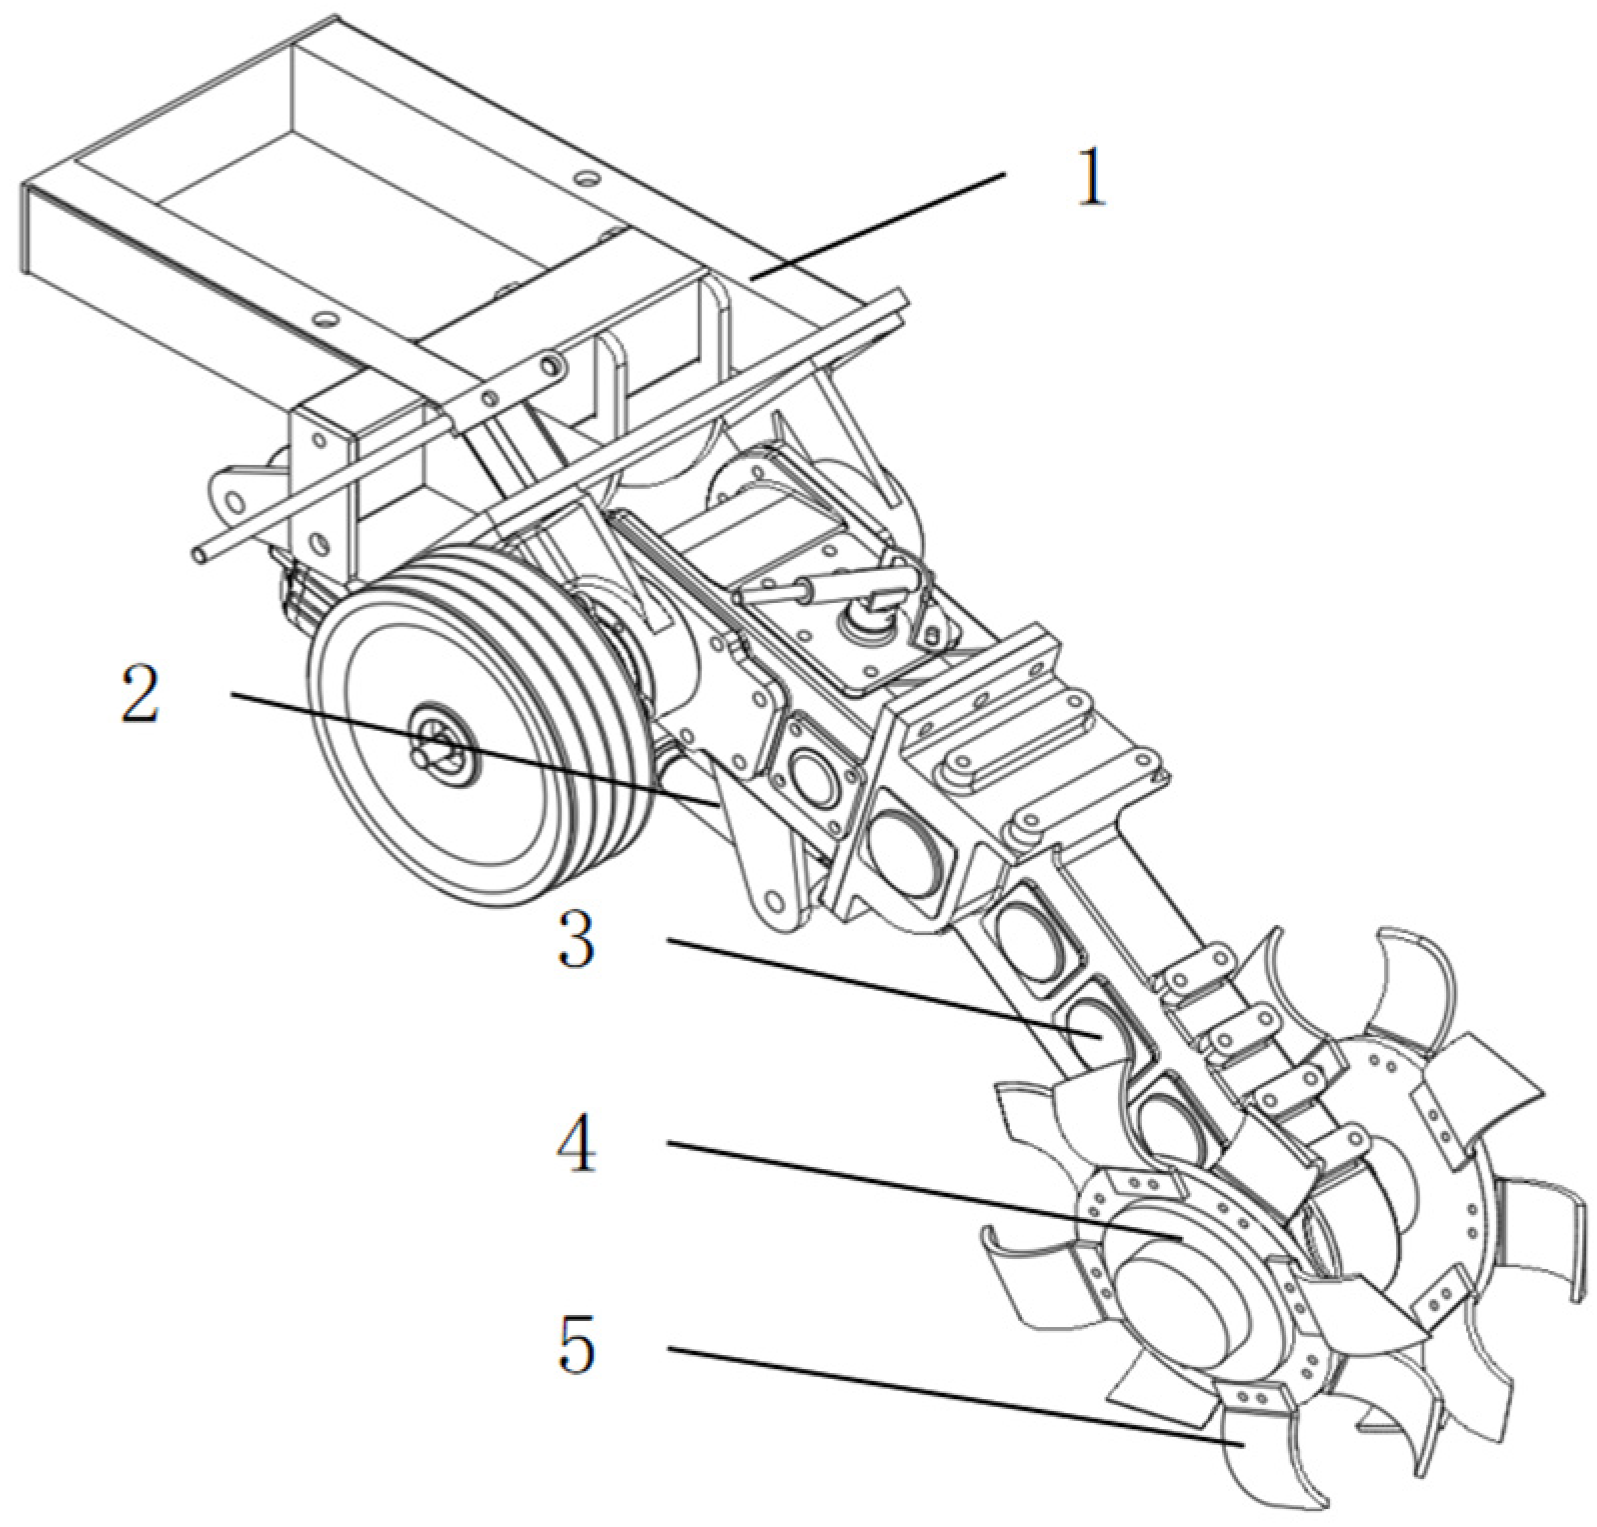
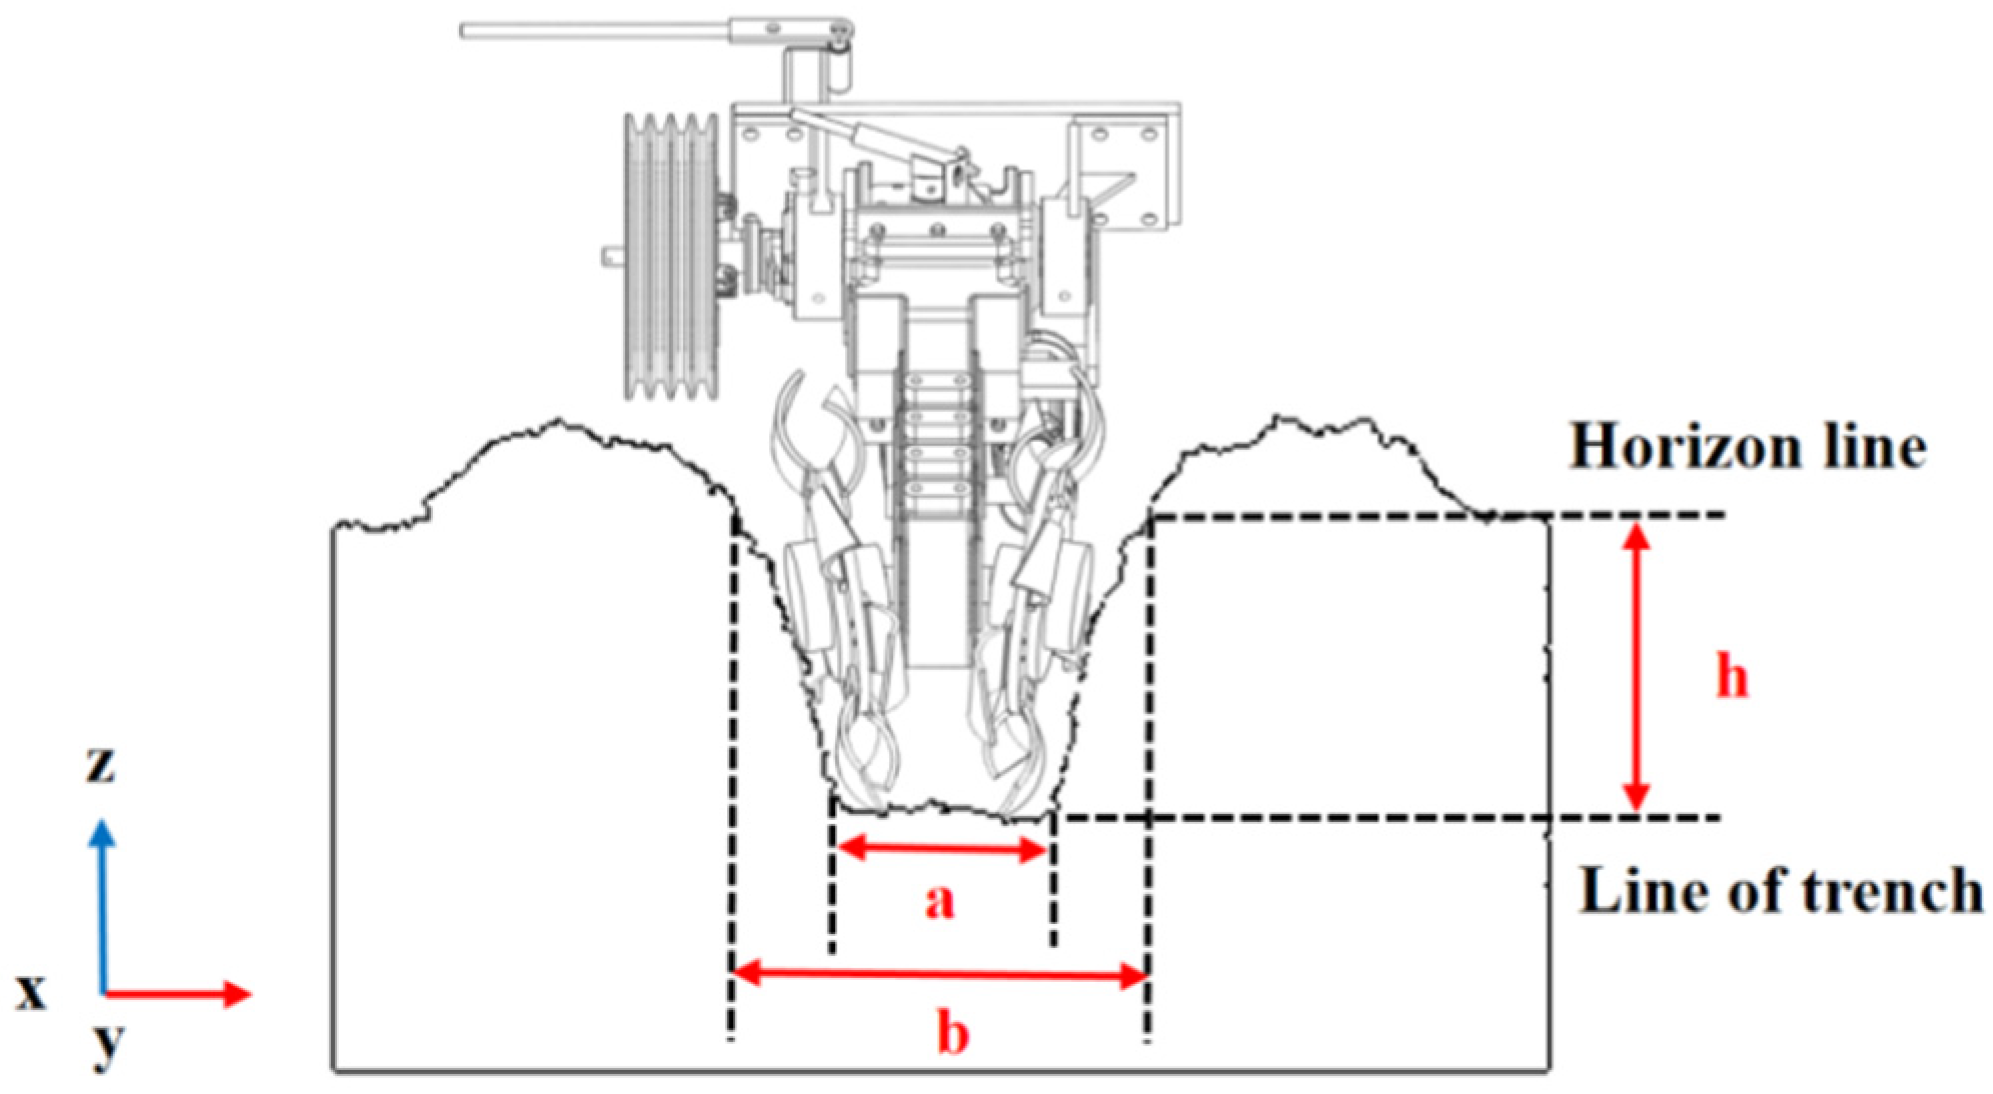
According to the agronomic standards for trenching and fertilizing in orchards [17], the required trench depth is generally between 20 and 35 cm, with a trench width of 20 to 30 cm. Considering the operational requirements for soil cutting and soil throwing during the trenching process, this study employed a dual-disc trenching device. The trenching knives are cup-shaped curved blades, which are symmetrically and alternately installed on both sides of the trenching disc by bolts, with the two discs symmetrically mounted on both sides of the trenching drive box at a 14° inclination angle. In order to ensure the strength and hardness, the material of the trenching knives is 65 Mn. Each side is equipped with four trenching knives arranged at 90° intervals along the circumference of the disc, as shown in Figure 3. The trenching disc drives the blades in a reverse rotation manner, ultimately forming a trapezoidal trench with cross-sectional dimensions (a × b × h) of 30 × 35 × 30 cm, as shown in Figure 4.
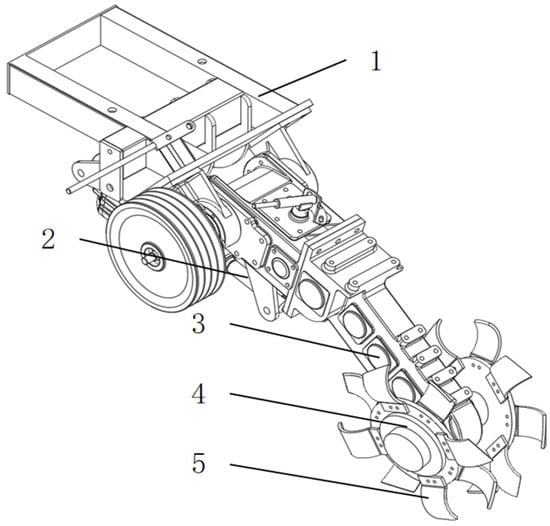
Figure 3.
Structural schematic of the trenching device. (1) Connection frame; (2) lifting mechanism; (3) trenching drive box; (4) trenching disc; (5) cup-shaped curved blade.
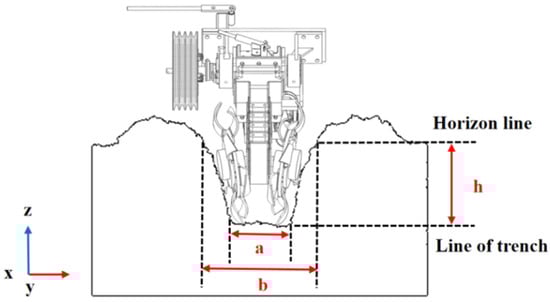
Figure 4.
Trenching effect schematic.
The trenching disc, as the main working component of the disc-type trenching machine, is critical for achieving the desired trench depth while optimizing energy consumption and improving operational efficiency. The diameter of the disc has a decisive effect on the cutting arc length of the trenching knives, which in turn affects both the soil cutting power consumption and the milling power consumption. Based on the above analysis, the influence of increasing disc diameter D on power consumption is not unique. Therefore, selecting an appropriate disc diameter is crucial to balancing earth-cutting power consumption and milling power consumption, and an empirical formula needs to be introduced [26]. The relationship between the disc diameter and the cutting arc length can be expressed as:
where B—the cutting arc length, mm; θ—the tearing line angle of the soil, °; R1—the radius of the disc, mm; D1—the diameter of the disc, mm; and δ1—the working length of the trenching knife, mm.
From Formula (1), as the disc diameter increases, the cutting arc length also increases, which reduces the curvature of the soil-cutting profile, thereby lowering the power consumption during the cutting process. The relationship between the disc diameter and the theoretical trench depth can be expressed as:
where H—the theoretical trench depth, mm.
Considering the impact of ground flatness on machine operations, we initially set the trench depth to 400 mm, with the working length of the trenching knife set to 140 mm. Using Formula (2), we determined that the disc diameter should range between 200 and 280 mm. Considering the comprehensive effects of disc diameter on torque distribution and structural dimensions, we increased the disc diameter within the reasonable range. To ensure that the trenching disc can cut soil evenly and complete the trenching operation with the minimum power consumption, the optimal disc diameter was determined to be 240 mm [18].
2.2.2. Design of Fertilizing Device
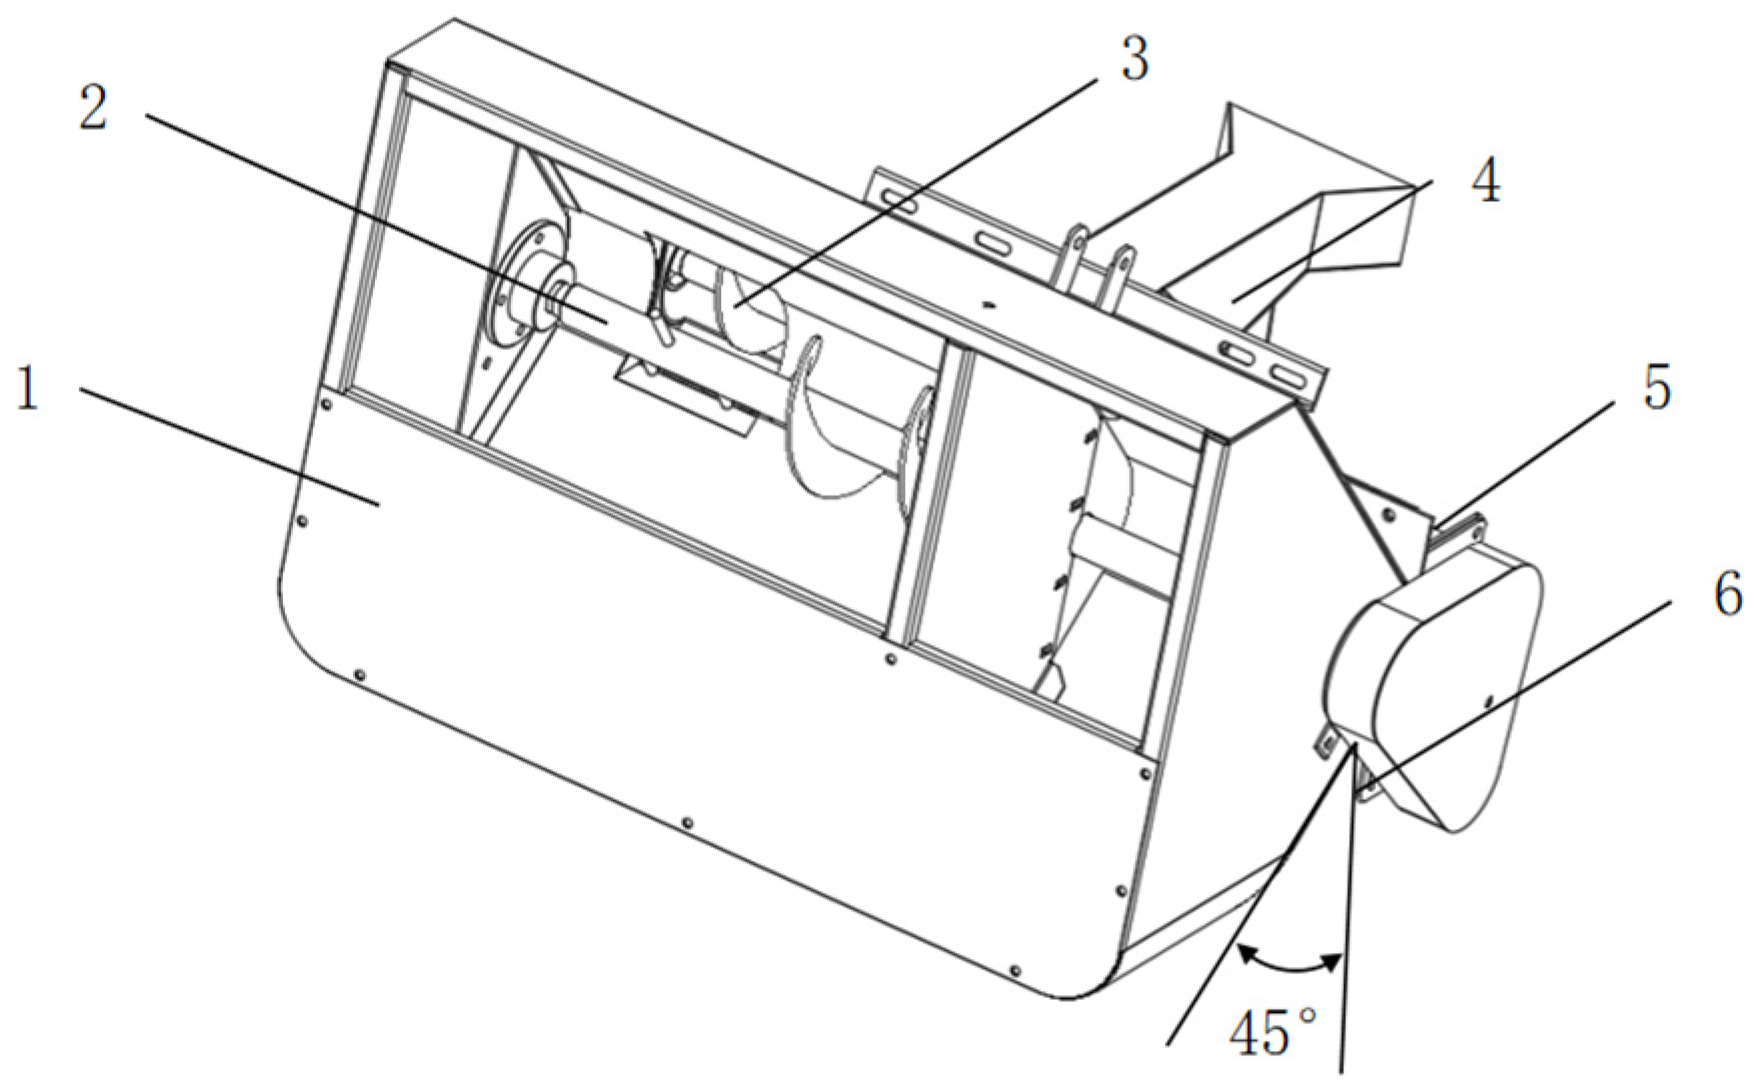
Figure 5 shows the structural schematic of the fertilizing device. The internal volume of the fertilizer box is approximately 0.2 m3, and the angle between the two wall surfaces of the fertilizer box and the horizontal plane is 45°, ensuring that the fertilizer flows smoothly down. The fertilizer discharge spiral is the main working component of the discharge device, and its size directly determines the total fertilizer discharge rate, discharge uniformity, and discharge stability. Taking into account the installation of the fertilizer discharge spiral conveyor and the fertilizer box in Figure 6, as well as the size of the chassis, the effective length of the fertilizer discharge spiral is initially designed to be 760 mm [17].
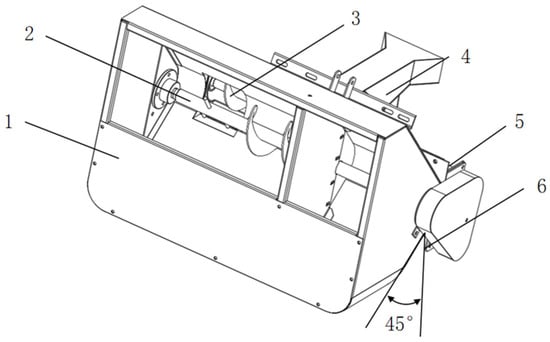
Figure 5.
Structural schematic of the fertilizing device. (1) Fertilizer box; (2) fertilizer conveyor spiral; (3) fertilizer discharge spiral conveyor; (4) fertilizing tray; (5) discharge tray; (6) fertilizer drive motor.
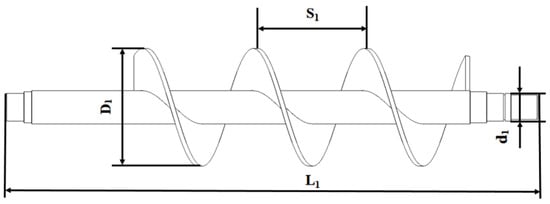
Figure 6.
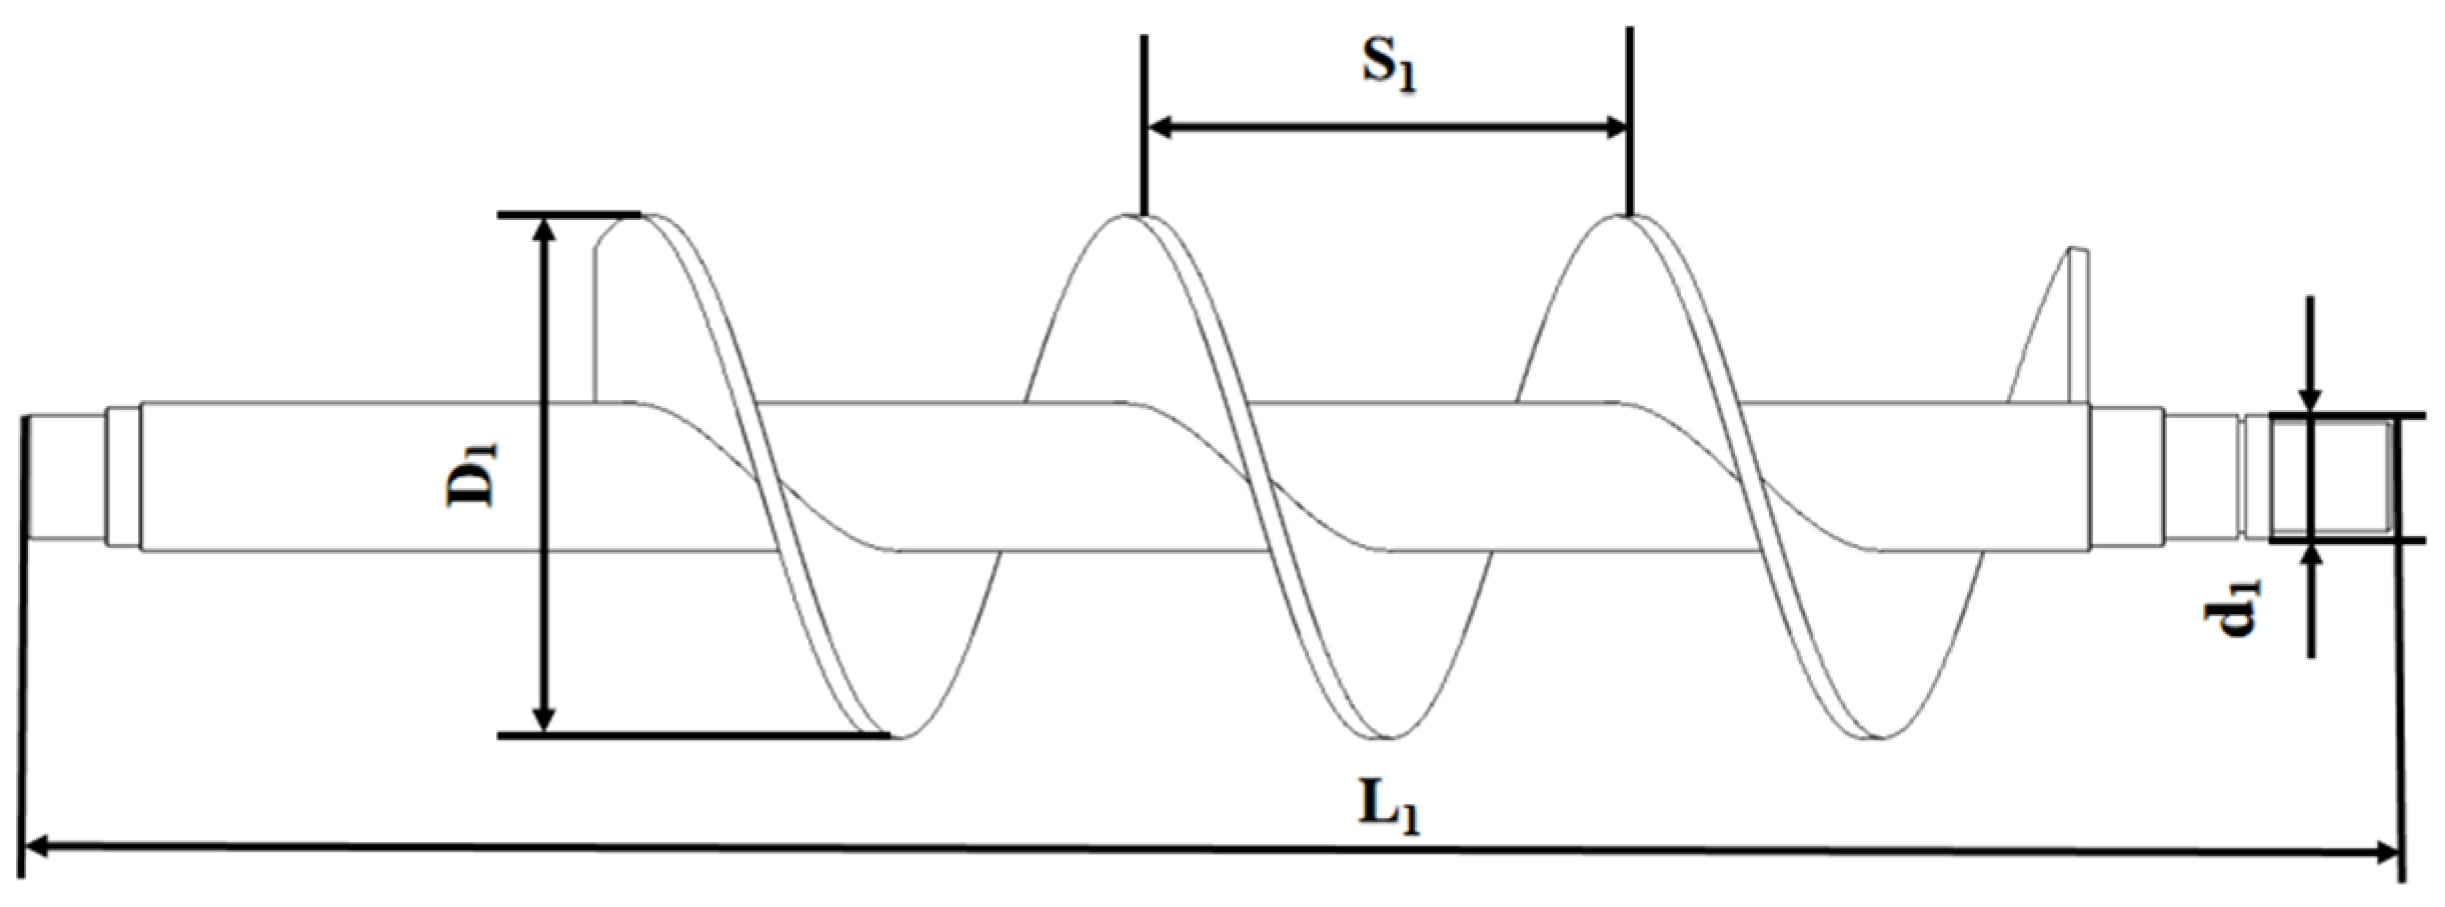
Structural schematic of the fertilizer discharge spiral conveyor.
The nominal diameter and pitch of the fertilizer discharge spiral are key parameters influencing the fertilizing rate. The nominal diameter of the spiral is related to the fertilizing speed, fill coefficient, and fertilizer bulk density. The calculation for the diameter is given by:
where D1—the nominal diameter of the fertilizer discharge spiral, mm; φ—the material’s comprehensive characteristic coefficient; K—the material’s comprehensive coefficient; c—the ratio of pitch to diameter; λ—the material’s unit volume mass; and ε—the inclined conveyor coefficient.
For the orchard trenching–fertilizing machine, under continuous fertilization operation, the fertilizing rate can be expressed as:
where Q—the fertilizing rate, t/h; g—the amount of fertilizer per distance traveled, t; and s—the forward travel distance, m.
According to the agronomic requirements for fertilizing fruit trees [18], the fertilizing amount per tree on one side is 3 kg/m. The forward speed of the fertilizing machine is taken as 0.3 m/s. From Formula (4), the fertilizing amount is 3 t/h. Combining this with the characteristics of organic fertilizer, the fill coefficient for compound fertilizer is 0.45 and the material coefficient is 0.05. For a horizontal conveyor, the inclined conveyor coefficient is taken as 1.0 and the unit volume mass is 0.8 t/m3. Substituting these values into Formula (3), the diameter of the spiral blades is found to be 116 mm. According to the mechanical industry standards, the spiral conveyor diameter is rounded to 100 mm.
The pitch and shaft diameter of the spiral conveyor directly affected the fertilizer discharge efficiency. The pitch and shaft diameter can be expressed as:
where c1—the pitch coefficient; c2—the shaft diameter coefficient; d1—the inner diameter of fertilizer discharge spiral conveyor, mm; and S1—pitch, mm.
Based on the Manual of Agricultural Machinery Design [27], the pitch coefficient is taken as 0.8, the shaft diameter coefficient is 0.3, the pitch S1 is equal to 80 mm, and the internal diameter of the fertilizer spiral d1 is equal to 30 mm, which meet the required specifications.
The theoretical single-turn discharge amount is a key indicator for evaluating the discharge capacity of the fertilizer spiral conveyor. It is calculated as:
where q—the single-turn discharge amount, g; D2—the outer diameter of the discharge spiral, mm; d1—the inner diameter of the discharge spiral, mm; S1—the pitch, mm; bt—the average thickness of the spiral blades, mm; ht—the depth of the spiral blades, mm; Lt—the average length of the spiral blades, mm; pc—the bulk density of compound fertilizer, g/mm3; and φ1—the fill coefficient of the discharge spiral.
Substituting the values of the discharge spiral’s diameter, shaft diameter, and pitch into Formula (6), the theoretical single-turn discharge amount of the fertilizer spiral conveyor is approximately 164 g.
2.2.3. Design of Soil-Covering Device
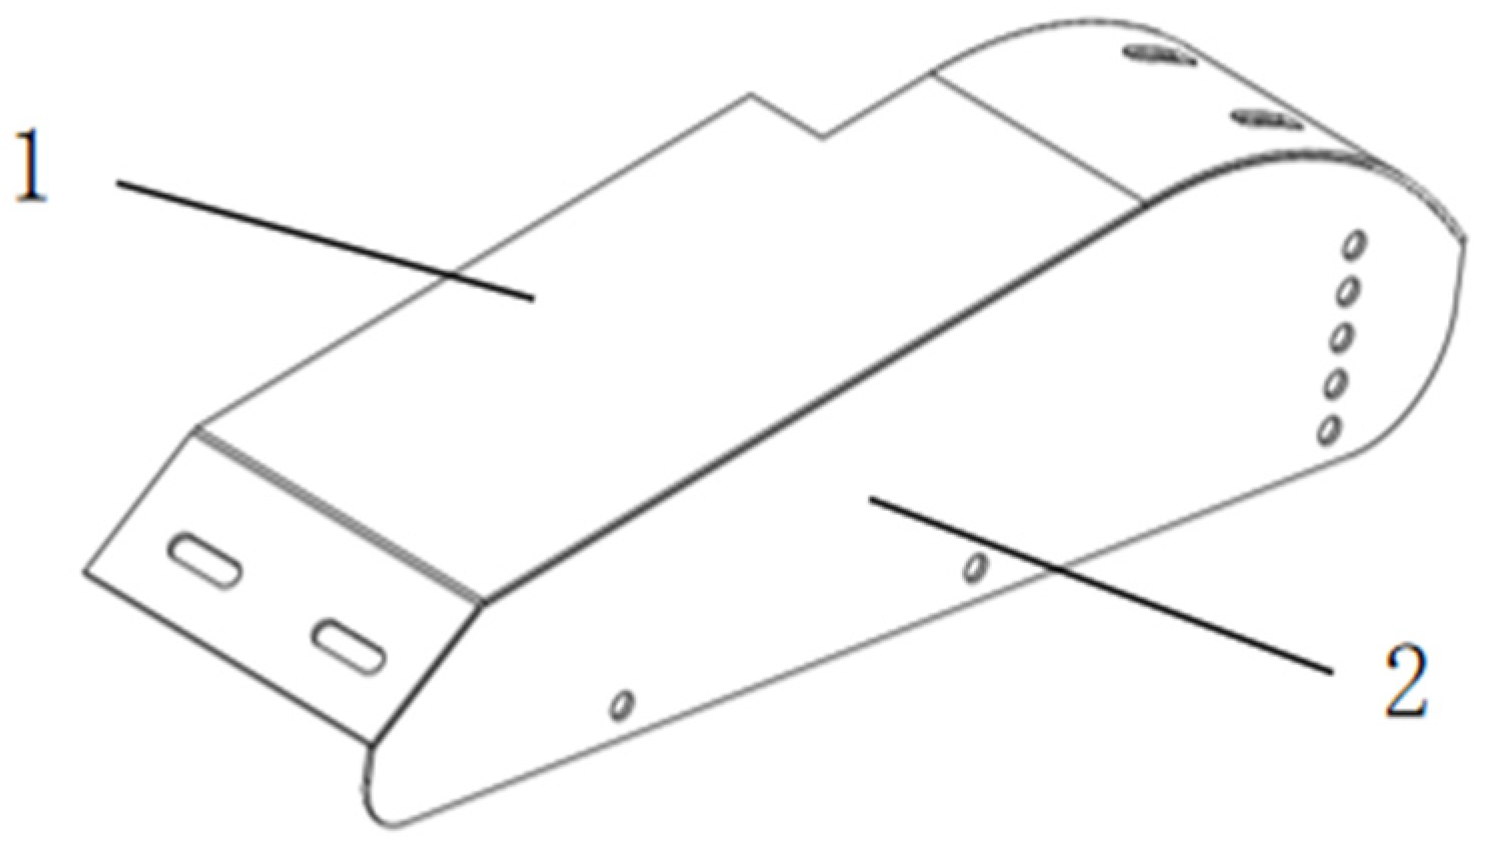
The soil-covering device mainly consists of a soil-covering plate and side plates, as shown in Figure 7. The purpose of the soil-covering plate is to intercept the soil thrown up by the trenching device, guiding it to fall into the trench. The side plates play a crucial role in preventing the soil from being thrown outside the trench, thus preventing soil loss. To match the symmetric distribution of the trenching blade in the trenching device, the side plates of the soil-covering device are designed as single-side plates, and the soil-covering device is symmetrically installed on the symmetric trenching blade disc. This symmetric layout ensures uniformity of the soil-covering effect, making the entire soil-covering process more efficient and stable, providing strong support for fertilization operations in the orchard.
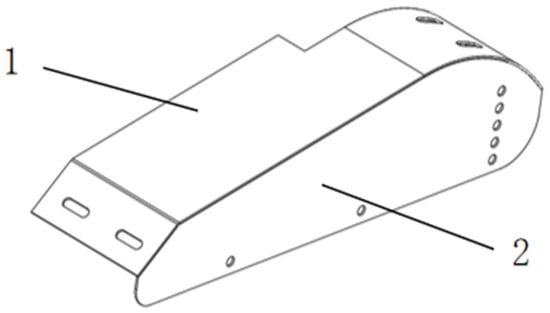
Figure 7.
Structural schematic of the soil-covering device. (1) Soil-covering plate; (2) side plate.
2.3. Discrete Element Method Simulation Experiments
2.3.1. Discrete Element Simulation Modeling
In this study, EDEM 2022 software was used to construct a DEM simulation model to simulate the trenching, fertilizing, and soil-covering operations in the orchard. To improve simulation efficiency, a simplified model of the trenching, fertilizing, and soil-covering device was created in SolidWorks 2020, omitting components such as the gearbox, bolts, and nuts. The model was then saved in “.IGS” format and imported into the soil discrete element model to study the dynamic interaction between the machine and soil.
To better approximate the real field conditions, a soil bed with dimensions of 2000 mm in length, 1000 mm in width, and 450 mm in height was established, as shown in Figure 8, generating a total of 300,000 soil particles. In order to ensure the accuracy of the simulation test and a high efficiency of calculation, the radius of the soil particles was set to 4 mm, with the particles modeled as spherical [28]. A particle factory was added above the soil bed, and the simulation model ran for 0 to 5 s to fill the bed with soil and allow it to stabilize. After the soil reached a stable state, a compression plate was applied at a constant speed of 0.2 m/s for 5 to 6 s to compact the soil. After 6 s, the compression plate was reversed at the same speed until it was fully unloaded, thus completing the simulation of the 2000 mm-long, 1000 mm-wide, and 450 mm-high soil bed, which was then exported as the soil discrete element model.
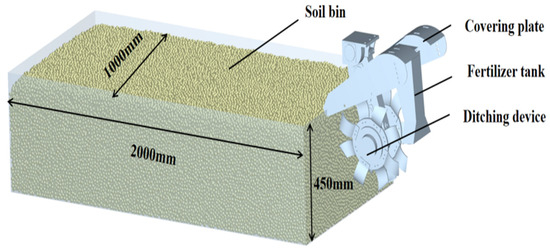
Figure 8.
EDEM simulation model.
2.3.2. Setting of Simulation Parameters
In response to the high soil viscosity and moisture content characteristics of litchi plantation areas in the hilly regions of South China, where elastic–plastic deformation occurs under the action of the blades, this study employed the Hertz–Mindlin with JKR contact model for the interactions between particles. The geometry material was selected as 65 Mn, and the Hertz–Mindlin no-slip contact model was used between the particles and the geometry. In the EDEM pre-processing module, appropriate contact mechanics models were set, and the simulation parameters for the material and contact properties are provided in Table 3 and Table 4, based on previous studies [8,29].
Table 3.
Material property parameters.
Table 4.
Contact attribute parameters.
After importing the model, the device was positioned at the front of the soil bed, with the lower end of the device set 300 mm from the soil surface. The trenching forward speed was set at 0.3 m/s, and the trenching rotation speed was set at 300 r/min. A particle factory was added above the fertilizer discharge slot, with a total of 40,000 fertilizer particles. Based on the size of the organic fertilizer, the particle radius was set to 3 mm as spherical particles. During the simulation, the generated fertilizer particles fell into the trench via the fertilizing slot. The time step for the simulation was set to 10%, with a total simulation duration of 8 s. The data write-out interval was set to 0.01 s, and the grid size was set to 2 Rmin to ensure that the number of grids was no fewer than 1 × 10⁵. To improve the simulation computational speed, the simulation area was minimized as much as possible.
2.3.3. Simulation Test of Fertilization Scheme
If unmixed fertilizer is placed directly into a trench and immediately covered with soil, many advantages of organic fertilizer—such as its buffering properties, soil loosening, moisture retention, and aeration capabilities—cannot be fully leveraged. This approach also fails to improve the internal soil environment as intended. Therefore, thoroughly mixing granular organic fertilizer with the soil is a crucial step in realizing its full functional benefits.
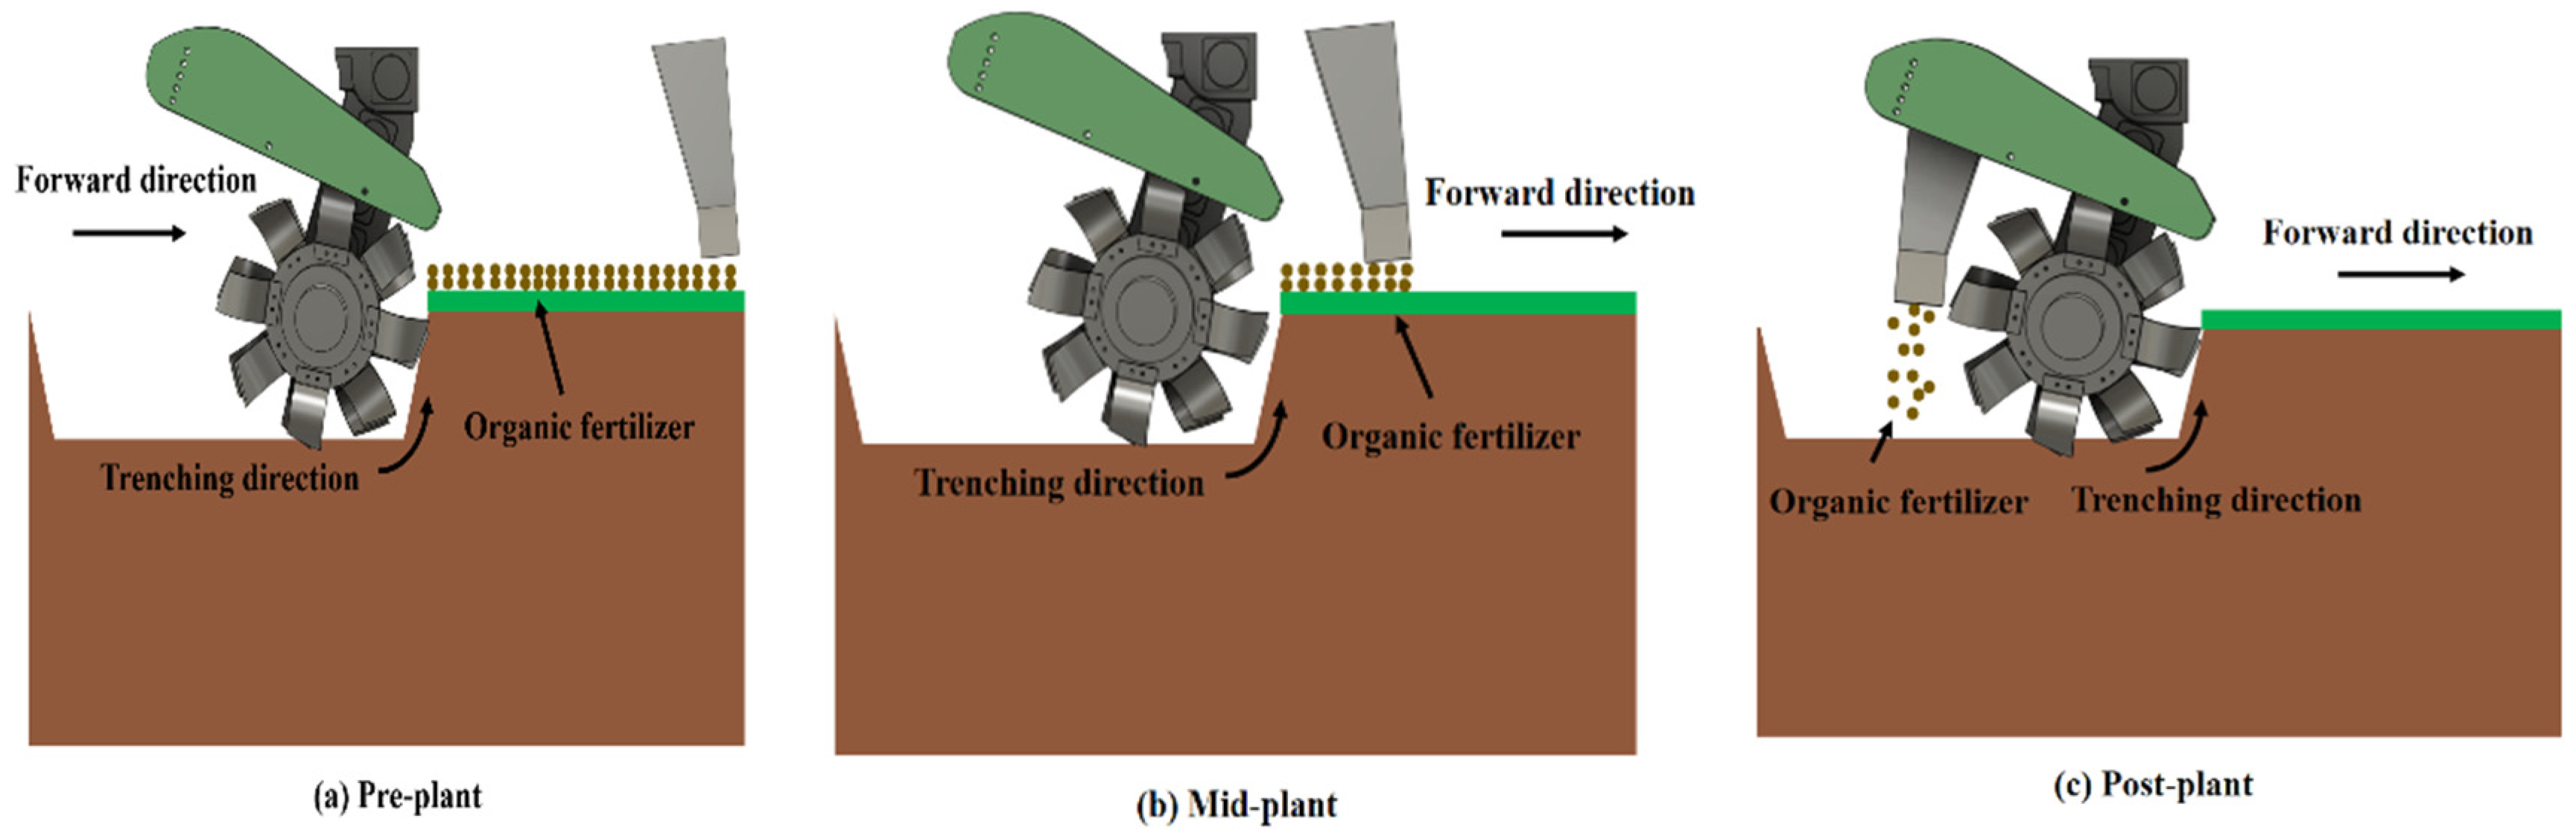
Based on existing organic fertilizer application methods, fertilization can be classified into three modes, as shown in Figure 9: pre-plant, mid-plant, and post-plant fertilization [24]. To select the most appropriate method, an analysis of the fertilization patterns of these three modes is necessary:

Figure 9.
Fertilization models of three different modes.
- (1)
- Pre-Plant Fertilization: The fertilizing trough is aligned parallel to the machine’s forward direction, with the trenching device positioned directly behind the fertilizer trough. Fertilizer is evenly spread along the outer edge of the tree root zone, forming a strip or band of fertilizer. The trenching device then cuts into the soil, simultaneously cutting and throwing both soil and fertilizer upward. The covering device directs the thrown soil and fertilizer back into the trench. This process achieves the mixing of soil and fertilizer without actual trench formation during the fertilization step, but may result in less uniform mixing compared to other methods.
- (2)
- Mid-Plant Fertilization: The fertilizing trough remains parallel to the forward direction, but the trenching device is positioned directly ahead of the fertilizer trough. Organic fertilizer is discharged from the fertilizing trough onto the surface of the soil. The trenching device then cuts into the soil, throwing both soil and the recently discharged fertilizer upward. Concurrently, the covering device guides the thrown mixture back into the trench. This method mixes soil and fertilizer by combining them during the cutting process, but some fertilizer may remain on the soil surface, affecting uniformity.
- (3)
- Post-Plant Fertilization: The trenching device cuts into the soil and throws soil upward, while the fertilizing trough is positioned behind the trenching device. As the trenching device cuts into the soil, organic fertilizer is discharged from the fertilizing trough into the open trench. The soil thrown and discharged fertilizer are then guided by the covering device to fall back into the trench, achieving a thorough mix of soil and fertilizer within the trench. This method tends to result in better soil–fertilizer mixing, as the fertilizer is directly introduced into the trench, where it is immediately combined with the displaced soil.
To choose the most suitable fertilization approach for enhancing soil–fertilizer mixture uniformity, it is essential to analyze and compare the fertilization distribution patterns (fertilizer discharge behavior) of these three modes. By examining how each method distributes fertilizer and mixes it with soil—using metrics such as surface fertilizer leakage rate and soil–fertilizer mixture uniformity—a more informed decision can be made about which fertilization model best meets the goals of efficient and effective organic fertilizer application.
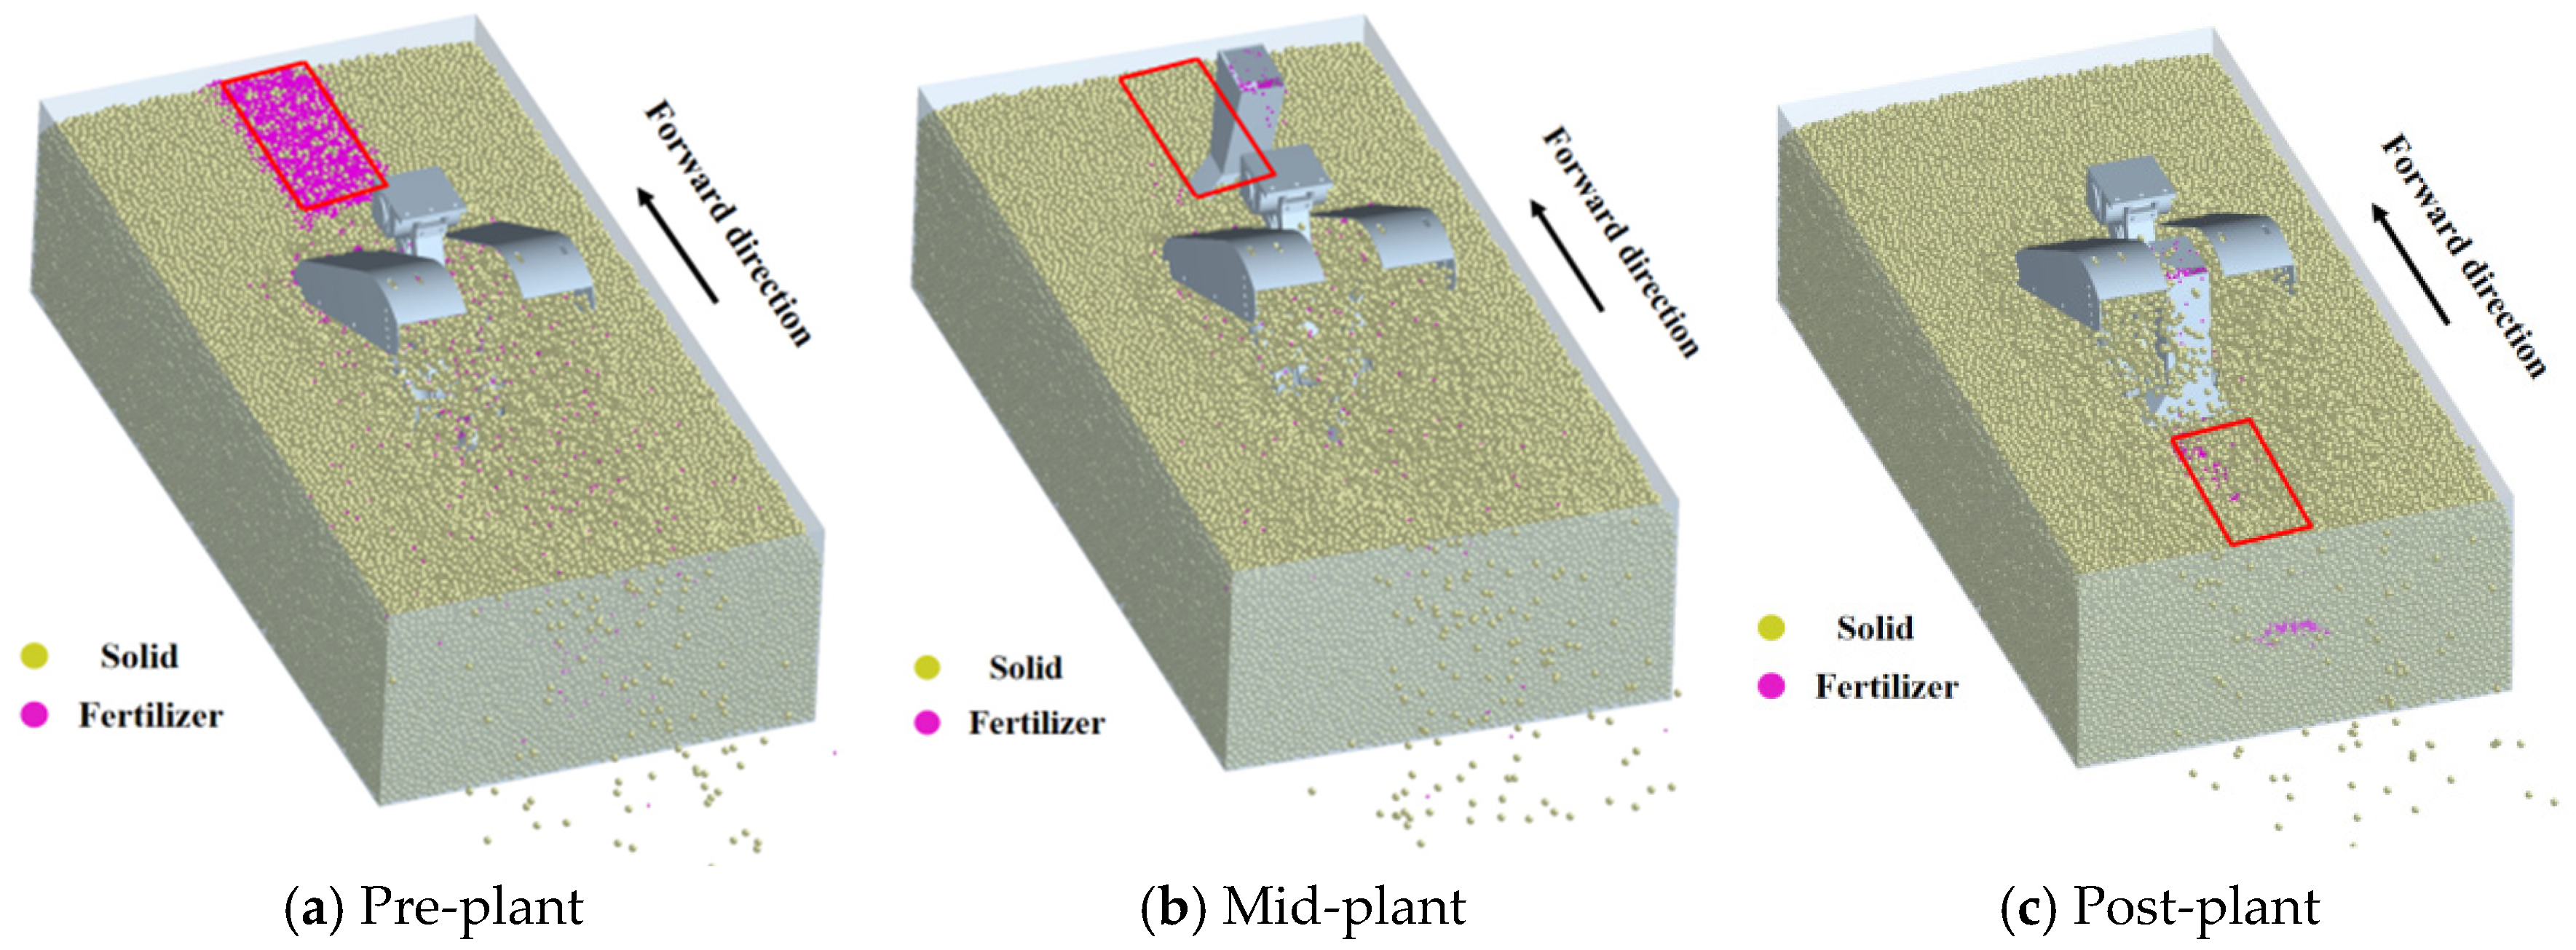
Three-dimensional models for the pre-plant, mid-plant, and post-plant fertilization methods were created and are shown in Figure 10. After importing the models, the device was positioned at the front of the soil bed, with its lower end set 300 mm above the soil surface. The trenching forward speed was set to 0.3 m/s and the trenching blade speed to 300 r/min, consistent with actual operating parameters. The simulation was set to run for 12 s, allowing the entire trenching, fertilizing, and covering device to pass completely over to the other side of the virtual soil bed. The time step was set at 10% of the simulation duration, with data saved at 0.01 s intervals. To facilitate quantitative evaluation of the soil–fertilizer mixing design requirements and to accurately assess the effectiveness of the soil–fertilizer mixing, this study referenced relevant research in the field and selected the surface fertilizer leakage rate (K) and soil–fertilizer mixture uniformity (M) as the primary evaluation metrics. These metrics were used to determine the optimal fertilization method during the operation.
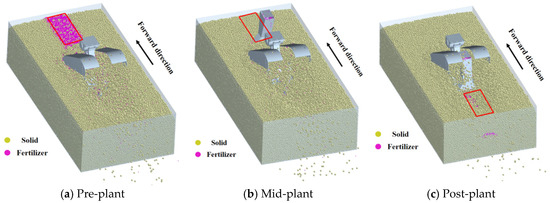
Figure 10.
Fertilization simulation models of three different modes.
2.3.4. Scheme and Method of the Simulation Test
Based on the practical operational requirements of litchi orchards and preliminary field experiments, as well as relevant literature, it has been observed that parameters such as the forward speed of the entire machine, trenching speed, and bending angle of the trenching blade significantly influence operational power consumption and the uniformity of soil–fertilizer mixing [17,30].When the forward speed is less than 0.2 m/s, the trenching consistency is well maintained. However, the overall trenching efficiency is low, leading to poor economic performance, and this speed may cause fertilizer to accumulate in localized areas. Conversely, when the forward speed exceeds 0.5 m/s, the operational efficiency of the entire machine significantly improves, increasing the area worked per unit time. Nonetheless, excessively high speeds can lead to increased power consumption, operational instability, and insufficient soil coverage. Consequently, a forward speed range of 0.2 to 0.5 m/s is considered optimal.
Regarding trenching speed, when it is below 250 r/min, soil is not effectively ejected from the trench, resulting in inadequate mixing of soil and fertilizer. Moreover, the trenching components endure high torque. When the speed exceeds 350 rpm, the soil ejection speed increases, leading to greater soil throw distance and more uniform soil–fertilizer mixing. However, this also results in higher specific power consumption. Therefore, a trenching speed range of 250 to 350 rpm is deemed appropriate.
As for the bending angle of the trenching blade, when it is less than 130°, the trench width decreases, reducing cutting power consumption. However, the disturbed soil area after blade entry is smaller, resulting in poorer soil-throwing performance and less effective soil–fertilizer mixing. When the bending angle exceeds 140°, the operational profile enlarges, the disturbed soil area increases, and the soil-throwing performance improves, leading to better mixing. Nonetheless, this also increases cutting power consumption. Therefore, a bending angle range of 130° to 140° is considered optimal.
To reduce operating power consumption and improve soil–fertilizer mixing performance, forward speed, disc cutter speed, and cutter deflection angle were selected as experimental factors. The evaluation indicators were trenching power consumption and soil–fertilizer mixing uniformity. A three-factor, three-level orthogonal experiment was designed using the Box–Behnken response surface method. The experimental factors and their levels are encoded in Table 5.
Table 5.
Table of factor levels of the experimental test.
2.3.5. Simulation Evaluation Method
- Trenching Power Consumption
After the simulation run, the trenching resistance torque was exported as one of the experimental results in the EDEM software’s post-processing module. The trenching power consumption is calculated using the following Formula (7):
where P—the trenching power consumption, kW; n—cutter disc rotation speed, r/min; and T—cutter disc torque, N·m.
- 2.
- Soil–Fertilizer Mixing Uniformity Measurement
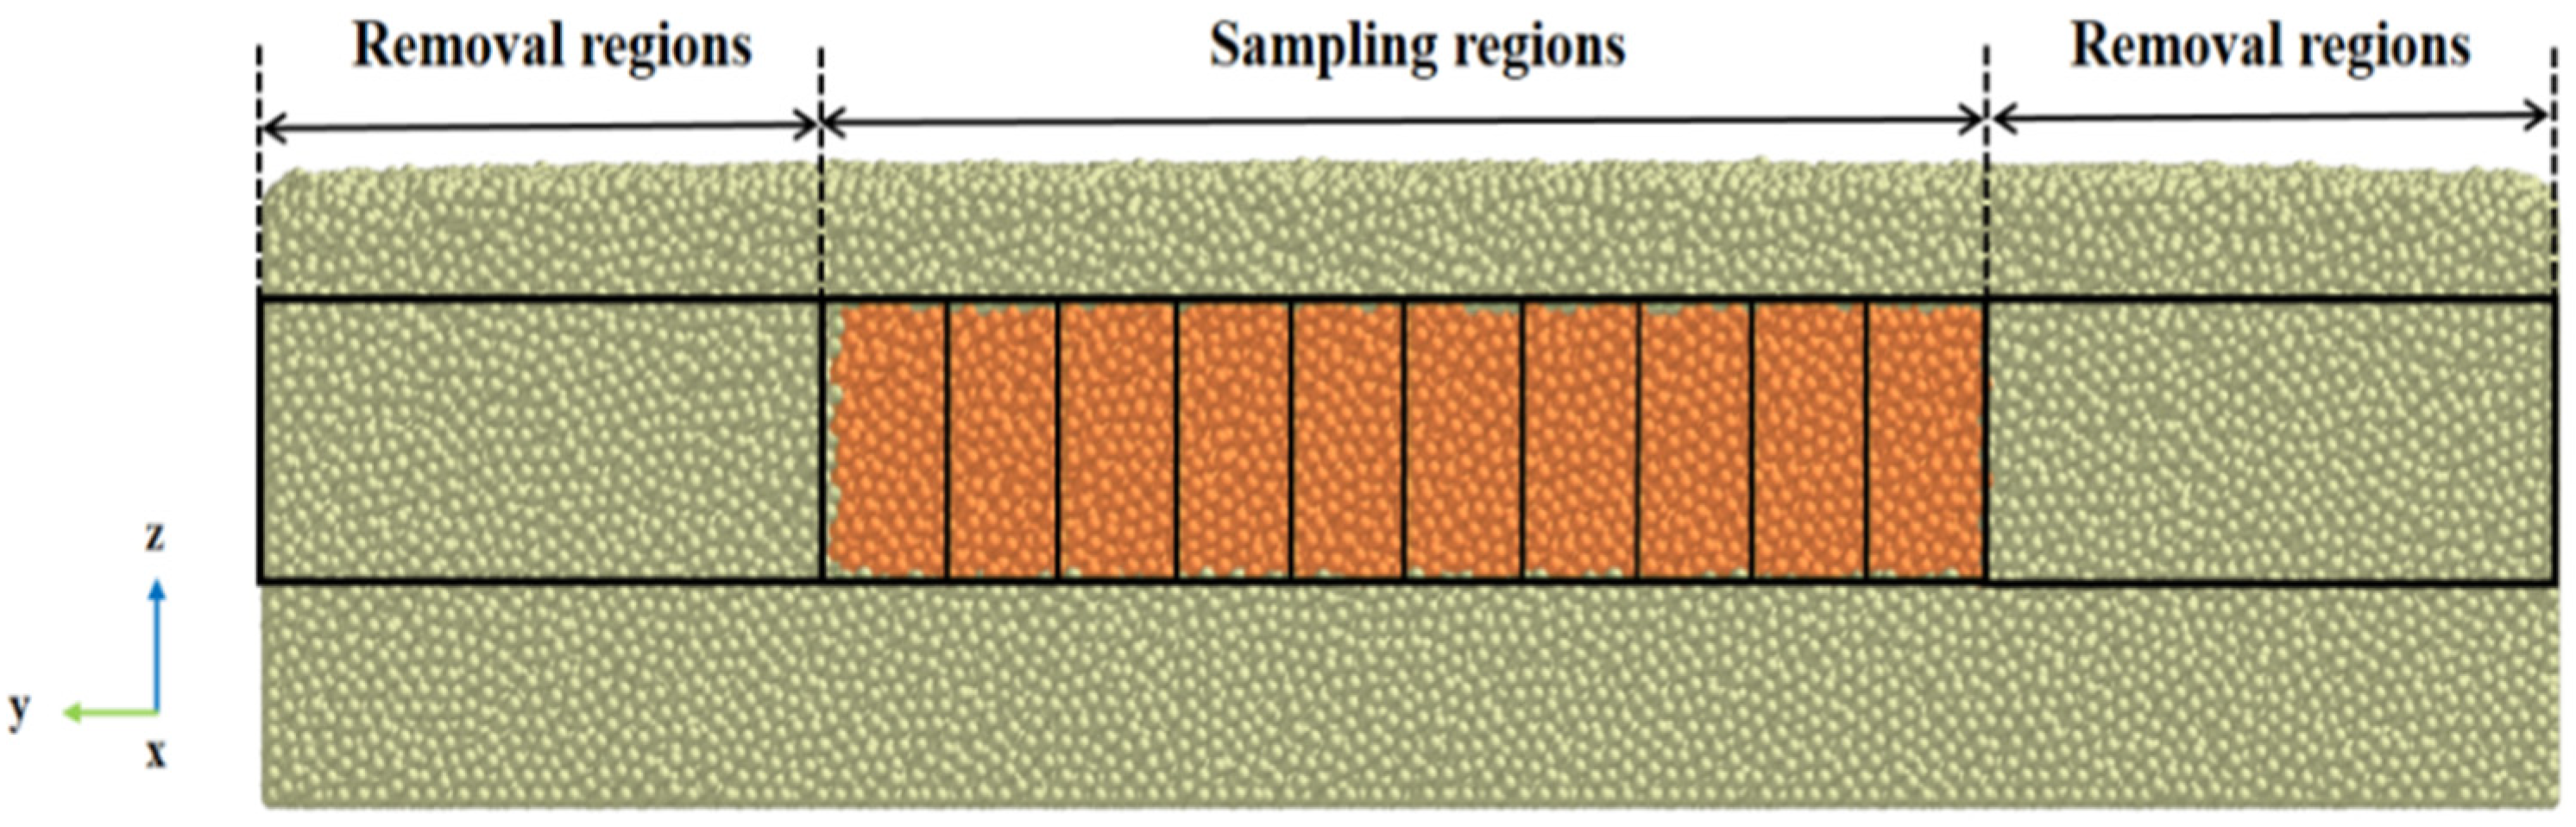
In the simulation, the soil–fertilizer mixing uniformity was measured as follows: In the EDEM post-processing module, under “Setup Selections”, the “Grin Bin Group” was selected for the middle 1000 mm of the analysis area. This area was divided into a 20 × 20 × 20 mm grid, and the 10 evenly distributed measurement regions were analyzed. The number of soil and fertilizer particles in different regions was recorded, as shown in Figure 11.
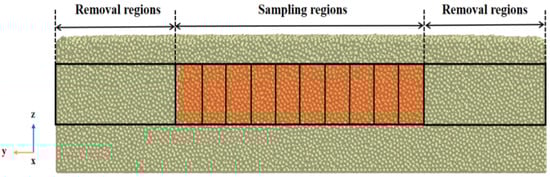
Figure 11.
Measurement of soil–fertilizer mixing uniformity.
The average value of the soil–fertilizer mixture in each grid is denoted by Formula (8):
where —The average value of the soil–fertilizer mixture, g; Qi—the mass of soil–fertilizer mixture in the grid, g; and n—the total number of grids in the analysis area.
The standard deviation of the soil–fertilizer mixture in each grid is calculated by Formula (9) as follows:
The coefficient of variation (Cv) for the mixing uniformity is given by Formula (10):
where Cv—the coefficient of variation for soil–fertilizer mixing uniformity.
The uniformity of the mixture M is then calculated by Formula (11) as follows:
- 3.
- Fertilizer Loss Rate
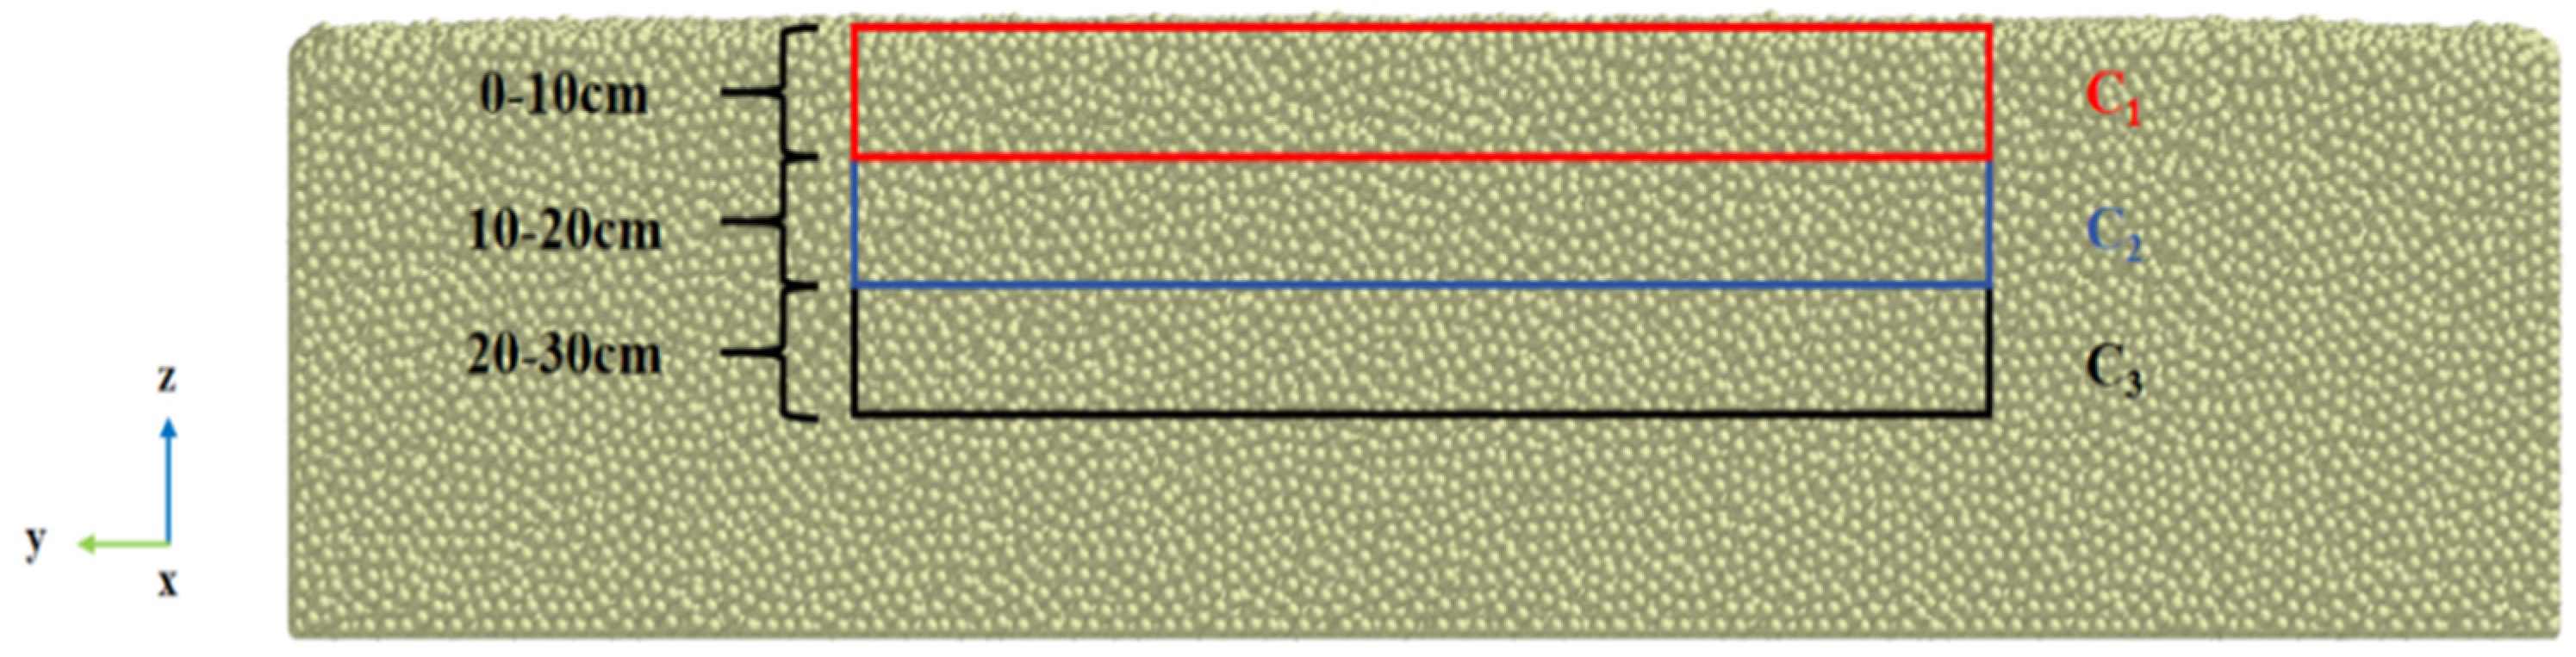
In the EDEM post-processing module, under “Setup Selections”, the “Grin Bin Group” was used to count the number of fertilizer particles distributed across different soil layers. The middle 1000 mm of the analysis area was selected and divided into three layers with a height of 10 cm each. The number of fertilizer particles in each layer was counted, as shown in Figure 12.
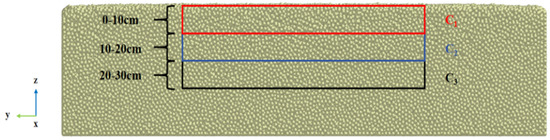
Figure 12.
Measurement of fertilizer loss rate.
The fertilizer loss rate is calculated by Formula (12) as follows:
where C1—the number of fertilizer particles in the first layer; C2—the number of fertilizer particles in the second layer; C3—the number of fertilizer particles in the third layer; and K—the fertilizer loss rate, %.
2.4. Field Test Condition and Method
2.4.1. Field Test Condition
To validate the accuracy of the simulation model and optimize the performance of the trenching, fertilization, and soil-covering system, a field experiment was conducted in 21 December 2024 at the Mingyuan Ecological Park in Gaozhou City, Guangdong Province, China. The weather was sunny, and the temperature was 20 degrees. The equipment used in the field test included (1) The trenching fertilization and soil-covering machine prototype, (2) a JRT-711 soil moisture content meter (range: 0–100%, accuracy: ±0.5%), (3) a JK-750-I soil compaction meter (range: 0–10 MPa, accuracy: ±1%), (4) a multimeter (range: 0–1000 V, accuracy: ±0.5%), (5) a ring knife (volume: 100 cm3), (6) measuring tape (range: 50 m, accuracy: 0.001 m), (7) a steel ruler (range: 50 cm, accuracy: 0.1 cm), (8) a stopwatch (accuracy: 0.01 s), and (9) an electronic scale (capacity: 1000 g, accuracy: 0.01 g). The soil type was clay loam, the fertilizer was granular organic fertilizer, the moisture content was 14%, the density was 1.29 g/cm3, and the soil compaction from 0 to 30 cm was 300 N/cm2.
The field test aimed to measure the actual trenching depth, fertilizer application uniformity, soil-covering efficiency, and power consumption, and to compare the results with the simulation data for validation and further optimization of the machine’s operational parameters.
2.4.2. Test Methods and Evaluation Indicators
- Power Consumption Test
According to the power consumption evaluation test method for trenching machinery, as specified in Chinese Mechanical Industry Standard JB/T 11908-2014 “Agricultural disc ditcher” [31], the following procedure was followed: consistent with the simulation parameters, the machine’s trenching blade rotational speed was set to 260 r/min, the forward speed was set to 0.4 m/s, and the trenching component was lowered to the target depth of 300 mm. The length of the test area was 300 cm; to ensure data accuracy, the middle 100 cm were designated as the data collection zone. Within the data collection zone, five points at equal intervals were selected. At each point, a multimeter was used to measure the current and voltage at the engine’s power supply terminals, from which the trenching power consumption was calculated. The test was repeated over three passes, yielding a total of 15 measurement points for current and voltage readings.
- 2.
- Fertilization Uniformity Test
The soil–fertilizer uniformity test was conducted in accordance with the fertilization machinery evaluation test method specified in Chinese National Industry Standard GB/T 20346.2-2022 “Equipment for distributing fertilizer—Part 2: Fertilizer distributor in lines” [32]. The following procedure was followed: consistent with the simulation parameters, the machine’s trenching blade rotational speed was set to 260 r/min, the forward speed was set to 0.4 m/s, and the length of the test area was 300 cm. After fertilization, within the middle 100 cm of the area, five equidistant measurement points were selected. At each measurement point, a 10 cm-long section of soil and fertilizer was collected and weighed separately. The test was repeated for three passes, resulting in a total of 15 measurement points for fertilizer mass, which were then used to calculate the soil–fertilizer mixture uniformity.
- 3.
- Fertilizer Leakage Rate
Taking the soil surface as the horizontal plane, after mixing and covering the soil with fertilizer, the soil–fertilizer mixture area was vertically divided into three depth layers: surface layer (0–10 cm), upper layer (10–20 cm), and lower layer (20–30 cm). The fertilizer leakage rate was defined as the ratio of the amount of fertilizer in the upper and lower layers to that in the surface layer.
3. Test Results and Discussion
3.1. EDEM Simulation Results and Discussion
During the operation process, the spatial positional relationships between the trenching, fertilizing, and soil-covering devices, as well as the synergistic coordination among the components, have a significant impact on the mixing effect of soil and fertilizer. To analyze the soil and fertilizer transport mechanisms of each device at different operational stages, this study employed EDEM post-processing technology to evaluate the kinetic energy and motion trends of simulated soil and fertilizer particles. As shown in Figure 13, taking operational conditions with a forward speed of 0.3 m/s and a trenching speed of 350 r/min as an example, the kinetic energy and motion trends of soil and fertilizer particles were observed. During the trenching process, the trenching device cuts through the soil via high-speed rotation, causing soil particles to be thrown upward and dispersed. Although the soil dispersion process is chaotic and irregular, most soil particles exhibit similar motion trends, eventually landing within a relatively fixed dispersion range. At this stage, the soil-covering device deflects the soil in a predetermined direction, guiding the motion trajectory of the soil particles. The detached soil is thrown backward along the leading surface of the soil-covering plate under the action of the high-speed rotating trenching cutter, with its kinetic energy gradually increasing. Due to inertia and internal forces, the soil continues to move and reaches the discharge surface, no longer influenced by the trenching cutter. Under the guiding effect of the discharge surface, the soil particles descend along a specific trajectory and collide with the fertilizer particles discharged from the fertilizing chute. At the moment of collision, the kinetic energy of the soil particles decreases, and the trajectories of some soil particles are altered, thereby affecting the landing point of the soil–fertilizer mixture. Ultimately, the soil–fertilizer mixture precisely falls into the trench created by the trenching device. Subsequently, the soil continues to move downward and backward, covering the soil–fertilizer mixture and completing the entire process of trenching, fertilizing, and soil covering.
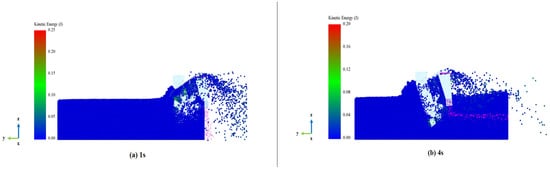
Figure 13.
Process of soil–fertilizer mixing and covering. (a) At 1 s; (b) at 4 s.
3.1.1. Simulation Analysis of Three Different Fertilization Schemes
After the simulation, post-processing analysis of the experimental results was conducted using the Grid Bin Group method for layer-by-layer statistical analysis of the working area. The area was divided into three depth layers: 0~10 cm (surface layer), 10~20 cm (upper layer), and 20~30 cm (lower layer). The number of fertilizer particles in each depth layer was counted, and the leakage fertilizer rate was then calculated according to Formula (12).
In this study, the uniformity of soil–fertilizer mixing was calculated using a sampling method [25]. The Grid Bin Group method was used to select the central 1000 mm of the analysis area in EDEM’s setup selections, dividing it into 20 × 20 × 20 mm cells to count the soil and fertilizer particle numbers in different regions. A group of 20 samples were randomly selected for the experiment, each group of samples was selected three times and the average value was obtained, the number of soil particles and fertilizer particles in the samples was counted. Finally, the uniformity of soil–fertilizer mixing was calculated according to Formula (11). The leakage fertilizer rate and soil–fertilizer mixture uniformity were used as evaluation metrics to calculate and assess the three fertilization schemes, as shown in Figure 14.
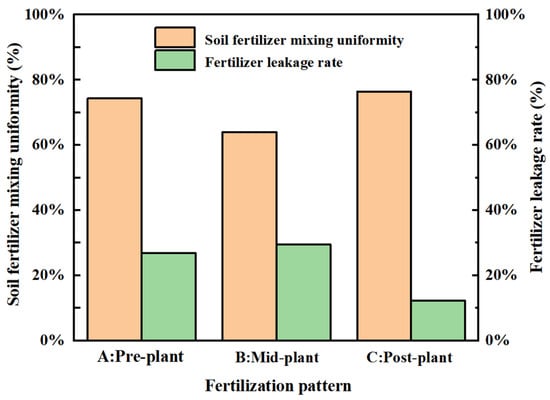
Figure 14.
Fertilization results of three different schemes.
After a simulation comparison of pre-plant fertilization, mid-plant fertilization, and post-plant fertilization, the results were as follows: the pre-plant fertilization was mainly concentrated in the soil surface of 0~10 cm, resulting in a high leakage rate and lower soil–fertilizer mixture uniformity; the mid-plant fertilization was mainly concentrated in the soil surface of 0~10 cm below the surface, resulting in a high leakage rate but better soil–fertilizer mixture uniformity; and the post-plant fertilization was mainly concentrated in the upper and lower layers of the surface of 10~30 cm, and the fertilizer leakage rate was low. Both the soil and fertilizer mixture uniformity and the fertilizer leakage rate could better meet and suit the fertilization trend requirements of deep application of organic fertilizer in orchards. Thus, based on the scheme comparison and analysis, post-plant fertilization was found to be the most advantageous method for ensuring better soil–fertilizer mixture uniformity and lower leakage rate.
3.1.2. Response Surface Analysis
A Box–Behnken response surface test was carried out, and the test scheme and results are shown in Table 6.
Table 6.
Response surface test scheme and results.
- Regression Analysis of Trenching Power Consumption
A regression fitting analysis was conducted on the test results to derive a quadratic regression model for trenching power consumption with respect to the experimental factors. The analysis of variance (ANOVA) for the tillage power consumption model is presented in Table 7.
Table 7.
ANOVA for the trenching power consumption model.
The regression analysis based on the experimental results led to a quadratic regression model for trenching power consumption in relation to the experimental factors. The ANOVA results showed that p < 0.01, indicating that the model was highly significant. The model’s lack-of-fit term p = 0.2263, suggesting no significant lack of fit, and the regression formula was well fitted and suitable for predictive analysis. The factors x1 (trenching speed), x2 (forward speed), and x3 (bending angle of trenching knife) had a highly significant impact on y1 (trenching power consumption). Based on the p-values for the factors, the influence on tillage power consumption was ranked from largest to smallest as follows: x1, x2, x3. The interaction terms x1x2 and x2x3 had significant effects on power consumption, while other interactions were not significant. Among the quadratic terms, the regression formula for each objective function, after excluding non-significant terms, are as follows:
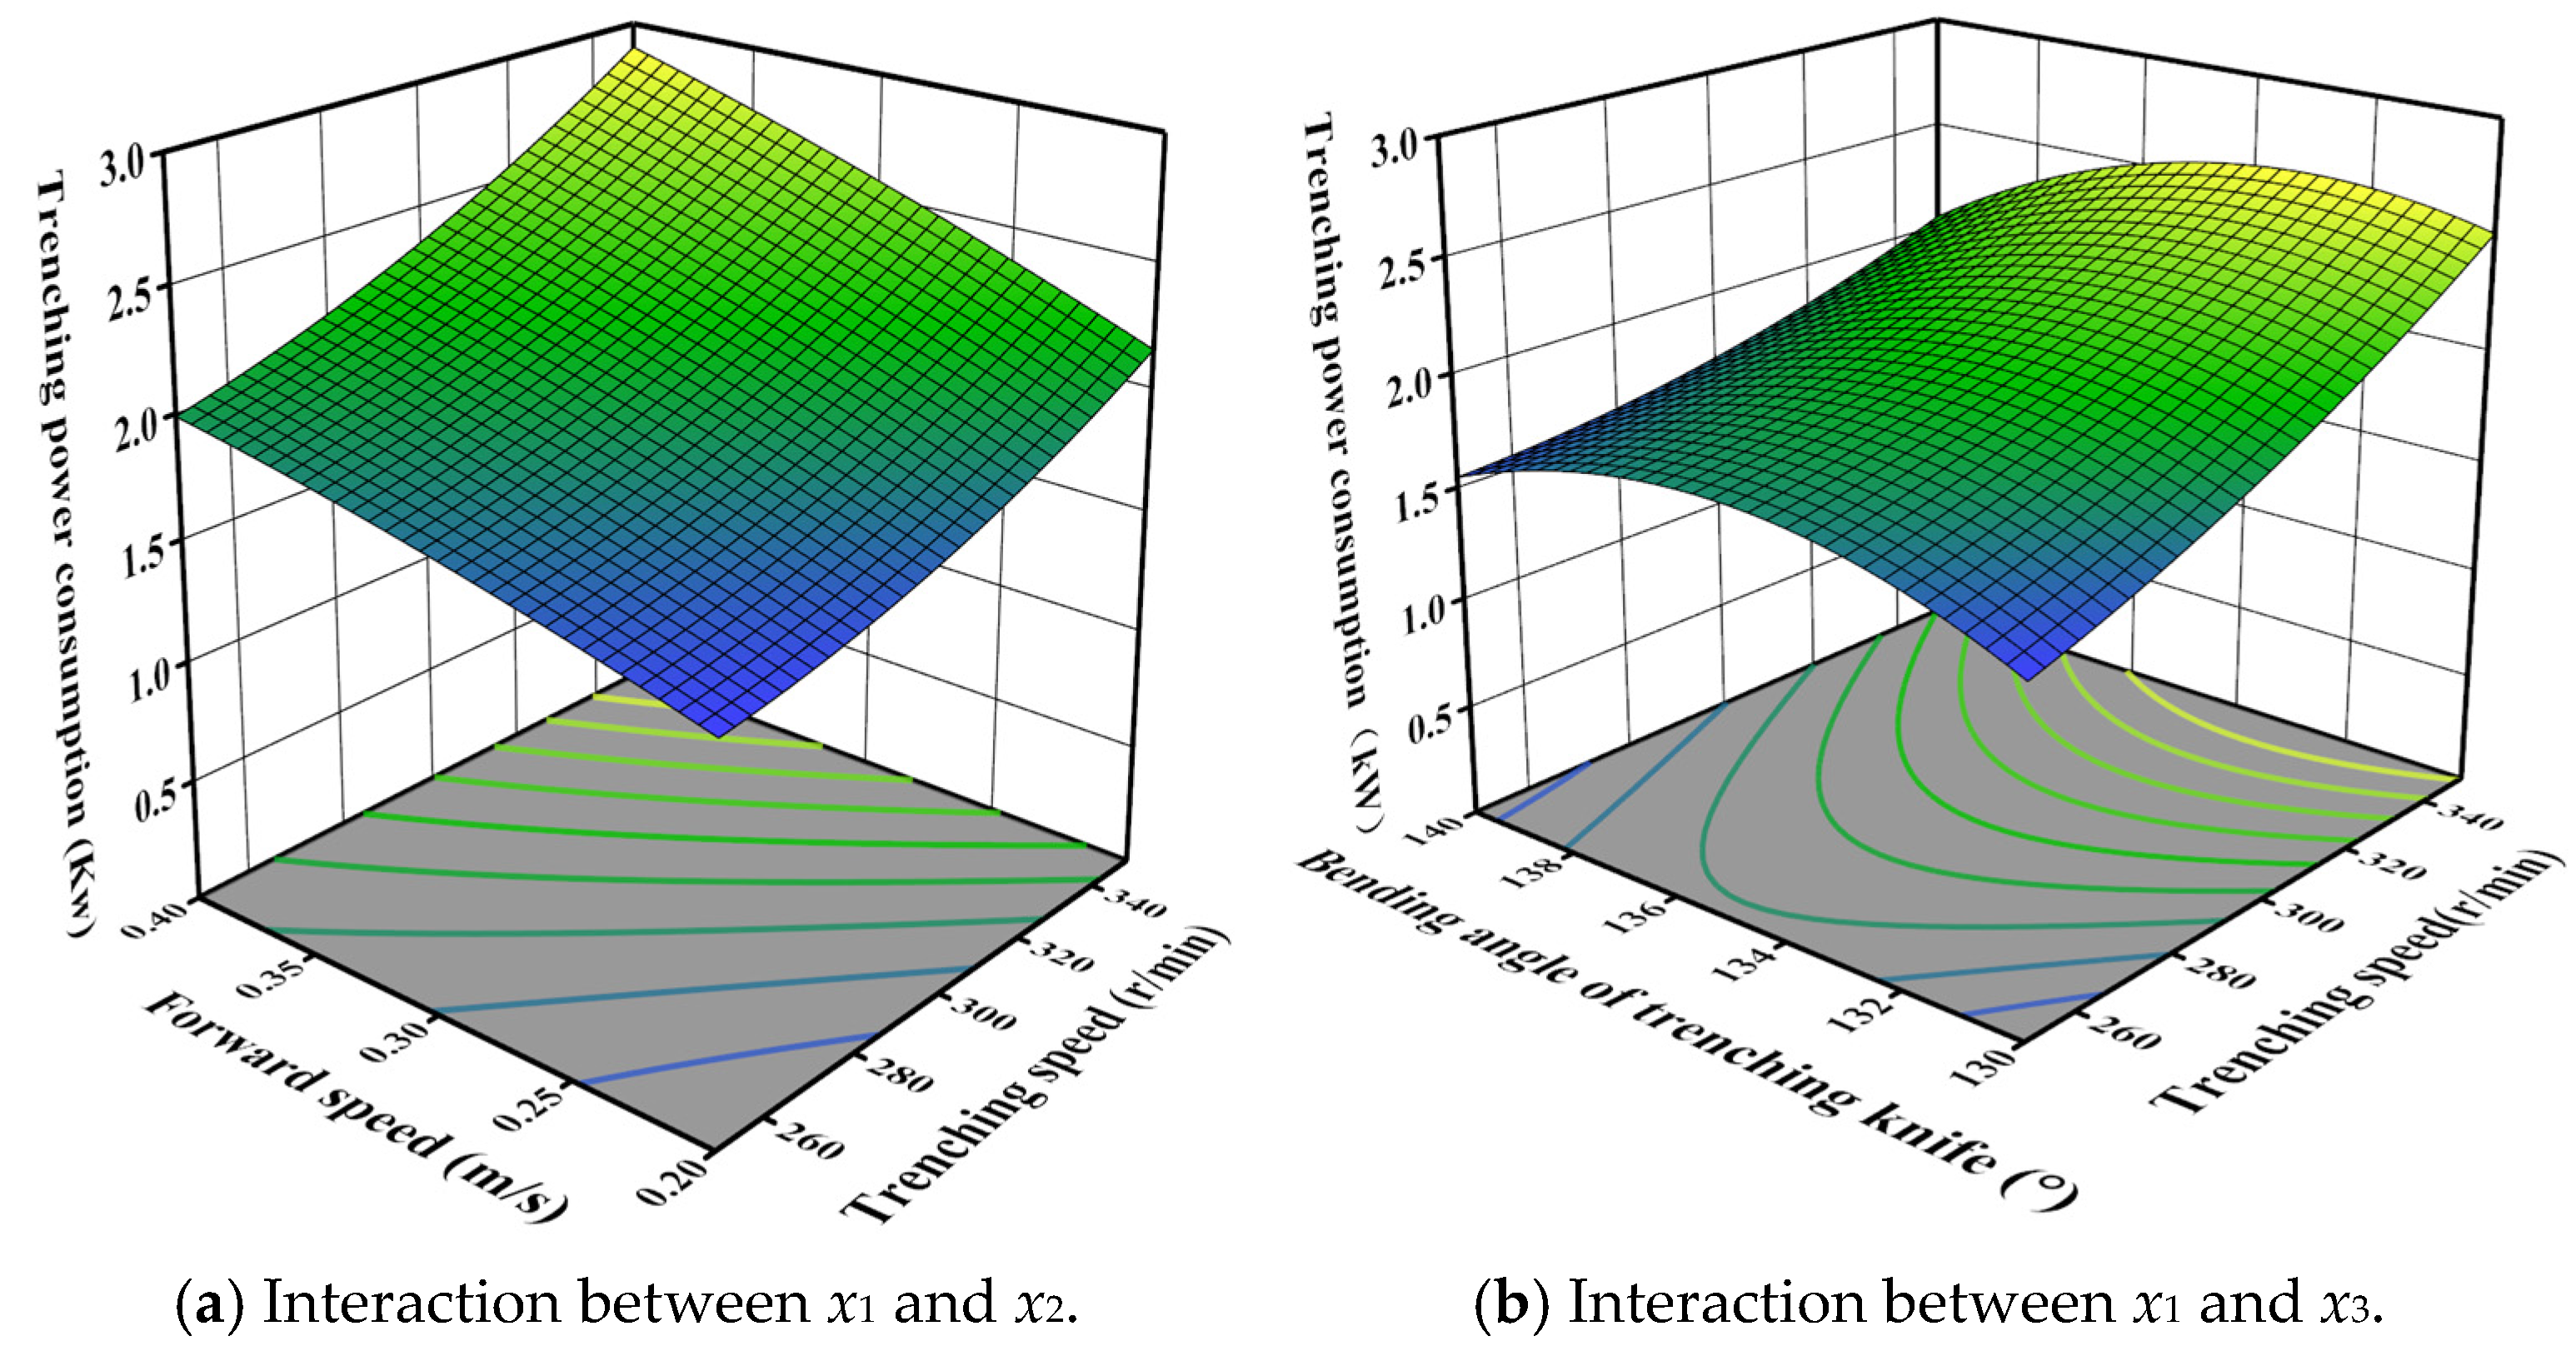
The influence surface of the interaction between variables on the trenching power consumption is shown in Figure 15. Figure 15a shows the interaction of trenching speed and forward speed on trenching power consumption. When the forward speed and the bending angle of the trenching knife were constant, the trenching power consumption increased with the increase in the trenching speed. The trenching power consumption curve along the direction of forward speed changed faster than the speed along the direction of trenching speed, indicating that at the test level, the trenching power consumption was more significantly affected by the forward speed than by the trenching speed. Figure 15b shows the interaction of trenching speed and bending angle of the trenching knife on trenching power consumption. When the forward speed and the trenching speed were constant, the trenching power consumption increased first and then decreased gradually. This was because when the bending angle of the trenching knife exceeded 130°, the torque force required by the trenching knife during rotation became larger, and when the bending angle of the trenching knife exceeded 135°, the torque force required by the trenching knife during rotation became smaller, but the trenching process had significant blade wear and a poor trenching effect on the soil. Therefore, the appropriate bending angle was beneficial for reducing the trenching torque and improving the quality of trenching.
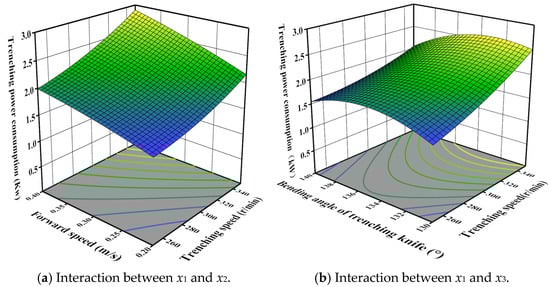
Figure 15.
Interaction effects of variables on power consumption.
- 2.
- Soil–Fertilizer Mixture Uniformity Model Variance and Response Surface Analysis
A regression fitting analysis was performed on the test results to derive a quadratic regression model for the experimental factors and soil–fertilizer mixture uniformity. The variance analysis for the soil–fertilizer mixture uniformity model is shown in Table 8.
Table 8.
Variance analysis for soil–fertilizer mixture uniformity model.
Based on the regression fitting analysis, a quadratic regression model was obtained for experimental factors and soil–fertilizer mixture uniformity. The variance analysis results indicated that p < 0.01, showing that the model was highly significant. The lack-of-fit term p = 0.0960 suggests that there were no significant lack-of-fit factors, and the regression formula was well fitted and suitable for predictive analysis. The factors x2 and x3 had a highly significant impact on y2 (soil–fertilizer mixture uniformity). The factor x1 also had a significant effect on soil–fertilizer mixture uniformity. The p-value analysis showed that the influence on soil–fertilizer mixture uniformity decreased in the following order: x3, x2, x1. The interaction term x1x2 had an extremely significant effect on soil–fertilizer mixture uniformity, with a p-value of less than 0.001, indicating a highly significant interaction between tillage speed and cutting speed on mixture uniformity. Among the quadratic terms, except for x12, the remaining terms significantly influenced soil–fertilizer mixture uniformity. After excluding non-significant terms, the regression formula for each objective function is as follows:
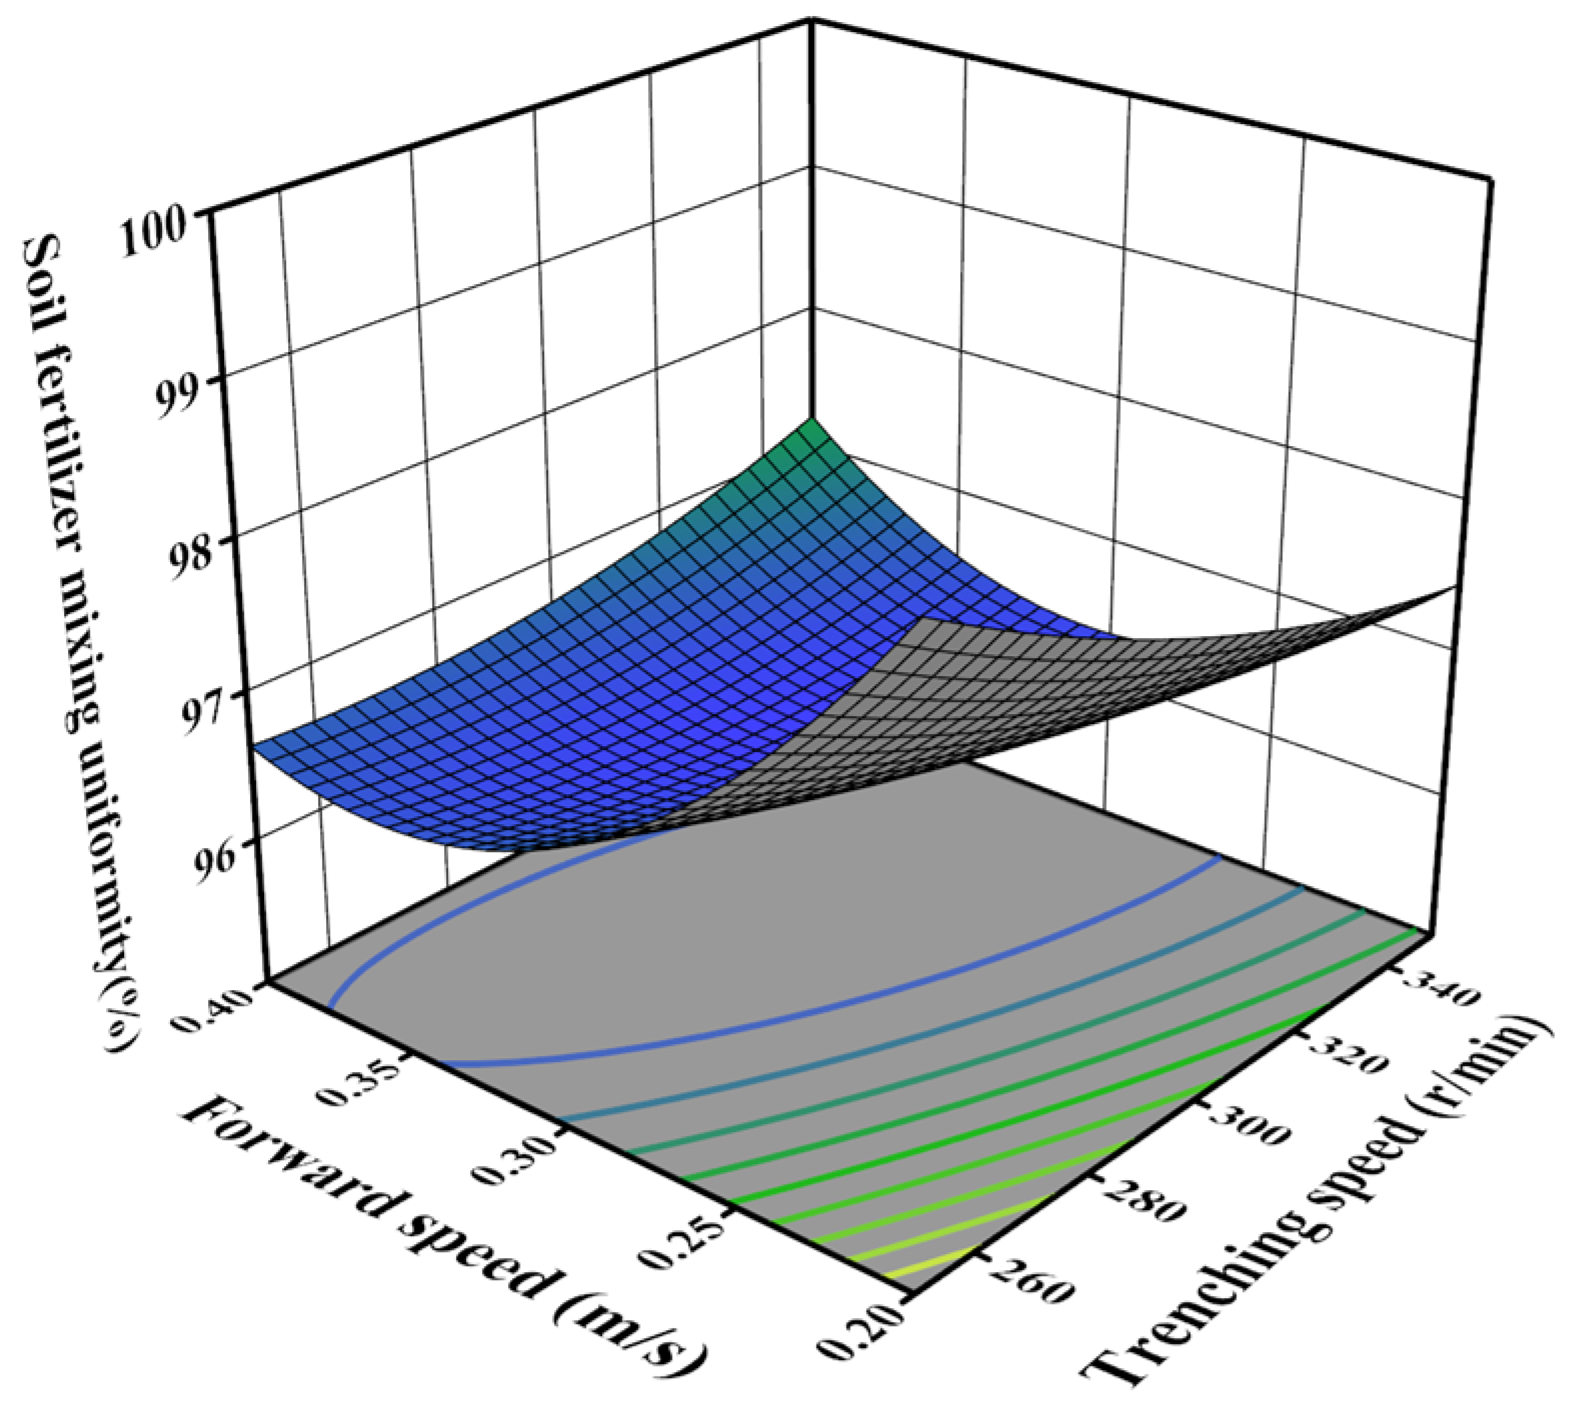
The influence surface of the interaction between variables on the soil–fertilizer mixture uniformity is shown in Figure 16. Figure 16 shows the interaction of trenching speed and forward speed on the soil–fertilizer mixture uniformity. When the forward speed and the bending angle of the trenching knife were constant, the soil–fertilizer mixture uniformity decreased slowly with the increase in the trenching rotation speed, because in the process of increasing the trenching rotation speed, the scattering speed of soil particles also increased, which weakened the effect of collision and stirring between soil particles and fertilizer particles. When the trenching speed and bending angle of the trenching knife were constant, the soil–fertilizer mixture uniformity decreased first and then increased slowly with the increase in the advancing speed. The variation in the soil–fertilizer mixture uniformity curve along the direction of forward speed was faster than that along the direction of trenching speed, indicating that at the test level, the influence of forward speed on soil–fertilizer mixture uniformity was more significant than that under the influence of trenching speed.

Figure 16.
Interaction effects of variables on soil–fertilizer mixture uniformity.
3.1.3. Optimization and Validation of Seedling Extraction Parameters
Due to the inconsistent effects of various factors on trenching power consumption and soil–fertilizer mixture uniformity, global multi-objective optimization was required. The objective functions were to minimize the trenching power consumption y1 and maximize the soil–fertilizer mixture uniformity y2. The variables were the trenching speed x1, forward speed x2, and bending angle of the trenching knife x3. The optimization was performed using quadratic models between the experimental factors and indices in the Design-Expert 12.0 software’s optimization module, with equal weights assigned to both performance indicators. The optimization model was:
The optimization results were as follows: the trenching speed was 265.03 r/min, the forward speed was 0.40 m/s, and the bending angle of trenching knife was 130°. According to the optimization results, the trenching component model was established to simulate the trenching power consumption, and the soil–fertilizer mixture uniformity were 1.74 kW and 77.15%, respectively.
3.2. Field Test Results and Discussion
3.2.1. Trenching Power Consumption Test
The real-time operating power consumption in the data collection zone is shown in Table 9, and the trenching test is shown in Figure 17. The average values for the simulation and field trials were 1.79 kW and 1.93 kW, respectively, with a relative error of 7.44%. This indicates that the mechanical characteristics of the simulated soil model are in good agreement with those of the actual soil. The simulation model calculated a lower operational power consumption than the field trial measurements, likely due to the presence of residual roots and gravel in the actual trenching environment. This will be the focus of future model optimizations. The optimized model can be used to analyze the interaction between the trenching tool set and residual roots or gravel until they are either smoothly cut or slide along the blade edge. This can provide design guidance for optimizing parameters in litchi orchard trenching operations.
Table 9.
Results of trenching power consumption test.

Figure 17.
Trenching test.
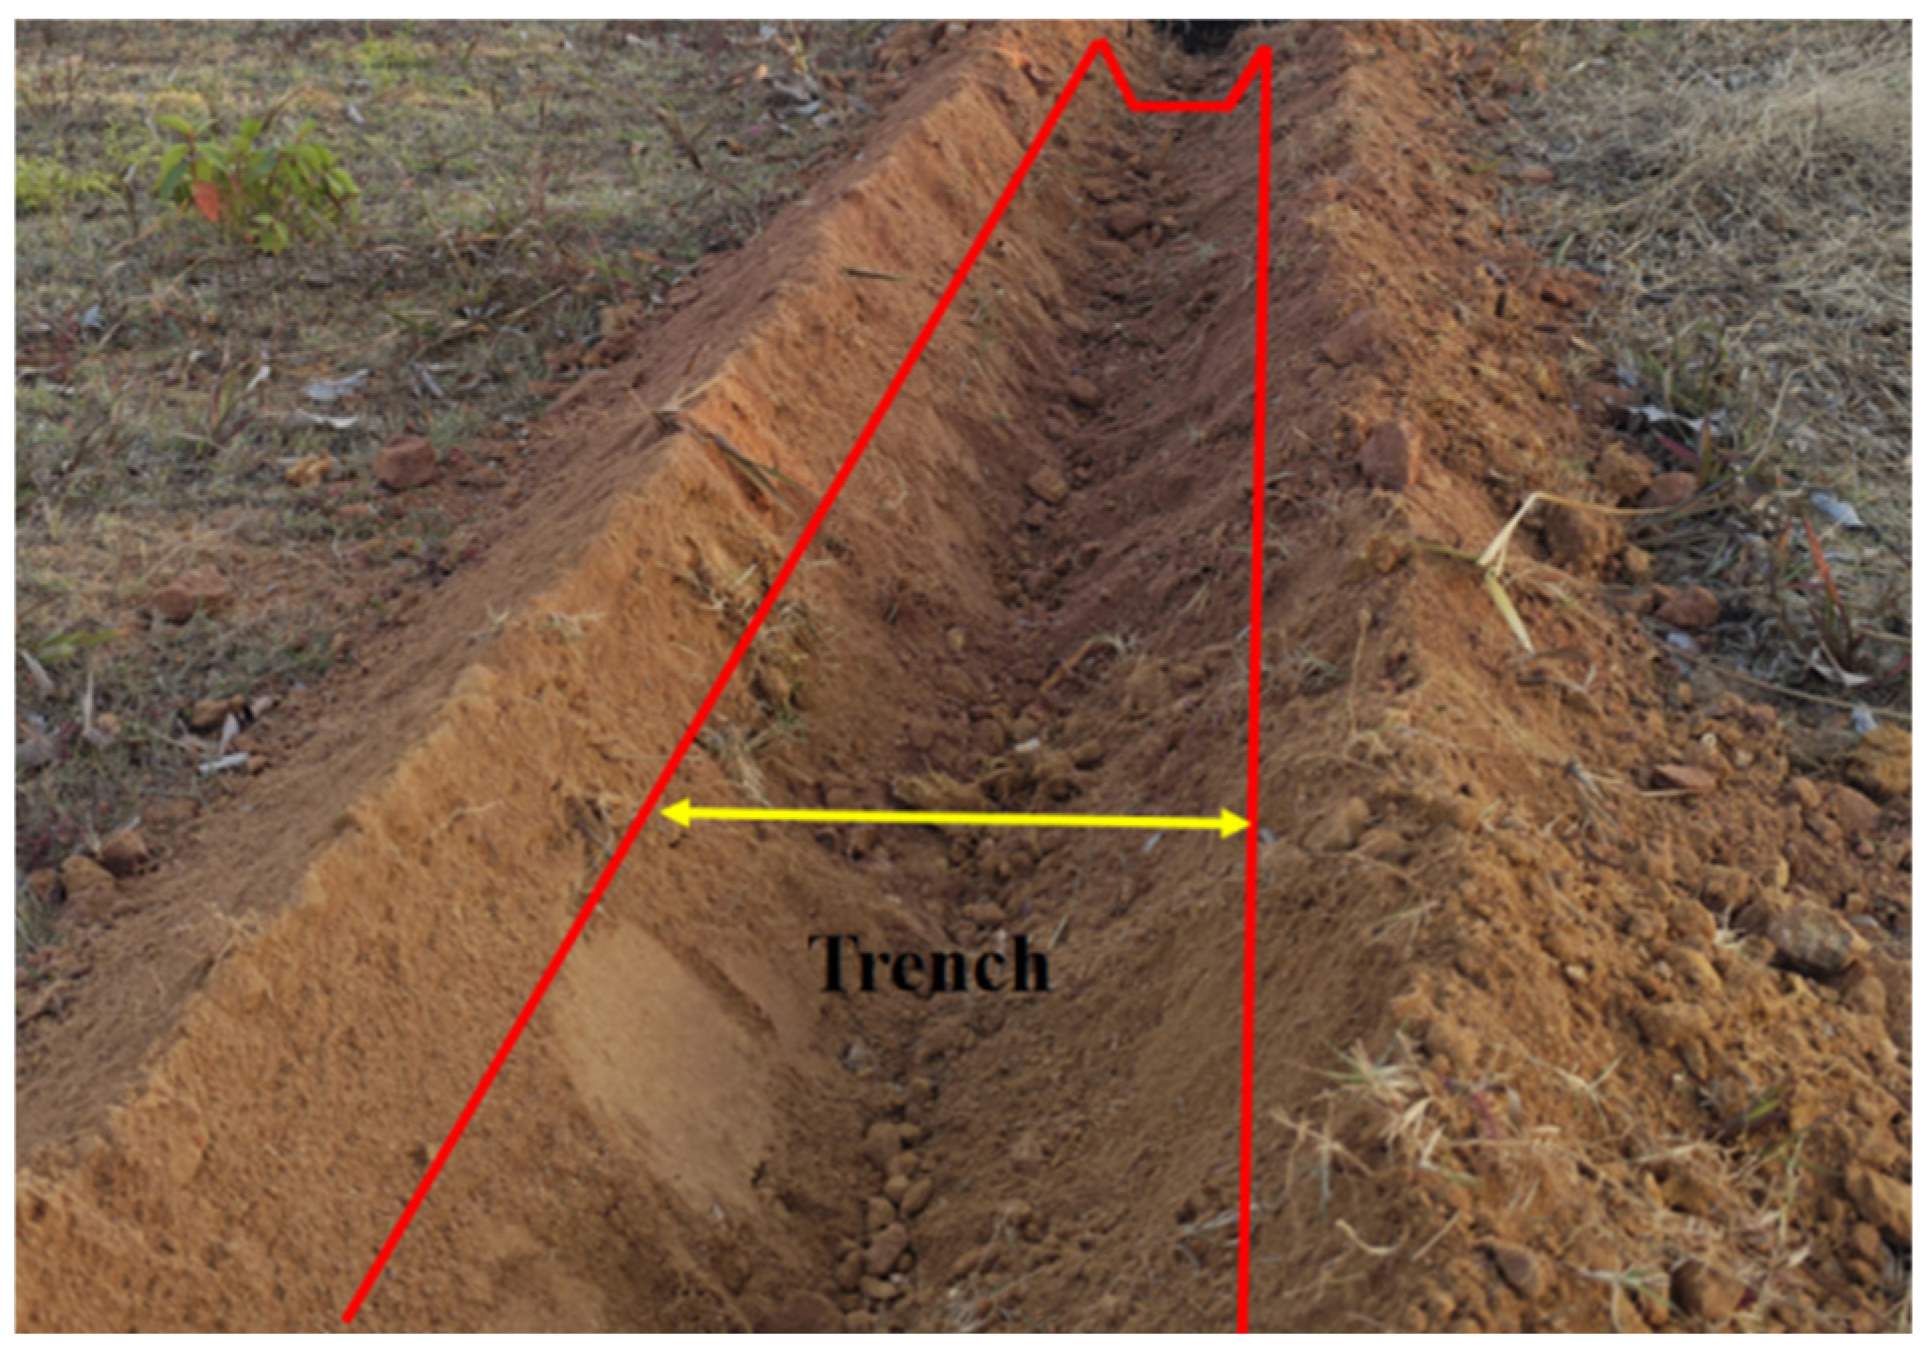
3.2.2. Soil–Fertilizer Mixture Uniformity
After the trenching, fertilizing, and covering process in Figure 18, the soil–fertilizer mixture uniformity at various sampling points was determined and is shown in Table 10. The field trial soil–fertilizer mixture uniformity was 76.16%, and the average relative error between the simulation and field trial mixture uniformity was 4.50%, indicating that the established simulation model can accurately predict the optimization results. Based on the technical specifications for soil–fertilizer mixture uniformity, the field trial results meet the mixing quality evaluation requirements.
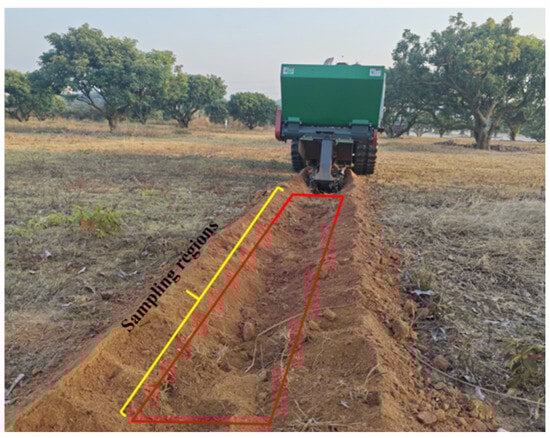
Figure 18.
Soil–fertilizer mixture uniformity test.
Table 10.
Results of soil–fertilizer mixture uniformity test.
According to the relevant evaluation test method for trenching machinery, as specified in “JB/T 11908-2014 Agricultural disc ditcher” [31] and “GB/T 20346.2-2022 Equipment for distributing fertilizer—Part 2: Fertilizer distributor in lines” [32], the results strongly confirmed the reliability of the regression model, as demonstrated by the relative errors between the actual and predicted values, all of which were below the threshold of 10%, and show harmonious agreement between the actual and expected values. The research results can provide reference for the structural transformation of orchard trenching machines and the management of trenching operation parameters.
In orchard trenching and fertilization operations, soil and fertilizer mix uniformity is crucial to ensuring full utilization of the fertilizer, thereby enhancing the uptake of nutrients by the root system, which is a key factor. Mechanized fertilization overcomes the problem of uneven nutrient distribution and concentration caused by the single fertilization method, greatly reduces labor intensity, and saves time and labor cost. Objective factors such as soil type, wind speed, and the physical properties of the fertilizer may have a slight impact on the trenching and fertilization performance of the equipment, but the machine’s performance far exceeds industry standards. From an innovative standpoint, the integration of trenching, fertilizing, and soil covering reflects the characteristics of automation and intelligence to a certain extent. This crawler-type self-propelled orchard trenching and fertilizing machine has been tested only in the experimental orchards of South China Agricultural University and the Mingyuan Ecological Garden in Gaozhou. However, to further enhance its environmental adaptability and technological advancement, systematic testing should be conducted in more typical orchard environments, particularly under the dwarf rootstock high-density planting mode, to verify the machine’s passability and operational stability.
In order to promote the development of unmanned orchards, the control system of the crawler-type self-propelled orchard trenching and fertilizing machine can continue to be improved in the next plan, the control system will be upgraded to an intelligent navigation system based on multi-modal perception to achieve centimeter-level positioning accuracy and dynamic obstacle avoidance functions, and the adaptive operation module will be developed by combining a deep reinforcement learning algorithm. The equipment can optimize the depth of trenching and control the amount of fertilizer in real time according to soil hardness, root distribution, and other parameters to realize automatic driving and adaptive trenching fertilization and soil-covering operations in different orchard environments, and thus reduce the manual participation and improve the production efficiency of the orchard.
4. Conclusions
A crawler-type self-propelled orchard trenching and fertilizing machine has been designed that is capable of trenching, fertilizing, and soil-covering operations in a single cycle. It exhibits certain levels of semi-automation, intelligence, and stability. Through theoretical analysis, various mechanisms have been devised, including the key components of the trenching device, fertilizing device, and soil-covering device. Three fertilizing simulation models (pre-plant, mid-plant, and post-plant) were established using EDEM discrete element software, with results indicating that the post-plant fertilizing mode better meets the soil–fertilizer mixing requirements for deep organic fertilizer application. Using trenching speed, forward speed, and bending angle of the trenching knife as experimental factors, with operating power consumption and soil–fertilizer mixing uniformity as evaluation indicators, a Box–Behnken experiment was conducted to optimize the parameters of the trenching and fertilizing components. A regression model was established to analyze the interaction between the experimental factors and indicators. The optimal operational parameter combination was determined as follows: trenching speed of 265.03 r/min, forward speed of 0.40 m/s, and bending angle of the trenching knife of 130°. Under these parameters, the trenching power consumption and soil–fertilizer mixing uniformity were 1.74 kW and 77.15%, respectively.
Orchard verification tests on the machine demonstrate that the machine operated with stability across all its components, exhibiting high consistency in the trenching depth, with trenching depth stability and soil–fertilizer mixing uniformity. The relative errors in trenching power consumption and soil–fertilizer mixing uniformity between the field tests and simulations were 7.40% and 4.50%. These results meet the agronomic requirements for trenching and fertilizing. The distribution of fertilizer particles was uniform, and the machine’s operational performance meets the industry standards stipulated by national regulations.
Author Contributions
Conceptualization, C.L. and C.M.; methodology, C.L. and Y.Z.; software, C.M.; validation, C.L., C.M. and Z.L.; formal analysis, C.L., C.M. and R.J.; investigation, C.L. and J.C.; resources, C.L. and Q.W. (Qinglin Weng); data curation, C.L., C.M. and Q.W. (Qian Wang); writing—original draft preparation, C.L. and C.M.; writing—review and editing, C.L. and C.M.; visualization, C.L. and C.M.; supervision, J.L.; project administration, J.L.; funding acquisition, J.L. All authors have read and agreed to the published version of the manuscript.
Funding
This research was supported by the earmarked fund for the Guangdong Laboratory for Lingnan Modern Agriculture (Grant No. NZ2021040 NT2021009), the Guangdong Province Rural Revitalization Strategy Special Project (Grant No. 2023-440000-60010000-9818), the 2022 Provincial Science and Technology Project of Agricultural High-Tech Industry Demonstration in Jinggangshan (Grant No. 20222-051256), the Special Project of Rural Vitalization Strategy of Guangdong Academy of Agricultural Sciences (Grant No. TS-1-4), the China Agriculture Research System (Grant No. CARS-32), and the Specific University Discipline Construction Project of South China Agricultural University in 2023 (Grant 2023B10564002).
Institutional Review Board Statement
Not applicable.
Data Availability Statement
The data presented in this study are available on request from the corresponding author.
Acknowledgments
The authors thank the helpful feedback from reviewers, which contributed to improving the quality of this manuscript.
Conflicts of Interest
The authors declare no conflicts of interest.
References
- Hou, Z.; Yang, H. Effects of soil fertilization periods and methods on the growth and fruiting of fruit trees. Pract. Rural Technol. 2019, 11, 48. [Google Scholar]
- Heidarisoltanabadi, M.; Elhami, B.; Imanmehr, A.; Khadivi, A. Determination of the most appropriate fertilizing method for apple trees using multi-criteria decision-making (MCDM) approaches. Food Sci. Nutr. 2023, 12, 1158–1169. [Google Scholar] [CrossRef] [PubMed]
- Sun, J.W.; Chen, Z.X.; Song, R.H.; Fan, S.; Han, X.; Zhang, C.F.; Wang, J.X.; Zhang, H. An intelligent self-propelled double-row orchard trenching and fertilizing machine: Modeling, evaluation, and application. Comput. Electron. Agric. 2025, 229, 109818. [Google Scholar] [CrossRef]
- Li, L.; Wu, T.Y.; Li, Y.S.; Hu, X.; Wang, Z.X.; Liu, J.F.; Qin, W.; Ashraf, U. Deep fertilization improves rice productivity and reduces ammonia emissions from rice fields in China; a meta-analysis. Field Crops Res. 2022, 289, 108704. [Google Scholar] [CrossRef]
- Liu, S.X.; Xu, C.B.; Zhang, H.J.; Jiang, H.; Quan, Z.K.; Wang, J.X. Research Status and Development Analysis of Base-fertilizer Application Equipment of Orchard. Chin. Soc. Agric. Mach. 2020, 51, 99–108. [Google Scholar]
- Sugirbay, A.; Zhao, K.; Liu, G.; Hu, G.; Chen, J.; Mustafin, Z.; Iskakov, R.; Kakabayev, N.; Muratkhan, M.; Khan, V.; et al. Double Disc Colter for a Zero-Till Seeder Simultaneously Applying Granular Fertilizers and Wheat Seeds. Agriculture 2023, 13, 1102. [Google Scholar] [CrossRef]
- Qin, K.; Lang, X.T.; Shen, Z.G.; Wu, Z.M.; Bi, H.J.; Cao, C.M.; Sun, Y.; Ge, J.; Fang, L.F. Design and Experiment of Reciprocating Furrowing and Loosening Machine for Tea Garden. Trans. Chin. Soc. Agric. Mach. 2024, 55, 29–39. [Google Scholar]
- Li, J.; Li, H.C.; Chen, Y.Y.; Lin, P.Y.; Zhang, Q.Q.; Cheng, Y.; Yang, Z.; Huang, G.W. Research on Ditching Mechanism of Self-Excited Vibration Ditching Machine. Agronomy 2023, 13, 905. [Google Scholar] [CrossRef]
- Zeng, Y.; Li, J.; Li, H.C.; Zhang, Q.Q.; Li, C.; Li, Z.; Jiang, R.P.; Mai, C.D.; Ma, Z.; He, H.W. Research on the ditching resistance reduction of self-excited vibrations ditching device based on MBD-DEM coupling simulation. Front. Plant Sci. 2024, 15, 1372585. [Google Scholar] [CrossRef] [PubMed]
- Ye, R.; Ma, X.; Zhao, J.; Liao, J.; Liu, X.; Xi, L.; Su, G. Optimization and Design of Disc-Type Furrow Opener of No-Till Seeder for Green Manure Crops in South Xinjiang Orchards. Agriculture 2023, 13, 1474. [Google Scholar] [CrossRef]
- Chen, W.X.; Ren, J.B.; Huang, W.L.; Chen, L.B.; Weng, W.X.; Chen, C.C.; Zheng, S.H. Design and Parameter Optimization of a Dual-Disc Trenching Device for Ecological Tea Plantations. Agriculture 2024, 14, 704. [Google Scholar] [CrossRef]
- Zhang, G.; Zhang, Z.; Xiao, M.; Bartos, P.; Bohata, A. Soil-Cutting Simulation and Parameter Optimization of Rotary Blade’s Three-Axis Resistances by Response Surface Method. Comput. Electron. Agric. 2019, 164, 104902. [Google Scholar] [CrossRef]
- Matin, M.A.; Hossain, M.I.; Gathala, M.K.; Timsina, J.; Krupnik, T.J. Optimal Design and Setting of Rotary Strip-Tiller Blades to Intensify Dry Season Cropping in Asian Wet Clay Soil Conditions. Soil. Tillage Res. 2021, 207, 104854. [Google Scholar] [CrossRef]
- Dai, F.; Guo, W.J.; Song, X.F.; Zhang, Y.; Shi, R.J.; Wang, F.; Zhao, W.Y. Optimization of mechanized soil covering path based on the agronomic mode of full-film double-ditch with double-width filming. Int. J. Agr. Biol. Eng. 2022, 15, 139–146. [Google Scholar] [CrossRef]
- Guo, D.; Wen, L.; Jia, D.; Cheng, Z.; Ning, M.; Wen, J. Optimal Design and Experiment of Arc-groove Double-spiral Fertilizer Discharge Device. Trans. Chin. Soc. Agric. Mach. 2022, 53, 118–125. [Google Scholar]
- Wang, X.Z.; Fang, W.Q.; Han, D.L.; Chen, X.G. Review of the Research on Soil Disturbance by Tools. Appl. Sci. 2023, 13, 338. [Google Scholar] [CrossRef]
- Niu, Y.; Zhang, J.Y.; Qi, J.T.; Meng, H.W.; Peng, H.J.; Li, J.H. Design and Test of Soil–Fertilizer Collision Mixing and Mulching Device for Manure Deep Application Machine. Agriculture 2023, 13, 709. [Google Scholar] [CrossRef]
- Zhang, H.J.; Xu, C.B.; Liu, S.X.; Jiang, H.; Zhang, C.F.; Wang, J.X. Design and Experiment of Orchard Double Row Ditching-fertilizer Machine with Automatic Depth Adjustment. Trans. Chin. Soc. Agric. Mach. 2021, 52, 62–72. [Google Scholar]
- Yuan, Q.; Xu, L.; Niu, C.; Ma, S.; Yan, C.; Zhao, S.; Liu, F.; Wang, K. Development of organic fertilizer deep applicator soil-fertilizer mixing layered backfill device for orchards. J. Agric. Eng. 2021, 37, 11–19. [Google Scholar]
- Wang, J.W.; Xu, Y.N.; Wang, C.Y.; Xiang, Y.S.; Tang, H. Design and simulation of a trenching device for rice straw burial and trenching based on MBD-DEM. Comput. Electron. Agric. 2023, 207, 107722. [Google Scholar] [CrossRef]
- Zhang, Z. Development and Experiment of Simulating Orchard Trencher Based on the Simulation of Soil Cutting Process by Edged Tool. Master’s Thesis, Shandong Agricultural University, Taian, China, 2020. [Google Scholar]
- Wang, X.Y.; Tang, Y.R.; Lan, H.P.; Liu, Y.; Zeng, Y.; Tang, Z.H.; He, Y.C.; Zhang, Y. Performance Analysis and Testing of Spiral Quantitative Fertiliser Distributors in Orchards. Appl. Sci. 2023, 13, 8941. [Google Scholar] [CrossRef]
- Chen, P.L.; Su, J.H.; Xu, J.; Liu, M.H. Design and Experiment of Hilly Orchard Vertical Spiral Ditching-fertilizing Machine. Trans. Chin. Soc. Agric. Mach. 2024, 55, 223–233+274. [Google Scholar]
- Zhu, X.H.; Zhao, H.S.; Fu, S.K.; Li, X.D.; Guo, W.C.; Zhang, L.X. Design and Test of Applicator for Kiwifruit Orchards to Mix Organic Fertilizer into Soil without Furrowing. Trans. Chin. Soc. Agric. Mach. 2023, 54, 133–142. [Google Scholar]
- Tan, H.C.; Ma, S.; Shen, S.C.; Ma, J.L.; Zhou, H.N.; Xu, L.M. Design and experimentation of a chain reversal trenching and fertilization device for vineyard organic fertilizer. Trans. Chin. Soc. Agric. Eng. 2024, 40, 12–23. [Google Scholar]
- Kang, J.M.; Li, S.J.; Yang, X.J.; Liu, L.J.; Li, C.R. Experimental verification and simulation analysis on power consumption of dise type ditcher. Trans. Chin. Soc. Agric. Eng. 2016, 32, 8–15. [Google Scholar]
- China Academy of Agricultural Mechanization Science. Manual of Agricultural Machinery Design; Machinery Industry Press: Beijing, China, 1998. [Google Scholar]
- Ucgul, M.; Fielke, J.M.; Saunders, C. Three-dimensional discrete element modelling (DEM) of tillage: Accounting for soil cohesion and adhesion. Biosyst. Eng. 2015, 129, 298–306. [Google Scholar] [CrossRef]
- Fotuhi, M.J.; Hazem, Z.D.; Bingül, Z. Adaptive Joint Friction Estimation Model For Laboratory 2 DOF Double Dual Twin Rotor Aerodynamical Helicopter System. In Proceedings of the 2018 6th International Conference on Control Engineering & Information Technology (CEIT), Istanbul, Turkey, 25–27 October 2018; pp. 1–6. [Google Scholar]
- Ma, C.; Meng, H.W.; Zhang, J.; Zhang, C.; Zhao, Y.; Wang, L.H. Research and experiment on the trenching performance of orchard trenching device. Sci. Rep. 2023, 13, 18941. [Google Scholar] [CrossRef] [PubMed]
- JB/T 11908-2014; Agricultural Disc Ditcher. National Standardization Administration: Beijing, China, 2014.
- GB/T 20346.2-2022; Equipment for Distributing Fertilizer—Part 2: Fertilizer Distributor in Lines. National Standardization Administration: Beijing, China, 2022.


Disclaimer/Publisher’s Note: The statements, opinions and data contained in all publications are solely those of the individual author(s) and contributor(s) and not of MDPI and/or the editor(s). MDPI and/or the editor(s) disclaim responsibility for any injury to people or property resulting from any ideas, methods, instructions or products referred to in the content. |
© 2025 by the authors. Licensee MDPI, Basel, Switzerland. This article is an open access article distributed under the terms and conditions of the Creative Commons Attribution (CC BY) license (https://creativecommons.org/licenses/by/4.0/).