Article

Parameter Calibration and Experimental Verification of the Discrete Element Model of the Edible Sunflower Seed

1
College of Mechanical and Electrical Engineering, Xinjiang Agricultural University, Urumqi 830052, China
2
Xinjiang Key Laboratory of Intelligent Agricultural Equipment, Urumqi 830052, China
3
School of Agricultural Engineering, Jiangsu University, Zhenjiang 212013, China
*
Author to whom correspondence should be addressed.
Agriculture 2025, 15(3), 292; https://doi.org/10.3390/agriculture15030292
Submission received: 9 January 2025 / Revised: 28 January 2025 / Accepted: 28 January 2025 / Published: 29 January 2025
(This article belongs to the Special Issue Intelligent Agricultural Machinery Design for Smart Farming)

Abstract

:
A discrete element model of the edible sunflower seed was constructed, addressing the lack of an accurate model for edible sunflower seeds in the simulation process of seeding, cleaning, and transportation, and it was calibrated and verified through actual and simulation tests. Taking the edible sunflower seed as the research object, the range of its simulation parameter values was preliminarily determined through actual tests. Using the seed repose angle as the test index, the simulation parameters of the seed were calibrated through the Plackett—Burman test, the steepest climb test, and the Box–Behnken test. The suspension velocity of the seed model was determined by the Fluent–EDEM coupling simulation test, and the reliability of the discrete element model of the edible sunflower seed was verified. The simulated test results showed that the seed repose angle obtained by the optimization test was 35.823°, which exhibited a relative error of 0.103% in comparison to the average values obtained from the actual test. The simulated suspension velocity of the seed was 6.98 m/s. with a deviation of 0.55 m/s from the average suspension velocity obtained through the actual test. The discrete element model of the edible sunflower seed is accurate and reliable, offering guidance for improving the design of machinery used for seeding and harvesting edible sunflowers.

1. Introduction

Sunflower is extensively grown all over the world and its production is steadily rising each year. In 2024, the total world production of sunflower seeds exceeded 21 million tons (USDA) [1]. Sunflower is generally divided into oil sunflower and edible sunflower. China is the world’s largest producer and exporter of edible sunflower seeds, boasting an annual planting area exceeding 500,000 ha, which constitutes approximately half of the world’s total edible sunflower planting area [2]. China’s sunflower industry has become an important industry to improve people’s dietary structure and increase farmers’ income [3,4]. The development of the edible sunflower industry is inseparable from various types of agricultural machinery and devices in the production process. When designing and optimizing the structure and operational parameters of production machinery, it is necessary to research the operation object. Therefore, the motion characteristics of edible sunflower seeds and the dynamic response characteristics with the mechanisms are the focus of research [5,6]. The traditional research methods are time-consuming and labor-intensive, and they are limited by the production cycle, which restricts the mechanization process of the edible sunflower industry. Over the past few years, due to the development of simulation technology, the discrete element method has become a crucial tool for researching the motion characteristics and dynamic response properties of agricultural materials [7,8].
There is an extensive amount of research focused on the calibration of discrete element parameters of agricultural materials [9]. Chen Yong et al. [10], Ma Wenpeng et al. [11], Shi Linrong et al. [12], Markauskas et al. [13], Zhang Shengwei et al. [14], and Ghodki et al. [15] analyzed and calibrated the intrinsic parameters and contact parameters of the discrete element models for cyperus esculentus seed, alfalfa seed, flax seed, maize grain, mung bean seed, and soybeans, respectively. The calibration method serves as a guideline for calibrating the simulation parameters of the edible sunflower seed.
In the area of sunflower research, Hao Jianjun et al. [16] calibrated the parameters of the discrete element model of the oil sunflower seed and verified the reliability of the model and simulation parameters through repose angle determination tests and electromagnetic hopper vibration tests. Li Fengli et al. [17] and Aorigele et al. [18] calibrated the simulation parameters of sunflower seed models by combining actual and simulation tests and verified the fluidity of the seed models. Wang Shuai et al. [19] established and verified the accuracy and applicability of sunflower seed models with different levels of precision using the multi-sphere and polyhedron filling methods. The pneumatic method is widely used in agricultural equipment such as seeding, cleaning, and transportation equipment for edible sunflower. However, current research on sunflower seed discrete element models mainly focuses on parameter calibration and seed flow verification, with limited studies on the motion characteristics of the sunflower seeds in the airflow field.
Suspension velocity is the basis for pneumatic system design and a key factor in determining reasonable wind speeds [20,21]. The coupling simulation based on Fluent–EDEM can effectively determine and verify the suspension velocity of the discrete element model for edible sunflower seeds and clarify the motion characteristics of the seed model in the airflow field [22,23,24]. Experts and scholars have conducted extensive research on determining the gas–solid coupling characteristics and suspension velocity of materials [25,26]. El-Sayed et al. [27] researched the aerodynamic characteristics of different kinds of peanut. The optimal airflow velocity to separate shelled peanut components from the shells was obtained through suspension velocity experiment. Jin Wei et al. [28] proposed a suspension separation method for residual film and impurities using EDEM–Fluent coupling, leveraging the differences in suspension velocity and flow characteristics between residual film and impurities such as soil and straw. Li Hongchang et al. [29,30] simulated the operation process of an air-screen cleaning device based on CFD–DEM (coupled simulation of discrete element method and computational fluid dynamics) coupling and analyzed the motion state of the material on the screen surface. Wen Xiangyu et al. [31] determined the suspension velocity of granular fertilizer according to the EDEM–Fluent coupling. The gas–solid two-phase flow coupling simulation based on Fluent–EDEM exhibits great accuracy in determining the suspension velocity of agricultural materials, providing theoretical and practical significance for analyzing the motion characteristics of edible sunflower seeds in the airflow field.
In this study, the discrete element model of the edible sunflower seed was constructed by measuring its physical intrinsic and contact parameters, and the simulation parameters of the model were calibrated. Using Fluent–EDEM coupling simulation, the motion characteristics of the calibrated seed model in the airflow field were analyzed to verify the model’s reliability. This research helps shorten the research cycle and reduce costs for developing mechanized equipment for seeding, cleaning, and transportation of edible sunflower.

2. Materials and Methods

2.1. Determination of Material Intrinsic Parameters

After the edible sunflowers were dried, the five-point sampling test was applied to collect samples from their growing area in Urumqi County, Xinjiang Province, on 1 October 2023. The kind of edible sunflower planted in the growing area is SH363. A total of 100 intact, non-deformed, and pest-free edible sunflower dishes were selected. After manual threshing, the whole and full seeds were selected for test.
The dimensions of the edible sunflower seed were determined. The average length, average width, and average thickness of the edible sunflower seed were 25.31 mm, 11.46 mm, and 5.95 mm, respectively. The moisture content of the seed during the suitable harvest period ranged from 16% to 23%.
To measure the density of the edible sunflower seed, an electronic balance was utilized to measure the weight of seeds. The average thousand-seed weight during the suitable harvest period was 2.698 kg. The liquid displacement method was used to measure the volume of the edible sunflower seed [32]. The calculated results showed that the density of the edible sunflower seed ranged from 348.57 kg/m3 to 421.54 kg/m3.
Poisson’s ratio is an elastic constant which reflects the transverse deformation of a material. Poisson’s ratio is calculated by measuring the deformation in the width and thickness directions of the material before and after compression [33]. The results showed that the Poisson’s ratio range of the edible sunflower seed was 0.442 ± 0.028.
The elastic modulus serves as an index which is utilized to measure the difficulty of elastic deformation of a material. It is commonly defined as the ratio of stress to strain in the same direction under unidirectional stress conditions. The elastic modulus of the seed was obtained from the force–displacement data over time [16]. The average elastic modulus of the edible sunflower seed was 1.014 × 10⁷ Pa, and the average shear modulus was 3.515 × 10⁷ Pa.

2.2. Determination of Contact Parameters

2.2.1. Determination of Static Friction Coefficient

The coefficient of static friction is the ratio of the maximum static friction force on a material to the normal pressure on the contact surface. In this research, using an inclined material plane to gauge the static friction coefficient. Before the test, the edible sunflower seed material plate (with seed shells tightly attached to the steel plate) and the steel plate were prepared as contact material plate. The process for measuring the static friction coefficient is illustrated in Figure 1, and Table 1 lists the test results.

2.2.2. Determination of Rolling Friction Coefficient

The coefficient of rolling friction reflects the degree of obstruction to rolling caused by the deformation of two materials in the contact area when the material rolls without sliding or exhibits a rolling tendency on the surface of the contact material. The dimensionless rolling friction coefficient is defined as the ratio of the work required to overcome the rolling frictional torque to the product of the normal force and the central displacement of the roller. It is expressed in Equation (1).
μ r = W F N L = W m c g L cos θ
where W is the work done by the material to overcome the rolling frictional torque, J; FN is the normal force exerted by the material on the contact material plate, N; mc is the weight of the material, kg; g is the acceleration of gravity, m/s2; L is the rolling displacement of the material along the inclined plane, m; θ is the inclination angle of the contact material plate, °; μr is the rolling friction coefficient.
The test bench for measuring the rolling friction coefficient of the seed primarily consisted of a Phantom I-SPEED TR high-speed camera (Olympus Corporation, Shanghai, China), computer, friction coefficient test rack, etc. A coordinate plate was used as the shooting background, and the high-speed camera was positioned approximately level with the movement plane of the edible sunflower seed. The process of measuring the rolling friction coefficient is presented in Figure 2.
Because edible sunflower seeds are irregular in shape, the rolling friction coefficient cannot be directly measured. To minimize the effect of sliding friction on the test results and ensure smooth rolling of the edible sunflower seeds, the seed materials (seed shells) were evenly adhered on the cylinders to form edible sunflower seed columns [34]. The rolling friction coefficient between the edible sunflower seed column and different contact materials was measured by rolling the edible sunflower seed column on the edible sunflower seed material plate and the steel plate. The outer diameter of the edible sunflower seed column was 23 mm. The edible sunflower seed column was regarded as a pure rolling motion on the contact material plate.
In this research, the rolling friction coefficient of edible sunflower seed was determined using the law of conservation of energy. Under pure rolling conditions, the energy transformation during the rolling process of the edible sunflower seed column along the inclined plane is shown in Equation (2).
E q = E k + E g + W E q = m c g L sin θ E k = 1 2 m c v c 2 E g = 1 2 I v c R 2 2 I = 1 2 m c R 1 2 + R 2 2
where Eq is the gravitational potential energy of the edible sunflower seed column, J; Ek is the translational kinetic energy of the edible sunflower seed column, J; Eg is the rolling kinetic energy of the edible sunflower seed column, J; vc is the central point velocity of the edible sunflower seed column, m/s; I is the moment of inertia of the edible sunflower seed column, kg·m2; R1 is the inner radius of the edible sunflower seed column, m; R2 is the outer radius of the edible sunflower seed column, m.
Equation (3) is obtained by combining Equation (1) with Equation (2).
μ r = tan θ v c 2 2 R 1 2 + R 2 2 2 g L R 2 2 cos θ
According to Equation (3), when the inclination angle of the contact material plate and the inner radius and outer radius of the sunflower seed column are constant, the rolling friction coefficient of the edible sunflower seed column depends only on the rolling displacement of the column along the inclined plane and the velocity at its center point.
During the test, one side of the contact material plate was raised until the edible sunflower seed column rolled freely without slipping, and the inclination angle of the contact material plate was maintained. A high-speed camera recorded the rolling process of the edible sunflower seed column.
A rectangular coordinate system was set up in the image of video during the rolling process, and the position coordinates of the center point were recorded as (x0, y0) when the edible sunflower seed column began to roll. After the edible sunflower seed column rolled for a period of time t, the position coordinate of the center point was recorded again as (xn, yn). Using proportional conversion, the rolling displacement of the edible sunflower seed column along the inclined plane was obtained as follows:
L = K 1 x n x 0 2 + y n y 0 2
where K1 is the proportionality coefficient between the actual size and the image size.
Because the time interval of each frame of the high-speed video was very short, the instantaneous velocity of the center point of the edible sunflower seed column was calculated by the displacement of the center point between adjacent frames and the time interval of each frame. The instantaneous velocity of the center point of the edible sunflower seed column was as follows:
v c = K 1 x n x n 1 2 + y n y n 1 2 + x n + 1 x n 2 + y n + 1 y n 2 2 Δ t
where xn−1, yn−1 are the horizontal and vertical coordinates of the center point of the edible sunflower seed column in the previous frame image after rolling for a period of time t; xn+1, yn+1 are the center point horizontal coordinate and vertical coordinate of the edible sunflower seed column in the next frame image after rolling for a period of time t; Δt is the time interval of each frame, s.
The edible sunflower seed column was tested with different contact material plates, and each set of tests was conducted 5 times. The test results are presented in Table 2.

2.2.3. Determination of Restitution Coefficient

The coefficient of restitution reflects the ability of a material to recover to its initial form after a collision. The coefficient of restitution between the edible sunflower seed and the contact materials is expressed as
e c = v 0 v 0
where v0 is the velocity of the edible sunflower seed after collision, m/s; v0 is the velocity of the edible sunflower seed before collision, m/s; ec is the coefficient of restitution.
The contact material plate was placed horizontally, and the seed was coated with paint. The seed fell freely from a given height h, and then it collided with the contact material plate. A high-speed camera was used to record the maximum rebound height and the number of frames between the primary collision point and the secondary collision point. After the edible sunflower seed became stationary on the contact material plate, the distance between the primary collision point and the secondary collision point was measured using the paint marks on the contact material plate.
When the corner of the edible sunflower seed collided with the contact material plate, the seed rebounded while undergoing rotation. During this process, a portion of the kinetic energy was transformed into work done by the moment of inertia, but it is difficult to quantitatively measure the work done by the moment of inertia during the test. When the large surface of the edible sunflower seed collided with the contact material plate, the edible sunflower seed did not easily rotate, and the energy transformed into work by the moment of inertia was small. Therefore, the test group in which the seed’s rotation was not obvious after the collision was selected to measure the coefficient of restitution [35]. Each combination of the seed and contact material plate was tested 5 times.
During the free fall of the edible sunflower seed from a given height h, the gravitational potential energy was transformed into kinetic energy. At the moment before the edible sunflower seed collided with the contact material plate, the gravitational potential energy of the edible sunflower seed was at its minimum, and the kinetic energy was at its maximum. The instantaneous velocity v0 of the edible sunflower seed before collision is shown in Equation (7).
v 0 = 2 g h
Because the edible sunflower seed presents an irregular form, the rebound direction of the seed after collision with the contact material plate exhibits a certain degree of randomness. At the highest point of rebound, the edible sunflower seed has both gravitational potential energy and kinetic energy. Ignoring air friction, the horizontal velocity of the edible sunflower seed after collision is equivalent to uniform motion, so the velocity of the edible sunflower seed after collision is given in Equation (8).
m g h = 1 2 m v 0 2 1 2 m v h 2 v h = K 2 L t 2
where vh is the horizontal velocity of the edible sunflower seed at the highest point of rebound, m/s; L’ is the distance between the primary collision point and the secondary collision point in the image, m; K2 is the proportionality coefficient between the actual size and the image size; t2 is the time interval between the primary collision point and the secondary collision point, s; h’ is the rebound height of the edible sunflower seed after collision, m; m is the weight of the edible sunflower seed, kg.
By substituting Equation (7) and Equation (8) into Equation (6), the seed coefficient of restitution is obtained as follows:
e c = 2 g h + K 2 L t 2 2 2 g h
By substituting test measurement data into Equation (9), the range and average value of the restitution coefficient of the seed were calculated. The Table 3 exhibits the results obtained from the tests.

2.3. Determination of Mechanical Properties

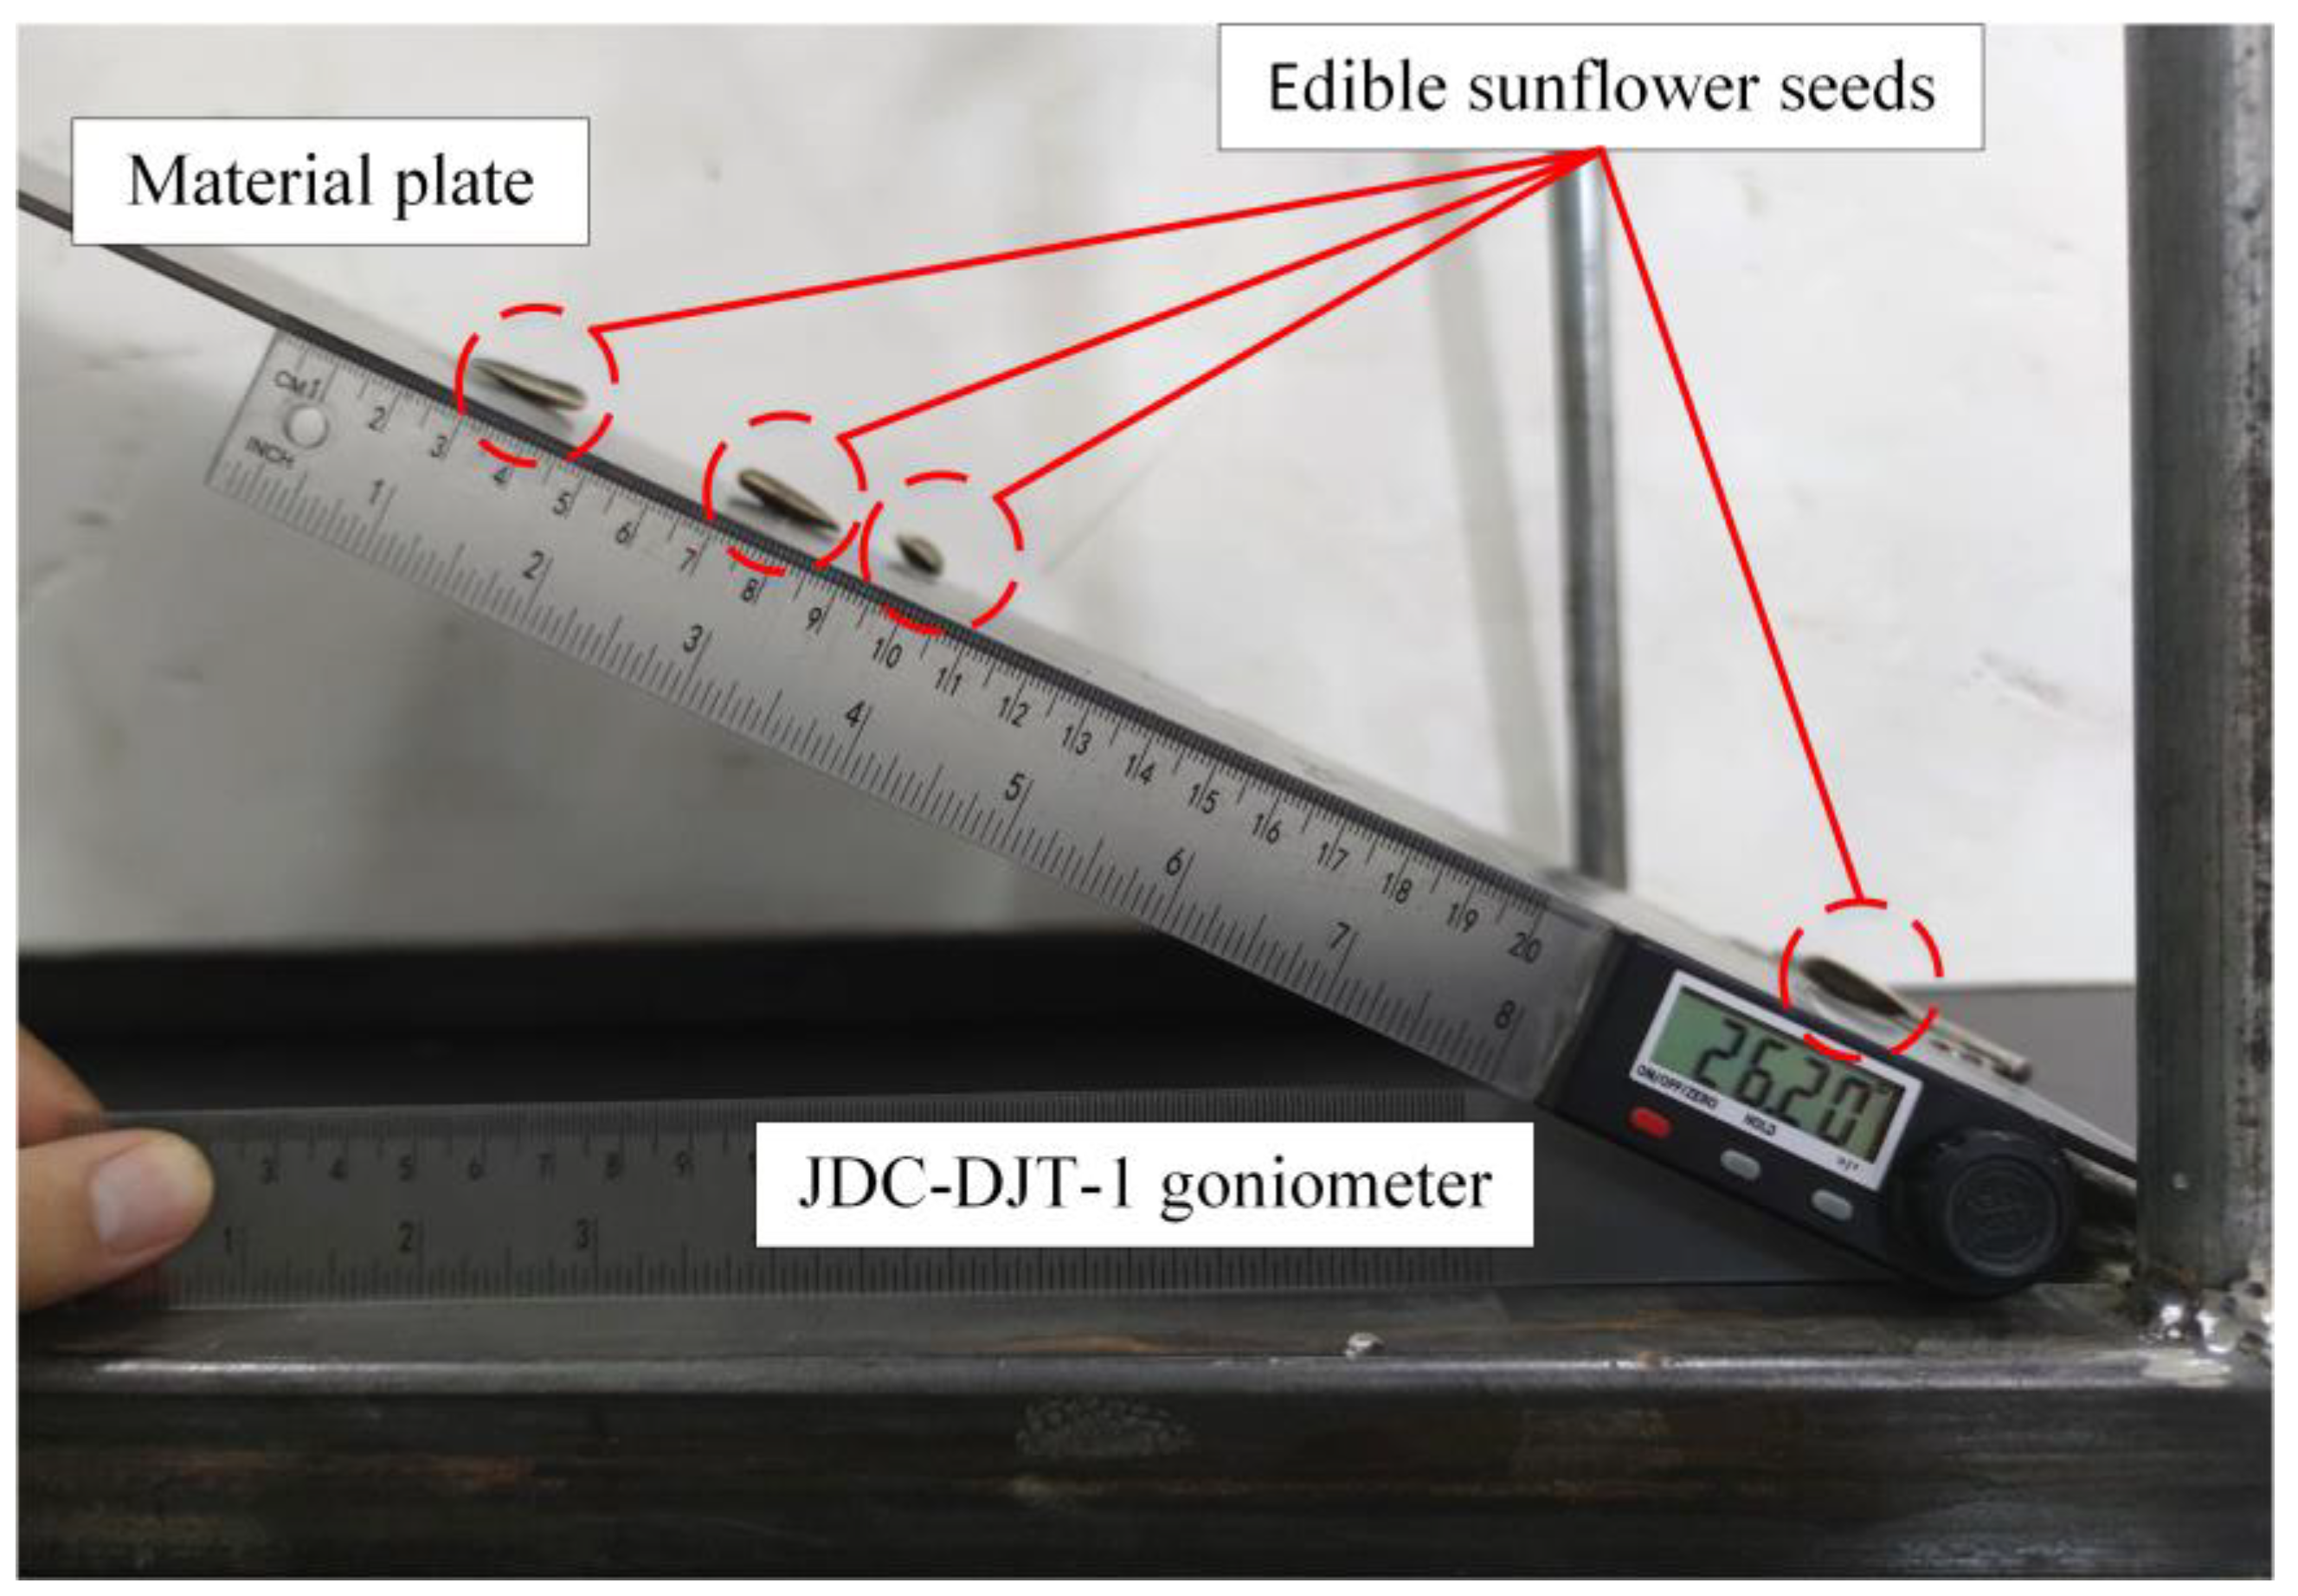
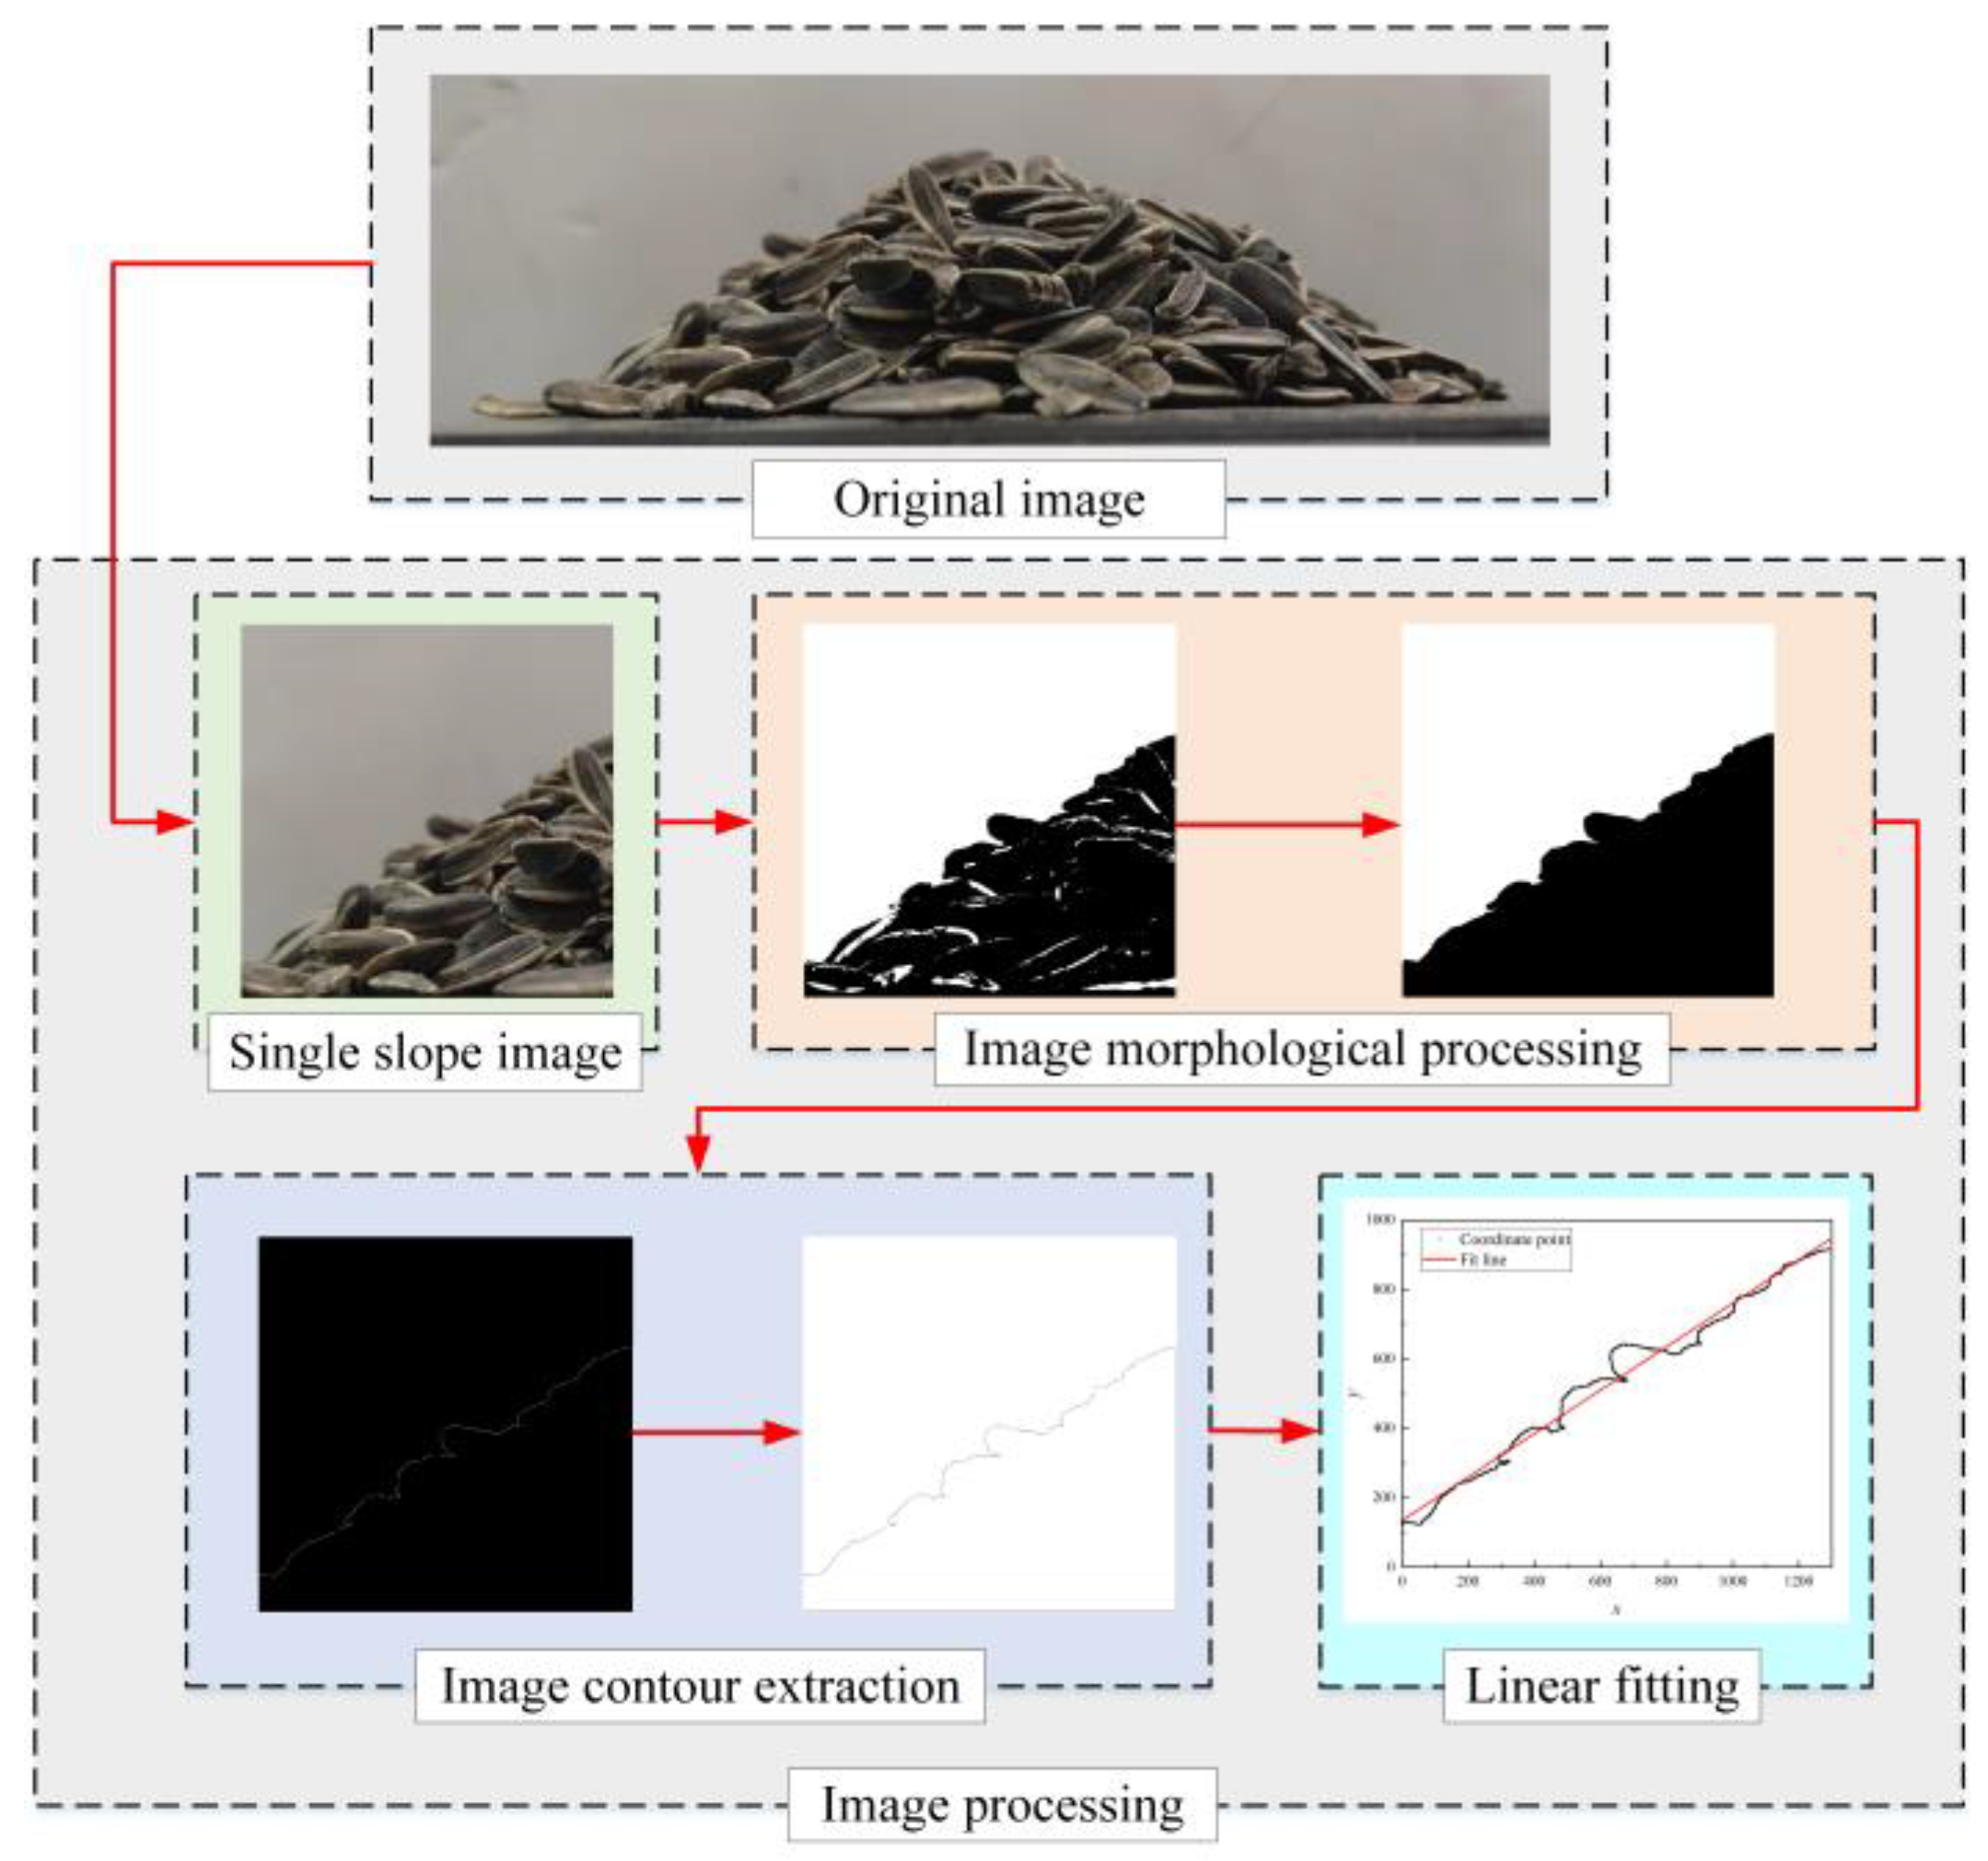
2.3.1. Determination of the Seed Repose Angle

The material repose angle can effectively reflect the flow and friction characteristics of a material group, which are mainly related to the variety type, hardness, moisture content, and surface roughness. In this study, the repose angle of edible sunflower seed during the suitable harvest period was determined using the cylinder lifting method [36].
First, the bottomless cylinder was placed on the horizontal steel plate, then filled with the edible sunflower seeds, and lifted at a constant speed perpendicular to the steel plate. The edible sunflower seeds gradually flowed out and accumulated on the horizontal steel plate, forming a cone shape. Once the edible sunflower seeds had completely flowed out of the cylinder and remained stationary, the angle between the cone surface of the seeds and the steel plate, which represented the seed repose angle, was gauged.
The cylinder was made of plexiglass, the inner diameter of the cylinder was 80 mm, the ratio of cylinder height to diameter was 3:1, and the hoisting speed of the cylinder perpendicular to the steel plate was 0.1 m/s. To accurately measure the repose angle of edible sunflower seed, after they had completely flowed out of the cylinder and formed a stationary slope, the front and lateral sides of the edible sunflower seed group were photographed vertically with the help of the camera. Image processing was applied to each slope in the seed accumulation image.
Taking a single slope image as an example: MATLAB R2022a software was used to process the image through grayscale, binarization, corrosion, filling, and denoising steps, then the bwperim function was used to extract the edge of the processed image. After transforming the image contour into coordinate data, the contour coordinate data were imported into Origin 2017 software for linear fitting. The tangent value of the slope of the fitted line represented the repose angle of the edible sunflower seeds. In each test, the repose angle was calculated on four slopes, and the results were averaged. The average repose angle was 35.86°. The process of seed accumulation images is shown in Figure 3.

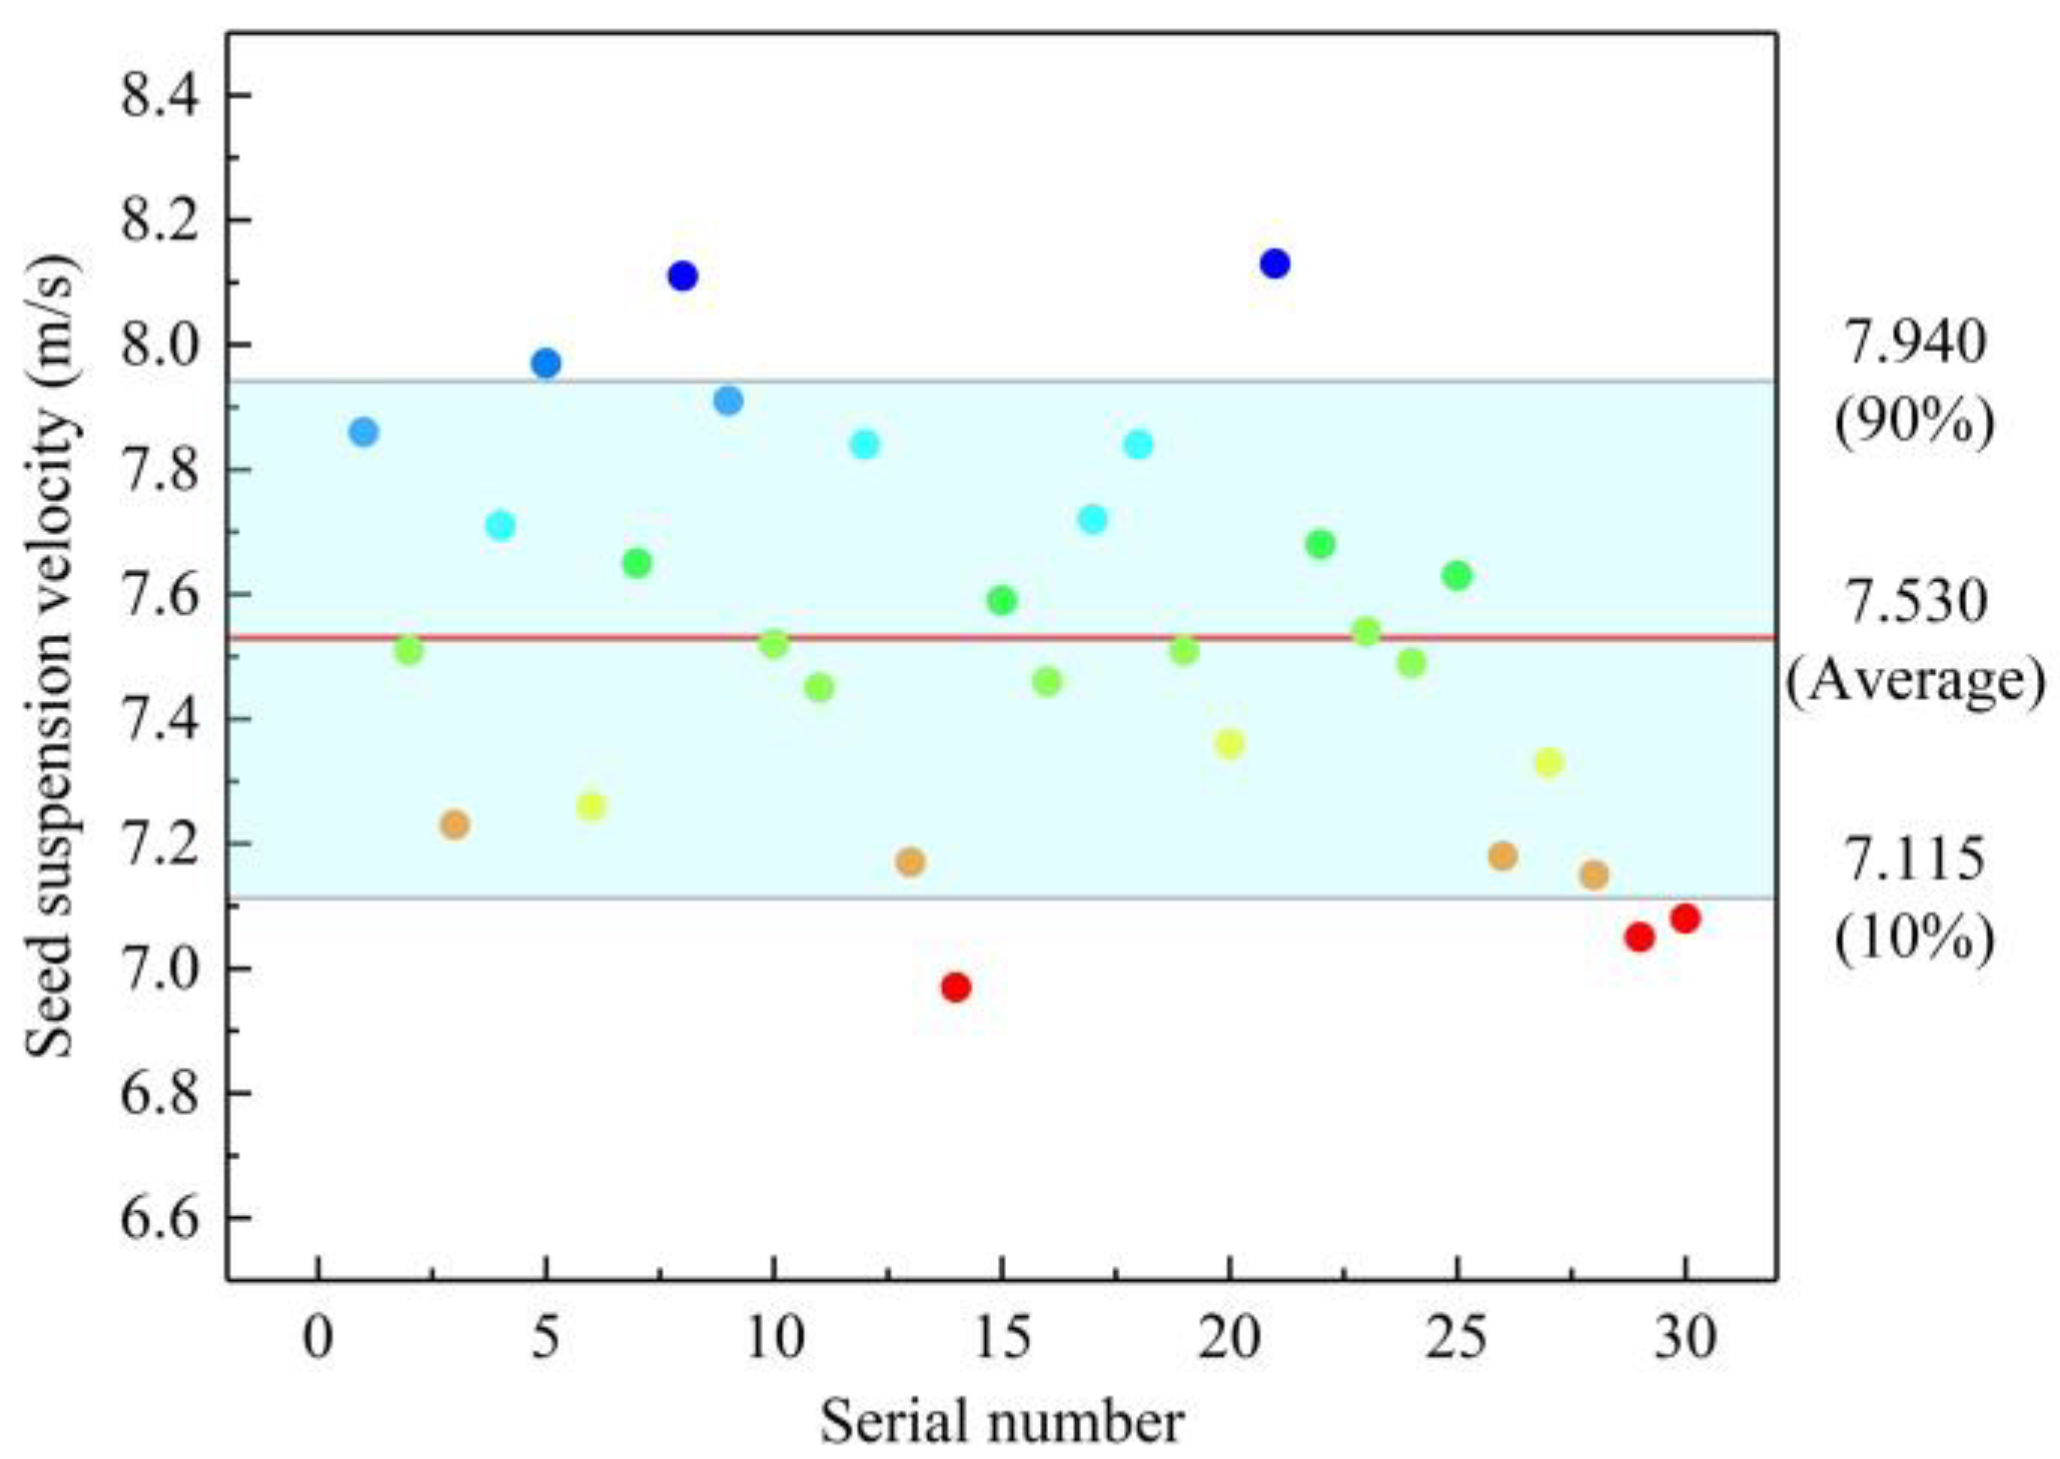
2.3.2. Determination of Seed Suspension Velocity

The material suspension velocity is the minimum airflow speed required to keep the material in a suspension state, and its value depends on the diameter, density, resistance coefficient of the material, and so on. The study of seed suspension velocity has a significant guiding value for the research of seeding and harvesting devices for the edible sunflower.
The theoretical value of the seed suspension velocity can be obtained through theoretical calculation. Since edible sunflower seeds are irregular in shape, their diameter needs to be corrected, and Equation (10) is obtained.
d s = 1.24 M a ρ s 1 3
where ds is the equivalent diameter of the edible sunflower seed, m; Ma is the average weight of the edible sunflower seed samples, kg. ρs is the average density of the edible sunflower seed samples, kg/m3.
The seed suspension velocity can be calculated according to Equation (11) [37].
v s = 3.62 K s d s ρ s ρ a C r ρ a 1 d s D i n 2
where Ks is the shape coefficient; ρa is the air density, kg/m3, the value is 1.29 kg/m3; Din is the inner diameter of the air duct, m; Cr is the resistance coefficient, which is 0.44 [31,37].
The shape coefficient of the edible sunflower seed was obtained by Equation (12).
1 K s = 1 2 1 K s 1 + 1 K s 2
where Ks1 is the rhomboid coefficient, which is 1.76; Ks2 is the square plate coefficient, which is 3.23 [5].
By substituting the parameter values into Equation (11), the theoretical value of the seed suspension velocity was calculated to be 7.38 m/s.
The actual suspension velocity of the edible sunflower seed was determined using the material suspension test bench, as depicted in Figure 4. A total of 600 edible sunflower seeds were randomly chosen during the suitable harvest period. The seeds were grouped into 30 sets, in which each set had 20 seeds, and the seed suspension velocity of each group was determined. The edible sunflower seeds were placed into the test bench, and the fan was driven by a motor. The fan blew air to suspend the seeds, and the suspension height of the seeds was observed by an air duct.
In this research, the wind speed of the fan was altered by controlling the motor speed, and a DLX-FSY-1603A anemometer (DELIXI, Wenzhou, China) was used to gauge the wind speed at the top of the transparent air duct. The measuring range of the anemometer is 0–40 m/s, with an accuracy of 0.01 m/s. The air duct consists of two parts: the upper part was a cone-shaped duct made of PVC transparent material, with a height of 800 mm, a bottom radius of 60 mm, and a top radius of 80 mm. The lower part was a cylindrical flow stabilizer duct, seamlessly connected to the cone-shaped duct, with a radius of 60 mm. Air entered from the bottom of the cylindrical flow stabilizer duct and exited from the top of the cone-shaped duct. The suspension velocity of the edible sunflower seed was calculated by Equation (13).
S c = h s ( R c max R c min ) L c + R c min 2 π v s = v d S c max S c
where Sc is the cross-sectional area of the cone-shaped duct at the suspension height of the edible sunflower seeds, m2; Rcmax is the top radius of the cone-shaped duct, m; Scmin is the bottom radius of the cone-shaped duct, m; Lc is the height of the cone-shaped duct, m; hs is the suspension height of the edible sunflower seeds, m; vs is the seed’s suspension velocity, m/s; vd is the wind speed measured at the top of the air duct, m/s.
The results of the suspension velocity of the edible sunflower seeds are illustrated in Figure 5. The color dots are the average seed suspension velocity for each test. The average suspension velocity of the edible sunflower seeds was 7.53 m/s, closely approximating the theoretical value of seed suspension velocity. The deviation between the actual and theoretical value is only 0.15 m/s.

2.4. Construction of Discrete Element Model

According to the real shape, and combined with the triaxial dimension of the edible sunflower seed, a three-dimensional model of the seed was created. The seed three-dimensional simulated model was imported into EDEM 2021 software. The edible sunflower seed three-dimensional model was used as the particle filling template. By filling particles in accordance with the contour of this template, the shape similarity between the seed model and the real object was enhanced. The discrete element model of the edible sunflower seed, composed of 34 particles of different diameters, was created by manual particle filling. Based on the previous test results, the basic parameters of the edible sunflower seed model were determined. The seed attributes were automatically calculated in the EDEM 2021 software, and the weight of the seed model was 2.705 × 10⁻³ kg. The thousand-seed weight of the seed model was approximately equal to that of the real seed; therefore, the volume filling of the model was reasonable, as shown in Figure 6.

2.5. Parameter Calibration of the Seed Model

There are a variety of complex motion conditions during the accumulation process of seeds. The repose angle can effectively analyze the scattering, flow, and friction characteristics of the seeds. Therefore, the seed model parameters were calibrated through a simulated repose angle determination test.
There are many parameters required for the creation of a discrete element model, and not all parameters have significant influence on the establishment of the seed model within the range of parameters obtained in actual tests. It is necessary to conduct experiments to determine the significance of each parameter to the seed repose angle, screen out the significant model parameters, and reduce the test cost. In this study, The Plackett—Burman test was designed through the Design-Expert software to find the key parameters, which have significant effect on the seed repose angle. Then, the steepest-ascent test was designed to narrow the value range of significant parameters. In the end, the Box–Behnken test was designed to analyze variance and optimize parameters. The value range of each parameter was set based on the results from actual test results. The coding table of model parameters is listed in Table 4.
Using SolidWorks 2020 software, the seed-filling cylinder and seed drop plate were modeled and exported in STL (STereoLithography) file format. After the STL file was imported into the EDEM 2021 software, the particle factory for generating simulated seed models was set up. When seed models were generated, the seed-filling cylinder was filled first, and then an interval 0.2 s was used to stabilize the seed models. Subsequently, the seed-filling cylinder was raised at a constant speed of 0.1 m/s, and the simulation was terminated once all the seed models had completely flowed out of the cylinder and become stationary. The seed accumulation images of the simulation experiment were processed to obtain the simulated seed repose angle. The simulated experiment process is presented in Figure 7.
The lifting speed and dimension parameters of the seed-filling cylinder were identical to those used in the actual repose angle determination test. The image processing method of seed accumulation images in the simulation test was the same as that used in the actual repose angle determination test.

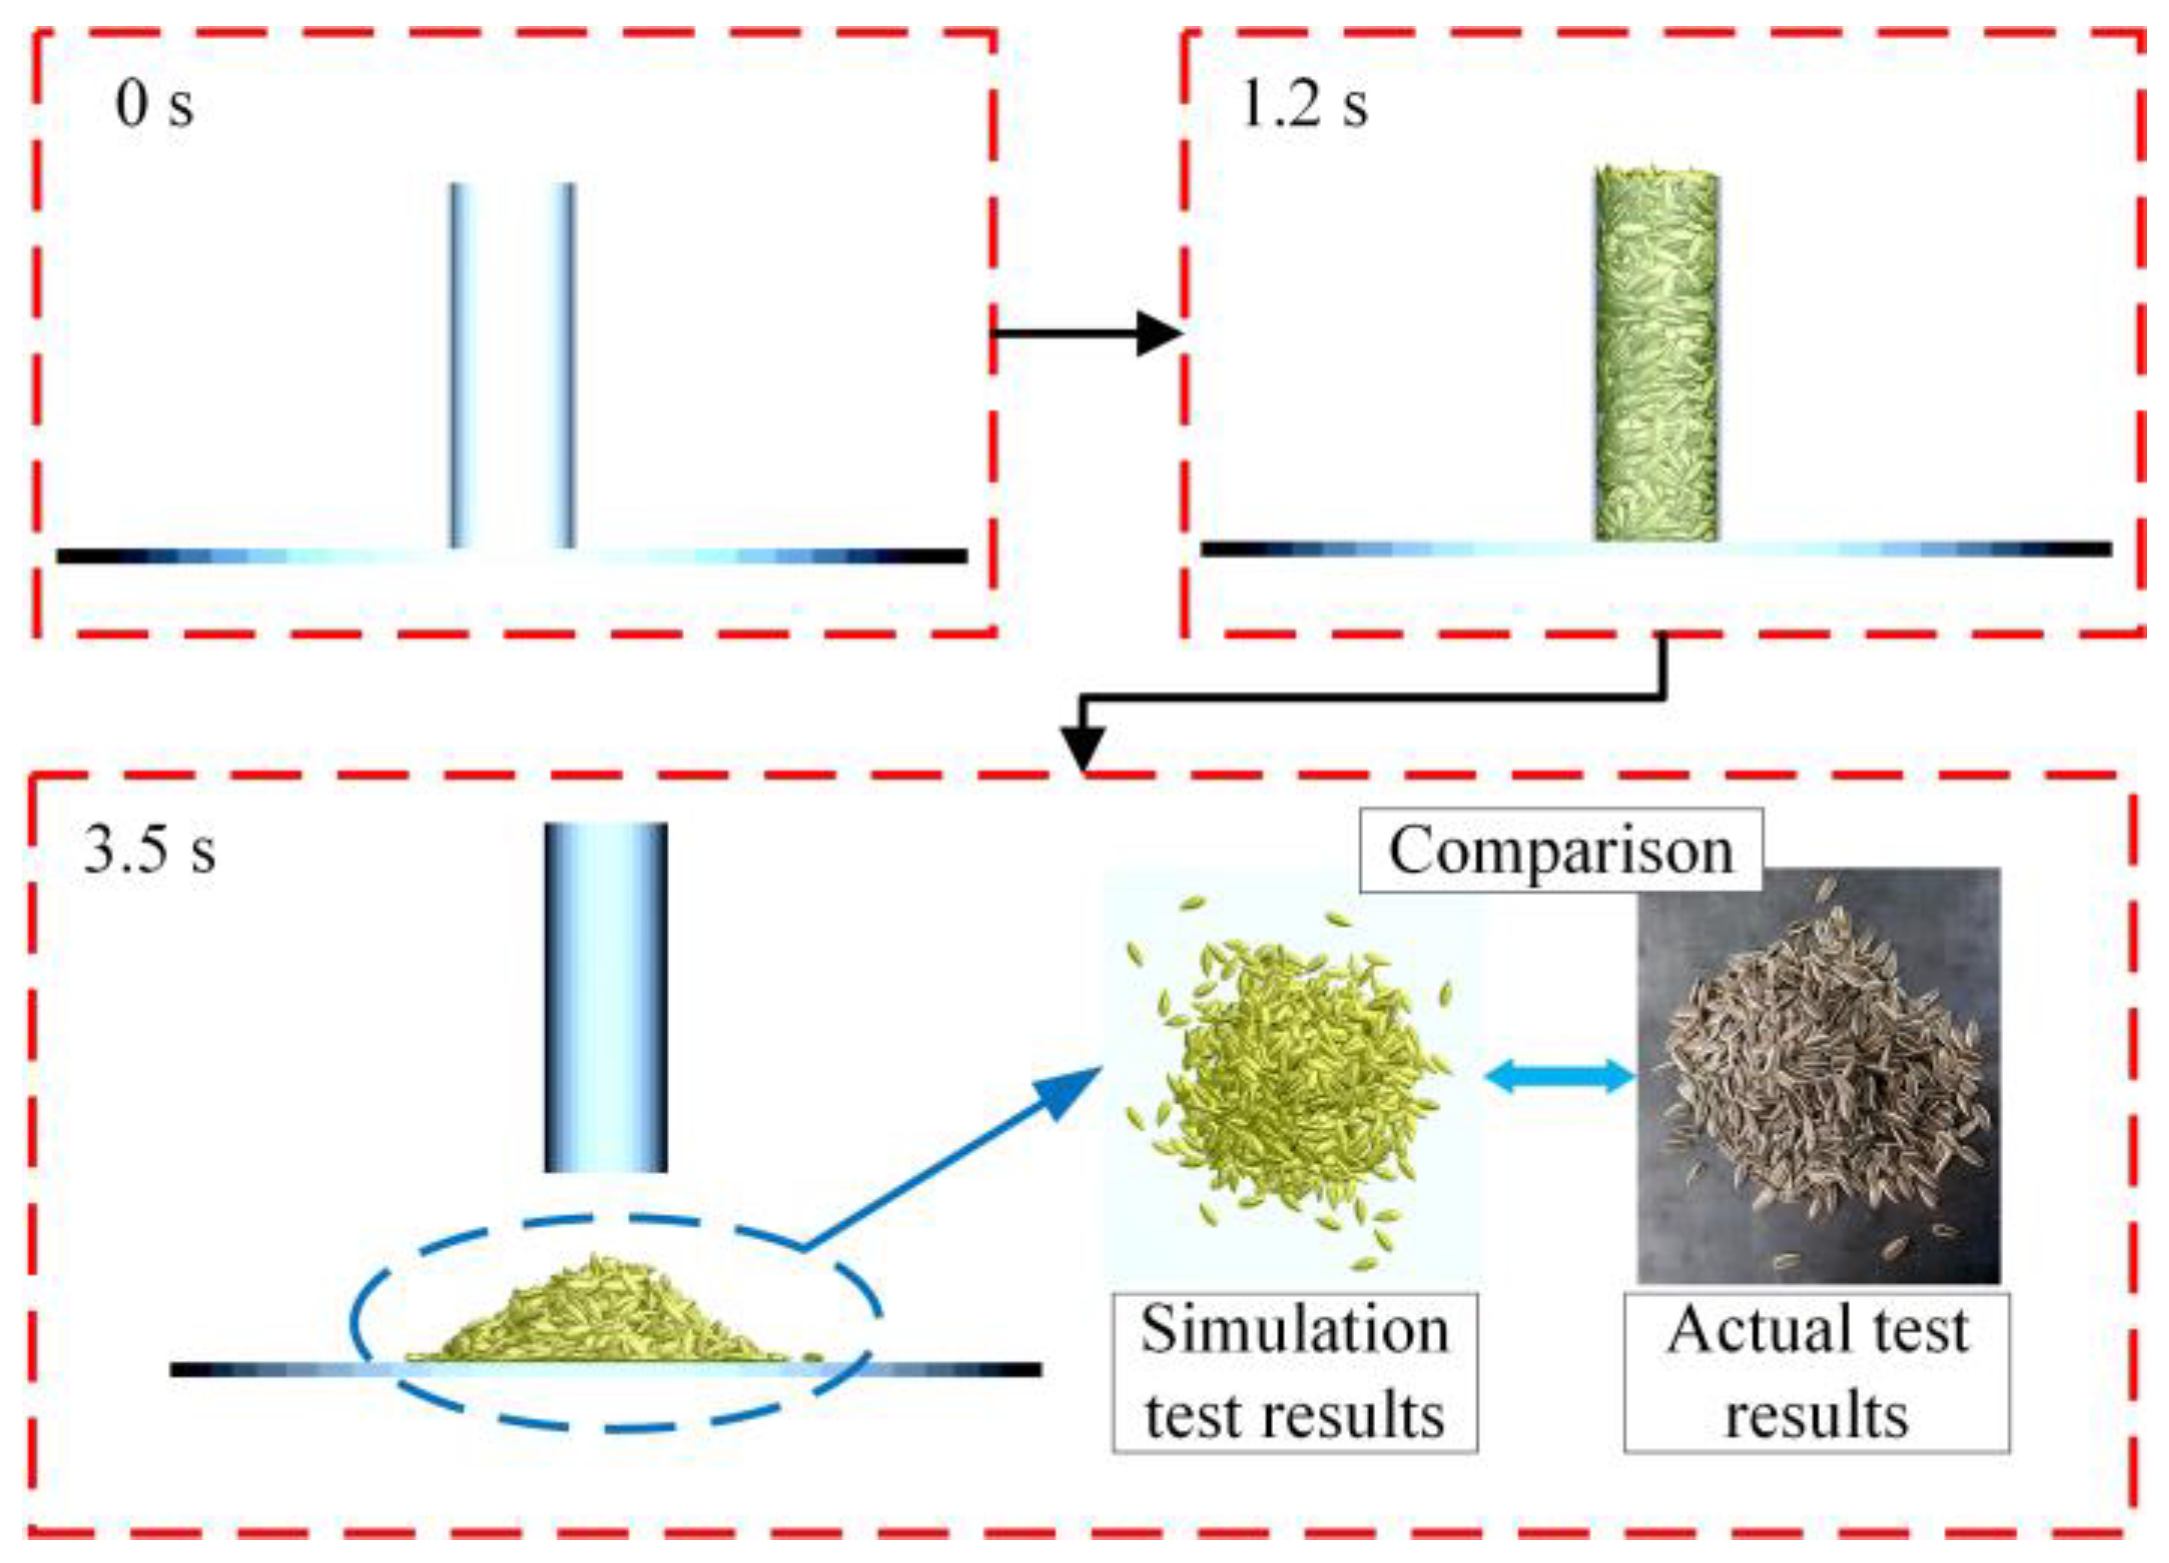
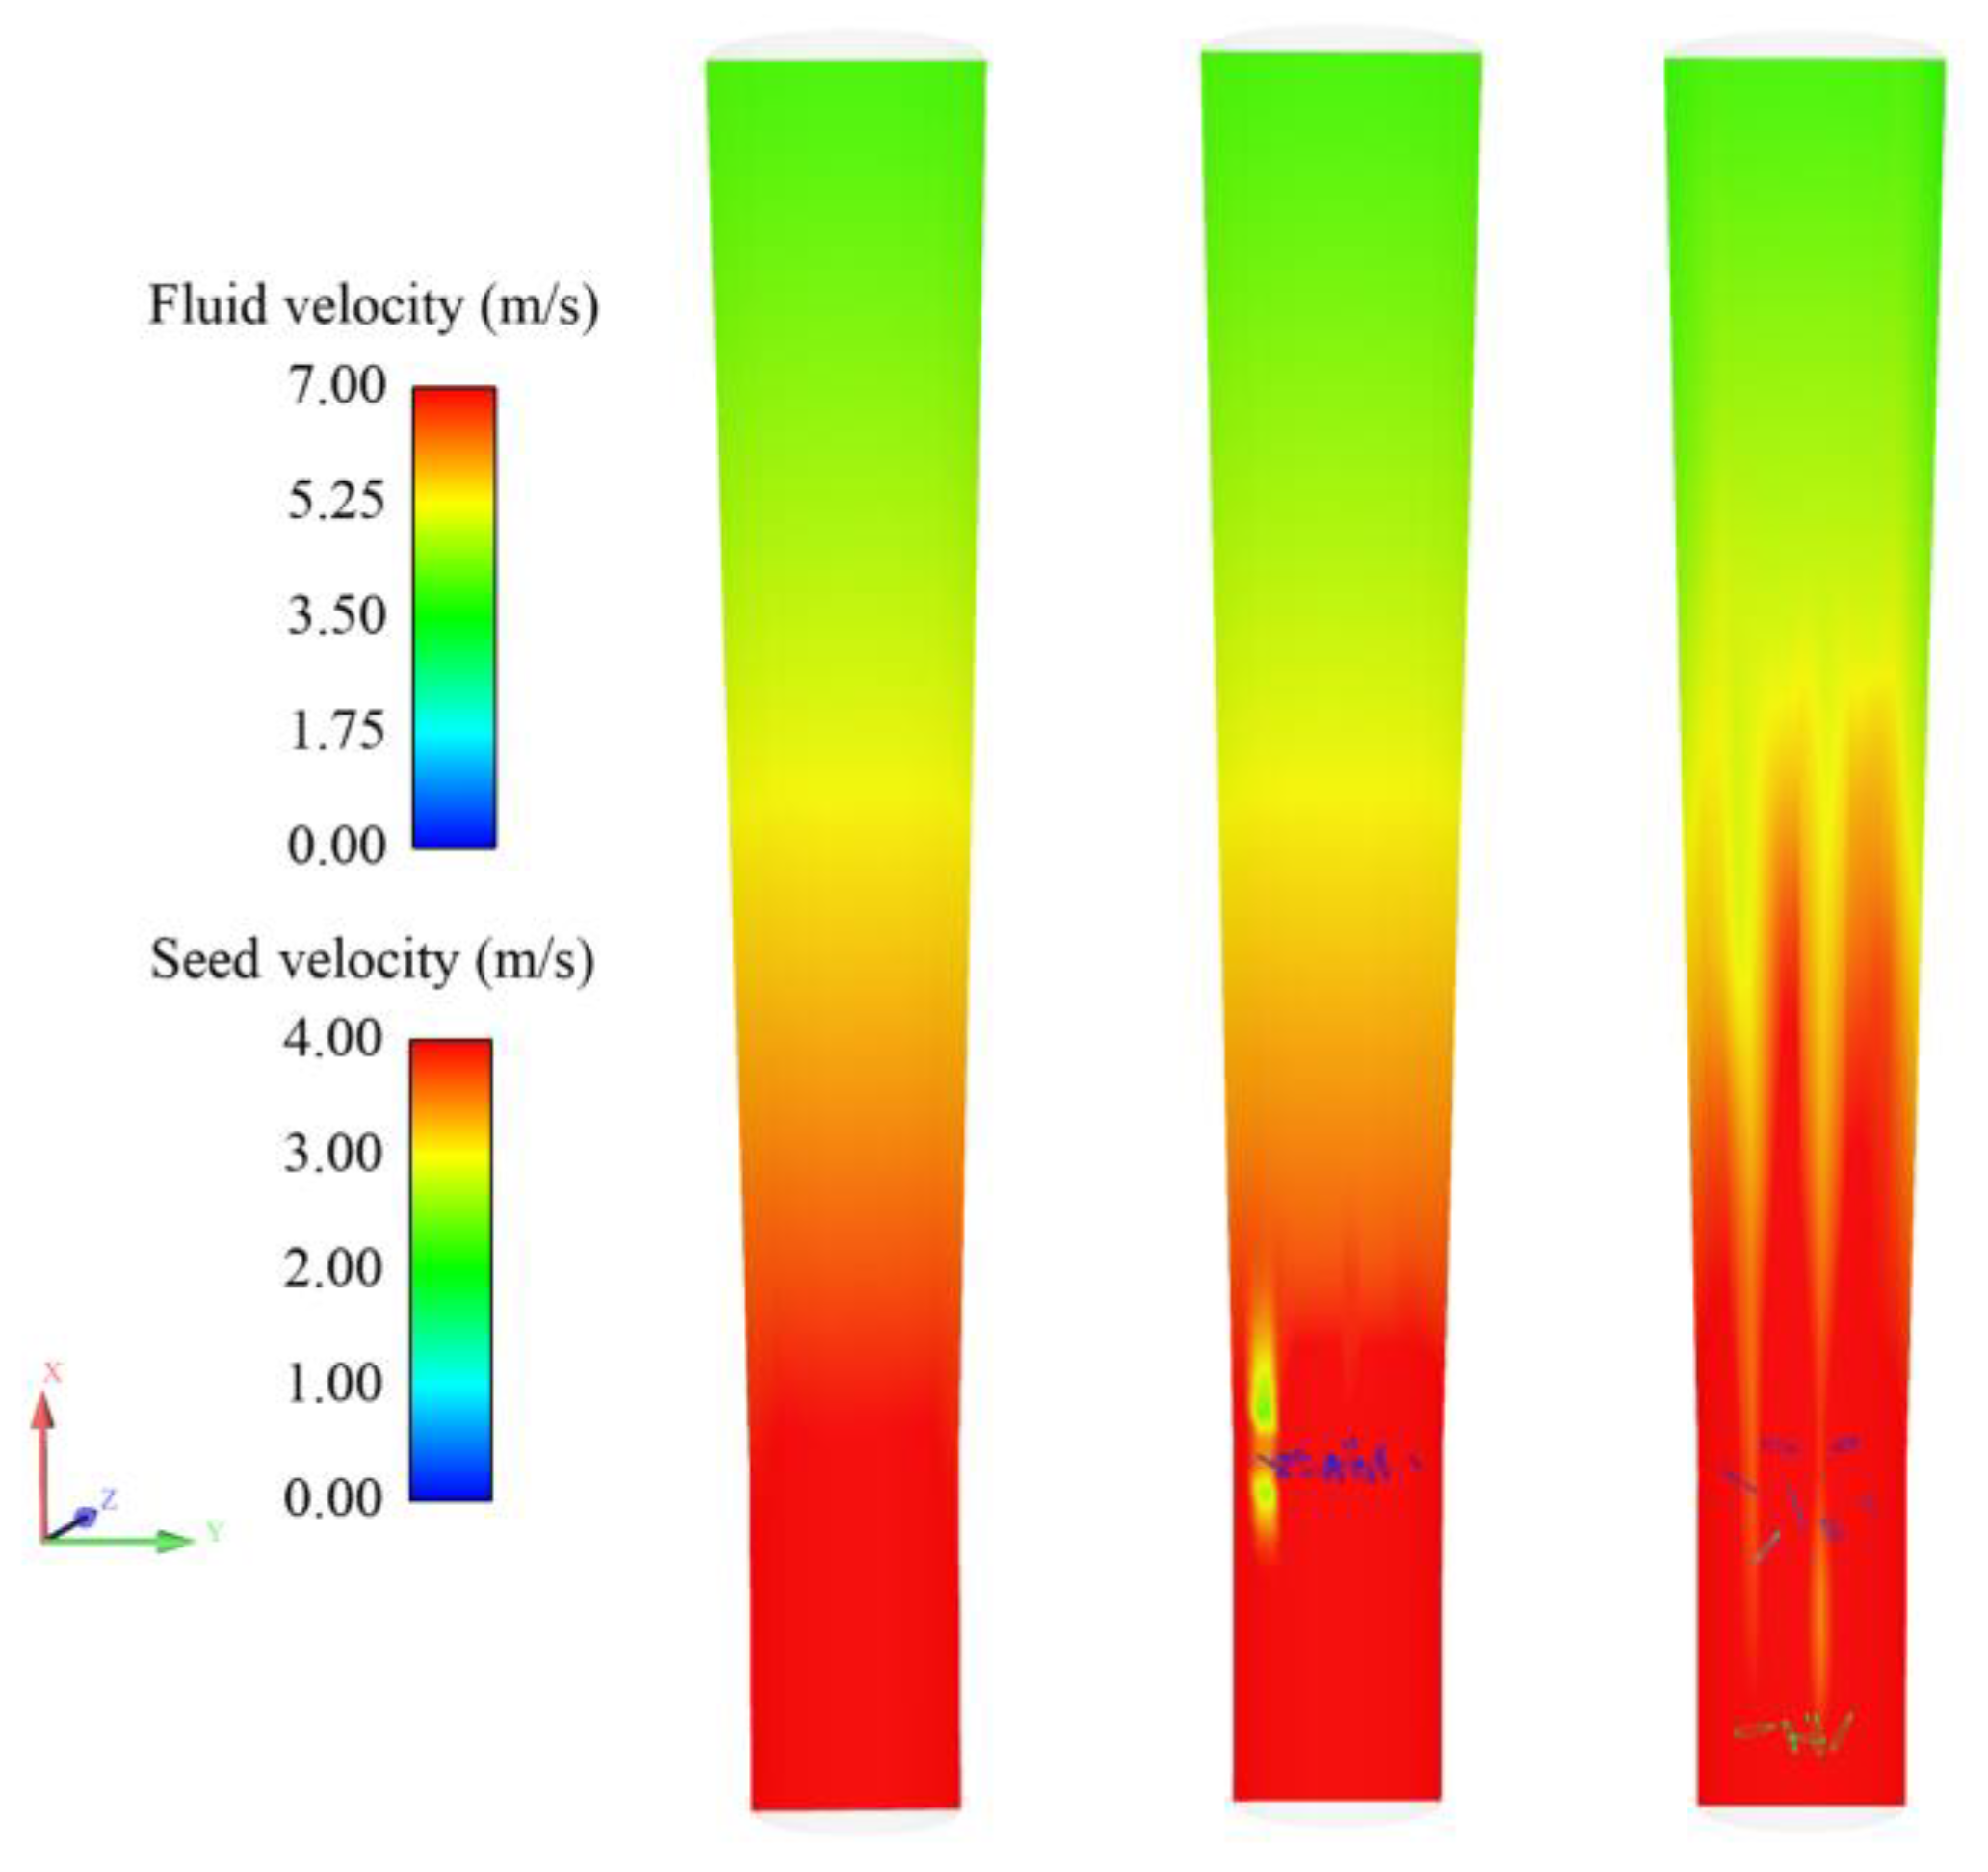
2.6. EDEM–Fluent Coupling Verification of the Seed Model

The EDEM–Fluent coupling approach was applied to measure the suspension velocity of the edible sunflower seed model to verify the rationality of parameter calibration for the edible sunflower seed model.
The three-dimension model of air duct was constructed in SolidWorks 2020 software; the air duct model was then imported into EDEM 2021 software. The setting of simulation parameters was based on the test results mentioned above. The Hertz–Mindlin non-sliding contact model was applied between the seed and the contact materials. Gravity was set according to the modeling direction of the air duct model. Then the air duct model was imported into ANSYS 2020 R2 software for fluid domain filling and mesh model construction. The mesh model was imported into Fluent 2020 R2 software, and the Fluent–EDEM coupling interface file was imported to establish the connection. Simulation parameters were set, with the turbulence model being the k-epsilon model, and the solution algorithm was set to Phase Coupled Simple. The simulation time step was determined to be 0.0001 s, and the number of steps was defined as 2000. The fluid type was air, the turbulence intensity was 5%, and the turbulence viscosity ratio was 10. After initialization, the software was started for the coupling simulation.
The size parameters of the air duct model correspond exactly to those of the actual air duct. Because the wall of the air duct has minimal impact on the determination of the seed suspension velocity, the air duct model was simulated using steel parameters. In the simulation process, if the wind speed is set at a high level, the seed group will fly out of the outlet; if the wind speed is too low, the seed group will not be suspended. Therefore, the theoretical value of the seed suspension velocity was chosen as the reference value for the simulation test. Five different inlet wind speeds were set for the simulation test: 6 m/s, 7 m/s, 8 m/s, 9 m/s, and 10 m/s.

3. Results

3.1. Parameter Calibration Results of the Seed Model

A Plackett—Burman test was carried out to obtain the simulated seed repose angle under different levels of seed model parameters. The results of the Plackett—Burman test are presented in Table 5.
The test results were analyzed using the Design-Expert 11 software. The analysis of the Plackett—Burman test results is shown in Table 6. The regression model p = 0.0175 was significant. The model determination coefficient R2 = 0.9961, close to 1. The regression model had high accuracy. The important weights of different parameters were assigned by the regression model, and the key parameters that had significant effects on simulated seed repose angle were selected. Interaction terms were not considered in the analysis of the results, and the order of the effect of each parameter on the simulated seed repose angle was as follows: X6, X1, X4, X5, X9, X8, X2, X7, X3. The parameters X2, X3, X5, X7, X8, and X9 had non-significant influences on the simulated seed repose angle (p > 0.05), while the parameters X1, X4, and X6 had significant influences on the simulated seed repose angle (p < 0.05). In the subsequent test design, only the significant model parameters (X1, X4, and X6) were calibrated. The middle value of the value range was used for the other parameters: X2 = 385.055 kg/m3, X3 = 35 MPa, X5 = 0.622, X7 = 0.374, X8 = 0.481, X9 = 0.062.
To decrease the value range of significant model parameters, the steepest-ascent test was conducted with significant model parameters as the test factors. The effect of parameter X6 on the simulated seed repose angle was positive, while the effects of parameters X1 and X4 on the simulated seed repose angle were negative. In the steepest-ascent test, parameters with a positive effect were gradually increased with a fixed step size, and parameters with a negative effect were gradually decreased with a fixed step size.
The relative error between the simulated seed repose angle (Y1) and the actual seed repose angle (35.86°) was determined using Equation (14). The details of the test design and the corresponding results are listed in Table 7.
r e i = Y i Y Y × 100 %
where Y is the actual test result; Yi is the simulation test result; rei is the relative error between the simulated and actual test result, %.
Under the conditions of Test 4, the simulated seed repose angle from the steepest-ascent test was the closest to the actual seed repose angle, with a relative error of only 0.926%. Therefore, the Box–Behnken test was carried out using the conditions of Test 3 and Test 5 as the low level and high level, respectively, while the middle value of the value range was still selected for the other parameters.
The coding table for the simulation parameters is shown in Table 8. The central level test was conducted three times, resulting in a total of 15 simulated repose angle determination tests. The test scheme and results are presented in Table 9.
The data in Table 9 were fitted using the Design-Expert 11 software. After removing non-significant model terms (p > 0.05) from the regression model, the coded regression equation for the simulated seed repose angle in terms of the three significant model parameters was established, as shown in Equation (15).
Y 1 = 36.14 0.2446 X 1 0.2736 X 4 + 0.8985 X 6 0.2603 X 4 2
The variance analysis results are presented in Table 10. The p-value of the regression model was 0.0012, indicating that the regression model was highly significant. The model determination coefficient (R2) was 0.9784, which is close to 1, which demonstrates the high accuracy of the regression model. The three parameters have significant influence on the simulated seed repose angle, among which X6 and X4 have extremely significant effect, and X1 has significant effect. The interaction terms have non-significant effects on the simulated seed repose angle, so the influence of parameter interaction on the establishment of seed model can be excluded. Among the quadratic terms, only X42 has significant influence on the simulated seed repose angle, while the other quadratic terms have non-significant influence. It is apparent that the Poisson’s ratio of the seed, the restitution coefficient of seed–seed, and the rolling friction coefficient of seed–seed independently affect the seed model establishment. When the Poisson’s ratio of the seed and the restitution coefficient of seed–seed were constant, the simulated seed repose angle gradually increased with the increase in the rolling friction coefficient of seed–seed, and the increase rate was the fastest. When the Poisson’s ratio of the seed and the rolling friction coefficient of seed–seed were constant, the simulated seed repose angle decreased gradually with the increase in the restitution coefficient of seed–seed. When the restitution coefficient of seed–seed and rolling friction coefficient of seed–seed were constant, the simulated seed repose angle decreased gradually with the increase in the Poisson’s ratio of the seed, and the decrease rate was the slowest.
To determine the optimal parameter combination, the target value of the actual seed repose angle of 35.86° was used as the optimization objective. For non-significant model parameters, the middle value within their respective value ranges was selected. To conduct a further optimization of the parameters, the Design-Expert 11 software was utilized. The objective function and constraint conditions are specified in Equation (16).
Y 1 = 35.86 0.414 X 1 0.442 0.234 X 4 0.287 0.084 X 6 0.126
According to the optimization results, 10 groups of optimized parameters were selected for simulation verification, then the results of the simulation test and actual test were compared. When the Poisson’s ratio of the seed was 0.417, the restitution coefficient of seed–seed was 0.286, the rolling friction coefficient of seed–seed was 0.104, and the size and shape of the simulated seed repose angle were most similar to the actual test. The simulated seed repose angle was 35.823°, with a deviation of only 0.037° from the actual seed repose angle obtained in the test, and the relative error was 0.103%.

3.2. EDEM–Fluent Coupling Verification Results of Seed Model

The results of the coupling simulation test are presented in Figure 8. When the inlet wind speed is less than 6 m/s, the edible sunflower seeds cannot be stably suspended in the air duct and gradually fall to the bottom of the air duct. When the inlet wind speed is in the range of 7–9 m/s, the seeds remain suspended in the air duct, floating up and down. When the inlet wind speed is greater than 10 m/s, the seeds continue to rise in the air duct until they fly out of the air duct. In the airflow field, the seeds disturb the airflow, causing the air velocity in the air duct to become non-uniform. Near the duct core, the airflow slows down, and the wind force acting on the seeds becomes less than the force required for their suspension, causing the seeds to fall. In the actual test, a seed mesh screen is installed in the air duct to prevent seeds from falling. However, seeds near the duct core move toward the wall of the air duct under the influence of the airflow and eventually become suspended under the effect of the vertical upward wind.
The seed velocity data and fluid velocity data were imported into EnSight 2020 post-processing software for coupling analysis. As illustrated in Figure 9, when the inlet wind speed was 7 m/s, some seeds were suspended. Based on the seed suspension height, the average fluid velocity at the corresponding position was calculated, resulting in a simulated seed suspension velocity of 6.98 m/s. The deviation between the simulated seed suspension velocity and the actual seed suspension velocity was 0.55 m/s. The actual seed suspension velocity was higher than the simulated seed suspension velocity. The reason is that the actual seed suspension velocity test had inconsistent seed sizes, and the test results were recorded according to all seeds in suspension state. However, in the simulation seed suspension velocity test, the seed model was equal, and the seed model was established according to the average seed parameter, which was smaller than the actual large seed parameter, so the simulated seed suspension velocity was slightly smaller than the actual seed suspension velocity. But, in general, the deviation of the two suspension velocities is relatively small, which can be used to guide the mechanical design and optimization research.

4. Discussion

According to the discrete element particle design criteria, the material characteristics of the model are influenced by both the intrinsic and the contact parameters. Taking the seed repose angle as the research index, the edible sunflower seed parameters acquired from physical tests were input into the seed discrete element model. Due to the simulated seed repose angle not exactly matching the actual seed repose angle, parameter calibration was required to make the material characteristics of the simulation model closely match the real material characteristics.
The repose angle is an index to not only better analyze the scattering, flow, and friction characteristics of the seed, but also effectively characterize the rationality and reliability of the characteristic parameters of the seed. The suspension velocity can reflect the motion characteristics of the material in the airflow field, and can also characterize the rationality of the parameters such as diameter, density, and resistance coefficient of the material. The combination of a repose angle and suspension velocity affords an effective means to comprehensively characterize the real situation of the material. The characterization of other performance indexes is one-sided, and it is difficult to effectively enhance the rationality of the material model. For example, the flow rate can be used as a performance index to characterize the flow characteristics of materials, but it overlaps with the role of the repose angle. For another example, the seed damage rate as a performance index can effectively characterize the mechanical properties of the seed, but the discrete element model is composed of spherical particles, and the seed model damage is mainly manifested as the dispersion of spherical particles, which is inconsistent with the actual seed damage phenotype. In the subsequent specific mechanical design research, the model performance can be verified according to the specific mechanical characteristics to improve the robustness of the model.
The edible sunflower seeds are generally seeded by a pneumatic seed-metering device, and the movement of seeds in the seed-metering device is difficult to detect in real time, which restricts the process of researching the seed-metering device. After the threshing of sunflower, the seeds are usually cleaned and transported pneumatically. The seed motion characteristics in the airflow field directly affect the harvest quality of seeds. The design of cleaning and transporting machinery depends on the movement characteristics of seeds in the airflow field. However, due to the single research target (seed repose angle), it is difficult to fully and accurately verify the material characteristics of the seed. In this study, the seed model material characteristics were analyzed by combining the characteristics of seed accumulation and suspension, and the rationality of the discrete element model was verified. The applicability of the seed model in the design of seeding and harvesting machinery is suitable.
The presence of seeds in the air duct causes disturbances to the airflow field, and the results of these disturbances are presented in Figure 10. As the seeds move within the air duct, the degree of disturbance to the airflow field increases, affecting the fluid velocity in the air duct and ultimately causing some seeds to fail to remain suspended. In this study, Fluent–EDEM coupling simulation was performed for the seed model, providing insight into the motion characteristics of seeds within the airflow field. However, the disturbance law of seeds in the airflow field requires further research. In addition, when designing seeding machinery, it is of great importance to conduct an analysis on the size characteristics of edible sunflower seeds. Beyond size considerations, the influence of chaff seeds and impurities must also be accounted for in the design of cleaning and transportation machinery.

5. Conclusions

The value range of material characteristic parameters for edible sunflower seed was obtained through actual tests, and key parameters were calibrated using discrete element simulation tests. Based on the Plackett–Burman test results, the parameters that have significant influence on the simulated seed repose angle were the rolling friction coefficient of seed–seed, the Poisson’s ratio of the seed, and the restitution coefficient of seed–seed. According to the response surface optimization test, the simulated seed repose angle was 35.823°, with a relative error of only 0.103% from the actual seed repose angle, demonstrating high similarity in both size and shape.
From the gas–solid coupling simulation test using Fluent–EDEM, the average seed suspension velocity in the simulation was 6.98 m/s, with a deviation of 0.55 m/s compared to the actual test. The parameter calibration of the discrete element model for edible sunflower seed is accurate and reliable, which provides an important guide for the simulation research of mechanized seeding and harvesting in edible sunflower production.

Author Contributions

Conceptualization, X.Z. and C.H.; methodology, X.Z., C.H. and H.M.; software, X.Z. and B.Y.; validation, X.Z. and Y.X.; formal analysis, X.Z. and Y.X.; data curation, Y.L., S.Q. and X.H.; writing—original draft preparation, X.Z. and C.H.; writing—review and editing, X.Z., Y.X. and B.Y.; supervision, C.H.; project administration, C.H.; funding acquisition, C.H. All authors have read and agreed to the published version of the manuscript.

Funding

This research was funded by National Natural Science Foundation of China (NSFC) (32360441, 31960367); Natural Science Foundation of Xinjiang Uygur Autonomous Region (2020D01A51); Tianshan Innovation team project of Xinjiang Uygur Autonomous Region (2021D14010); Graduate innovation project of Xinjiang Uygur Autonomous Region (XJ2023G123).

Institutional Review Board Statement

Not applicable.

Data Availability Statement

Data are contained within the article.

Conflicts of Interest

The authors declare no conflicts of interest.

References

  1. USDAFAS. Available online: https://apps.fas.usda.gov/psdonline/app/index.html#/app/compositeViz (accessed on 22 January 2025).
  2. Feng, J.H.; Jan, C.C.; Seiler, G. Breeding, production, and supply chain of confection sunflower in China. Oilseeds Crops Fats Lipids 2022, 29, 11. [Google Scholar] [CrossRef]
  3. Mu, J.; Wang, P.; Liu, Y.; Cui, J.; Chen, Y.; Wan, S.; Chen, G. Effects of Different Harvesting Periods on the Commerciality and Yield of Edible Sunflower. Crops 2024, 5, 146–151. [Google Scholar]
  4. Suthar, V.; Asare, M.A.; Sahu, P.; Gupta, R.K. Sunflower oil-based polyurethane/graphene composite: Synthesis and properties. J. Thermoplast. Compos. Mater. 2024, 37, 1667–1689. [Google Scholar] [CrossRef]
  5. Han, C.; Song, D.; Zhu, X.F.; Zhu, X.L.; Yuan, P.; Diao, H. Design and Experiment of Principle Machine for In-situ Harvesting of Edible Sunflower discs on Stalks. Trans. Chin. Soc. Agric. Mach. 2022, 53, 181–192, 222. [Google Scholar]
  6. Lian, G.; Ma, L.; Feng, W.; Wei, X.; Cheng, Y.; Zong, W. Design and experiment of the cleaning device with double-layer vibrating air-sieve for edible sunflower seeds. Trans. CSAE 2023, 39, 55–65. [Google Scholar]
  7. Ma, Z.; Li, Y.; Xu, L. Summarize of Particle Movements Research in Agricultural Engineering Realm. Trans. Chin. Soc. Agric. Mach. 2013, 44, 22–29. [Google Scholar]
  8. Zeng, Z.; Ma, X.; Cao, X.; Li, Z.; Wang, X. Critical Review of Applications of Discrete Element Method in Agricultural Engineering. Trans. Chin. Soc. Agric. Mach. 2021, 52, 1–20. [Google Scholar]
  9. Liang, R.; Chen, X.; Jiang, P.; Zhang, B.; Meng, H.; Peng, X.; Kan, Z. Calibration of the simulation parameters of the particulate materials in film mixed materials. Int. J. Agric. Biol. Eng. 2020, 13, 29–36. [Google Scholar] [CrossRef]
  10. Chen, Y.; Gao, X.; Jin, X.; Ma, X.; Hu, B.; Zhang, X. Calibration and Analysis of Seeding Parameters of Cyperus esculentus Seeds Based on Discrete Element Simulation. Trans. Chin. Soc. Agric. Mach. 2023, 54, 58–69. [Google Scholar]
  11. Ma, W.; You, Y.; Wang, D.; Yin, S.; Huan, X. Parameter Calibration of Alfalfa Seed Discrete Element Model Based on RSM and NSGA-Ⅱ. Trans. Chin. Soc. Agric. Mach. 2020, 51, 136–144. [Google Scholar]
  12. Shi, L.; Ma, Z.; Zhao, W.; Yang, X.; Sun, B.; Zhang, J. Calibration of simulation parameters of flaxed seeds using discrete element method and verification of seed-metering test. Trans. CSAE 2019, 35, 25–33. [Google Scholar]
  13. Markauskas, D.; Ramírez-Gómez, Á.; Kačianauskas, R.; Zdancevičius, E. Maize grain shape approaches for DEM modelling. Comput. Electron. Agric. 2015, 118, 247–258. [Google Scholar] [CrossRef]
  14. Zhang, S.; Zhang, R.; Chen, T.; Fu, J.; Yuan, H. Calibration of Simulation Parameters of Mung Bean Seeds Using Discrete Element Method and Verification of Seed-metering Test. Trans. Chin. Soc. Agric. Mach. 2022, 53, 71–79. [Google Scholar]
  15. Ghodki, B.M.; Patel, M.; Namdeo, R.; Carpenter, G. Calibration of discrete element model parameters: Soybeans. Comput. Part. Mech. 2019, 6, 3–10. [Google Scholar] [CrossRef]
  16. Hao, J.; Wei, W.; Huang, P.; Qin, J.; Zhao, J. Calibration and experimental verification of discrete element parameters of oil sunflower seeds. Trans. CSAE 2021, 37, 36–44. [Google Scholar]
  17. Li, F.; Tao, Y.; Chen, J. Discrete Element Parameter Calibration of Sunflower Seeds Based on Stacking Experiment. J. Agric. Mech. Res. 2024, 46, 209–215. [Google Scholar]
  18. Aorigele; Zhang, W.; Wang, S.; Liu, W.; Yu, Z. Measurement of Physical Contact Parameters and Discrete Element Simulation Calibration of Sunflower Seeds. J. Agric. Mech. Res. 2023, 45, 139–147. [Google Scholar]
  19. Wang, S.; Yu, Z.; Aorigele; Zhang, W. Study on the modeling method of sunflower seed particles based on the discrete element method. Comput. Electron. Agric. 2022, 198, 107012. [Google Scholar] [CrossRef]
  20. Yu, X.; Geng, D.; Du, R.; Jin, C.; Yang, S.; Lu, X. Design and Experiment of Wheat planter by Pneumatic Conveying with no-tillage. Trans. Chin. Soc. Agric. Mach. 2018, 49, 141–148. [Google Scholar]
  21. Zhang, X.; Wang, Y.; Zhang, L.; Peng, C.; Fan, G. Design and Experiment of Wheat Pneumatic Centralized Seeding Distributing System. Trans. Chin. Soc. Agric. Mach. 2018, 49, 59–67. [Google Scholar]
  22. Mu, G.; Lv, H.; Zhang, T.; Zheng, W.; Zhang, W.; Lv, Z. Gas-Solid Coupling Simulation and Experimental Optimization of Throwing Device of Sweet Potato Seedling Recycling Machine. Trans. Chin. Soc. Agric. Mach. 2021, 52, 213–222. [Google Scholar]
  23. Hou, H.; Cui, Q.; Guo, Y.; Zhang, Y.; Sun, D.; Lai, S.; Liu, J. Design and test of air-sweeping suspension velocity testing device for cleaning threshed materials of grain and oil crops. Trans. CSAE 2018, 34, 43–49. [Google Scholar]
  24. Yang, Q.; Li, Z.; Li, H.; He, J.; Wang, Q.; Lu, C. Numerical Analysis of Particle Motion in Pneumatic Centralized Fertilizer Distribution Device Based on CFD-DEM. Trans. Chin. Soc. Agric. Mach. 2019, 50, 81–89. [Google Scholar]
  25. Guzman, L.; Chen, Y.; Landry, H. Coupled CFD-DEM simulation of seed flow in an air seeder distributor tube. Processes 2020, 8, 1597. [Google Scholar] [CrossRef]
  26. Arzu, Y.; Vedat, D.; Adnan, D. Comparison of computational fluid dynamics-based simulations and visualized seed trajectories in different seed tubes. Turk. J. Agric. For. 2020, 44, 599–611. [Google Scholar]
  27. El-Sayed, A.S.; Yahaya, R.; Wacker, P.; Kutzbach, H.D. Characteristic attributes of the peanut (Arachis hypogaea L.) for its separation. Int. Agrophysics 2001, 15, 225–230. [Google Scholar]
  28. Jin, W.; Zhang, X.; Ding, Y.; Bai, S.; Liu, W.; Zhou, X. Experiment on Suspension Separation of Residual Film and Impurity Based on EDEM-Fluent Coupling. Trans. Chin. Soc. Agric. Mach. 2022, 53, 89–98. [Google Scholar]
  29. Li, H.; Li, Y.; Tang, Z.; Xu, L. Numerical Simulation of Material Motion on Vibrating Screen of Air-and-screen Cleaning Device Based on CFD-DEM. Trans. Chin. Soc. Agric. Mach. 2012, 43, 79–84. [Google Scholar]
  30. Li, H.; Li, Y.; Tang, Z.; Xu, L.; Zhao, Z. Numerical simulation and analysis of vibration screening based on EDEM. Trans. CSAE 2011, 27, 117–121. [Google Scholar]
  31. Wen, X.; Jia, H.; Zhang, S.; Yuan, H.; Wang, G.; Chen, T. Test of Suspension Velocity of Granular Fertilizer Based on EDEM-Fluent Coupling. Trans. Chin. Soc. Agric. Mach. 2020, 51, 69–77. [Google Scholar]
  32. Wu, B. Study on the Physical and Mechanical Properties of Frozen Maize Grains. Master’s Thesis, Northeast Agricultural University, Harbin, China, 2019. [Google Scholar]
  33. Hou, Z.; Dai, N.; Chen, Z.; Qiu, Y.; Zhang, X. Measurement and calibration of physical property parameters for Agropyron seeds in a discrete element simulation. Trans. CSAE 2020, 36, 46–54. [Google Scholar]
  34. Tang, H. Design and Mechanism Analysis of Ripple Surface Pickup Finger Maize Precision Seed Metering Device. Ph.D. Thesis, Northeast Agricultural University, Harbin, China, 2018. [Google Scholar]
  35. Yu, Q.; Liu, Y.; Chen, X.; Sun, K.; Lai, Q. Calibration and Experiment of Simulation Parameters for Panax notoginseng Seeds Based on DEM. Trans. Chin. Soc. Agric. Mach. 2020, 51, 123–132. [Google Scholar]
  36. Zhang, Z.; Zeng, C.; Xing, Z.; Xu, P.; Guo, Q.; Shi, R.; Wang, Y. Discrete element modeling and parameter calibration of safflower biomechanical properties. Int. J. Agric. Biol. Eng. 2024, 17, 37–46. [Google Scholar] [CrossRef]
  37. Du, X.; Han, C.; Shen, J.; Diao, H.; Song, D.; Zhang, S. Optimization design and test of jujube picker. J. Chin. Agric. Mech. 2022, 43, 43–50. [Google Scholar]
Figure 1. Measurement process of static friction coefficient.
Agriculture 15 00292 g001
Figure 2. Measurement process of rolling friction coefficient.
Agriculture 15 00292 g002
Figure 3. Processing of seed accumulation images.
Agriculture 15 00292 g003
Figure 4. Material suspension test bench.
Agriculture 15 00292 g004
Figure 5. Actual suspension velocity of edible sunflower seeds.
Agriculture 15 00292 g005
Figure 6. Establishment process of the edible sunflower seed discrete element model.
Agriculture 15 00292 g006
Figure 7. Simulated seed repose angle determination test.
Agriculture 15 00292 g007
Figure 8. Suspension position and velocity of seeds model: (a) suspension position of seeds model; (b) velocity and velocity direction of seeds model.
Agriculture 15 00292 g008
Figure 9. Results of gas–solid coupling.
Agriculture 15 00292 g009
Figure 10. Results of seeds disturbing the air flow field.
Agriculture 15 00292 g010
Table 1. Static friction coefficient between edible sunflower seed and different contact materials.
MaterialsRange of Static Friction CoefficientMiddle Value of Static Friction CoefficientAverage Value of Static Friction Coefficient
seed–seed0.527–0.7160.6220.653
seed–steel0.375–0.5860.4810.432
Table 2. Rolling friction coefficient between edible sunflower seed and different contact materials.
MaterialsRange of Rolling
Friction Coefficient
Middle Value of Rolling Friction CoefficientAverage Value of Rolling Friction Coefficient
seed–seed0.042–0.1260.1040.985
seed–steel0.032–0.1030.0620.074
Table 3. Coefficient of restitution between edible sunflower seed and different contact materials.
MaterialsRange of Restitution
Coefficient
Middle Value of
Restitution Coefficient
Average Value of
Restitution Coefficient
seed–seed0.234–0.3400.2860.295
seed–steel0.291–0.4570.3740.381
Table 4. Coding table of model parameters.
SymbolParameterCode
−11
X1Poisson’s ratio of the seed0.4140.470
X2Density of seed/kg·m−3348.57421.54
X3Shear modulus of seed/Pa1 × 1076 × 107
X4Restitution coefficient of seed–seed0.2340.340
X5Static friction coefficient of seed–seed0.5270.716
X6Rolling friction coefficient of seed–seed0.0420.126
X7Restitution coefficient of seed–steel0.2910.457
X8Static friction coefficient of seed–steel0.3750.586
X9Rolling friction coefficient of seed–steel0.0200.103
Table 5. Results of the Plackett—Burman test.
Serial NumberX1X2X3X4X5X6X7X8X9Simulated Repose
Angle/(°)
111−1111−1−1−134.09
2−111−1111−1−138.88
31−111−1111−133.41
4−11−111−111132.67
5−1−11−111−11139.34
6−1−1−11−111−1135.90
71−1−1−11−111−130.18
811−1−1−11−11135.93
9111−1−1−11−1129.71
10−1111−1−1−11−131.35
111−1111−1−1−1129.89
12−1−1−1−1−1−1−1−1−131.99
1300000000035.15
Table 6. Analysis of Plackett–Burman test results.
SourceEffectContribution Rate/%Sum of SquaresF-Valuesp-Values
Model 120.460056.49000.0175 *
X1−2.820019.727923.8600100.69000.0098 **
X20.32000.25400.30721.30000.3729
X30.30330.22830.27601.17000.3933
X4−1.45335.23986.340026.74000.0354 *
X51.12673.14903.810016.07000.0570
X65.293369.508884.0600354.78000.0028 **
X7−0.30670.23330.28211.19000.3891
X80.40330.40360.48802.06000.2877
X90.59000.86351.04004.41000.1706
** means extremely significant (p < 0.01); * means significant (0.01 < p < 0.05). Coefficient of variation is 1.45%, R2 = 0.9961, precision is 22.4374.
Table 7. Design and results of steepest-ascent test: re1 is relative error between the simulated and the actual seed repose angle.
Test No.X1X4X6Y1/(°)re1/%
10.470.340.04232.05810.604
20.4560.31350.06333.6536.154
30.4420.2870.08434.8832.726
40.4280.26050.10536.1920.926
50.4140.2340.12637.1393.566
Table 8. Coding of simulation parameters.
CodeX1X4X6
−10.4140.2340.084
00.4280.26050.105
10.4420.2870.126
Table 9. Scheme and results of the Box–Behnken test.
Test No.X1X4X6Y1/(°)re1/%
1−1−1036.3811.453
21−1035.852−0.022
3−11036.0250.460
411035.09−2.147
5−10−135.155−1.966
610−134.946−2.549
7−10137.1053.472
810136.8212.680
90−1−135.163−1.944
1001−134.733−3.143
110−1136.953.040
1201136.3091.252
1300036.2311.035
1400036.1830.901
1500036.0050.404
Table 10. Variance analysis of the Box–Behnken test results.
Data SourcesSum of SquaresDegree of FreedomMean SquareF-Valuep-Value
Model7.860090.873325.22000.0012 **
X10.478710.478713.82000.0137 *
X40.599010.599017.29000.0088 **
X66.460016.4600186.4800<0.0001 **
X1 × 40.041210.04121.19000.3251
X1 × 60.001410.00140.04060.8482
X4X60.011110.01110.32140.5953
X120.006610.00660.19110.6803
X420.250210.25027.23000.0434 *
X620.030310.03030.87480.3926
Residual0.173250.0346
Lack of Fit0.144830.04833.40000.2353
Pure error0.028420.0142
Total8.030014
** means extremely significant (p < 0.01); * means significant (0.01 < p < 0.05). Coefficient of variation is 0.5180%, R2 = 0.9784, precision is 16.4478.
Disclaimer/Publisher’s Note: The statements, opinions and data contained in all publications are solely those of the individual author(s) and contributor(s) and not of MDPI and/or the editor(s). MDPI and/or the editor(s) disclaim responsibility for any injury to people or property resulting from any ideas, methods, instructions or products referred to in the content.

