Article

Coupling Agricultural Green Development and Park City Development: An Empirical Analysis from Chengdu, China

1
College of Management, Sichuan Agricultural University, Chengdu 611130, China
2
School of Economics, Southwestern University of Finance and Economics, Chengdu 610074, China
3
College of Economics and Management, China Agricultural University, Beijing 100083, China
*
Author to whom correspondence should be addressed.
Agriculture 2025, 15(3), 248; https://doi.org/10.3390/agriculture15030248
Submission received: 9 October 2024 / Revised: 25 December 2024 / Accepted: 21 January 2025 / Published: 24 January 2025
(This article belongs to the Section Agricultural Economics, Policies and Rural Management)

Abstract

:
The development of park cities is an important exploration for better satisfying people’s aspirations for a better life, promoting sustainable social development, and advancing the transformation of green ecological values. As a basic industry for sustainable development, the combination of agriculture and urban development is an important way to build an ecological civilization. Clarifying the relationship between a park city and green development of agriculture is of great significance to the construction of a green base and ecological system of the city, sustainable development of agriculture, and integrated development of urban and rural areas. Chengdu is a mega-city in western China, and the Chengdu-led park city development program is unique in Chinese urban development. Chengdu’s park city development is a pioneering example of urban ecological civilization construction. Taking Chengdu as an example and combining the data of other prefecture-level cities in Sichuan, this study explored the correlation and interaction between agricultural green development (AGD) and park city development (PCD) in Chengdu and other prefecture-level cities in Sichuan from 2011 to 2022 based on the coupling coordination degree, gray correlation degree, and spatial autocorrelation analysis. The results showed the following: (1) Based on the entropy method, the level of AGD in Chengdu rises from 0.353 in 2011 to 0.537 in 2022, and the level of PCD rises from 0.368 to 0.826. The level of AGD and the level of PCD as a whole show an upward trend. (2) The degree of coupling and coordination between the PCD and AGD levels rises from 0.600 to 0.816, realizing the leap from coordination to good coordination, and the degree of coupling has been at a high level. (3) Based on the grey correlation degree, in the process of the influence of AGD on the PCD, the correlation degree of the influencing factors of each indicator is basically above 0.5, and each influencing factor has a strong contribution to the level of the PCD. (4) Spatial self-analysis shows that the coupling coordination degree of AGD and PCD in a region is affected by the neighboring region. Therefore, we believe that AGD plays a more obvious role in driving and radiating PCD and that it can effectively promote the economic, social, and ecological upgrading in the process of PCD.

1. Introduction

In the face of the increasingly complex international situation and changes in economic and social development, China’s urbanization has entered a plateau period, and the development model that unilaterally pursues the financial benefits of urban land is no longer sustainable. Urban development needs to change from an economic orientation to a people-oriented orientation, from simple extension development to conformal development, and realize the value shift from urban construction orientation to urban governance orientation. In this context, the idea of a park city characterized by ecological priority and human-centered principles has emerged. The concept of a park city can be traced back to the ideal city-state envisioned by the Italian philosopher Campanella in “City of the Sun”, and Ebenezer Howard’s “Garden City” proposed in “Garden Cities of To-Morrow”. Both advocated breaking the isolation between urban and agricultural development areas to achieve balanced development. The construction of a park city seeks to address the ‘urban maladies’ resulting from traditional, extensive development, achieving a win–win situation between economic and social development and environmental protection. Simultaneously, as urban–rural integration progresses, the role of agriculture around the city has undergone significant changes over time to meet the development needs of urban industries and services [1,2]. Agriculture not only provides fresh agricultural products and industrial raw materials to the city, but also offers recreation and entertainment spaces for urban residents, ensures food security, and promotes the greening of urban areas in the suburbs [3]. Therefore, agriculture is not only an integral part of the urban economy and ecological system, but also a prerequisite for the park cities’ ecological environment optimization and livability level improvement [4]. In 2022, the Implementation Plan for Promoting Green Development of Urban and Rural Construction, issued by the General Office of the Sichuan Provincial Party Committee and the General Office of the Provincial Government, emphasized that Sichuan Province will not only support Chengdu in establishing a park city demonstration zone that embodies the new development paradigm, but also advance the protection and restoration of urban ecosystems across the province. Subsequently, the 14th Five-Year Plan” for Chengdu’s Park City Construction and Development further articulated the integration of green resources, such as ecological agriculture, into emerging economic sectors and business models. Advancing green agricultural development is an essential means of addressing the ecological pressures on urban environments and resource scarcity challenges in rural areas. Furthermore, it is also a way to meet the growing demand for a better life of the people from both countryside and city [5].
In the history of the People’s Republic of China, agriculture and rural areas have helped urban economies and societies overcome crises on more than one occasion [6]. Based on the current situation, the relationship between urban and rural areas is entering a new stage. Rural areas are no longer merely the supply sources for cities, but are increasingly becoming the ecological foundation for urban development [7]. Agriculture and rural areas provide valuable pollutant-absorbing spaces for cities, contributing to the alleviation of urban environmental issues [8]. This mutually beneficial model not only promotes comprehensive sustainable development but also offers more diverse and livable lifestyles for both urban and rural residents [9]. Therefore, the construction of park cities must move away from the traditional path of urban–rural development in isolation, drawing from the strengths of agriculture and rural areas. Agriculture should be regarded as a “strategic partner”, working together to create a new vision for urban–rural development that is livable, conducive to business, green, and harmonious.

2. Literature Review

In 2018, General Secretary Xi first proposed the concept of a “park city” in Chengdu. Since then, academic circles have conducted a series of studies on the origins of the park city concept [10,11], its ideological connotations [12,13,14], and practical pathways [15,16]. It should be noted that any new concept is not made up of thin air, and there must be a profound basis for its formation. By studying the development process of Chinese and foreign cities, some scholars put forward that the important causes of the emergence of park cities lie in the outbreak of urban social health problems and the deterioration of the urban living environment caused by rapid urbanization. In fact, the concept of a park city is highly consistent with the concept of equality between humans and nature in the period of agricultural civilization in China. It can be seen that the concept of a park city is not only the innovation of the development concept of industrial civilization city, but also the inheritance and promotion of the natural ecological thought of “harmony between heaven and man” of our ancient philosophers [17]. Conceptually, park city construction emphasizes human-oriented, prioritizes the protection of the ecological environment, and advocates a cautious and friendly approach to the relationship between humans and nature [18]. The park city construction plan integrates natural scenery into the city and also emphasizes green and low-carbon lifestyles and urban operation modes [19]. Some other research pointed out that park cities need to build a foundation with ecology and take the road of green development [20,21]. It is worth noting that urban ecological construction relies heavily on the development of ecological agriculture [22]. Agriculture located in the inner city and suburban areas is an important foundation for enhancing the carrying capacity of urban ecology and promoting green living in the city [23].
Modern agriculture is influenced by the overall level of economic and social development. Modern agriculture, represented by green agriculture, has never been more closely linked to urban economies and ecosystems. Agriculture on the edge of cities (e.g., scale farming in suburban areas) and agriculture within cities (e.g., small-scale agricultural projects utilizing the roofs and facades of urban buildings) are deeply tied to urban ecosystems. Agriculture influences the functioning of cities in direct and indirect ways. In addition to providing products and markets for the city, part of the ecological carrying capacity of agriculture contributes to the absorption of urban greenhouse gas emissions (GHGs). Peri-urban and intra-urban agriculture is closely dependent on and serves the city. When we refer to the relationship between park cities and agriculture, it is easy to naturally think of agriculture in the metropolis (intra-urban agricultural programs). It is important to note that the reference to agriculture in this study is meant to include intra-urban, peri-urban, and peri-urban agriculture as a whole.
As a specific form of high-quality agricultural development, green agricultural development means the use of more environmentally friendly and more efficient farming and field management methods, which can efficiently and safely ensure local food supply [24,25]. As the social economy evolves, the functions of agriculture have shifted significantly [26,27]; along with the increase in the level of urbanization, the production and living functions of agriculture are gradually weakening, while its functions of recreation, leisure, ecology, education, and so on are gradually being highlighted [28,29]. The rural and agricultural sectors that embrace the concept of green development supply fresh meat, eggs, milk, vegetables, and staple foods to the city, ensuring basic health protection for urban residents [30,31]. At the same time, this approach reduces the losses, costs, and carbon emissions associated with cross-regional food logistics, enhancing both the economic efficiency and environmental sustainability of agricultural products [32,33]. The international development experience of some cities also shows that agriculture in the process of green development in the provision of green and high-quality agricultural products, to meet the personalized needs of residents at the same time, but also has the role of improving the urban environment [34], helping to achieve high-quality urban–rural integration of metropolitan cities [35]. It is evident that the green development of agriculture serves as a fundamental foundation for urban green development and provides practical support for the realization of the park city concept [36]. Furthermore, as a vast market for urban products, a significant number of advanced technologies and innovations originating in cities are being transferred to rural areas [37,38], offering both technical and product support for the green, digital, and high-quality development of rural sectors [39,40]. This process enhances the green production capacity of rural and agricultural industries, further promoting the park city development and creating a self-sustaining cycle for its continued growth.
In summary, the study of the relationship between park cities and agriculture has become a hot topic in contemporary urban development and agricultural modernization research. However, quantitative studies on PCD from the perspective of the impact of agriculture are still insufficient. This research will take Chengdu, China’s first park-city-construction-plan city, as an example, and also combine the data of other prefecture-level cities in Sichuan (except Aba Tibetan and Qiang Autonomous Prefecture, Ganzi Tibetan Autonomous Prefecture, and Liangshan Yi Autonomous Prefecture) to construct an evaluation index system for AGD and the construction of PCD. By measuring the levels of AGD and PCD in Chengdu and its surrounding areas from 2011 to 2022, we analyze the coupled and coordinated relationship between the two, explore the interaction and spatial autocorrelation between AGD and PCD, and reveal the spatial aggregation effect and mutual influence law between different areas. A systematic path for promoting the coordinated development of agriculture and park city is proposed with the hope of providing an experience for other regions with similar development plans to evolve into a park city.

3. Methods and Data

3.1. Overview of the Study Area

Sichuan Province, located in Southwest China, is an important agricultural province in China. With its rich agricultural resources and green development practice, Sichuan plays an important role in the green development of agriculture. Known as the “Land of abundance”, Chengdu (Chengdu, in this research, refers to the Chengdu Plain and its surrounding areas, including the 5 central urban districts and 15 surrounding counties and cities) is located in the central part of Sichuan Province, West China. It is known as the “Heavenly Land” due to its rich regional resources. We can know the geographic location of Chengdu from Figure 1. It is not only the economic center of Southwest China, but also the pioneer and demonstration area of park city construction. At the end of 2022, Chengdu had a total population of 21.268 million, an urbanization rate of 79.9%, and a GDP of 20.8175 trillion Yuan (Data: Chengdu Bureau of Statistics, https://cdstats.chengdu.gov.cn/cdstjj/c154795/2023-03/25/content_c2016a5d71b24884835ddb8ea0bfbe1a.shtml (accessed on 25 March 2023)). In 2007, Chengdu set up the Pilot Zone of Comprehensive Reform of Urban and Rural Development, establishing the development orientation of a world-modern idyllic city which laid a good foundation for the construction of a park city in the later stage.
As the first city to propose the concept of a “park city”, Chengdu has a vast rural hinterland. Under the strategic objectives of food security and ecological civilization construction, the construction of a park city in Chengdu has received great attention from the whole society. The construction of a park city in Chengdu is a pilot implementation and a typical example of an ecological civilization construction path from a city development perspective. Exploring the role of agriculture in promoting economy, society, and ecology in the process of PCD and clarifying the relationship between AGD and PCD is of great significance in providing impetus for park city construction from the agricultural perspective.

3.2. Evaluation System of Green Agricultural Development and Park City in Chengdu

The selection of research indicators follows the principles of data availability, scientific, and simplicity. The selection of indicators refers to some existing research results and combines with the local policy documents of the 14th Five-Year Plan for the Construction and Development of Chengdu Park City. Based on the connotation of park city, this research selects three first-level indicators: habitat living environment, urban ecological environment, and green production states. We also selected 13 secondary indicators to reflect the level of park city development, such as the per capita green space area of parks in built-up areas and the green space rate in built-up areas [41,42] as shown in Table 1. Simultaneously, based on the understanding of the connotation of agricultural green development, this study constructs 4 first-level indicators and 13 second-level indicators from the dimensions of resource conservation, ecological conservation, efficient development, and green life as a system of indicators for measuring the level of AGD [43,44] as shown in Table 2.

3.3. Setting Weights with the Entropy Method

The entropy method is an objective method of weight assignment. It determines the indicator weights based on the information provided by the observed values of each indicator [45]. In the context of this study, it helps us assign appropriate weights to various indicators related to AGD and PCD. Since the specific indicators for evaluating the level of AGD and the level of PCD are quite different in perspective of magnitude and unit of measurement, we need to standardize the indicators of the two evaluation systems. The specific standardization steps are as follows:
Data standardization:
Positive   indicators :   Z i j = X i j min ( X i j ) max ( X i j ) min ( X i j )
Negative   indicators :   Z i j = max ( X i j ) X i j max ( X i j ) min ( X i j )
In Equations (1) and (2), i represents the year (t = 1, 2, … t), j represents the indicator j (t = 1, 2, … t). X represents the value of the indicator, Z i j represents the standardized value of the indicator j , and m a x ( X i j ) , and m i n ( X i j ) represent the maximum and minimum values of the indicator data, respectively.
The entropy expression for the indicator j is calculated as Formula (3):
e j = 1 ln n × i = 1 n P i j × ln P i j
In Equation (3), P i j = X i j i = 1 n X i j denotes the share of indicator j in the i th year for that indicator, where n is the number of samples. Since the data utility value of a research indicator depends on the difference between the information entropy of the indicator e j and 1, the coefficient of variation is calculated as shown in Equation (4):
d j = 1 e j
The formula for determining the weights of the indicators is shown in Equation (5):
W j = d j / j = 1 m d j  
The formula for calculating the composite score is shown in Equation (6):
U i = j = 1 m w j × X i j

3.4. Gray Correlation Analysis

Gray correlation analysis is a method of measuring the degree of correlation of different factors based on the degree of similarity or dissimilarity of trends among the factors. We can characterize the degree of association and evolutionary trend between the two systems of AGD and PCD by calculating the gray correlation coefficients between each indicator within the AGD and PCD level evaluation systems [46]. This can help to explore the temporal relationship between AGD and PCD, especially when data are incomplete or uncertain. This method quantifies the degree of correlation between two variables by comparing their variation patterns over time. The correlation coefficient calculation formula is shown in Equation (8), and the association degree calculation formula is shown in Equation (9):
ξ i k = m i n i m i n j N i x t N j y t + ρ m a x i m a x j N i x t N j y t N i x t N i y t + ρ m a x i m a x j N i x t N j y t
r i j = 1 m i = 1 m ξ i k           ( m = 1 , 2 , , n )
In Equations (7) and (8), N i x t and N j y t are the value of AGD and the standardized values of the indicators of PCD in the year t , m is the number of samples, and ρ is the judgment coefficient, with a value range of (0, 1). In general, the judgment coefficient takes the value of 0.5. Through the gray correlation size of AGD and each index of PCD, we can have a preliminary determination of the degree of mutual influence between the AGD and PCD. If r i j   = 1, it indicates that the two factors show a perfect match in their developmental dynamics; the larger the value of r i j , the stronger the degree of correlation; the smaller the value of r i j , the weaker the degree of correlation between the two systems.

3.5. Coupling Coordination Model

The concept of coupling originates from physics. The coupling degree is an important index reflecting the degree of interdependence and mutual influence between systems or elements. The coupling degree is mainly used to measure the synergistic effect between the sequential coefficients within two or more systems or elements, aiming at clarifying their coupling relationship as well as the overall coordination [47]. The coupling coordination degree helps to measure the level of coordination between AGD and PCD, revealing their mutual influence during different stages of development. Specifically, the coupling coordination degree reflects the degree of alignment and overall development level between the two systems within a given period, offering deeper insights into the interaction between agricultural green development and park city construction. In order to further judge the level of AGD and PCD in different years, we can construct the coupling coordination degree model as shown in Equations (10) and (11):
C = U 1 × U 2 [ ( U 1 + U 2 ) / 2 ] 2 1 / 2
D = C × F ,   where   F = a U 1 + β U 2
In Equations (10) and (11), U 1 and U 2 are the comprehensive evaluation levels of AGD and PCD, respectively. C is the coupling degree of the AGD and PCD; the value range of C is 0 C 1 , and the larger C is, the larger the coupling degree of AGD and PCD systems is. D is the coupling coordination degree of AGD and PCD. F is the comprehensive evaluation index of AGD and PCD, and it reflects the contribution of the overall level of AGD and PCD to the degree of coordination. a and β are coefficients to be determined, and in the calculation, a and β are assigned a value of 0.5. In order to accurately measure the stage and type of the coordinated development of AGD and PCD, referring to the existing studies [48], the degree of coupled coordination can be divided into 10 levels, as shown in Table 3.

3.6. Spatial Autocorrelation Test

Spatial autocorrelation analysis is employed to examine the spatial dependence between observations in spatial data, specifically examining whether the value of a given region is correlated with that of its neighboring regions. In this study, Moran’s I index is used to assess the spatial autocorrelation between the coupling levels of PCD and AGD across different regions. This approach allows us to identify spatial agglomeration patterns and regional disparities in the coupling degree, providing empirical evidence for further exploring the collaborative advancement of park city construction and agricultural green development. The calculation formula is as follows:
M o r a n s   I = n i = 1 n j = 1 n W i j ( D i D ¯ ) × ( D j D ¯ ) ( i = 1 n j = 1 n W i j ) × i = 1 n ( D i D ¯ ) 2
In Equation (10), n represents the number of prefecture-level cities; W i j denotes the spatial weight matrix reflecting spatial or economic geography; D i and D j represent the coupling coordination degree of the regions i and j , respectively; and i refers to the prefecture-level city adjacent to city j . Generally, Moran’s I index falls within the range of (−1, 1). When Moran’s I > 0, it indicates a positive spatial autocorrelation between the coupling coordination index of PCD and AGD. Conversely, when Moran’s I < 0, it suggests a negative spatial autocorrelation between the coupling coordination index of PCD and AGD.

3.7. Data Sources

The research period of this article is from 2011 to 2022. Considering that the AGD levels in Aba Tibetan and Qiang Autonomous Prefecture, Garze Tibetan Autonomous Prefecture, and Liangshan Yi Autonomous Prefecture are relatively low, heavily influenced by unique geographic and economic factors, significant differences exist in the coupling between AGD and PCD in these regions compared to other cities in Sichuan Province. To ensure the representativeness and comparability of this study, this research excludes these three regions and focuses on analyzing data from other prefecture-level cities within the province. The data of the evaluation indices, such as the sown area of crops, cultivated land area, labor productivity, and expenditure on R&D, are mainly from the Sichuan Statistical Yearbook. Data on the agricultural GDP and per capita disposable income of urban residents are mainly from the Chengdu Statistical Yearbook. Indicators such as the number of good days for environmental air quality, green coverage rate of built-up areas, per capita public recreational green space, and sewage treatment rate are mainly from the Statistical Bulletin of Chengdu National Economic and Social Development from 2011 to 2022.

4. Findings

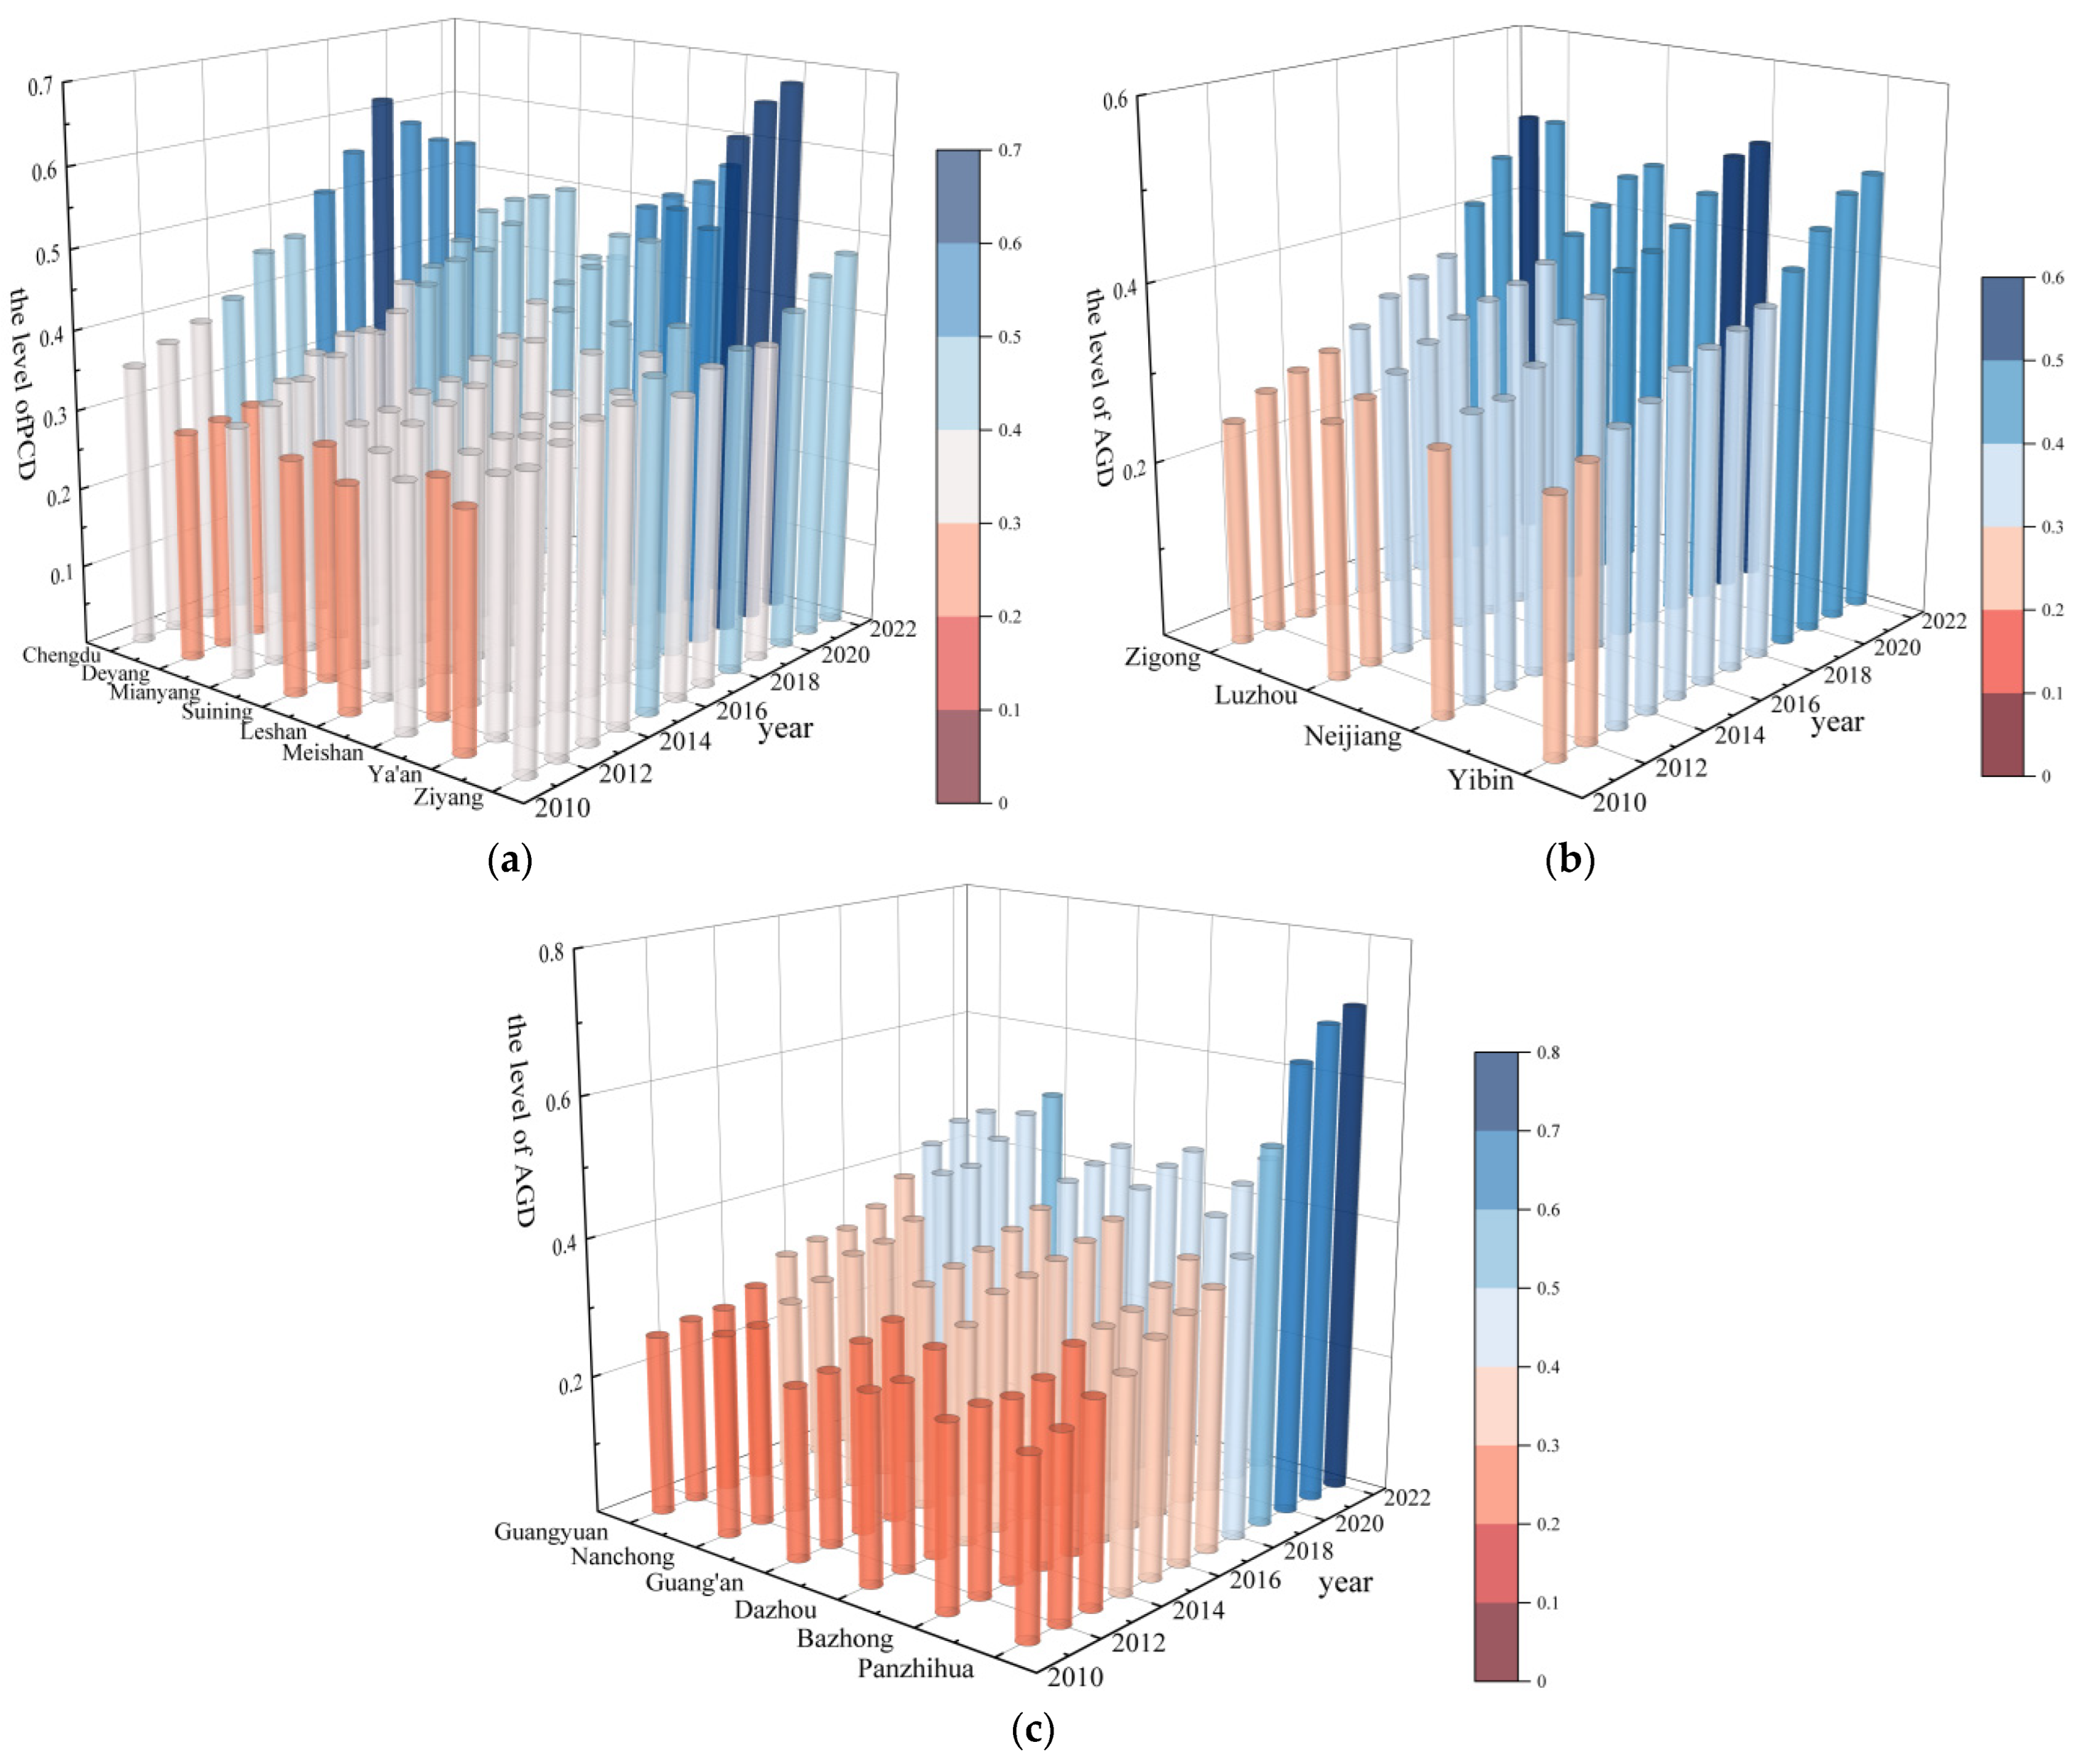
4.1. Time-Series Characteristics of the AGD Level in Prefecture-Level Cities in Sichuan Province

Based on the evaluation system of AGD indicators constructed in the previous section, the results of the entropy value method can be used to judge the level of AGD in prefecture-level cities in Sichuan Province and its change trend and regional differences from 2011 to 2022. This paper divides Sichuan into three major economic zones, namely the Chengdu Plain Economic Zone (Figure 2a), the South Sichuan Economic Zone (Figure 2b), and the Northeast Sichuan Economic Zone and Panzhihua (Figure 2c), to analyze AGD levels in these regions more comprehensively. Overall, from 2011 to 2022, the level of AGD in most cities in Sichuan has shown stable growth. However, there are significant differences in both the speed and overall development levels among cities. In the early stages, the level of AGD in most cities increased, but the growth rate was relatively slow, with an average annual growth rate generally below 5%. After 2016, the pace of AGD accelerated in most cities in Sichuan. This acceleration may be attributed to the Implementation Opinions on Accelerating the Transformation of Agricultural Development Mode issued by the Sichuan Provincial People’s Government in 2015, which emphasized the five principles for accelerating agricultural development, particularly focusing on environmentally friendly and resource-conserving production methods. With the implementation of these policies, the efficiency of agricultural resource utilization and the supply of green products have gradually improved in prefecture-level cities. During the study period, the Chengdu Plain Economic Zone (Figure 2a), which started earlier, showed a relatively stable growth rate, although the rate has slowed in recent years, with the average level of AGD increasing from 0.309 to 0.519. From 2011 to 2012, the average level of AGD in the South Sichuan Economic Zone rose from 0.276 to 0.491 (Figure 2b), reflecting a middle level for Sichuan overall, but exhibiting an accelerated growth trend from 2016 onward. While the AGD in the Northeast Sichuan Economic Zone and Panzhihua started relatively late, significant potential has emerged in recent years. Notably, Panzhihua experienced a remarkable increase from 0.253 in 2011 to 0.706 in 2022, a growth of 179%.
In terms of Chengdu’s development, this study found that the level of comprehensive AGD in Chengdu from 2011 to 2022 shows an obvious upward trend, rising from 0.353 in 2011 to 0.537 in 2022, with an overall increase of 52%. From the results of measuring the level of Chengdu’s AGD (Figure 3), we can roughly divide the AGD into two stages. The first stage is between 2011 and 2019. During this period, the level of AGD shows a steady growth trend, and grows to 0.619 in 2019, with a growth rate of up to 75.5% compared with 2011. In the second stage, starting from 2020, the level of AGD declined, and further dropped to 0.536 in 2022. Specifically, in the dimension of the level of resource conservation and ecological conservation, the study period was in a fluctuating development trend, the level of green living grew steadily, and the overall development trend of the quality and efficient development subsystem was similar to that of the level of green development of agriculture, with a significant growth in the early stage of development and a slight decline in the later period.
Mechanization is an important way to accelerate the modernization of agriculture. In 2011, Sichuan issued an important governmental document called Implementation Opinions of the Sichuan Provincial People’s Government on Promoting the Good and Fast Development of Agricultural Mechanization and the Agricultural Machinery Industry, which proposes to improve the level and scale of agricultural mechanization in the Chengdu plain area and to build high-standard farmland to develop modernized agriculture. However, while improving the level of agricultural mechanization and expanding the application scale of agricultural machinery contribute to enhancing production efficiency, the increasing mechanization of agricultural production processes inevitably leads to higher energy consumption and resource depletion. This is particularly evident in the production of key crops, where the demand for total power of agricultural machinery increases, resulting in energy losses and resource waste, which, in turn, affect the improvement of resource conservation. The ecological conservation system is mainly measured by indicators such as the intensity of fertilizer and pesticide application and forest coverage, focusing on assessing its derived ecological effects during the development of agriculture in Chengdu. Since the government of Sichuan Province proposed the strategy of reducing of chemical fertilizer and pesticide and increasing their utilization efficiency, Chengdu’s agricultural development has strictly implemented this requirement. Except for 2017, the application of pesticides and fertilizers in Chengdu was reduced in all years compared with the previous year. Throughout the observation period, there was a significant increase in the level of ecological conservation after 2015.
Since China launched the second phase of the Natural Forest Protection Project (The full name is China Natural Forest resources protection Project II. The second phase of the project adheres to the principles of giving priority to protection and giving priority to natural restoration and actively adopts strong policies and measures such as “stopping logging, raising standards and expanding areas” to effectively increase the protection of natural forests.), the area and volume of forests have been increasing year by year. In 2012, the government of Chengdu issued Implementing Rules for the Management of the Forest Ecological Benefit Compensation Fund for Phase II of Chengdu Natural Forest Resources Protection Project. Thanks to the strict enforcement of this implementation rule, the forest coverage rate in Chengdu has increased significantly. Furthermore, Chengdu has also endeavored to promote green development in the entire region. Through the construction of Tianfu Green Road, wetland parks, and ecological zones around the city, it has met the needs of urban and rural residents for a high quality of life in a green and livable city, while building green ecological barriers and beautifying the public environment of the city. Since 2018, the efficient development subsystem has significantly contributed to the growth of the level of AGD in Chengdu, indicating that Chengdu’s agriculture has experienced a shift from a function of providing agricultural products to an ecological function. The green living standard has also experienced a significant rise in recent years, which is mainly due to the integration of agriculture with commerce, culture, and tourism industry. Chengdu vigorously develops regional specialty agriculture such as edible mushrooms, Chinese herbs, fruits, nursery flowers, etc., and attaches importance to the improvement of the appearance of the villages around the city. Famous rural tourism villages such as Zhanqi village, Mingyue village, Wuxing village, Tieniu village, etc., have led to a significant rise in the output value of leisure agriculture and rural tourism. This rural tourism development also enriched local farmers and contributed to the sustained eradication of rural poverty. In 2022, the per capita disposable income of rural residents reached about 30,900 yuan, and the living standard of rural residents is rising significantly.

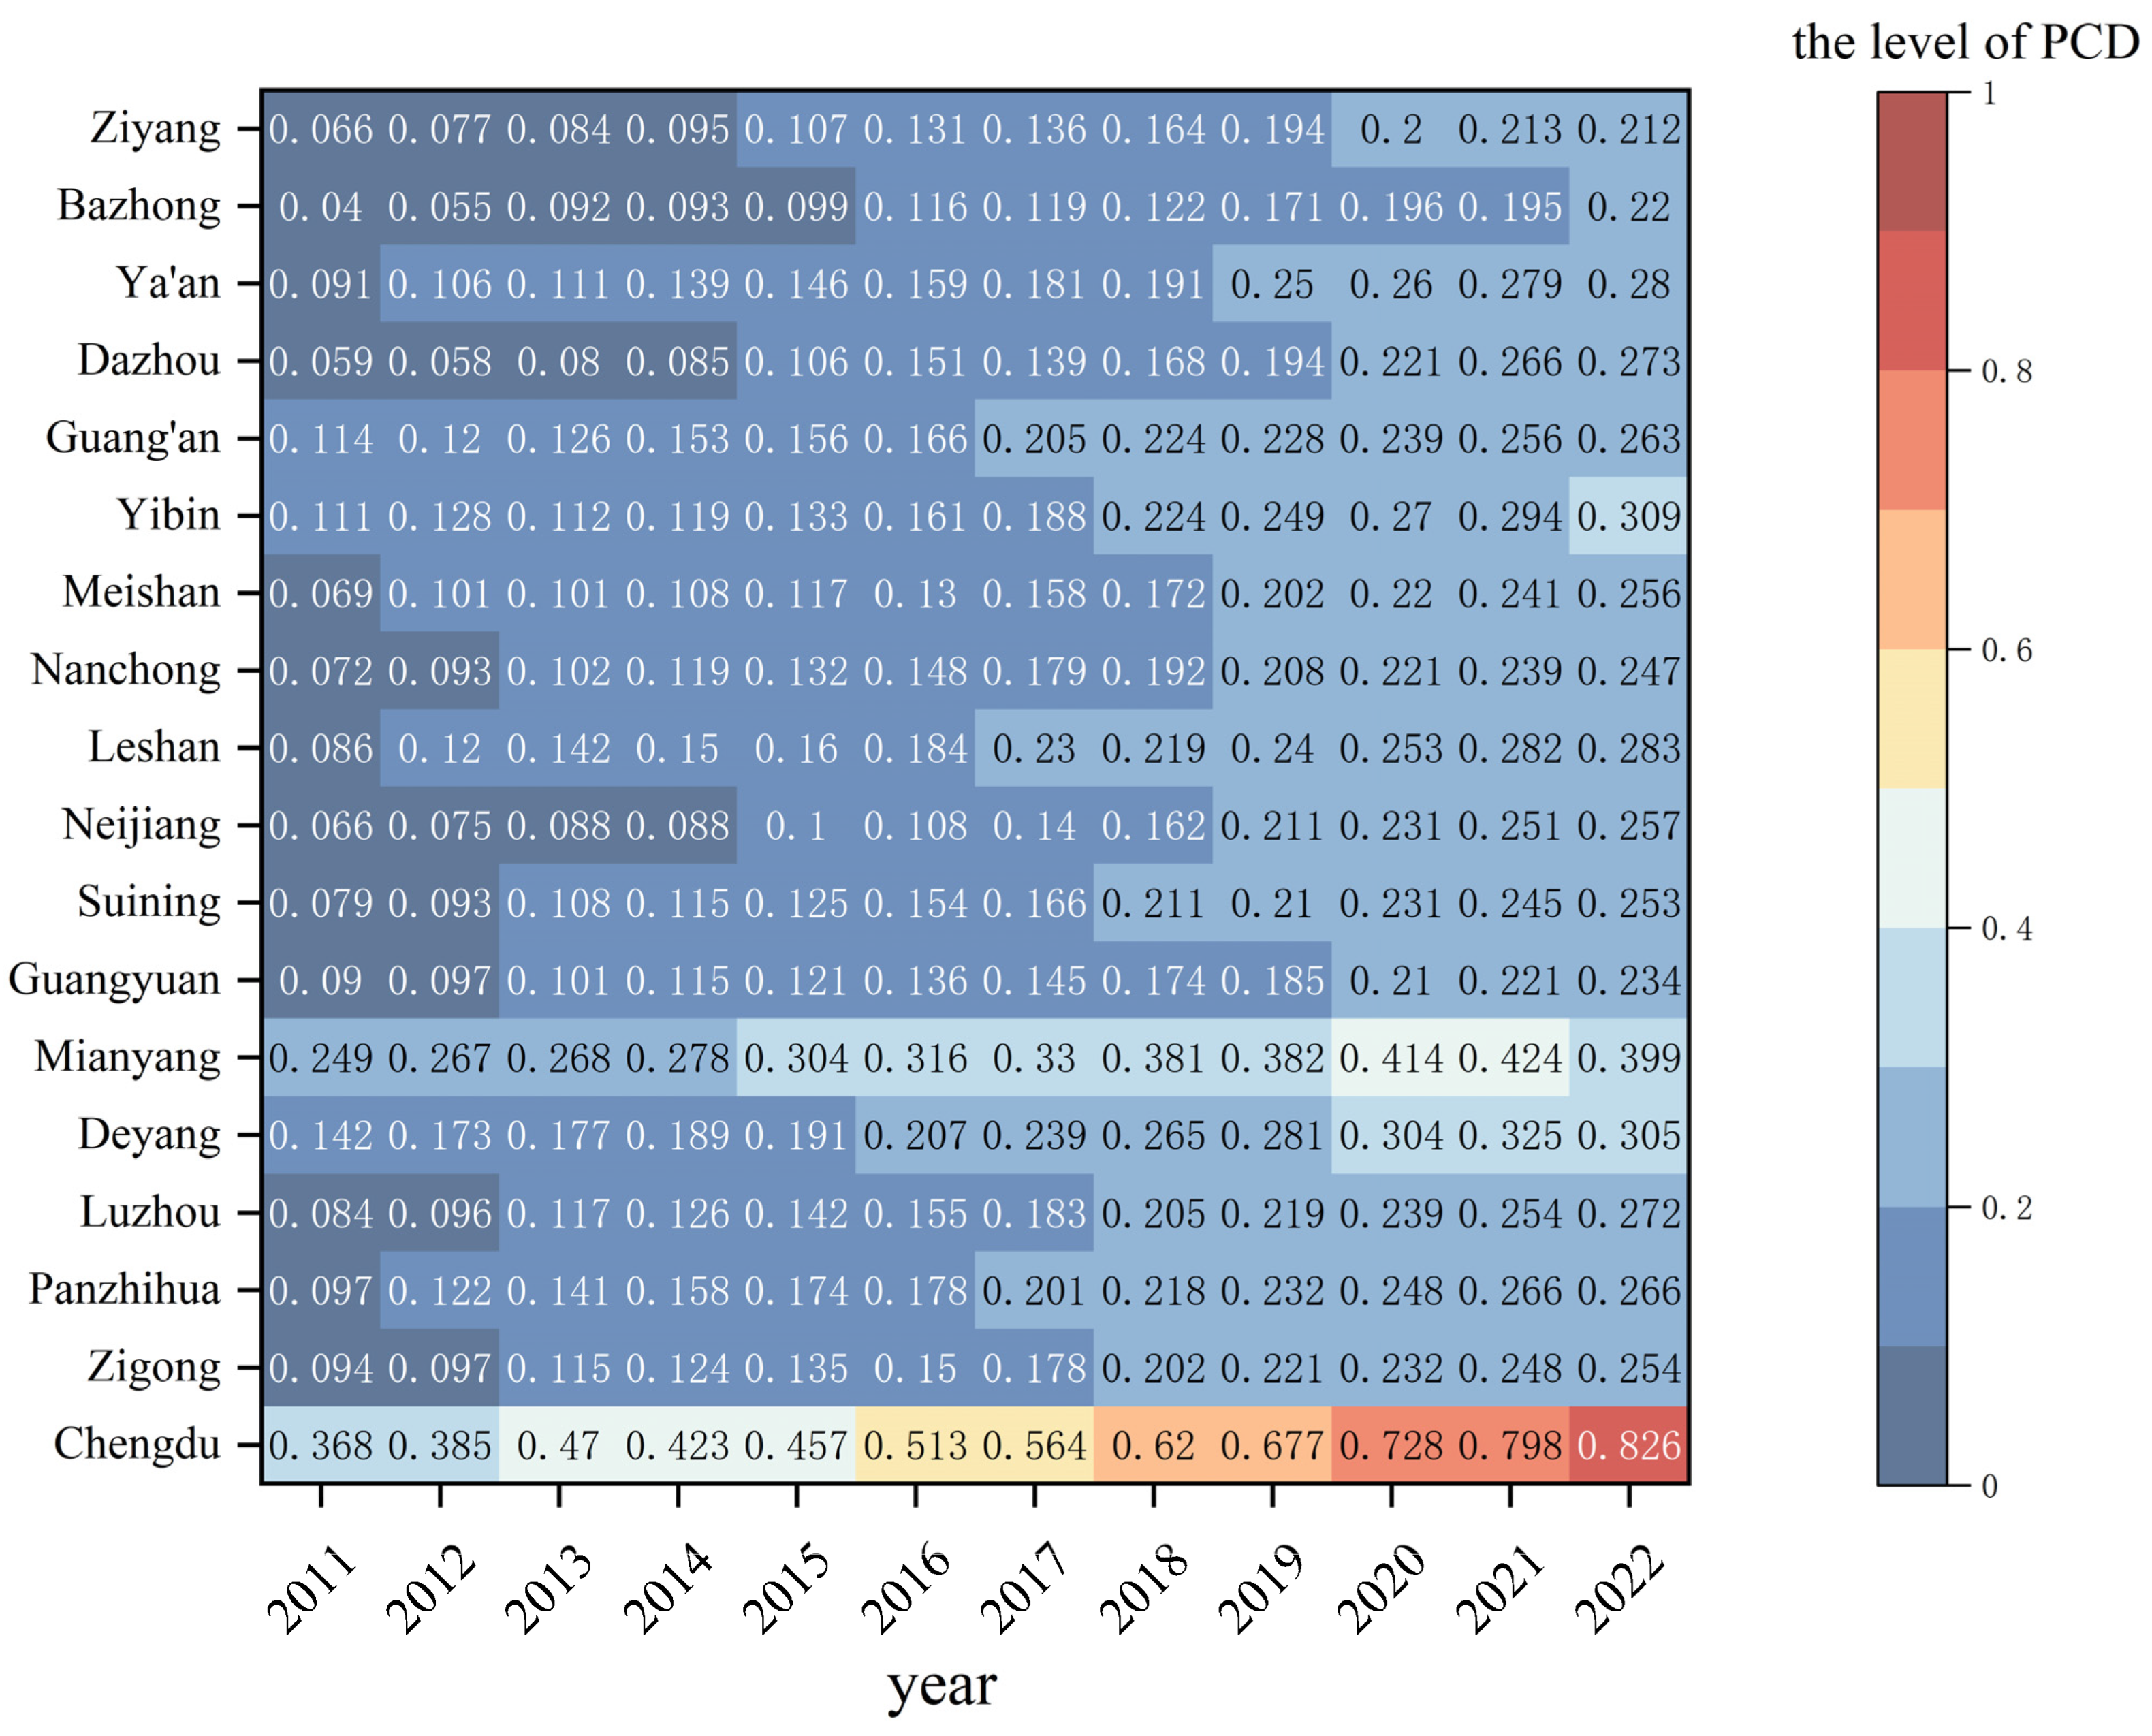
4.2. Time-Series Characteristics of the PCD Level in Prefecture-Level Cities in Sichuan Province

According to the evaluation index system of PCD conceived in the previous section, the overall development level and change trend of each index can be observed by measuring the score of each PCD index in each city of Sichuan Province (Figure 4). From 2011 to 2022, the overall development level of PCD in Sichuan Province showed a steady upward trend. Chengdu, in particular, experienced a significant increase, rising from 0.368 in 2011 to 0.826 in 2022, with a remarkable growth rate, consistently ranking first in the province. Meanwhile, the development levels of PCD in other cities across Sichuan Province have also improved, though their growth rates remain relatively slower compared to Chengdu.
The development level of PCD in Sichuan Province remains uneven, with significant regional disparities. As the provincial capital, Chengdu benefits from clear geographical advantages. Situated on the flat Chengdu Plain, it enjoys convenient transportation, well-developed infrastructure, a robust economic foundation, and abundant resource advantages. The government has made substantial investments in promoting park city construction, with strong policy support and financial guarantees. In contrast, other prefecture-level cities are mostly located in the mountainous and hilly areas of Sichuan, characterized by large topographical fluctuations. Due to constraints related to economic structure, industrial layout, and other factors, their development is slower, and they face greater challenges. Overall, while the development level of PCD in Sichuan has steadily improved over the study period, Chengdu’s strong growth has led urban green development in the province. Although infrastructure construction in other cities started later, they still maintained a steady growth trajectory. Local governments have gradually increased investments in ecological environmental protection and green space development, fostering urban green transformation through industrial restructuring and enhancing green infrastructure. Although progress has been relatively slow, these cities have laid a foundation for sustainable development along the path of PCD, thereby improving environmental quality and enhancing citizens’ quality of life.
From the perspective of Chengdu’s PCD, the level increased from 0.368 to 0.862, representing an increase of approximately 124.5%. As shown in Figure 5, the overall level of PCD in Chengdu has exhibited a steady upward trend, with the comprehensive score surpassing 0.6 after 2018. Notably, the contribution of the Green Production Status level to the overall score is relatively significant, while the score for the urban ecological environment subsystem has remained relatively stable.
In terms of the characteristics of the period, all subsystems showed slow growth and low levels between 2011 and 2015, as shown in Figure 5. After 2015, the PCD level and its subsystems increased more significantly. This increase may be attributed to the fact that 2015 was the final year of the “Twelfth Five-Year Plan” task, which involved comprehensive deployment and vigorous remediation of air pollution. Chengdu was taking multiple measures to combat atmospheric haze, such as addressing emissions from industrial enterprises, curbing motor vehicle exhaust pollution, and controlling urban dust pollution, which has laid a good foundation for sustainable development of the urban environment.
In 2018, a new paradigm of urban development, known as the park city, was introduced, and Chengdu’s urban development concept has returned from industrialization-driven logic to human-oriented logic. Chengdu has prioritized the development of its park system, including the Tianfu green road, park cluster, and park city communities, resulting in significant improvements to the urban and ecological environment. It is important to note that the level of Green Production Status increased by 190.3% during the study period. The tertiary industry value-added index makes the largest contributions. The cultural and tourism industries in Chengdu have had a significant positive impact on improving people’s lives, driving investment, and boosting the development of the modern service industry [49].

4.3. Analysis of Gray Correlation Degree Between Agricultural Green Development and Park City in Sichuan Province

Based on the evaluation indices of AGD and PCD in the previous section, we define the value of the PCD level of each city in Sichuan as the reference sequence, and each index of AGD ( y 1 , y 2 , y 3 , y 4 , y 5 , y 6 , y 7 , y 8 , y 9 , y 10 , y 11 , y 12 , y 13 ) as the gray correlation between the comparative sequences, and then we can obtain the gray correlation value between each index of the two systems as shown in Table 4.
It can be observed from Table 4 that the grey correlation degree between a park city and agricultural green development is almost above 0.45. Therefore, it can be concluded that there exists a strong correlation between PCD and AGD systems, indicating close mutual influence in their interactive relationships.
In order to further recognize the coupling relationship between indicators of AGD and PCD, the main factors contributing to the coupling between Sichuan and Chengdu’s AGD system and PCD system during the study period were determined using a numerical average based on the gray correlation matrix. The results are presented in Table 5 and Table 6.
From 2011 to 2022, the impact of AGD on PCD in Sichuan Province exhibited a strong correlation, highlighting the significant influence of various PCD indicators on urban ecological environments and sustainable development. From the perspective of the influence degree of the four subsystems, the green life and efficient development subsystem plays a particularly prominent role in promoting PCD. Specifically, within the resource conservation subsystem, the “Percentage of effective irrigated area” showed a high correlation (0.728), indicating the crucial role of water resource management in park city ecological construction. However, the correlation of the “Cropland replanting coefficient” is relatively low (0.577), suggesting its limited influence on park city development. In the efficient development subsystem, the “Total agricultural output per sown area” showed the strongest correlation (0.833), followed by “agricultural labor productivity” (0.789), indicating that improvements in agricultural production efficiency and labor productivity have played a key role in advancing the economic development and agricultural modernization of PCD. In contrast, although the “Intensity of pesticide usage” and “Intensity of agricultural plastic film use” in the ecological conservation subsystem have some impact on park city construction, their influence is relatively weak, indicating that while promoting green agriculture, ecological conservation measures still need to be strengthened. The green life subsystem, in particular, plays an essential role in promoting PCD. Specifically, the correlation degree of “Per capita disposable income of rural residents” is 0.660, reflecting that the green development of agriculture, coupled with the growth of the rural economy, has significantly improved the urban–rural income gap and promoted the adoption of green lifestyles. All in all, the green life and efficient development subsystem plays an indispensable role in promoting the sustainable development of PCD, enhancing residents’ quality of life, and improving the ecological environment.
In the process of examining the impact of AGD on PCD in Chengdu from 2011 to 2022, except for “contribution of the agricultural economy” and “Total agricultural output per sown area”, other correlation degrees are above 0.6, indicating a strong overall correlation. Every indicator of AGD has played a significant role in the construction of the PCD. Notably, most of the indicators of resource saving, ecological conservation, and green life exceed 0.7. This suggests that the enhancement of environmental and ecological benefits, as well as the increase in agricultural output value, have a more pronounced impact on the PCD.
Considering that the impact order of the four subsystems of AGD on PCD is green life > ecological conservation > resource saving > efficient development, it is evident that green life plays a prominent role in the PCD. On one hand, the agricultural development in Chengdu significantly boosts the output value of the service industry and tourism, providing robust economic support for the city’s further growth and effectively narrowing the income gap between urban and rural areas. On the other hand, the greening, purifying, and beautifying effects of Chengdu’s inner and suburban agriculture contribute to enhancing the urban ecological environment and optimizing the city’s sustainable development capabilities.
Overall, the correlation between each subsystem of AGD and PCD appears to be relatively balanced. Firstly, Chengdu’s agriculture and park city construction progress steadily, and the development trends in each dimension are relatively balanced, showing no apparent bias. Secondly, because the development of agriculture in Chengdu is dependent on the city’s development, it always maintains a high sensitivity to the needs of urban development. Changes in urban development elements, such as spatial layout, population, economy, etc., have a facilitating or inhibiting effect on agriculture [50]. As can be seen from Table 6, in the process of PCD, the improvement of agricultural output and economic efficiency effectively drives the improvement of the park city level. This is consistent with Zhong et al. (2020), who showed that agricultural development plays an important role in the process of urbanization [51]. Compared to other subsystems, green life and quality and efficiency are most closely associated with the park city and drive the latter most significantly.

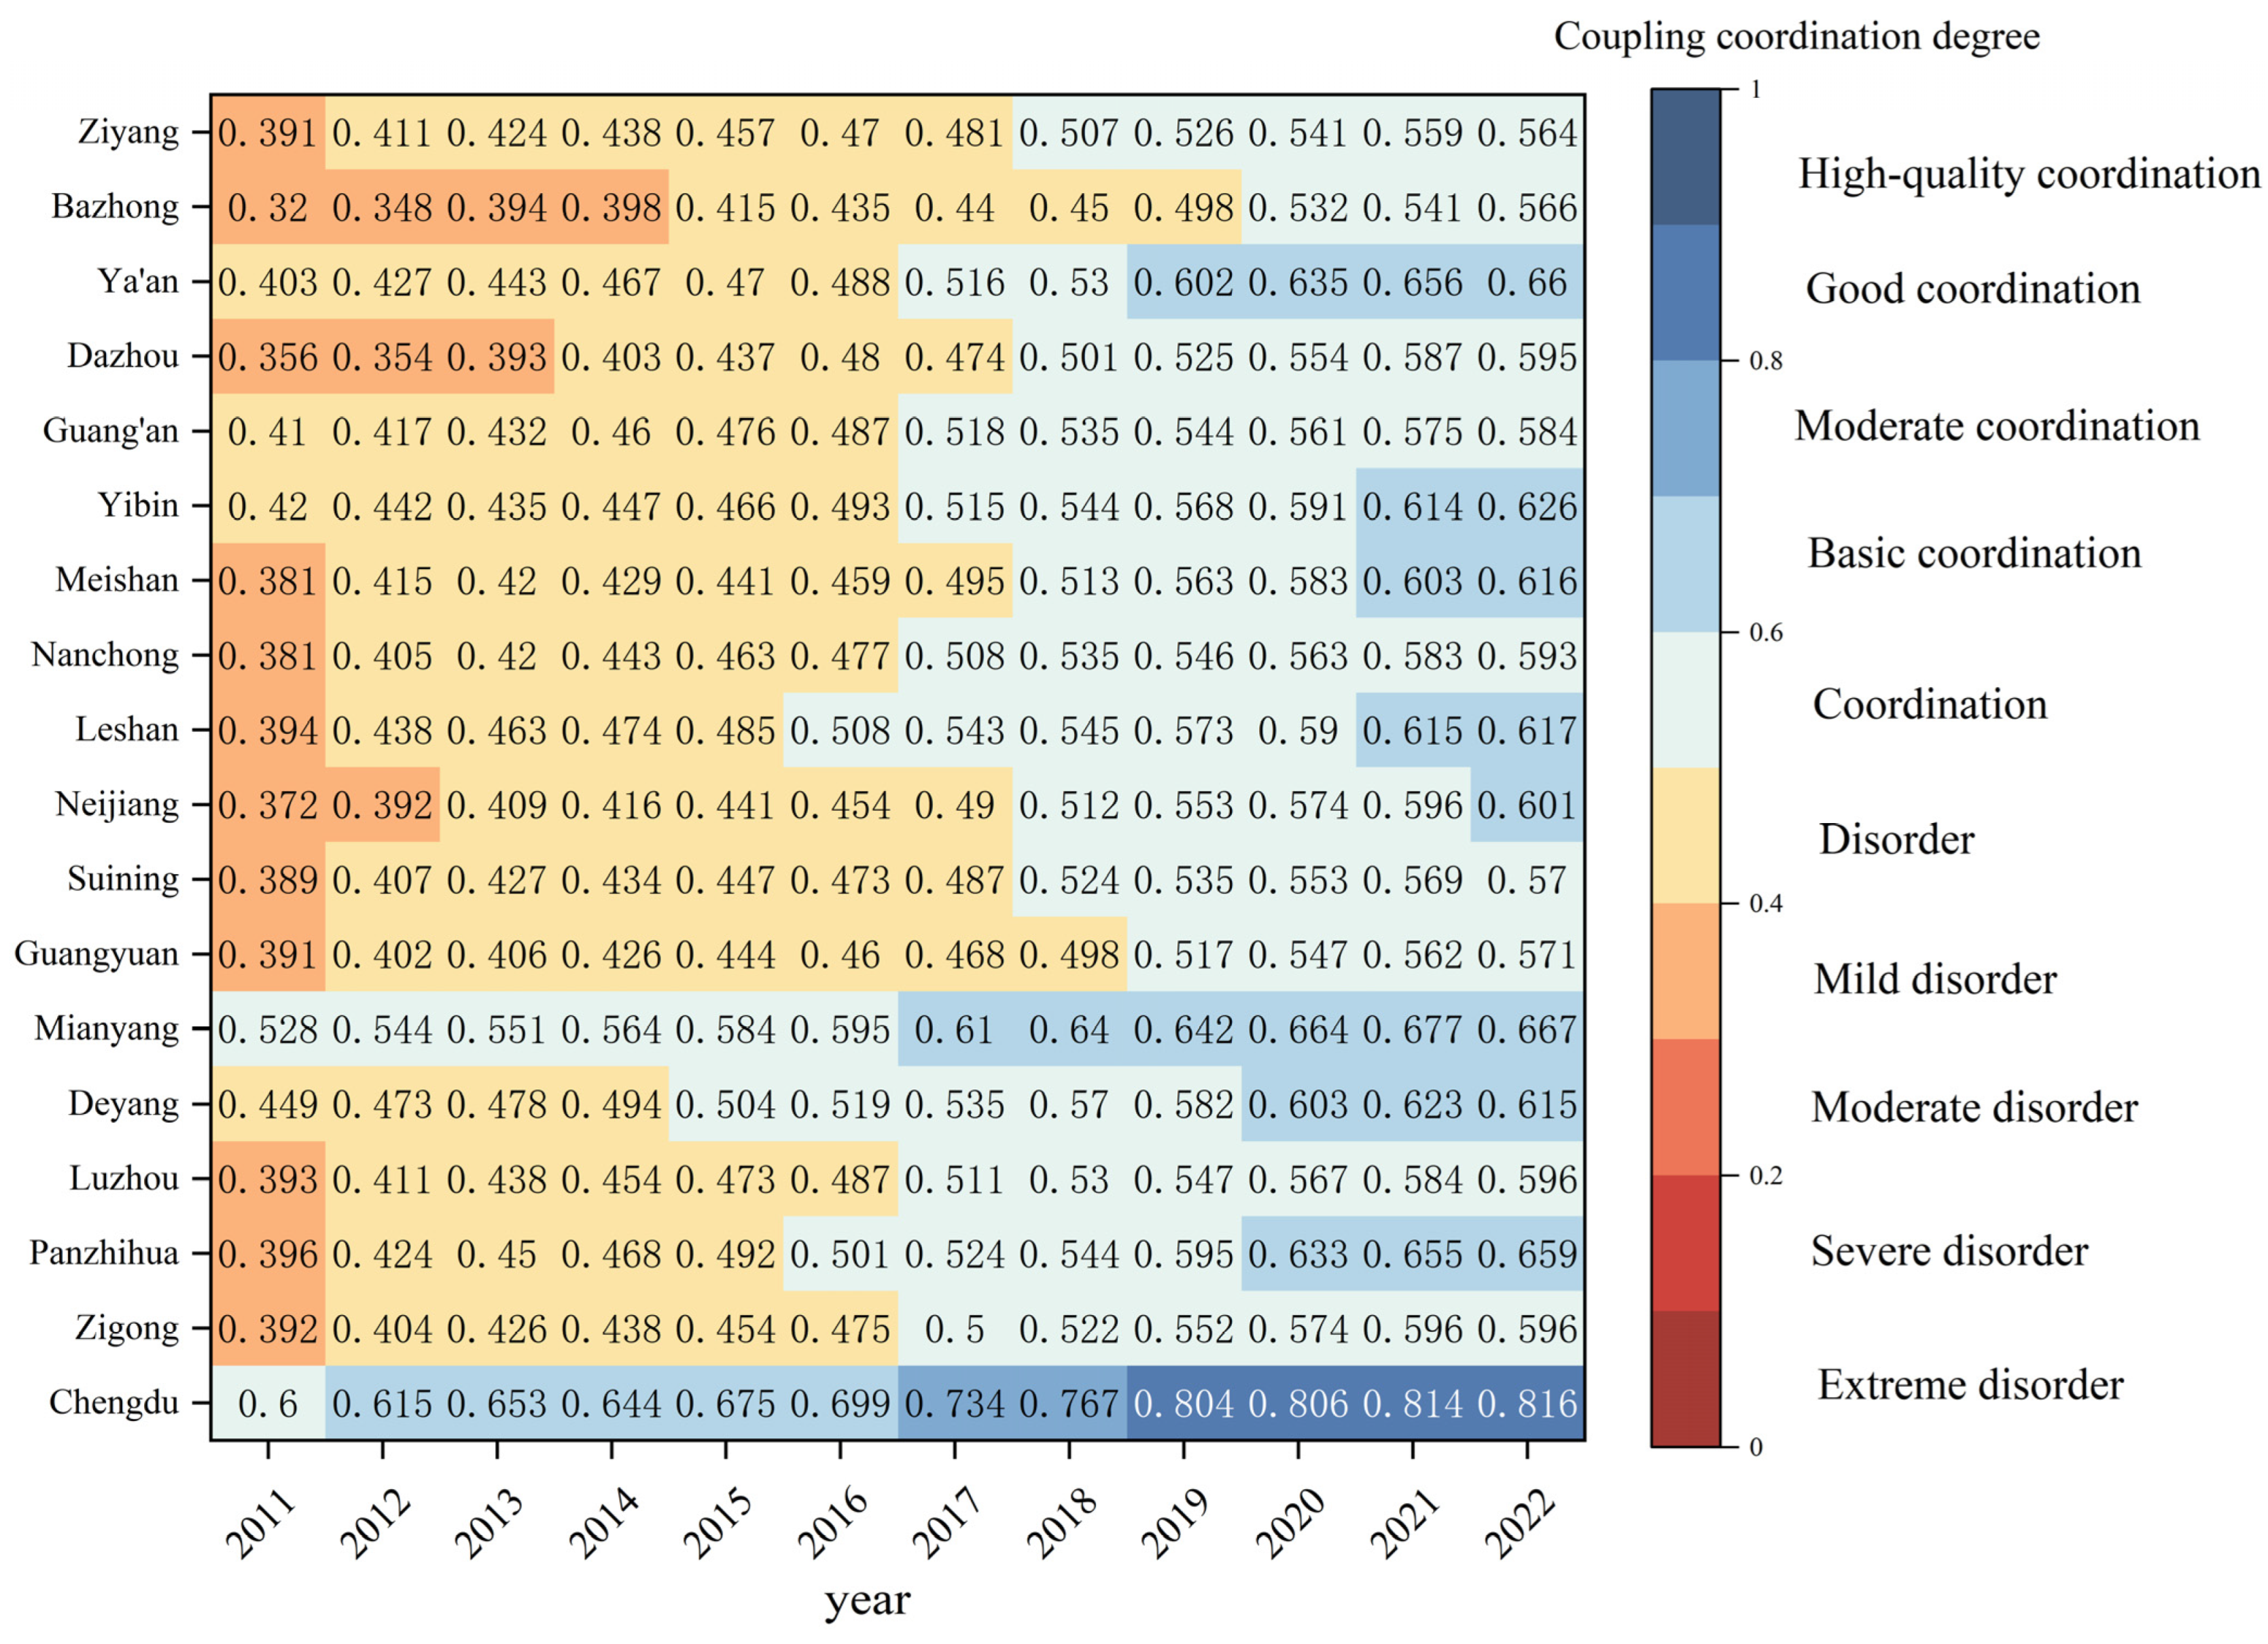
4.4. Timing Characteristics of Coupling Degree and Coupling Coordination Degree Between AGD and PCD

The coupled coordination model was employed to analyze the coordinated development status and dynamic change trend between AGD and PCD in prefectural-level cities in Sichuan Province from 2011 to 2022. As shown in Figure 6, the coupled coordination degree between PCD and AGD in most areas of Sichuan Province from 2011 to 2022 shows a gradual upward trend. From the perspective of the coupling development in Chengdu, the coupled coordination degree of AGD and PCD in Chengdu during the study period ranged from 0.600 to 0.816, marking the transition of both from coordination to good coordination. The synergy between AGD and PCD in Chengdu has gradually emerged. Prior to 2016, the AGD and PCD were in the stage of primary coordination. During this period, Chengdu’s AGD was in its initial stage. The utilization efficiency of agricultural resources such as agricultural labor force, capital, and technology was not high; urbanization and industrialization occupied agricultural land area, while the number of urban consumer residents increased year by year, and the demand for agricultural products was high, restricting its development to the direction of resource saving and environmental friendliness. During 2015–2022, the two achieved a three-level leap from primary coordination to good coordination, which is enough to see a qualitative leap in the high-quality coordination relationship between the two systems, and the various elements of the two systems promote each other and develop healthily.
Green agricultural development provides an ecological foundation for urban development. The scientific and technological achievements and advanced productivity in the process of urban development provide technical support for the green development of agriculture. Agriculture has been gradually integrated into the urban construction system. Urban development and agricultural development are mutually beneficial and develop together. The park city level far exceeds the level of green development in agriculture, which may be attributed to the advancement of the construction of Chengdu Park City Demonstration Zone, the rapid inflow of labor and capital into the city’s construction, and the difference between urban and rural resources leading to a more prominent advantage in the PCD process.
The coupled coordination degree between PCD and AGD in Chengdu has developed from coordination to good coordination, and its causes are multifaceted. From the perspective of urban construction, Chengdu has taken the construction of a park city demonstration area practicing the new development concept as the overall leader, continued to shape the beautiful form of the park city, and thickly planted the color of green development. It has continued to implement natural forest protection and returning farmland to forests, created the Tianfu Greenway, built the Longquanshan Urban Forest to a high standard, and accelerated the construction of ecological corridors in giant panda habitats. From the point of view of agricultural development, Chengdu aims to achieve the “build circle” and “strong chain” goals, that is, to create a modern urban agricultural ecosphere, extend and strengthen the modern seed industry chain, and enhance the competitiveness of urban agriculture. At the same time, Chengdu aims to improve the quality of arable land and food production capacity as the primary goal, to strengthen scientific and technological innovation, and to enhance the ability of modern management. In terms of policy orientation, the Chengdu City Master Plan (2011–2020) emphasizes that the optimization of the overall function of the town should be based on modern agriculture, and the overall orientation of the city and policy orientation has given agriculture better opportunities for development. In conclusion, Chengdu has created a sample of modern agriculture, through the development of more local characteristics of agriculture, to achieve increased income and overall regional development, especially the construction of the park city more reflecting the advantages of agricultural resources, the construction of greenways, the development of beautiful new villages, the restoration of ecological forests, etc., to fully demonstrate the modern functions of agriculture and the value of diversity, the connotation of the park city countryside expression of the connotation of the extensible and constantly enriched!

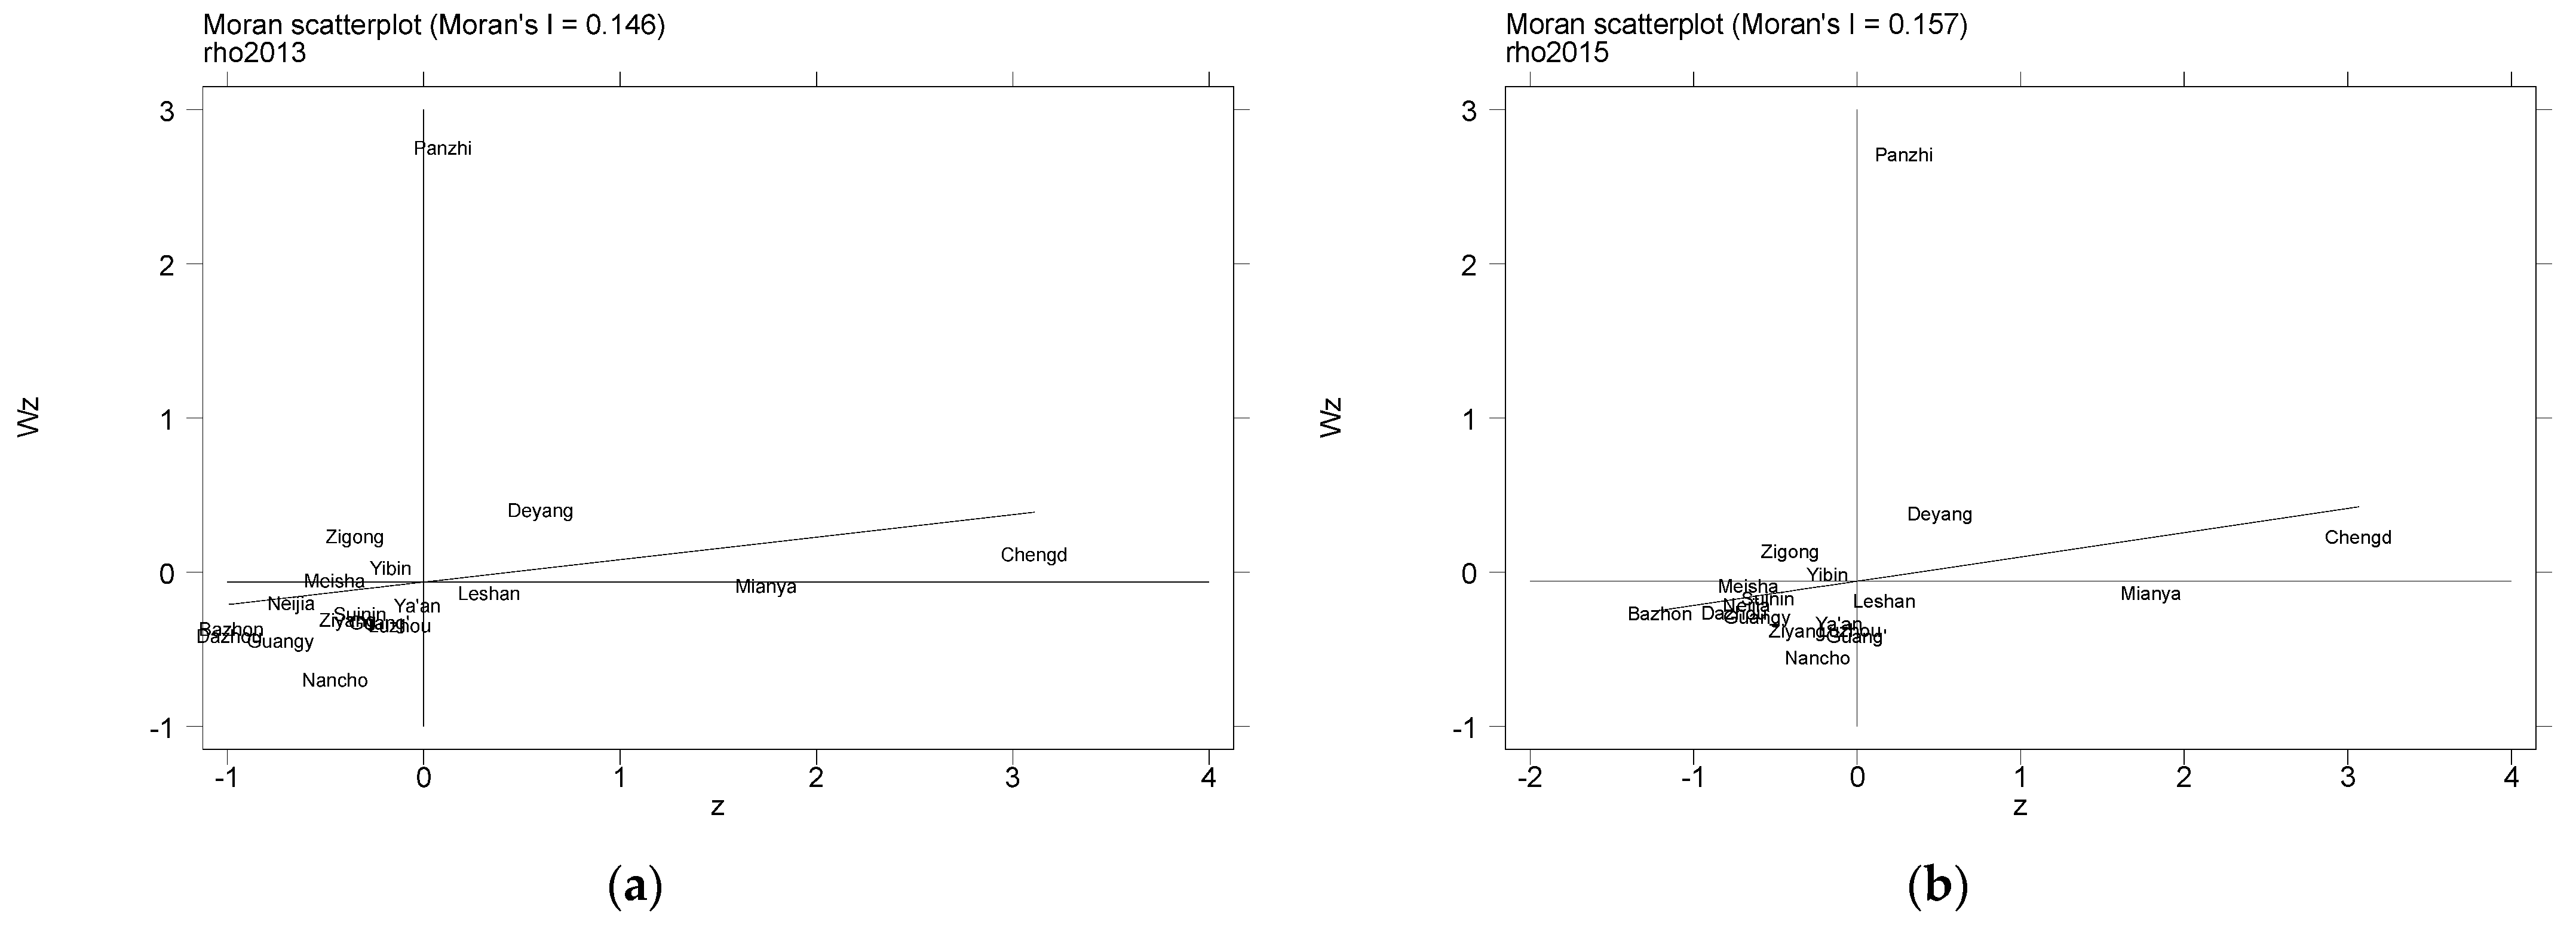
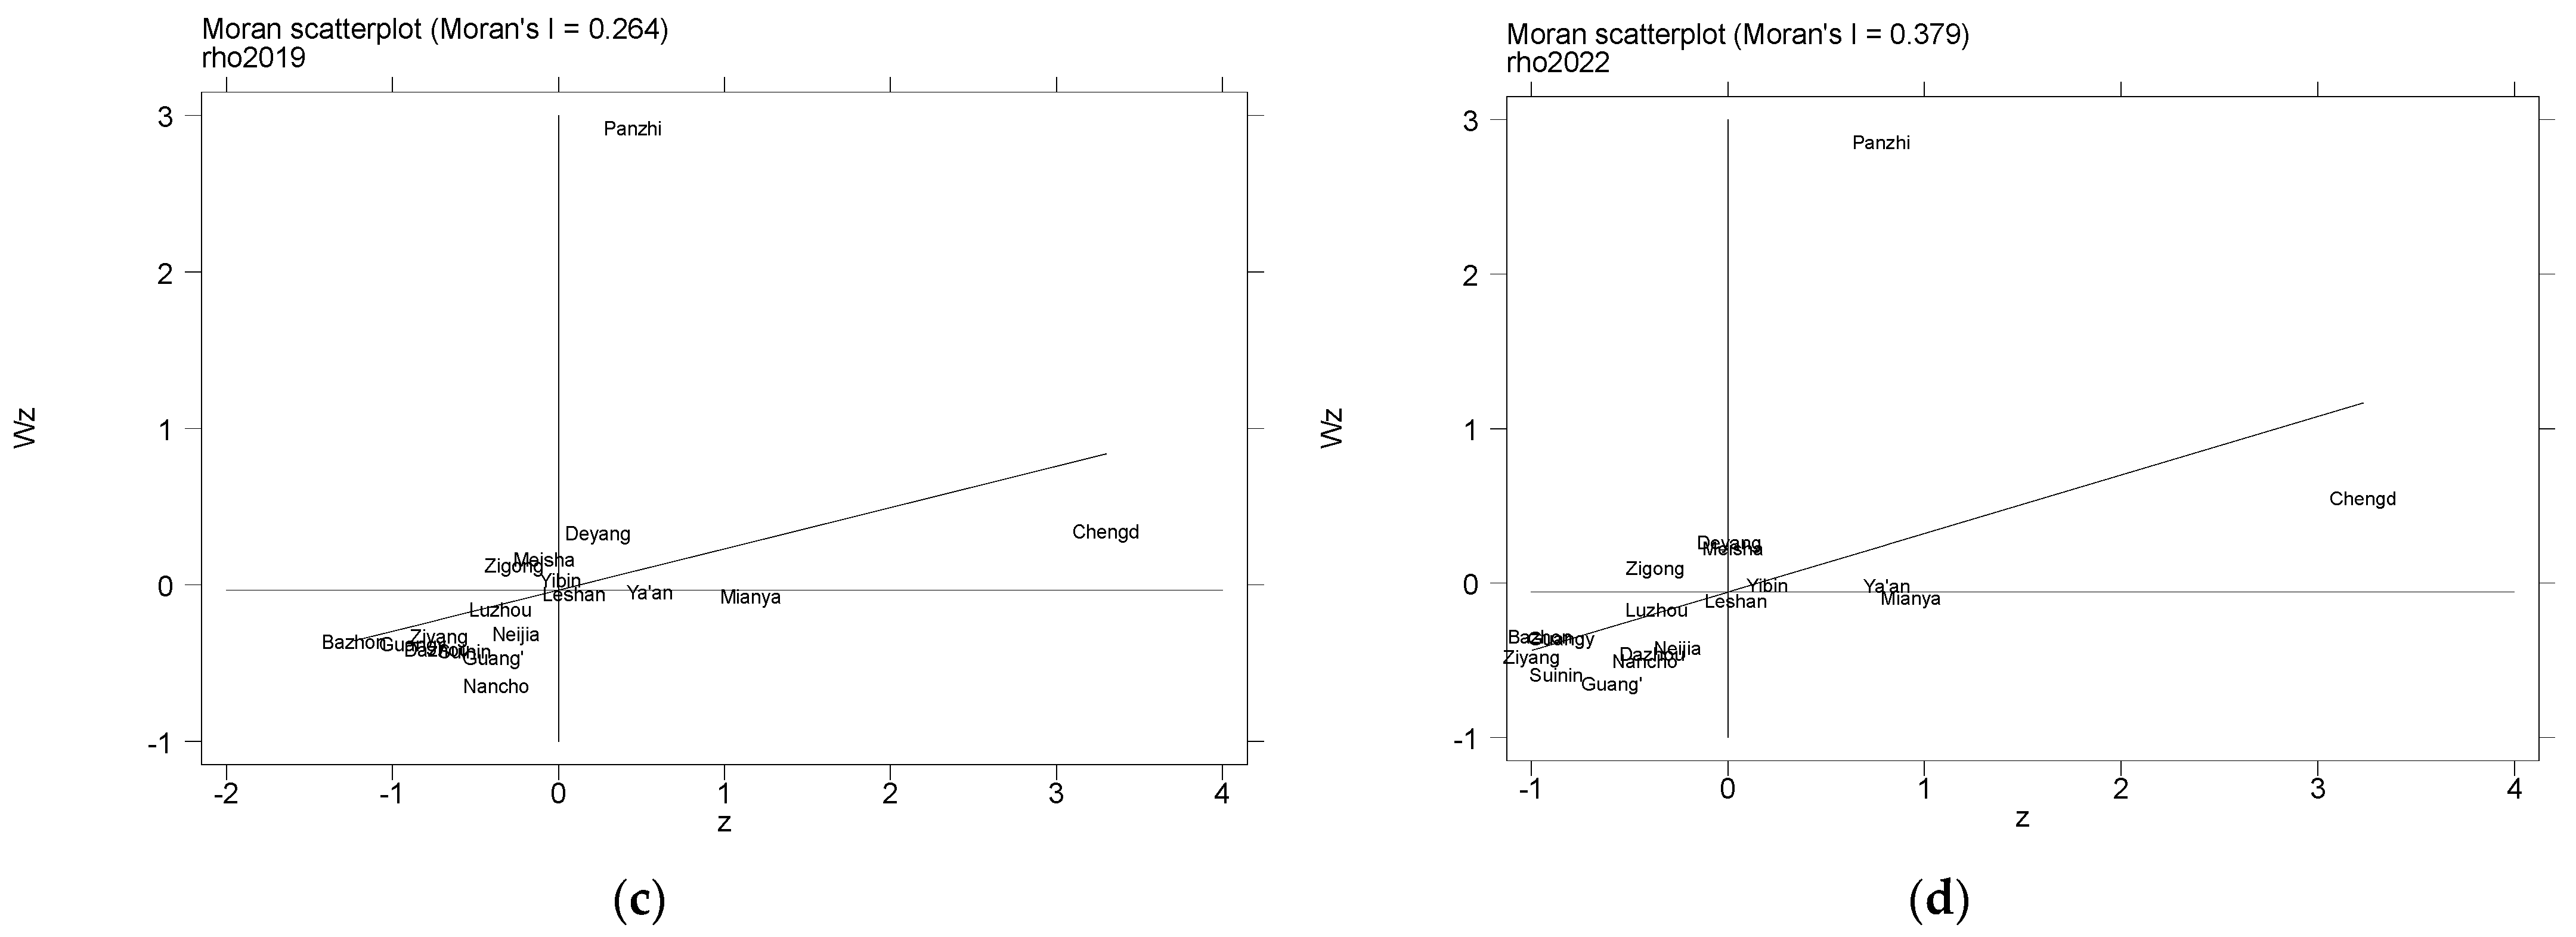
4.5. Spatial Autocorrelation Analysis

The global Moran I index was used to conduct spatial autocorrelation tests on the coordination and coupling degree of PCD and AGD in Sichuan from 2011 to 2022. Considering that both geographic and economic factors may affect the interaction between regions, the economic geography nested matrix was adopted in this study, and the results are shown in Table 7.
The results show that, except for 2011 and 2018, the Moran’s I index of the coordination coupling degree of prefecture-level cities in Sichuan passed the significance test at the 10% level, indicating a certain degree of spatial clustering. This suggests that the coordination coupling degree of AGD and PCD in a region is influenced by neighboring regions. From the magnitude of the Moran’s I index, the Moran’s I coefficients of the coupling degree from 2012 to 2022 are all greater than 0, indicating a positive spatial correlation. On the one hand, in the agricultural sector, Sichuan Province has vigorously promoted the transformation of green agriculture, facilitating the shift towards resource-saving and environmentally friendly agricultural production modes, which has gradually reduced the negative impact of traditional agriculture on the ecological environment. Meanwhile, in terms of urban green construction, Sichuan Province actively promotes an urban development model focused on ecological civilization, creating a livable and sustainable “park city” form. The coordinated development of both sectors has also fostered positive interactions and synergies between urban and agricultural systems. On the other hand, Sichuan Province has accelerated the construction of integrated urban–rural planning and regional integration. To promote regional cooperation, Sichuan has implemented a series of policies, and some regions have gradually formed a favorable situation for the coordinated development of agriculture and urban areas, improving the overall coordination degree among regions, This is similar to the findings of Gan et al. (2020), showing that narrowing the gap between urban and rural areas is conducive to coordinated regional development [52].
Four time points, 2013, 2016, 2019, and 2022, were selected to illustrate the local spatial clustering of the horizontal coupling coordination degree between AGD and PCD in Sichuan and to explore the spatial correlation characteristics of prefecture-level cities in Sichuan, as shown in Figure 7.
In the first quadrant, the local and adjacent areas exhibit a high coordination degree of AGD and PCD, representing a high–high agglomeration area. The second quadrant contains prefecture-level cities with a low coordination degree area, yet surrounded by high-level areas, referred to as low–high agglomeration. The third quadrant represents areas with a low coupling coordination degree between AGD and PCD, both locally and in neighboring regions, which is classified as a low–low agglomeration area. The fourth quadrant indicates a high local level with surrounding low levels, referred to as high–low agglomeration. As shown in Figure 7, the points corresponding to the Moran’s I index of the coordination coupling degree of AGD and PCD levels among cities in Sichuan Province are predominantly distributed in the first and third quadrants, highlighting the positive spatial promotion effect of agricultural green development and digitalization in these regions. From 2013 to 2022, the spatial autocorrelation between AGD and PCD in Sichuan has strengthened. The coupling coordination degree between agricultural green development and park city construction varies across regions, with Chengdu and Panzhihua exhibiting a high–high agglomeration effect. Cities such as Meishan, Mianyang, Yibin, and Ya’an have gradually transitioned to high–high coordination levels. This indicates that Chengdu, as the provincial capital, may have a positive influence on neighboring cities, promoting regional integration. On the other hand, cities like Guangyuan, Nanchong, Bazhong, Guangan, and Suining, which show relatively low coupling coordination degrees, may require more policy support and resource investment to enhance their coordination. The improvement in spatial autocorrelation is likely linked to regional coordinated development policies, infrastructure construction, and economic cooperation [53].

5. Conclusions and Policy Implications

5.1. Conclusions

By processing the time-series data of Sichuan prefecture-level cities from 2011 to 2022, on the basis of measuring the level of AGD and PCD, this study uses the coupled coordination model and the gray correlation degree model to explore the degree of interrelation and interdependence between the AGD and PCD. The main conclusions are as follows: (1) The overall level of AGD in most cities in Sichuan realized stable growth during the study period, but there are large differences in the development speed and overall level between regions. Among them, Chengdu’s comprehensive level of AGD shows a clear upward trend. Ecological conservation, efficient development, and green life standards are on the rise as a whole, indicating that Chengdu’s agricultural functions have undergone a transformation from traditional production functions to ecological and recreational functions. (2) The PCD of Chengdu levels showed an overall increase over the study period. This trend is especially enhanced by the significant improvement in the ecological aspects of the city since the park city was officially proposed in 2018. (3) The coupling and coordination degree of AGD and PCD in most areas of Sichuan Province from 2011 to 2022 shows a gradual upward trend. From the viewpoint of Chengdu’s coupling development, the coupling coordination degree of Chengdu’s AGD and PCD ranges from 0.600 to 0.816 during the study period, realizing the leap from coordination to good coordination between AGD and PCD. (4) During the study period, the impact of AGD on PCD construction showed a strong correlation, which, overall, reflected the significant role of AGD indicators on urban ecological environment and sustainable development. (6) From a spatial perspective, it is found that the coupling coordination degree of AGD and PCD in a region is influenced by neighboring regions. Specifically, Chengdu, as both a provincial capital and a demonstration area for park city construction, may have a positive impact on surrounding cities and promote regional integration.

5.2. Policy Implications

As a country with a large population, China needs to guarantee food security internally and fulfill its carbon-neutral development commitments externally. In the face of such dual pressures, Chengdu has taken the lead in proposing the development of a park city, which aims to break the traditional urban development model by promoting the development of rural areas, the quality of regional agriculture, the livability of the countryside, and the affluence of farmers. Based on the conclusions in the last section, there is still a lot of room for improvement in some elements of developing a park city.
To enhance the future level of integrated urban and rural development, improvements in the following areas can be the focus of government policy efforts in the coming period:
(1) Dual-Driven Infrastructure and Information Platforms for Enhancing Agricultural Modernization. Accelerate the upgrading of urban infrastructure, especially in suburban areas, improving key facilities such as roads, water, electricity, and communications, to support agricultural production and circulation. At the same time, establish cross-county agricultural information platforms to integrate resources and enhance farmers’ access to information, regularly providing market trends, technical guidance, and policy interpretations. Promote agricultural modernization, improving production efficiency and market competitiveness.
(2) Strengthen Agricultural R&D and Applications to Promote Green Agriculture. Promote cooperation between research institutions and enterprises, focusing on R&D of efficient, low-harm fertilizers, pesticides, and energy-saving agricultural machinery, and facilitate the conversion of scientific achievements. Promote advanced cultivation technologies and agricultural IoT applications, improving mechanization efficiency and using smart monitoring systems for precise management, thus reducing resource waste. Organize training on green agricultural technologies, enhancing farmers’ environmental awareness and technology application capabilities to promote sustainable agricultural development.
(3) Integrate Agriculture with Urban Ecosystems and Optimize Ecological Function Layout. Incorporate agricultural ecological functions into urban planning, optimize agricultural land use, and build ecological corridors to promote biodiversity conservation and enhance urban ecosystem stability. Combine urban renewal with rural beautification efforts, increase public green space per capita, and improve the quality of life for urban and rural residents, promoting the integration of agricultural functions and the park city development system.
(4) Deepen Regional Cooperation to Promote Ecological Integration in Urban Clusters. Drawing on Chengdu’s PCD experience, promote ecological integration in urban clusters such as Chengdu, Deyang, Meishan, and Zigong. Establish cross-regional cooperation mechanisms to advance projects like ecological corridors and green agricultural development demonstration zones, exploring models of benefit-sharing and cost-sharing. Promote the integration of green agriculture with rural tourism and cultural industries, driving rural revitalization and farmers’ income growth, thus achieving a win–win for agricultural green development and park city construction, and fostering sustainable regional economic development.
In summary, the construction of PCD advocates the development of urban agriculture and ecological agriculture, including implementing vertical farming, rooftop gardens, urban horticulture projects, etc., within the city or its surrounding areas, and promoting the development of organic agriculture and ecological agriculture. This model is of great significance in enhancing the dietary environment of urban residents, reducing urban dependence on external resources, and also contributes to the enhancement of the urban ecological environment. Furthermore, this PCD development model provides a possible urbanization transition scenario for industrialized countries and developing countries that promotes the development of rural areas and narrows the gap between cities and countrysides.

Author Contributions

Writing—original draft, methodology, data curation, validation, X.D. and Y.L.; methodology, resources, Y.Q.; data curation, writing and formatting, Y.C.; data curation, methodology, D.Y.; data curation, methodology, software, Y.H. and K.X.; conceptualization, writing—review and editing, X.D. and S.H. All authors have read and agreed to the published version of the manuscript.

Funding

This research was funded by the National Social Science Fund of China, grant number 23XJY015, the Philosophy and Social Science Planning Project of Chengdu grant number 2024CS122. The 2023 Sichuan Provincial Science and Technology Activity Program for Returned Scholars from Overseas (grant no. 24, Start-Up Projects).

Institutional Review Board Statement

Not applicable.

Informed Consent Statement

Not applicable.

Data Availability Statement

The original contributions presented in this study are included in the article; further inquiries can be addressed to the corresponding author.

Conflicts of Interest

The authors declare no conflicts of interest.

Abbreviations

AGDAgricultural green development
PCDPark city development
ACERAgriculture carbon emission reduction

References

  1. Chen, X. The core of China’s rural revitalization: Exerting the functions of rural area. China Agric. Econ. Rev. 2020, 12, 1–13. [Google Scholar] [CrossRef]
  2. Sharifi, A.; Khavarian-Garmsir, A.R. The COVID-19 pandemic: Impacts on cities and major lessons for urban planning, design, and management. Sci. Total Environ. 2020, 749, 142391. [Google Scholar] [CrossRef] [PubMed]
  3. Fanfani, D.; Duží, B.; Mancino, M.; Rovai, M. Multiple evaluation of urban and peri-urban agriculture and its relation to spatial planning: The case of Prato territory (Italy). Sustain. Cities Soc. 2022, 79, 103636. [Google Scholar] [CrossRef]
  4. Hosseinpour, N.; Kazemi, F.; Mahdizadeh, H. A cost-benefit analysis of applying urban agriculture in sustainable park design. Land Use Policy 2022, 112, 105834. [Google Scholar] [CrossRef]
  5. Li, Y.; Westlund, H.; Liu, Y. Why some rural areas decline while some others not: An overview of rural evolution in the world. J. Rural Stud. 2019, 68, 135–143. [Google Scholar] [CrossRef]
  6. Wen, T. Eight crises: Lessons from China 1949–2009. In Development Trap and Experience in China; Oriental Press: Beijing, China, 2013. [Google Scholar]
  7. Long, H.; Tu, S.; Ge, D.; Li, T.; Liu, Y. The allocation and management of critical resources in rural China under restructuring: Problems and prospects. J. Rural Stud. 2016, 47, 392–412. [Google Scholar] [CrossRef]
  8. Fei, X.; Feng, J.W. Research on the High-Quality Development Model of China’s Grain Industry from the Perspective of Rural Revitalization. Wirel. Commun. Mob. Comput. 2022, 2022, 2661237. [Google Scholar] [CrossRef]
  9. Zoomers, A.; van Noorloos, F.; Otsuki, K.; Steel, G.; van Westen, G. The Rush for Land in an Urbanizing World: From Land Grabbing Toward Developing Safe, Resilient, and Sustainable Cities and Landscapes. World Dev. 2017, 92, 242–252. [Google Scholar] [CrossRef]
  10. Huang, M.H.; Xiao, J.; Zhou, Y.T. From Garden City to Public Garden City: The Actuality, Oughtness, and Inevitability of Theoretical Innovation of Urban Planning with Chinese Characteristics. Planners 2022, 38, 140–145. [Google Scholar]
  11. Sharifi, A. From Garden City to Eco-urbanism: The quest for sustainable neighborhood development. Sustain. Cities Soc. 2016, 20, 1–16. [Google Scholar] [CrossRef]
  12. Fu, F.; Li, H.; Zhao, C. From landscape City to Park City—The road of urban development in China. Landsc. Archit. 2020, 36, 12. [Google Scholar]
  13. Yu, G.; Wu, S.; Huang, S.; Huang, X. From “City of a Thousand Parks” to “City as a Park”: Compilation Idea and Practice of the Outline of Shenzhen Park City Planning. Landsc. Archit. 2023, 30, 69–77. [Google Scholar]
  14. Shi, Y.; Liu, Q. Park City: Connotation, Logic and Path of Green Governance. J. Renmin Univ. China 2019, 33, 48. [Google Scholar]
  15. Wu, S.; Wang, D.; Yan, Z.; Wang, X.; Han, J. Coupling or contradiction? The spatiotemporal relationship between urbanization and urban park system development in China. Ecol. Indic. 2023, 154, 110703. [Google Scholar] [CrossRef]
  16. Xie, X.; Gong, X.; Pan, S. Research on the construction path of the megacity from the perspective of Nudge Theory: Empirical evidence of the “Park City” construction in Chengdu Tianfu New Area. Chin. J. Popul. Res. Environ. 2023, 21, 163–171. [Google Scholar] [CrossRef]
  17. Zhang, Z.; Ma, G.; Lin, X.; Dai, H. Accessibility in a multiple transport mode urban park based on the “D-D” model: A case study in Park City, Chengdu. Cities 2023, 134, 104191. [Google Scholar] [CrossRef]
  18. Zhang, S.; Song, H.; Li, X.; Luo, S. Urban Parks Quality Assessment Using Multi-Dimension Indicators in Chengdu, China. Land 2024, 13, 86. [Google Scholar] [CrossRef]
  19. Tan, R.; Wang, R.; Wang, Y.; Yi, D.; Chen, Y.; Cai, W.; Wang, X. The Park city perspective study: Revealing the park accessibility influenced by experiences of visitors under different travel modes. Front. Environ. Sci. 2022, 10, 924996. [Google Scholar] [CrossRef]
  20. Li, Z.; Liu, Q.; Zhang, Y.; Yan, K.; Yan, Y.; Xu, P. Characteristics of Urban Parks in Chengdu and Their Relation to Public Behaviour and Preferences. Sustainability 2022, 14, 6761. [Google Scholar] [CrossRef]
  21. Zhang, J.; Xu, E. Investigating the spatial distribution of urban parks from the perspective of equity-efficiency: Evidence from Chengdu, China. Urban For. Urban Green. 2023, 86, 128019. [Google Scholar] [CrossRef]
  22. Azunre, G.A.; Amponsah, O.; Peprah, C.; Takyi, S.A.; Braimah, I. A review of the role of urban agriculture in the sustainable city discourse. Cities 2019, 93, 104–119. [Google Scholar] [CrossRef]
  23. La Rosa, D.; Barbarossa, L.; Privitera, R.; Martinico, F. Agriculture and the city: A method for sustainable planning of new forms of agriculture in urban contexts. Land Use Policy 2014, 41, 290–303. [Google Scholar] [CrossRef]
  24. Benis, K.; Ferrão, P. Potential mitigation of the environmental impacts of food systems through urban and peri-urban agriculture (UPA)—A life cycle assessment approach. J. Clean. Prod. 2017, 140, 784–795. [Google Scholar] [CrossRef]
  25. Hara, Y.; McPhearson, T.; Sampei, Y.; McGrath, B. Assessing urban agriculture potential: A comparative study of Osaka, Japan and New York city, United States. Sustain. Sci. 2018, 13, 937–952. [Google Scholar] [CrossRef]
  26. Rallings, A.M.; Smukler, S.M.; Gergel, S.E.; Mullinix, K. Towards multifunctional land use in an agricultural landscape: A trade-off and synergy analysis in the Lower Fraser Valley, Canada. Landsc. Urban Plan. 2019, 184, 88–100. [Google Scholar] [CrossRef]
  27. Renting, H.; Rossing, W.A.H.; Groot, J.C.J.; Van der Ploeg, J.D.; Laurent, C.; Perraud, D.; Stobbelaar, D.J.; Van Ittersum, M.K. Exploring multifunctional agriculture. A review of conceptual approaches and prospects for an integrative transitional framework. J. Environ. Manag. 2009, 90, S112–S123. [Google Scholar] [CrossRef]
  28. Peng, J.; Liu, Z.; Liu, Y.; Hu, X.; Wang, A. Multifunctionality assessment of urban agriculture in Beijing City, China. Sci. Total Environ. 2015, 537, 343–351. [Google Scholar] [CrossRef]
  29. Yang, Z.; Cai, J.; Sliuzas, R. Agro-tourism enterprises as a form of multi-functional urban agriculture for peri-urban development in China. Habitat Int. 2010, 34, 374–385. [Google Scholar] [CrossRef]
  30. Barthel, S.; Parker, J.; Ernstson, H. Food and green space in cities: A resilience lens on gardens and urban environmental movements. Urban Stud. 2015, 52, 1321–1338. [Google Scholar] [CrossRef]
  31. McClintock, N.; Miewald, C.; McCann, E. Governing urban agriculture: Formalization, resistance and re-visioning in two ‘green’ cities. Int. J. Urban Reg. Res. 2021, 45, 498–518. [Google Scholar] [CrossRef]
  32. Nogeire-McRae, T.; Ryan, E.P.; Jablonski, B.B.R.; Carolan, M.; Arathi, H.S.; Brown, C.S.; Saki, H.H.; McKeen, S.; Lapansky, E.; Schipanski, M.E. The role of urban agriculture in a secure, healthy, and sustainable food system. BioScience 2018, 68, 748–759. [Google Scholar] [CrossRef]
  33. Rao, N.; Patil, S.; Singh, C.; Roy, P.; Pryor, C.; Poonacha, P.; Genes, M. Cultivating sustainable and healthy cities: A systematic literature review of the outcomes of urban and peri-urban agriculture. Sustain. Cities Soc. 2022, 85, 104063. [Google Scholar] [CrossRef]
  34. Weidner, T.; Yang, A. The potential of urban agriculture in combination with organic waste valorization: Assessment of resource flows and emissions for two European cities. J. Clean. Prod. 2020, 244, 118490. [Google Scholar] [CrossRef]
  35. Gómez-Villarino, M.T.; Ruiz-Garcia, L. Adaptive design model for the integration of urban agriculture in the sustainable development of cities. A case study in northern Spain. Sustain. Cities Soc. 2021, 65, 102595. [Google Scholar] [CrossRef]
  36. Panagopoulos, T.; Duque, J.A.G.; Dan, M.B. Urban planning with respect to environmental quality and human well-being. Environ. Pollut. 2016, 208, 137–144. [Google Scholar] [CrossRef]
  37. Kulak, M.; Graves, A.; Chatterton, J. Reducing greenhouse gas emissions with urban agriculture: A Life Cycle Assessment perspective. Landsc. Urban Plan. 2013, 111, 68–78. [Google Scholar] [CrossRef]
  38. Langemeyer, J.; Madrid-Lopez, C.; Beltran, A.M.; Mendez, G.V. Urban agriculture—A necessary pathway towards urban resilience and global sustainability? Landsc. Urban Plan. 2021, 210, 104055. [Google Scholar] [CrossRef]
  39. Cohen, N.; Wijsman, K. Urban agriculture as green infrastructure: The case of New York city. Urban Agric. Mag. 2014, 27, 16–19. [Google Scholar]
  40. McCarthy, L.J.; Russo, A. Exploring the role of nature-based typologies and stewardship schemes in enhancing urban green spaces: Citizen perceptions of landscape design scenarios and ecosystem services. J. Environ. Manag. 2023, 346, 118944. [Google Scholar] [CrossRef]
  41. Bai, X.; Sadia, S. Park city leads the way of urban development and innovation in China. J. Environ. Eng. Landsc. Manag. 2023, 31, 240–247. [Google Scholar] [CrossRef]
  42. Wu, X.; Liu, H.; Liu, W. Exploring the spatiotemporal evolution dynamic and influencing factor of green ecology transition for megacities: A case study of Chengdu, China. Ecol. Indic. 2024, 158, 111285. [Google Scholar] [CrossRef]
  43. Chen, Z.; Sarkar, A.; Rahman, A.; Li, X.; Xia, X. Exploring the drivers of green agricultural development (GAD) in China: A spatial association network structure approaches. Land Use Policy 2022, 112, 105827. [Google Scholar] [CrossRef]
  44. Liu, Y.; Sun, D.; Wang, H.; Wang, X.; Yu, G.; Zhao, X. An evaluation of China’s agricultural green production: 1978–2017. J. Clean. Prod. 2020, 243, 118483. [Google Scholar] [CrossRef]
  45. Cui, X.; Zhao, T.; Wang, J. Allocation of carbon emission quotas in China’s provincial power sector based on entropy method and ZSG-DEA. J. Clean. Prod. 2021, 284, 124683. [Google Scholar] [CrossRef]
  46. Hu, Y.; Wu, L.; Shi, C.; Wang, Y.; Zhu, F. Research on optimal decision-making of cloud manufacturing service provider based on grey correlation analysis and TOPSIS. Int. J. Prod. Res. 2020, 58, 748–757. [Google Scholar] [CrossRef]
  47. Zhang, J.; Dong, Z. Assessment of coupling coordination degree and water resources carrying capacity of Hebei Province (China) based on WRESP2D2P framework and GTWR approach. Sustain. Cities Soc. 2022, 82, 103862. [Google Scholar] [CrossRef]
  48. Dong, Q.; Zhong, K.; Liao, Y.; Xiong, R.; Wang, F.; Pang, M. Coupling coordination degree of environment, energy, and economic growth in resource-based provinces of China. Resour. Policy 2023, 81, 103308. [Google Scholar] [CrossRef]
  49. Wu, B.; Liu, L. Social capital for rural revitalization in China: A critical evaluation on the government’s new countryside programme in Chengdu. Land Use Policy 2020, 91, 104268. [Google Scholar] [CrossRef]
  50. Du, Y. Holistic gentrification and the recreation of rurality: The new wave of rural gentrification in Chengdu, China. J. Rural Stud. 2022, 96, 237–245. [Google Scholar] [CrossRef]
  51. Zhong, C.; Hu, R.; Wang, M.; Xue, W.; He, L. The impact of urbanization on urban agriculture: Evidence from China. J. Clean. Prod. 2020, 276, 122686. [Google Scholar] [CrossRef]
  52. Gan, L.; Shi, H.; Hu, Y.; Lev, B.; Lan, H. Coupling coordination degree for urbanization city-industry integration level: Sichuan case. Sustain. Cities Soc. 2020, 58, 102136. [Google Scholar] [CrossRef]
  53. Tang, D.; Mao, M.; Shi, J.; Hua, W. The spatio-temporal analysis of urban-rural coordinated development and its driving forces in Yangtze River Delta. Land 2021, 10, 495. [Google Scholar] [CrossRef]
Figure 1. Location of Chengdu City.
Agriculture 15 00248 g001
Figure 2. Comprehensive level of agricultural green development and changes of its subsystems in prefecture-level cities of Sichuan Province from 2011 to 2022. (a) Agricultural green development level of prefecture-level cities in Chengdu Plain Economic Zone from 2010 to 2022; (b) Agricultural green development level of prefecture-level cities in south Sichuan Economic Zone from 2010 to 2022; (c) Agricultural green development level of prefecture-level cities in Northeast Sichuan Economic Zone and Panzhihua from 2010 to 2022.
Agriculture 15 00248 g002
Figure 3. Comprehensive level of agricultural green development and its subsystem changes in Chengdu from 2011 to 2022.
Agriculture 15 00248 g003
Figure 4. The comprehensive development level of PCD in prefecture-level cities of Sichuan Province from 2011 to 2022.
Agriculture 15 00248 g004
Figure 5. Comprehensive level of park city and its subsystem changes in Chengdu from 2010 to 2021.
Agriculture 15 00248 g005
Figure 6. Time-series changes in the level of green agricultural development and park city in Chengdu and its coupling coordination degree.
Agriculture 15 00248 g006
Figure 7. Local Moran’s I for agricultural green development and park city coupling coordination in Sichuan Province in 2013, 2015, 2019, and 2022. (a) Local spatial cluster map of horizontal coupling coordination between AGD and PCD in Sichuan in 2015; (b) Local spatial cluster map of horizontal coupling coordination between AGD and PCD in Sichuan in 2015; (c) Local spatial cluster map of horizontal coupling coordination between AGD and PCD in Sichuan in 2019; (d) Local spatial cluster map of horizontal coupling coordination between AGD and PCD in Sichuan in 2022.
Agriculture 15 00248 g007aAgriculture 15 00248 g007b
Table 1. Indicators for Park City development.
Primary IndicatorsSecondary IndicatorsVectorsCharacteristicsWeight W
Habitat Living Environment
(0.265)
Number of parks x 1 Positive0.151
Per capita public recreational green space x 2 Positive0.054
Urban sewage treatment rate x 3 Positive0.007
Harmless treatment rate of domestic garbage x 4 Positive0.008
Road square per capita (m2) x 5 Positive0.044
Urban Ecological Environment
(0.041)
Proportion of days with good ambient air quality x 6 Positive0.010
Green space rate of built district (%) x 7 Positive0.015
Green coverage rate of built-up areas (%) x 8 Positive0.016
Green Production Status
(0.694)
Share of tertiary industry GDP in total GDP x 9 Positive0.062
GDP per capita x 10 Positive0.054
Value added of tertiary industry x 11 Positive0.345
Per capita disposable income of urban residents x 12 Positive0.055
Intensity of R&D investment x 13 Positive0.178
Table 2. Indicators for agricultural green development.
Primary IndicatorsSecondary IndicatorsMeaning of the IndicatorVectorsCharacteristicsWeight W
Resource Saving
(0.217)
Cropland replanting coefficientSown area of major crops/total cultivated area y 1 Negative0.063
Total power of agricultural machinery per unit sown areaTotal power of agricultural machinery/area sown with crops y 2 Negative0.039
Percentage of effective irrigated areaEffective irrigated area/total cultivated area y 3 Positive0.115
Ecological Conservation
(0.185)
Intensity of pesticide usagePesticide application/area sown with crops y 4 Negative0.004
Intensity of fertilizer useAgricultural fertilizer application/area sown with crops y 5 Negative0.069
Intensity of agricultural plastic film useAgricultural film use/area sown with crops y 6 Negative0.035
Forest coverage rateRatio of forest area/total land area y 7 Positive0.077
Efficient Development
(0.452)
Level of contribution of the agricultural economy(Agricultural output/regional GDP) × 100 y 8 Positive0.083
The per unit area yield of grainTotal grain production/total area sown with grain y 9 Positive0.028
Total agricultural output per sown areaGross agricultural output/area sown for major crops y 10 Positive0.173
Agricultural labor productivityGross value of agricultural output/personnel employed in the primary sector y 11 Positive0.168
Green Life
(0.145)
Per capita disposable income of rural residentsRural disposable income per capita y 12 Positive0.105
Engel’s coefficient for rural householdsEngel’s coefficient for rural households y 13 Positive0.041
Table 3. Indicator system of coupled coordination degree.
Category of Coupling CoordinationValueCoupling Coordination Level
Bad Coupling Coordination(0, 0.1]Extreme disorder
(0.1, 0.2]Severe disorder
(0.2, 0.3]Moderate disorder
(0.3, 0.4]Mild disorder
(0.4, 0.5]Disorder
Good Coupling Coordination(0.5, 0.6]Coordination
(0.6, 0.7]Basic coordination
(0.7, 0.8]Moderate coordination
(0.8, 0.9]Good coordination
(0.9, 1.0]High-quality coordination
Table 4. Matrix of correlation between park city and agricultural green development in Chengdu from 2011 to 2022.
ChengduZigongPanzhihuaLuzhouDeyangMianyangGuangyuanSuiningNeijiang
Agricultural green development system (Y)Resource saving y 1 0.716 0.570 0.395 0.527 0.729 0.673 0.623 0.578 0.620
y 2 0.723 0.393 0.742 0.420 0.441 0.525 0.464 0.389 0.414
y 3 0.719 0.804 0.683 0.794 0.700 0.749 0.758 0.725 0.727
Ecological conservation y 4 0.767 0.511 0.531 0.510 0.541 0.622 0.498 0.505 0.511
y 5 0.765 0.511 0.874 0.433 0.956 0.816 0.451 0.696 0.491
y 6 0.775 0.444 0.791 0.419 0.532 0.540 0.458 0.405 0.403
y 7 0.639 0.865 0.375 0.483 0.641 0.550 0.405 0.820 0.840
Efficient Development y 8 0.466 0.803 0.857 0.851 0.893 0.816 0.634 0.735 0.638
y 9 0.642 0.622 0.754 0.437 0.422 0.723 0.571 0.532 0.505
y 10 0.595 0.932 0.727 0.849 0.847 0.658 0.795 0.902 0.948
y 11 0.675 0.807 0.713 0.890 0.796 0.807 0.821 0.844 0.530
Green life y 12 0.743 0.617 0.600 0.656 0.648 0.703 0.727 0.647 0.610
y 13 0.780 0.550 0.491 0.563 0.549 0.574 0.500 0.549 0.549
LeshanNanchongMeishanYibinGuang’anDazhouYa’anBazhongZiyang
Agricultural green development system (Y)Resource saving y 1 0.558 0.682 0.520 0.489 0.513 0.564 0.523 0.609 0.500
y 2 0.563 0.390 0.523 0.431 0.479 0.387 0.789 0.389 0.399
y 3 0.659 0.821 0.451 0.817 0.799 0.801 0.546 0.746 0.797
Ecological conservation y 4 0.526 0.501 0.496 0.519 0.519 0.502 0.517 0.487 0.500
y 5 0.545 0.486 0.837 0.391 0.524 0.499 0.909 0.493 0.359
y 6 0.487 0.444 0.603 0.452 0.536 0.451 0.395 0.449 0.367
y 7 0.420 0.656 0.501 0.568 0.731 0.584 0.341 0.364 0.687
Efficient Development y 8 0.910 0.598 0.681 0.819 0.668 0.581 0.673 0.570 0.475
y 9 0.567 0.515 0.519 0.465 0.452 0.509 0.848 0.487 0.773
y 10 0.931 0.902 0.860 0.869 0.911 0.930 0.660 0.804 0.870
y 11 0.836 0.676 0.835 0.816 0.825 0.863 0.782 0.838 0.854
Green life y 12 0.683 0.700 0.564 0.640 0.667 0.654 0.733 0.713 0.575
y 13 0.506 0.576 0.482 0.600 0.572 0.582 0.454 0.576 0.484
Table 5. Grey correlation ranking of green agricultural development factors influencing park city in Sichuan Province.
Factors of Agricultural Green Development Influencing Park CityGray Correlation DegreeSort
Resource Saving
0.599
Cropland replanting coefficient0.577 8
Total power of agricultural machinery per unit sown area0.492 13
Percentage of effective irrigated area0.728 3
Ecological Conservation
0.556
Intensity of pesticide usage0.531 11
Intensity of fertilizer use0.613 6
Intensity of agricultural plastic film use0.497 12
Forest coverage rate0.582 7
Efficient Development
0.725
Level of contribution of the agricultural economy0.704 4
The per unit area yield of grain0.574 9
Total agricultural output per sown area0.833 1
Agricultural labor productivity0.789 2
Green Life
0.606
Per capita disposable income of rural residents0.660 5
Engel’s coefficient for rural households0.552 10
Table 6. Gray correlation ranking of factors influencing the green development of Chengdu’s agriculture in the park city.
Factors of Agricultural Green Development Influencing Park CityGray Correlation DegreeSort
Resource Saving
0.719
Cropland replanting coefficient0.716 8
Total power of agricultural machinery per unit sown area0.723 6
Percentage of effective irrigated area0.719 7
Ecological Conservation
0.736
Intensity of pesticide usage0.767 3
Intensity of fertilizer use0.765 4
Intensity of agricultural plastic film use0.775 2
Forest coverage rate0.639 11
Efficient Development
0.594
Level of contribution of the agricultural economy0.466 13
The per unit area yield of grain0.642 10
Total agricultural output per sown area0.595 12
Agricultural labor productivity0.675 9
Green Life
0.761
Per capita disposable income of rural residents0.743 5
Engel’s coefficient for rural households0.780 1
Table 7. Global Moran’s I for prefecture-level cities of Sichuan from 2011 to 2022.
YearsMoran’s IZP
20110.0560.828 0.204
20120.128 *1.314 0.095
20130.146 *1.564 0.059
20140.146 *1.483 0.069
20150.157 *1.630 0.052
20160.110 *1.325 0.093
20170.122 *1.396 0.081
20180.0961.208 0.114
20190.264 ***2.622 0.004
20200.356 ***3.211 0.001
20210.369 ***3.211 0.001
20220.379 ***3.434 0.000
Note: * and *** denote significance at the 10% and 1% levels.
Disclaimer/Publisher’s Note: The statements, opinions and data contained in all publications are solely those of the individual author(s) and contributor(s) and not of MDPI and/or the editor(s). MDPI and/or the editor(s) disclaim responsibility for any injury to people or property resulting from any ideas, methods, instructions or products referred to in the content.

