1. Introduction
Maize, as one of the world’s most important cereal crops, plays a vital role in ensuring global food security, providing livestock feed, and serving as a key source of bioenergy materials. Its high yield potential and genetic diversity have made maize a cornerstone of modern agricultural production [
1]. However, traditional phenotypic measurement approaches rely heavily on manual operations, resulting in limited trait types, low efficiency, and insufficient accuracy for large-scale and systematic phenotyping. These limitations increasingly restrict the needs of modern breeding and quantitative plant research. Therefore, the development of efficient and automated techniques for phenotypic trait extraction is of great significance for advancing maize genetic improvement and promoting crop science research.
To address these issues, early studies attempted to automate phenotypic trait extraction using two-dimensional (2D) imaging technologies [
2,
3,
4,
5,
6]. Representative works include the C-V model and Sobel-based leaf segmentation pipeline proposed by Wang et al., which integrates background removal, contour extraction, and segmentation fusion to improve edge delineation [
7]. Yang et al. employed HSV color space analysis and connected component labeling to isolate leaf regions and enable morphological and textural feature extraction [
8]. Sandesh et al. developed an Eff-Unet++ architecture using EfficientNet-B4 as the encoder for leaf segmentation and counting [
9], while Hou et al. introduced a fully automated segmentation approach using graph-cut with Otsu thresholding and color statistics [
10].
Although these 2D methods are computationally efficient and easy to deploy, they inherently lack depth cues and cannot describe the three-dimensional (3D) structure, making them inadequate for scenarios involving severe occlusion, leaf adhesion, or accurate geometric measurements. This motivates a transition from 2D imaging to 3D structural modeling.
With the rapid advancement of modern 3D acquisition technologies, including LiDAR [
11,
12,
13,
14], laser scanning [
15], and depth cameras [
16], plant phenotyping research increasingly adopts 3D reconstruction techniques. Structure from Motion (SfM) and Multi-View Stereo (MVS) methods [
17,
18] have further facilitated convenient generation of dense point cloud datasets. Based on such data, Xiang et al. proposed a 3D skeletonization technique using plant structural heuristics to separate overlapping tillers and extract leaf-level parameters from reconstructed skeletons and point clouds [
19]. Wang et al. extended PointNet with K-Nearest Neighbor (KNN) modules to combine global and local cues for semantic plant segmentation [
20]. Turgut et al. developed RoseSegNet, a Transformer-based encoder–decoder network with dual attention modules for contextual encoding and feature propagation [
21]. These studies demonstrate clear advantages of 3D data in capturing plant architecture and alleviating ambiguities inherent to 2D imaging. However, they still rely on assumptions such as geometric separability or stable local structure, which are easily violated under natural maize growth conditions.
Despite the progress above, robust 3D point cloud segmentation of maize in real field environments remains a major challenge. Natural growth leads to dense leaf clustering, large leaves wrapping smaller ones, inconsistent spacing, and severe self-occlusion. Moreover, physical boundaries between organs often become blurred, and point densities vary significantly with acquisition angle. Existing 3D segmentation models frequently assume clean geometry, clear structural priors, or mild occlusion, resulting in decreased robustness and incomplete organ separation when applied to complex, real-world maize structures. Thus, the key problem, how to accurately segment maize stems and leaves under strong occlusion, adhesion, and heterogeneous point densities, has not been fully solved by current 2D or 3D approaches.
To address these limitations, this study aims to develop an automatic method for segmenting maize organs under complex occlusion and overlap conditions, using a hybrid PSCSO architecture based on PointNet++ and SCConv, featuring targeted improvements in its convolutional and optimization modules. SCConv is used to enhance local geometric feature representation in densely overlapping regions, while the Sophia optimizer improves training stability on irregular point clouds. Through the integrated improvements achieved by combining these two components, the model provides more reliable segmentation of single maize plant structures under challenging conditions and supports organ level trait extraction across different growth stages, offering a dependable foundation for high-throughput phenotyping and 3D morphological analysis.
2. Materials and Methods
2.1. Data Acquisition and Preprocessing
2.1.1. Image Data Acquisition and Preprocessing
The field experiments were conducted from April to May 2024 at Shanxi Agricultural University, using two maize cultivars: Tianyu 108 and Qiangsheng 370. A total of 20 maize plants were grown, and to ensure uniform environmental conditions, all seedlings were transplanted at the early growth stage and cultivated in pots of identical dimensions (top diameter 24 cm, height 26 cm).
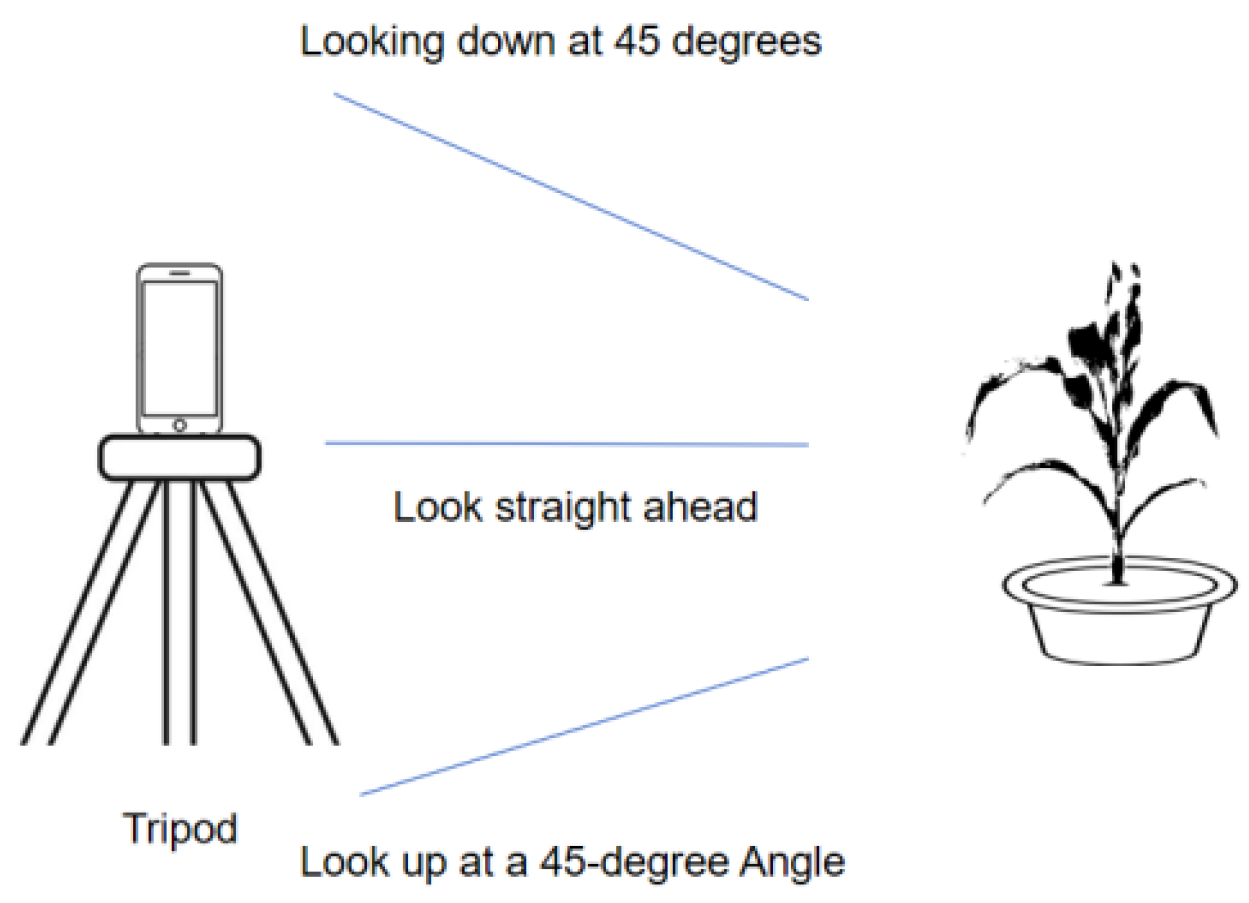
To acquire high quality multi-view RGB images, a vivo S17 Pro smartphone (VIVO, Taiyuan City, Shanxi Province, China) was used as the imaging device and mounted on a tripod to maintain capture stability. Image acquisition was performed around each individual plant at three primary viewpoints: horizontal, 45° overhead, and 45° upward. For each viewpoint, 40 to 50 images were collected, and an additional 5 to 10 top-view images were taken to better capture the structure of the upper leaves. In total, approximately 140 images were obtained for each plant to provide sufficient viewpoint coverage for subsequent three-dimensional reconstruction, as illustrated in
Figure 1.
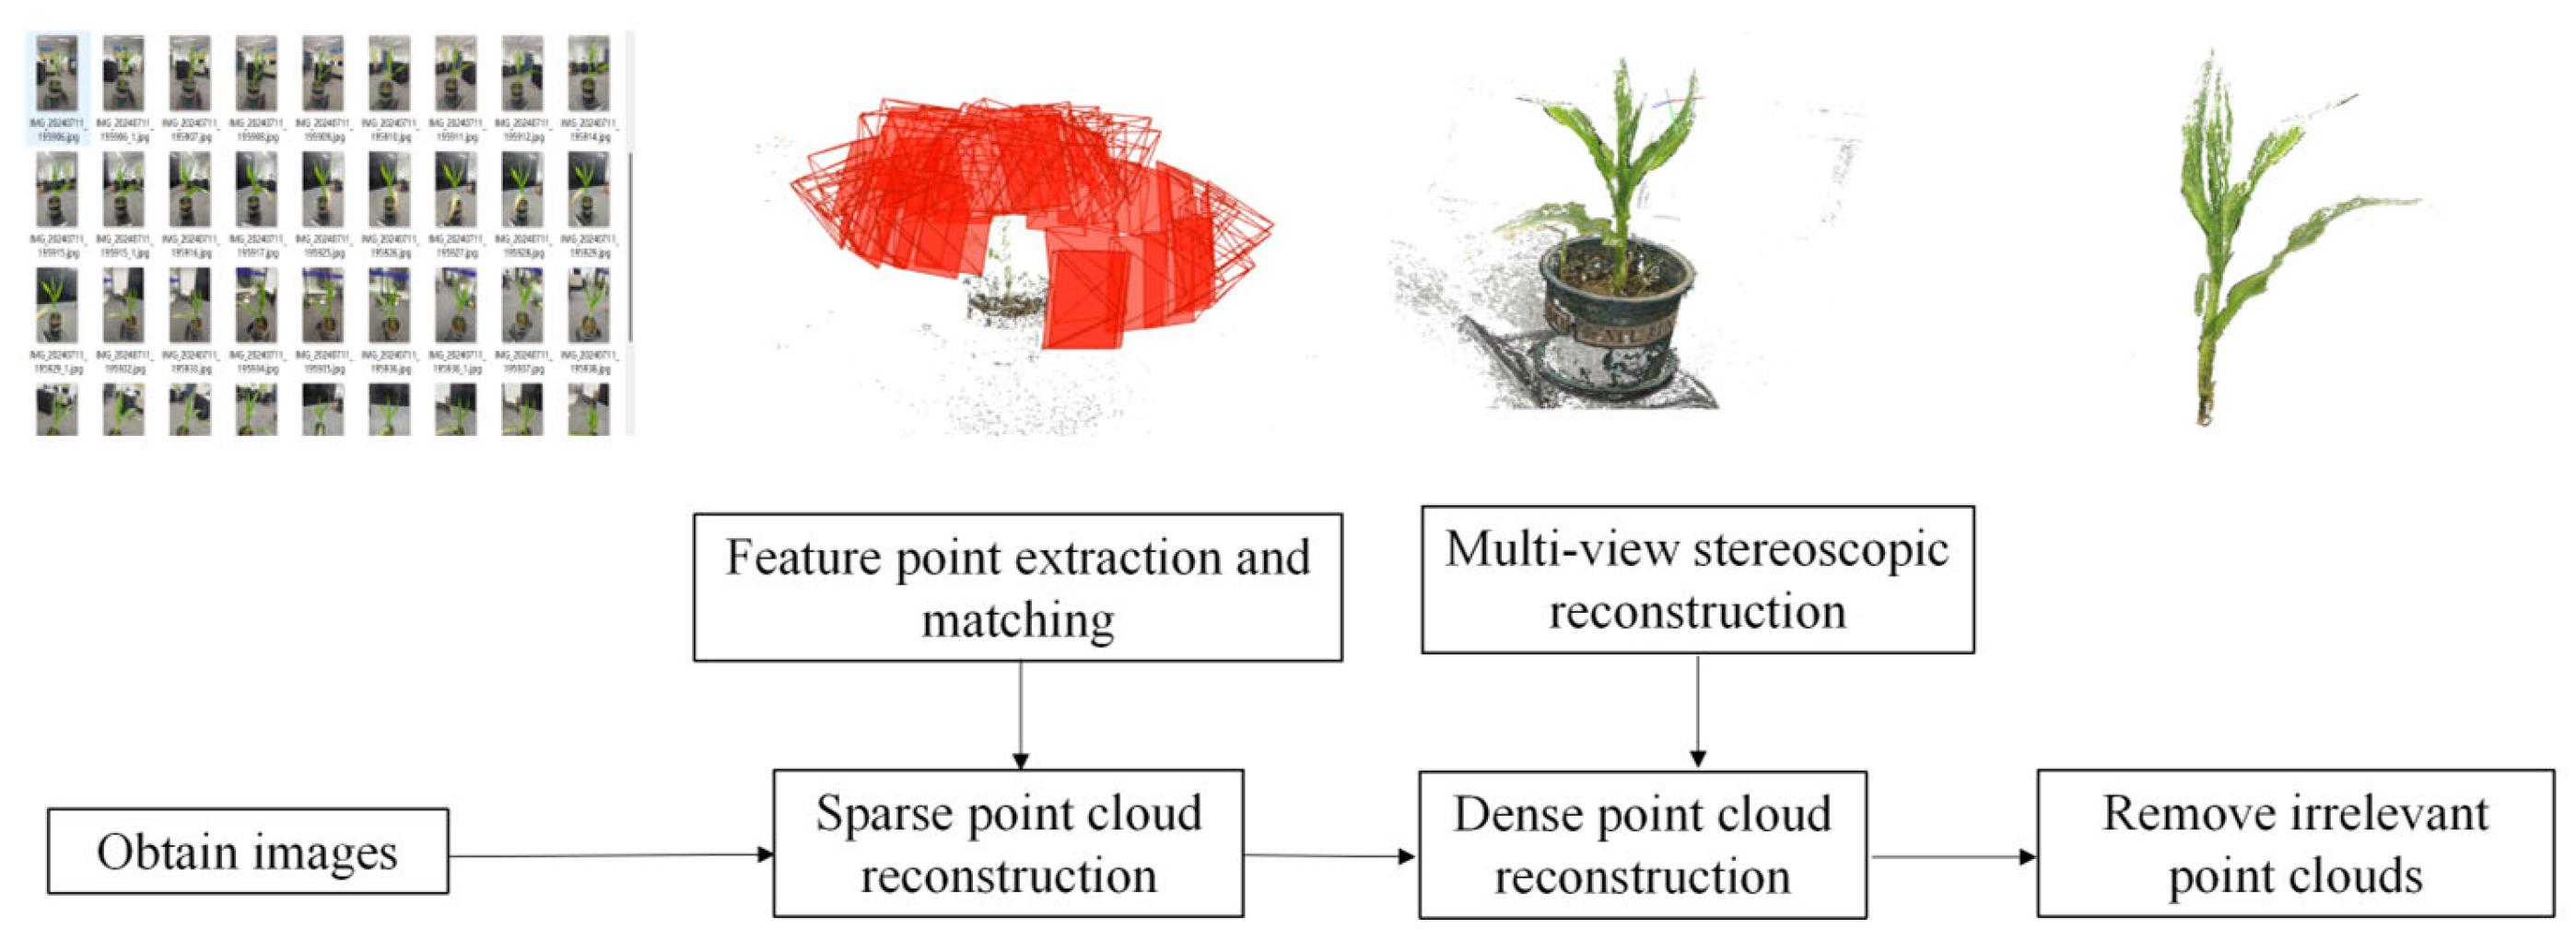
After obtaining a sufficient number of 2D images, the 3D reconstruction process of maize plants was carried out using COLMAP (parameters from EXIF, block_size = 50, num_threads = 10, octave_resolution = 3, version 3.6), a photogrammetric software. The SfM algorithm [
22] was first applied to process the 2D images, recovering a sparse point cloud representation of the scene along with the corresponding camera poses of each input image. Subsequently, the resulting sparse point cloud and camera pose estimations were used as inputs to MVS [
23], which further computed and reconstructed a dense point cloud representation of the maize plant. The overall 3D reconstruction pipeline is illustrated in
Figure 2.
2.1.2. Point Cloud Data Acquisition and Preprocessing
In this study, a Femto Bolt depth camera was employed to acquire 3D point cloud data of maize plants, with the core computational parameters of the device summarized in
Table 1. During data acquisition, the camera’s field of view (FOV) was set to 120°, and multi-angle point clouds were captured using a motorized gimbal, with one viewpoint collected every 120°, resulting in three complementary perspectives. Subsequently, the multi-view point clouds were registered using the Iterative Closest Point (ICP) (iterations = 20, EMS difference = 1.0 × 10
−5) algorithm [
24,
25] to achieve spatial coordinate alignment and ensure geometric consistency across views.
To further enhance data quality, the registered point clouds were manually preprocessed using the CloudCompare (version 2.11.3) 3D point cloud processing software. Non-plant structures such as pots, ground noise, and background artifacts were systematically removed, ensuring the completeness and uniformity of the point cloud data utilized for subsequent analyses. As a result, a comprehensive and high-fidelity 3D maize plant point-cloud dataset was successfully constructed. The entire data acquisition workflow is illustrated in
Figure 3.
2.2. Dataset Construction
A total of 100 point cloud samples were generated from the multi-view image data, and an additional 320 point cloud samples were obtained using a depth camera. In total, 420 maize point cloud datasets were collected. All point cloud data were annotated using the Label3DMaize software package, which integrates clustering algorithms with maize structure aware interactive functionalities. This tool enables effective differentiation between stems and leaves during the annotation process, thereby ensuring accurate structural labeling.
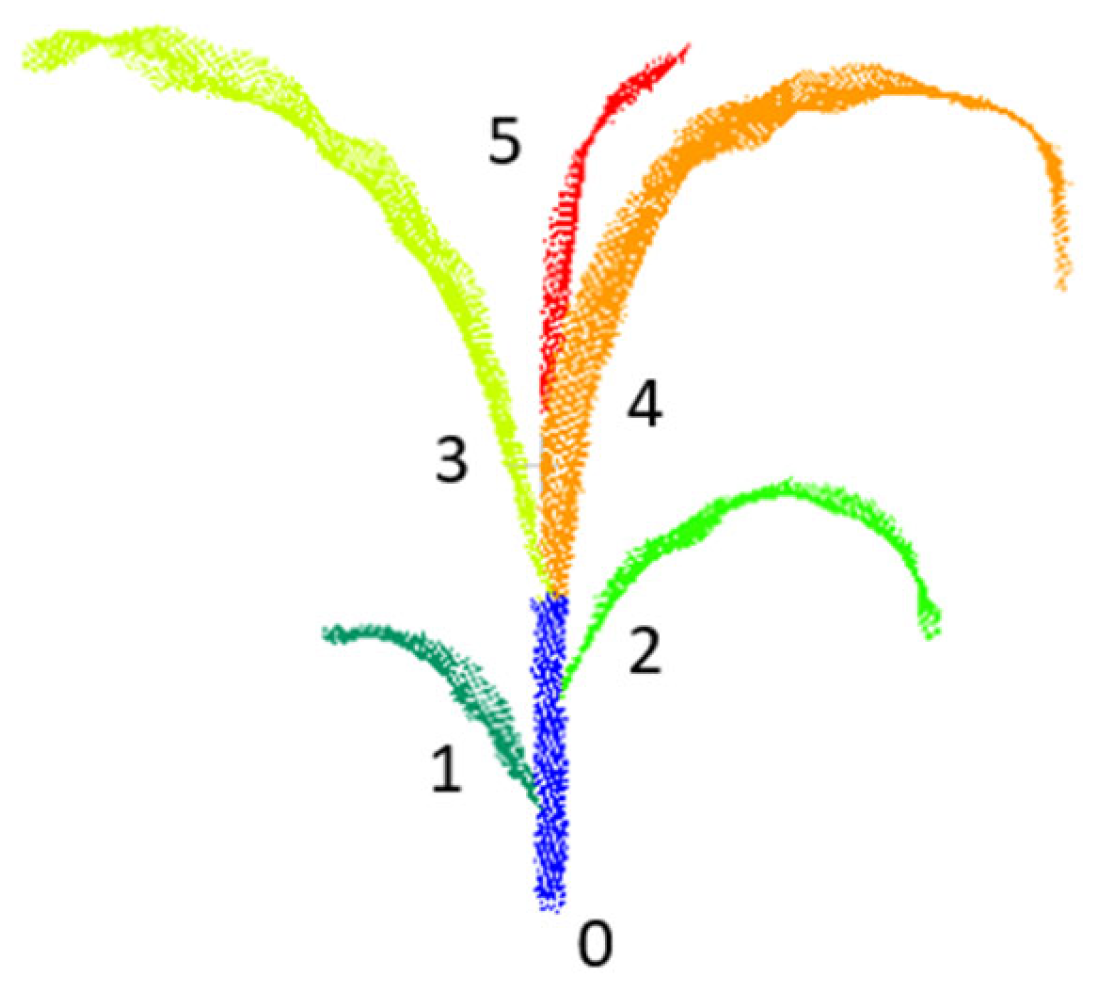
For subsequent segmentation tasks, distinct label values were assigned to the stem and each individual leaf. Specifically, the stem was assigned a label value of 0, while the maize leaves were labeled sequentially from bottom to top, starting from 1 and incrementing upward. The detailed labeling scheme and visual annotation results are illustrated in
Figure 4.
2.3. PSCSO Model
Deep learning provides crucial support for maize phenotypic analysis, and PointNet++, with its rapid segmentation speed and enhanced accuracy, demonstrates remarkable advantages compared to similar algorithms. However, it still suffers from limitations such as weak local detail capture and insufficient robustness to data variability. The algorithm developed and investigated in this study is an improved and optimized version based on the PointNet++ framework, aiming to further enhance the accuracy of maize plant point cloud segmentation and to better accommodate the complex and diverse requirements of specific application scenarios.
2.3.1. PointNet++ Segmentation Network Structure
PointNet++ is a deep learning network specifically designed for processing 3D point cloud data, and it is widely applied to tasks such as point cloud classification and segmentation [
26]. Building upon the original PointNet segmentation framework, PointNet++ introduces a hierarchical processing strategy that leverages local structural information of point clouds to effectively manage complex geometric patterns. Inspired by the architecture of Convolutional Neural Networks (CNN), PointNet++ partitions point clouds into multiple subsets to progressively extract both local and global features [
27,
28]. Each layer captures information from local regions and aggregates it globally, while multi-scale sampling strategies are employed within the hierarchical operations. This design enables the network to capture geometric information at different spatial scales, thereby improving its robustness in handling point clouds with varying densities and resolutions.
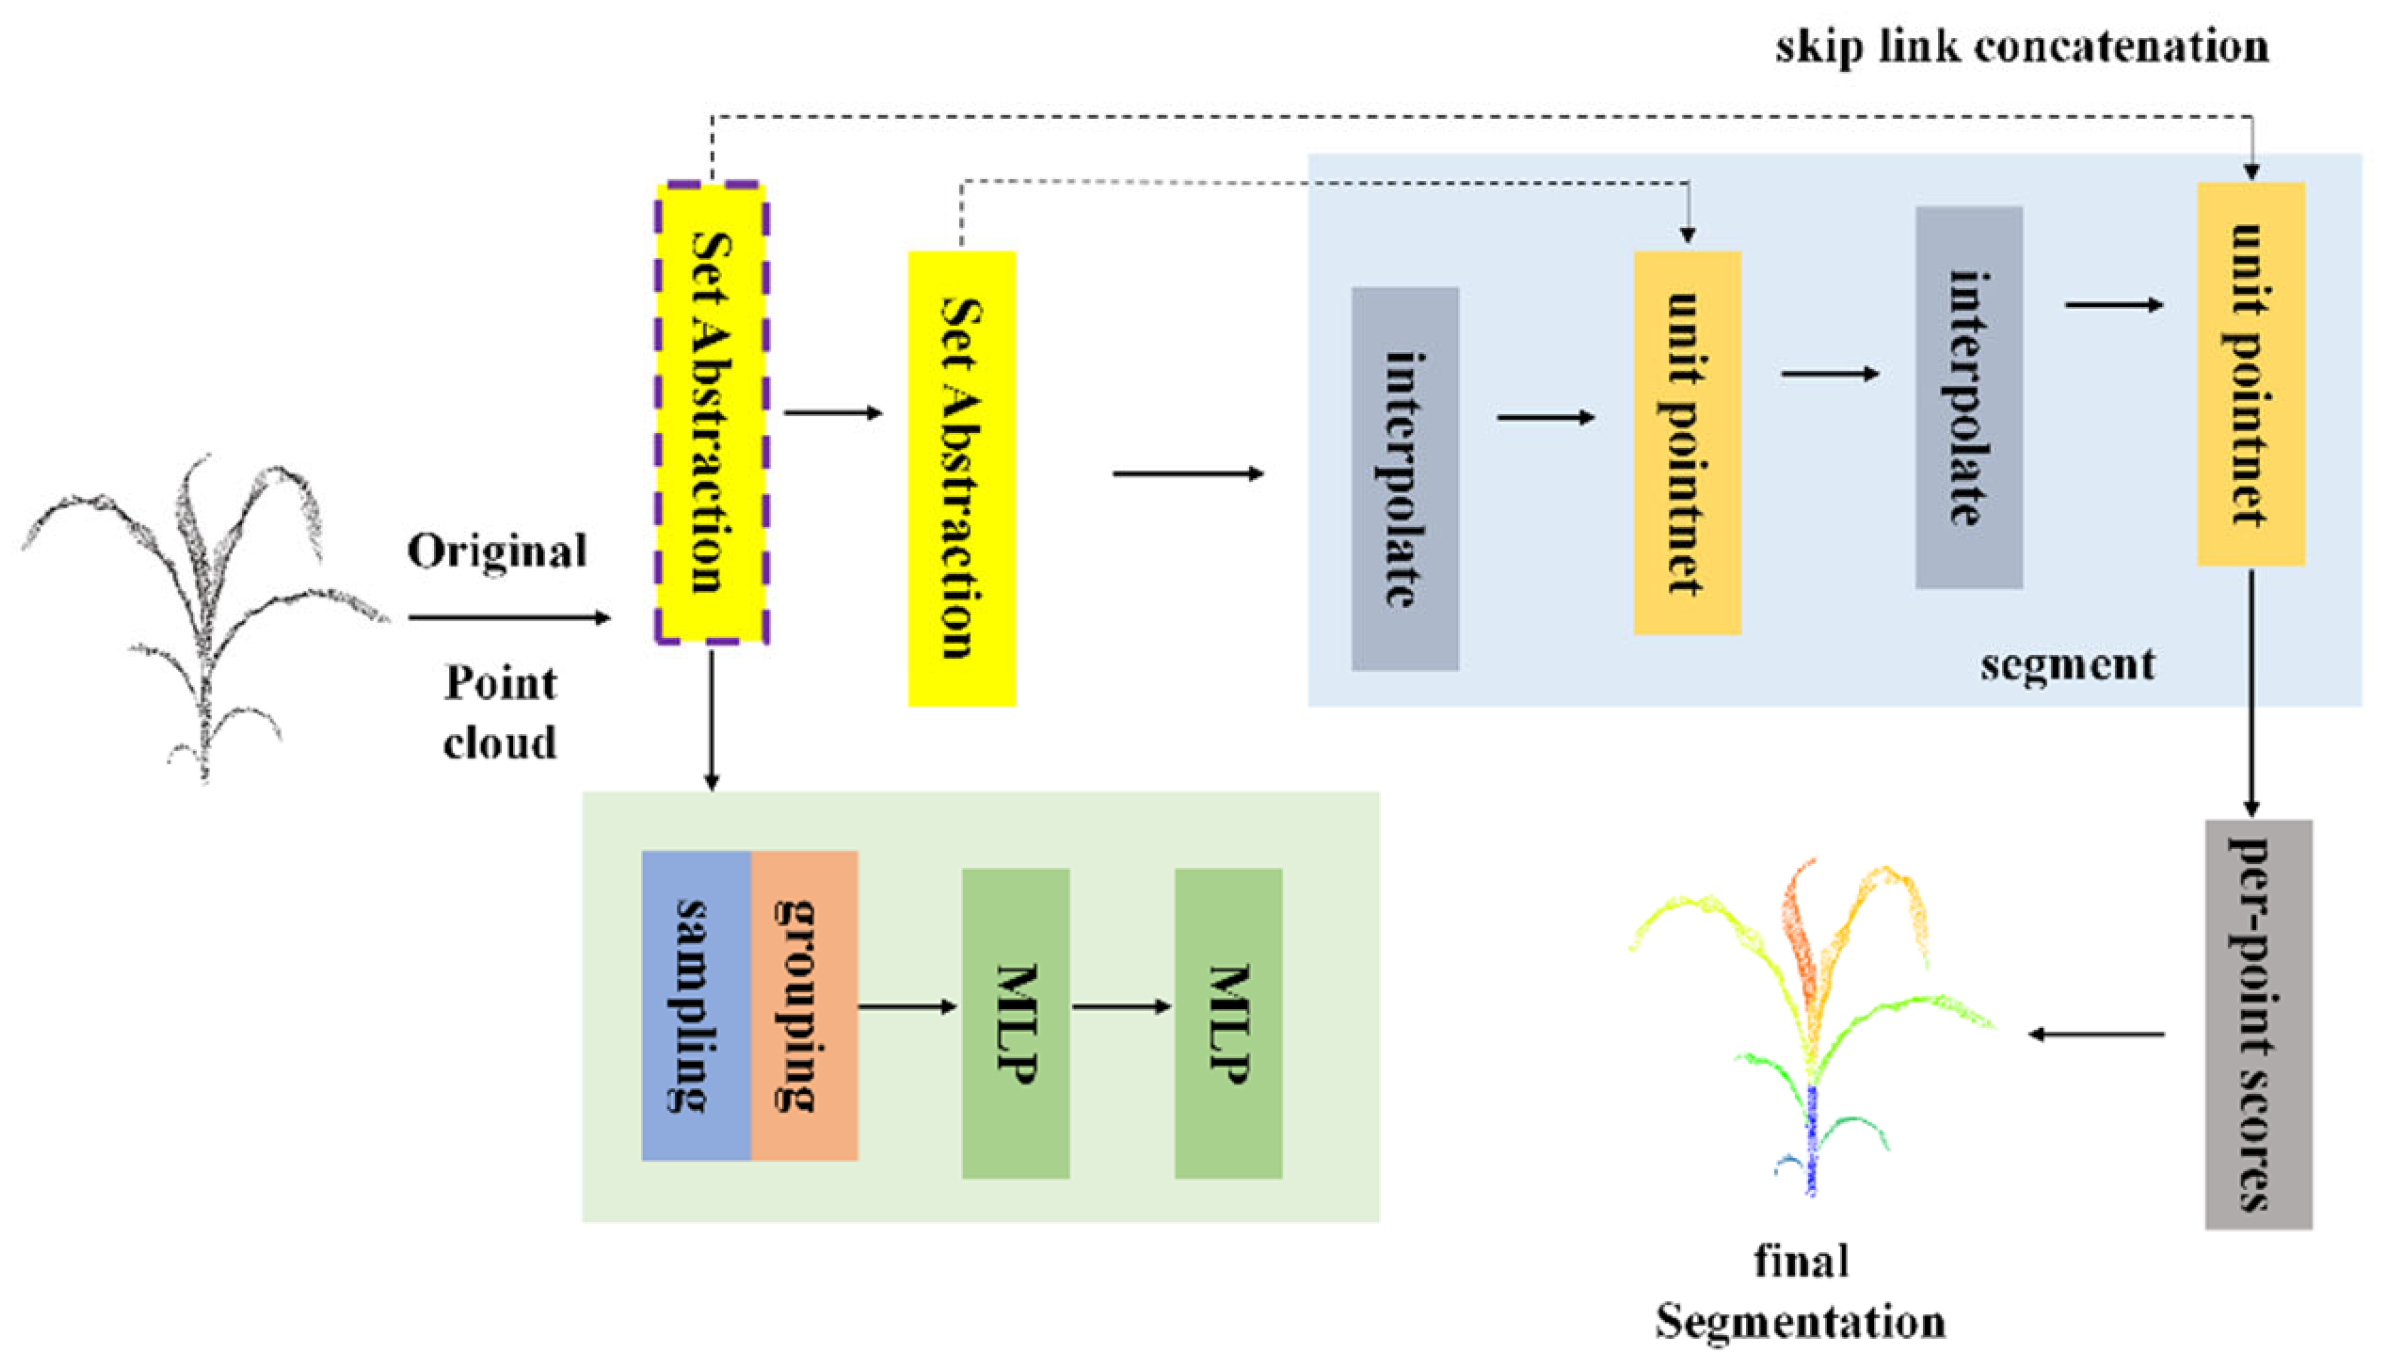
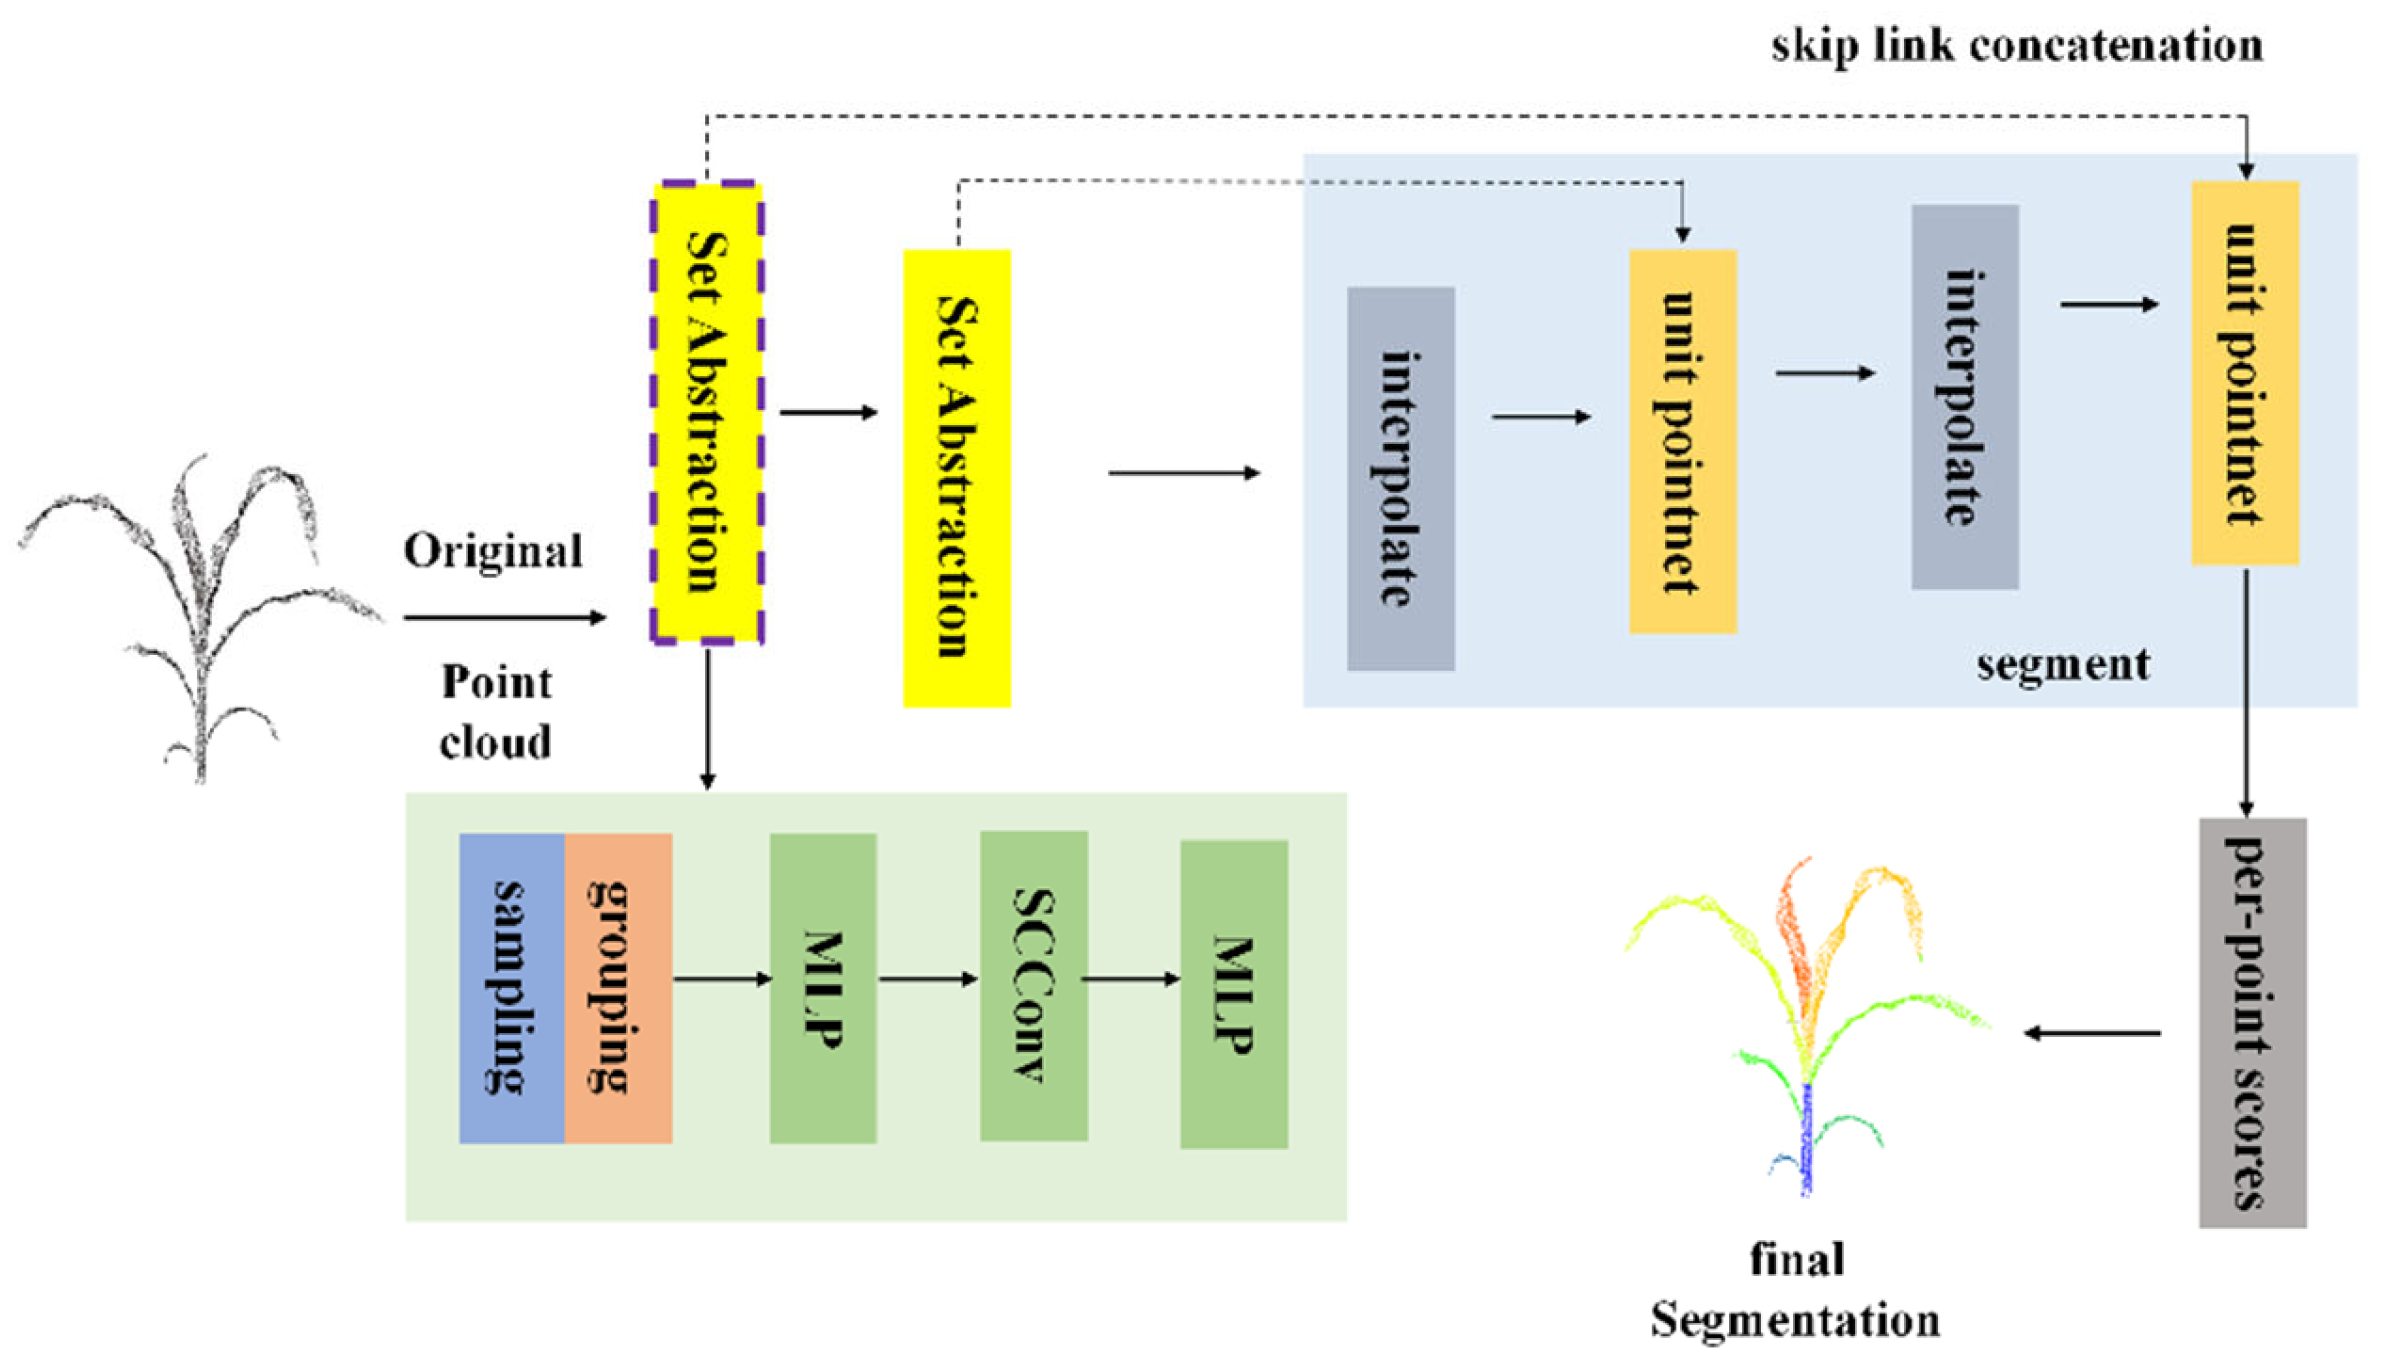
As illustrated in
Figure 5, the PointNet++ architecture centers on hierarchical point cloud processing, performing multi-stage feature extraction and refinement on the raw input data. Initially, after the raw point cloud is input, it passes through the Set Abstraction (SA) module. This module first applies the Farthest Point Sampling (FPS) algorithm to select a subset of representative center points from the original point cloud, followed by a grouping operation that divides neighboring points around each center into local regions. Subsequently, a Multi-Layer Perceptron (MLP) is employed to extract and encode features within each local region, transforming the geometric and semantic attributes of the local point cloud into feature vectors. This completes the first stage of feature abstraction, during which the number of points is reduced, but the feature representation capacity is enhanced.
The subsequent layers perform similar Set Abstraction operations. At each stage, additional sampling, grouping, and feature extraction steps are conducted to derive more abstract and globally representative features from the previously obtained feature points. Through this hierarchical progression, feature representations evolve from local to global, continuously enriching the network’s understanding of the overall point cloud scene. Meanwhile, to compensate for detail loss induced by hierarchical downsampling, the network integrates upsampling pathways and skip-link concatenation mechanisms. The upsampling operation restores a denser point distribution by interpolating higher-level feature points to approximate the lower-level geometric structure, while skip-link concatenation fuses features from multiple Set Abstraction layers, combining high-level global representations with low-level local details, to produce a more informative and structurally consistent feature map.
After multiple rounds of feature extraction, fusion, and upsampling, the network proceeds to the segmentation stage. At this point, mechanisms such as point-wise scoring are applied to determine the category or segmentation label for each individual point, thereby achieving fine-grained segmentation of the input point cloud. The network ultimately outputs detailed and accurate segmentation maps, completing the transformation from raw 3D point cloud data to semantically meaningful, precisely segmented results. This architecture ensures a balanced representation that preserves both comprehensive global context and fine local structural information.
2.3.2. SCConv Convolutional Module
PointNet++ demonstrates certain limitations in stem-leaf segmentation of maize plant point clouds. Its segmentation accuracy decreases in regions with densely overlapping leaves, where severe occlusion often leads to feature confusion. Furthermore, the boundary between maize stems and leaves tends to be indistinct, and the network exhibits limited adaptability to morphological variations across different maize growth stages. Considering the high-precision requirements of maize phenotypic analysis for stem-leaf segmentation, it is essential to enhance the network to overcome these deficiencies, improve segmentation performance under complex environmental conditions, and better meet the practical demands of agricultural research.
SCConv (Spatial and Channel Reconstruction Convolution) is a module designed to enhance the feature representation capability of CNN. Its primary advantage lies in improving the model’s perception of features across multiple spatial scales, and its network architecture is illustrated in
Figure 6 [
29,
30,
31]. The SCConv module exploits spatial and channel redundancy within feature maps to compress CNN, thereby reducing redundant computations and strengthening the network’s capacity to learn contour features from overlapping leaves. The module comprises two key components: the Spatial Reconstruction Unit (SRU) and the Channel Reconstruction Unit (CRU), which operate synergistically to optimize the detection and representation of target features. The SRU reconstructs features by weighting and separating redundant spatial components, effectively suppressing redundancy while enhancing discriminative representation. For an input feature map X, group normalization is first applied to evaluate the information content of each feature, and the corresponding computational expression is provided in Equation (1).
In the formula, represents the output feature map after normalization and subsequent operations. GN denotes group normalization, where the scaling factor and the offset factor are learnable parameters that can be updated during training. The symbol denotes the mean, represents the standard deviation, and is a small constant introduced to ensure numerical stability.
The scaling factor
in the group normalization process is employed to assess the information content of different feature maps, thereby indicating the relative importance of each channel. The corresponding computational expression is provided in Equation (2).
In the formula, denotes the channel for which the weight is being calculated, represents the traversal over all channels used to compute the total sum, and refers to the total number of channels in the current feature map under processing.
The SCConv module processes information from multiple receptive fields through a multi-branch architecture, thereby simultaneously enhancing the extraction of local details and global contextual information. In the maize point cloud stem-leaf segmentation task, stems typically exhibit upright, thick, and locally smooth geometric structures, whereas leaves are generally broad, flat, and morphologically complex, extending irregularly in 3D space. Owing to the substantial differences in size, shape, and spatial distribution between these two components, effectively capturing multi-scale features becomes essential for achieving high segmentation accuracy. SCConv addresses this challenge by dividing the input feature maps into multiple branches, each responsible for extracting features under different receptive fields. This design allows the model to capture fine-grained local features, such as leaf edges and contours, while simultaneously maintaining awareness of global structural patterns, such as the overall stem morphology.
In the traditional PointNet++ network, the MLP layers adopt a shared weight strategy when processing local point cloud features. This approach overlooks the spatial dependencies among neighboring points, which can lead to the loss of local geometric information and the presence of redundant feature representations. To address this limitation, the SCConv module is integrated after the MLP layers (as illustrated in
Figure 7). By leveraging its parallel processing mechanism of spatial and channel convolutions, the model achieves effective aggregation of spatial features from neighboring points while dynamically calibrating channel level information. This integration substantially enhances the network’s sensitivity to local geometric structures, strengthens its feature discrimination capability, and ultimately improves the overall segmentation performance.
2.3.3. Sophia Optimizer
Due to the inherent irregularity, sparsity, and complex 3D geometric structure of maize point cloud data, traditional optimizers such as SGD and Adam often exhibit slow convergence and struggle to effectively capture key features when handling such high dimensional, unstructured data. To overcome these challenges, this study employs the Sophia optimizer for the maize point cloud stem-leaf segmentation task to improve model training efficiency and enhance feature extraction capability.
Sophia is an adaptive optimizer that integrates both first-order and second-order gradient information. Building upon Adam, it introduces a second-order optimization mechanism that achieves a balance between performance and computational efficiency. Its working principle relies on gradient momentum and second-moment estimation of historical squared gradients to dynamically adjust the learning rate across different dimensions. When gradient fluctuations in a given dimension are large, the step size is automatically reduced to stabilize parameter updates; conversely, when gradient changes are relatively smooth, the learning step is adaptively increased to accelerate convergence and maintain stability [
32].
In the maize point cloud segmentation task, the accurate extraction of phenotypic parameters: such as stem height, leaf length, leaf width, and leaf area, depends on the model’s sensitivity to fine-grained geometric details. Sophia not only utilizes first-order gradients but also updates parameters through a diagonal approximation of the Hessian matrix, allowing for more precise capture of local geometric structures and more efficient optimization of update directions. This mechanism enables the model to better distinguish subtle morphological differences between stems and leaves, thereby enhancing feature representation capability and improving segmentation accuracy for complex point cloud data.
2.4. Phenotypic Feature Extraction
2.4.1. Coordinate Correction
The relationship between the collected point cloud data and the spatial coordinate system is inherently random, and directly using the maximum value along the Z-axis would lead to an overestimation of the actual plant height. Therefore, it is essential to align the Z-axis of the point cloud with the true ground normal vector to ensure that morphological parameters, such as plant height, can be accurately measured along the Z-axis.
Given the actual parameters
of the reference object within the target 3D point cloud scene, the Euclidean distance algorithm is employed to compute its corresponding coordinates
in the plant point cloud data. A transformation is then performed to derive the conversion coefficient
, which enables the acquisition of the true spatial coordinates of the target plant point cloud. The conversion relationship is expressed in Equation (3).
To facilitate the subsequent extraction of parameters such as plant height, the ground plane in the point cloud data must be aligned vertically with the Z-axis. First, the normal vector of the ground surface in the target point cloud is obtained, and the rotation angle and corresponding rotation axis are calculated based on its angular deviation from the Z-axis to achieve geometric correction.
After obtaining the rotation angle θ and the rotation axis u, the rotation matrix is constructed. The rotation matrix R is shown in Equation (4).
Each point P (x, y, z) in the point cloud is rotated using Equation (5) to obtain the rotated point
.
2.4.2. Phenotypic Extraction Method
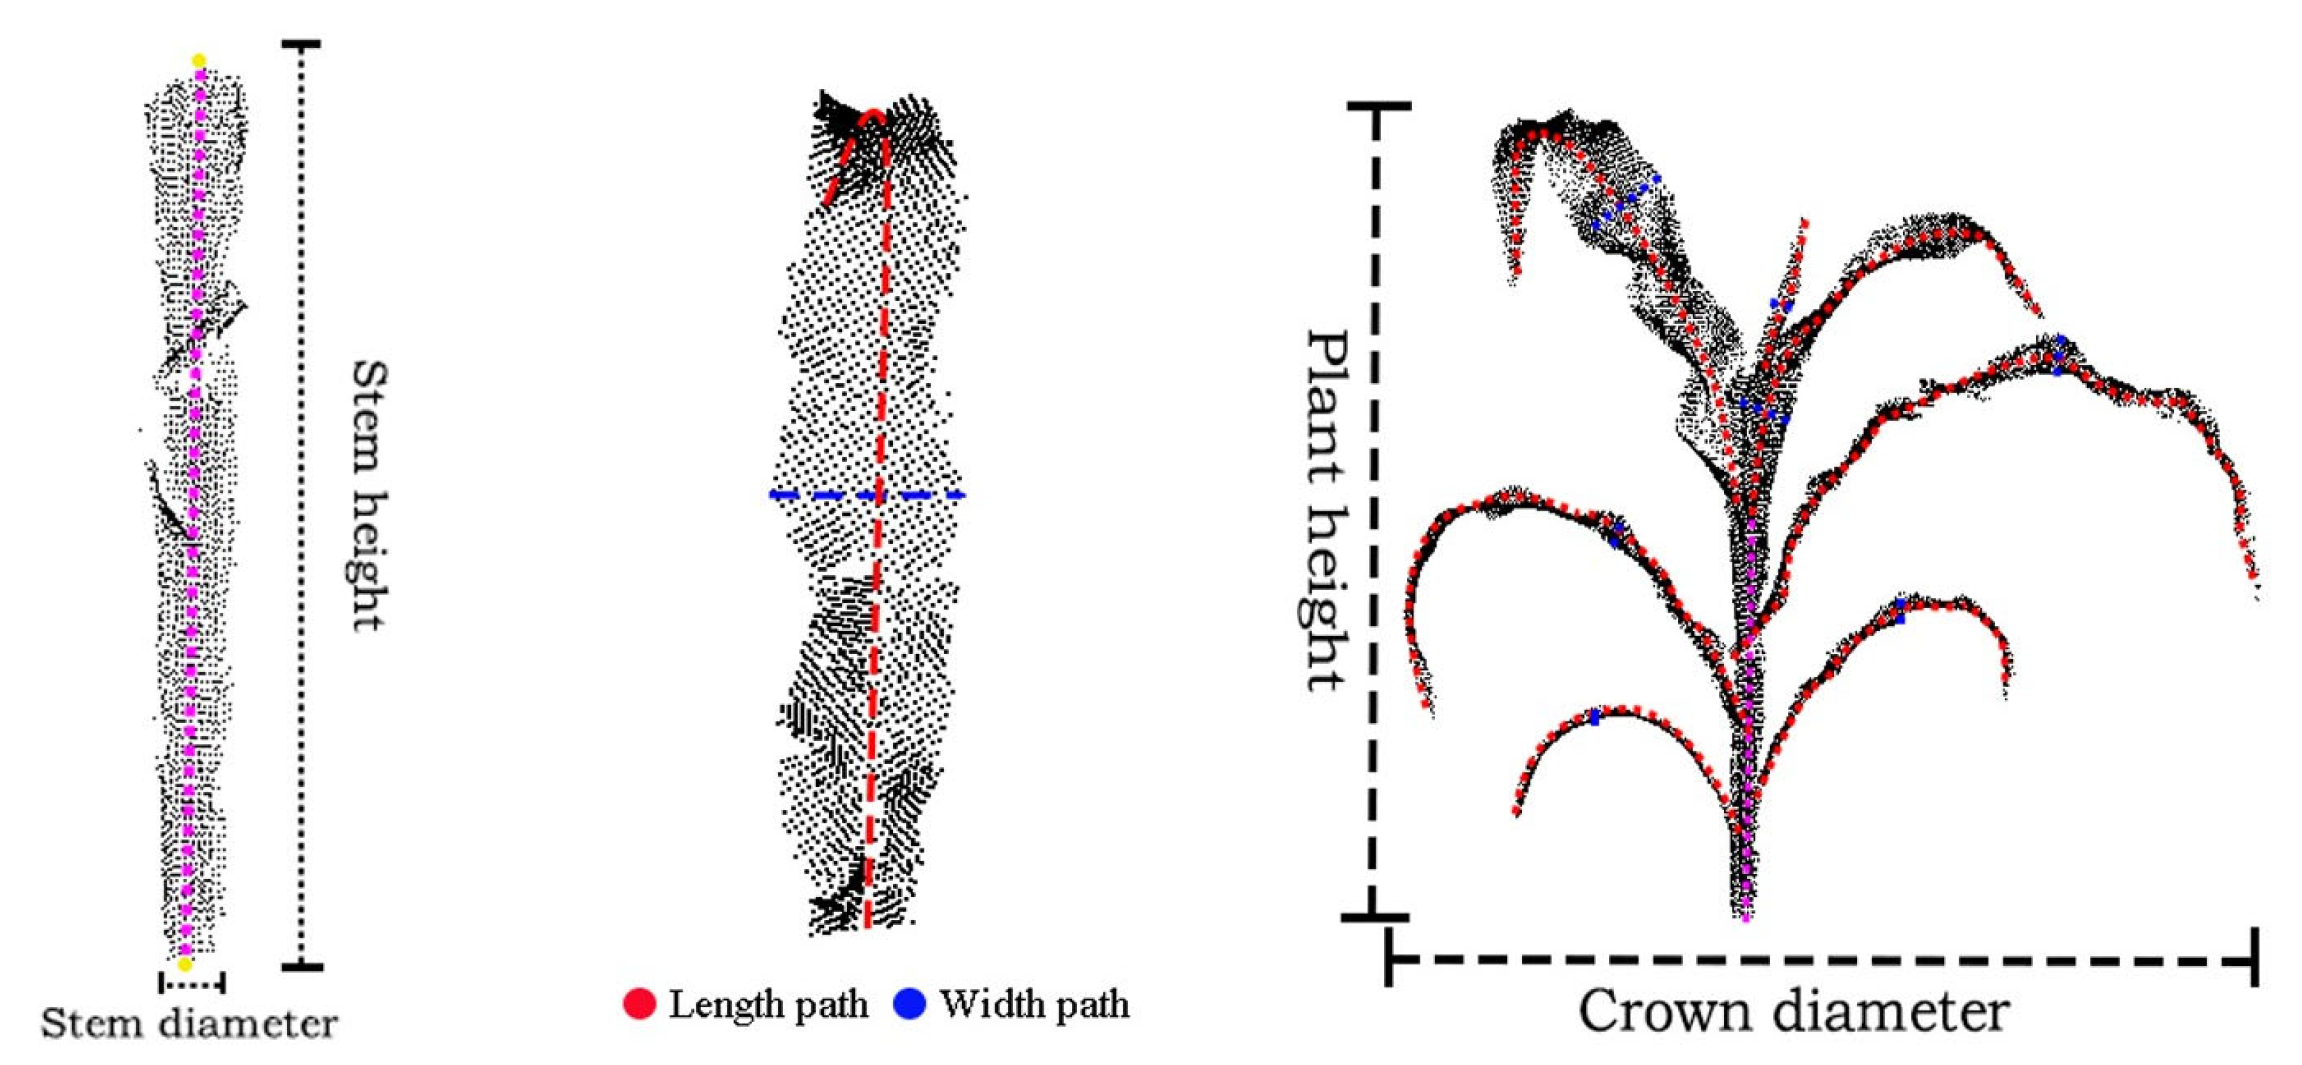
In this study, seven key phenotypic parameters, namely plant height, crown diameter, stem height, stem diameter, leaf length, leaf width and leaf area, were selected for extraction, as they together constitute a multi-dimensional index system for evaluating plant growth and structure. Plant height directly represents the overall vegetative growth vitality, while crown diameter reflects the plant’s space occupation and light competition ability. Stem diameter is a key factor in measuring mechanical support and conduction capacity and predicting lodging resistance, while stem height precisely indicates the elongation of the main stem. As for the leaves, their length and width are the basis for morphological diagnosis, and the estimated leaf area directly quantifies the photosynthetic potential, which is closely related to the final biomass accumulation. Through these parameters, this study aims to decompose the macroscopic three-dimensional structure into quantifiable traits with clear biological functions, providing a solid foundation for high-throughput phenotypic analysis. The phenotypic parameter extraction method is shown in
Figure 8 [
33].
- (1)
Overall, the difference between the maximum and minimum Z-axis values of the point cloud is defined as the plant height, while the difference between the maximum and minimum X-axis values is defined as the crown diameter.
- (2)
At the stem level, the Z coordinate represents the stem height direction (independent variable z) whereas the XY coordinates correspond to the horizontal distribution (dependent variables x). A Linear Regression model is applied to fit the central axis segment of the stem point cloud and to establish linear relationships between Z-X and Z-Y. The corresponding linear regression formula is expressed as shown in Equation (6).
In the formula, represents the intercept of the linear regression equation, indicating the predicted value of y when (x = 0), that is, the starting position of the central axis when (Z = 0). denotes the regression coefficient of the linear regression equation, representing the average change in y for each unit increase in x; it describes the direction or inclination of the central axis and reflects the geometric shape of the stem. represents the error term, which is the random deviation between the observed value and the model’s predicted value.
The regression coefficient is determined using the least squares method to minimize the sum of squared errors. Subsequently, a linear regression instance is implemented in Python using the sklearn library. The Z coordinate (target variable) and the XY coordinates (feature variables) are input into the model to learn their linear relationship. Then, the np.linspace function is employed to generate a linear space from the minimum to the maximum Z-coordinate. For each Z value, the corresponding X and Y coordinates are predicted, and these predicted points are connected to form an approximate representation of the stem’s central axis. The length of this fitted line is taken as the stem height parameter, as illustrated in
Figure 9a.
After obtaining the central axis of the stem, the distance from each stem point to the axis is computed, and twice the median of all these distances is defined as the stem diameter parameter.
- (3)
At the leaf level, the Principal Component Analysis (PCA) method is first applied to calculate the three principal component axes of the leaf point cloud [
34]. The direction corresponding to the largest variance is identified as the first principal component axis, which represents the leaf length direction within the leaf point cloud. The shortest path between the two endpoints of this axis is defined as the leaf length path, and its length is taken as the leaf length parameter, as illustrated in
Figure 9b.
For the leaf width parameter, the leaf point cloud is uniformly divided into 11 segments along the leaf length path (as shown in
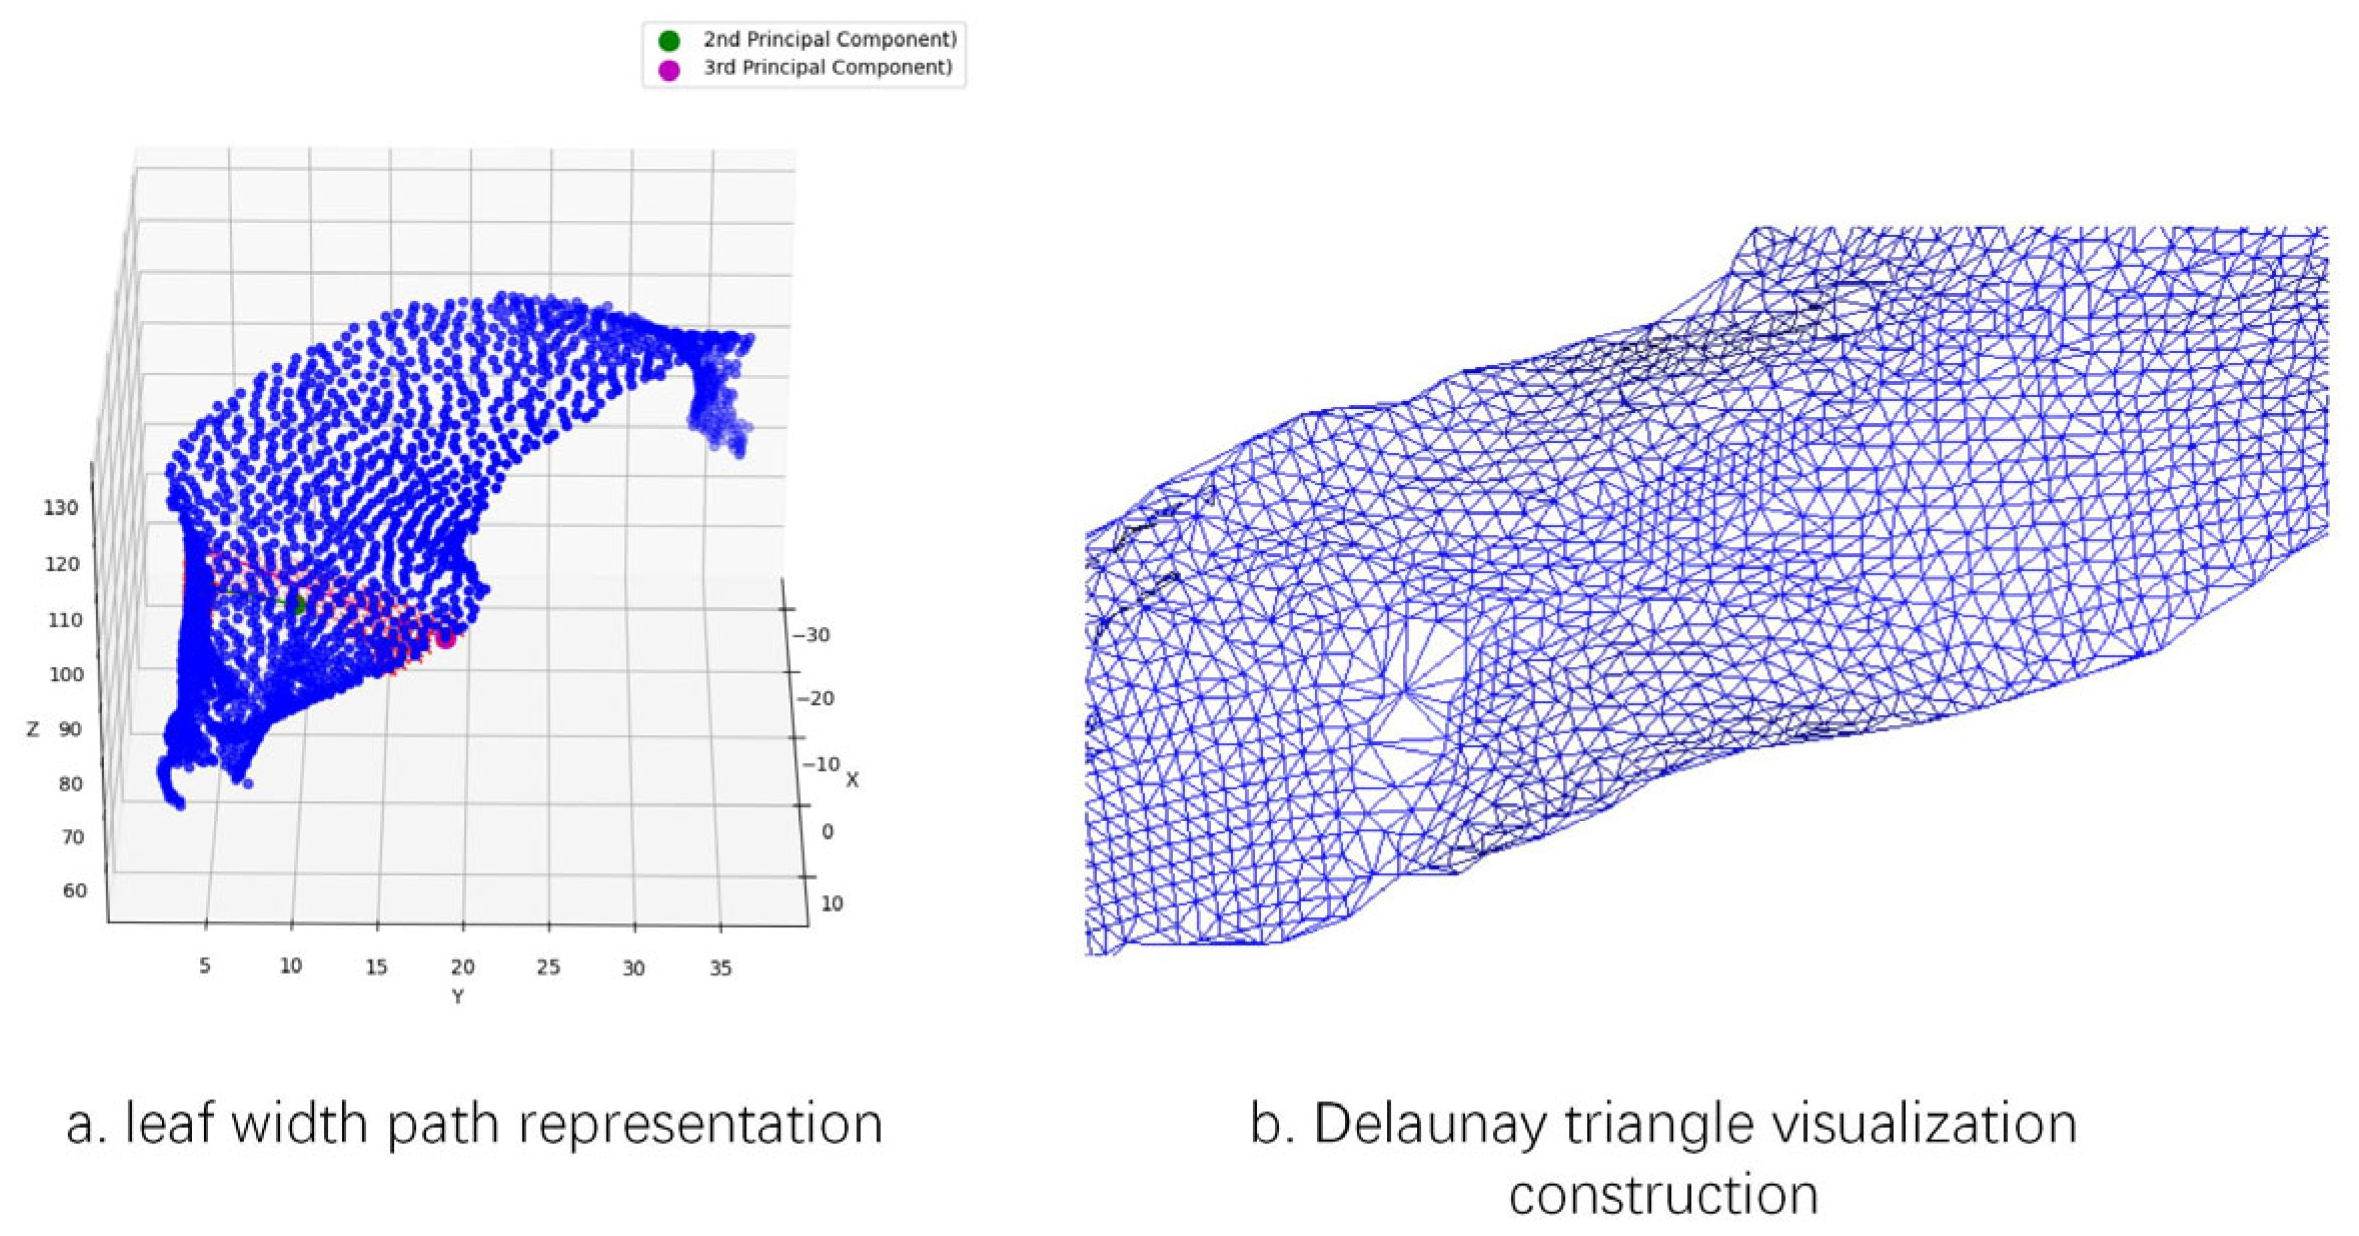
Figure 9c). The central segments typically correspond to the middle region of the leaf; selecting these segments allows the extracted path to better represent the overall width characteristics of the leaf. Within the point cloud of the middle segments, two endpoints are identified along the second principal component axis, and the shortest path between them is extracted as T1. Similarly, two endpoints are located along the third principal component axis, and the shortest path between them is extracted as T2. The longer of the two paths, T1 or T2, is designated as the leaf width path, and its length is defined as the leaf width parameter, as shown in
Figure 10a.
For the leaf area parameter, this study employs the Delaunay triangulation algorithm to perform the extraction. The algorithm partitions the given set of leaf points into non overlapping triangles, ensuring that no other points lie within the circumcircle of any triangle [
35]. First, an initial super triangle enclosing all points is constructed. Then, during point-by-point insertion, the triangles whose circumcircles contain the newly added point are identified and removed, forming a cavity. The new point is subsequently connected to all vertices located on the boundary of this cavity, thereby generating new Delaunay triangles. Finally, triangles associated with the vertices of the initial super triangle are eliminated, resulting in a complete Delaunay triangular mesh composed solely of the original point set. By traversing all triangles and summing their respective areas, as illustrated in
Figure 10b, the leaf area parameter is derived.
2.5. Evaluation Index
In this study, a total of 420 maize plants with varying morphologies and growth stages were selected for the quantitative evaluation of stem leaf segmentation, encompassing representative samples from the V2 to V12 growth stages [
36]. Additionally, 30 maize plants were randomly selected for phenotypic parameter extraction, and the accuracy of the proposed phenotypic extraction method was quantitatively assessed.
Stem leaf segmentation accuracy: The model performance was evaluated using Train Accuracy, Test Accuracy, and Mean Intersection over Union (MIoU) [
37]. Train Accuracy refers to the proportion of correctly predicted samples within the training dataset, while Test Accuracy denotes the proportion of correctly predicted samples within the testing dataset. The corresponding calculation is provided in Equation (7).
In the formula, TP (True Positive) represents the number of samples correctly predicted as positive; TN (True Negative) represents the number of samples correctly predicted as negative; FP (False Positive) represents the number of samples incorrectly predicted as positive; FN (False Negative) represents the number of samples incorrectly predicted as negative.
MIoU calculates the degree of overlap between the predicted region and the actual region of the model, averaging the IoU values across all classes or instances to obtain the MIoU. The calculation is shown in Equation (8).
Phenotypic parameter extraction accuracy: Linear regression analysis was used to evaluate the relationship between the measured phenotypic parameters and the predicted extraction values. Quantitative evaluations were conducted using R
2 (coefficient of determination) and RMSE, and the calculation formulas are shown in Equations (9) and (10) [
38].
In the formula, M2 represents the number of phenotypic data samples, η denotes the index of a phenotypic data sample, qη is the extracted value of the phenotypic parameter, is the mean of the extracted phenotypic parameter values, Qη is the measured value of the parameter, and is the mean of the measured parameter values.
3. Results
All experiments in this study were performed on a Windows 11 operating system, utilizing an NVIDIA GeForce RTX 4060 GPU with CUDA 11.7 for accelerated computation. The deep learning framework employed was PyTorch 1.13.1, configured within a Python 3.8.18 environment. During network training, the batch size was set to 32, the initial learning rate to 0.001, the number of training epochs to 315, and the step size to 20. The segmentation experiment adopted a batch training approach, dividing 420 corn plant point cloud data into a training set, a validation set and a testing set in a ratio of 8:1:1.
3.1. Comparison of Instance Segmentation Results of Maize Point Clouds with Different Improvements
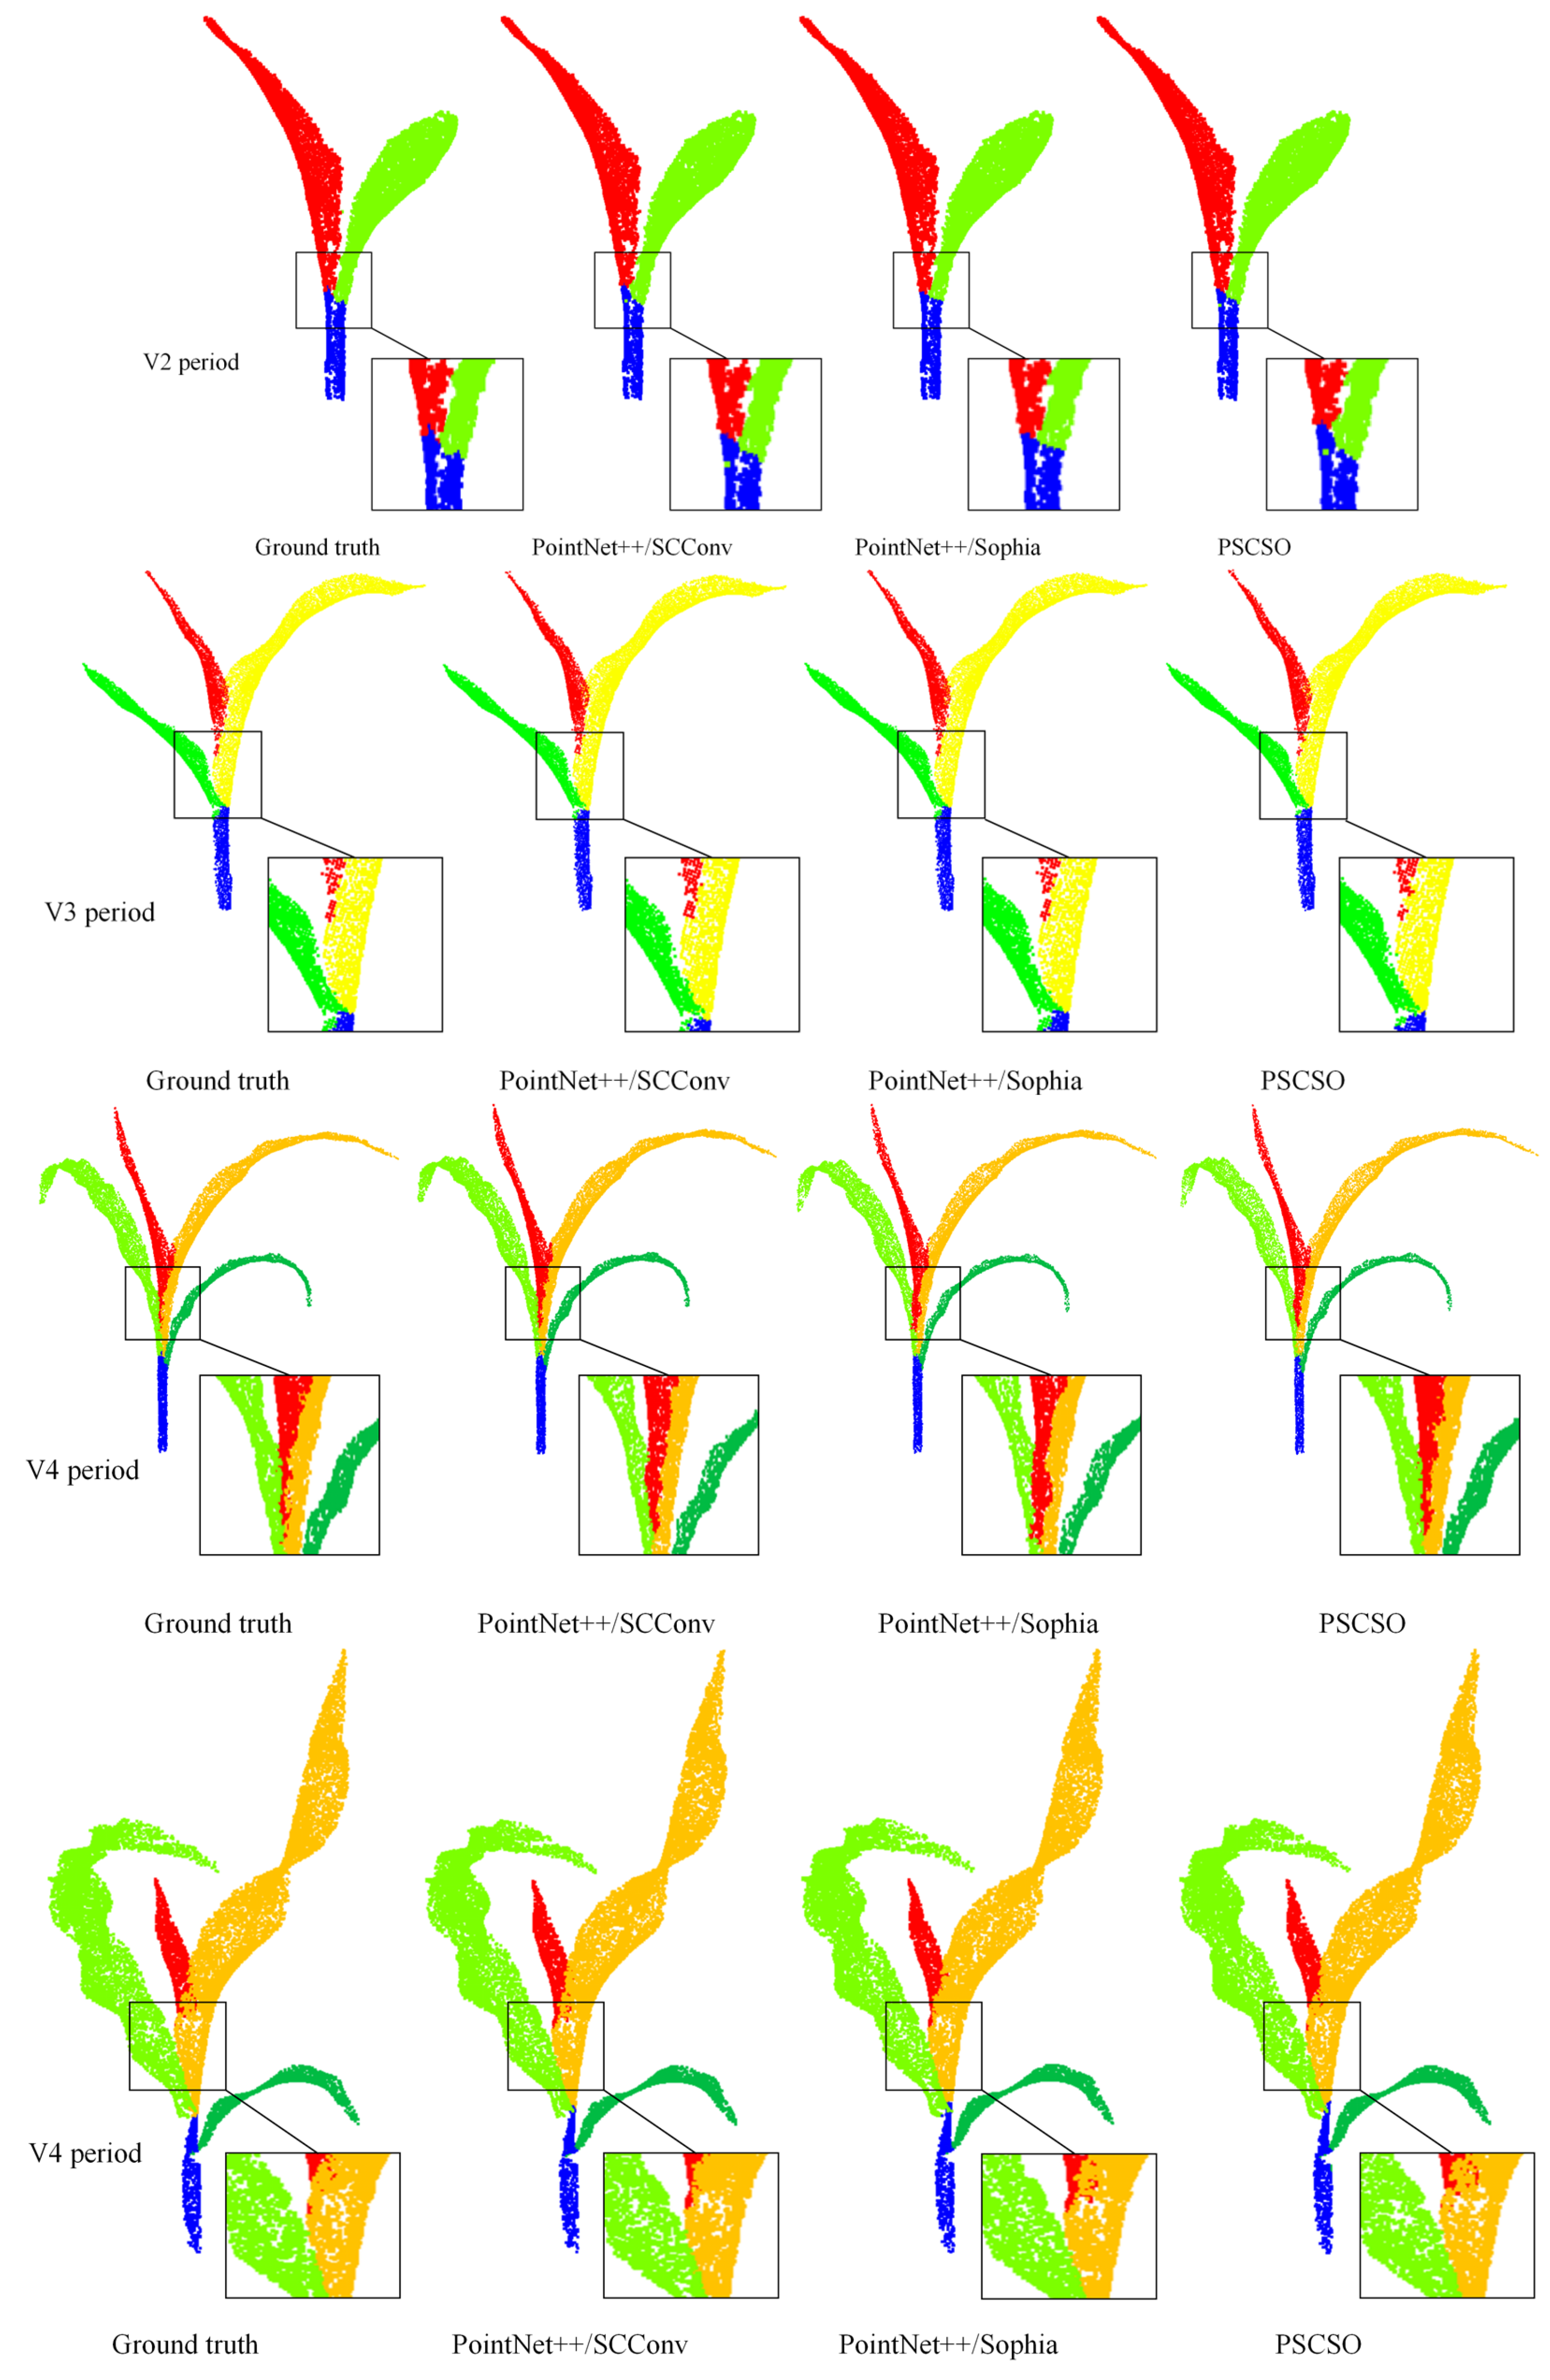
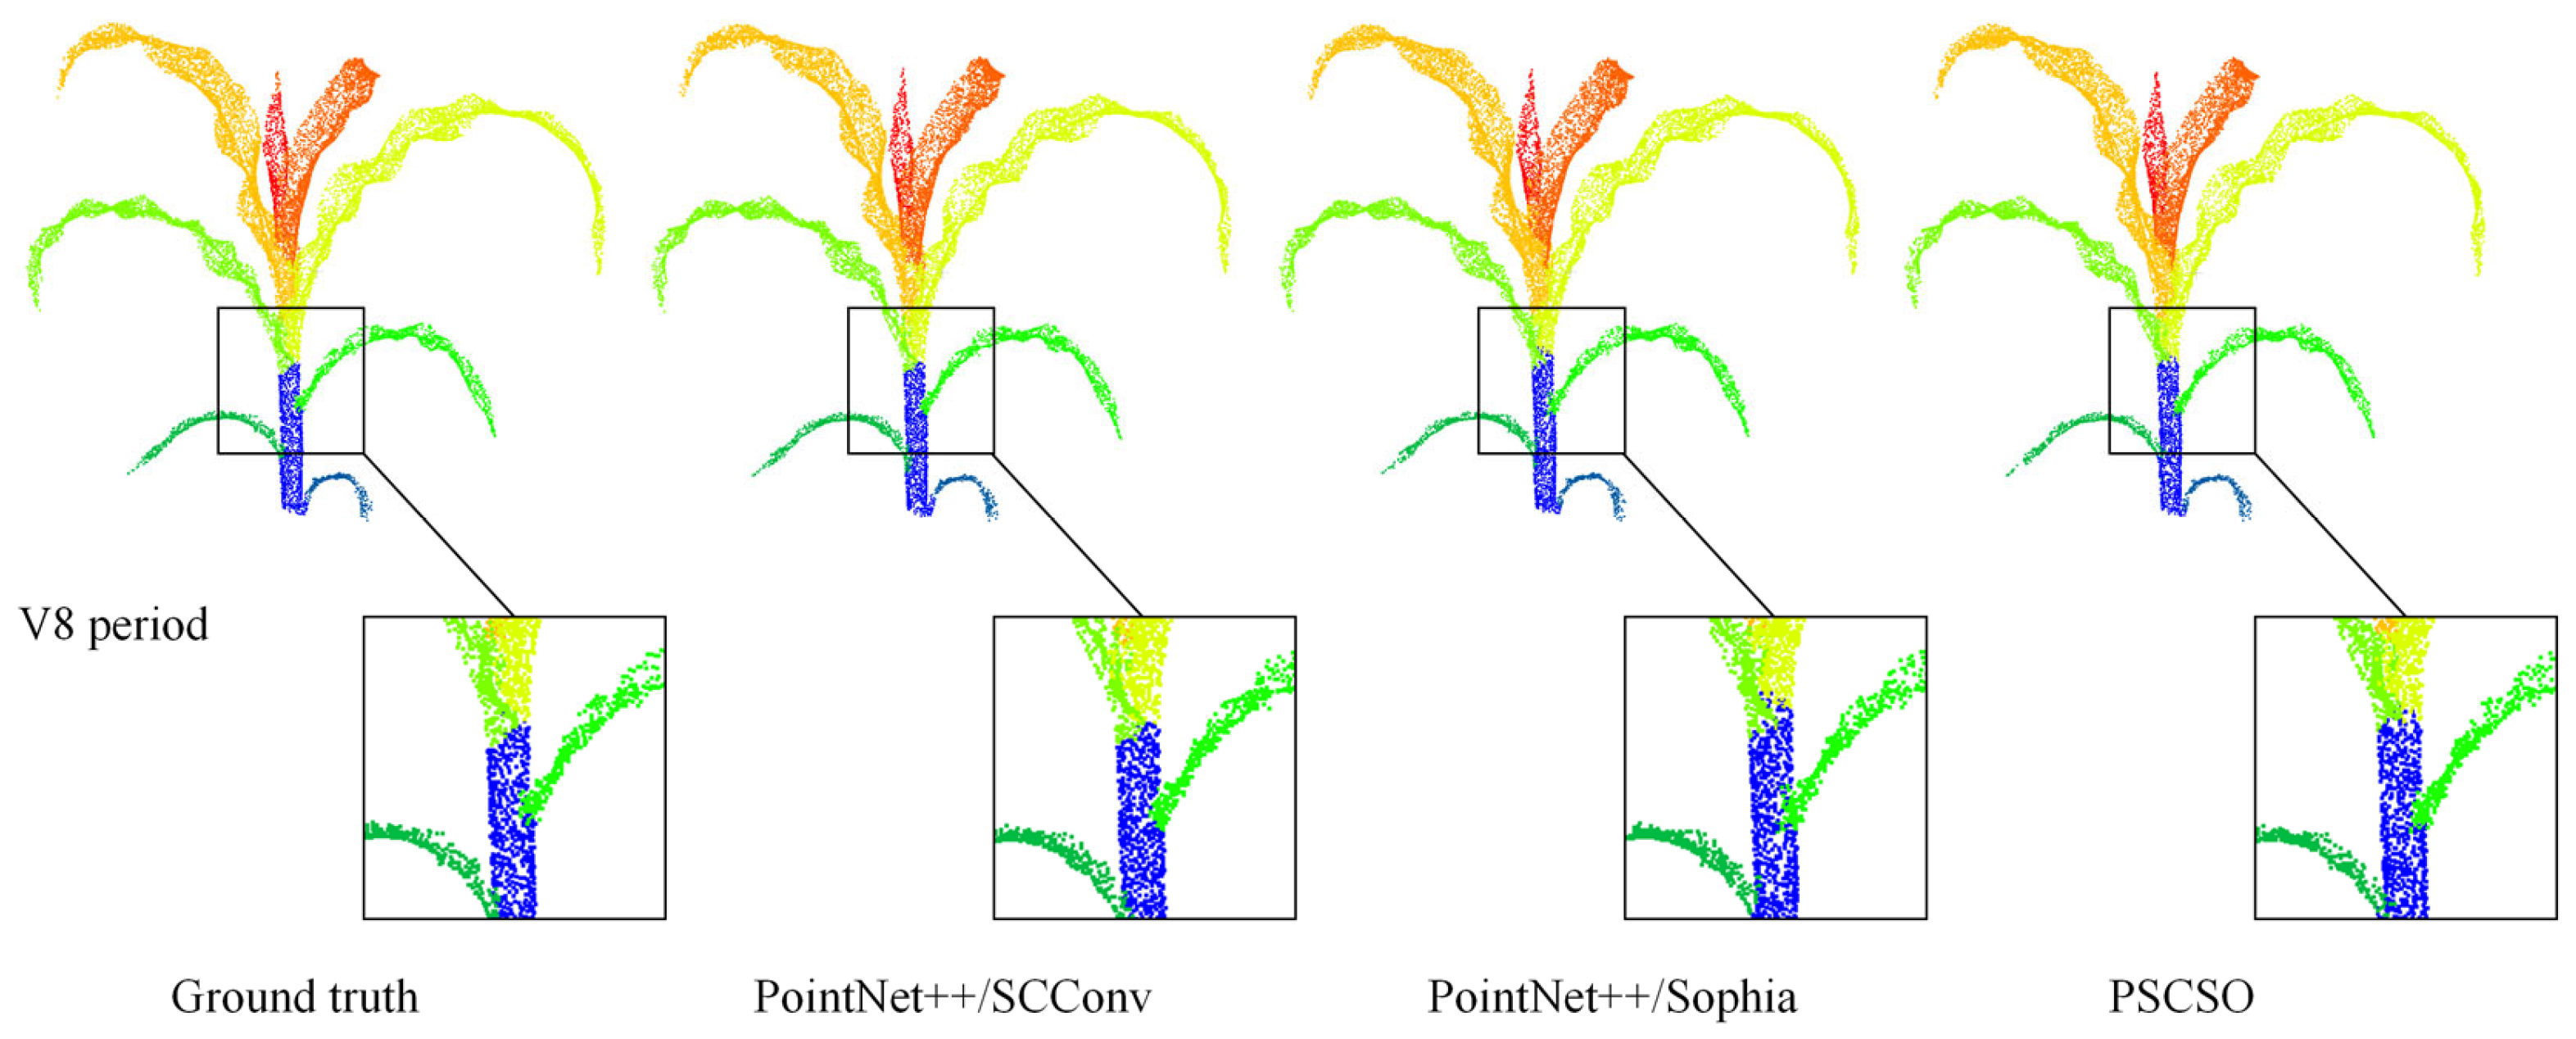
In this study, to enhance the accuracy and effectiveness of maize plant point cloud stem-leaf segmentation, the model was improved by integrating the SCConv convolutional module and the Sophia optimizer, and its segmentation performance was systematically analyzed. The segmentation results of representative sample plants are illustrated in
Figure 11, while the corresponding segmentation evaluation metrics are summarized in
Table 2.
As shown in the figure, the improved PSCSO model demonstrates superior performance in the automated stem-leaf segmentation of maize plant point clouds. Compared with the original PointNet++ model, the overall segmentation results are markedly improved, exhibiting more accurate stem-leaf separation and smoother boundary continuity, with only minor segmentation errors observed at the junctions between stems and leaves.
As shown by the ablation experiment results in
Table 2, the proposed PSCSO model achieved the most significant performance improvement over the SOTA baseline (PointNet++) in the maize stem leaf point cloud instance segmentation task, owing to the synergistic integration of the SCConv module and the Sophia optimizer. Specifically, the independent introduction of the SCConv module improved the model’s test accuracy and MIoU by 2.81% and 7.60%, respectively, compared with the baseline. The model incorporating only the Sophia optimizer also showed reliable gains, with increases of 1.40% in test accuracy and 6.34% in MIoU. When both components were jointly integrated, the PSCSO model achieved the most notable improvement, yielding relative increases of 8.69% in test accuracy and 13.10% in MIoU over the original PointNet++ baseline.
These results confirm the synergistic effect between the SCConv module, which enhances local feature representation, and the Sophia optimizer, which dynamically refines the training process, thus providing a robust and reliable technical framework for high precision segmentation of complex 3D plant point clouds.
3.2. Comparison of Instance Segmentation Results of Maize Point Clouds Using Different Methods
To systematically assess the effectiveness of the proposed PSCSO model in maize plant stem-leaf point cloud segmentation, this study conducted a comparative analysis against several mainstream point cloud instance segmentation models, including GDA-Net [
39], PAConv [
40], Point Transformer [
41], and the baseline PointNet++. Their performance was comprehensively evaluated based on Train accuracy, Test accuracy, MIoU and Training duration. The comparative results are summarized in
Table 3.
As shown in
Table 3, the proposed PSCSO model achieved the most significant performance improvement over the SOTA baseline (PointNet++) in the maize stem leaf point cloud instance segmentation task. Compared with existing methods including GDA-Net, PAConv, and Point Transformer, PSCSO demonstrated superior performance across all evaluation metrics, achieving relative improvements of 8.69% in test accuracy and 13.10% in MIoU over PointNet++. Notably, while maintaining a training duration comparable to that of GDA-Net, PSCSO exhibited a markedly reduced performance gap between training and testing, indicating stronger generalization capability.
In particular, the exceptional performance of PSCSO in the MIoU metric highlights its strong ability to handle complex plant organ boundaries and overlapping leaf structures. Overall, the PSCSO model exhibits clear advantages in processing plant point cloud data characterized by complex morphological variations, providing a robust and scalable technical solution for 3D plant phenotyping. It holds significant potential for applications in agricultural automation monitoring and high throughput phenotypic analysis.
3.3. Evaluation of Phenotypic Trait Extraction Results
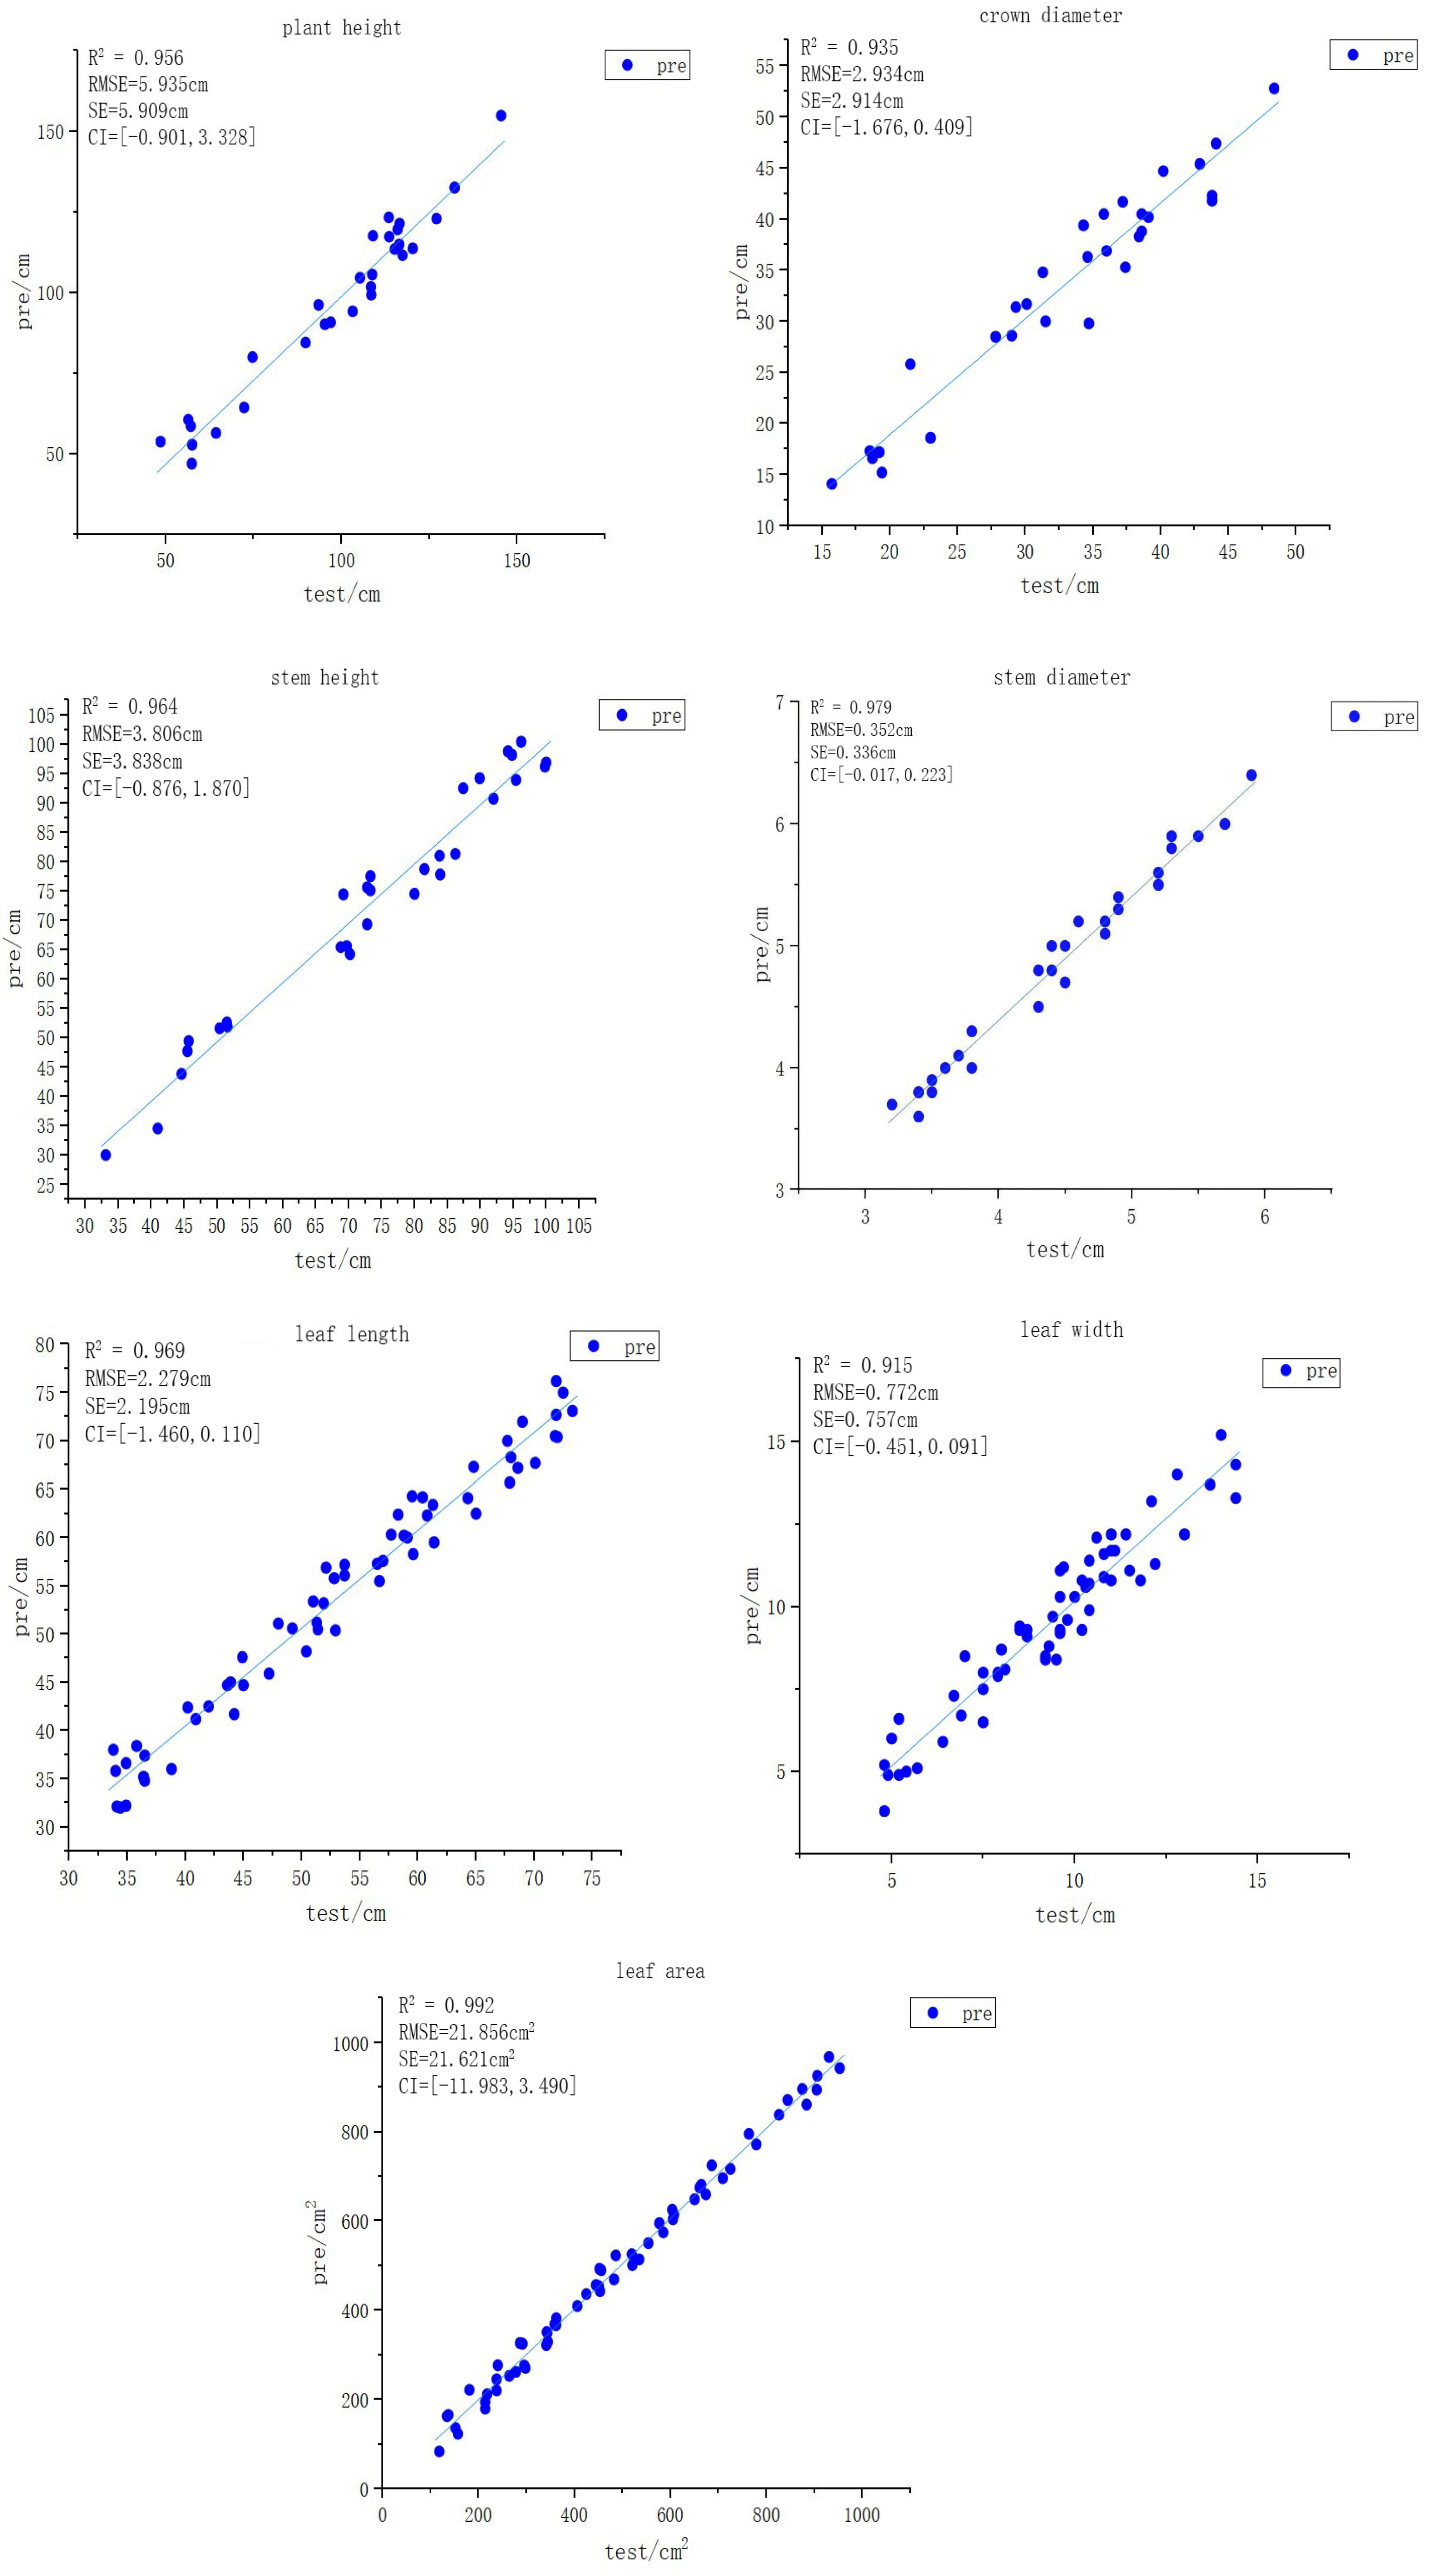
Thirty maize point cloud samples were randomly selected from the dataset for segmentation, and several maize leaf samples were further chosen for detailed analysis. In total, thirty maize plant point clouds, thirty stem point clouds, and sixty leaf point clouds were obtained. Phenotypic feature extraction was subsequently performed on these data to derive seven key phenotypic parameters: plant height, crown diameter, stem height, stem diameter, leaf length, leaf width, and leaf area. The comparison between the extracted results and the corresponding measured values for each phenotypic parameter is presented in
Figure 12, the horizontal axis in the figure represents the measured values (cm/cm
2) of each phenotype, and the vertical axis represents the predicted values (cm/cm
2) of each phenotype.
The experimental results demonstrate that the proposed PSCSO model achieved consistently high accuracy in maize plant phenotypic parameter extraction. The R2 value is: plant height 0.956; crown diameter, 0.935; stem height, 0.964; stem diameter, 0.979; leaf length, 0.969; leaf width, 0.915; leaf area is 0.992. The RMSE value is: plant height, 5.935 cm; crown diameter, 2.934 cm; stem height, 3.806 cm; stem diameter, 0.352 cm; leaf length, 2.279 cm; leaf width, 0.772 cm; leaf area, 21.856 cm2. The SE value is: plant height, 5.909 cm; crown diameter, 2.914 cm; stem height, 3.838 cm; stem diameter, 0.336 cm; leaf length, 2.195 cm; leaf width, 0.757 cm; leaf area, 21.621 cm2. The Confidence Intervals (CI) value is: plant height, [−0.901, 3.328]; crown diameter, [−1.676, 0.409]; stem height, [−0.876, 1.870]; stem diameter, [−0.017, 0.223]; leaf length, [−1.460, 0.110]; leaf width, [−0.451, 0.091]; leaf area, [−11.983, 3.490]. CI contains 0, indicating that there is no significant difference between the model’s predicted values and the manually measured values, suggesting that the model we proposed has good performance. These results fully validate the accuracy and stability of the proposed model in phenotypic measurement.
Comprehensive analysis indicates that, although slight overestimation or underestimation occurred in a few individual samples, the overall extracted phenotypic parameters exhibited a high degree of correlation with the measured values (all R2 > 0.91). These findings confirm that the PSCSO model possesses stability, robustness, and practical applicability in high throughput maize phenotypic parameter extraction, providing reliable technical support for future plant phenotyping research.
4. Discussion
4.1. Analysis of the PSCSO Model
To address the challenges of low efficiency and high labor cost associated with manual segmentation of maize plant point clouds, this study proposes an automated stem-leaf segmentation method based on the PSCSO model. The improvements observed in the PSCSO model originate mainly from its enhanced capability to represent complex local geometric structures rather than from numerical increases in accuracy alone. SCConv strengthens the integration of spatial and channel features, allowing the network to better differentiate fine structural variations in regions where leaves overlap or curl. The Sophia optimizer improved the training stability and convergence speed. The synergistic integration of these two components boosted the model’s segmentation accuracy and robustness when processing complex plant structures. Compared with existing 3D plant segmentation approaches such as PointNet++ and Transformer-based models reported in recent studies, PSCSO demonstrates a clearer ability to preserve boundary details, which are often difficult to resolve under dense clustering.
4.2. Evaluation of Phenotypic Parameter Extraction Performance
Building upon the automated stem-leaf structure segmentation, this study systematically extracted seven key phenotypic parameters: plant height, crown diameter, stem height, stem diameter, leaf length, leaf width, and leaf area. Specifically, plant height and crown diameter were calculated from the range of point cloud coordinates along the Z and X axes, respectively; stem height was determined by fitting the length of the stem’s central axis; stem diameter was estimated as twice the median distance from stem points to the central axis; leaf length and leaf width were obtained via PCA by extracting the primary component axes; and leaf area was computed using the Delaunay triangulation algorithm.
Experimental results demonstrated a high degree of consistency between the extracted and measured values of all parameters, with R2 values exceeding 0.91, indicating that the proposed method achieves excellent accuracy and stability in high throughput maize phenotypic extraction.
To more comprehensively evaluate the model performance and guide subsequent optimization, we further conducted a cause analysis of the errors in the segmentation results:
(1) For stem diameter extraction, errors primarily arose from approximating the distance between stem point clouds and the central axis as the radius and assuming the stem cross section to be circular. This cylindrical simplification may introduce systematic deviations when the actual stem shape deviates from circular symmetry, potentially resulting in overestimation or underestimation of the measured values.
(2) In leaf length estimation, errors mainly stemmed from two factors: (1) the complex morphology of leaves, where drooping or curling at the leaf tips caused the endpoints of the first principal component axis to fail to fully extend to the actual leaf apex, leading to underestimation; (2) manual segmentation inaccuracies, in which subjective errors or structural ambiguity between stems and leaves led to boundary confusion and measurement deviation.
(3) Regarding leaf area computation, the accuracy of the Delaunay triangulation strongly depended on the point cloud density. Sparse point clouds often produced oversimplified mesh structures that could not capture fine geometric details, such as edge curvature variations, thereby causing area underestimation or bias. Moreover, inadequate point density increased susceptibility to noise, reducing the robustness and reliability of the calculated results.
Despite these localized deviations, the extracted and measured values maintained a strong overall correlation, confirming that the proposed PSCSO model exhibits high practicality, robustness, and reliability for 3D phenotypic analysis of maize plants.
4.3. Limitations
Although the PSCSO model provides clear improvements in segmenting complex maize structures, several limitations remain. The method continues to face challenges under high density planting conditions, where severe leaf overlap complicates the precise delineation of organs. In such cases, the model tends to under segment clustered regions or misidentify junctions with ambiguous boundaries. This behavior aligns with observations in related 3D plant reconstruction literature, where dense occlusion consistently reduces segmentation reliability. In addition, the relatively high computational cost of PSCSO may restrict deployment in real time or resource constrained scenarios, despite achieving a favorable balance between accuracy and inference time when compared with representative networks such as GDA Net and PointNet++.
The subsequent research focus should be placed on improving generalization and robustness. Increasing dataset diversity, incorporating explicit regularization and exploring lighter yet expressive local feature modules could mitigate overfitting and reduce model complexity. Enhancing the system’s resistance to noise and point density variation will also be essential for broader field applications. Expanding the model to additional crop species and development stages would further validate its utility in high throughput phenotyping and strengthen its applicability in real world plant science research.
5. Conclusions
This study proposes the PSCSO model, an enhanced point cloud segmentation framework built upon PointNet++. By incorporating SCConv to strengthen local geometric representation and using the Sophia optimizer to improve the stability of feature learning, the model provides a more reliable mechanism for interpreting complex maize architectures. This provides new evidence that locally adaptive convolutional operations are essential for robust plant organ segmentation in realistic field conditions.
Furthermore, seven key phenotypic parameters were systematically extracted: plant height, crown diameter, stem height, stem diameter, leaf length, leaf width, and leaf area.
Comprehensive experimental evaluations demonstrate that: (1) The PSCSO model outperforms the baseline model in metrics such as test accuracy and mIoU, exhibiting superior segmentation precision and robustness. (2) Compared to existing mainstream point cloud segmentation methods, the model achieves remarkable improvements in both training and testing accuracy, while showing strong adaptability to complex plant structures such as leaf occlusion and overlapping regions. (3) The phenotypic parameters extracted from the segmentation results exhibit a high degree of consistency with manually measured values, with all R2 values exceeding 0.91, confirming the method’s high accuracy and reliability.
It should be noted that the model was evaluated primarily on a single crop species, and its performance under broader morphological diversity remains to be determined. In addition, the reliance on geometric point cloud data limits the ability to capture physiological traits, and the current model does not yet incorporate spectral or temporal information. These aspects represent important directions for improvement, together with the need for stronger regularization strategies to mitigate overfitting and enhance generalization across growth stages and field environments.
Future research will extend the evaluation to multiple crop species to further assess cross-species applicability, integrate multispectral sensing to deepen the connection between structure and function, and investigate lighter and more efficient architectural variants to support real-time deployment. Overall, this study provides a technically grounded and biologically meaningful framework for high-throughput 3D phenotypic analysis. Its methodological innovations contribute to advancing plant structural modeling and offer valuable support for crop phenomics and intelligent agricultural systems.
Author Contributions
Conceptualization, Y.Z.; methodology, Y.Z., Z.W. (Zhen Wang) and J.Y. (Jiangtan Yao); software, Y.Z. and J.Y. (Jinjun Yu); validation, Z.W. (Zhen Wang), J.Y. (Jiangtan Yao) and Z.W. (Zhichuan Wang); formal analysis, Z.W. (Zhen Wang) and Z.W. (Zhichuan Wang); investigation, Y.Z. and Z.W. (Zhen Wang); resources, Y.Z. and D.L.; data curation, D.L., Z.W. (Zhen Wang) and J.Y. (Jinjun Yu); writing—original draft preparation, Y.Z. and D.L.; writing—review and editing, Y.Z., D.L. and Z.W. (Zhen Wang); visualization, D.L.; supervision, Y.Z.; project administration, Z.J.; funding acquisition, Z.J. All authors have read and agreed to the published version of the manuscript.
Funding
This work was supported by the Shanxi Province Postgraduate Excellent Teaching Case (No: 2024AL07).
Data Availability Statement
Data can be provided by contacting the corresponding author.
Conflicts of Interest
The authors declare no conflicts of interest.
References
- Tanumihardjo, S.A.; McCulley, L.; Roh, R.; Lopez-Ridaura, S.; Palacios-Rojas, N.; Gunaratna, N.S. Maize agro-food systems to ensure food and nutrition security in reference to the Sustainable Development Goals. Glob. Food Secur. 2020, 25, 100327. [Google Scholar] [CrossRef]
- Zhang, H.; Wang, L.; Jin, X.; Bian, L.; Ge, Y. High-throughput phenotyping of plant leaf morphological, physiological, and biochemical traits on multiple scales using optical sensing. Crop J. 2023, 11, 1303–1318. [Google Scholar] [CrossRef]
- Liu, F.; Wang, S.; Zhao, L. Research Progress and Prospect of Intelligent High-Throughput Crop Phenotyping Platform. J. Crop Health 2025, 77, 156. [Google Scholar] [CrossRef]
- Gatkal, N.; Dhar, T.; Prasad, A.; Prajwal, R.; Santosh; Jyoti, B.; Roul, A.K.; Potdar, R.; Mahore, A.; Parmar, B.S.; et al. Development of a user—Friendly automatic ground—Based imaging platform for precise estimation of plant phenotypes in field crops. J. Field Robot. 2023, 41, 2355–2372. [Google Scholar] [CrossRef]
- Wen, T.; Li, J.-H.; Wang, Q.; Gao, Y.-Y.; Hao, G.-F.; Song, B.-A. Thermal imaging: The digital eye facilitates high-throughput phenotyping traits of plant growth and stress responses. Sci. Total Environ. 2023, 899, 165626. [Google Scholar] [CrossRef]
- Ayankojo, I.T.; Thorp, K.R.; Thompson, A.L. Advances in the Application of Small Unoccupied Aircraft Systems (sUAS) for High-Throughput Plant Phenotyping. Remote Sens. 2023, 15, 2623. [Google Scholar] [CrossRef]
- Wang, Z.; Wang, K.; Yang, F.; Pan, S.; Han, Y. Image segmentation of overlapping leaves based on Chan–Vese model and Sobel operator. Inf. Process. Agric. 2018, 5, 1–10. [Google Scholar] [CrossRef]
- Yang, X.; Ni, H.; Li, J.; Lv, J.; Mu, H.; Qi, D. Leaf recognition using BP-RBF hybrid neural network. J. For. Res. 2021, 33, 579–589. [Google Scholar] [CrossRef]
- Bhagat, S.; Kokare, M.; Haswani, V.; Hambarde, P.; Kamble, R. Eff-UNet++: A novel architecture for plant leaf segmentation and counting. Ecol. Inform. 2022, 68, 101583. [Google Scholar] [CrossRef]
- Hou, C.; Zhuang, J.; Tang, Y.; He, Y.; Miao, A.; Huang, H.; Luo, S. Recognition of early blight and late blight diseases on potato leaves based on graph cut segmentation. J. Agric. Food Res. 2021, 5, 100154. [Google Scholar] [CrossRef]
- Jin, S.; Sun, X.; Wu, F.; Su, Y.; Li, Y.; Song, S.; Xu, K.; Ma, Q.; Baret, F.; Jiang, D.; et al. Lidar sheds new light on plant phenomics for plant breeding and management: Recent advances and future prospects. ISPRS J. Photogramm. Remote Sens. 2021, 17, 1202–1223. [Google Scholar] [CrossRef]
- Anderson, K.E.; Glenn, N.F.; Spaete, L.P.; Shinneman, D.J.; Pilliod, D.S.; Arkle, R.S.; McIlroy, S.K.; Derryberry, D.R. Estimating vegetation biomass and cover across large plots in shrub and grass dominated drylands using terrestrial lidar and machine learning. Ecol. Indic. 2018, 84, 793–802. [Google Scholar] [CrossRef]
- Arnó, J.; Escolà, A.; Vallès, J.M.; Llorens, J.; Sanz, R.; Masip, J.; Palacín, J.; Rosell-Polo, J.R. Leaf area index estimation in vineyards using a ground-based LiDAR scanner. Precis. Agric. 2013, 14, 290–306. [Google Scholar] [CrossRef]
- Arumäe, T.; Lang, M. Estimation of canopy cover in dense mixed-species forests using airborne lidar data. Eur. J. Remote Sens. 2018, 51, 132–141. [Google Scholar] [CrossRef]
- Gené-Mola, J.; Gregorio, E.; Guevara, J.; Auat, F.; Sanz-Cortiella, R.; Escolà, A.; Llorens, J.; Morros, J.-R.; Ruiz-Hidalgo, J.; Vilaplana, V.; et al. Fruit detection in an apple orchard using a mobile terrestrial laser scanner. Biosyst. Eng. 2019, 187, 171–184. [Google Scholar] [CrossRef]
- Milella, A.; Marani, R.; Petitti, A.; Reina, G. In-field high throughput grapevine phenotyping with a consumer-grade depth camera. Comput. Electron. Agric. 2019, 156, 293–306. [Google Scholar] [CrossRef]
- Gené-Mola, J.; Sanz-Cortiella, R.; Rosell-Polo, J.R.; Morros, J.-R.; Ruiz-Hidalgo, J.; Vilaplana, V.; Gregorio, E. Fruit detection and 3D location using instance segmentation neural networks and structure-from-motion photogrammetry. Comput. Electron. Agric. 2020, 169, 105165. [Google Scholar] [CrossRef]
- Westoby, M.; Brasington, J.; Glasser, N.F.; Hambrey, M.J.; Reynolds, J.M. ‘Structure-from-Motion’ photogrammetry: A low-cost, effective tool for geoscience applications. Geomorphology 2012, 179, 300–314. [Google Scholar] [CrossRef]
- Xiang, L.; Bao, Y.; Tang, L.; Ortiz, D.; Salas-Fernandez, M.G. Automated morphological traits extraction for sorghum plants via 3D point cloud data analysis. Comput. Electron. Agric. 2019, 162, 951–961. [Google Scholar] [CrossRef]
- Wang, Y.; Jiang, T.; Liu, J.; Li, X.; Liang, C. Hierarchical Instance Recognition of Individual Roadside Trees in Environmentally Complex Urban Areas from UAV Laser Scanning Point Clouds. ISPRS Int. J. Geo-Inf. 2020, 9, 595. [Google Scholar] [CrossRef]
- Turgut, K.; Dutagaci, H.; Rousseau, D. RoseSegNet: An attention-based deep learning architecture for organ segmentation of plants. Biosyst. Eng. 2022, 221, 138–153. [Google Scholar] [CrossRef]
- Schonberger, J.L.; Frahm, J.-M. Structure-from-Motion Revisited. In Proceedings of the 2016 IEEE Conference on Computer Vision and Pattern Recognition (CVPR), Las Vegas, NV, USA, 27–30 June 2016; pp. 4104–4113. [Google Scholar]
- Ono, T.; Kubo, H.; Tanaka, K.; Funatomi, T.; Mukaigawa, Y. Practical BRDF reconstruction using reliable geometric regions from multi-view stereo. Comput. Vis. Media 2019, 5, 325–336. [Google Scholar] [CrossRef]
- Kuçak, R.A.; Erol, S.; Erol, B. The strip adjustment of mobile LiDAR point clouds using iterative closest point (ICP) algorithm. Arab. J. Geosci. 2022, 15, 1017. [Google Scholar] [CrossRef]
- Wang, R.; Jing, H.; Bao, Q. Point cloud registration algorithm based on feature extraction and improved ICP. J. Appl. Opt. 2025, 46, 805–812. [Google Scholar] [CrossRef]
- Qi, C.R.; Yi, L.; Su, H.; Guibas, L.J. Pointnet++: Deep hierarchical feature learning on point sets in a metric space. In Proceedings of the Advances in Neural Information Processing Systems, Long Beach, CA, USA, 4–9 December 2017; pp. 5099–5108. [Google Scholar] [CrossRef]
- Charles, R.Q.; Su, H.; Kaichun, M.; Guibas, L.J. PointNet: Deep Learning on Point Sets for 3D Classification and Segmentation. In Proceedings of the 2017 IEEE Conference on Computer Vision and Pattern Recognition (CVPR), Honolulu, HI, USA, 21–26 July 2017; pp. 77–85. [Google Scholar] [CrossRef]
- Shchenyavskaya, L.A.; Gura, D.A.; Dyachenko, R.A. Analysis of neural network architecture pointnet. Vestnik of the dagestan state technical university. Tech. Sci. 2024, 50, 158–165. [Google Scholar] [CrossRef]
- Li, J.; Wen, Y.; He, L. SCConv: Spatial and Channel Reconstruction Convolution for Feature Redundancy. In Proceedings of the 2023 IEEE/CVF Conference on Computer Vision and Pattern Recognition (CVPR), Vancouver, BC, Canada, 17–24 June 2023; pp. 6153–6162. [Google Scholar] [CrossRef]
- Tian, F.; Zhang, Y.; Soomro, S.A.; Wang, Q.; Zhang, S.; Zhang, J.; Yang, Q.; Yan, Y.; Yu, Z.; Song, Z. SSOD-MViT: A novel model for recognizing alfalfa seed pod maturity based on semi-supervised learning. Comput. Electron. Agric. 2025, 236, 110439. [Google Scholar] [CrossRef]
- Geng, Q.; Xu, X.; Ma, X.; Li, L.; Xu, F.; Gao, B.; Ma, Y.; Huang, J.; Yang, J.; Yao, X. WSG-P2PNet: A deep learning framework for counting and locating wheat spike grains in the open field environment. Comput. Electron. Agric. 2025, 235, 110314. [Google Scholar] [CrossRef]
- Hou, Z.; Zhang, Q.; Zhang, B.; Zhang, H.; Huang, L.; Wang, M. CattlePartNet: An identification approach for key region of body size and its application on body measurement of beef cattle. Comput. Electron. Agric. 2025, 232, 110013. [Google Scholar] [CrossRef]
- Miao, T.; Zhu, C.; Xu, T.; Yang, T.; Li, N.; Zhou, Y.; Deng, H. Automatic stem-leaf segmentation of maize shoots using three-dimensional point cloud. Comput. Electron. Agric. 2021, 187, 106310. [Google Scholar] [CrossRef]
- Shlens, J. A Tutorial on Principal Component Analysis. arXiv 2014, arXiv:1404.1100. [Google Scholar] [CrossRef]
- Haklı, H.; Uğuz, H.; Çay, T. A new approach for automating land partitioning using binary search and Delaunay triangulation. Comput. Electron. Agric. 2016, 125, 129–136. [Google Scholar] [CrossRef]
- Coulter, J.A.; Nafziger, E.D.; Abendroth, L.J.; Thomison, P.R.; Elmore, R.W.; Zarnstorff, M.E. Agronomic responses of corn to stand reduction at vegetative growth stages. Agron. J. 2011, 103, 577–583. [Google Scholar] [CrossRef]
- Shelhamer, E.; Long, J.; Darrell, T. Fully Convolutional Networks for Semantic Segmentation. IEEE Trans. Pattern Anal. Mach. Intell. 2017, 39, 640–651. [Google Scholar] [CrossRef]
- Zhu, C.; Miao, T.; Xu, T.; Li, N.; Deng, H.; Zhou, Y. Segmentation and phenotypic trait extraction of maize point cloud stem-leaf based on skeleton and optimal transportation distances. Trans. Chin. Soc. Agric. Eng. (Trans. CSAE) 2021, 37, 188–198. [Google Scholar] [CrossRef]
- Hu, X.; Liu, A.; Tan, Z.; Zhang, X.; Zhang, C.; King, I.; Yu, P.S. GDA: Generative Data Augmentation Techniques for Relation Extraction Tasks. In Findings of the Association for Computational Linguistics: ACL 2023; Association for Computational Linguistics: Toronto, ON, Canada, 2023; pp. 10221–10234. [Google Scholar] [CrossRef]
- Xu, M.; Ding, R.; Zhao, H.; Qi, X. PAConv: Position Adaptive Convolution with Dynamic Kernel Assembling on Point Clouds. In Proceedings of the 2021 IEEE/CVF Conference on Computer Vision and Pattern Recognition (CVPR), Nashville, TN, USA, 20–25 June 2021; pp. 3172–3181. [Google Scholar] [CrossRef]
- Zhao, H.; Jiang, L.; Jia, J.; Torr, P.; Koltun, V. Point Transformer. In Proceedings of the 2021 IEEE/CVF International Conference on Computer Vision (ICCV), Montreal, QC, Canada, 10–17 October 2021; pp. 16239–16248. [Google Scholar] [CrossRef]
| Disclaimer/Publisher’s Note: The statements, opinions and data contained in all publications are solely those of the individual author(s) and contributor(s) and not of MDPI and/or the editor(s). MDPI and/or the editor(s) disclaim responsibility for any injury to people or property resulting from any ideas, methods, instructions or products referred to in the content. |
© 2025 by the authors. Licensee MDPI, Basel, Switzerland. This article is an open access article distributed under the terms and conditions of the Creative Commons Attribution (CC BY) license (https://creativecommons.org/licenses/by/4.0/).
