Article

Integrated Metabolomic and Transcriptomic Profiles Provide Insights into the Molecular Mechanisms in Modulating Female Flower of Coconut (Cocos nucifera L.)

1
Coconut Research Institute, Chinese Academy of Tropical Agricultural Sciences, Wenchang 571339, China
2
Hainan Key Laboratory of Tropical Oil Crops Biology, Wenchang 571339, China
3
Wenchang, Tropical Palm Crop Resources and Environment, Hainan Observation and Research Station, Wenchang 571339, China
*
Author to whom correspondence should be addressed.
Agriculture 2025, 15(22), 2336; https://doi.org/10.3390/agriculture15222336
Submission received: 3 October 2025 / Revised: 7 November 2025 / Accepted: 7 November 2025 / Published: 10 November 2025
(This article belongs to the Section Crop Genetics, Genomics and Breeding)

Abstract

Coconut yield and quality are significantly affected by multiple female inflorescences (MFF), which disrupt flower differentiation balance. To elucidate the molecular mechanisms, we compared MFF with normal female inflorescences (NFF) using phenotypic, morphological, physiological, and multi-omics approaches. The results revealed that MFF exhibited altered flower structures. MFF showed elevated iron (Fe), nitrogen (N), sulfur (S), potassium (K), calcium (Ca), zinc (Zn), proline (Pro), catalase (CAT), malondialdehyde (MDA), abscisic acid (ABA), and jasmonic acid (JA), but reduced molybdenum (Mo), soluble sugar (SS), soluble protein (SP), superoxide dismutase (SOD), peroxidase (POD), indole acetic acid (IAA), zeatin riboside (ZR), and gibberellic acid (GA). We detected 445 differentially expressed genes (DEGs) mainly enriched in ABA, ETH, BR, and JA pathways in MFF compared to NFF. We identified 144 differentially accumulated metabolites (DAMs) primarily in lipids and lipid-like molecules, phenylpropanoids and polyketides, as well as organic acids and derivatives in the comparison of MFF and NFF. Integrated analysis linked these to key pathways, e.g., “carbon metabolism”, “carbon fixation in photosynthetic organisms”, “phenylalanine, tyrosine, and tryptophan biosynthesis”, “glyoxylate and dicarboxylate metabolism”, “glycolysis/gluconeogenesis”, “pentose and glucuronate interconversions”, “flavonoid biosynthesis”, “flavone and flavonol biosynthesis”, “pyruvate metabolism”, and “citrate cycle (TCA cycle)”. Based on our results. the bHLH137, BHLH062, MYB (CSA), ERF118, and MADS2 genes may drive MFF formation. This study provides a framework for understanding coconut flower differentiation and improving yield.

1. Introduction

Flower bud differentiation is a crucial stage in the development of flowering plants, as the balance and the quality of this process directly determine subsequent yield and quality. This physiological phase plays a central role in regulating differentiation [1,2,3]. In nature, only about 5% of flowering plants achieve monoecious differentiation, where individual flowers exhibit either female or male characteristics [4]. However, most species exhibit an imbalance in the number of male and female flowers. For example, coconuts exhibit a high proportion of female flowers but with poor quality, alongside a below-average male flower count. This imbalance reduces both pollination rates and fertilization [5]. To enhance crop yield, promoting balanced male and female flower differentiation is often essential. Given that flower bud differentiation is critical for yield and quality formation, elucidating its molecular mechanisms is vital for improving crop productivity and advancing molecular-assisted breeding.
The flowering mechanism of Arabidopsis has been extensively studied, and its regulatory network is well-established [6,7,8]. However, new regulatory genes and mechanisms continue to emerge [9,10,11], suggesting that the flowering network is not only complex but also highly species-specific. For tropical economic crops, flowering is a critical trait that directly influences yield and quality. Consequently, many studies have focused on flowering pathways and gene functions. For instance, flavonoid biosynthesis plays a key role in peach blossom differentiation. In walnut female flower buds, flavonoid metabolism predominantly shifts toward isoflavones, flavones, and flavonol branches during differentiation, mediated by key structural genes such as PAL, CHS, CHI, FLS, F3′5′H, and DFR. Furthermore, these structural genes and their associated flavonoid metabolites exhibit strong correlations with flowering integrators like SOC1, FT, CO, and AP1 [12].
The significant enrichment of differentially expressed genes (DEGs) in glycolysis/gluconeogenesis pathways suggests that sugar metabolism plays a key role in regulating lily flowering. Sucrose transporter (SUT) genes, which regulate sugar transport and concentration, promote flowering by positively modulating FT and SOC1 expression [13]. Supporting this, Cai et al. (2020) observed that the soluble sugar content in Lycoris sprengeri flower buds peaks early in differentiation but is heavily consumed during organ formation, highlighting sugar concentration’s critical role in bulbous flower blooming [14]. Additionally, DEGs are enriched in pentose metabolism, glucuronate interconversions, amino sugar metabolism, and nucleotide sugar metabolism, further implicating sugar metabolism in Arabidopsis flowering regulation [15]. Similarly, in Chinese cherry (Prunus pseudocerasus L.), early flower bud differentiation is marked by DEG enrichment in carbohydrate, nucleotide, and amino acid metabolism, underscoring the importance of energy and structural precursors in initiating floral differentiation [16].
Hormones play a crucial role in regulating flowering. Auxin (IAA), gibberellin (GA), abscisic acid (ABA), and cytokinins (CK) significantly influence flower bud differentiation and flowering time [17]. For instance, differentially expressed genes (DEGs) are highly enriched in plant hormone signal transduction pathways, suggesting that multiple endogenous hormones are involved in lily flowering [18]. In Jatropha curcas, endogenous hormone regulation is critical for female flower differentiation but shows no significant association with male flower differentiation. Research indicates that the cytokinin (CTK) signaling pathway initiates female flower primordia formation, which is then further promoted by other hormones, including jasmonic acid (JA), GA, and ABA. Notably, key genes involved in hormone biosynthesis and signaling pathways may play pivotal roles in regulating flower bud growth and development [19].
Transcription factors (TFs) play a key role in regulating plant flowering by modulating specific gene networks, including those involving bHLH [20], MYB [21], and MADS-box proteins [22]. Studies have also shown that TF families such as AP2/ERF, MYB, MADS-M, bHLH, NAC, and WRKY are closely associated with alfalfa flower bud development [23].
Coconut fruits are widely processed into food products such as candies, beverages, and pastries. Both coconut juice and meat are rich in vitamins, potassium, calcium, magnesium, and trace elements [24]. Currently, there are more than 300 types of coconut products and by-products available [25]. Additionally, coconut exhibits beneficial functional properties, including antioxidant, heat-clearing, and anti-inflammatory effects. The balance and quality of male and female flower differentiation in coconut inflorescences directly impact yield and fruit quality. Inflorescence differentiation begins three years before flowering, with bract differentiation occurring two years prior. Approximately six months later, spikelets emerge [26]. This process is influenced by genetic material, endogenous hormones, nutrient supply, and environmental conditions [27,28,29]. Coconut is a monoecious, synecious, and cross-pollinated plant. Each inflorescence comprises 20–30 branches, each bearing 200–300 male flowers at the top and typically one female flower at the middle to base. In tall coconut varieties, female flowers bloom later than male flowers. The flowering period of a single spike lasts 5–7 days, with a 3-day receptive window, favoring cross-pollination. In contrast, dwarf coconut varieties exhibit simultaneous flowering, with a female flowering period of 15–24 days and a 2-day receptive period, enabling self-pollination [26]. Normal female flower inflorescence (NFF) differentiation is crucial for successful pollination in dwarf coconuts. However, production practices often reveal that multiple female flower inflorescences (MFF) lead to uneven nutrient distribution among female flowers, while competition for nutrients from male flowers impairs their development. This imbalance between male and female differentiation can reduce female flower quality and male flower quantity/quality, ultimately lowering pollination efficiency. Understanding the regulatory mechanisms of flower cluster differentiation—particularly female flower differentiation—in dwarf coconuts is essential for improving female flower quality and breeding high-yield coconut varieties. However, research on these molecular mechanisms, especially for female flower differentiation, remains limited.
To investigate this issue, we utilized female flowers from both normal (NFF) and multiple (MFF) female flower inflorescences of yellow dwarf coconuts as experimental materials. Through a comprehensive analysis integrating phenotypic, morphological, nutrient element detection, transcriptome (RNA-seq), and metabolomics approaches, we systematically characterized female flower traits and identified key metabolic pathways involved in differentiation. We analyzed the expression patterns of differential metabolites and genes within these pathways, followed by correlation analysis to pinpoint critical pathways, differentially expressed genes/metabolites, and core transcription factors regulating MFF emergence. Based on these findings, we constructed a regulatory network for female flower differentiation. This study provides theoretical insights into the molecular mechanisms underlying MFF differentiation in coconuts, offers new perspectives on coconut flower development regulation, and establishes a foundation for high-quality coconut production.

2. Materials and Methods

2.1. Plant Materials

Yellow dwarf coconut trees of 8 years old and grown in Wenchang City, Hainan Province, China were used as a plant material. Three plants with similar growth vigor were selected from the same park, and female flowers from NFF and MFF at 15 days after anthesis were sampled for analysis. The morphology of female flowers was observed, and samples were collected for laboratory measurement of size and weight. For histological analysis, female flower samples from NFF and MFF were fixed in FAA (formalin:glacial acetic acid:50% alcohol = 8:58:7; Servicebio, Wuhan, China). For physiological indicators, transcriptome and metabolome analysis, fresh female flower samples from NFF and MFF were frozen in liquid nitrogen and stored at −80 °C. Additional samples were dried for nutrient analysis. Three biological replicates were established for all samples from NFF and MFF.

2.2. Observing the Morphological Characteristics of Coconut Female Flowers

Coconut female flowers were photographed using a single-lens reflex camera (Nikon D750, Tokyo, Japan). For microscopic observation, female flowers from NFF and MFF were collected and immediately fixed in formalin-acetic—FAA (50%) (Servicebio, Wuhan, China). The tissues were then dehydrated in a graded ethanol series, infiltrated with paraffin, embedded, and sectioned. The sections underwent the following staining protocol. (1) Dewaxing and Hydration: Immersed in eco-friendly dewaxing and clearing solution I (G1128, Servicebio) for 20 min; followed by eco-friendly dewaxing and clearing solution II for 20 min; washed in anhydrous ethanol I (5 min), anhydrous ethanol II (5 min), and 75% alcohol (5 min); rinsed with tap water. (2) Safranin Staining: Stained in plant safranin staining solution for 2 min; lightly rinsed with tap water to remove excess dye. (3) Dehydration: Briefly immersed in 50%, 70%, and 80% gradient alcohol (3–8 s each). (4) Fast Green Staining: Stained in plant fast green staining solution (G1031, Servicebio) for 6–20 s; dehydrated in three baths of anhydrous ethanol (5, 10, and 20 s). (5) Mounting and Clearing: Cleared in clean xylene for 5 min; mounted with neutral balsam. Finally, the sections were examined under an upright optical microscope (Nikon Eclipse E100) and imaged using a Nikon DS-U3 imaging system.

2.3. Nutrients and Enzymatic Activity Measurements

For physiological analysis, female flower samples from both NFF and MFF were collected, with all assays conducted in triplicate. We measured the contents of SS, SP, Pro, and MDA, as well as the activities of SOD, POD, and CAT. Precisely 0.1000 g of coconut female flower tissue was homogenized with pre-cooled PBS (1:10, w/v). The homogenate was ground at high speed and centrifuged at 2500 rpm for 10 min. The supernatant (50 µL) was used for subsequent assays. Assay kits and standards for MDA, SS, SP, Pro, SOD, CAT, and POD were obtained from Nanjing Jiancheng Bioengineering Institute. Measurements were performed strictly following the manufacturer’s instructions and the method described by Li (2000) [30]. A microplate reader (DG5033A, Nanjing Huadong Electronics Group Medical Equipment, Nanjing, China) was used with 1 cm cuvettes and blank cuvettes for baseline correction. Absorbance was measured at specific wavelengths: 595 nm (SP), 620 nm (SS), 532 nm (MDA), 520 nm (Pro), 550 nm (SOD), 405 nm (CAT), and 420 nm (POD). All readings were taken within 10 min after adding the termination solution. Concentrations/activities were calculated from absorbance values using the respective standard curves.

2.4. Endogenous Hormone Measurements

(1)
Sample Preparation: The experimental testing was conducted by Nanjing Ruiyuan Biotechnology Co., Ltd. (Nanjing, China). All samples were ground into powder in liquid nitrogen, accurately weighed into test tubes, and mixed with 10 mL of acetonitrile solution and 8 μL of internal standard mother liquor. The extract was stored overnight at 4 °C, then centrifuged at 12,000× g for 5 min at 4 °C, and the supernatant was collected. The precipitate was re-extracted twice with 5 mL of acetonitrile, and the supernatants were combined. The extract was purified by adding C18 and GCB to remove impurities, followed by centrifugation (12,000× g, 5 min, 4 °C). The supernatant was nitrogen-dried, reconstituted in 400 μL of methanol, filtered through a 0.22 μm organic-phase membrane, and stored at −20 °C for analysis.
(2)
Standard Solution Preparation: A 1.5 mL centrifuge tube was filled with 984 μL of methanol and 2 μL each of 500 μg/mL IAA, ABA, JA, and ZR, and then GA standard stock solutions (Sigma) were added to prepare a 1 μg/mL mother liquor. Similarly, a 1 μg/mL internal standard mother liquor was prepared by adding 2 μL of each 500 μg/mL internal standard stock solution to 990 μL of methanol. Standard curve solutions were prepared at concentrations of 0.1, 0.2, 0.5, 1, 2, 5, 10, 20, 50, 100, and 200 ng/mL, with each point containing a 20 ng/mL internal standard.
(3)
LC-MS/MS Analysis: The analysis was performed using a PE QSight 420 triple quadrupole mass spectrometer (PerkinElmer, Waltham, MA, USA) coupled with a high-performance liquid chromatography (HPLC) system. The mobile phase was delivered by a binary pump, and the sample was injected via an autosampler. Components were separated in the chromatographic column based on their retention times and then ionized via electrospray ionization (ESI). The ionized components were accelerated into the mass analyzer, where they were fragmented and detected in multiple reaction monitoring (MRM) mode. For each analyte, 2 or more fragment ions were monitored, and identification was confirmed by matching retention times and response ratios with standards. Quantification was achieved using the standard curve. Liquid phase conditions were as follows: A Poroshell 120 SB-C18 reverse-phase chromatography column (2.1 mm × 150 mm, 2.7 μm) was used at a column temperature of 30 °C. The mobile phase consisted of A (water/0.02% formic acid) and B (chromatographic methanol) with an elution gradient as follows: 0~1 min, 0.3 mL/min-A—95%; 1~9 min, 0.3 mL/min-A—95%~40%; 9~11 min, 0.3 mL/min-A—40%~5%; 11~13 min, 0.3 mL/min-A—5%; 13~13.2 min, 0.3 mL/min-A—5%~95%; 13.2~15 min, 0.3 mL/min-A—95%. The injection volume was 2 μL. Mass spectrometry parameters: Ionization was performed in ESI positive and negative ion modes separately. The scanning type was MRM. The air curtain pressure was 15 psi, with spray voltages of +5500 V (positive mode) and −5000 V (negative mode). The atomizing gas pressure was 65 psi, the auxiliary gas pressure was 70 psi, and the atomization temperature was 300 °C.

2.5. Nutritional Element Measurements

(1)
Nitrogen (N) detection: Sample preparation: 0.2 g of sample (accurate to 0.0001 g) was weighed into a 300 mL digestion tube, avoiding contact with the tube neck. A small amount of water was added to moisten the sample, followed by 5 mL sulfuric acid and 2 g accelerator. A curved-neck funnel was placed on the tube mouth and heated at 250 °C on a digestion furnace (timer started after temperature stabilization; duration ~30 min). After H2SO4 decomposition (white smoke emission), the temperature was raised to 400 °C. It was removed when the solution turned uniformly brownish-black (~3 h) and cooled before distillation. Blank Test: Reagent dosage and procedure were identical to sample analysis, except no sample was added. Distillation: Sodium hydroxide and sulfuric acid standard solutions were prepared, indicators mixed, and the nitrogen analyzer (SKD-1800, Shanghai, China) preheated. Air distillation was performed to clean the pipelines until the readings stabilized then the total nitrogen content calculated using formula [31].
(2)
Chlorine (Cl) determination: Sample preparation: Weigh 0.5000 g sample into a 100 mL stoppered colorimetric tube, add 25 mL water; if necessary, heat in a 70 °C water bath for 10 min to dissolve. Shake and sonicate for 20 min, cool to room temperature, shake again, and filter. Discard the initial filtrate. Titration: Transfer 5–20 mL filtrate to a 100 mL beaker, add 5 mL nitric acid solution and 25 mL acetone, immerse the glass and silver electrodes, and start the electromagnetic stirrer. Titrate with silver nitrate standard solution from an acid burette, recording the potential after each drop. Near the endpoint, add 0.1 mL per drop until the potential is stabilized. Use a potentiometric titrator (ZDJ-4D, Shanghai, China) to record the volume and potential automatically. Blank Test: Conduct simultaneously and record the silver nitrate consumption. Calculate the chloride ion content using formula [31].
(3)
Elemental analysis (P, K, Ca, Mg, S, Fe, Cu, Mn, Zn, B, Mo): Sample digestion: Weigh 0.1–0.4 g dry sample (or 0.5–5 mL, accurate to 0.0001 g) into a PTFE digestion tank and soak overnight in 5 mL nitric acid. Seal with inner lid and stainless steel jacket, then place in an oven: 80 °C for 2 h, 120 °C for 2 h, 160 °C for 4 h. Cool naturally to room temperature, open, and heat to near dryness. Solution preparation: Wash the digestion solution into a 25 mL volumetric flask. Rinse the tank and lid three times with 1% nitric acid, combining the rinses in a flask. Dilute to mark with 1% nitric acid, mix well, and set aside. Measurement: Conduct a reagent blank test and measure the element content in the test solution using inductively coupled plasma mass spectrometry (ICP-MS) (NexION® 5000, Woodbridge, CT, USA). Calculate the content of female flowers based on the dilution ratio.

2.6. RNA Extraction and RNA-Sequencing (RNA-Seq)

Total RNA was extracted from frozen samples using an optimized cetyltrimethylammonium bromide (CTAB) protocol [32], which integrated the advantages of CTAB, LiCl precipitation, TRIzol, and phenol–chloroform–isopentanol methods [33]. This approach yielded high-quality RNA with improved integrity and quantity. RNA purity and integrity were assessed by agarose gel electrophoresis, and concentration was measured using a NanoDrop 2000 spectrophotometer (Thermo Fisher Scientific, Waltham, MA, USA). The Agilent 2100 Bioanalyzer System (Agilent Technologies, Palo Alto, CA, USA) was employed for precise RNA integrity quantification. Library construction and RNA-seq analysis were performed by Beijing Biomarker Biotechnology Company and Beijing Biomarker Cloud Technology Company (Beijing, China) [34]. The NEBNext® Ultra™ II RNA Library Prep Kit (New England Biolabs, Ipswich, MA, USA) was used to prepare libraries, with index codes added to distinguish samples. Sequencing was conducted on the Illumina HiSeq2500 platform (Illumina, San Diego, CA, USA) with three technical replicates per sample. Raw reads were processed to remove low-quality sequences and adapter contaminants. By using the HISAT2 program [35], clean sequences were aligned to the coconut reference genome (accession: http://creativecommons.org/licenses/by/4.0/, accessed on 3 March 2024) [36]. Gene functions were annotated through the following multiple databases: NCBI Non-Redundant Protein Sequence (Nr), Homologous Protein Cluster (COG/KOG), Swiss PROT Protein Sequence Database, Kyoto Encyclopedia of Genes and Genomes (KEGG), Homologous Protein Family (Pfam), and Gene Ontology (GO) [37,38]. Transcript expression levels were calculated as FPKM values using RESM software (v3.8.6) [39]. Differential gene expression analysis was performed with DESeq (v1.6.3), defining significant DEGs as those with |log2fold change (FC)| ≥ 1 and FDR < 0.01. The Benjamini–Hochberg method was applied for multiple testing correction [40]. GO enrichment analysis of DEGs was conducted using the GOseq R package (v2.18.0) [41,42,43]. KEGG pathway enrichment was analyzed using KOBAS software (v3.0) [44].

2.7. Metabolite Analysis

All experimental procedures, including sample preparation, metabolomic profiling, and data analysis, were conducted by Beijing Biomarker Biotechnology Co., Ltd. (https://www.biocloud.net/). Frozen coconut female flowers were ground into powder under liquid nitrogen. Subsequently, 100 mg of the powder was transferred into a 1.5 mL Eppendorf tube and extracted with 1.0 mL of 70% aqueous methanol at 4 °C for 24 h. The mixture was centrifuged at 10,000× g and 4 °C for 10 min. The supernatant was filtered through a 0.22 µm nylon membrane and subjected to liquid chromatography–mass spectrometry (LC-MS) analysis. To ensure analytical consistency, extracts from each treatment group were combined, and quality control (QC) samples were prepared by pooling three technical replicates. During analysis, each QC sample was measured alongside the corresponding experimental samples to validate system stability. Metabolite profiling was performed using an ultra-performance liquid chromatography–electrospray ionization tandem mass spectrometry (UPLC-ESI-MS/MS) system (Shimadzu). Chromatographic separation was achieved on a UPLC HSS T3 C18 column (2.1 mm × 100 mm, 1.8 µm; Waters, Milford, MA, USA) maintained at 40 °C. The mobile phase consisted of Phase A: Water with 0.04% acetic acid and Phase B: Acetonitrile with 0.04% acetic acid. A linear gradient elution program was applied: 0–11.0 min—5% to 95% B; 11.0–12.0 min—95% to 5% B; 12.0–15.0 min—5% to 5% B. The flow rate was maintained at 0.40 mL/min. LC-MS/MS analysis was conducted on an API 4500 QTRAP system (AB SCIEX, Framingham, MA, USA). The electrospray ionization (ESI) source parameters were as follows: Ion source—Turbine spray; Source temperature—550 °C; Ion spray voltage—5.5 kV; Curtain gas pressure—25 psi; Ion source gas 1 pressure—55 psi; Ion source gas 2 pressure—60 psi. Multiple reaction monitoring (MRM) experiments were performed using nitrogen as collision gas at 5 psi. Metabolite identification was performed using Beijing Biomarker’s proprietary cloud database (Beijing, China) [34], supplemented with public repositories including HMDB, MoToDB, MassBank, METLIN, and KNAPSAcK. Structural characterization followed standard metabolite analysis protocols, while quantification was achieved through MRM methods. Multivariate statistical analyses, including principal component analysis (PCA), partial least squares discriminant analysis (PLS-DA), and orthogonal PLS-DA (OPLS-DA), were employed to identify differentially accumulated metabolites (DAMs). Significant DAMs were selected based on the following criteria: Variable importance in projection (VIP) ≥ 1, fold change (FC) ≥ 2 (upregulated) or ≤0.5 (downregulated), statistical significance (p < 0.05).

2.8. Integrated Metabolome and Transcriptome Analyses

Pearson correlation tests were performed to assess the relationships between differentially expressed genes (DEGs) and differentially accumulated metabolites (DAMs). Pearson correlation coefficients (PCCs) were calculated using the “corrplot” function in R (version 4.0). Correlation heatmaps and networks were generated for gene–metabolite pairs with |PCC| > 0.8 and p < 0.05. To identify biologically meaningful associations, we compared KEGG pathways enriched in DEGs and DAMs (p < 0.05). Only DEGs and DAMs with significant correlations (p < 0.05) within the KEGG pathways were selected for further analysis and network visualization [45,46,47].

2.9. Quantitative Real-Time PCR (qRT-PCR) Analysis

To validate the differentially expressed genes (DEGs) identified by RNA-seq, we performed quantitative real-time PCR (qRT-PCR) using gene-specific primers (Table S1). Reactions were carried out on a QuantStudio™ 6 Flex system (Applied Biosystems, Carlsbad, CA, USA) with PowerUp™ SYBR™ Green Master Mix (Thermo Fisher Scientific, Waltham, MA, USA) following the manufacturer’s protocol. The thermal cycling program consisted of an initial denaturation at 95 °C for 5 min, followed by 40 cycles of 95 °C for 10 s and 60 °C for 30 s. Each qRT-PCR analysis was performed in triplicate (three biological replicates, each with three technical replicates). Expression levels were normalized to the internal reference gene (18S rRNA) and calculated using the 2−∆∆CT method [48].

2.10. Statistical Analysis

All data were analyzed using Excel (Microsoft (2020), Redmond, Washington, DC, USA). For statistical analysis, data = mean ± standard deviation (SD) of three biological replicates, and one-way ANOVA and Student’s t-test were performed using SPSS software (Version 20.0, SPSS, Chicago, IL, USA), with p < 0.05 indicating significant differences.

3. Results

3.1. Morphological Comparison in Coconut Female Flowers of NFF and MFF

According to the observation of fruit morphological characteristics, the volume (diameter = 3.24 cm) and weight (20.465 g) of female flowers in NFF were significantly larger than those in MFF (2.58 cm and 15.368 g) (Figure 1a–d). NFF female flowers had a kernel larger than MFF, and NFF had a positive “heart” shape with tightly packed tissue cells. Conversely, MFF had a skewed “heart” shape with loose tissue cells. As shown in Figure 1e,f, the female flower buds of NFF showed normal differentiation (with floral differentiation tissue), while the female flower buds of MFF did not show differentiation (without floral differentiation tissue). In the early stage of flower bud differentiation, the basal region of a normal inflorescence of female flowers begins to expand, and within the developing flower bud, heart-shaped bracts begin to layer (Figure 1e). Although the cells in the female flower buds of NFF still maintain a tight arrangement, the primordia gradually enlarge and undergo upward curling deformation. When entering the stage of petal primordium differentiation, the top of the developing floral meristem has a wavy surface, indicating that the differentiation of petal primordia has begun.

3.2. Nutrition Elements, Nutrients, Enzyme Activity, and Phytohormone Content in Coconut Female Flowers of NFF and MFF

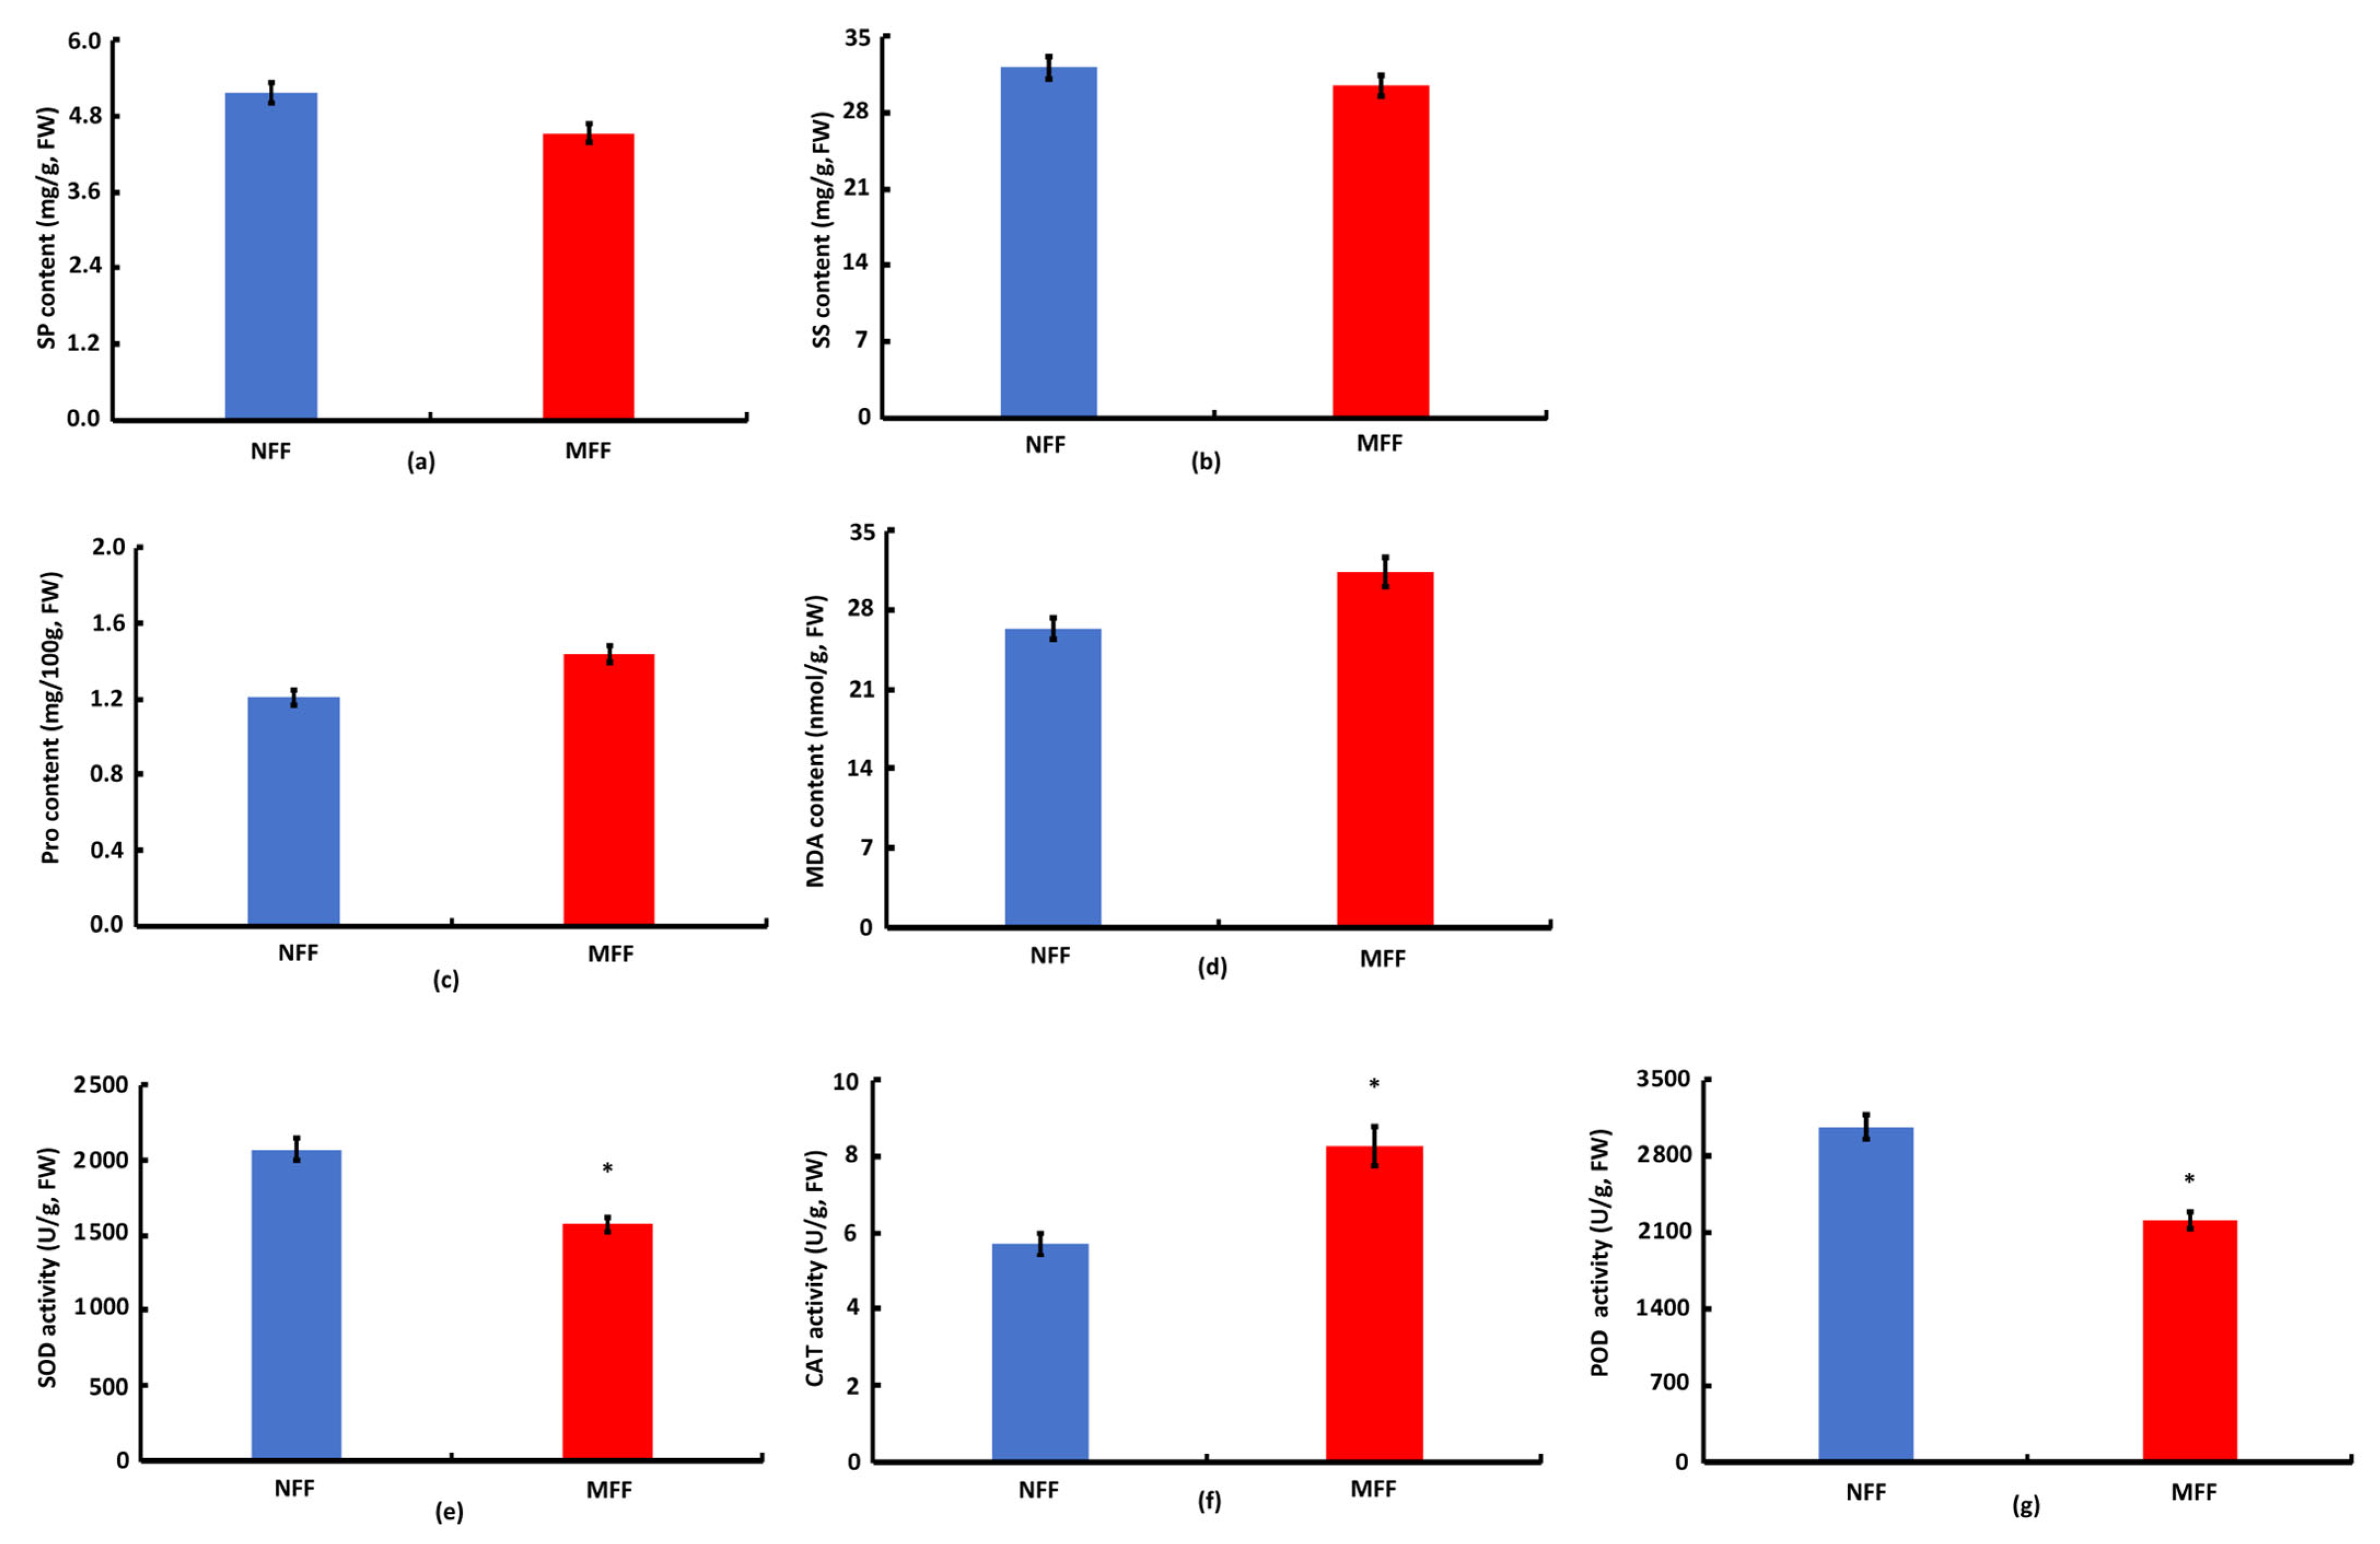
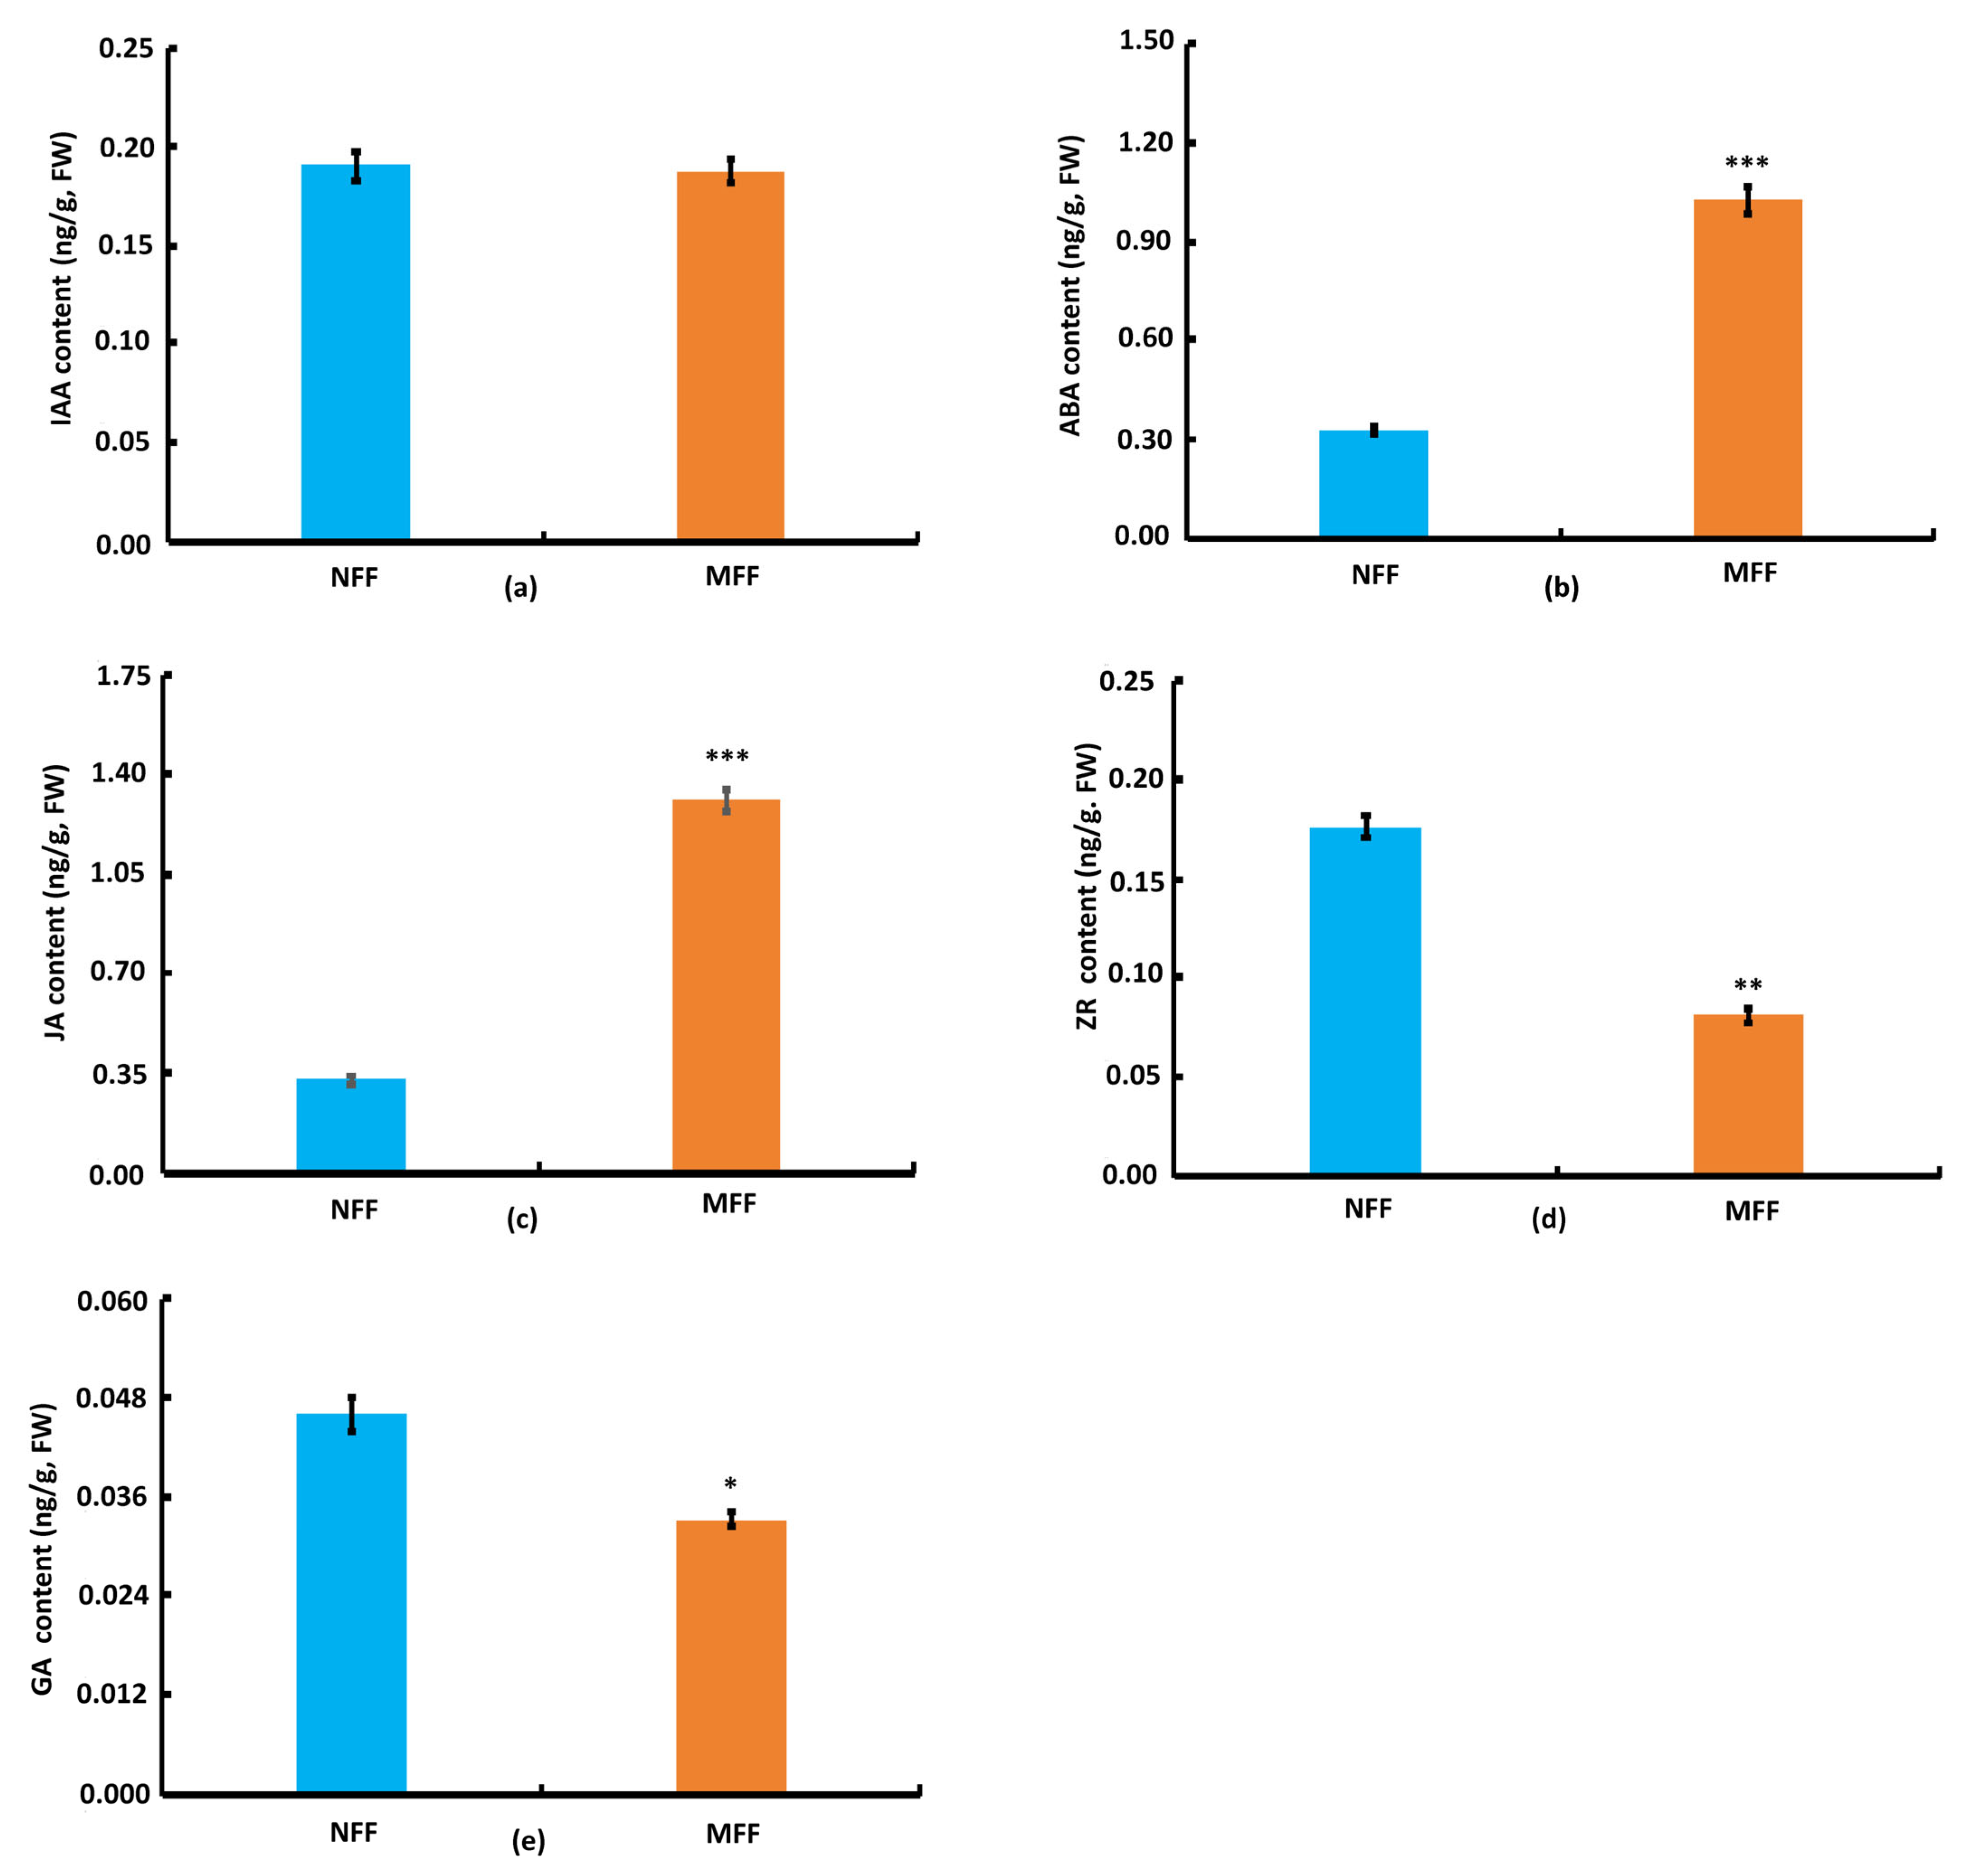
We measured the nutritional elements, nutrients, enzyme activity, and endogenous hormone content of female flowers in NFF and MFF. The results showed that the content of N, P, K, Ca, Mg, S, Fe, Cu, Zn, B, and Cl elements in MFF was higher than that in NFF, increasing by 41.84%, 21.28%, 26.02%, 25.68%, 14.53%, 34.56%, 183%, 16.85%, 22.30%, 15.51%, and 19.90%, respectively. Fe increased significantly (p < 0.01), while N, S, K, Ca, and Zn increased significantly (p < 0.05). However, the Mo content in MFF decreased significantly compared to NFF, reaching 46.86% (Table S2). The contents of SP, SS, SOD, and POD in MFF were lower than those in NFF, decreasing by 12.23%, 5.07%, 23.85%, and 27.75%, respectively, with SOD and POD showing the most significant decrease. Pro, CAT, and MDA content were higher than NFF, increasing by 18.85%, 44.56%, and 18.92%, respectively, with CAT significantly elevated (p < 0.05, Figure 2). The content of ABA and JA in MFF significantly increased (p < 0.001), by 212.32% and 300%, respectively. However, the content of IAA, ZR, and GA in MFF decreased, by 1.60%, 54.01%, and 27.94%, respectively, with ZR (p < 0.01) and GA significantly decreasing (p < 0.05, Figure 3). The above results indicate that the changes in nutrient elements, nutrients, enzyme activity, and endogenous hormone content of female flowers may be inevitably related to the occurrence of multiple female inflorescences in coconut.

3.3. Transcriptome Analysis in Coconut Female Flowers of NFF and MFF

3.3.1. Transcriptome Assessment

To investigate the gene expression profile changes of NFF and MFF, we conducted RNA-seq analysis. Under three biological replicates, RNA-seq of six female flower samples produced a total of 41.28 Gb of clean bases. The clean bases of each sample reached 5.90 Gb, and the Q30 base percentage was 93.91%–95.73% (Table S3). These clean reads were compared to the reference genome, with a matching rate ranging from 93.91% to 95.73% (Table S4). We identified 24,642 genes, of which 4340 were novel genes, significantly enriching the genome annotation information of coconut female flowers (Table S5). Based on the number of exon fragments per kilobase (FPKM), the FPKM values of MFF samples are relatively scattered (Figure S1a). We used Spearman’s correlation coefficient as an evaluation metric for biological repeat correlation, which further revealed the high correlation between all samples (Figure S1b). Principal component analysis (PCA) showed that the biological replicates of each variety were tightly clustered, indicating that the sequencing data has high reliability. However, this study found good separation between NFF and MFF (Figure S1c).
To identify DEGs between two samples and perform functional analysis, this study used a threshold of adjusted p-value < 0.01 and |log2FC| > 1 for DEGs screening. In the NFF vs. MFF comparison group, a total of 445 DEGs were found (262 upregulated and 183 downregulated) (Figure S1d, Table S6), and 324 DEGs were annotated (199 upregulated and 125 downregulated) (Table S7). Figure S2a shows the volcano plot of the differential changes and significance of gene expression levels between NFF and MFF treatments. Hierarchical clustering analysis showed that NFF or NFF biological duplicate samples had genes with the same or similar expression patterns, while samples between NFF and MFF had genes with different expression patterns (Figure S2b).

3.3.2. Gene Ontology (GO) Annotation and Enrichment Analysis of the DEGs

To obtain functional information of DEGs, we annotated and classified them using the GO database. This database is divided into three advanced categories: molecular function (MF), cellular components (CC), and biological processes (BP). To characterize the functional distribution characteristics of genes, we determined the functional distribution of DEGs in NFF vs. MFF through GO enrichment analysis. There were 269 DEGs with GO annotations (Table S8). In terms of BP, the category with the highest enrichment and number of DEGs in the NFF vs. MFF comparison group is “metabolic processes”, followed by “cellular processes”. In terms of MF, “catalytic activity” is the most representative GO term in the NFF vs. MFF comparison group, followed by “binding” function. On the CC, the categories with significantly enriched and the highest number of DEGs in the NFF vs. MFF comparison group were “cellular anatomical entities” and “intracellular” (Figure S2c).
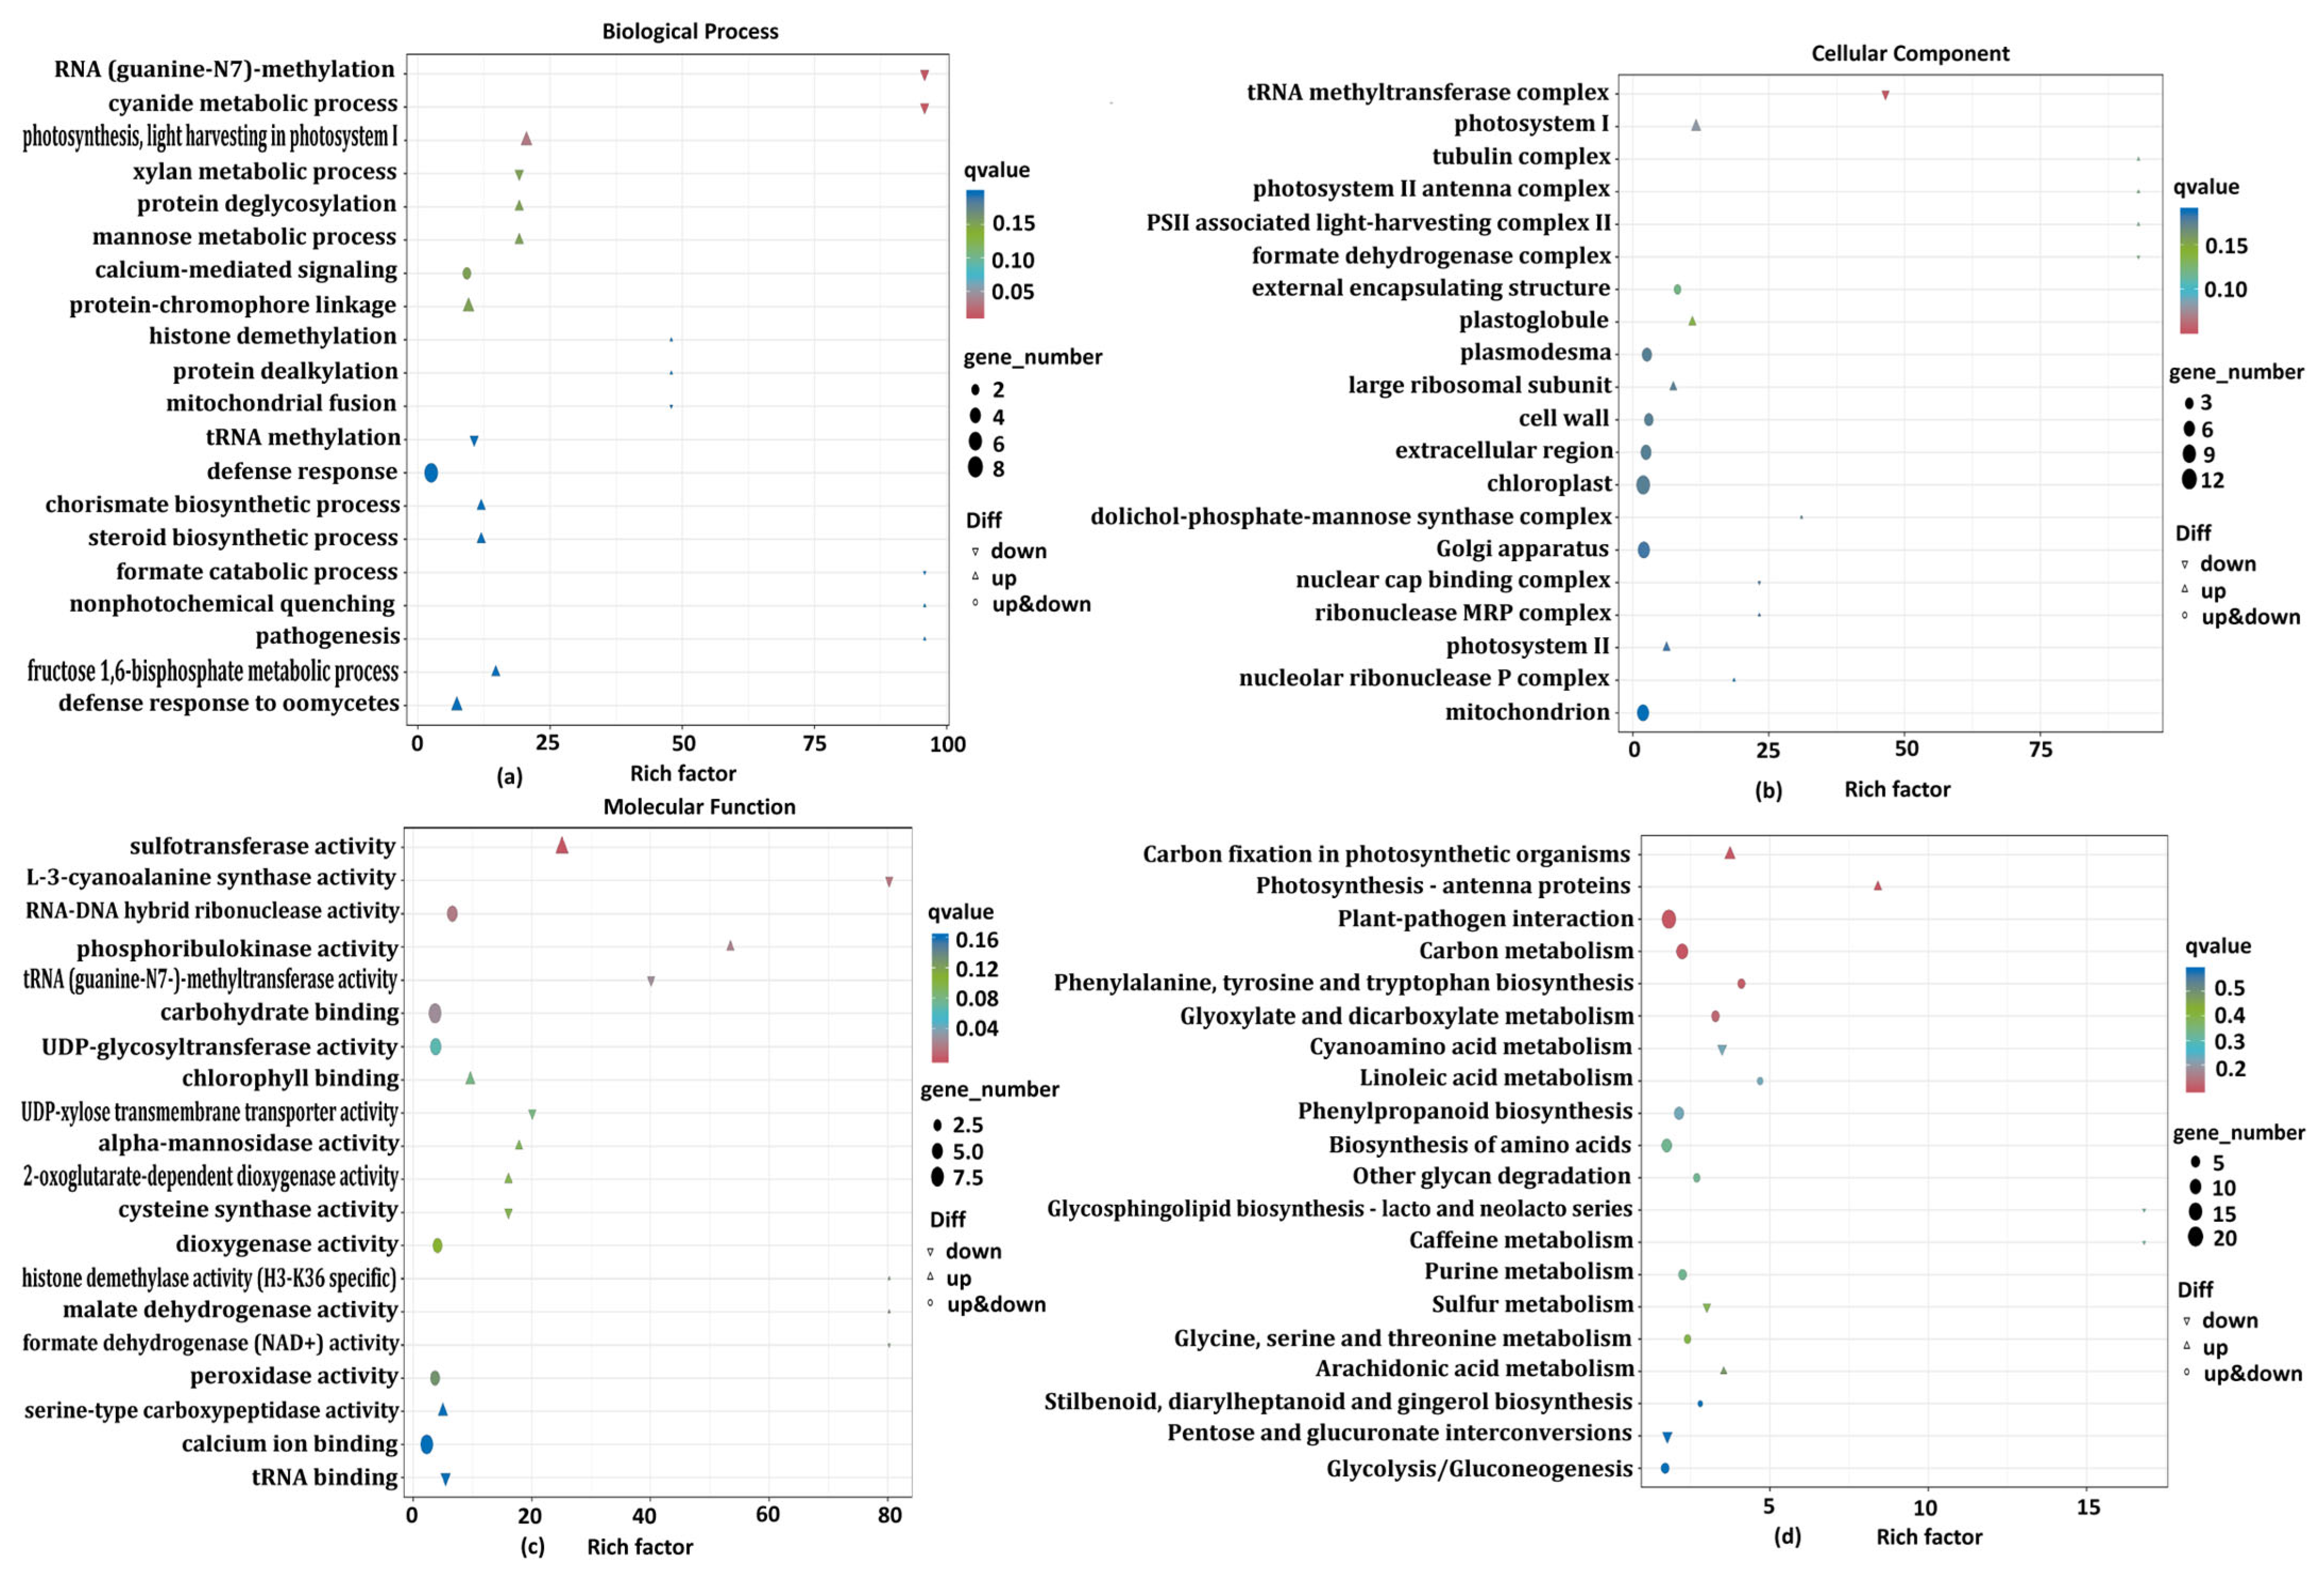
In order to classify the functions of DEGs, enrichment analysis of DEGs annotated GO pathway gene functions showed (p-value < 0.01), in the BP, the DEGs of “cyanide metabolic process”, “RNA (guanine-N7)-methylation”, “photosynthesis, light harvesting in photosystem I”, “protein–chromophore linkage”, “calcium-mediated signaling”, “mannose metabolic process”, “protein deglycosylation”, “xylan metabolic process”, “defense response to oomycetes” and “fructose 1,6-bisphosphate metabolic process” pathways were significantly enriched (Figure 4a, Table S9).
In the CC category, DEGs of “tRNA methyltransferase”, “complex”, “photosystem I”, and “external encapsulating structure” pathways were significantly enriched (Figure 4b, Table S9).
In the MF category, the DEGs enriched in GO pathways mainly included “sulfotransferase activity”, “L-3-cyanoalanine synthase activity”, “RNA-DNA hybrid ribonuclease activity”, “phosphoribulokinase activity”, “carbohydrate binding”, “tRNA (guanine-N7-)-methyltransferase activity”, “UDP-glycosyltransferase activity”, “chlorophyll binding”, “UDP-xylose transmembrane transporter activity”, “alpha-mannosidase activity”, “cysteine synthase activity”, “2-oxoglutarate-dependent dioxygenase activity” and “dioxygenase activity” (Figure 4c, Table S9).

3.3.3. KEGG Annotation and Enrichment Analysis of DEGs

We utilized the KEGG database to classify the DEGs of female flowers from the NFF vs. MFF comparison group into KEGG pathways and performed functional enrichment analysis. A total of 236 DEGs were successfully annotated to KEGG pathways (Table S8). In the NFF vs. MFF comparison group, the “Metabolism” category was associated with the majority of the pathways and the DEGs. Among these, the highest number of DEGs were annotated under “carbon metabolism”, followed by “biosynthesis of amino acids”, “phenylpropanoid biosynthesis”, “carbon fixation in photosynthetic organisms”, “glyoxylate and dicarboxylate metabolism”, “purine metabolism”, “glycolysis/gluconeogenesis”, and “starch and sucrose metabolism”. This indicates that the genetic differences between MFF and NFF are primarily reflected at the carbohydrate metabolism level. In the “genetic information processing” category, the highest number of DEGs were annotated under “protein processing in endoplasmic reticulum”. In the “environmental information processing” category, the MAPK signaling pathway-plant was the most representative and involved the largest number of DEGs, followed by “plant hormone signal transduction”. In the “organismal system” category, the most representative and densely annotated pathway was “plant–pathogen interaction” (Figure S2d).
Through KEGG annotation analysis, relevant metabolic pathways were identified from biochemical metabolic pathways and other aspects. Subsequently, to investigate whether there were significant differences in DEGs on specific pathways, we conducted pathway enrichment analysis on DEGs (Table S10) and selected the 20 most important enrichment pathways which are displayed in Figure 4d. The research results showed that in the NFF vs. MFF comparison group, DEGs were most significantly enriched in “carbon metabolism”, “plant-pathogen interaction”, “photosynthesis–antenna proteins”, “carbon fixation in photosynthetic organisms”, “phenylalanine, tyrosine and tryptophan biosynthesis”, “glyoxylate and dicarboxylate metabolism” (p-value < 0.01), followed by “phenylpropanoid biosynthesis”, “linoleic acid metabolism” and “cyanoamino acid metabolism”. In addition, in the top 20 enriched pathways, “biosynthesis of amino acids”, “purine metabolism” and “glycolysis/gluconeogenesis” pathways had a relatively large number of DEGs. This result showed that changes in gene expression levels of DEGs in these pathways have a critical impact on the production of multiple female inflorescences in coconut.

3.3.4. DEGs Related to Phytohormones

To determine the expression and regulation of various plant hormone related genes in NFF and MFF female flowers of coconut, this study obtained ABA (10), ethylene (2), BR (1), JA (1) of plant hormone signaling pathways with DEGs, as shown in Figure 5 and Table S7. In the ABA pathway, two DEGs related to probable protein phosphatase 2C (At2g30020 and PP2C06) were upregulated. Five out of eight DEGs related to serine/threonine-protein kinase were upregulated; the two DEGs encoding LECRK1 and At3g47570 were significantly upregulated. But three out of eight DEGs related to serine/threonine-protein kinase were downregulated. The bidirectionality of gene expression in the ABA signaling pathway indicates the complexity of its regulatory mechanism on the occurrence of multiple inflorescences in coconut. In the ethylene pathway, two DEGs related to ethylene were upregulated, with one DEG encoding ERF118 significantly upregulated. In the BR pathway, one DEG encoding XTHB related to probable xyloglucan endotransglucosylase/hydrolase protein B were significantly downregulated. In the JA pathway, one DEG encoding protein TIFY9 was significantly upregulated (Figure 5a–d).

3.3.5. Transcription Factors

Transcription factors may also play an important role in the development of coconut flowers. We analyzed the differential expression of transcription related genes to determine the transcription related factors involved in the occurrence of multiple female inflorescences in coconut (Figure 5e). In NFF vs. MFF, we identified five transcription regulatory genes with differential expression, including bHLH137, BHLH062, MYB (CSA), ERF118, and MADS2 transcription factors in significant up-regulation; this result suggests that these transcription factors may play a key role in the occurrence of multiple female inflorescences in coconut.

3.3.6. Validation of DEGs Through qRT-PCR Analysis

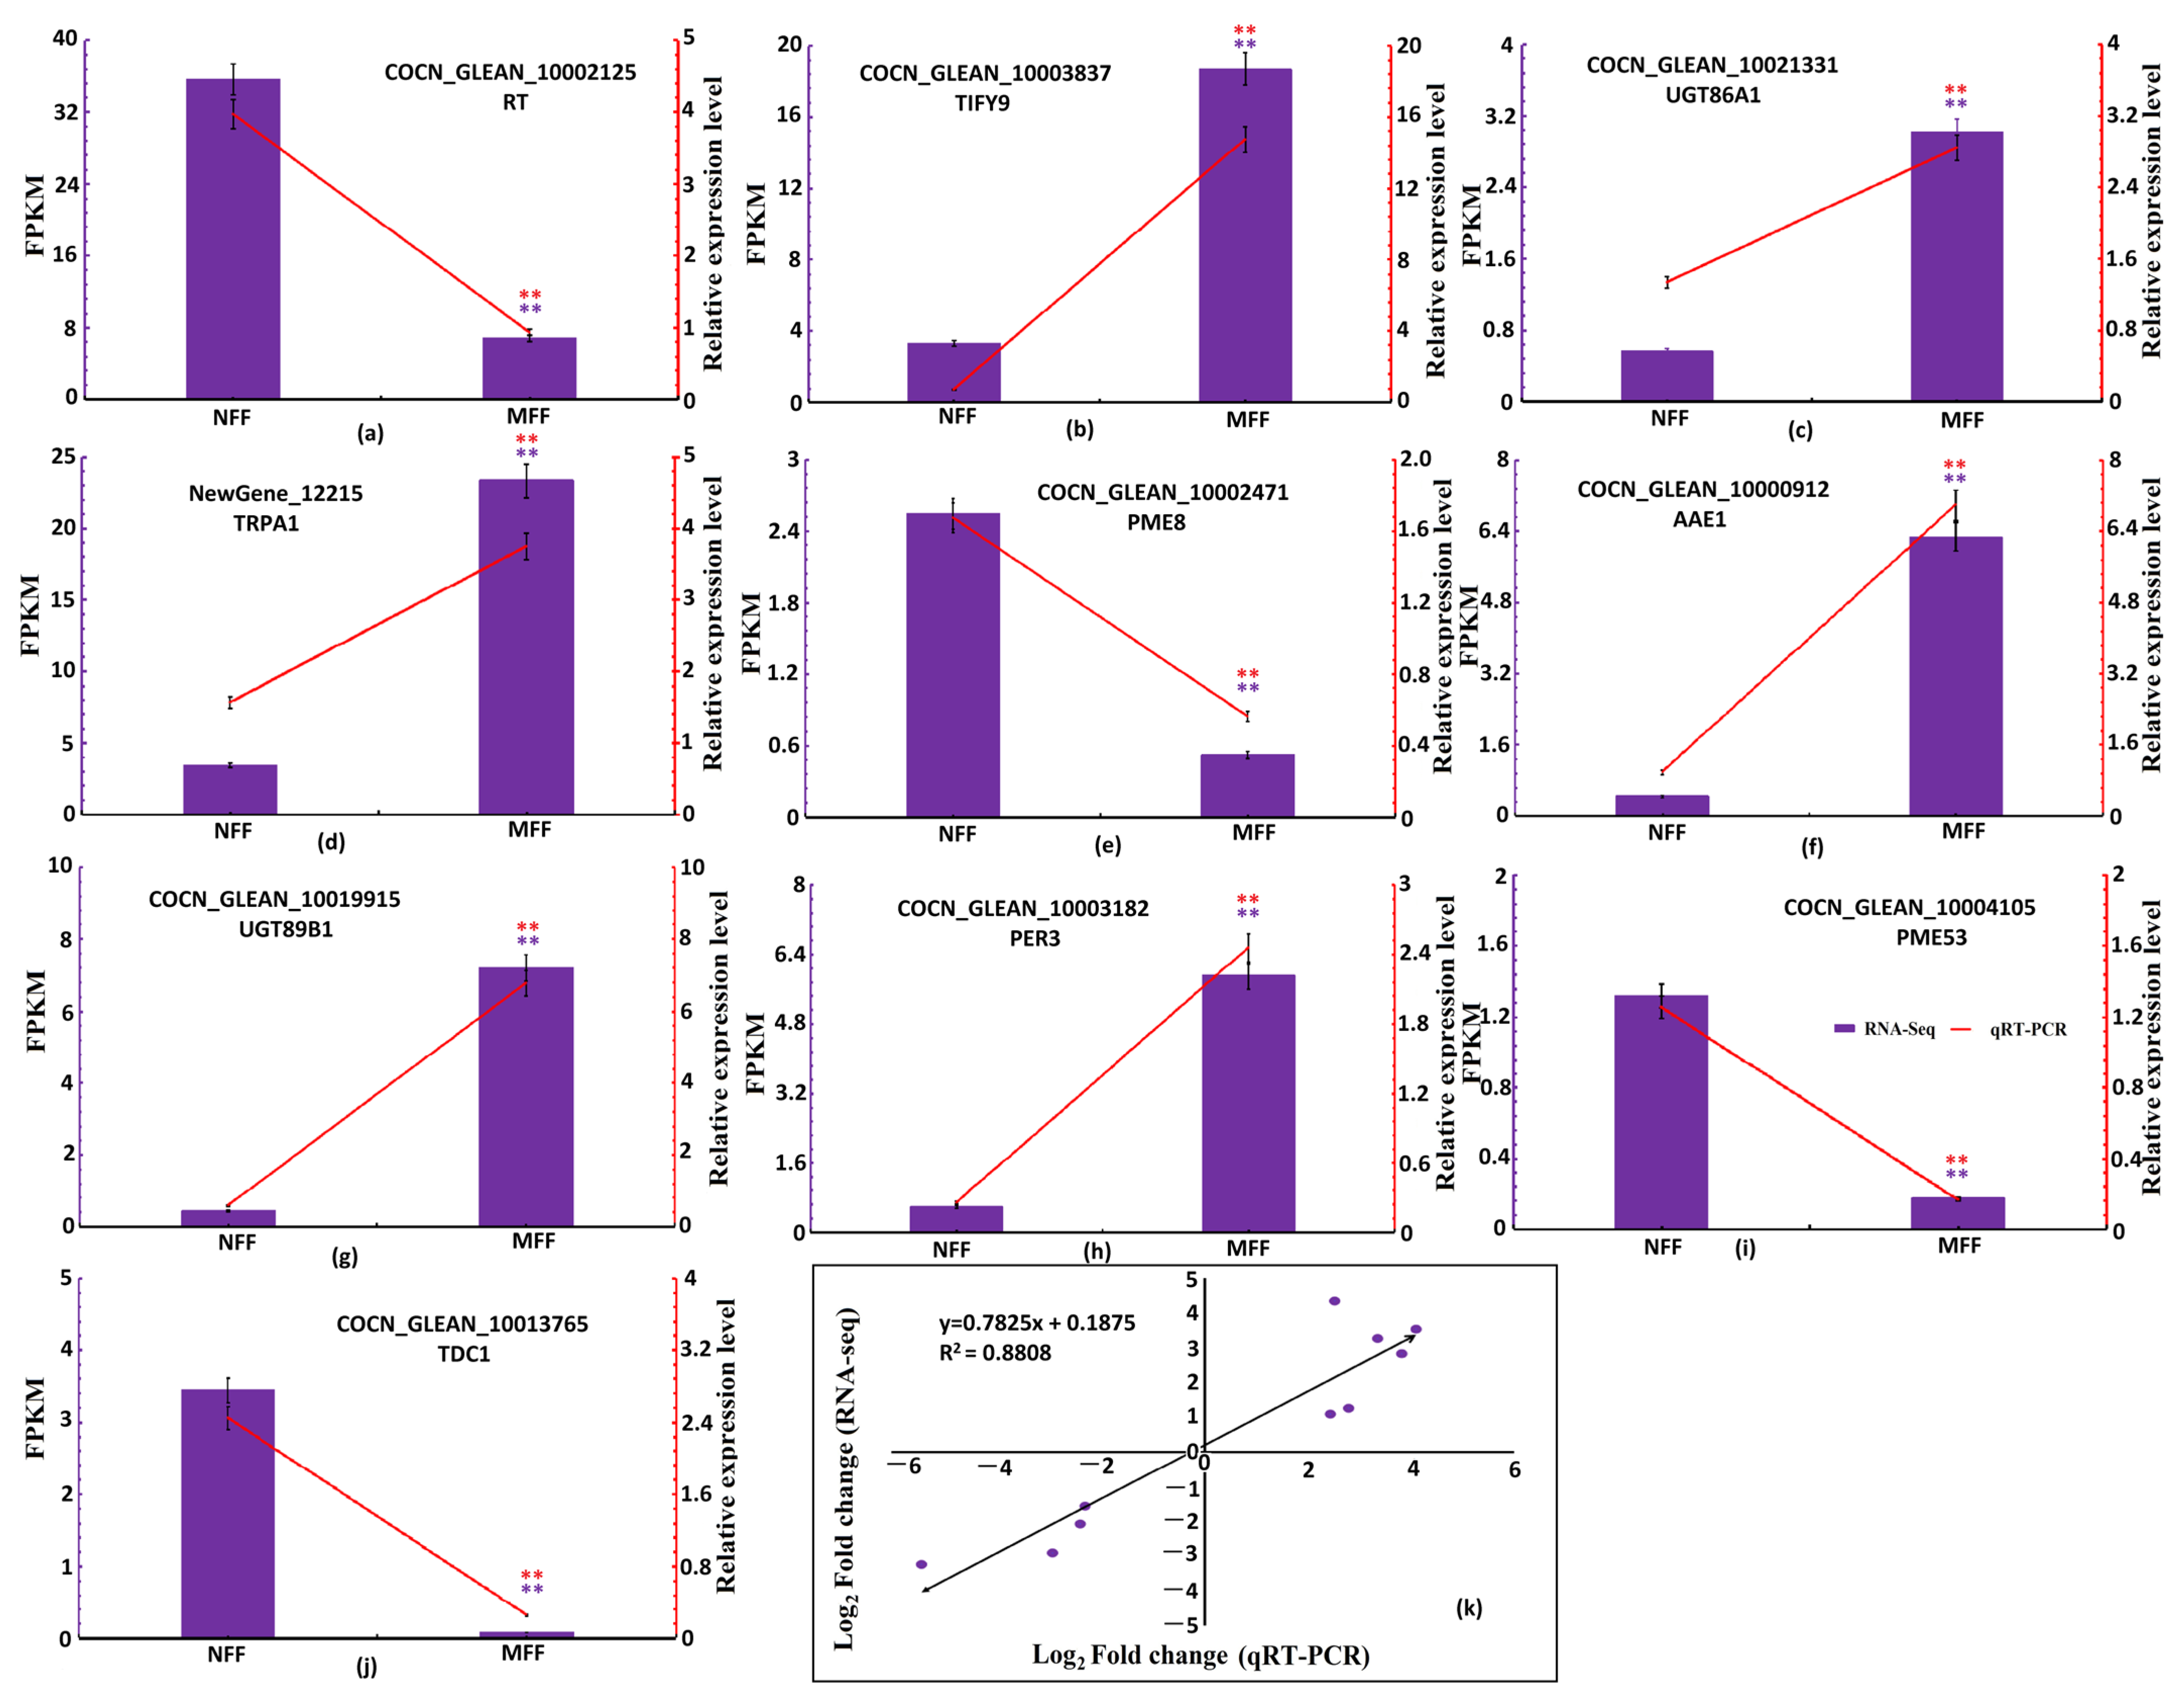
To confirm the gene expression results obtained from RNA-seq data, we selected 10 DEGs related to major enriched metabolic pathways for qRT-PCR (Table S1). These DEGs are mainly involved in flavonoid and flavonoid biosynthesis (RT); plant hormone signal transduction jasmonic acid (TIFY9), glycolysis/gluconeogenesis, carbon fixation in photosynthetic organisms and carbon metabolism (UGT86A1 and AAE1), phenylpropanoid biosynthesis (UGT89B1 and PER3), phenylalanine, tyrosine and tryptophan biosynthesis (TRPA1), pentose and glucuronate interconversions (PME8 and PME53), and tyrosine metabolism (TDC1). In NFF vs. MFF, TIFY9, UGT86A1, TRPA1, AAE1, and UGT89B1 were significantly upregulated, while RT, PME8, PER3, PME53, and TDC1 were significantly downregulated. These DEGs may be involved in the occurrence of multiple female inflorescences in coconut. According to the results of RNA-seq and qRT-PCR, the expression trends of these 10 DEGs are similar, with a linear trend at R2 = 0.8808, indicating the accuracy of transcriptome analysis (Figure 6).

3.4. Metabolome Analysis in Coconut Female Flowers of NFF and MFF

3.4.1. Metabolomics Characterization

There were multiple metabolite differences between NFF and MFF. This study analyzed the metabolite composition of female flowers in NFF and MFF through untargeted metabolomics to compare their compositional differences. First, the biological repeatability between samples within the group was evaluated through inter sample correlation analysis, and the square of the Spearman rank correlation coefficient was used as the biological repeatability correlation evaluation index. From Figure S3a,b, it can be seen that the R2 values of the QC samples are all greater than 0.99, indicating good instrument stability. The R2 values of each group of samples were also greater than 0.81, indicating the reliability of the differential metabolites obtained. This indicates that the sample has good reproducibility and can therefore be used for subsequent metabolomics data analysis.
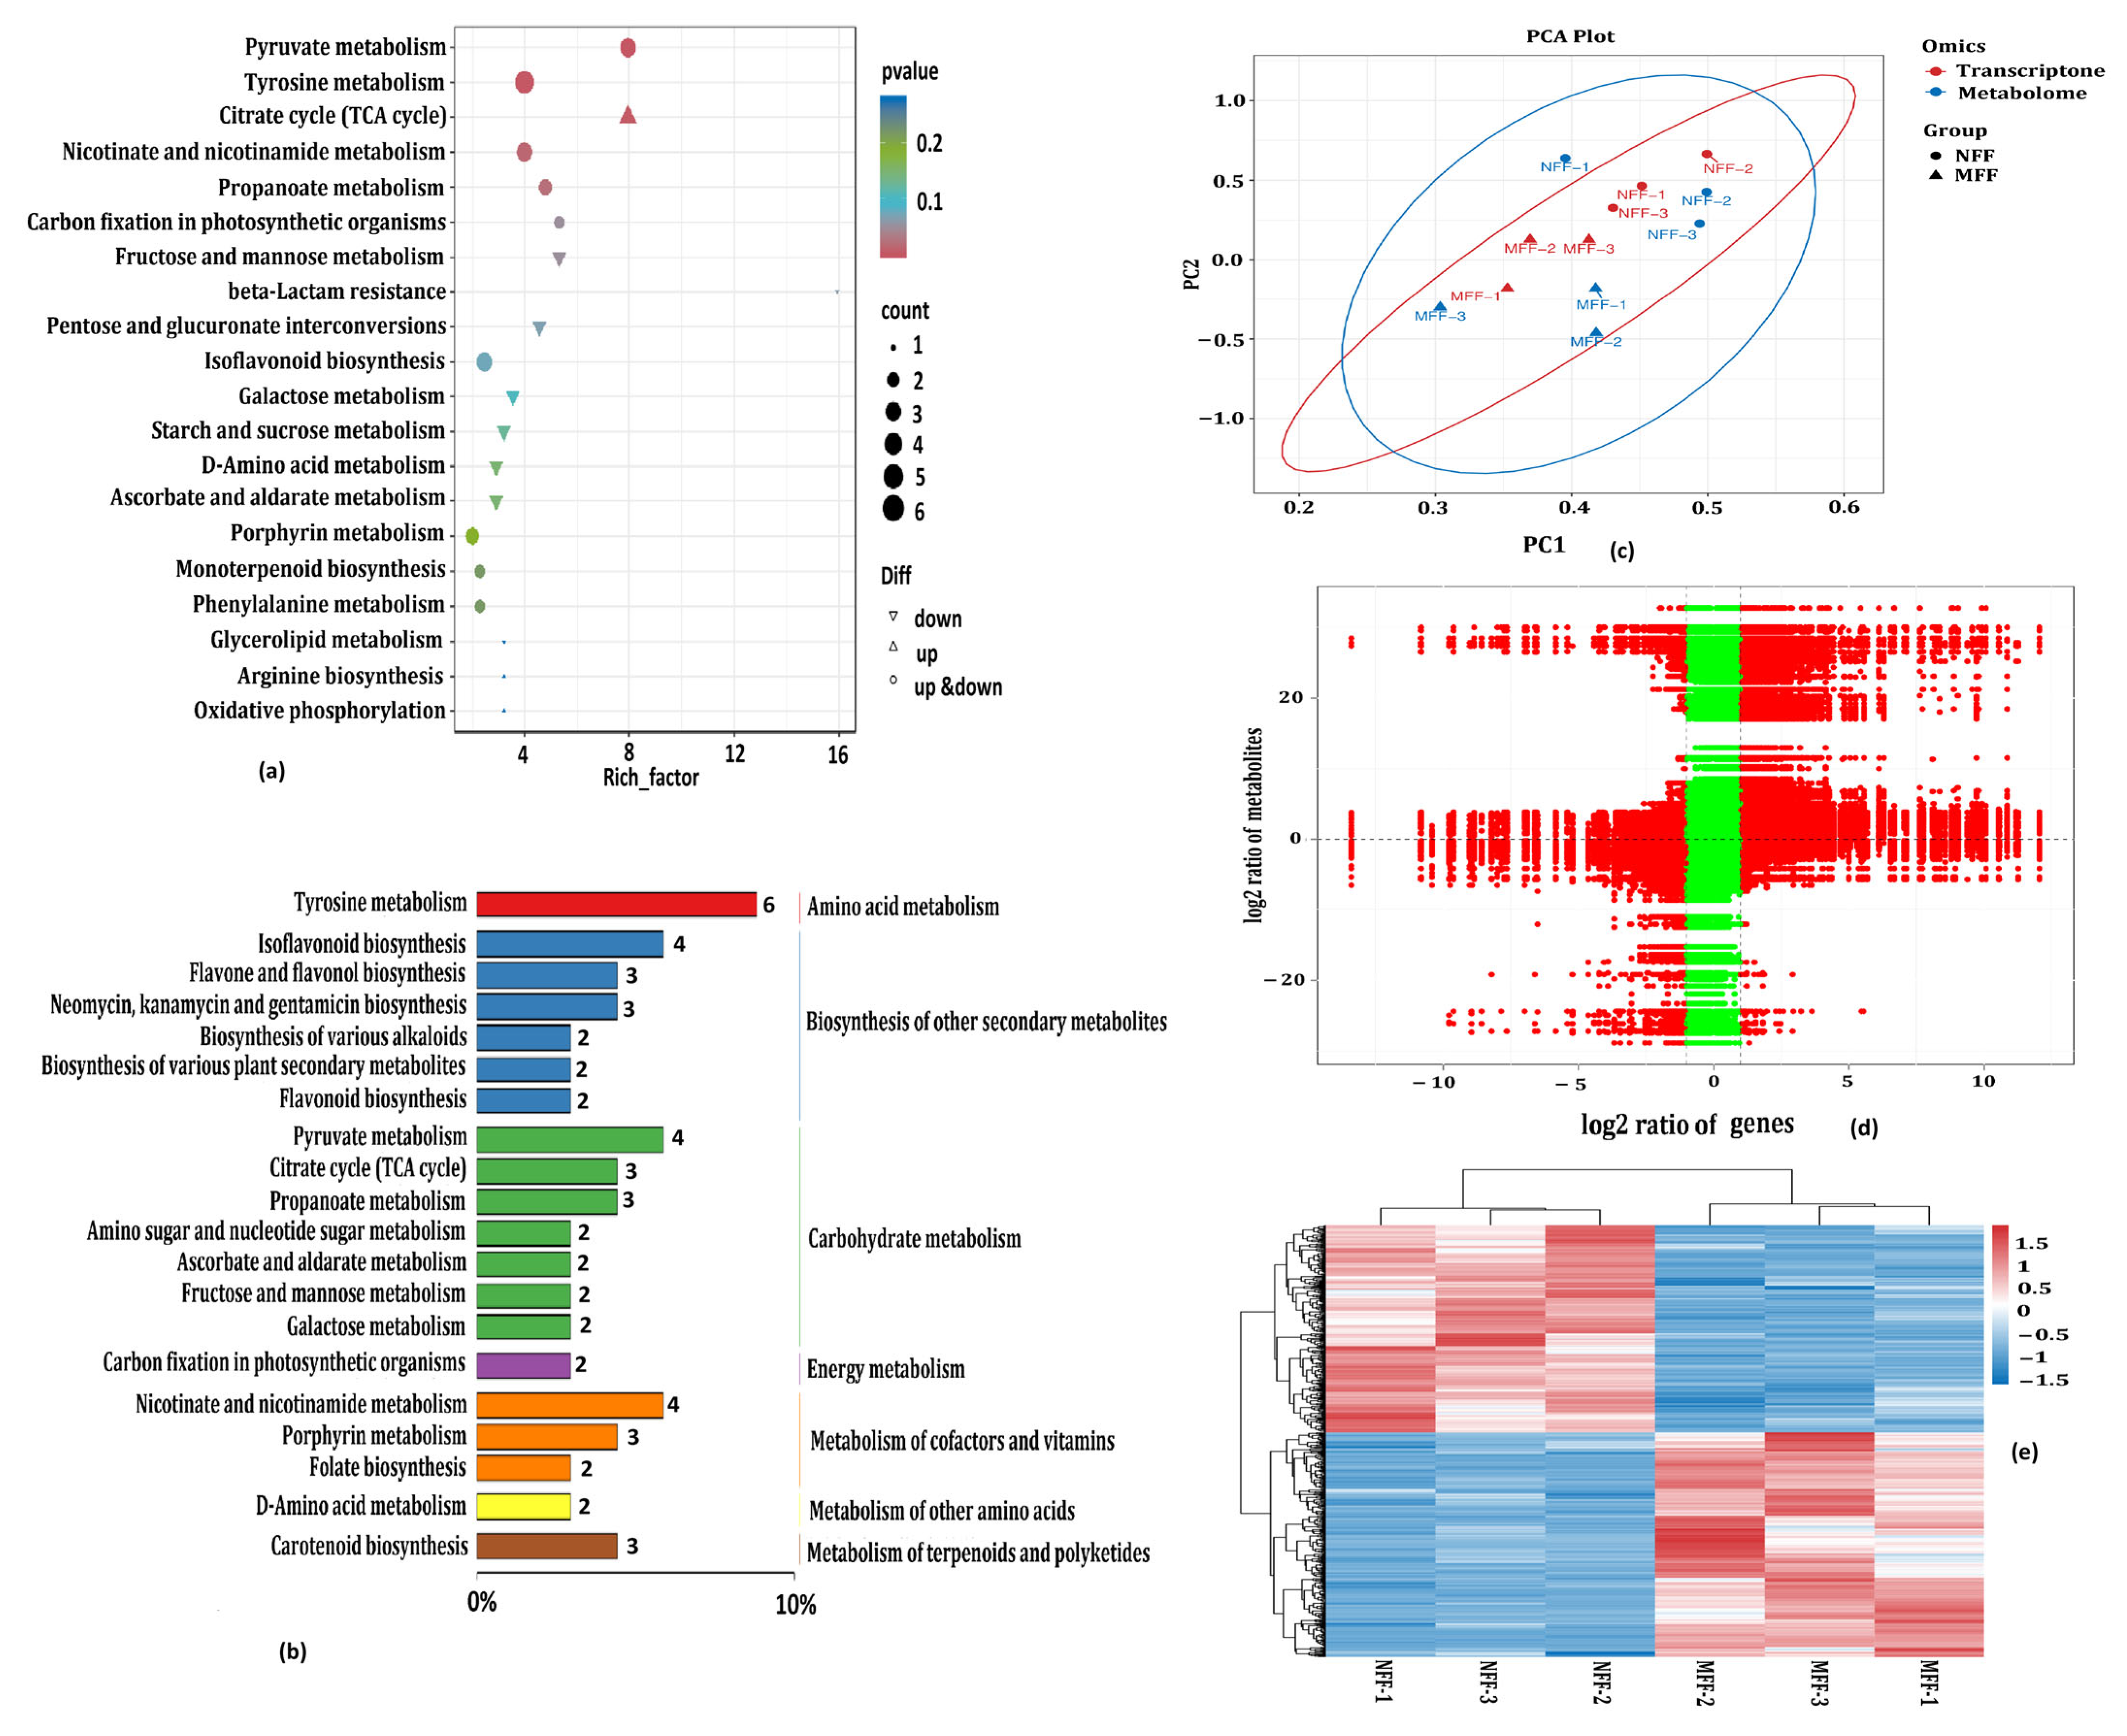
Based on principal component analysis (PCA) of NFF and MFF female flowers, all biological replicates were clustered together, indicating that our metabolite data is highly reliable (Figure S3c). The contribution rates of PC1 and PC2 are 39.11% and 21.86%, respectively, and they can explain 60.97% of the total variation of the data cumulatively. In the inter group comparison, the scatter plot of PCA scores showed significant differences between NFF and MFF; the focus will be on the similarities and differences in metabolites between the two in the future. This is consistent with the results of transcriptomic analysis. This phenomenon also suggests that changes in metabolite accumulation in coconut female flowers are closely related to differential gene expression.
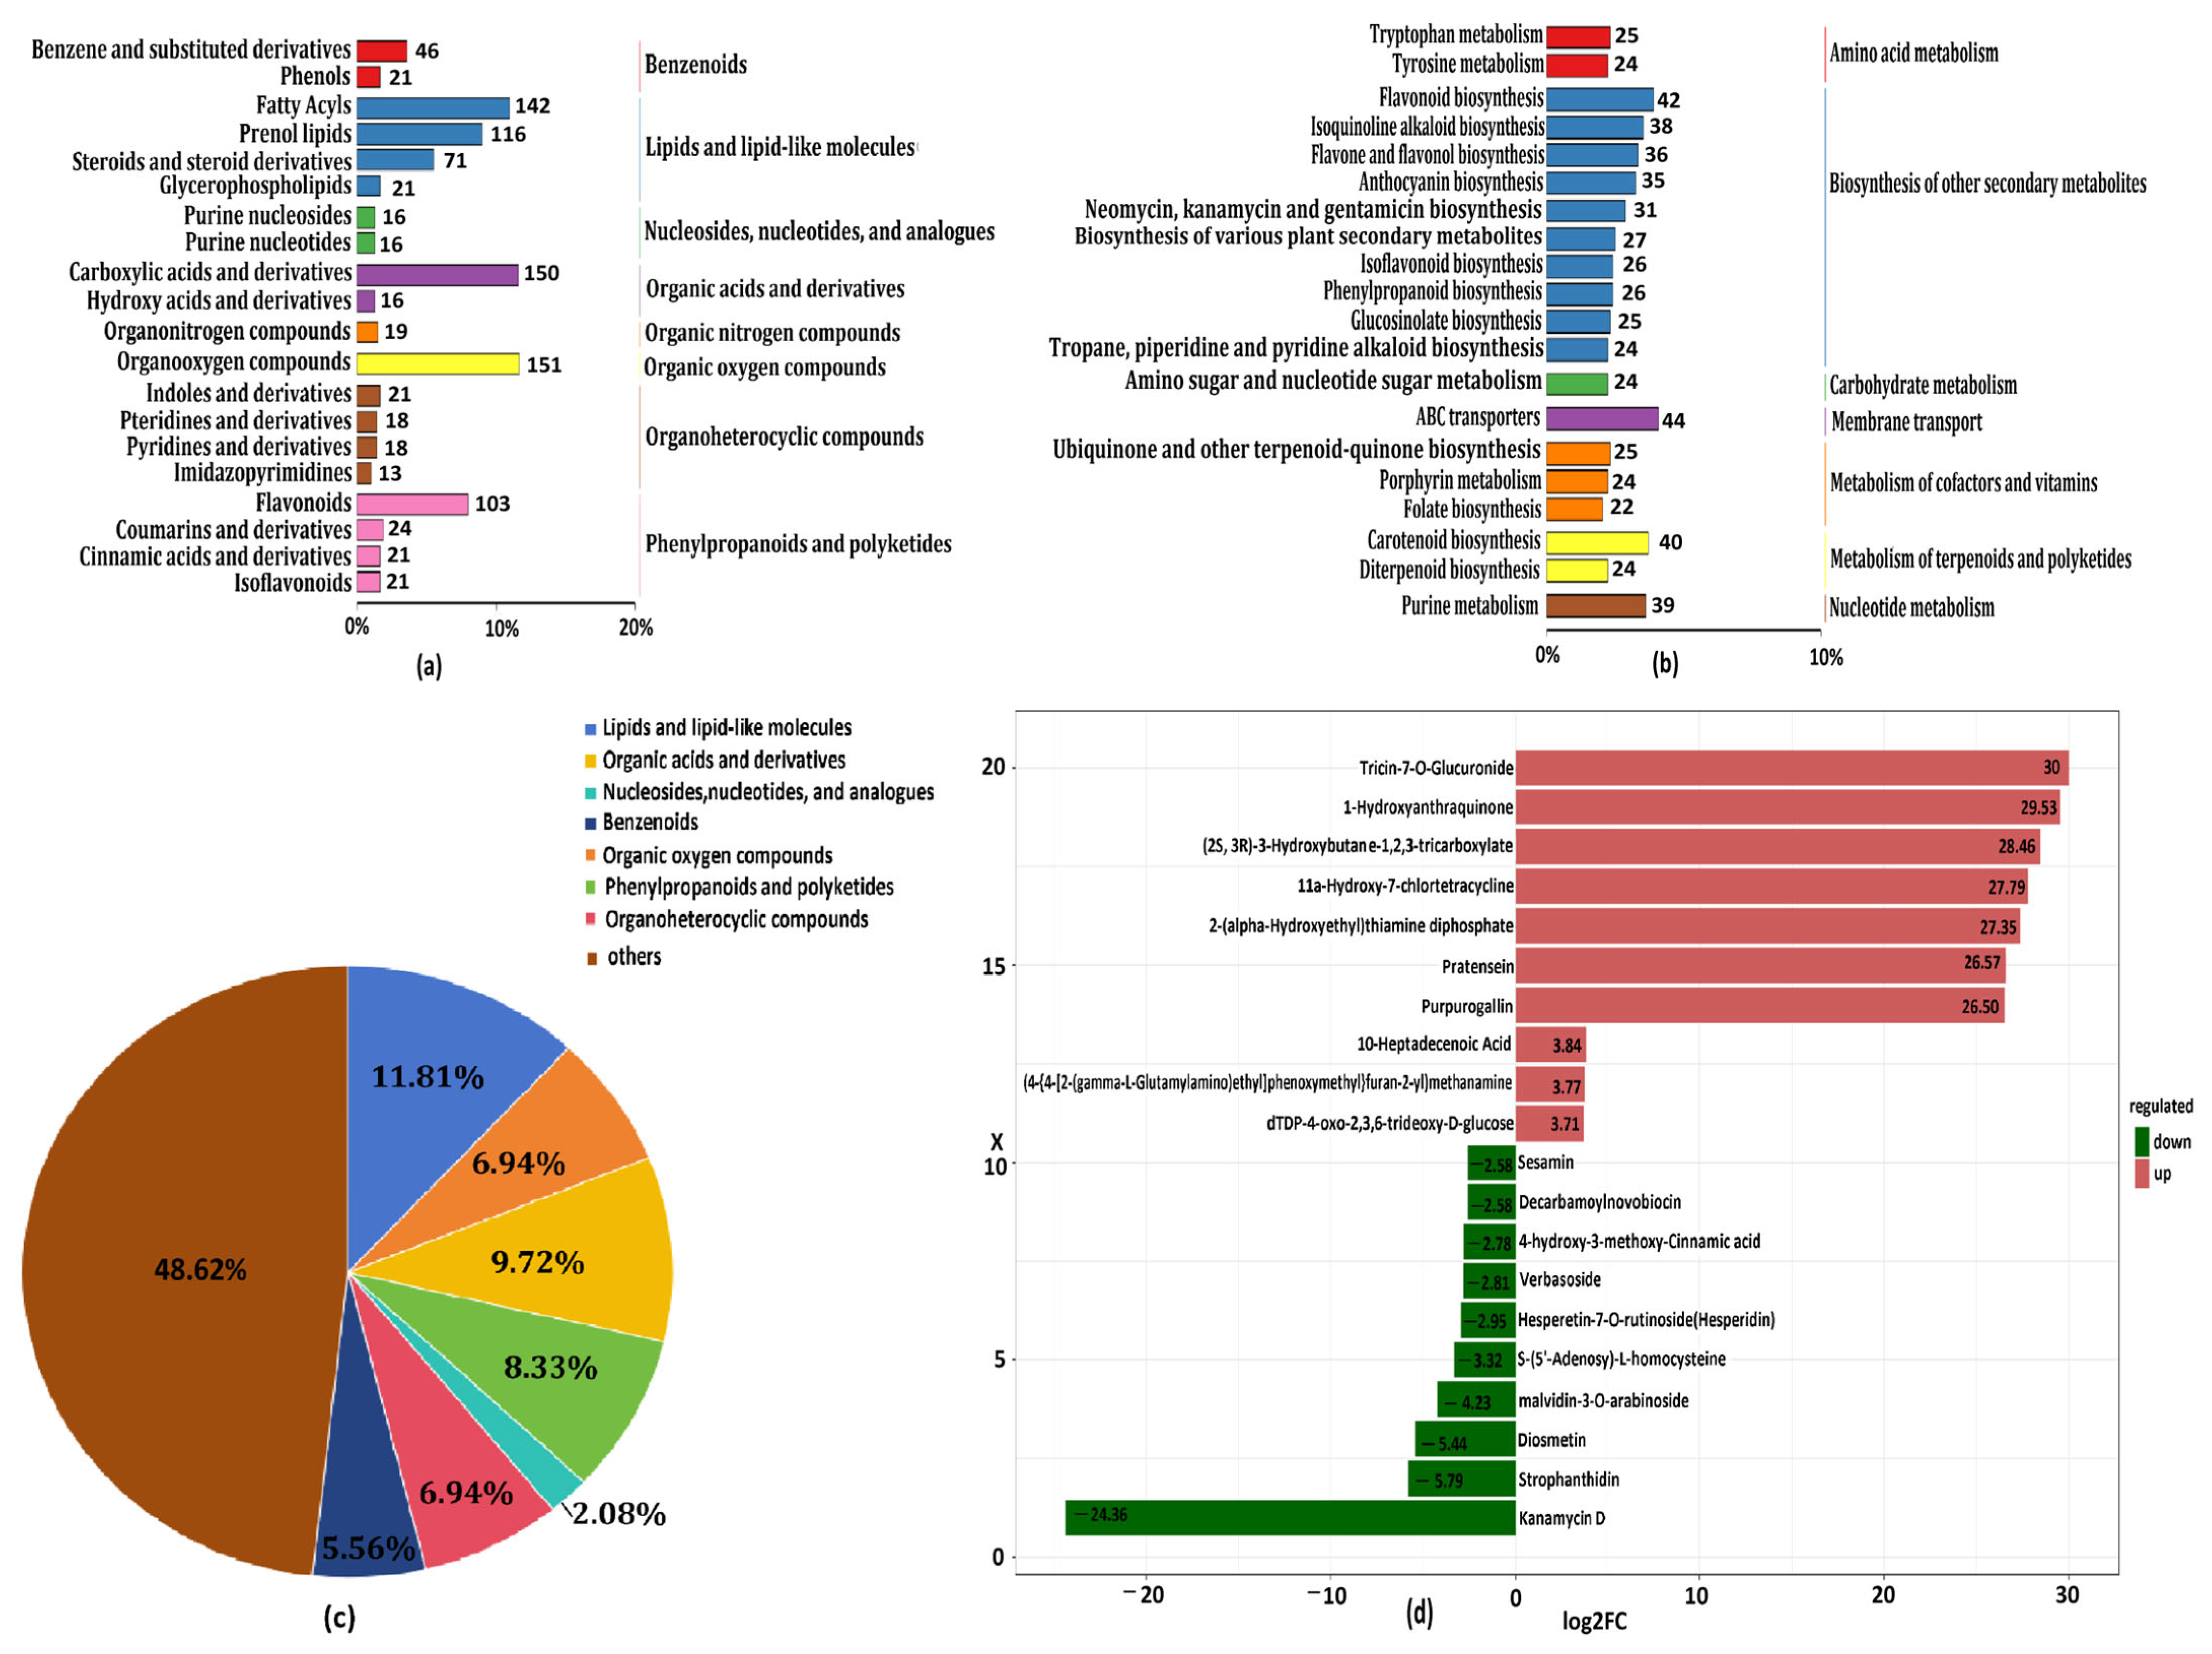
A total of 2687 metabolites were identified in the female flowers of NFF and MFF, with 1295 metabolites classified into 14 distinct categories (Table S11). The following metabolite categories exhibited higher compound counts: lipids and lipid-like molecules (366, 28.26%); phenylpropanoids and polyketides (205, 15.83%); organic acids and derivatives (198, 15.29%); organo-heterocyclic compounds (169, 13.05%); organic oxygen compounds (151, 11.66%); benzenoids (85, 6.56%); nucleosides, nucleotides, and analogues (71, 5.48%); and organic nitrogen compounds (19, 1.47%) (Figure 7a, Table S12). Additionally, 1083 metabolites were annotated in the KEGG database (Table S13). To understand the metabolic pathways, we selected the top 20 metabolite categories with the highest annotation information from the KEGG annotation database for analysis (Figure 7b). The study revealed that metabolites were primarily annotated to the following pathways: “ABC transporters (44, 4.06%)”, “flavonoid biosynthesis (42, 3.88%)”, “carotenoid biosynthesis (40, 3.69%)”, “purine metabolism (39, 3.6%)”, “isoquinoline alkaloid biosynthesis (38, 3.51%)”, “flavone and flavonol biosynthesis (36, 3.32%)”, and “anthocyanin biosynthesis (35, 3.23%)”.

3.4.2. Differentially Accumulated Metabolites (DAMs) Analysis

Based on the criteria of VIP > 1, fold change (FC) ≥ 1 (upregulated) or <1/2 (downregulated), and p value < 0.05, we determined the DAMs of the NFF vs. MFF comparison group. Clustering heatmap and volcano plot analysis showed a significant number of DAMs between the NFF and MFF, including 144 (55 upregulated and 89 downregulated) DAMs (Table S14, Figure S3d,e). These DAMs can be divided into eight different categories (Figure 7c), such as lipids and lipid-like molecules (17, 11.81%); phenylpropanoids and polyketides (12, 8.33%); organic acids and derivatives (14, 9.72%); organo-heterocyclic compounds (10, 6.94%); organic oxygen compounds (10, 6.94%); benzenoids (8, 5.56%); nucleosides, nucleotides, and analogues (3, 2.08%); and others (70, 48.62%). To further elucidate the accumulation patterns of DAMs in NFF and MFF, the K-means clustering algorithm for analysis obtained a total of three categories by detecting all DAMs (Figure S3f). The contents of five candidate metabolites in the first category showed a decreasing trend, including arecatannin A2 (neg_2245), pinocembrin-7-O-glucoside (neg_592), D-arabitol(neg_744), camptothecin (neg_761), 3-hydroxyisovalerate (pos_2318). However, the content of one candidate metabolite, nostoxanthin (pos_7141), showed an upward trend, while the third metabolite, adonixanthin(pos_7326), showed an upward trend in the comparison between NFF and MFF. The second category of 138 candidate DAMs metabolites showed an upregulation, downregulation, and plateau trend in NFF vs. MFF, with 24 DAMs significantly upregulated and 16 DAMs significantly downregulated (|log2FC| > 2). Notably, the top 10 metabolites with upregulated expression were tricin-7-O-glucuronide (neg_2811), 1-hydroxyanthraquinone (neg_2645), (2S, 3R)-3-hydroxybutane-1,2,3-tricarboxylate (neg_2635), 11a-hydroxy-7-chlortetracycline (neg_1886), 2-(alpha-hydroxyethyl) thiamine diphosphate (neg_2759), pratensein (neg_2703), purpurogallin (neg_2755), 10-heptadecenoic acid (neg_3641), (4-{4-[2-(gamma-L-glutamylamino)ethyl]phenoxymethyl}furan-2-yl) methanamine (pos_350), dTDP-4-oxo-2,3,6-trideoxy-D-glucose (neg_2684). However, kanamycin D (pos_2751), strophanthidin (neg_596), diosmetin (neg_3362), malvidin-3-O-arabinoside (pos_3338), S-(5′-adenosy)-L-homocysteine (neg_531), hesperetin-7-O-rutinoside (hesperidin) (neg_803), verbasoside (pos_3007), 4-hydroxy-3-methoxy-cinnamic acid (pos_2998), decarbamoylnovobiocin (neg_842), and sesamin (neg_1035) were the top 10 downregulated metabolites (Figure 7d). These DAMs showed significant differences in content between the NFF and MFF comparison groups, which could serve as potential flavor-related metabolic markers.
To determine the main pathways of DAMs in the NFF vs. MFF comparison group, KEGG enrichment analysis was conducted in this study. It was found that DAMs in female flowers were significantly enriched in the following pathways: “pyruvate metabolism (ko00620)”, “tyrosine metabolism (ko00350)”, “citrate cycle (TCA cycle) (ko00020)”, “nicotinate and nicotinamide metabolism (ko00760”, “propanoate metabolism (ko00640”, “fructose and mannose metabolism (ko00051)”, and “carbon fixation in photosynthetic organisms (ko00710)” (Figure 8a). These pathways mainly focused on carbohydrate metabolism, energy metabolism, amino acid metabolism, and biosynthesis of other secondary metabolites related pathways (Figure 8b, Table S15).

3.5. Integrated Metabolome and Transcriptome Analysis to Reveal Crucial Pathways Responsive to Coconut Female Flowers of NFF and MFF

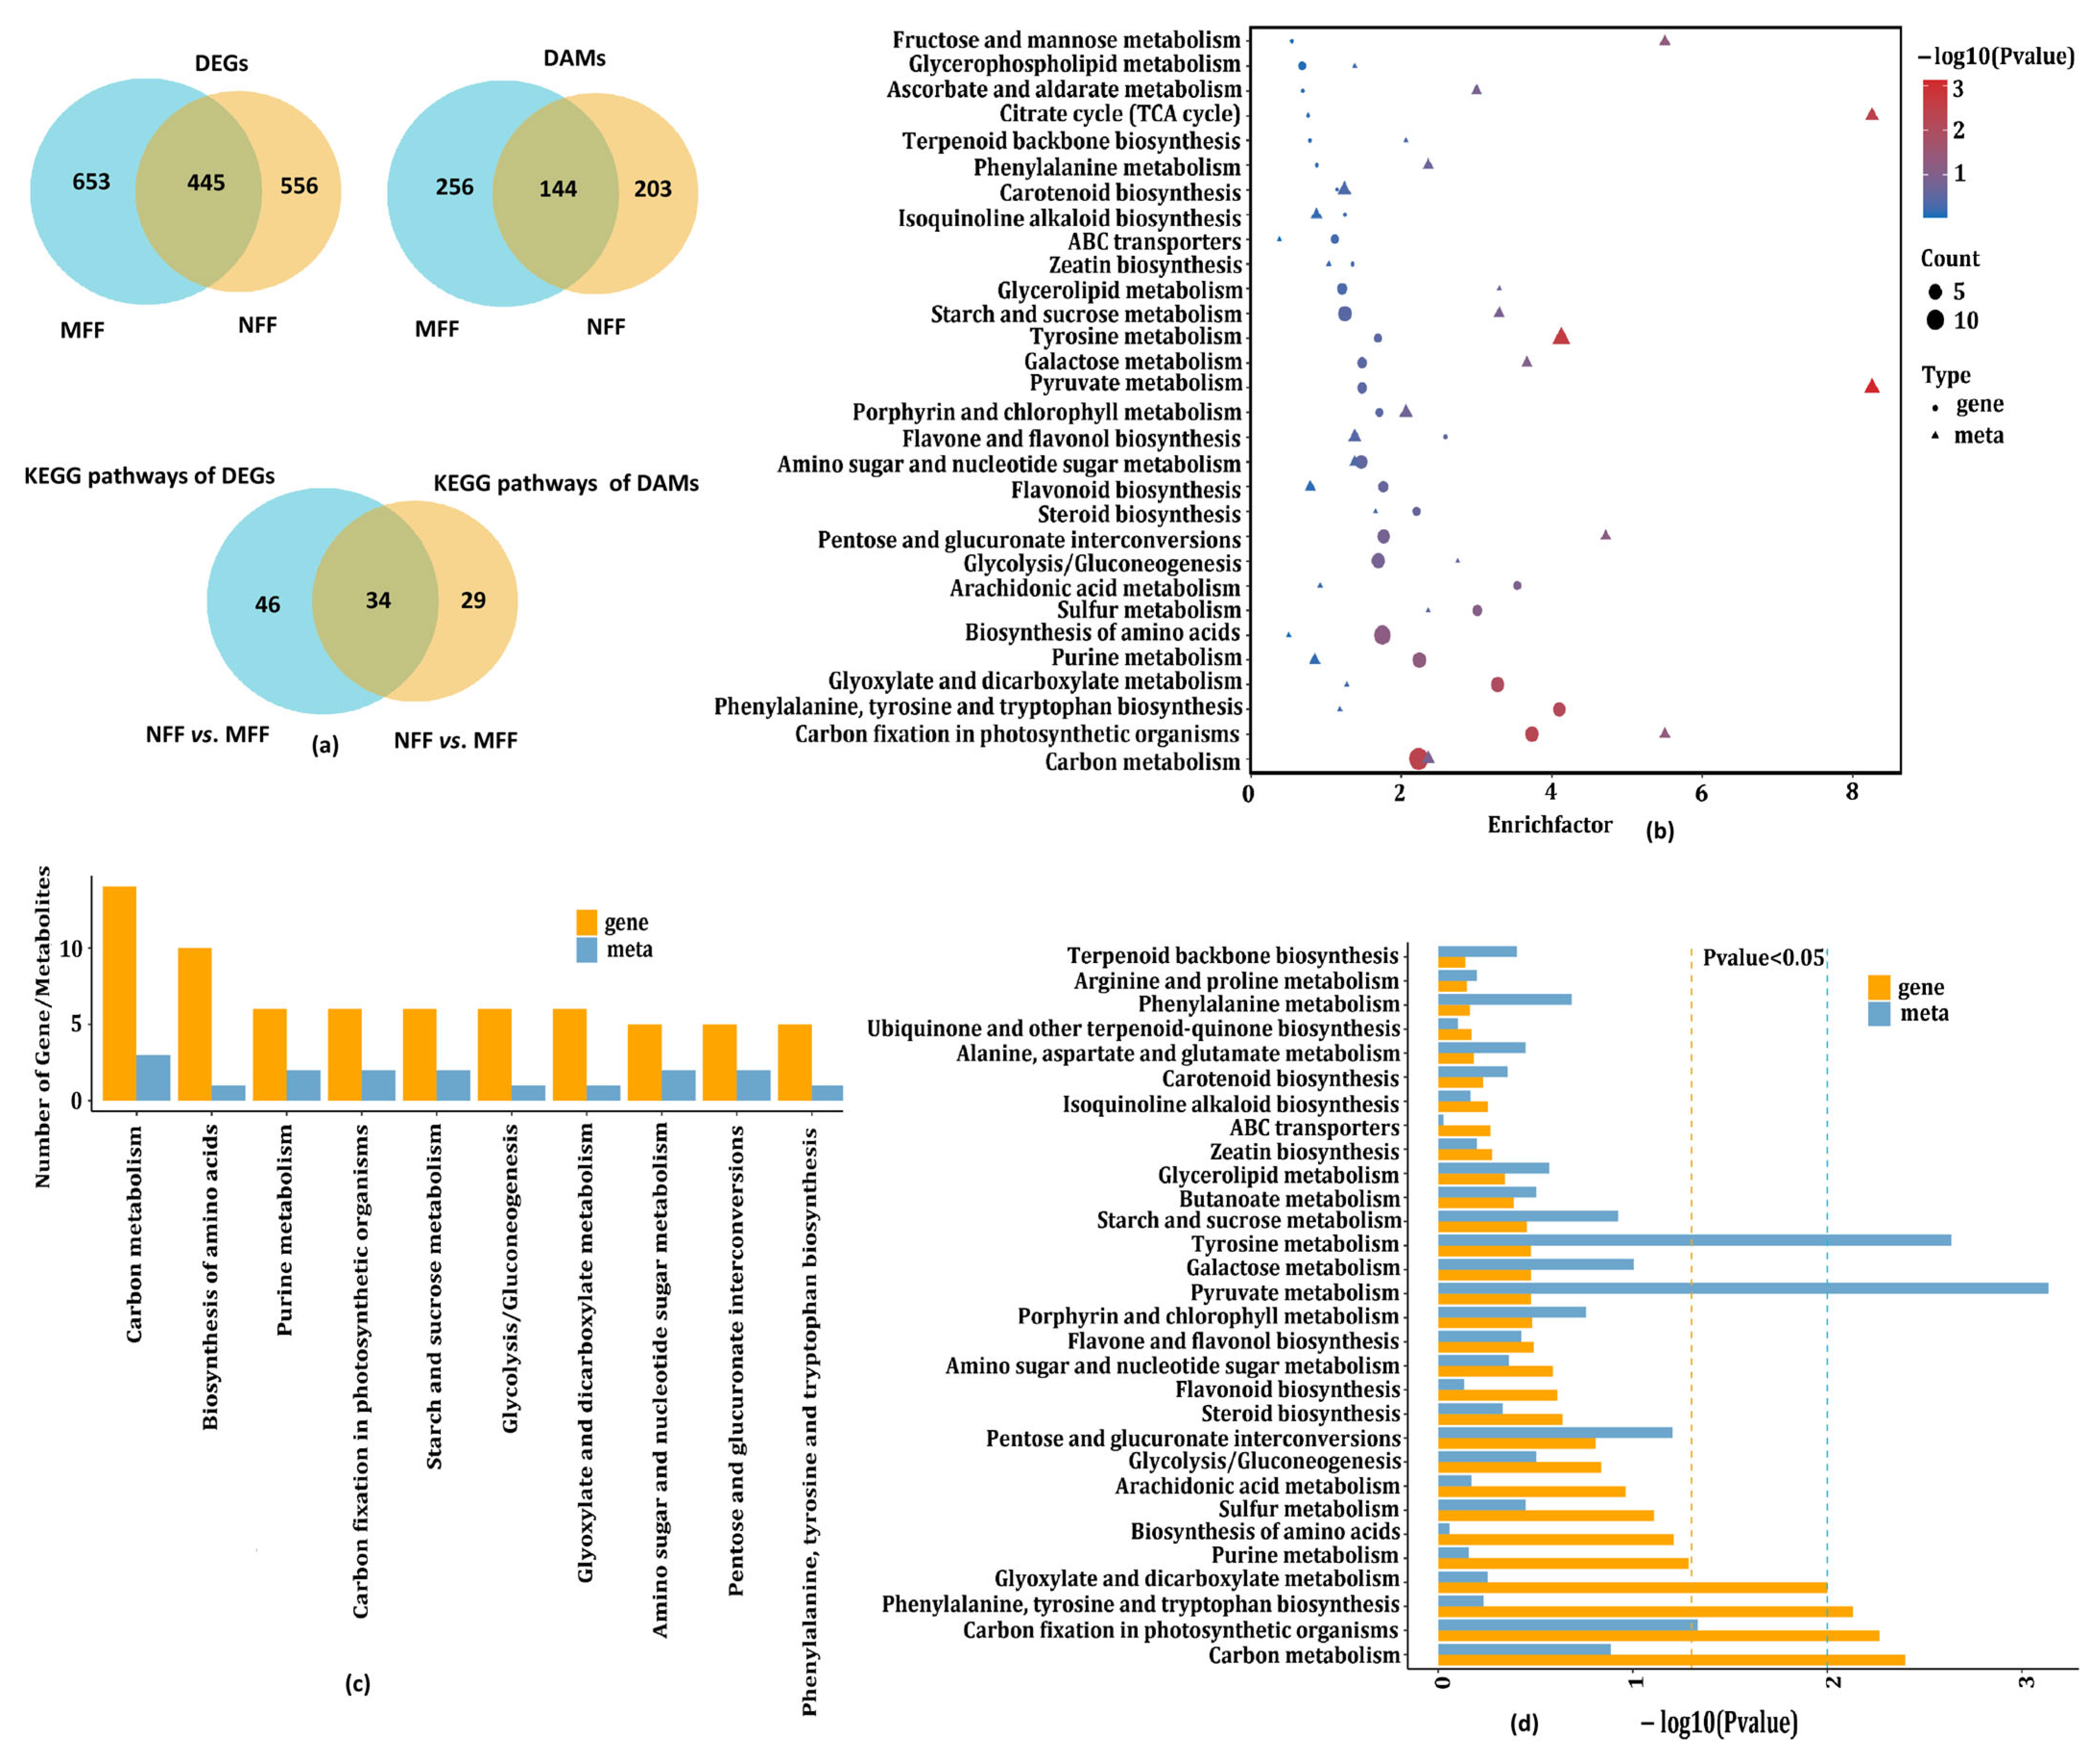
In order to understand the relationship between genes and metabolites in NFF and MFF, there were a total of 445 DEGs, corresponding to 144 DAMs (Figure 9a). A significant correlation (p < 0.01, R > 0.8) existed between DEGs and DAMs. Based on the PCA of DAMs and DAMs in NFF vs. MFF, all biological duplicate samples were clustered together, indicating that our differential gene and metabolite data are highly reliable. The PCA score scatter plot showed significant differences in DEGs and DAMs between NFF and MFF (Figure 8c). From the Pearson correlation coefficient analysis of the nine quadrants, the distribution patterns of DEGs and DAMs were in the first, second, third, seventh, eighth, and ninth quadrants, with the highest number of DEGs and DAMs distributed in the third quadrant, followed by the seventh quadrant. The expression of DEGs and DAMs in the third and seventh quadrants was positively correlated. The expression of DEGs and DAMs in the first and ninth quadrants showed a negative correlation (correlation coefficient > 0.9, p-value < 0.01) (Figure 8d). Further selecting DAMs and DEGs with Pearson correlation coefficients (PCCs) greater than 0.8, described as heatmaps, the expression of DEGs and DAMs in biological replicates of the same treatment group was highly correlated (Figure 8e). In NFF vs. MFF, 140 DEGs and 86 DAMs were combined with KEGG to enrich 34 common pathways (Figure 9a, Table S16). Interestingly, “carbon metabolism”, “carbon fixation in photosynthetic organisms”, “phenylalanine, tyrosine and tryptophan biosynthesis”, “glyoxylate and dicarboxylate metabolism”, “glycolysis/gluconeogenesis”, “pentose and glucuronate interconversions”, “flavonoid biosynthesis”, “flavone and flavonol biosynthesis”, “pyruvate metabolism”, “citrate cycle (TCA cycle)” were important DEGs or DAMs significant enrichment pathways (Figure 9b,c), where the differential DEGs and DAMs were common, significantly enriched in “carbon fixation in photosynthetic organisms” (Figure 9d).

3.5.1. Analysis of Soluble Sugars and Organic Acid Related to DAMs and DEGs

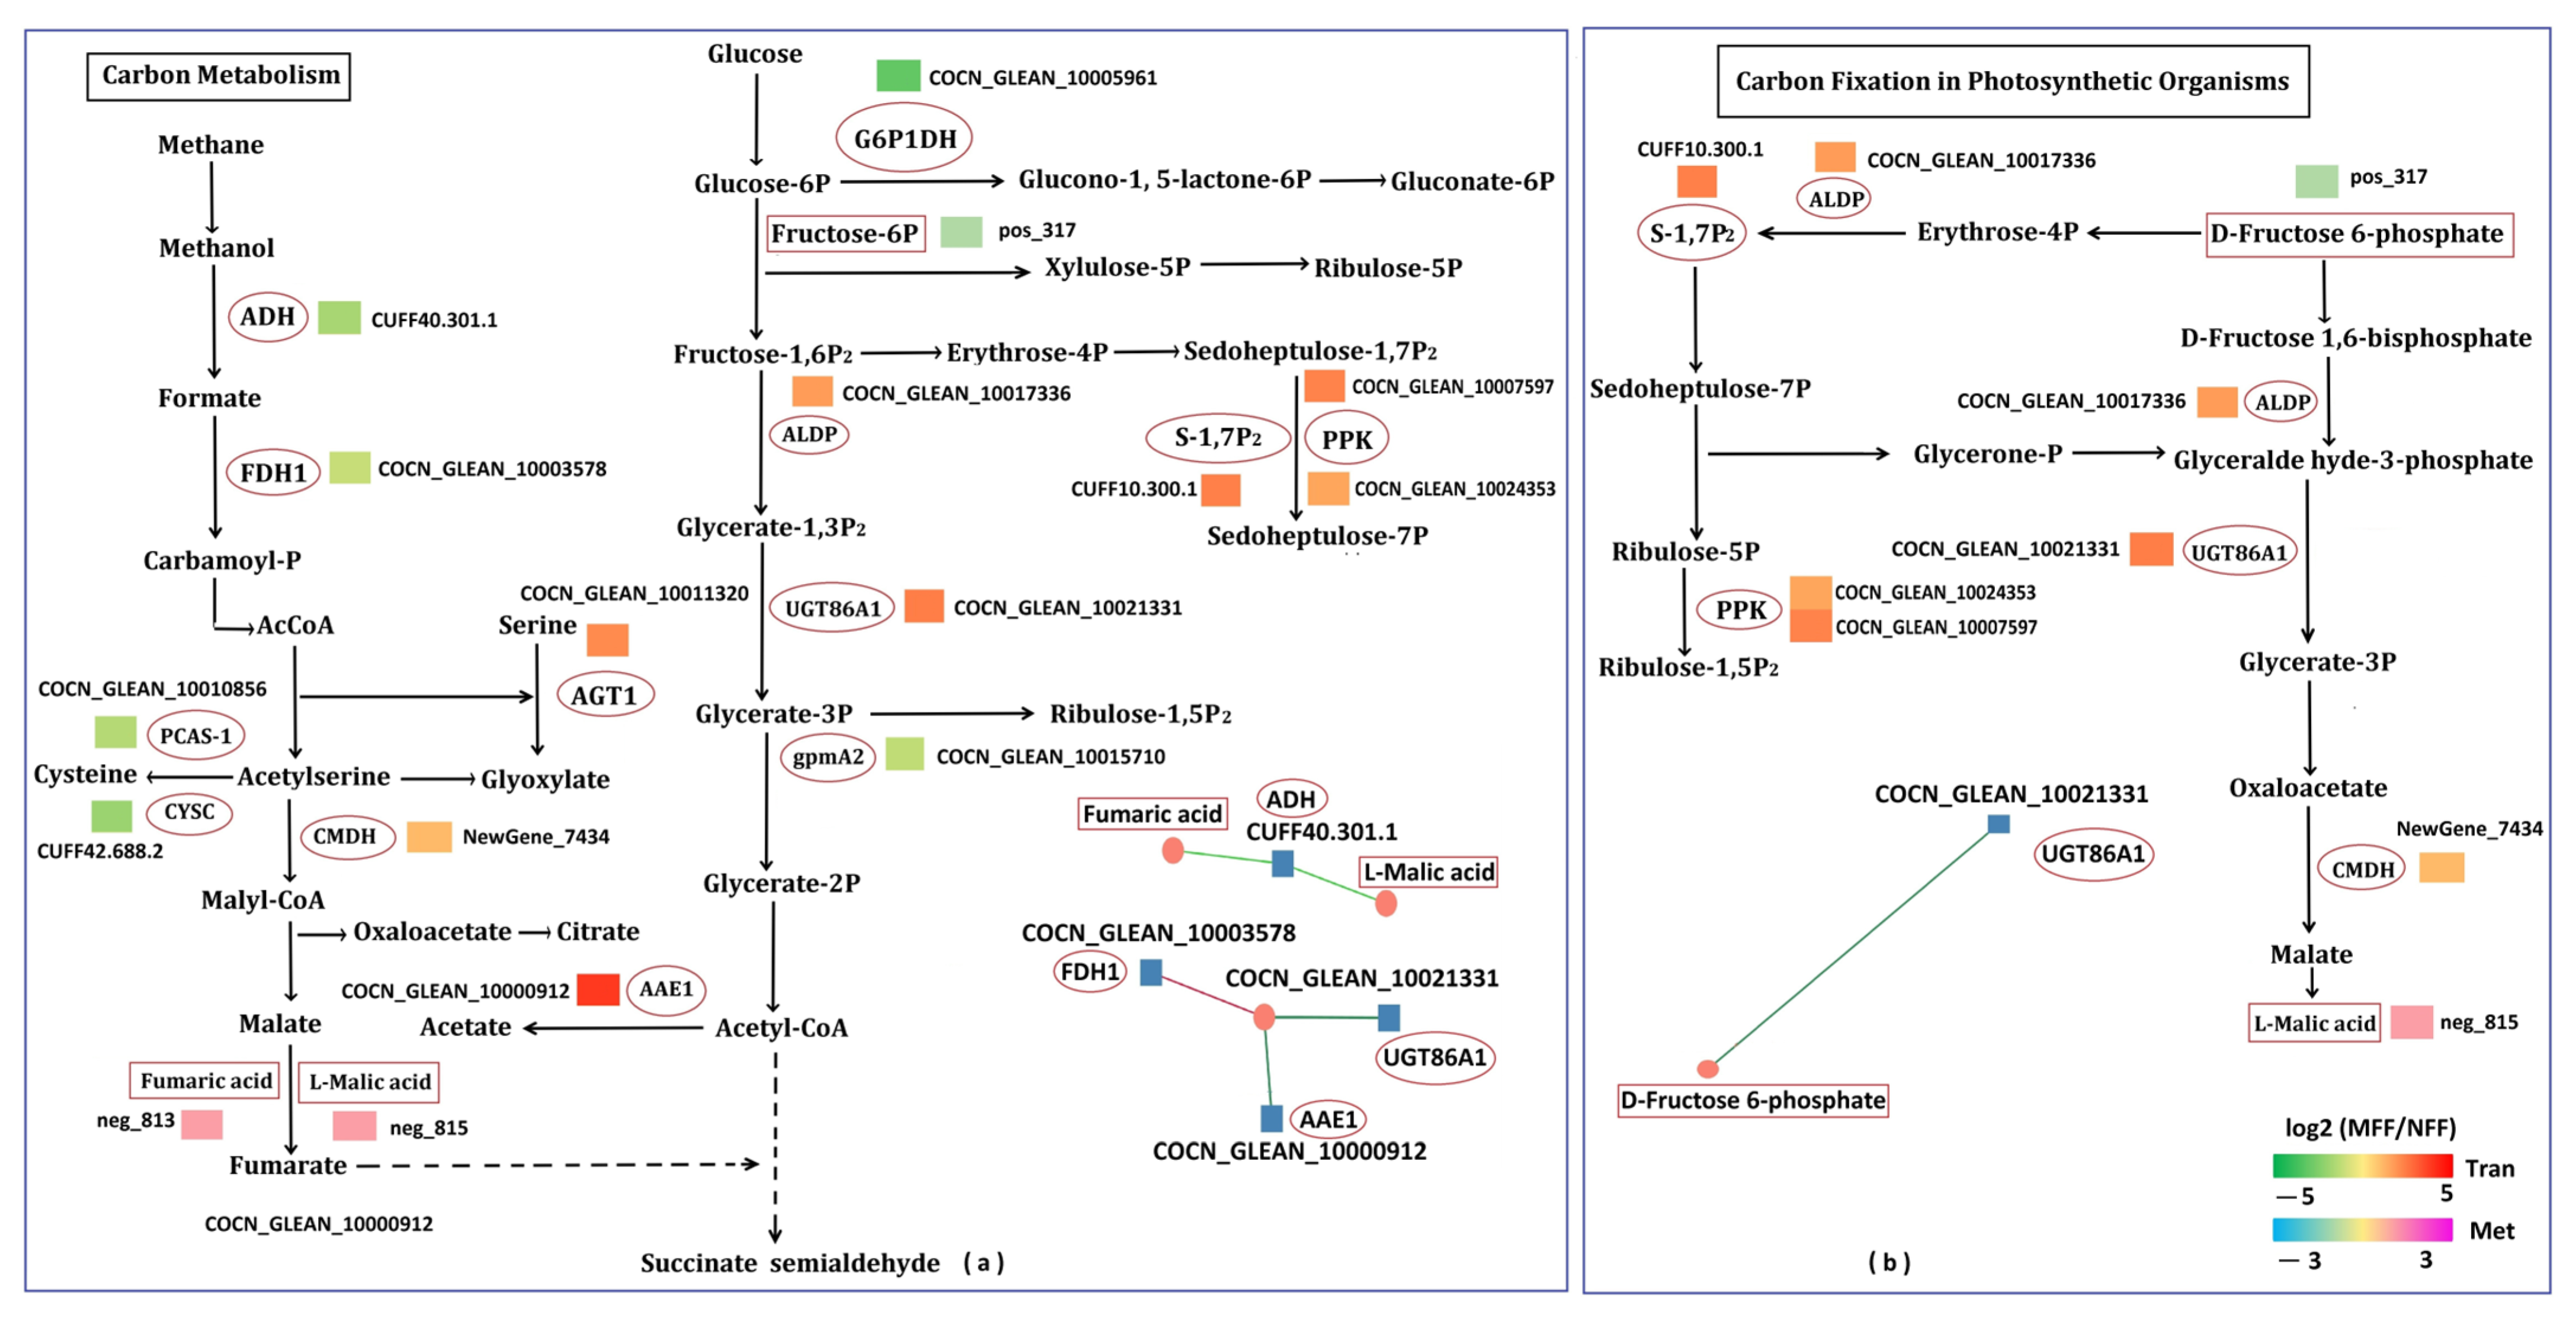
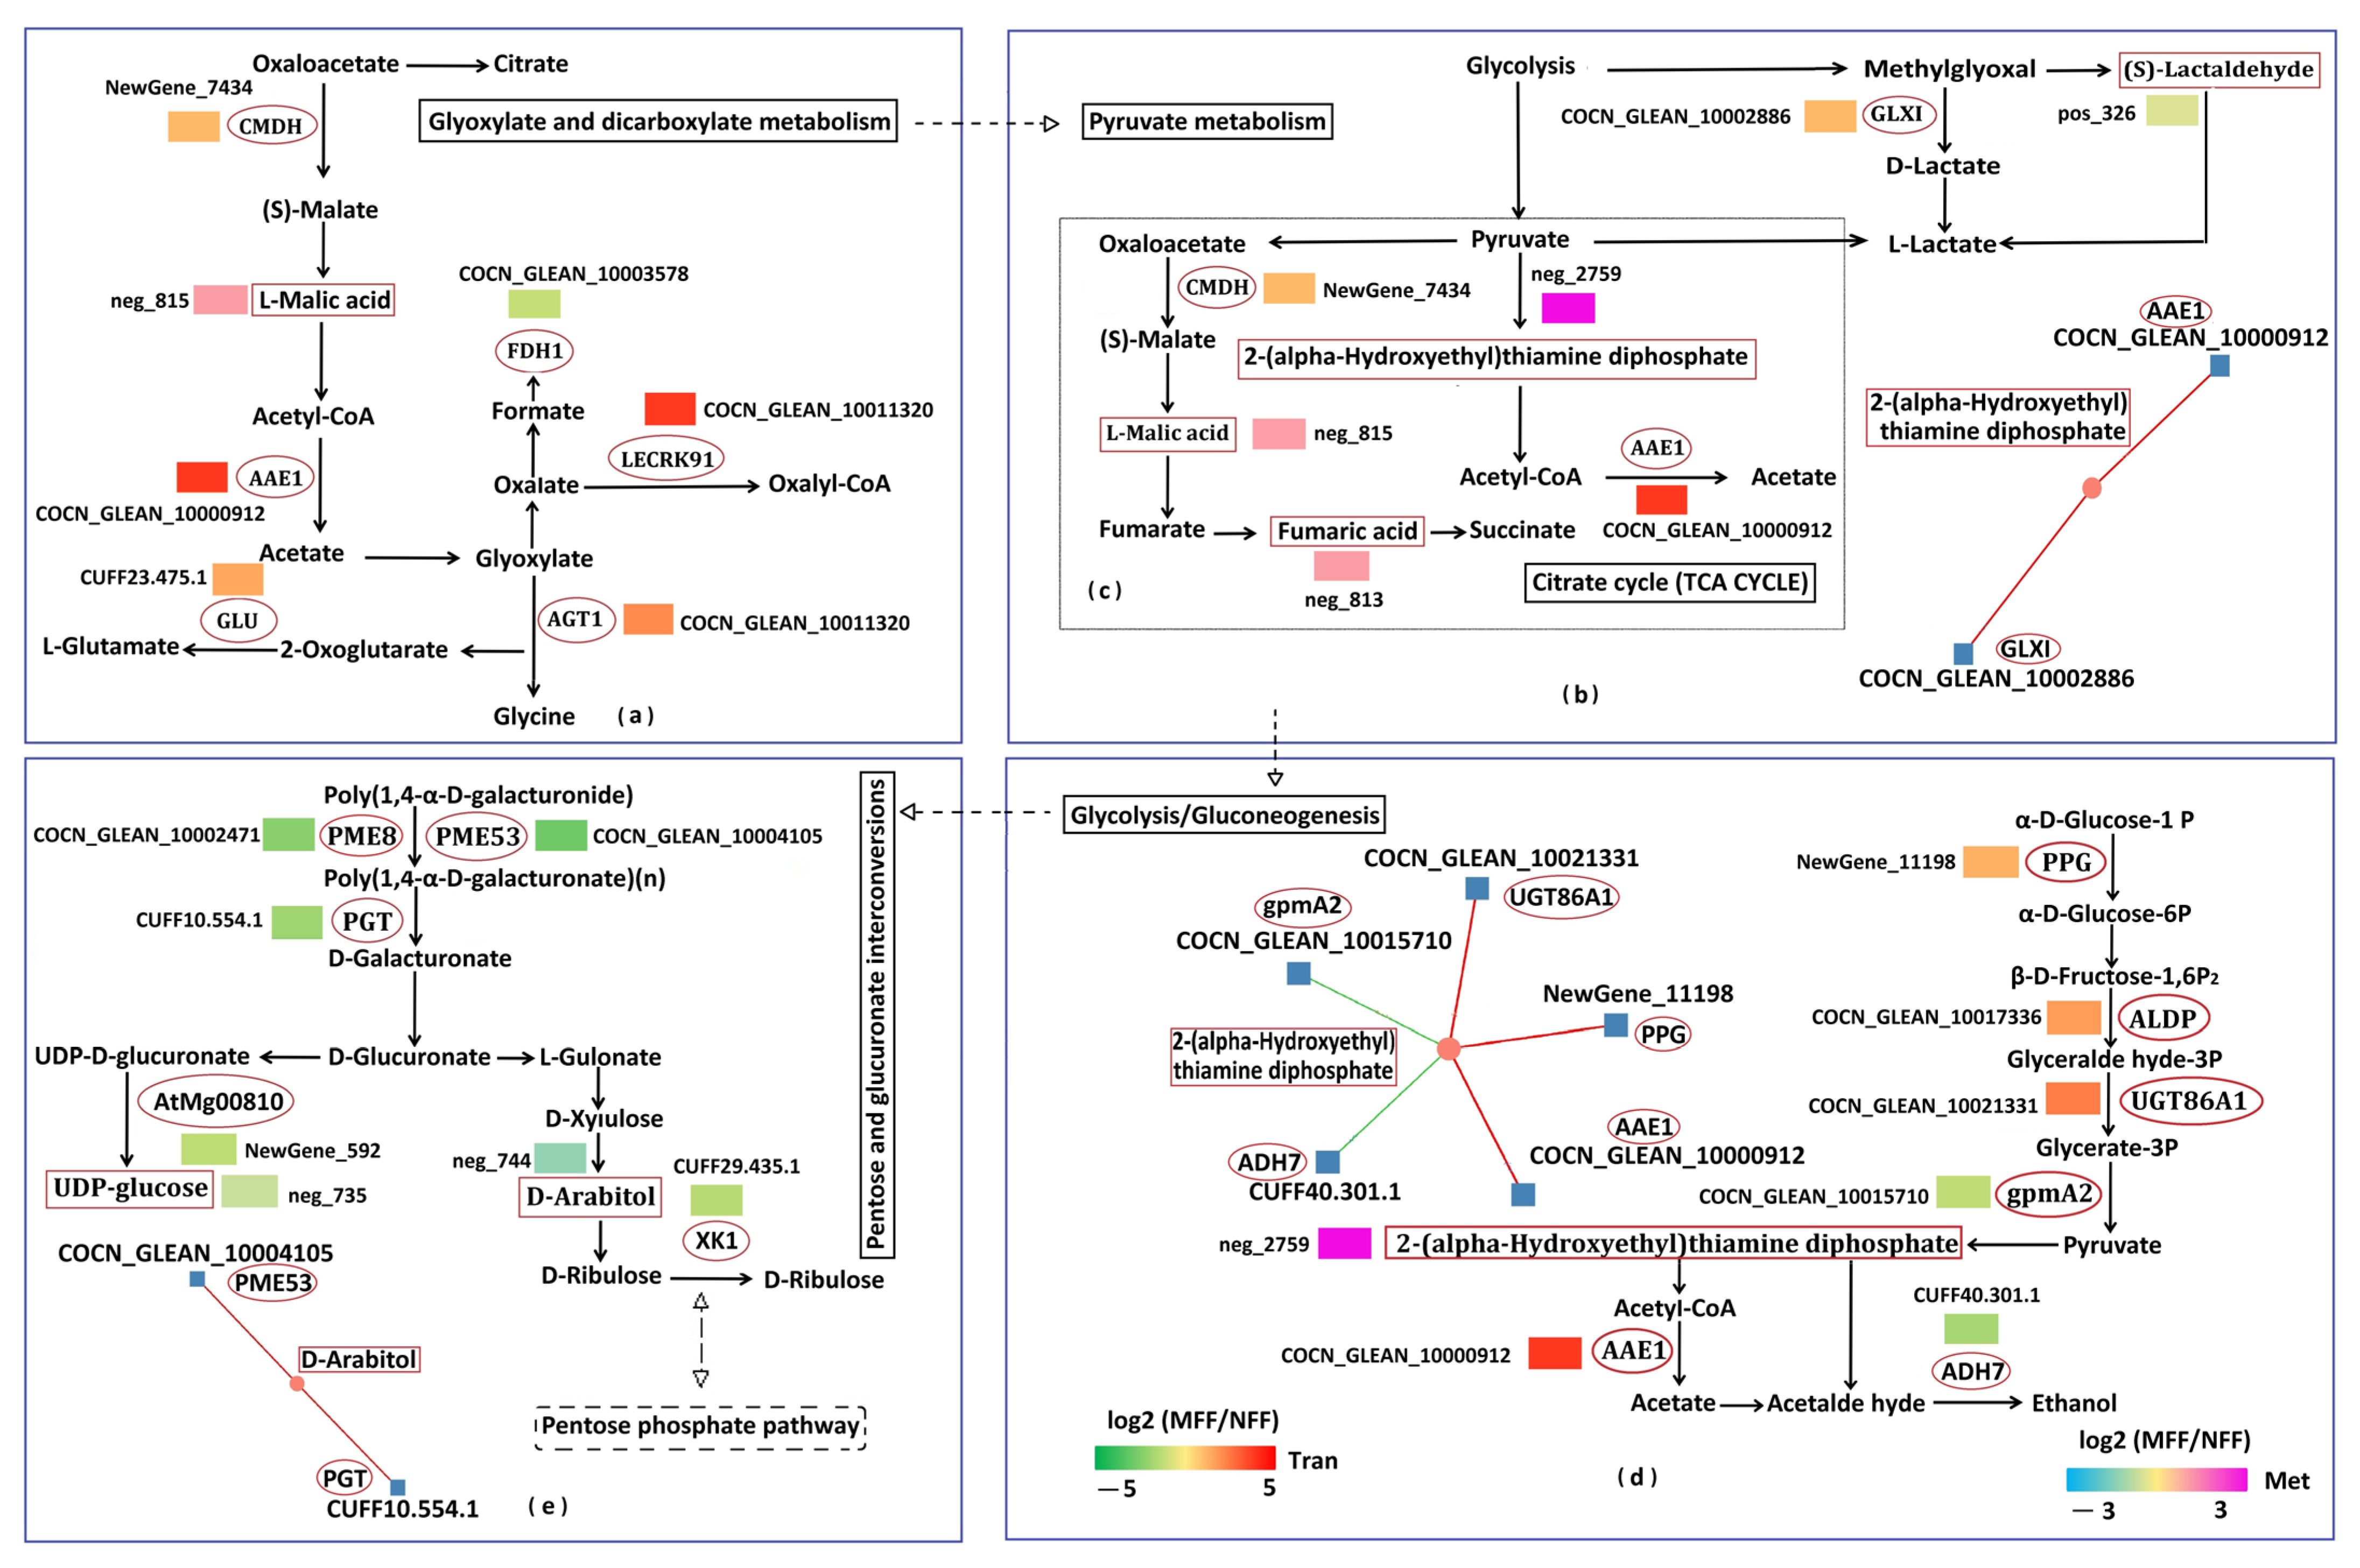
In NFF vs. MFF, fourteen DEGs were identified in the carbon metabolism pathway, including phosphoribulokinase (PPK), UDP-glycosyltransferase 86A1 (UGT86A1), probable acyl-activating enzyme 1 (AAE1), malate dehydrogenase (CMDH), formate dehydrogenase (FDH1), glucose-6-phosphate 1-dehydrogenase (G6P1DH), 2,3-bisphosphoglycerate-dependent phosphoglycerate mutase 2 (gpmA2), serine-glyoxylate aminotransferase (AGT1), alcohol dehydrogenase (ADH), fructose-bisphosphate aldolase (ALDP), sedoheptulose-1,7-bisphosphatase (S-1,7P2), bifunctional L-3-cyanoalanine synthase/cysteine synthase (CYSC/PCAS-1). COCN_GLEAN_10021331 (UGT86A1), COCN_GLEAN_10007597 (PPK), COCN_GLEAN_10000912 (AAE1), COCN_GLEAN_10011320 (AGT1) and CUFF10.300.1 (S-1,7P2) were significantly upregulated in NFF vs. MFF, while COCN_GLEAN_10005961 (G6P1DH) was significantly downregulated. L-malic acid (neg_815) and fumaric acid (neg_813) were upregulated, while D-fructose 6-phosphate (pos_317) was downregulated. Through the analysis of the correlation network diagram between DEGs and DAMs, L-malic acid (neg_815) and fumaric acid (neg_813) were significantly negatively correlated with CUFF40.301.1 (ADH), while D-fructose 6-phosphate (pos_317) was significantly positively correlated with COCN_GLEAN_10003578 (FDH1); however, it was significantly negatively correlated with COCN_GLEAN_10021331 (UGT86A1) and COCN_GLEAN_10000912 (AAE1) (Figure 10a).

3.5.2. Analysis of Carbon Fixation in Photosynthetic Organisms Related to DAMs and DEGs

Six upregulated DEGs were identified in the carbon fixation in the photosynthetic organisms pathway, including phosphoribulokinase (PPK), UDP-glycosyltransferase 86A1 (UGT86A1), malate dehydrogenase (CMDH), fructose-bisphosphate aldolase (ALDP), sedoheptulose-1,7-bisphosphatase (S-1,7P2). In NFF vs. MFF, COCN_GLEAN_10021331 (UGT86A1), COCN_GLEAN_10007597 (PPK), COCN_GLEAN_10000912 (AAE1), and CUFF10.300.1 (S-1,7P2) were significantly upregulated. In addition, L-malic acid (neg_815) associated with this pathway was upregulated, while D-fructose 6-phosphate (pos_317) was downregulated. The correlation analysis between DEGs and DAMs showed a significant negative correlation between D-fructose 6-phosphate (pos_317) and COCN_GLEAN_10021331 (UGT86A1) (Figure 10b).

3.5.3. Analysis of Amino Acid Metabolism Related to DAMs and DEGs

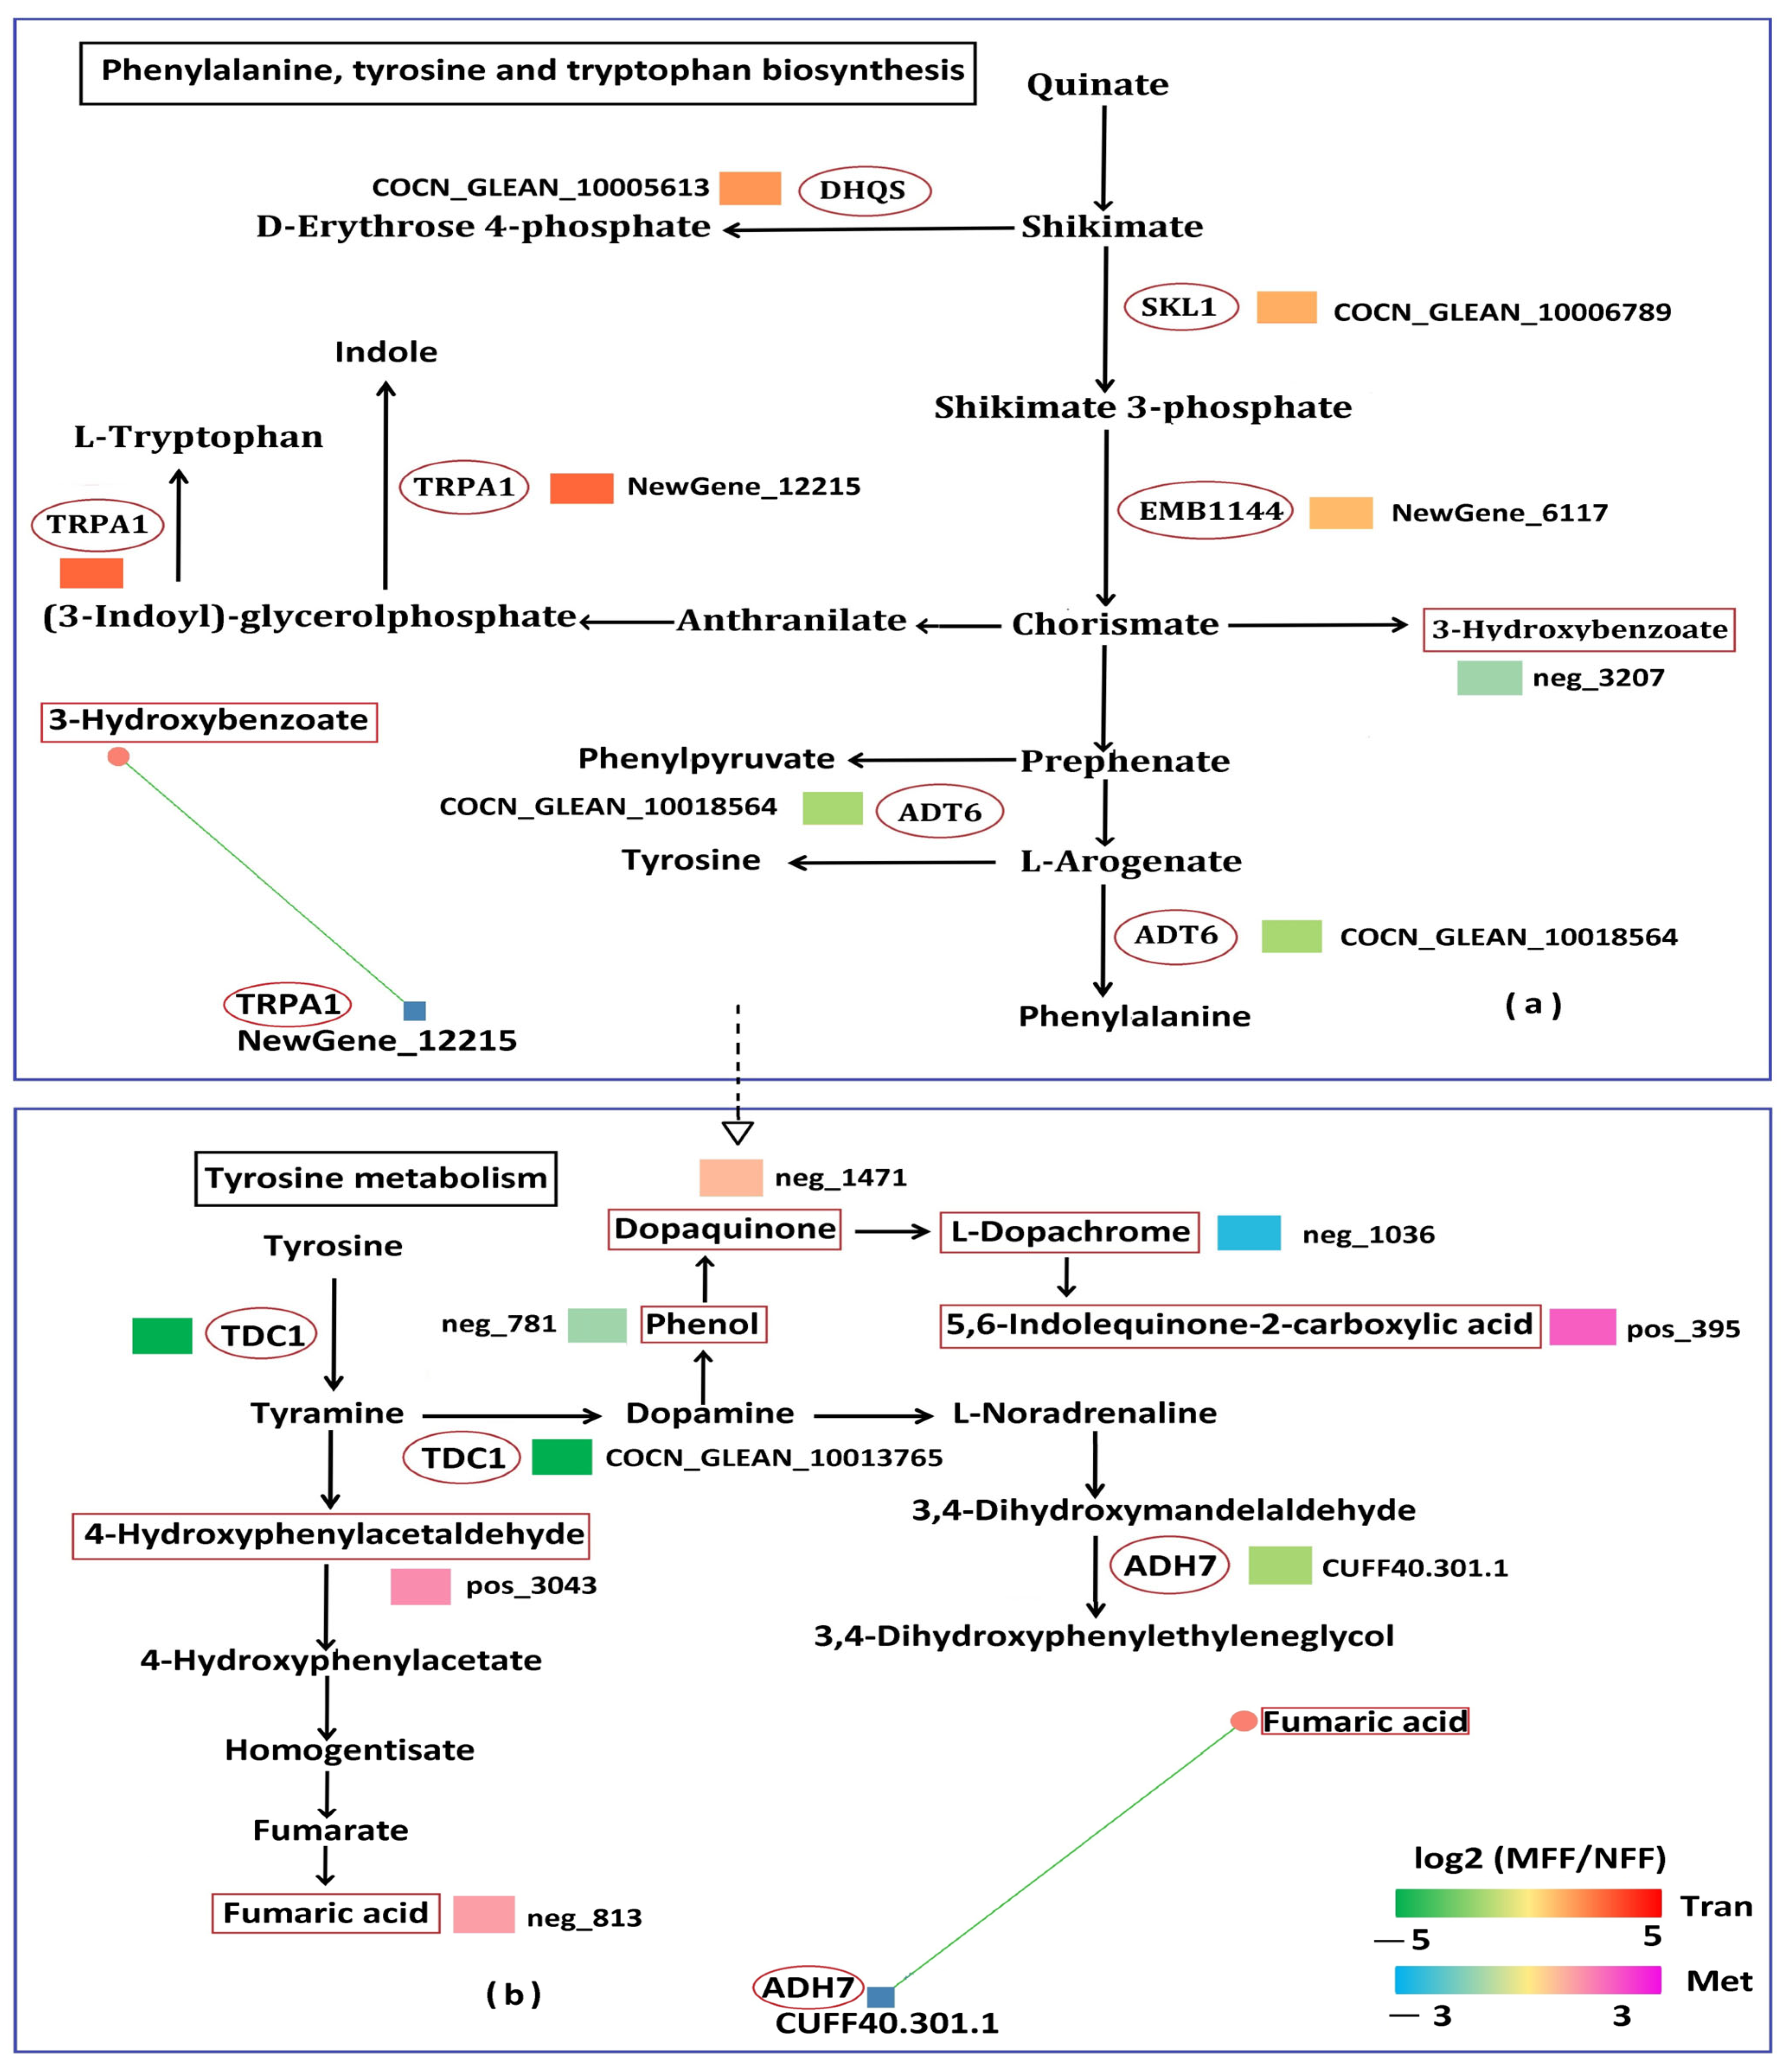
In NFF vs. MFF, we found that seven DEGs and seven DAMs are involved in the amino acid metabolism pathway (“phenylalanine, tyrosine and tryptophan biosynthesis”, “tyrosine metabolism”). Five DEGs and one DAM were identified in the phenylalanine, tyrosine, and tryptophan biosynthetic pathways, including chorismate synthase (EMB1144), arogenate dehydratase/prephenate dehydratase 6 (ADT6), tryptophan synthase alpha chain (TRPA1), probable inactive shikimate kinase like 1(SKL1) and 3-dehydroquinate synthase (DHQS) genes, and 3-hydroxybenzoate (neg_3207) metabolite. NewGene_12215 (TRPA1) was significantly upregulated in NFF vs. MFF and showed a significant negative correlation with 3-hydroxybenzoate (neg_3207) (Figure 11a). Two DEGs and six DAMs were identified in the tyrosine metabolism. These genes encoding tryptophan decarboxylase (TDC1) and alcohol dehydrogenase-like 7 (ADH7) were downregulated, with TDC1 being significantly downregulated. These metabolites such as 4-hydroxyphenylacetaldehyde (pos_3043), fumaric acid (neg_813), dopaquinone (neg_1471), and 5,6-indolequinone-2-carboxylic acid (pos_395) were upregulated, L-dopachrome (neg_1036) and phenol (neg_781) were downregulated. Meanwhile, fumaric acid (neg_813) was negatively correlated with CUFF40.301.1 (ADH7) (Figure 11b).

3.5.4. Analysis of Carbohydrate Metabolism Related to DAMs and DEGs

This study annotated seventeen DEGs and six DAMs identified in the following five carbohydrate metabolism related pathways (Figure 12). There were a total of six DEGs and one DAM involved in the glyoxylate and dicarboxylate metabolism pathway including probable acyl-activating enzyme 1 (AAE1), malate dehydrogenase (CMDH), formate dehydrogenase (FDH1), serine-glyoxylate aminotransferase (AGT1), L-type lectin-domain containing receptor kinase IX.1 (LECRK91), and ferredoxin-dependent glutamate synthase (GLU) genes and L-malic acid (neg_815). COCN_GLEAN_10000912 (AAE1), COCN_GLEAN_10011320 (AGT1) and COCN_GLEAN_10022136 (LECRK91) were significantly upregulated in NFF vs. MFF, and L-malic acid (neg_815) was also upregulated (Figure 12a). Three DEGs and four DAMs were identified in the pyruvate metabolism. DEGs included probable acyl-activating enzyme 1 (AAE1), malate dehydrogenase (CMDH), and lactoylglutathione lyase (GLXI), with AAE1 significantly upregulated in NFF vs. MFF. 2-(alpha-hydroxyethyl) thiamine diphosphate (neg_2759), fumaric acid (neg_813) and L-malic acid (neg_815) were upregulated, while (S)-lactaldehyde (pos_326) was downregulated. In addition, COCN_GLEAN_10000912 (AAE1) and COCN_GLEAN_10002886 (GLXI) were significantly positively correlated with 2-(alpha-hydroxyethyl) thiamine diphosphate (neg_2759) (Figure 12b). One DEG and three DAMs were identified in the citrate cycle (TCA cycle). A malate dehydrogenase (CMDH) gene was upregulated in NFF vs. MFF, with three DAMs including 2-(alpha-hydroxyethyl) thiamine diphosphate (neg_2759), fumaric acid (neg_813), and L-malic acid (neg_815) upregulated (Figure 12c). Six DEGs and one DAM were identified in glycolysis/gluconeogenesis. DEGs included phosphoglucomutase (PPG), UDP-glycosyltransferase 86A1 (UGT86A1), probable acyl-activating enzyme 1 (AAE1), 2,3-bisphosphoglycerate-dependent phosphoglycerate mutase 2 (gpmA2), alcohol dehydrogenase-like 7 (ADH7) and fructose-bisphosphate aldolase (ALDP), as well as COCN_GLEAN_10021331 (UGT86A1) and COCN_GLEAN_10000912 (AAE1) were significantly upregulated in NFF vs. MFF, while 2-(alpha-hydroxyethyl) thiamine diphosphate (neg_2759) was also upregulated. The correlation analysis results also showed that NewGene_11198 (PPG), COCN_GLEAN_10021331 (UGT86A1), and COCN_GLEAN_10000912 (AAE1) were significantly positively correlated with 2-(alpha-hydroxyethyl)thiamine diphosphate (neg_2759), while COCN_GLEAN_10015710 (gpmA2) and CUFF40.301.1 (ADH7) were negatively correlated with 2-(alpha-hydroxyethyl) thiamine diphosphate (neg_2759) (Figure 12d). Five DEGs and two DAMs were identified in pentose and glucuronate interconversion. DEGs including probable pectinesterase 53 (PME53), D-ribulose kinase (XK1), uncharacterized mitochondrial protein AtMg00810 (AtMg00810), polygalacturonase (PGT), and probable pectinesterase 8 (PME8) were downregulated, and COCN_GLEAN_10004105 (PME53) and COCN_GLEAN_10002471 (PME8) were significantly downregulated; the related DAMs such as UDP-glucose (neg_735) and D-arabitol (neg_744) were also downregulated. COCN_GLEAN_10004105 (PME53) and CUFF10.554.1 (PGT) were significantly positively correlated with D-arabitol (neg_744), respectively (Figure 12e).

3.5.5. Analysis of Biosynthesis of Other Secondary Metabolites Related to DAMs and DEGs

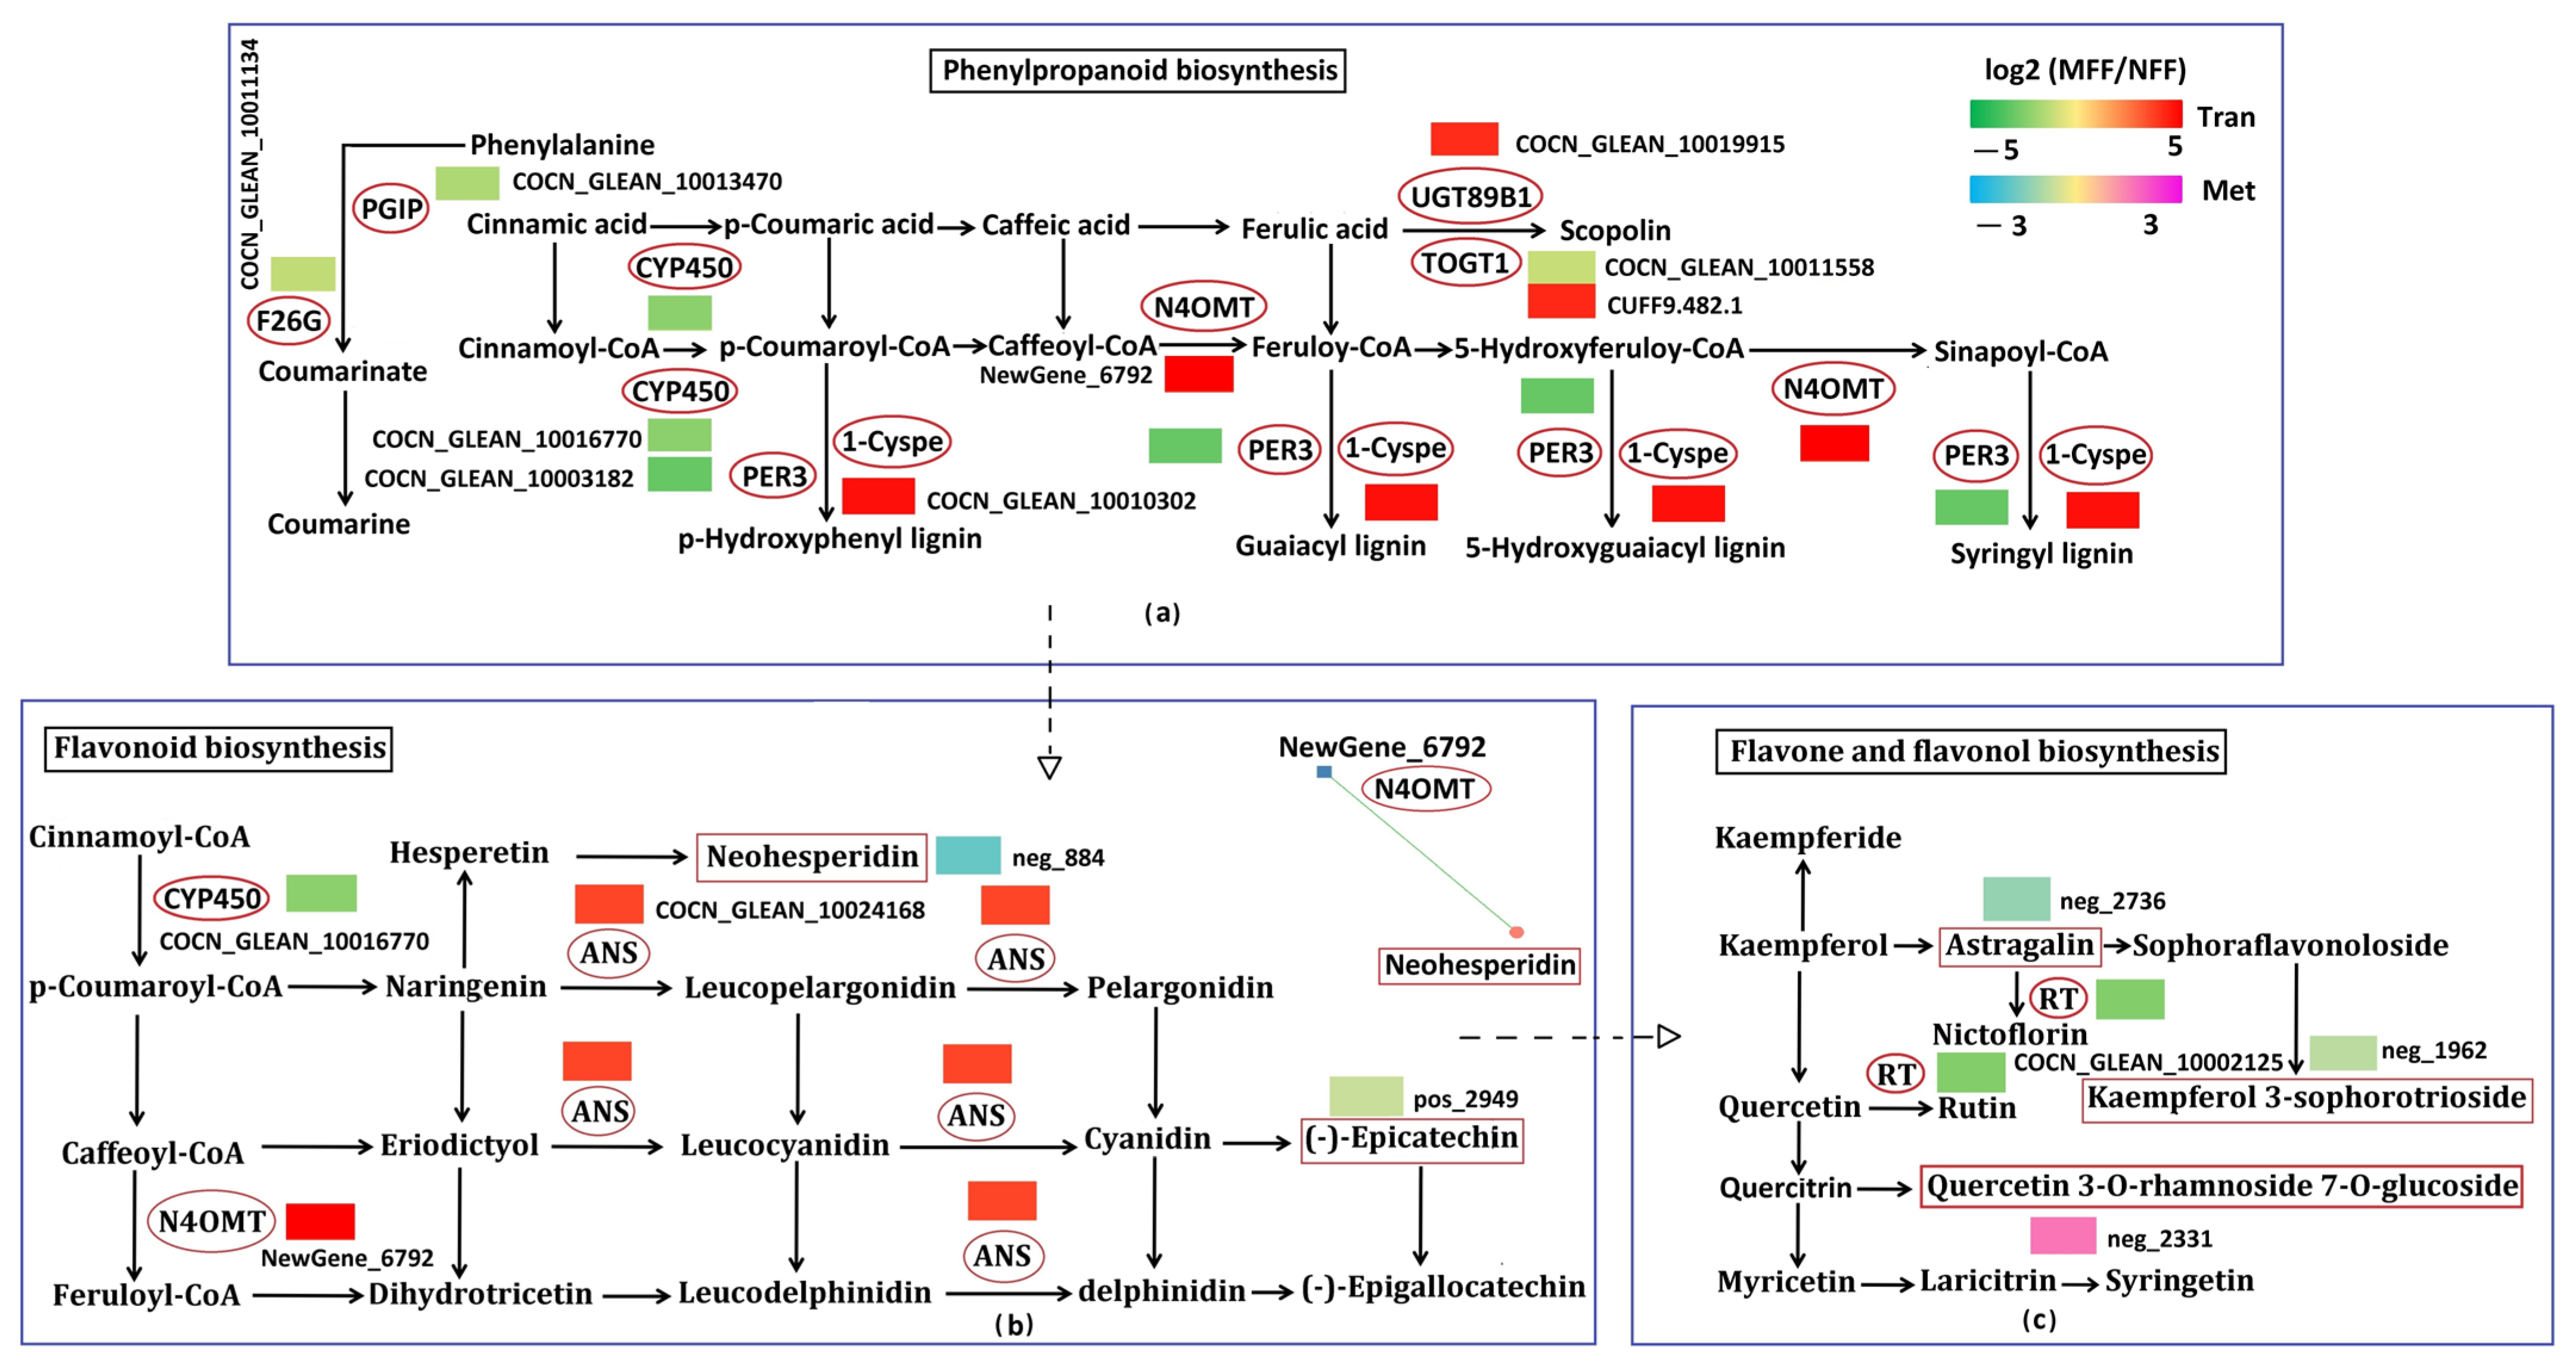
Thirteen DEGs and five DAMs involved in the biosynthesis of other secondary metabolites pathway (phenylpropanoid biosynthesis, flavonoid biosynthesis, flavone and flavonol biosynthesis) were found in NFF vs. MFF. Nine DEGs were identified in the phenylpropanoid biosynthesis, including cytochrome P450 (CYP450), polygalacturonase inhibitor (PGIP), norbelladine 4′-O-methyltransferase (N4OMT), flavonol 3-O-glucosyltransferase (UGT89B1), furostanol glycoside 26-O-beta-glucosidase (F26G), scopoletin glucosyltransferase (TOGT1), peroxidase 3 (PER3), and 1-Cys peroxiredoxin (1-Cyspe). NewGene_6792 (N4OMT), COCN_GLEAN_10019915 (UGT89B1), CUFF9.482.1 (TOGT1), and COCN_GLEAN_10010302 (1-Cyspe) were significantly upregulated in NFF vs. MFF, while COCN_GLEAN_10016770 (CYP450) and COCN_GLEAN_10003182 (PER3) were significantly downregulated (Figure 13a). Three DEGs and two DAMs were identified in the flavonoid biosynthesis. These three genes encoding cytochrome P450 (CYP450), norbelladine 4′-O-methyltransferase (N4OMT), leucoanthocyanidin dioxygenase (ANS), NewGene_6792 (N4OMT), and COCN_GLEAN_10024168 (ANS) were significantly upregulated in NFF vs. MFF, while COCN_CLEAN_10016770 (CYP450) was significantly downregulated in NFF vs. MFF. In addition, two related metabolites of this pathway, encoding neohesperidin (neg_884) and (-)-epicatechin (pos_2949), were significantly downregulated in NFF vs. MFF. Correlation analysis showed that NewGene_6792 (N4OMT) is significantly negatively correlated with neohesperidin (neg_884) (Figure 13b). One DEG and three DAMs were identified in flavone and flavonol biosynthesis, and the anthocyanidin-3-O-glucoside rhamnosyltransferase (RT) gene was significantly downregulated in NFF vs. MFF. One DAM encoding quercetin 3-O-rhamnoside 7-O-glucoside (neg_2331) was upregulated, while two DAMs encoding kaempferol 3-sophorotrioside (neg_1962) and astragalin (neg_2736) were downregulated. (Figure 13c).

4. Discussion

4.1. Phenoty, Morphology and Physiology Play an Important Role in Multiple Female Flowers of Coconut

The study on the internal and external morphological changes of female flowers in NFF and MFF of coconut provides a fundamental theoretical support for understanding the occurrence of multiple female inflorescences in coconut. In recent years, multiple studies have shown that different plant flower differentiation has different external morphological and internal anatomical characteristics [29,49,50]. In this study, the volume and weight of female flowers in NFF were significantly larger than those in MFF. The NFF morphology was a positive “heart” shape with tightly packed tissue cells, while the MFF morphology was a skewed “heart” shape with loosely packed tissue cells (Figure 1). The female flower buds of NFF showed floral differentiation tissue, while the female flower buds of MFF did not show floral differentiation tissue (Figure 1).
Mineral nutrients also play a significant role in the process of plant flower bud differentiation. Changes in nitrogen (N) content can affect flower quantity [51], phosphorus (P) provides energy for plant flower bud morphological differentiation [52], copper (Cu) can affect plant photoperiod types, zinc (Zn) may be beneficial for flower bud morphological differentiation in the later stage, and potassium (K) and CTK have a significant synergistic effect and partial compensatory effect. In addition, the content of elements such as iron (Fe) and manganese (Mn) is also related to the development of flower buds in some plants [53]. In the early stage of physiological differentiation, spraying mineral elements such as boron (B), zinc (Zn), magnesium (Mg), calcium (Ca), and molybdenum (Mo) can increase the number of fruiting mother branches and promote flowering in kumquat [54]. In this study, the contents of N, P, K, Ca, Mg, S, Fe, Cu, Zn, B, and Cl elements in the female flower of coconut MFF were higher than that in the female flower of NFF, with Fe increasing significantly (p < 0.01) and N, S, K, Ca, and Zn increasing significantly (p < 0.05). However, the Mo content in MFF decreased significantly compared to NFF (p < 0.05) (Table S2). From this study, it is evident that there are significant differences in the nutritional elements of female flowers between NFF and MFF. It can be inferred that an increase in Fe, N, S, K, Ca, and Zn significantly promotes an increase in female flower quantity and leads to the occurrence of multiple female inflorescences. However, a decrease in Mo content may trigger the emergence of multiple female inflorescences.
The SP content continues to slowly increase during the process of apple flower bud differentiation, reaching its highest level during the inflorescence separation stage. Carbohydrates are the structural substances of plant cells and provide the necessary energy for plant growth. Their accumulation is closely related to flower bud differentiation [55]. The progress of grape flower bud differentiation is positively correlated with the content of starch, SS, sucrose, and fructose [56,57]. The accumulation of reducing sugars, sucrose, and SS in the leaves before the initiation of Morella rubra flower buds is beneficial for the development of flower buds [58]. A high content of SS and sucrose in flower buds is beneficial for flower bud differentiation [59]. In this study, the content of SS and SP in MFF was lower than that in NFF (Figure 2), which may indicate that female flowers in NFF are undergoing differentiation. Proteins and sugars are broken down into SP and SS, respectively, to provide the energy required for female flower differentiation. However, structural analysis showed that the female flowers of the multi female inflorescence did not differentiate, which may be the main reason for the lower SS and SP content of these flowers.
Plant oxidases such as phenylalanine ammonia lyase (PAL) and POD are involved in the process of flower bud development [60]. In this study, the content of SOD and POD in MFF was significantly lower than that in NFF. Pro, CAT, and MDA contents were higher than NFF, with CAT significantly increasing (Figure 2). The significant increase in SOD activity may reduce the accumulation of reactive oxygen species (ROS) in plant tissues. POD and CAT work synergistically to degrade H2O2, preventing its conversion into more toxic hydroxyl radicals. Elevated POD and CAT activities help maintain H2O2 balance. MDA, a marker of membrane lipid peroxidation, indicates cell membrane damage, electrolyte leakage, and intensified ROS accumulation. Proton, as an osmoregulatory substance, protects cellular structures and enzyme activity by maintaining osmotic pressure equilibrium. For instance, Pro can neutralize ROS and mitigate oxidative damage. Through collaboration with antioxidant enzymes like SOD and CAT, Pro reduces MDA accumulation and alleviates membrane lipid peroxidation [30,34]. From this, it can be seen that SOD, POD, Pro, CAT, and MDA involved in the differentiation process of coconut flowers showed significant differences in NFF and MFF, in which they are out of balance. The regulation of endogenous plant hormones plays a crucial role in the differentiation of female flower in Jatropha curcas but is not significantly associated with male flower differentiation. Some research has shown that the CTK signaling pathway first triggers the formation of female flower primordia, followed by the promotion of female flower development by other plant hormones such as JA, BR, GA, and ABA. GA, IAA, CK, and JA are key plant hormones that regulate flower bud differentiation and development [19]. In this study, the content of ABA and JA in female flowers of MFF significantly increased by 212.32% and 300%, respectively. However, the contents of IAA, ZR, and GA in MFF decreased, with ZR and GA significantly decreasing (Figure 3). IAA, GA, ABA and erythromycin hormones play a crucial regulatory role in the complex biological processes of flowering regulation [17]. DEGs are highly enriched in plant hormone signal transduction, indicating that multiple endogenous hormones are involved in the flowering process of lilies [18]. In coconut, ABA and JA may promote the occurrence of multiple female flowers. In addition, the contents of IAA, ZR, and GA in MFF decreased, which may be a hormonal imbalance in the process of flower differentiation, resulting in multiple female flowers.

4.2. DAMs and DEGs Involved in Crucial Pathways in Multiple Female Flowers of Coconut

This study analyzed the transcriptome and metabolome of NFF and MFF. The results showed that a total of 445 genes and 144 metabolites exhibited specific expression in NFF vs. MFF (Tables S6 and S14). This indicates that there are many genes and metabolites that play important roles in the occurrence of multiple female inflorescences.
KEGG enrichment analysis showed that DEGs were highly enriched in plant hormone signal transduction, indicating that multiple endogenous hormones were involved in the flowering process of lilies [18]. Hormones play a crucial regulatory role in the complex biological processes of flowering. In addition, substances such as IAA, GA, and ABA have important effects on flower bud differentiation and flowering time [17]. JA can participate in flower organ development in tomatoes by promoting the expression of the SlMYB21 gene [61]. Plant hormones such as JA, BR, GA, and ABA play important roles in the development of female flowers in J. cucas. In addition, IAA plays an auxiliary role throughout the entire flower differentiation process [19]. In this study, we found DEGs in the plant hormone pathways of ABA, ETH, BR, and JA. In the ABA pathway, two DEGs related to probable protein phosphatase 2C (At2g30020 and PP2C06) were upregulated. Five out of eight DEGs related to serine/threonine-protein kinase were upregulated, the two DEGs encoding LECRK1 and At3g47570 were significantly upregulated but three out of eight DEGs related to serine/threonine-protein kinase were downregulated. In the ETH pathway, two DEGs are associated with ETH being upregulated, with one DEG encoding ERF118 significantly upregulated. In the BR pathway, one DEG encoding XTHB related to probable xyloglucan endotransglucosylase/hydrolase protein B was significantly downregulated. In the JA pathway, one DEG encoding protein TIFY 9 was significantly upregulated (Figure 5). This indicates that the ABA, ETH, BR, and JA signaling pathways play important roles in the production of multiple female inflorescences in coconut.
The glycolysis/gluconeogenesis pathway is significantly enriched in numerous DEGs, suggesting that sugar metabolism may be another important pathway regulating lily flowering. In lilies, SUT genes involved in sucrose transport and sugar concentration regulation have been shown to promote flowering by positively regulating the expression of FT and SOC1 genes [13]. SS accumulates significantly in the early stages of Lycoris sprengeri flower bud differentiation and is consumed in large quantities during the formation of floral organs. This indicates that sugar concentration plays a crucial role in the flowering of bulbous flowers [14]. In this study, in NFF vs. MFF, fourteen DEGs were identified in the carbon metabolism pathway, including PPK, UGT86A1, AAE1, CMDH, FDH1, G6P1DH, gpmA2, AGT1, ADH, ALDP, S-1,7P2, CYSC/PCAS-1. UGT86A1, PPK, AAE1, AGT1, and S-1,7P2 were significantly upregulated in NFF vs. MFF, while G6P1DH was significantly downregulated. L-malic acid and fumaric acid were upregulated, while D-fructose 6-phosphate was downregulated. Through the analysis of the correlation network diagram between DEGs and DAMs, L-malic acid and fumaric acid were significantly negatively correlated with ADH, while D-fructose 6-phosphate was significantly positively correlated with FDH1; however, it was significantly negatively correlated with UGT86A1 and AAE1 (Figure 10a). It can be inferred that there is a significant correlation between changes in carbon metabolism pathway genes and metabolites and female flower differentiation and the occurrence of multiple female inflorescences.
Carbohydrate and nucleic acid synthesis is crucial for the transition of stem meristematic tissue from vegetative growth to reproductive growth [62], and the construction of flower organs requires a large amount of these substances. The carbon fixation in the photosynthetic organisms pathway plays an important role in cherry flower differentiation [63]. In this study, six upregulated DEGs were identified in the carbon fixation in the photosynthetic organisms pathway, including PPK, UGT86A1, CMDH, ALDP, S-1,7P2. In NFF vs. MFF, UGT86A1, PPK, AAE1 and S-1,7P2 were significantly upregulated. In addition, L-malic acid associated with this pathway was upregulated, while D-fructose 6-phosphate was downregulated. The correlation analysis between DEGs and DAMs showed a significant negative correlation between D-fructose 6-phosphate and UGT86A1 (Figure 10b). In this study, the SS content of female flowers in NFF was higher than that of female flowers in MFF (Figure 2), indicating that sugar may be broken down into SS during female flower differentiation in NFF, while female flowers in MFF are undifferentiated. Therefore, sugar is not broken down into soluble sugar. This further confirms that coconut female flowers should accumulate sugar during physiological differentiation and subsequently consume sugar during morphological differentiation.
The core elements that regulate flower bud differentiation usually include the carbon to nitrogen ratio, plant hormones, and the involvement of floral genes [49,64]. When the ratio of carbohydrates to available nitrogen compounds in plants is high, it is beneficial for reproductive growth and may promote bud differentiation. On the contrary, it will promote nutritional growth and inhibit flowering [65]. The dynamic accumulation of sugars and nitrogen elements during flowering is crucial. When sugars accumulate to an appropriate level, nitrogen elements will be converted into the proteins required for flowering [49]. Previous studies showed that high levels of soluble sugars and sucrose in flower buds are beneficial for flower bud differentiation [59], with sucrose being the initiating signal for flower induction [66]. Shang et al. (2022) found that DEGs are highly enriched in carbohydrates, indicating that energy substances are crucial for initiating Chinese cherry flower differentiation [16]. These studies indicate that carbohydrates are a very important material basis for plant flower differentiation, and their changes have a significant impact on plant flower differentiation. Therefore, carbohydrate metabolism plays a crucial role in plant flower development and differentiation. In this study, annotated seventeen DEGs and six DAMs were identified in the following five carbohydrate metabolism related pathways (Figure 12). There were a total of six DEGs and one DAM involved in the glyoxylate and dicarboxylate metabolism including AAE1, CMDH, FDH1, AGT1, LECRK91, and GLU genes as well as L-malic acid. AAE1, AGT1, and LECRK91 were significantly upregulated in NFF vs. MFF, and L-malic acid was also upregulated (Figure 12a). Three DEGs and four DAMs were identified in the pyruvate metabolism. DEGs included AAE1, CMDH, and GLXI, with AAE1 significantly upregulated in NFF vs. MFF. 2-(alpha-Hydroxyethyl) thiamine diphosphate, fumaric acid, and L-malic acid were upregulated, while (S)-lactaldehyde was downregulated. Additionally, AAE1 and GLXI were significantly positively correlated with 2-(alpha-hydroxyethyl) thiamine diphosphate (Figure 12b). One DEG and three DAMs were identified in the citrate cycle (TCA cycle). A CMDH gene was upregulated in NFF vs. MFF, with three DAMs including 2-(alpha-hydroxyethyl) thiamine diphosphate, fumaric acid, and L-malic acid upregulated (Figure 12c). Six DEGs and one DAM were identified in glycolysis/gluconeogenesis. DEGs included PPG, UGT86A1, AAE1, gpmA2, ADH7 and ALDP. UGT86A1 and AAE1 were significantly upregulated in NFF vs. MFF, while 2-(alpha-hydroxyethyl) thiamine diphosphate was also upregulated. The correlation analysis results also showed that PPG, UGT86A1, and AAE1 were significantly positively correlated with 2-(alpha-hydroxyethyl)thiamine diphosphate, while gpmA2 and ADH7 were negatively correlated with 2-(alpha-hydroxyethyl) thiamine diphosphate (Figure 12d). Five DEGs and two DAMs were identified in pentose and glucuronate interconversion. DEGs including PME53, XK1, AtMg00810, PGT and PME8 were downregulated, and PME53 and PME8 were significantly downregulated; the related DAMs such as UDP-glucose and D-arabitol were also downregulated. PME53 and PGT were significantly positively correlated with D-arabitol, respectively (Figure 12e).
The above results indicate that pathways related to carbohydrate metabolism, such as glyoxylate and dicarboxylate metabolism, glycolysis/gluconeogenesis, pentose and glucuronate interconversions, the pyruvate metabolism and the citrate cycle (TCA cycle) play a key role in coconut flower differentiation; this also indicates that changes in the energy metabolites are crucial for the occurrence of multiple female flowers in coconut.
Amino acid metabolism may be an important pathway for regulating flowering in Arabidopsis [15]. KEGG enrichment analysis showed that differentially expressed genes were highly enriched in nucleotide and amino acid metabolism, indicating that energy and structural substances are crucial for the initiation of Chinese cherry flower differentiation [16]. The specific content of amino acids and proteins is essential for cell proliferation and morphogenesis and therefore plays an important role in flower bud differentiation [49]. In this study, in NFF vs. MFF, we found that seven DEGs and seven DAMs are involved in the amino acid metabolism pathway (“phenylalanine, tyrosine and tryptophan biosynthesis”, “tyrosine metabolism”). Five DEGs and one DAM were identified in the phenylalanine, tyrosine, and tryptophan biosynthetic pathways, including EMB1144, ADT6, TRPA1, SKL1, and DHQS genes as well as the 3-hydroxybenzoate metabolite. TRPA1 was significantly upregulated in NFF vs. MFF and showed a significant negative correlation with 3-hydroxybenzoate (Figure 11a).
Two DEGs and six DAMs were identified in the tyrosine metabolism. These genes encoding TDC1 and ADH7 were downregulated, with TDC1 being significantly downregulated. These metabolites such as 4-hydroxyphenylacetaldehyde, fumaric acid, dopaquinone, and 5,6-indolequinone-2-carboxylic acid were upregulated, L-Dopachrome and phenol were downregulated. Meanwhile, fumaric acid was negatively correlated with ADH7 (Figure 11b). This also indicates that amino acid metabolism plays a significant role in the development of multiple female flowers in coconut.
In Chrysanthem morifolium, flavonoid biosynthesis genes including CHS, CHI, FLS, and F3H were highly expressed in the early flowering stage, indicating that flavonoids may play an important role in the early flowering stage [67]. During the differentiation process of Juglans sigillata female flower buds, DEGs and DAMs related to flavonoid biosynthesis were significantly enriched. The upstream genes involved in flavonoid biosynthesis, such as CHI, CHS, and PAL have significantly higher expression levels in female flower buds than in leaf buds, especially during the undifferentiated and physiologically differentiated stages. Among them, PAL, FLS, CHS, DFR, and F3′5′H genes exhibit high network connectivity. During the critical period of female flower differentiation, the relative accumulation of phenylalanine, cinnamic acid, and coumaric acid significantly increases. In downstream metabolic pathways, substances from isoflavones, flavones, and flavonol branches accumulate more significantly during female flower differentiation, indicating that these metabolites play important roles in the differentiation process [3]. In this study, thirteen DEGs and five DAMs involved in the biosynthesis of other secondary metabolites pathways (phenylpropanoid biosynthesis, flavonoid biosynthesis, flavone and flavonol biosynthesis) were found in NFF vs. MFF. Nine DEGs were identified in the phenylpropanoid biosynthesis, including CYP450, PGIP, N4OMT, UGT89B1, F26G, TOGT1, PER3, and 1-Cyspe. d N4OMT, UGT89B1, TOGT1 and 1-Cyspe were significantly upregulated in NFF vs. MFF, while CYP450 and PER3 were significantly downregulated (Figure 13a).
Three DEGs and two DAMs were identified in the flavonoid biosynthesis. These three genes encoded CYP450, N4OMT, and ANS. N4OMT and ANS were significantly upregulated in NFF vs. MFF, while CYP450 was significantly downregulated in NFF vs. MFF. In addition, two related metabolites of this pathway, encoding neohesperidin and (-)-epicatechin, were significantly downregulated in NFF vs. MFF. Correlation analysis showed that N4OMT is significantly negatively correlated with neohesperidin (Figure 13b). One DEG and three DAMs were identified in the flavone and flavonol biosynthesis, and the RT gene was significantly downregulated in NFF vs. MFF. One DAM encoding quercetin 3-O-rhamnoside 7-O-glucoside was upregulated, while two DAMs encoding kaempferol 3-sophorotrioside and astragalin were downregulated. (Figure 13c). The above research results indicate the relevance of the biosynthesis of other secondary metabolites pathways such as phenylpropanoid biosynthesis, flavonoid biosynthesis, flavone and flavonol biosynthesis may play an important or critical role in the differentiation of coconut flowers and the occurrence of multiple female flowers.

4.3. Transcription Factor in Response to Multiple Female Flowers of Coconut

The AP2/ERF-ERF transcription factor family proteins are mainly involved in the development process of flowers [23,68]. Overexpression of RcAP2 increases the number of petals in Arabidopsis, while silencing RcAP2 reduces the number of petals [69]. In this study, in NFF vs. MFF, ERF118 transcription factor was significantly upregulated (Figure 5e). MYB transcription factors play important roles in flowering time, flower development, flower color formation, and sex differentiation of flower organs [21,23,70]. During the development of Arabidopsis reproductive organs, AtMYB125 and AMYB98 are respectively involved in the development of male flowers [71]. In this study, in NFF vs. MFF, MYB (CSA) was significantly upregulated (Figure 5e). Most studies have shown that the MADS family is a key factor in regulating plant flowering time and flower development [22,23,72]. In this study, MADS2 was significantly upregulated (Figure 5e). Members of the bHLH protein family, such as CIB1, CIB2, CIB4, and CIB5, jointly regulate flowering initiation [20,23,73]. In this study, bHLH137, and BHLH062 were significantly upregulated (Figure 5e). We speculate that these transcription factors may play a key role in the occurrence of multiple female flowers in coconut. This suggests that these transcription factors may play a key role in regulating female flower differentiation and multi-female flower occurrence.

5. Conclusions

This study integrated morphological, physiological, transcriptional, and metabolomic analyses to identify key features of female flowers associated with multiple female inflorescences in coconut. Of note, the content of ABA and JA in female flowers of MFF significantly increased by 212.32% and 300%, respectively. However, IAA, ZR, and GA in MFF decreased, with ZR and GA significantly decreasing. Furthermore, it was found that multiple DEGs are involved in the ABA, ETH, BRl, JA hormone signaling pathways and multiple key metabolic pathways. It was also found that in the NFF vs. MFF comparison group, the associated DEGs and DAMs were mainly enriched in “carbon metabolism”, “carbon fixation in photosynthetic organisms”, “phenylalanine, tyrosine and tryptophan biosynthesis”, “glyoxylate and dicarboxylate metabolism”, “glycolysis/gluconeogenesis”, “pentose and glucuronate interconversions”, “flavonoid biosynthesis”, “flavone and flavonol biosynthesis”, “pyruvate metabolism”, “citrate cycle (TCA cycle)” pathways. This result indicated that hormonal imbalance and carbon metabolism, carbon fixation in photosynthetic organisms, etc., pathways may serve as key drivers of multiple female inflorescences and flower bud differentiation. In addition, differential expression of transcription factors bHLH137, BHLH062, MYB (CSA), ERF118, and MADS2 were closely related to the occurrence of multiple female flowers in coconut. The data obtained in this study provides an important basis for in-depth analysis of the molecular mechanism of coconut flower differentiation. Subsequent focus will be on the molecular mechanism of hormone and carbon metabolism regulation in coconut flower differentiation.

Supplementary Materials

The following are available online at https://www.mdpi.com/article/10.3390/agriculture15222336/s1. Figure S1. Gene expression analysis of female flowers in NFF vs. MFF. (a) Gene expression distribution; (b) Correlation analysis of genes; (c) Principal component analysis (PCA) of genes; (d) Bar chart of DEG statistical data. NFF, normal inflorescence; MFF, more female inflorescences. Figure S2. Differentially expressed genes (DEGs) expression analysis of female flowers in NFF vs. MFF. (a) Volcanic map of DEGs; (b) Cluster analysis heatmap of DEG; (c) Functional classification of all DEGs in biological processes (BP), cellular components (CC) and molecular function (MF) categories. (d) KEGG classification chart for all DEGs. NFF and MFF has same meaning as in Figure S1. Figure S3. Analysis of all metabolites and differentially accumulated metabolites (DAMs) of female flowers in NFF vs. MFF. (a) QC correlation; (b) all correlation; (c) PCA analysis of metabolites in all samples; (d) heatmap clustering of DAMs; (e) union trend map of k-means clustering for DAMs; (e) volcanic map of DAMs. Table S1. Primers used in qRT-PCR validation in coconut female flower under NFF vs. MFF group. Table S2. The nutrient element contents of coconut female flowers from NFF and MFF treatments. Table S3. Overview of RNA-seq data statistics in coconut female flower from NFF and MFF. Table S4. Overview of compared statistics from sequence alignment results of seq-data and selected reference genomes in coconut female flower between NFF and MFF samples. Table S5. Genes with FPKM values in RNA-seq in coconut female flower of NFF vs. MFF group. Table S6. Differentially expressed genes (DEGs) with FPKM values in RNA-seq in coconut female flower of NFF vs. MFF group. Table S7. Annotatable DEGs with FPKM values in RNA-seq of coconut female flower in NFF vs. MFF group. Table S8. Annotation statistics of DEG database. Table S9. Analyses of top 20 GO enrichment pathways in coconut female flower of NFF vs. MFF group. Table S10. Analyses of KEGG enrichment pathways in coconut female flower of NFF vs. MFF group. Table S11. Metabolites identified in coconut female flower of NFF vs. MFF group. (Pos. + Neg.). Table S12. Metabolism Category of KEGG pathways in coconut female flower of NFF vs. MFF group. Table S13. KEGG pathway category of metabolism in coconut female flower of NFF vs. MFF group. Table S14. Different accumulated metabolites (DAMs) identified in coconut female flower of NFF vs. MFF group. (Pos. + Neg.). Table S15. KEGG enrichment pathways of different accumulated metabolites (DAMs) in coconut female flower of NFF vs.MFF group.(Pos. + Neg.). Table S16. KEGG enrichment pathways of correlations between differentially expressed genes (DEGs) and differentially accumulated metabolites (DAMs) in coconut female flower of NFF vs. MFF group. (Pos. + Neg.) groups (Pos. + Neg.).

Author Contributions

Conceptualization: L.L. Methodology: L.L. and Y.Z. Software: L.L. and Y.Z. Validation: Z.D., W.Y. and R.Y. Data curation: Y.Z. and Z.D. Writing—original draft preparation: L.L. Writing—review and editing: L.L. Project administration: L.L., R.Y. and W.Y. All authors have read and agreed to the published version of the manuscript.

Funding

This research was funded by the National Key R&D Program of China (2023YFD2200700), Hainan Provincial Natural Science Foundation for Young Scientists (323QN272) and the High-Level Talents Program of the Hainan Natural Science Foundation (323RC523).

Institutional Review Board Statement

Not applicable.

Informed Consent Statement

Not applicable.

Data Availability Statement

Data will be made available at https://www.ncbi.nlm.nih.gov/bioproject/PRJNA1336660 (accessed on 30 September 2025).

Acknowledgments

We would like to thank Mominur Rahman (from the Department of Agronomy, Hajee Mohammad Danesh science and technology university, Dinajpur 5200, Bangladesh), for editing the English text of a draft of this revision manuscript.

Conflicts of Interest

The authors declare no conflicts of interest.

References

  1. Zik, M.; Irish, V.F. Flower development: Initiation, differentiation, and diversification. Annu. Rev. Cell Dev. Biol. 2003, 19, 119–140. [Google Scholar] [CrossRef] [PubMed]
  2. Meijón, M.; Jesús, C.M.; Valledor, L.; Rodríguez, R.; Feito, I. Epigenetic and physiological effects of gibberellin inhibitors and chemical pruners on the floral transition of azalea. Physiol. Plant. 2010, 141, 276–288. [Google Scholar] [CrossRef] [PubMed]
  3. Chen, J.; Li, W.; Zhang, W.; Li, C.; Wang, R.; Pan, X.; Peng, J. Combined transcriptional and metabolomic analysis of flavonoids in the regulation of female flower bud differentiation in Juglans sigillata Dode. BMC Plant Biol. 2025, 25, 168. [Google Scholar] [CrossRef] [PubMed]
  4. Barrett, S.C. The evolution of plant sexual diversity. Nat. Rev. Genet. 2002, 3, 274–284. [Google Scholar] [CrossRef]
  5. Chen, S.T.; Liu, R.; Lu, L.L. Study on the Flower Blooming Law of Three Fruit Coconut Varieties. Chin. Agric. Sci. Bull. 2022, 38, 43–46. (In Chinese) [Google Scholar] [CrossRef]
  6. Broun, P. Transcriptional control of flavonoid biosynthesis: A complex network of conserved regulators involved in multiple aspects of differentiation in Arabidopsis. Curr. Opin. Plant Biol. 2005, 8, 272–279. [Google Scholar] [CrossRef]
  7. Deng, Y.; Lu, S. Biosynthesis and Regulation of Phenylpropanoids in Plants. Crit. Rev. Plant Sci. 2017, 36, 257–290. [Google Scholar] [CrossRef]
  8. Taylor, L.P.; Grotewold, E. Flavonoids as developmental regulators. Curr. Opin. Plant Biol. 2005, 8, 317–323. [Google Scholar] [CrossRef]
  9. Shan, X.T.; Li, Y.Q.; Yang, S.; Yang, Z.Z.; Qiu, M.; Gao, R.F.; Han, T.T.; Meng, X.Y.; Xu, Z.Y.; Wang, L.; et al. The spatio-temporal biosynthesis of floral flavonols is controlled by differential phylogenetic MYB regulators in Freesia hybrida. New Phytol. 2020, 228, 1864–1879. [Google Scholar] [CrossRef]
  10. Shi, Y.F.; Jiang, X.L.; Chen, L.B.; Xia, T. Functional analyses of flavonol synthase genes from camellia sinensis reveal their roles in Anther development. Front. Plant Sci. 2021, 12, 753131. [Google Scholar] [CrossRef]
  11. Yang, Q.; Dong, B.; Wang, L.; Song, Z.; Niu, L.; Li, H.; Cao, H.; Meng, D.; Fu, Y. CDPK6 phosphorylates and stabilizes MYB30 to promote hyperoside biosynthesis that prolongs the duration of full-blooming in okra. J. Exp. Bot. 2020, 71, 4042–4056. [Google Scholar] [CrossRef] [PubMed]
  12. Fan, L.; Chen, M.; Dong, B.; Wang, N.; Yu, Q.; Wang, X.; Xuan, L.; Wang, Y.; Zhang, S.; Shen, Y. Transcriptomic Analysis of Flower Bud Differentiation in Magnolia sinostellata. Genes 2018, 9, 212. [Google Scholar] [CrossRef] [PubMed]
  13. Gu, J.; Zeng, Z.; Wang, Y.; Lyu, Y. Transcriptome Analysis of Carbohydrate Metabolism Genes and Molecular Regulation of Sucrose Transport Gene LoSUT on the Flowering Process of Developing Oriental Hybrid Lily ‘Sorbonne’ Bulb. Int. J. Mol. Sci. 2020, 21, 3092. [Google Scholar] [CrossRef] [PubMed]
  14. Cai, J.; Fan, J.; Wei, X.; Zhang, D.; Ren, J.; Zhang, L. Differences in floral development between Lycoris radiata and Lycoris sprengeri. Scienceasia 2020, 46, 271–279. [Google Scholar] [CrossRef]
  15. Matsoukas, I.G. Interplay between sugar and hormone signaling pathways modulate floral signal transduction. Front. Genet. 2014, 5, 218. [Google Scholar] [CrossRef]
  16. Shang, C.; Cao, X.; Tian, T.; Hou, Q.; Wen, Z.; Qiao, G.; Wen, X. Cross-Talk between Transcriptome Analysis and Dynamic Changes of Carbohydrates Identifies Stage-Specific Genes during the Flower Bud Differentiation Process of Chinese Cherry (Prunus pseudocerasus L.). Int. J. Mol. Sci. 2022, 23, 15562. [Google Scholar] [CrossRef]
  17. Freytes, S.N.; Canelo, M.; Cerdán, P.D. Regulation of flowering time: When and where? Curr. Opin. Plant Biol. 2021, 63, 102049. [Google Scholar] [CrossRef]
  18. Arif, Y.; Sami, F.; Siddiqui, H.; Bajguz, A.; Hayat, S. Salicylic acid in relation to other phytohormones in plant: A study towards physiology and signal transduction under challenging environment. Environ. Exp. Bot. 2020, 175, 104040–104059. [Google Scholar] [CrossRef]
  19. Hui, W.; Yang, Y.; Wu, G.; Peng, C.; Chen, X.; Zayed, M.Z. Transcriptome profile analysis reveals the regulation mechanism of floral sex differentiation in Jatropha curcas L. Sci. Rep. 2017, 7, 16421. [Google Scholar] [CrossRef]
  20. Ito, S.; Song, Y.H.; Josephson-Day, A.R.; Miller, R.J.; Breton, G.; Olmstead, R.G.; Imaizumi, T. FLOWERING BHLH transcriptional activators control expression of the photoperiodic flowering regulator CONSTANS in Arabidopsis. Proc. Natl. Acad. Sci. USA 2012, 109, 3582–3587. [Google Scholar] [CrossRef]
  21. Abe, M.; Kaya, H.; Watanabe-Taneda, A.; Shibuta, M.; Yamaguchi, A.; Sakamoto, T.; Kurata, T.; Ausin, I.; Araki, T.; Alonso-Blanco, C. FE, a phloem-specific Myb-related protein, promotes flowering through transcriptional activation of FLOWERING LOCUS T and FLOWERING LOCUS T INTERACTING PROTEIN 1. Plant J. 2015, 83, 1059–1068. [Google Scholar] [CrossRef]
  22. Cheng, G.; Zhang, F.; Shu, X.; Wang, N.; Wang, T.; Zhuang, W.; Wang, Z. Identification of Differentially Expressed Genes Related to Floral Bud Differentiation and Flowering Time in Three Populations of Lycoris radiata. Int. J. Mol. Sci. 2022, 23, 14036. [Google Scholar] [CrossRef] [PubMed]
  23. Huang, X.; Liu, L.; Qiang, X.; Meng, Y.; Li, Z.; Huang, F. Integrative Metabolomic and Transcriptomic Analysis Elucidates That the Mechanism of Phytohormones Regulates Floral Bud Development in Alfalfa. Plants 2024, 13, 1078. [Google Scholar] [CrossRef] [PubMed]
  24. Lu, L.; Liu, R.; Xiao, Y.; Li, J.; Shen, X.; Li, H.; Fan, H. Research Progress on Coconut Germplasm Resources, Cultivation and Utilization. Chin. J. Trop. Crops 2021, 42, 1795–1803. (In Chinese) [Google Scholar]
  25. Deng, B.; Li, X.; Yang, J.; He, X.; Qian, C.; Bao, Q.; Yang, H.; Jie, W. Research Progress in Deep Processing and High Value Utilisation of Coconut By-products. China Fruit Veg. 2023, 43, 25–30. (In Chinese) [Google Scholar] [CrossRef]
  26. Mao, Z.S.; Qiu, W.M. Coconut High-Yield Cultivation Technology; Hainan Press: Haikou, China, 2007; pp. 1–62. (In Chinese) [Google Scholar]
  27. Hassankhah, A.; Rahemi, M.; Ramshini, H.; Sarikhani, S.; Vahdati, K. Flowering in Persian walnut: Patterns of gene expression during flower development. BMC Plant Biol. 2020, 20, 136. [Google Scholar] [CrossRef]
  28. Ma, K.; Xu, R.; Zhao, Y.; Han, L.; Xu, Y.; Li, L.; Wang, J.; Li, N. Walnut N-Acetylserotonin Methyltransferase Gene Family Genome-Wide Identification and Diverse Functions Characterization During Flower Bud Development. Front. Plant Sci. 2022, 15, 861043. [Google Scholar] [CrossRef]
  29. Li, J.J.; Pan, X.J.; Zhang, W.E. Relationship between mineral nutrition, hormone content and flower bud differentiation of Juglans sigillata. Acta Bot. Boreali-Occiden. Sin. 2016, 36, 0971–0978. [Google Scholar] [CrossRef]
  30. Li, H.S. Principles and Techniques of Plant Physiology and Biochemistry Experiment; Higher Education Press: Beijing, China, 2000; pp. 25–63. (In Chinese) [Google Scholar]
  31. Bao, S.D. Agrochemical Analysis of Soil, 3rd ed.; Agricultural Publishing House: Beijing, China, 2000; pp. 23–56. (In Chinese)
  32. Vennapusa, A.R.; Somayandal, C.J.; Jagadish, S.V.K. A universal method for highquality RNA extraction from plant tissues rich in starch, proteins and fiber. Sci. Rep. 2020, 10, 16887. [Google Scholar] [CrossRef]
  33. Sasi, S.; Krishnan, S.; Kodackattumannil, P.; Shamisi1, A.A.L.; Aldarmaki, M.; Lekshmi, G.; Kottackal, M.; Amiri, K.M.A. DNA-free high-quality RNA extraction from 39 difficult-to-extract plant species (representing seasonal tissues and tissue types) of 32 families, and its validation for downstream molecular applications. Plant Methods 2023, 19, 84. [Google Scholar] [CrossRef]
  34. Lu, L.; Wang, Y.; Sayed, M.A.; Iqbal, A.; Yang, Y. Exploring the Physiological and Molecular Mechanisms by Which Potassium Regulates Low-Temperature Tolerance of Coconut (Cocos nucifera L.) Seedlings. Agronomy 2024, 14, 2983. [Google Scholar] [CrossRef]
  35. Kim, D.; Langmead, B.; Salzberg, S.L. HISAT: A fast spliced aligner with low memory requirements. Nat. Methods 2015, 12, 357–360. [Google Scholar] [CrossRef] [PubMed]
  36. Xiao, Y.; Xu, P.X.; Fan, H.K.; Luc, B.; Xia, W.; Stephanie, B.; Xu, J.Y.; Li, Q.; Guo, A.P.; Zhou, L.X.; et al. The genome draft of coconut (Cocos nucifera). GigaScience 2017, 6, gix095. [Google Scholar] [CrossRef] [PubMed]
  37. Finn, R.D.; Bateman, A.; Clements, J.; Penelope, C.; Eberhardt, R.Y.; Eddy, S.R.; Andreas, H.; Kirstie, H.; Liisa, H.; Jaina, M.; et al. Pfam: The protein families database. Nucleic Acids Res. 2014, 42, D222–D230. [Google Scholar] [CrossRef]
  38. Tatusov, R.L.; Galperin, M.Y.; Natale, D.A.; Koonin, E.V. The COG database: A tool for genome scale analysis of protein functions and evolution. Nucleic Acids Res. 2000, 28, 33–36. [Google Scholar] [CrossRef]
  39. Li, B.; Dewey, C.N. RSEM: Accurate transcript quantification from RNA-Seq data with or without a reference genome. BMC Bioinform. 2011, 12, 323. [Google Scholar] [CrossRef]
  40. Love, M.I.; Huber, W.; Anders, S. Moderated estimation of fold change and dispersion for RNA-seq data with DESeq2. Genome Biol. 2014, 15, 550. [Google Scholar] [CrossRef]
  41. Ashburner, M.; Ball, C.A.; Blake, J.A.; Botstein, D.; Butler, H.; Cherry, J.M.; Davis, A.P.; Dolinski, K.; Dwight, S.S.; Eppig, J.T.; et al. Gene ontology: Tool for the unification of biology. Nat. Genet. 2000, 25, 25–29. [Google Scholar] [CrossRef]
  42. Alexa, A.; Rahnenfuhrer, J. topGO: Enrichment analysis for gene ontology. R package version 2.8. Cranio 2016, 2, 289–300. [Google Scholar]
  43. Robinson, M.D.; McCarthy, D.J.; Smyth, G.K. edgeR: A Bioconductor package for differential expression analysis of digital gene expression data. Bioinformatics 2010, 26, 139–140. [Google Scholar] [CrossRef]
  44. Kanehisa, M.; Goto, S.; Kawashima, S.; Okuno, Y.; Hattori, M. The KEGG resource for deciphering the genome. Nucleic Acids Res. 2004, 32, D277–D280. [Google Scholar] [CrossRef]
  45. Shannon, P.; Markiel, A.; Ozier, O.; Baliga, N.S.; Wang, J.T.; Ramage, D.; Amin, N.; Schwikowski, B.; Ideker, T. Cytoscape: A software environment for integrated models of biomolecular interaction networks. Genome Res. 2003, 13, 2498–2504. [Google Scholar] [CrossRef]
  46. Luo, W.; Brouwer, C. Pathview: An R/Bioconductor package for pathway based data integration and visualization. Bioinformatics 2013, 29, 1830–1831. [Google Scholar] [CrossRef] [PubMed]
  47. Zhang, G.; He, P.; Tan, H.; Budhu, A.; Gaedcke, J.; Ghadimi, B.M.; Ried, T.; Yfantis, H.G.; Lee, D.H.; Maitra, A.; et al. Integration of metabolomics and transcriptomics revealed a fatty acid network exerting growth inhibitory effects in human pancreatic cancer. Clin. Cancer Res. 2013, 15, 4983–4993. [Google Scholar] [CrossRef] [PubMed]
  48. Livak, K.J.; Schmittgen, T.D. Analysis of relative gene expression data using real time quantitative PCR and the 2-ΔΔCT method. Methods 2001, 25, 402–408. [Google Scholar] [CrossRef] [PubMed]
  49. Zhang, W.E.; Li, J.J.; Zhang, W.L.; Njie, A.; Pan, X.J. The changes in C/N, carbohydrate, and amino acid content in leaves during female flower bud differentiation of Juglans sigillata. Acta Physiol. Plant. 2022, 44, 19. [Google Scholar] [CrossRef]
  50. Xia, X.Q.; Xi, R.T. The periods of physiological and morphological differentiation of pistillate flower buds in walnut (Juglans regia L.). J. Hebei Agric. Univ. 1989, 12, 18–21. (In Chinese) [Google Scholar]
  51. Yu, S.; Tang, Z. Plant Physiology and Molecular Biology, 2nd ed.; Science Press: Beijing, China, 1998; pp. 556–562. (In Chinese) [Google Scholar]
  52. Qi, H.; Hao, J.; Wang, H. The Changes of Mineral Nutrient Content and C/N in Melon Leaves During Flower Bud Differentiation. J. Shenyang Agric. Univ. 2008, 39, 530–533. (In Chinese) [Google Scholar] [CrossRef]
  53. Chen, C.; Xia, C. Regulation techniques for the annual chrysanthemum season in Hainan region. Trop. Agric. Sci. 1998, 06, 59–65. (In Chinese) [Google Scholar]
  54. Dai, L.; Zhang, Q.; He, M. The Relationship between Mineral Nutrients and Flower Formation during the Flower Bud Differentiation Stage of Ponkan. Chin. Citrus 1995, 25, 20–21. (In Chinese) [Google Scholar] [CrossRef]
  55. Yuan, X.; Wei, X.; Tian, H.; Han, L.; Xu, J. Changes in Protein and Amino Acid Content during Flower Bud Germination of “Gala” Apple. North. Hortic. 2013, 9, 5–7. (In Chinese) [Google Scholar]
  56. Fang, Y.; Geng, Y.; Sun, W.; Gao, C.; Zhang, A.; Zhao, X.; Meng, J.; Zhang, Z. Studies on the Nitrogen Metabolism in the Process of Dormancy and Germinating of Cabernet Sauvignon Grapevine. Sci. Agric. Sin. 2011, 44, 5041–5049. (In Chinese) [Google Scholar] [CrossRef]
  57. Wu, Y.; Li, P.; Wu, Q. Effect of Carbohydrate and Protein Metabolism of Grapevine Leaves on Bud differentiation. J. Zhejiang Wanli Univ. 2002, 15, 54–57. (In Chinese) [Google Scholar] [CrossRef]
  58. Li, X.; Li, S.; Wang, G.; Lv, J. Changes of Acid Invertase Activity and Correlated Sugar Level in Bayberry Leaves During Flower Bud Initiation Stage. J. Sichuan Agric. Univ. 2000, 18, 164–166. (In Chinese) [Google Scholar] [CrossRef]
  59. Guo, Y.Y.; An, L.Z.; Yu, H.Y.; Yang, M.M. Endogenous hormones and biochemical changes during flower development and florescence in the buds and leaves of Lycium ruthenicum Murr. Forests 2022, 13, 763. [Google Scholar] [CrossRef]
  60. Deng, C. Study on the Physiological Mechanism of Flower Bud Differentiation in Summer Shoots of Loquat Variety ‘Zaozhong 6’. Doctoral Thesis, Sichuan Agricultural University, Chengdu, China, 2016. (In Chinese). [Google Scholar]
  61. Niwa, T.; Suzuki, T.; Takebayashi, Y.; Ishiguro, R.; Higashiyama, T.; Sakakibara, H.; Ishiguro, S. Jasmonic Acid Facilitates Flower Opening and Floral Organ Development through the Upregulated Expression of SlMYB21 Transcription Factor in Tomato. Biosci. Biotechnol. Biochem. 2018, 82, 292–303. [Google Scholar] [CrossRef]
  62. Bernier, G.; Perilleux, C. A physiological overview of the genetics of flowering time control. Plant Biotechnol. J. 2005, 3, 3–16. [Google Scholar] [CrossRef]
  63. Chmielewski, F.M.; Goetz, K.P. Metabolites in cherry buds to detect winter dormancy. Metabolites 2022, 12, 247. [Google Scholar] [CrossRef]
  64. Naor, V.; Kigel, J.; Ben-Tal, Y.; Ziv, M. Variation in endogenous gibberellins, abscisic acid, and carbohydrate content during the growth cycle of colored Zantedeschia spp., a tuberous geophyte. J. Plant Growth Regul. 2008, 27, 211–220. [Google Scholar] [CrossRef]
  65. Wan, C.Y.; Mi, L.; Chen, B.Y.; Li, J.F.; Huo, H.Z.; Xu, J.T.; Chen, X.P. Effects of nitrogen during nursery stage on flower bud differentiation and early harvest after transplanting in strawberry. Braz. J. Bot. 2018, 41, 1–10. [Google Scholar] [CrossRef]
  66. Xing, L.B.; Zhang, D.; Li, Y.M.; Shen, Y.W.; Zhao, C.P.; Ma, J.J.; An, N.; Han, M.Y. Transcription profiles reveal sugar and hormone signaling pathways mediating flower induction in apple (Malus domestica Borkh.). Plant Cell Physiol. 2015, 56, 2052–2068. [Google Scholar] [CrossRef] [PubMed]
  67. Yue, J.Y.; Zhu, C.X.; Zhou, Y.; Niu, X.L.; Miao, M.; Tang, X.F.; Chen, F.; Zhao, W.P.; Liu, Y.S. Transcriptome analysis of differentially expressed unigenes involved in flavonoid biosynthesis during flower development of Chrysanthemum morifolium ‘Chuju’. Sci. Rep. 2018, 8, 13414. [Google Scholar] [CrossRef] [PubMed]
  68. Bendahmane, M.; Dubois, A.; Raymond, O.; Bris, M.L. Genetics and Genomics of Flower Initiation and Development in Roses. J. Exp. Bot. 2013, 64, 847–857. [Google Scholar] [CrossRef] [PubMed]
  69. Han, Y.; Tang, A.; Wan, H.; Zhang, T.; Cheng, T.; Wang, J.; Yang, W.; Pan, H.; Zhang, Q. An APETALA2 Homolog, RcAP2, Regulates the Number of Rose Petals Derived from Stamens and Response to Temperature Fluctuations. Front. Plant Sci. 2018, 9, 481. [Google Scholar] [CrossRef]
  70. Dubos, C.; Stracke, R.; Grotewold, E.; Weisshaar, B.; Martin, C.; Lepiniec, L. MYB Transcription Factors in Arabidopsis. Trends Plant Sci. 2010, 15, 573–581. [Google Scholar] [CrossRef]
  71. Punwani, J.A.; Rabiger, D.S.; Lloyd, A.; Drews, G.N. The MYB98 Subcircuit of the Synergid Gene Regulatory Network Includes Genes Directly and Indirectly Regulated by MYB98. Plant J. 2008, 55, 406–414. [Google Scholar] [CrossRef]
  72. Chen, M.-K.; Lin, I.-C.; Yang, C.-H. Functional Analysis of Three Lily (Lilium longiflorum) APETALA1-like MADS Box Genes in Regulating Floral Transition and Formation. Plant Cell Physiol. 2008, 49, 704–717. [Google Scholar] [CrossRef]
  73. Liu, Y.; Li, X.; Li, K.; Liu, H.; Lin, C. Multiple bHLH Proteins Form Heterodimers to Mediate CRY2-Dependent Regulation of Flowering-Time in Arabidopsis. PLoS Genet. 2013, 9, e1003861. [Google Scholar] [CrossRef]
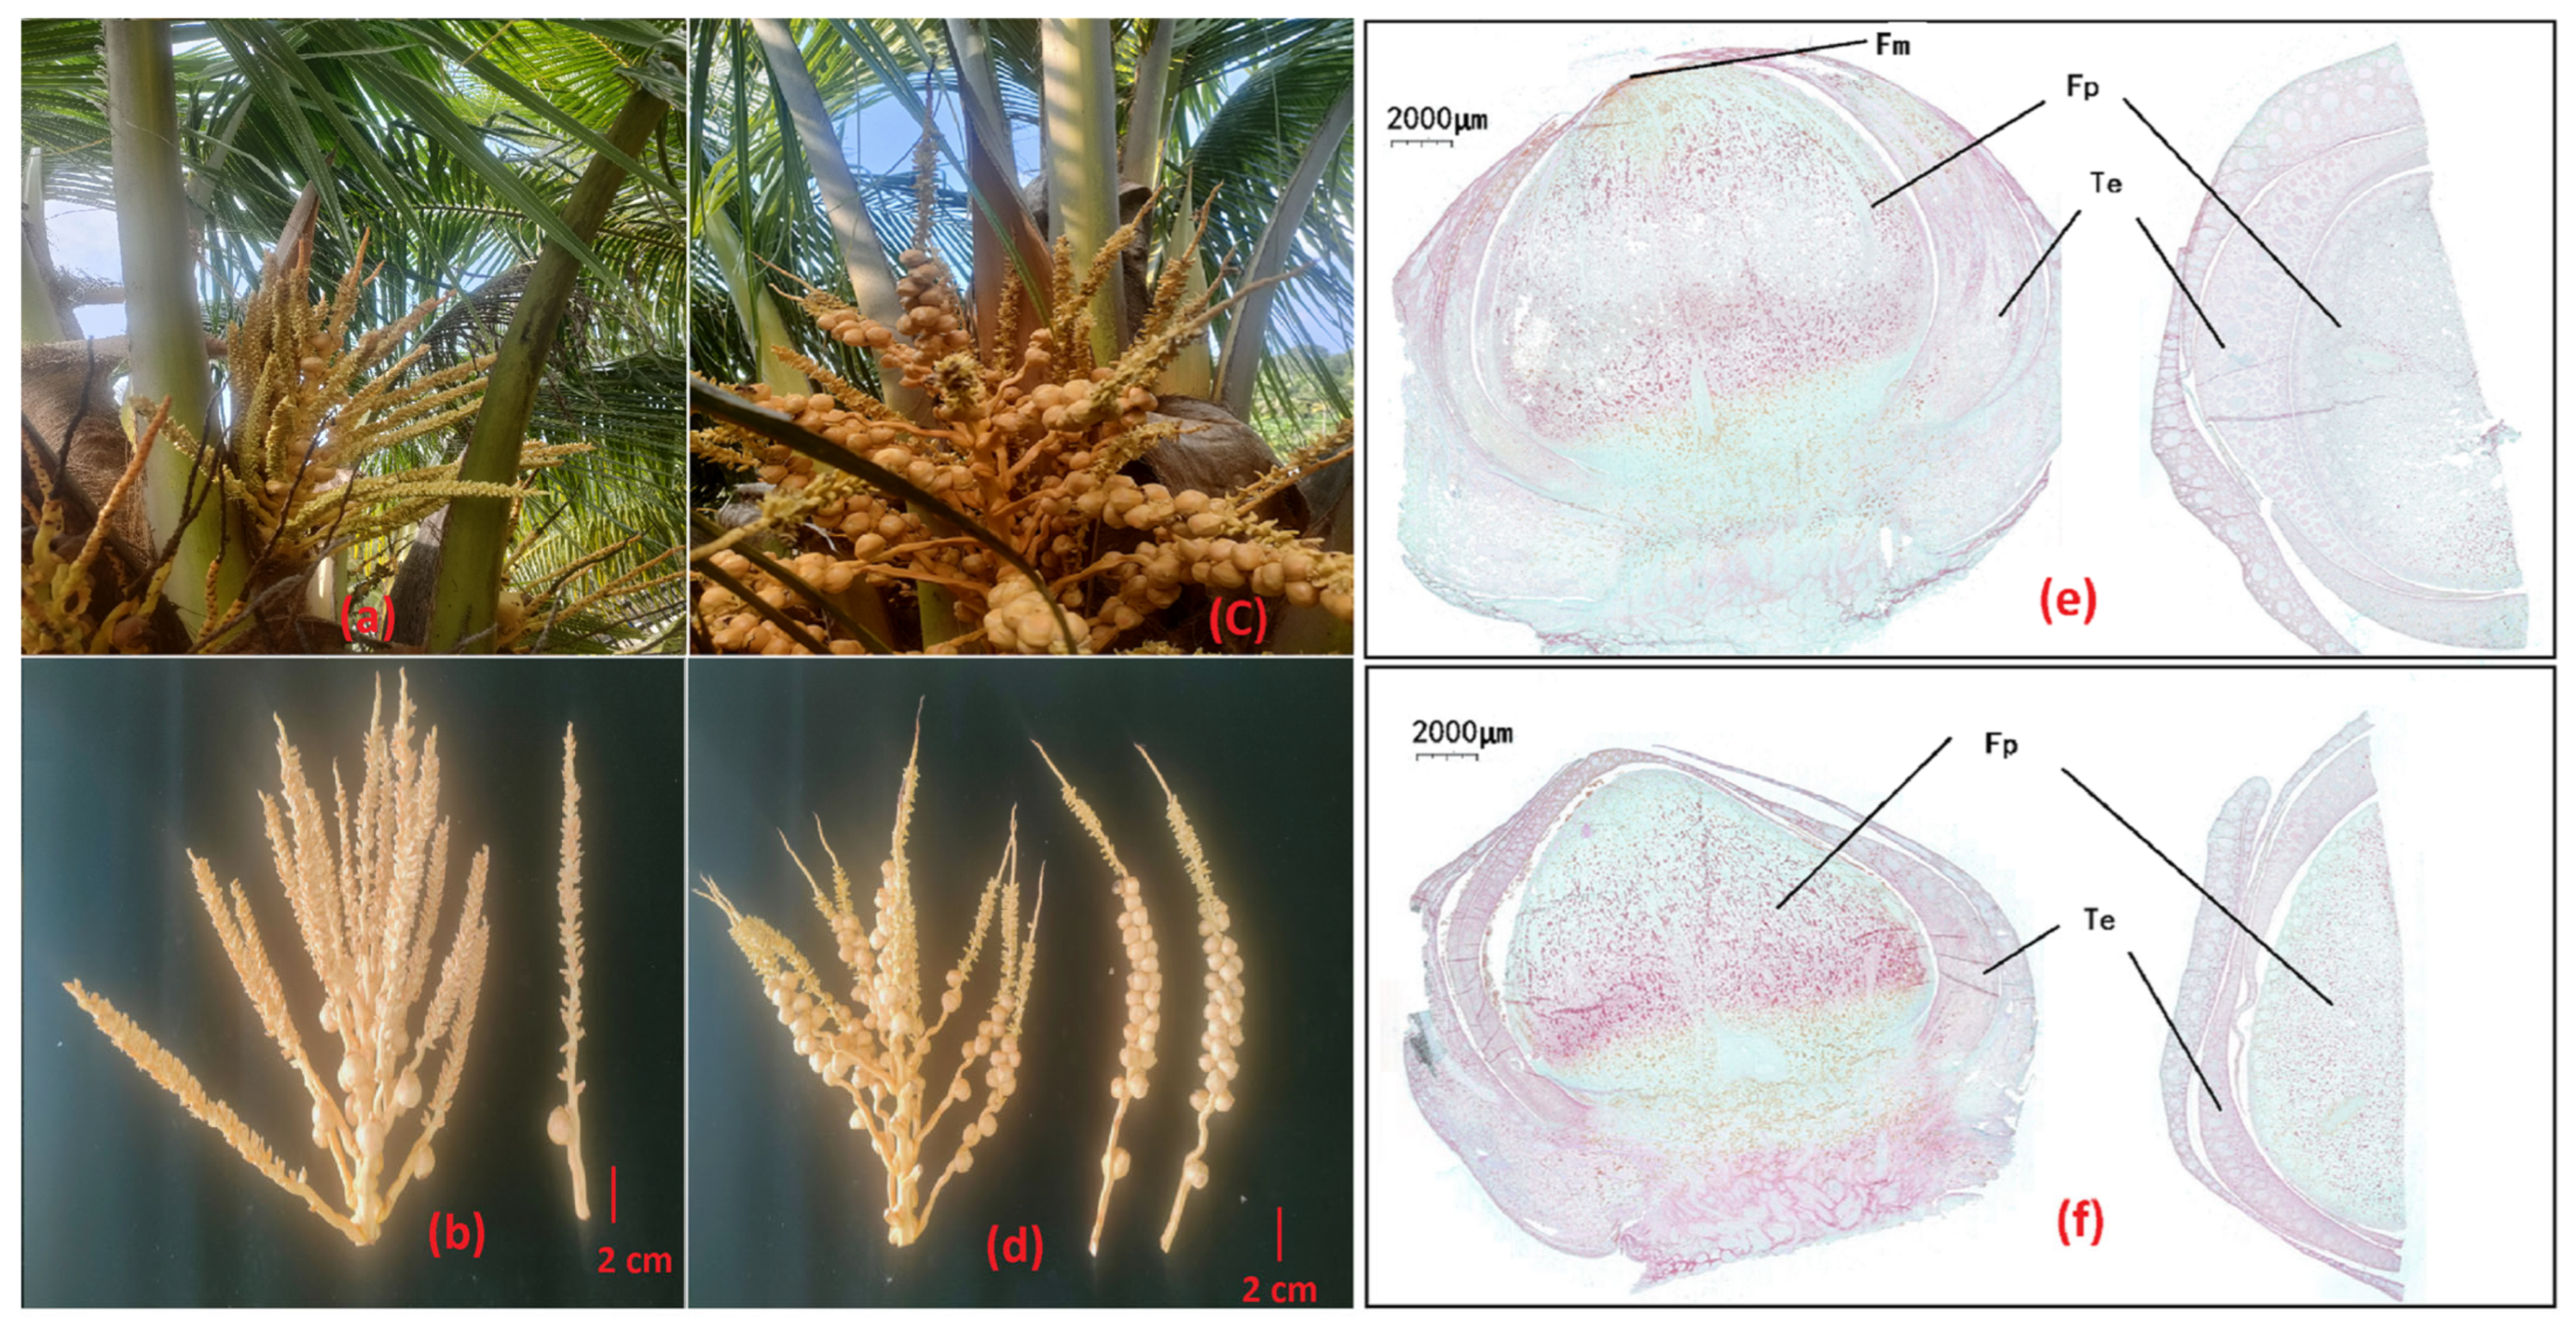
Figure 1. Morphological characteristics of coconut female flowers from NFF and MFF. (a) Photo of NFF female flowers in tree; (b) Photo of NFF female flowers; (c) Photo of MFF female flowers in tree; (d) Photo of MFF female flowers; (e) Microstructure of NFF female flowers; (f) Microstructure of MFF female flowers. NFF, normal inflorescences; MFF, multiple female inflorescences; Fm, floral meristem; Fp, flower primordium; Te, tepal.
Agriculture 15 02336 g001
Figure 2. Nutrients, physiological substances, enzyme activities of coconut female flowers from NFF and MFF. (a) SP content; (b) SS content; (c) Pro content; (d) MDA content; (e) SOD activity; (f) CAT activity; (g) POD activity. All measurements were conducted in triplicate, and the data were presented as mean ± standard deviation (SD). The Student’s t-test was used for statistical evaluation (n = 3, * p < 0.05). SS, soluble sugar; SP, soluble protein; Pro, proline; MDA, malondialdehyde; SOD, superoxide dismutase; POD, peroxidase; CAT, catalase. NFF and MFF had the same meaning as in Figure 1.
Agriculture 15 02336 g002
Figure 3. Endogenous hormones of coconut female flowers from NFF and MFF. (a) IAA content; (b) ABA content; (c) JA content; (d) ZR content; (e) GA content. All measurements were conducted in triplicate, and the data were presented as mean ± standard deviation (SD). The student’s t-test was used for statistical evaluation (n = 3, * p < 0.05, ** p < 0.01, *** p < 0.01). IAA, indole acetic acid; ABA, abscisic acid; GA, gibberellic acid; JA, jasmonic acid; ZR, zeatin riboside. NFF and MFF had the same meaning as in Figure 1.
Agriculture 15 02336 g003
Figure 4. All differentially expressed genes (DEGs) enriched in the GO and KEGG analysis of female flowers in NFF vs. MFF. (a) Bubble chart of biological processes in GO term; (b) Bubble chart of cellular components in GO term; (c) Bubble chart of molecular function in GO term; (d) Bubble chart of KEGG enrichment analysis. NFF and MFF had the same meaning as in Figure 1.
Agriculture 15 02336 g004
Figure 5. Expression analysis of the main genes involved in plant hormone signal transduction and transcription factors of female flowers in NFF vs. MFF. The expression profiles of DEGs related to phytohormones (e.g., abscisic acid (ABA) (a), jasmonic acid (JA) (b), ethylene (ETH) (c) and brassinosteroid (BR) (d) in this pathway and transcription factors (e). NFF and MFF had the same meaning as in Figure 1.
Agriculture 15 02336 g005
Figure 6. The expression of 10 genes from coconut female flowers was validated by qRT-PCR analysis. (a) RT; (b) TIFY9; (c) UGT86A1; (d) TRPA1; (e) PME8; (f) AAE1; (g) UGT89B1; (h) PER3; (i) PME53; (j) TDC1. The bar chart represents the value of FPKM. The line graph represents the qRT-PCR values. The error bars represent the standard deviation of three biological replicates. (k) Correlation of expression changes observed through RNA-seq (y-axis) and qRT PCR (x-axis). RNA-seq and qRT-PCR values between NFF and MFF were determined using Student’s t-test (n = 3, ** p < 0.01; Purple ‘**’ represented RNA-seq anlysis; Red ‘**’ represented qRT-PCR analysis). NFF and MFF had the same meaning as in Figure 1.
Agriculture 15 02336 g006
Figure 7. Metabolomic analysis of female flowers in NFF vs. MFF. (a) Classification and summary of metabolites in the HMDB database; (b) Classification and summary of metabolites in KEGG database; (c) Classification and summary of differentially accumulated metabolites (DAMs); (d) Top 10 upregulated and downregulated DAMs. NFF and MFF had the same meaning as in Figure 1.
Agriculture 15 02336 g007
Figure 8. Metabolomic analysis, integrated transcriptomic and metabolomic analysis of female flowers in NFF vs. MFF. (a) KEGG enrichment plot of differential metabolites; (b) Classification diagram of DAMs in KEGG pathways; (c) Integrated analysis principal component analysis (PCA) chart; (d) Nine quadrant diagram; (e) Hierarchical clustering heatmap of correlation analysis between DEGs and DAMs. NFF and MFF had the same meaning as in Figure 1.
Agriculture 15 02336 g008
Figure 9. Integrated analysis of transcriptome and metabolome of female flowers in NFF vs. MFF. (a) Venn diagram of DEGs, DAMs, and KEGG pathways in NFF vs. MFF; (b) KEGG enrichment bubble plot of DEGs/DAMs; (c) The top 10 pathways with the most DEGs/DAMs; (d) KEGG enrichment bar chart of the top 30 pathways with significant enrichment of DEGs/DAMs. NFF and MFF had the same meaning as in Figure 1.
Agriculture 15 02336 g009
Figure 10. Expression of DEGs and DAMs in carbon metabolism and fixation in photosynthetic organisms pathways and correlation network analysis of female flowers in NFF vs. MFF. (a) Carbon metabolism; (b) Carbon fixation in photosynthetic organisms. PPK, phosphoribulokinase; UGT86A1, UDP-glycosyltransferase 86A1; AAE1, probable acyl-activating enzyme 1; CMDH, malate dehydrogenase; FDH1, formate dehydrogenase; G6P1DH, glucose-6-phosphate 1-dehydrogenase; gpmA2, 2,3-bisphosphoglycerate-dependent phosphoglycerate mutase 2; AGT1, serine-glyoxylate aminotransferase; ADH, alcohol dehydrogenase; ALDP, fructose-bisphosphate aldolase; S-1,7P2, sedoheptulose-1,7-bisphosphatase; CYSC, bifunctional L-3-cyanoalanine synthase/cysteine synthase; PCAS-1, bifunctional L-3-cyanoalanine synthase/cysteine synthase 1. DEGs are displayed in the red oval box, while DAMs are displayed in the red rectangular box. The redder and pinker the color of the heat map, the more significant the up-regulation of DEGs and DAMs; the greener and bluer the color, the more significant the down-regulation of DEGs and DAMs. The red line in the correlation network graph represents positive correlation, while the green line represents negative correlation. The larger the correlation coefficient, the wider the line, and the darker the color. NFF and MFF had the same meaning as in Figure 1.
Agriculture 15 02336 g010
Figure 11. Expression of DEGs and DAMs in amino acid metabolism pathways and correlation network analysis of female flowers in NFF vs. MFF. (a) Phenylalanine, tyrosine and tryptophan biosynthesis; (b) Tyrosine metabolism. EMB1144, chorismate synthase; ADT6, arogenate dehydratase/prephenate dehydratase 6; TRPA1, tryptophan synthase alpha chain; SKL1, probable inactive shikimate kinase like 1; DHQS, 3-dehydroquinate synthase; TDC1, tryptophan decarboxylase TDC1; ADH7, alcohol dehydrogenase-like 7. DEGs, DAMs, NFF, MFF and other illustrations had the same meaning as in Figure 10.
Agriculture 15 02336 g011
Figure 12. Expression of DEGs and DAMs in carbohydrate metabolism pathways and correlation network analysis of female flowers in NFF vs. MFF. (a) Glyoxylate and dicarboxylate metabolism; (b) Pyruvate metabolism; (c) Citrate cycle (TCA cycle); (d) Glycolysis/Gluconeogenesis; (e) Pentose and glucuronate interconversions. AAE1, probable acyl-activating enzyme 1; CMDH, malate dehydrogenase; FDH1, formate dehydrogenase; AGT1, serine-glyoxylate aminotransferase; LECRK91, L-type lectin-domain containing receptor kinase IX.1; GLU, ferredoxin-dependent glutamate synthase; PPG, phosphoglucomutase; UGT86A1, UDP-glycosyltransferase 86A1; gpmA2, 2,3-bisphosphoglycerate-dependent phosphoglycerate mutase 2; ADH7, alcohol dehydrogenase-like 7; ALDP, fructose-bisphosphate aldolase; PME53, probable pectinesterase 53; XK1, D-ribulose kinase; AtMg00810, uncharacterized mitochondrial protein AtMg00810; PGT, polygalacturonase; PME8, probable pectinesterase 8; GLXI, lactoylglutathione lyase. DEGs, DAMs, NFF, MFF and other illustrations had the same meaning as in Figure 10.
Agriculture 15 02336 g012
Figure 13. Expression of DEGs and DAMs in biosynthesis of other secondary metabolites pathways and correlation network analysis of female flowers in NFF vs. MFF. (a) Phenylpropanoid biosynthesis; (b) Flavonoid biosynthesis; (c) Flavone and flavonol biosynthesis. CYP450, cytochrome P450; PGIP, polygalacturonase inhibitor; N4OMT, norbelladine 4′-O-methyltransferase; UGT89B1, flavonol 3-O-glucosyltransferase UGT89B1; F26G, furostanol glycoside 26-O-beta-glucosidase; TOGT1, scopoletin glucosyltransferase; PER3, peroxidase 3; 1-Cyspe, 1-Cys peroxiredoxin; ANS, leucoanthocyanidin dioxygenase; RT, anthocyanidin-3-O-glucoside rhamnosyltransferase. DEGs, DAMs, NFF, MFF and other illustrations had the same meaning as Figure 10.
Agriculture 15 02336 g013
Disclaimer/Publisher’s Note: The statements, opinions and data contained in all publications are solely those of the individual author(s) and contributor(s) and not of MDPI and/or the editor(s). MDPI and/or the editor(s) disclaim responsibility for any injury to people or property resulting from any ideas, methods, instructions or products referred to in the content.