Article

Nominal Evaluation of Automatic Multi-Sections Control Potential in Comparison to a Simpler One- or Two-Sections Alternative with Predictive Spray Switching

Findklein GmbH, 6300 Zug, Switzerland
Agriculture 2025, 15(21), 2304; https://doi.org/10.3390/agriculture15212304
Submission received: 20 September 2025 / Revised: 26 October 2025 / Accepted: 29 October 2025 / Published: 5 November 2025

Abstract

Automatic Section Control (ASC) promises to minimize spray overlap areas. The idea is to (i) switch off spray nozzles on areas that have already been sprayed, and (ii) to dynamically adjust nozzle flow rates along the boom bar that holds the spray nozzles when velocities of boom sections vary during turn maneuvers. Spraying and the movement of modern wide boom bars are highly dynamic processes with many uncertainty factors. Therefore, an Automatic Multi-Sections Control method is compared to a proposed simpler one- or two-sections alternative that uses a predictive spray switching. The comparison is provided under nominal conditions. Combinations of two area coverage path planning and switching logics as well as three sections-setups are compared. These differ by controlling 48 sections, 2 sections or controlling all nozzles uniformly with the same control signal as one single section. Methods are evaluated on 10 diverse real-world field examples. An economic cost analysis is provided. A preferred method is suggested that (i) minimizes area coverage pathlength, (ii) is suitable for manual driving by following a pre-planned predictive spray switching logic for an area coverage path plan, and (iii) and in contrast to ASC can be implemented sensor-free and therefore at low cost. Surprisingly strong economic arguments are found to not recommend ASC for small farms.

Graphical Abstract

1. Introduction

Within an agricultural arable farming context, spraying applications play a major role in the process of open-space cereal crop cultivation of grains like wheat, rapeseed, barley and the like. Spraying applications include (i) spraying of herbicides, pesticides and the like for plant protection, but can alternatively (ii) refer to spraying of fertilizing means, or in general (iii) to applications where input means are sprayed onto a work area through a set of nozzles. Throughout a crop cycle, multiple field runs are required to apply different sprays. This underlines the importance of an efficient spraying technique for the crop cycle.
Spraying in open-space agriculture is typically realized by a moving machinery, such as ground-based vehicles and, more recently, also aerial vehicles, which follow an area coverage path plan while spray is simultaneously applied to crops through nozzles. The nozzles are attached to a boom bar aligned along a working width and carried by the machinery with the purpose of applying spray along the working width [1,2,3,4].
Typically, uniform spray application over the entire field area is desired. Nevertheless, it is mentioned that there exist alternative scenarios such as spot spraying or banding, where only specific spots or bands of the field area are meant to be sprayed [5,6,7]. However, the topic for the remainder of this paper is uniform spraying.
Agricultural spraying is intrinsically linked to area coverage path planning [8,9,10,11,12]. In order to achieve uniform spraying and subject to the constraint of a given working width, an area coverage path plan is desired that avoids area coverage gaps and overlaps, while minimizing area coverage pathlength.
Agricultural spraying is also intrinsically linked to the development of logics for spray switching, i.e., for the on and off switching of nozzles. Besides optimized area coverage path planning, a second strategy for efficient and resource-saving spraying is to suitably switch on and off individual nozzles for areas already sprayed, and to vary nozzle flow rates of individual nozzles along turn maneuvers to compensate for different traveling velocities of different sections of the boom bar. The name for this is Automatic Section Control (ASC) or Automatic Boom Section Control [13]. ASC is a long-standing trend for spray applications in agriculture [14].
The research of this paper is motivated by the observation of the complexity of the spraying process and ASC, especially for open-space agriculture. The spraying process is affected by a remarkable amount of parameters. These include nozzle type, spray fan angle, spray pressure, boom height, nozzle spray overlap, nozzle spacing, nozzle clogging, machinery traveling speed changes, cross wind for spray drift and more [7,15,16,17,18,19,20,21,22,23,24,25,26,27]. For unmanned aerial spraying [28], in contrast to traditional spraying with tractors carrying or trailing spraying machinery and sprayers operating close to the ground, dynamic effects are further amplified. Furthermore, for ASC on top of these factors accurate localization data and velocity estimates are required along a wide boom bar, whose movement is highly dynamic and also affected by mechanical structure vibrations and inertia. This further adds to the complexity of the spraying process. See also Figure 1.
Second, three different setups for the number of sections are considered: 1, 2 or multiple sections. See Figure 2 for the illustration. In all three cases always the same number of nozzles is controlled. However, nozzles are controlled either individually or uniformly. For the 1-section setup all nozzles along the boom bar uniformly receive the same switch-on or switch-off signal. In contrast, for the multiple sections-setup different sections can receive different switch-on or switch-off signals.
This raises the natural question: “In view of the plethora of complexities of the spraying process, is ASC quantitatively worth it and does an alternative exist?”
To approach this question, this paper (i) focuses on nominal conditions, and (ii) tries to answer first the following question: “What is the best-case performance an optimal ASC-solution under nominal conditions can achieve in comparison to an alternative practical method?”. It is crucial to note that this evaluation under ’nominal conditions’ establishes a theoretical upper bound for ASC’s performance. In the real world, performance will inevitably be affected and degraded by the aforementioned multiple uncertainty factors, which may reduce the potential savings.
For comparison, an alternative practical method is suggested that varies from a common ASC-solution along two independent vectors: (i) a predictive spray switching logic is employed that is tailored to (ii) a specific path pattern. The predictive spray switching method from [30] is employed, which is here extended to the non-convex general case with non-convex field areas and multiple obstacle areas. This method employs a predictive switching logic tailored to a specific path pattern. This is in contrast to the reactive switching logic that is common for ASC, which is based on Boustrophedon-based path planning (Ancient Greek for “like the ox turns”, e.g., [31,32]) with a meandering path pattern.
To summarize, the research questions addressed in this paper are as follows:
Research Questions. 
What is the performance benefit of Automatic Section Control (ASC) under nominal conditions? More specifically, (i) suggest a practical alternative that can also be realized by manual on- and off-switching of at most two boom-sections along the boom bar, and (ii) analyze what best-case savings ASC can provide in comparison to the alternative under idealistic nominal conditions.
Thus, in total, six different experimental setups are compared. Evaluation metrics are (i) pathlength, (ii) spray volume consumption in liters (a proxy for the overlap area, but more accurate since also accounting for nozzle flow rate variations for turn compensation), and (iii) overlap area visualization. In addition, a detailed economic cost discussion is provided.
The remaining paper is organized as follows: materials and methods, results, discussion and the conclusion are described in Section 2, Section 3, Section 4 and Section 5.

2. Materials and Methods

This section lists uncertainties associated with the spraying process, before discussing four hierarchical planning levels for agricultural area coverage, and finally discussing two different alternatives for each of the first three planning levels.

2.1. Complexity of the Spraying Process

The optimization of the spraying process is driven by two contradicting objectives: spraying overlap avoidance and spraying gap avoidance. These contradicting objectives are the root-cause for the complexity of the spraying process.
Table 1 lists factors that influence uncertainty of the spraying process, particularly in open-space agriculture. A list is provided for clarity and to underline complexity.
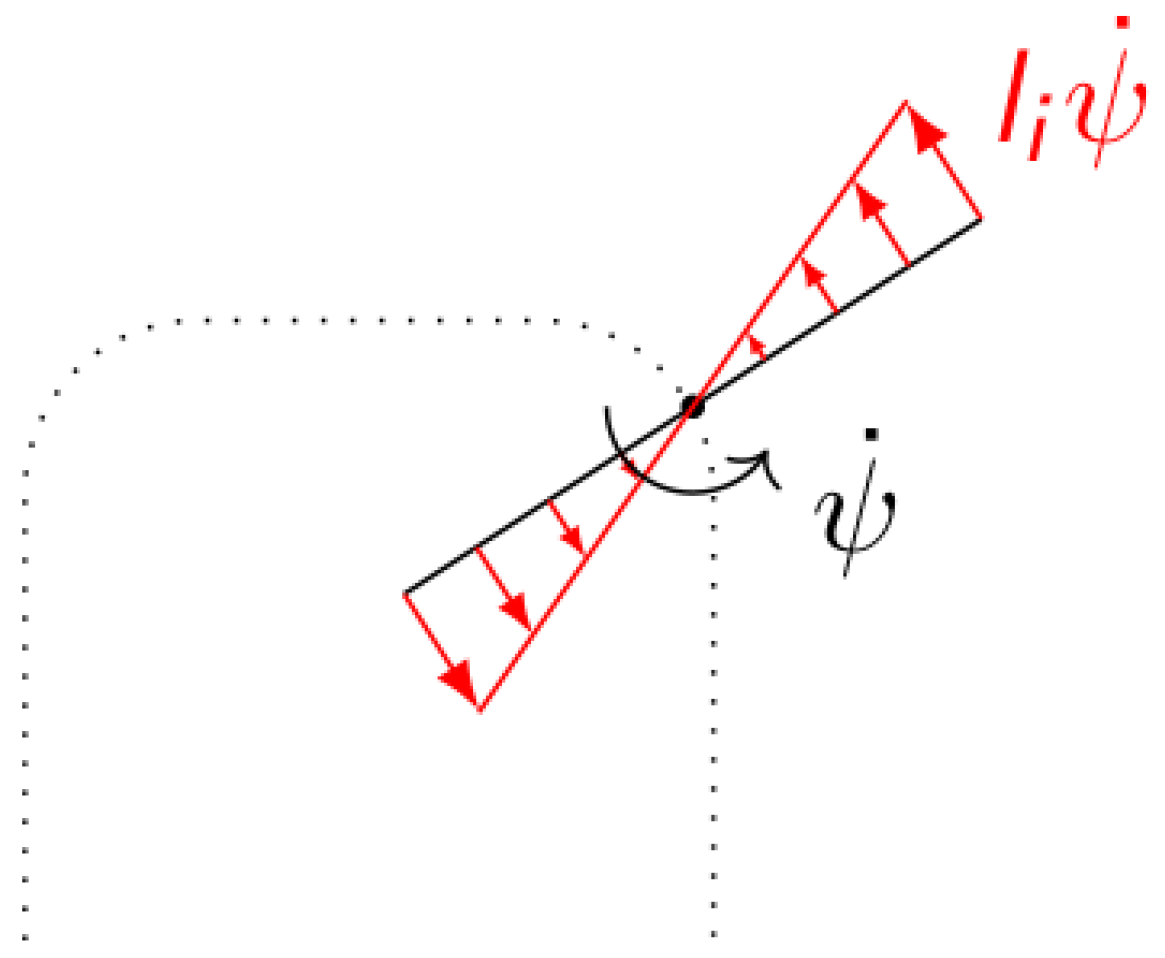
For unmanned aerial spraying [28], in contrast to traditional spraying with tractors carrying or trailing spraying machinery and sprayers operating close to the ground, dynamic effects are further amplified. Some complexities are further illustrated in Figure 3, Figure 4 and Figure 5.

2.2. Four Hierarchical Planning Levels

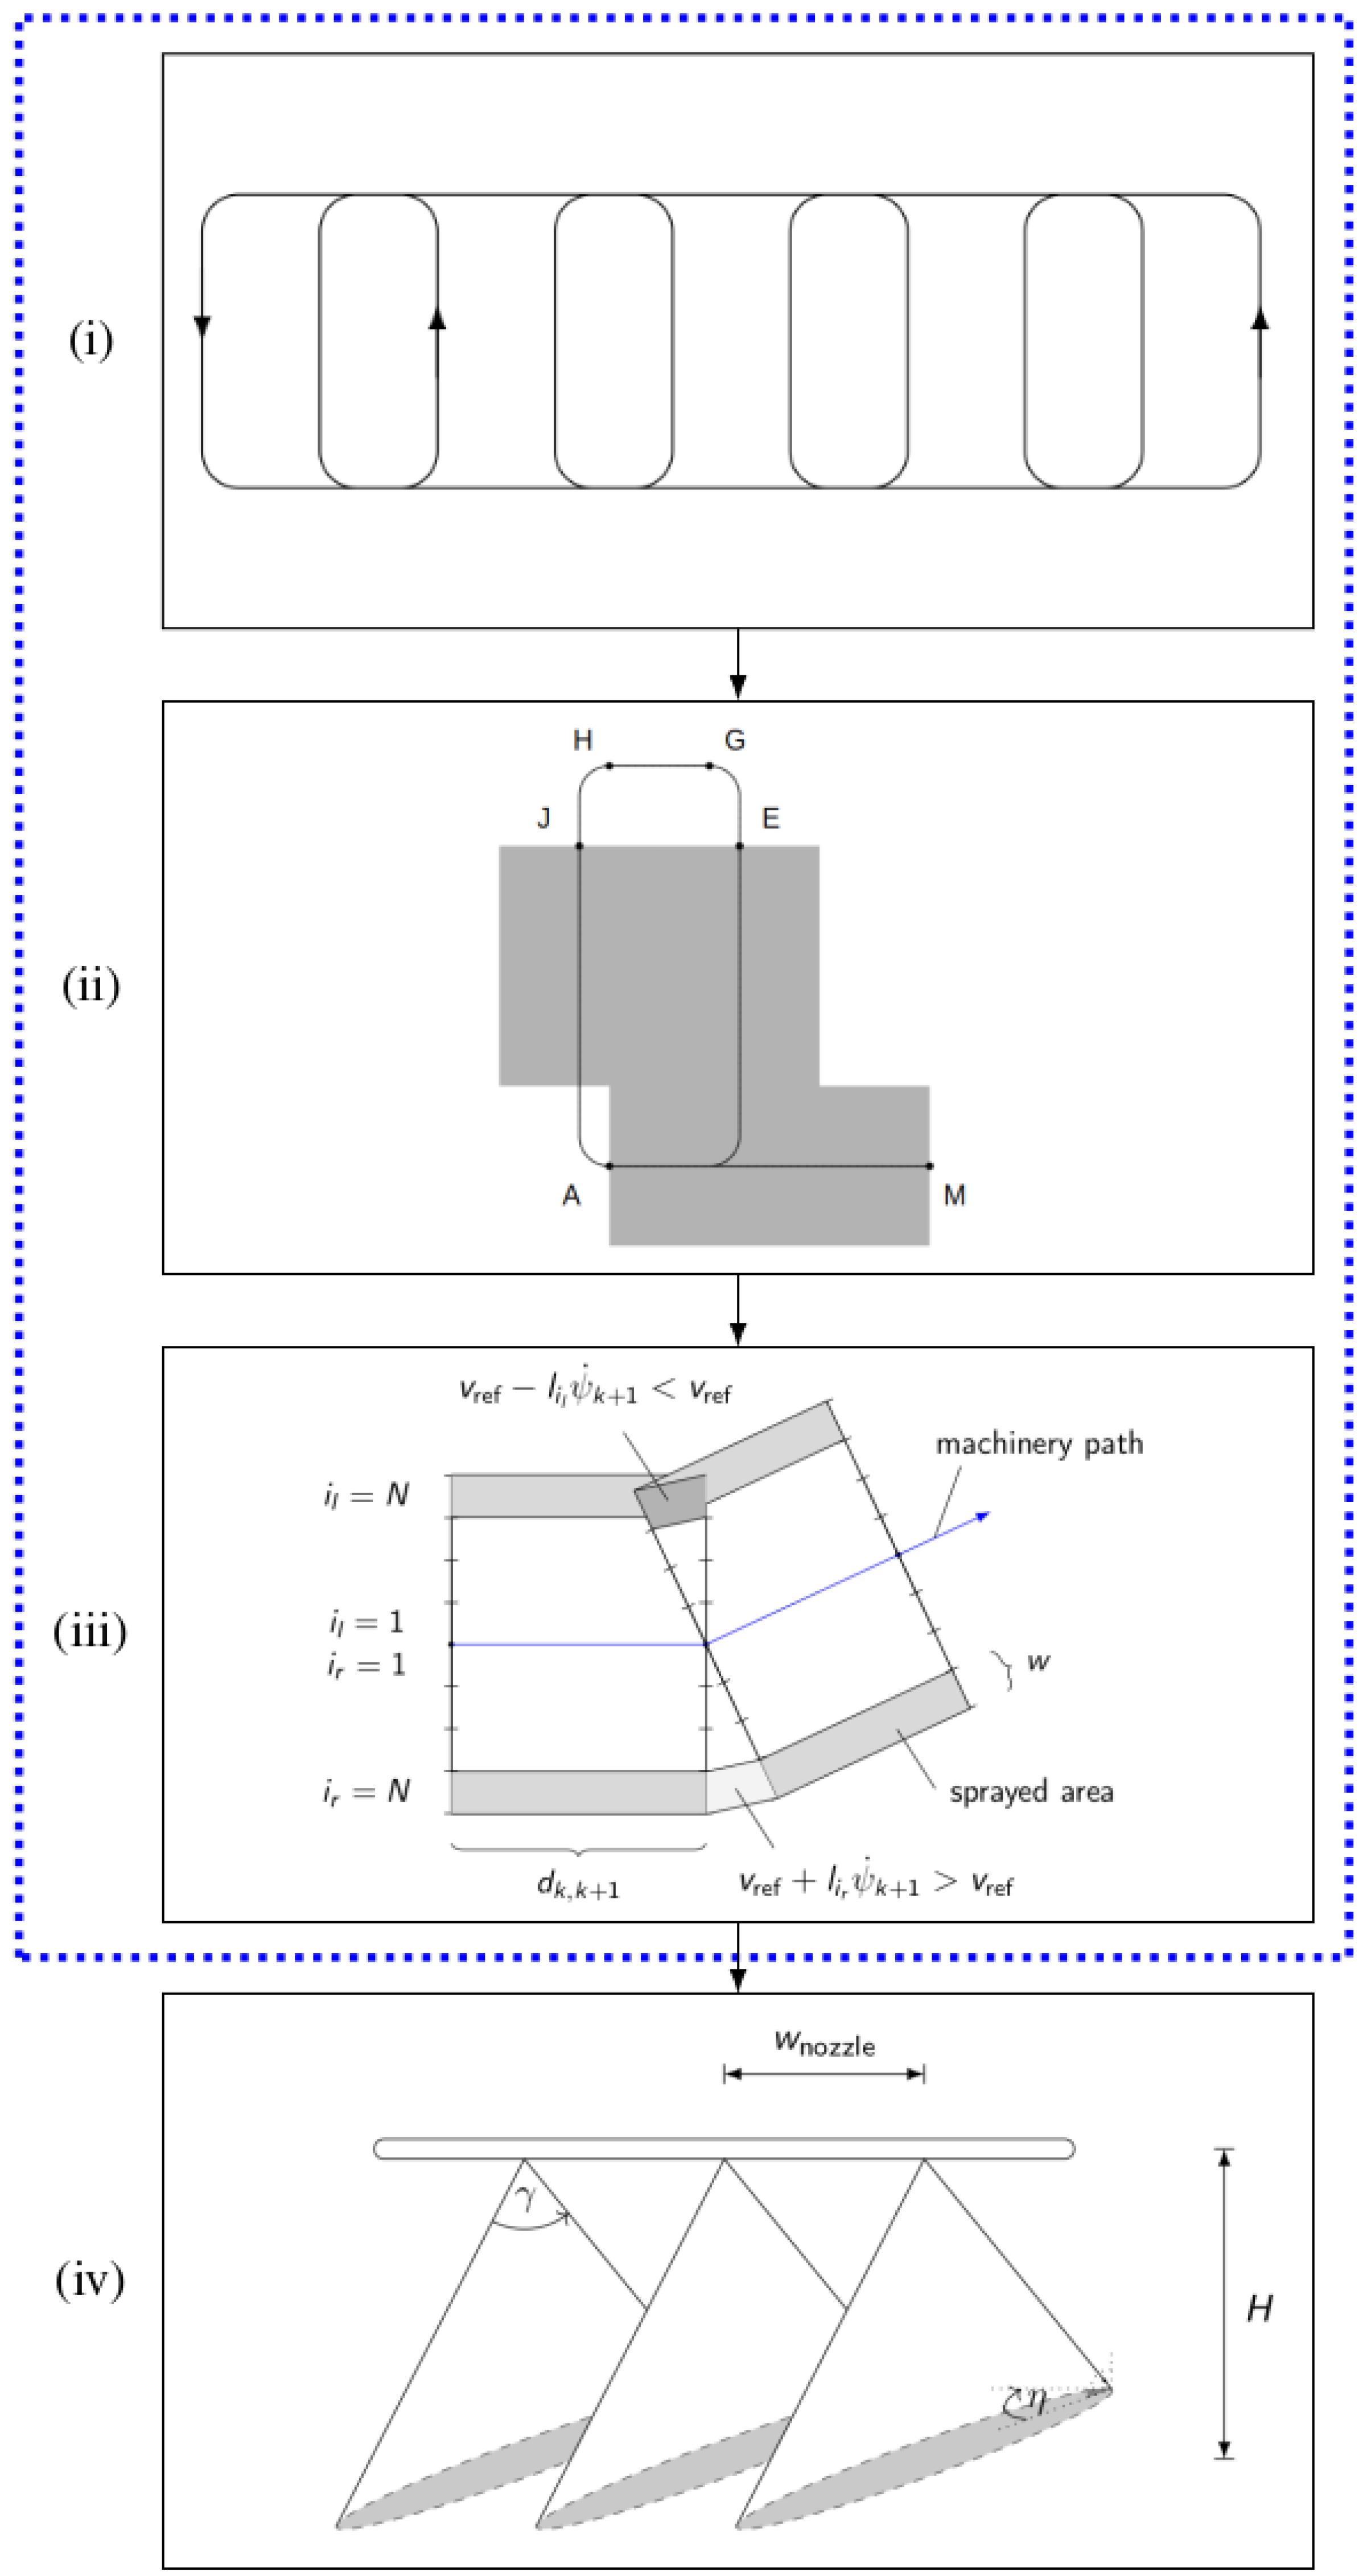
For area spraying it can be differentiated between 4 hierarchical planning levels: (i) an area coverage path planning-level where for a given field area it is distinguished between a mainfield area and a headland area used for turning, before fitting a lane-grid consisting of a headland path and mainfield lanes, and determining an area covering path based on this lane-grid [9,34,35], (ii) a high-level spray switching level here denoted as block switching-level, which differentiates between switching logics at the transitions between mainfield lanes and headland path segments [30], (iii) a sections switching-level which differentiates between switching-states along different sections along the boom bar, and (iv) a nozzle control-level which covers all details about individual nozzle control such as e.g., nozzle flow rate at the machine level [24]. For illustration see Figure 6. The focus of this paper is on the first three hierarchical levels (i)–(iii). These three levels will be described in detail in the next three subsections.
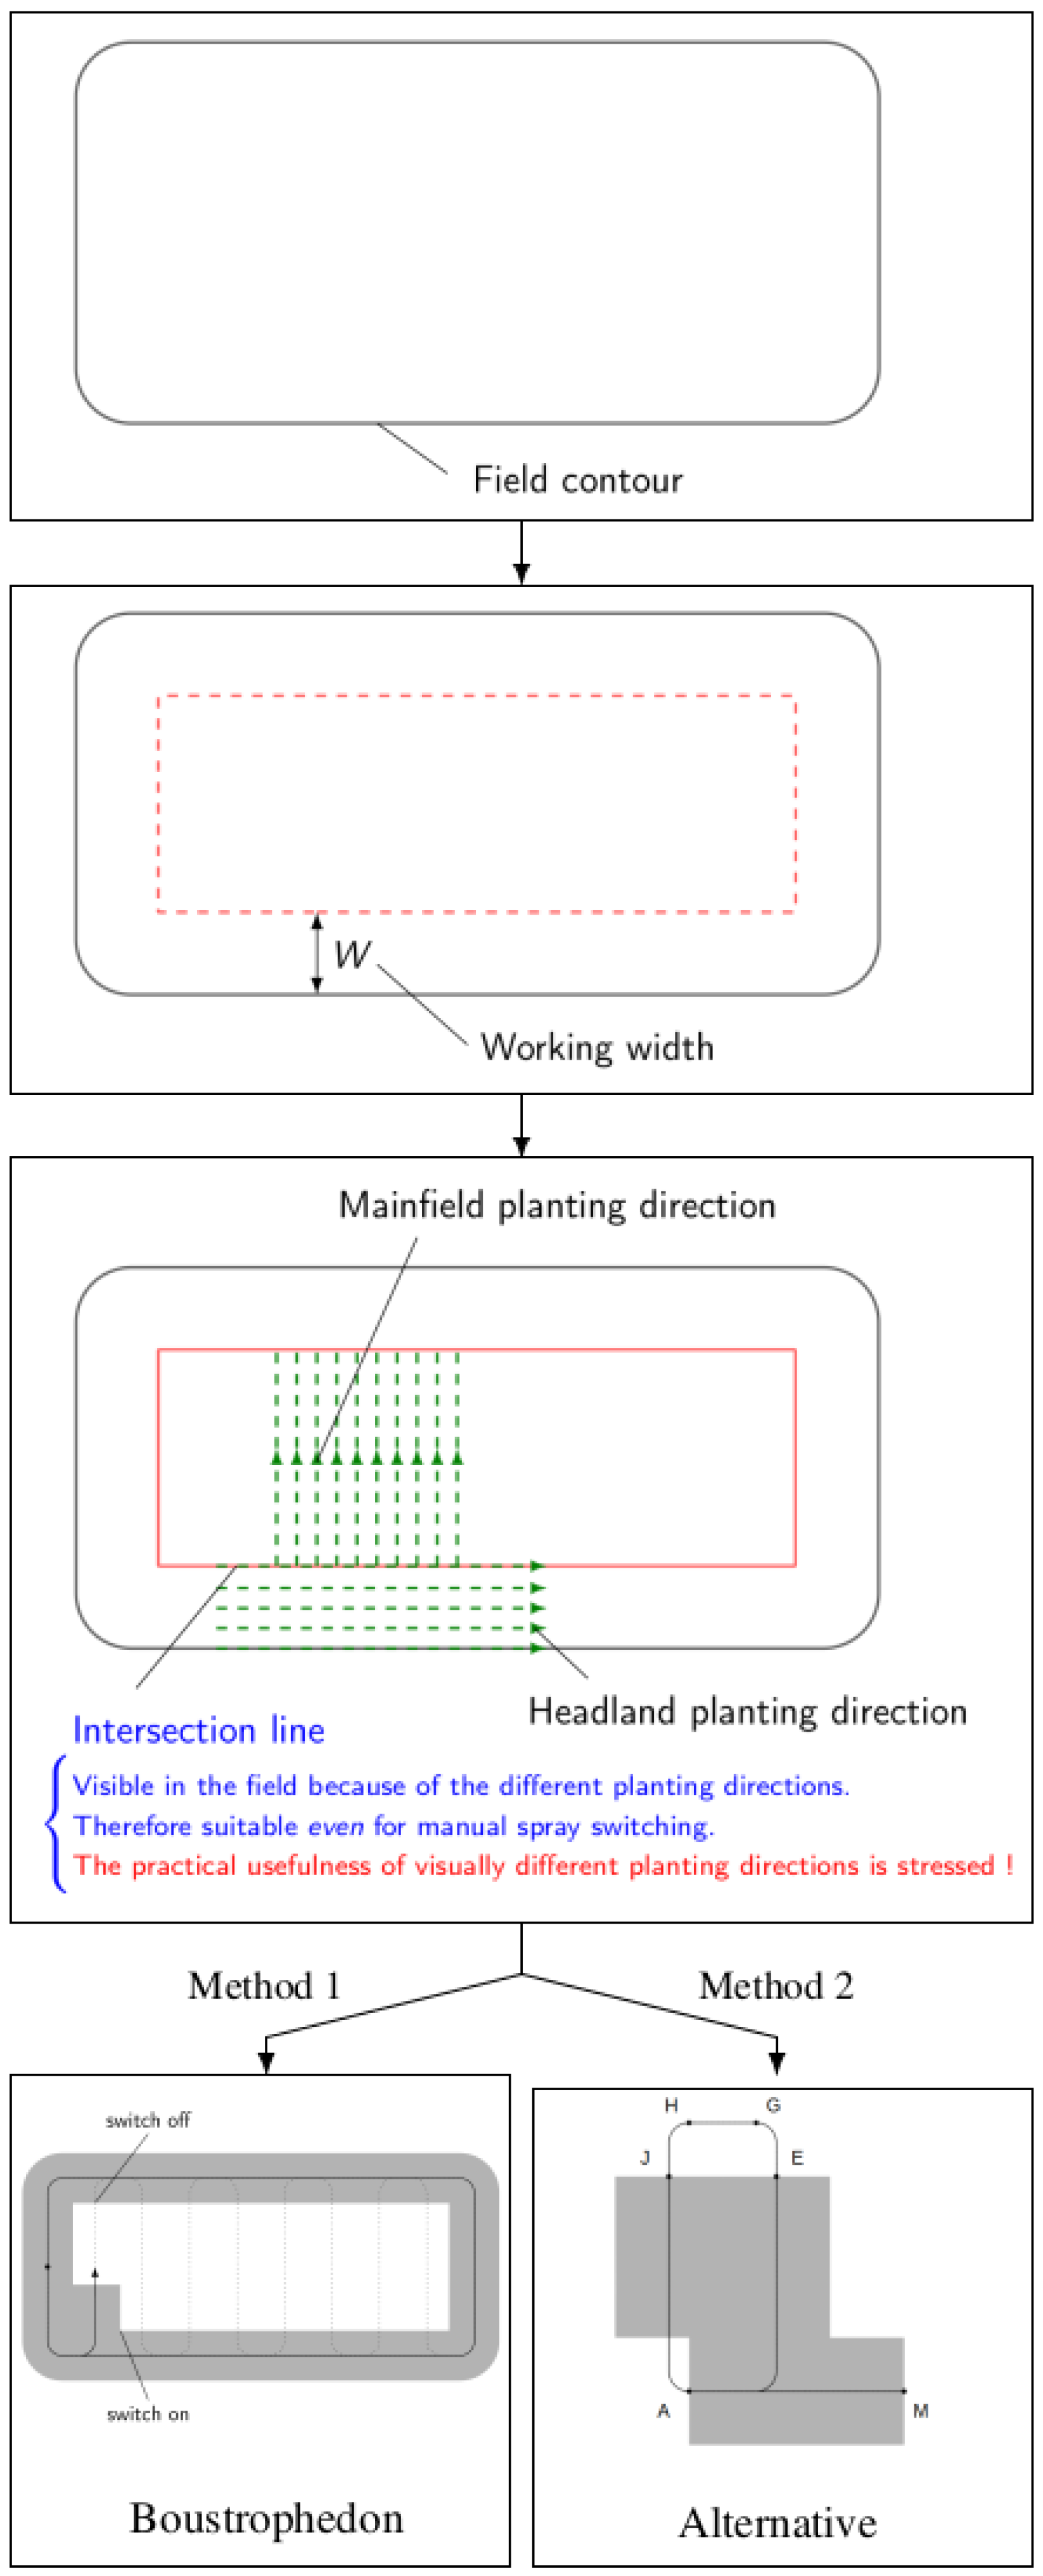
Note that the spraying process can be further facilitated by the design of the seeding process, which precedes the spraying process. Two influences are mentioned. First, the orientation of straight mainfield lanes or alternatively freeform mainfield lanes can facilitate turning or reduce the required number of transitions between mainfield lanes and headland path [36]. Second, the intersection line between mainfield area and headland area can be used as visual cue to determine suitable spray on/off-switching locations. See Figure 7.

2.3. Area Coverage Path Planning Level

Two different area coverage path planning strategies are compared. For convexly-shaped fields these can be used throughout. For the non-convex cases a graph optimization problem is solved that adopts the respective strategies whenever possible.
  • Boustrophedon: Boustrophedon paths, whose name is derived from Ancient Greek for “like the ox turns”, represents the standard pattern for area coverage applications and agricultural real-world praxis. It is characterized by a full headland coverage before mainfield lanes are traversed in a meandering pattern. See Figure 8a,c.
  • Alternative: The method from [9] is used for area coverage path planning. It differs from the Boustrophedon method by optimizing the sequence of lanes and turns to minimize total path length, often employing less conventional but more efficient field patterns for non-convex and obstructed areas. For convexly shaped field areas, the method can be reduced to a recurring path pattern that is discussed in detail in [37] and shown in Figure 8b,d. Headland path edges and headland-to-mainfield lane transitions can be smoothed [38,39].

2.4. Block Switching Level

According to the hierarchical structure of Figure 6, a block swiching logic is applied on top of a given area coverage path plan according to the methods from the previous Section 2.3.
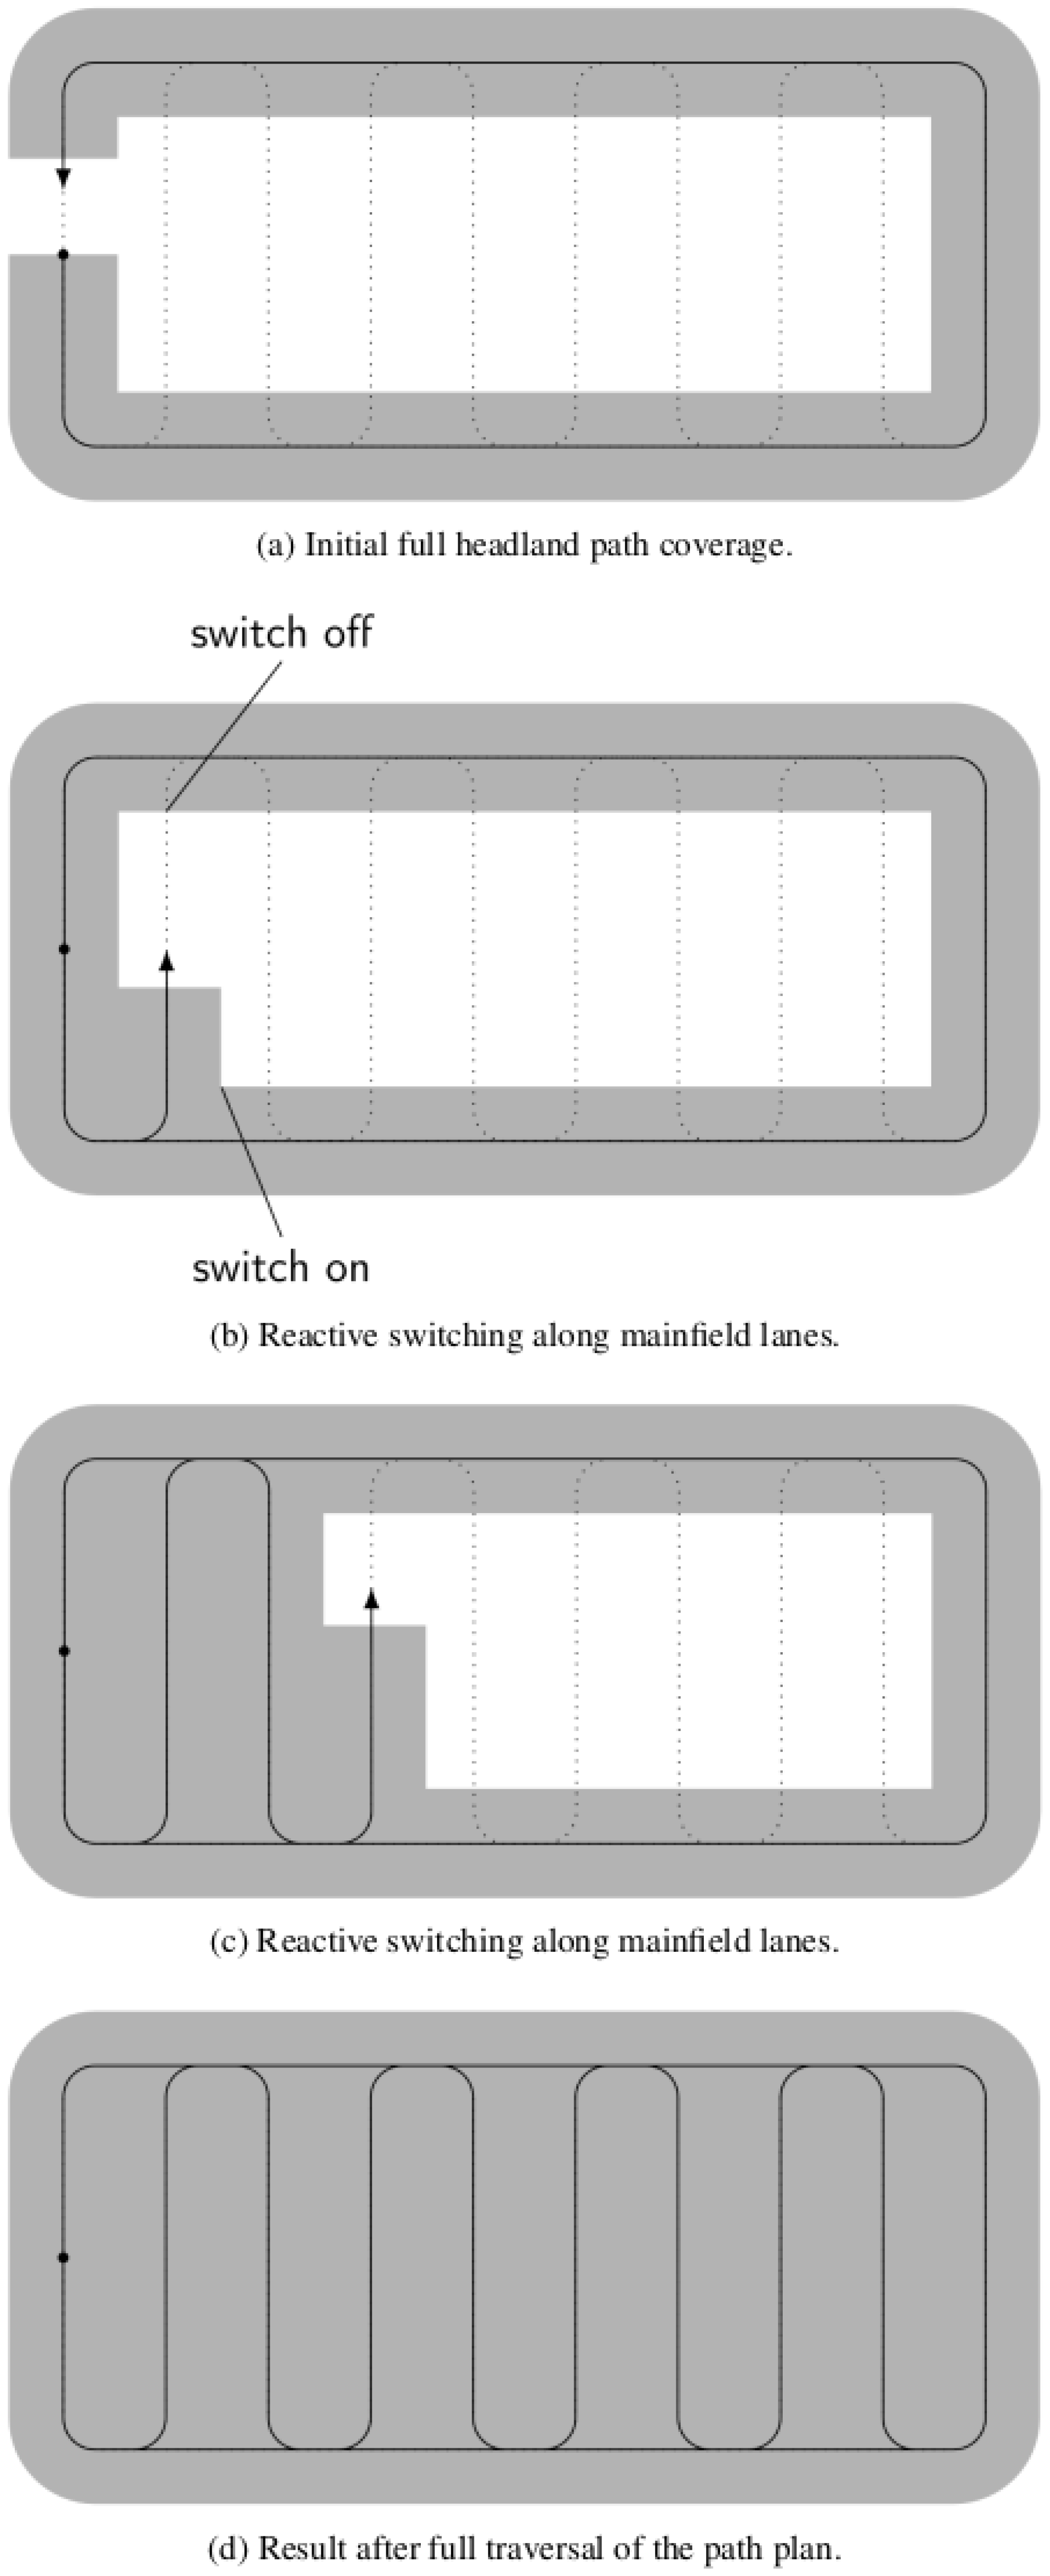
  • Boustrophedon: The associated switching logic on top of this area coverage path planning method is illustrated in Figure 9.
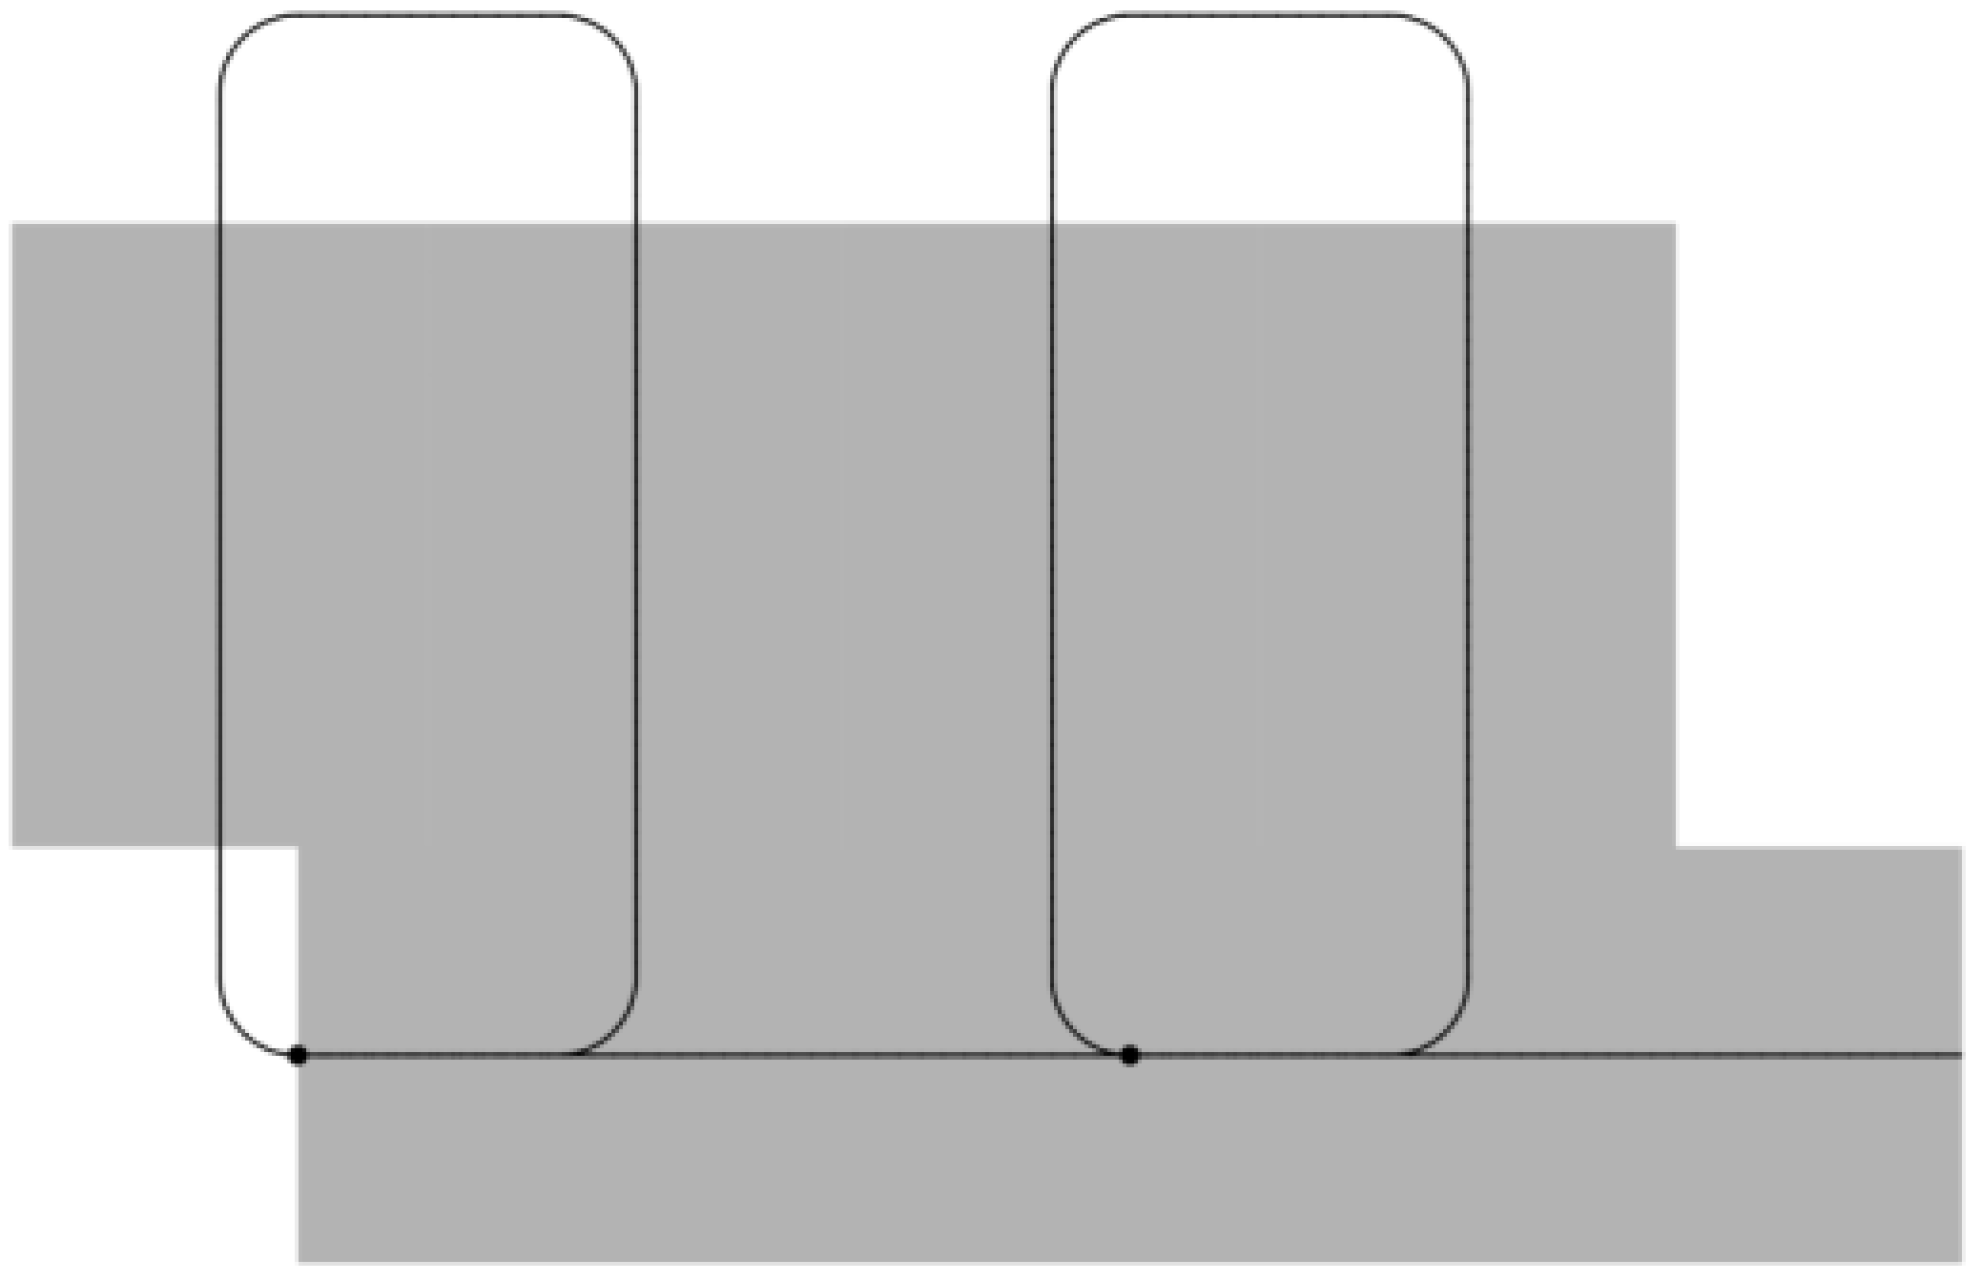
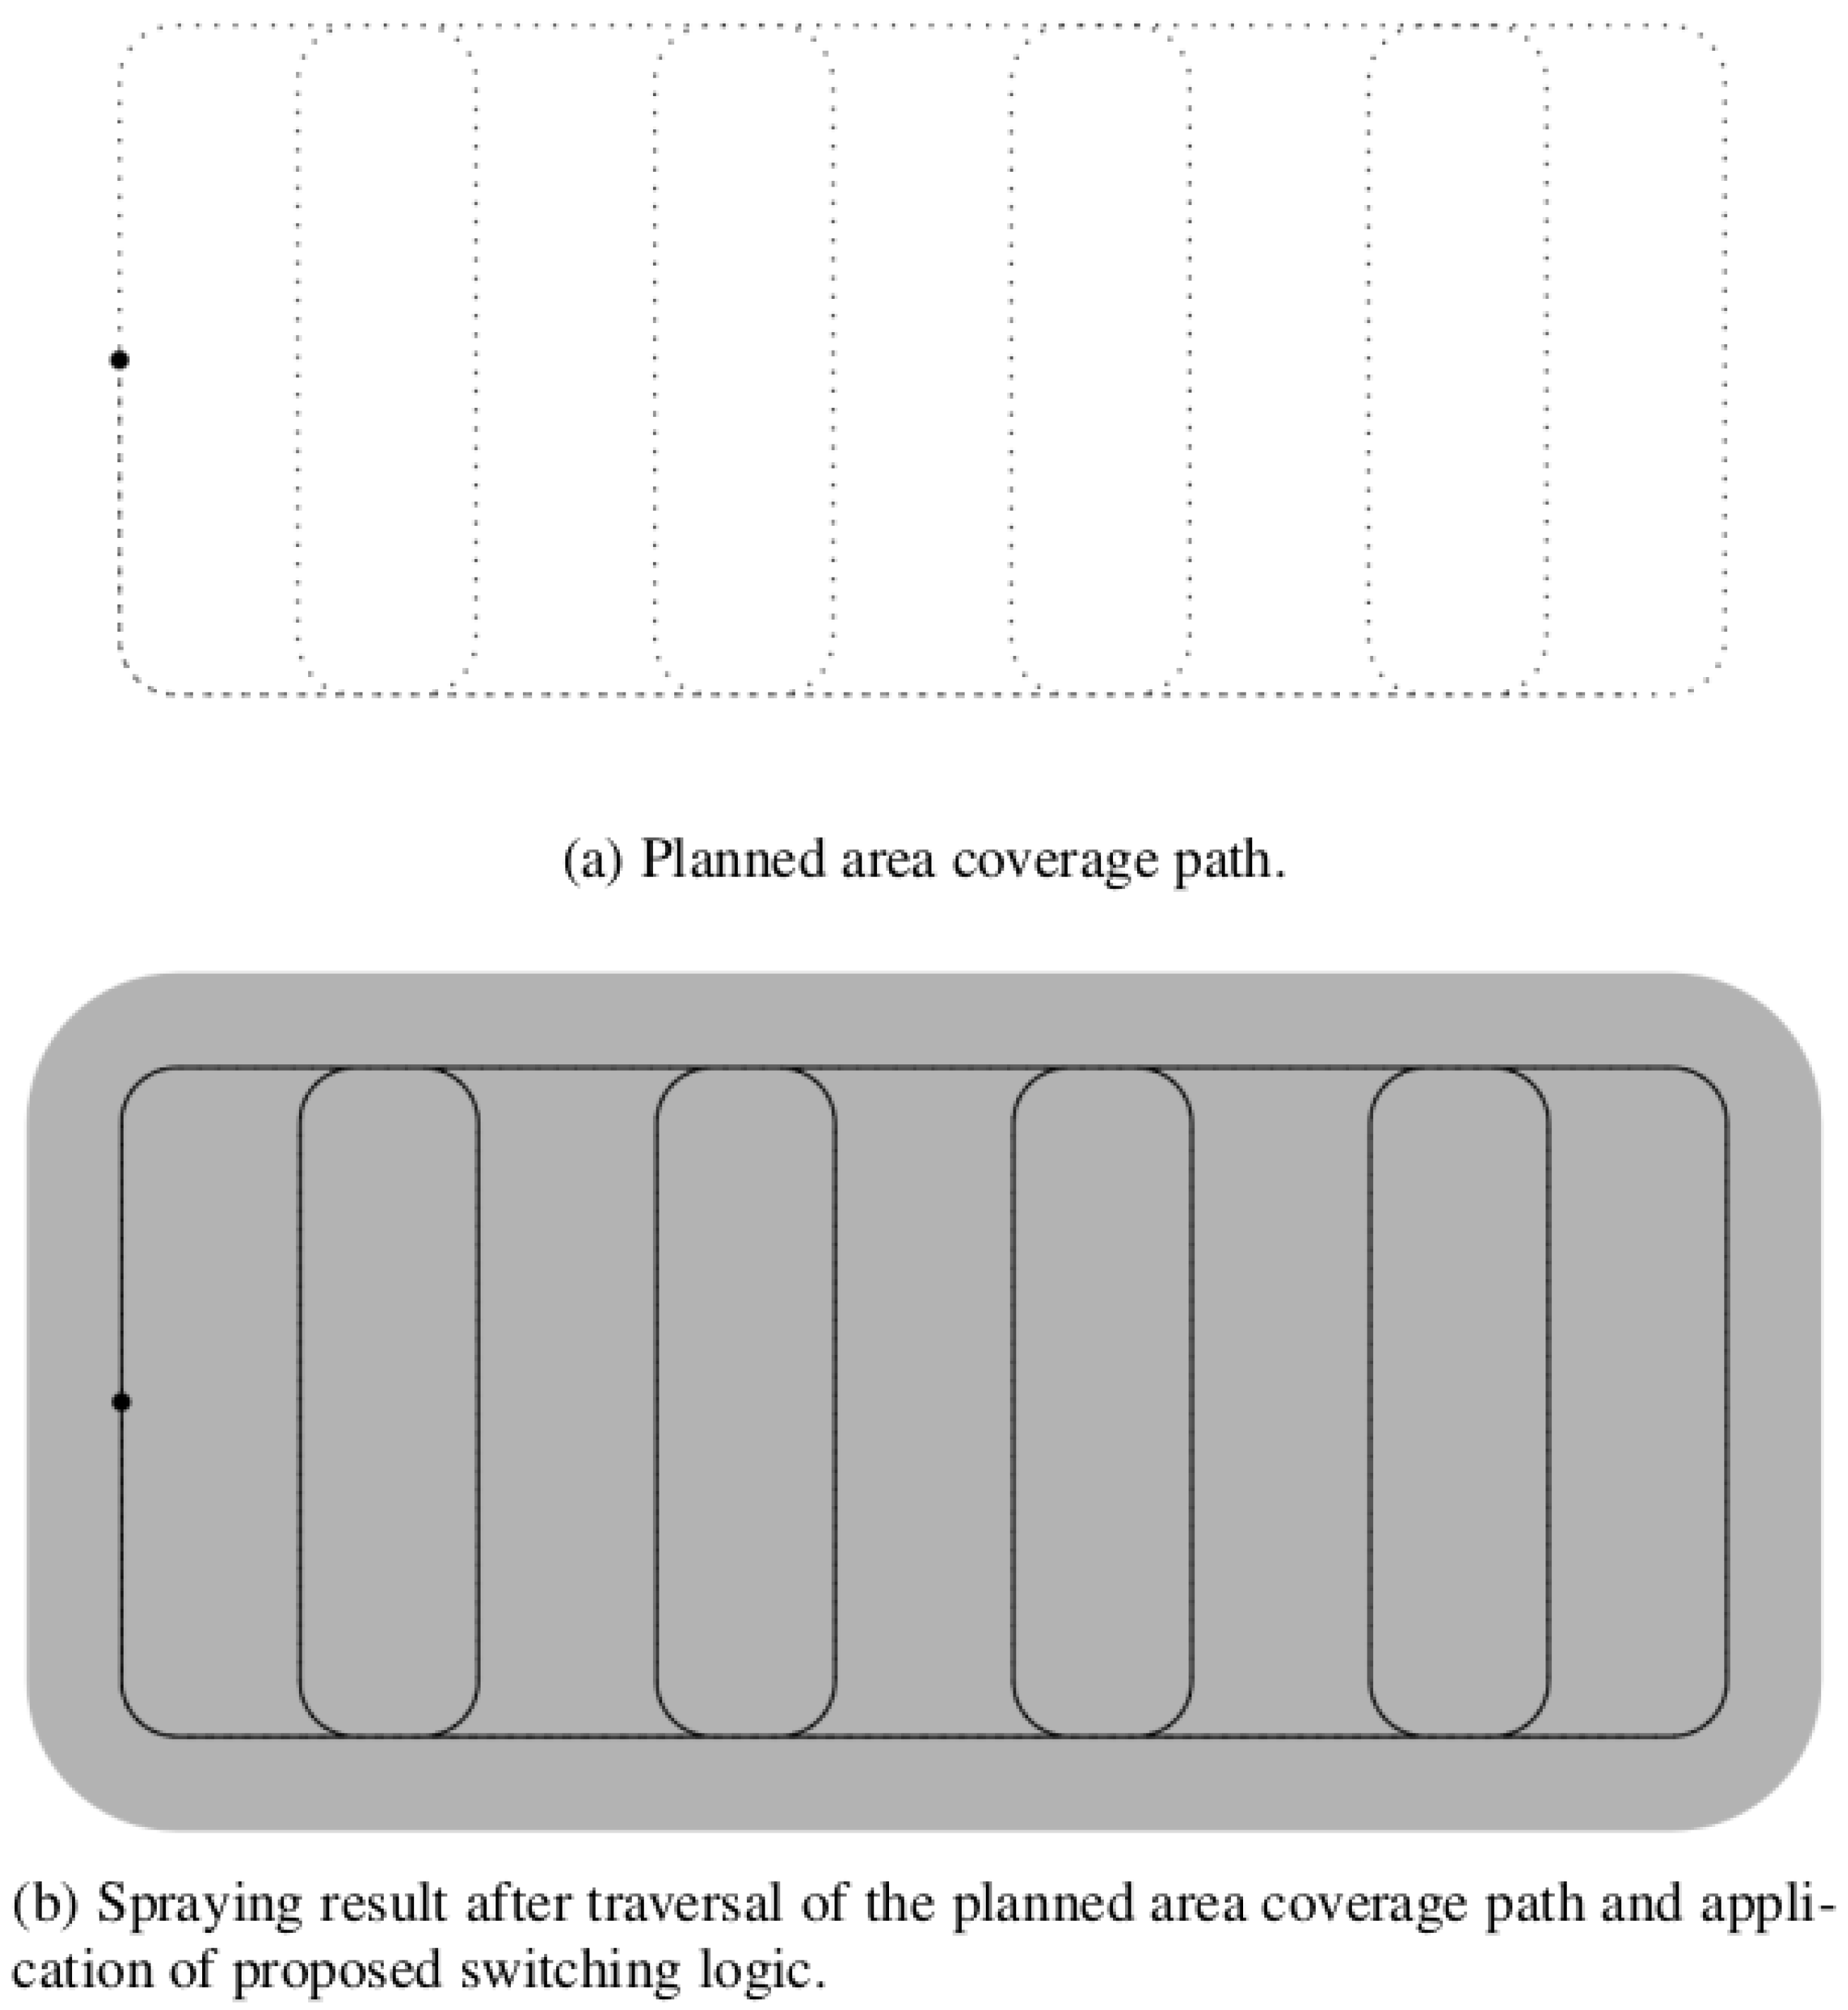
  • Alternative: The associated switching logic is summarized in Figure 10, Figure 11 and Figure 12. The logic is introduced in detail in [30].
In the following, the Boustrophedon-based and alternative area coverage path planning methods in combination with their corresponding block switching logic shall be abbreviated by method M 1 and M 2 , respectively.

2.5. Sections Switching Level

According to the hierarchical structure of Figure 6, on the sections switching level (i) a decision regarding section width, and (ii) regarding discretization modeling has to be made. There are 2 factors that influence our discretization modeling of spray section areas at each sampling distance along a path.
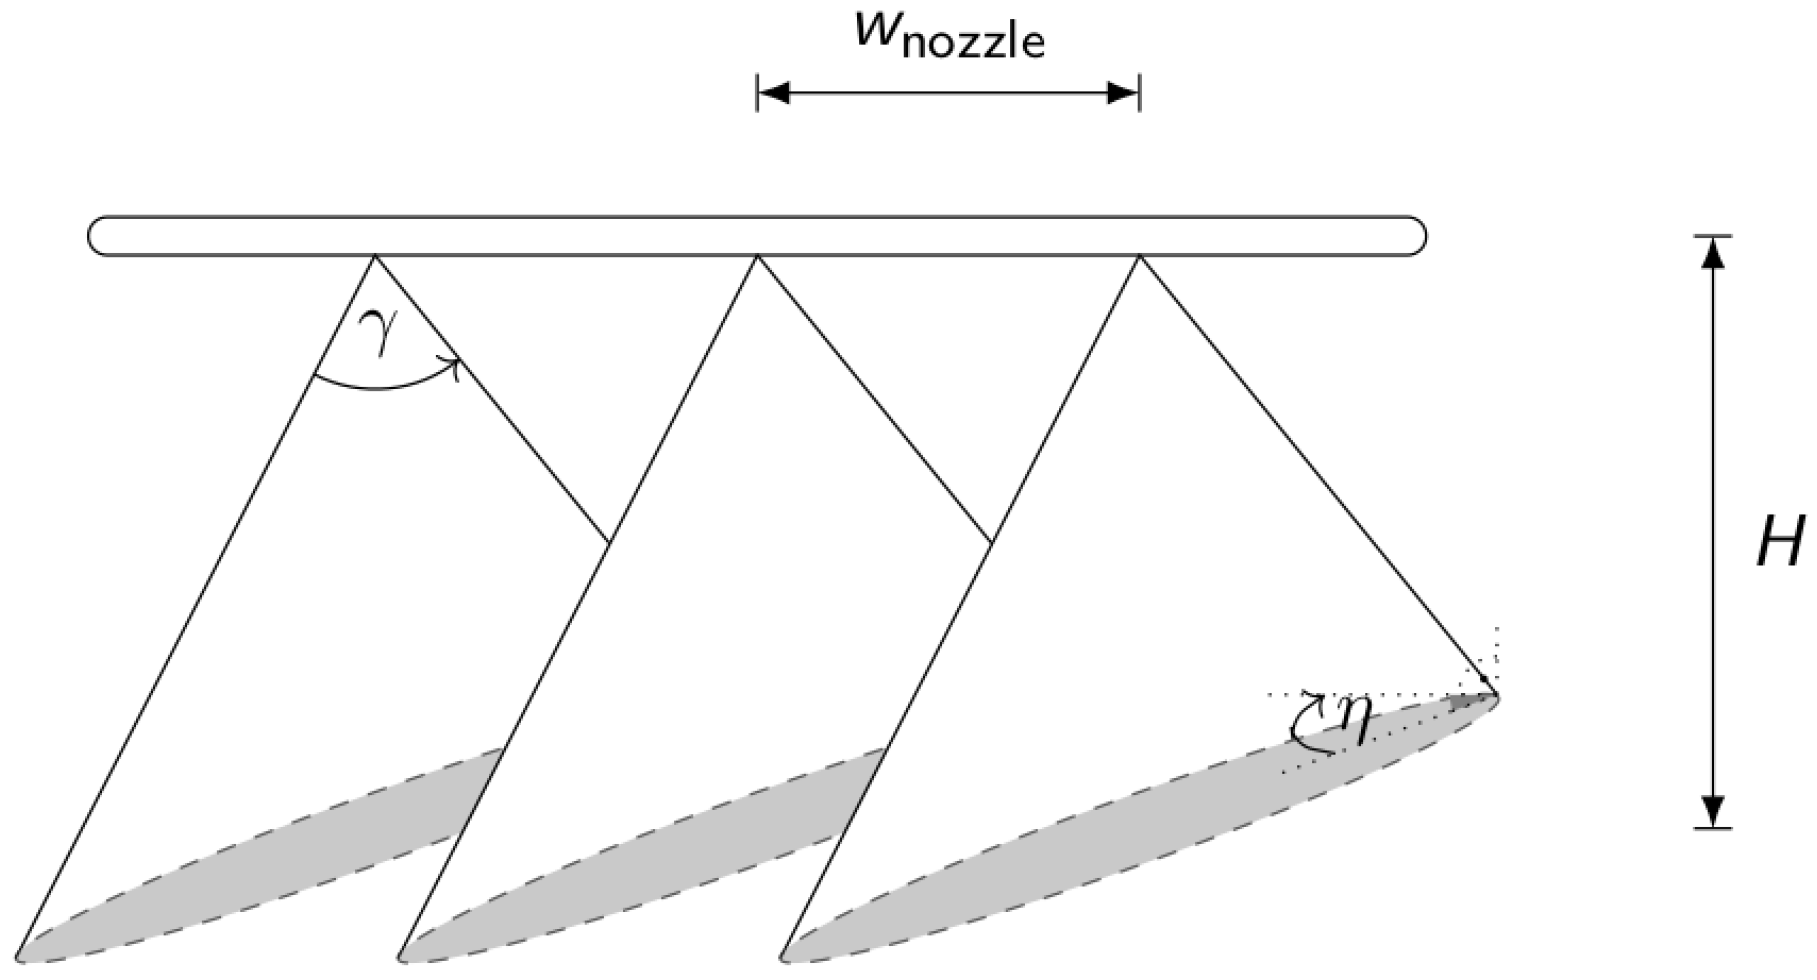
The 2 influencing factors are as follows: (i) Spray patterns that result from the dominant standard flat-fan nozzle type are ellipsoid [20]. (ii) The simplifying assumption is made that the boom bar is orthogonally oriented along the area coverage path plan at every sampling point. See Figure 4 for visualization of ellipsoidal spray patterns. See Figure 13 for illustration of assumption (ii).
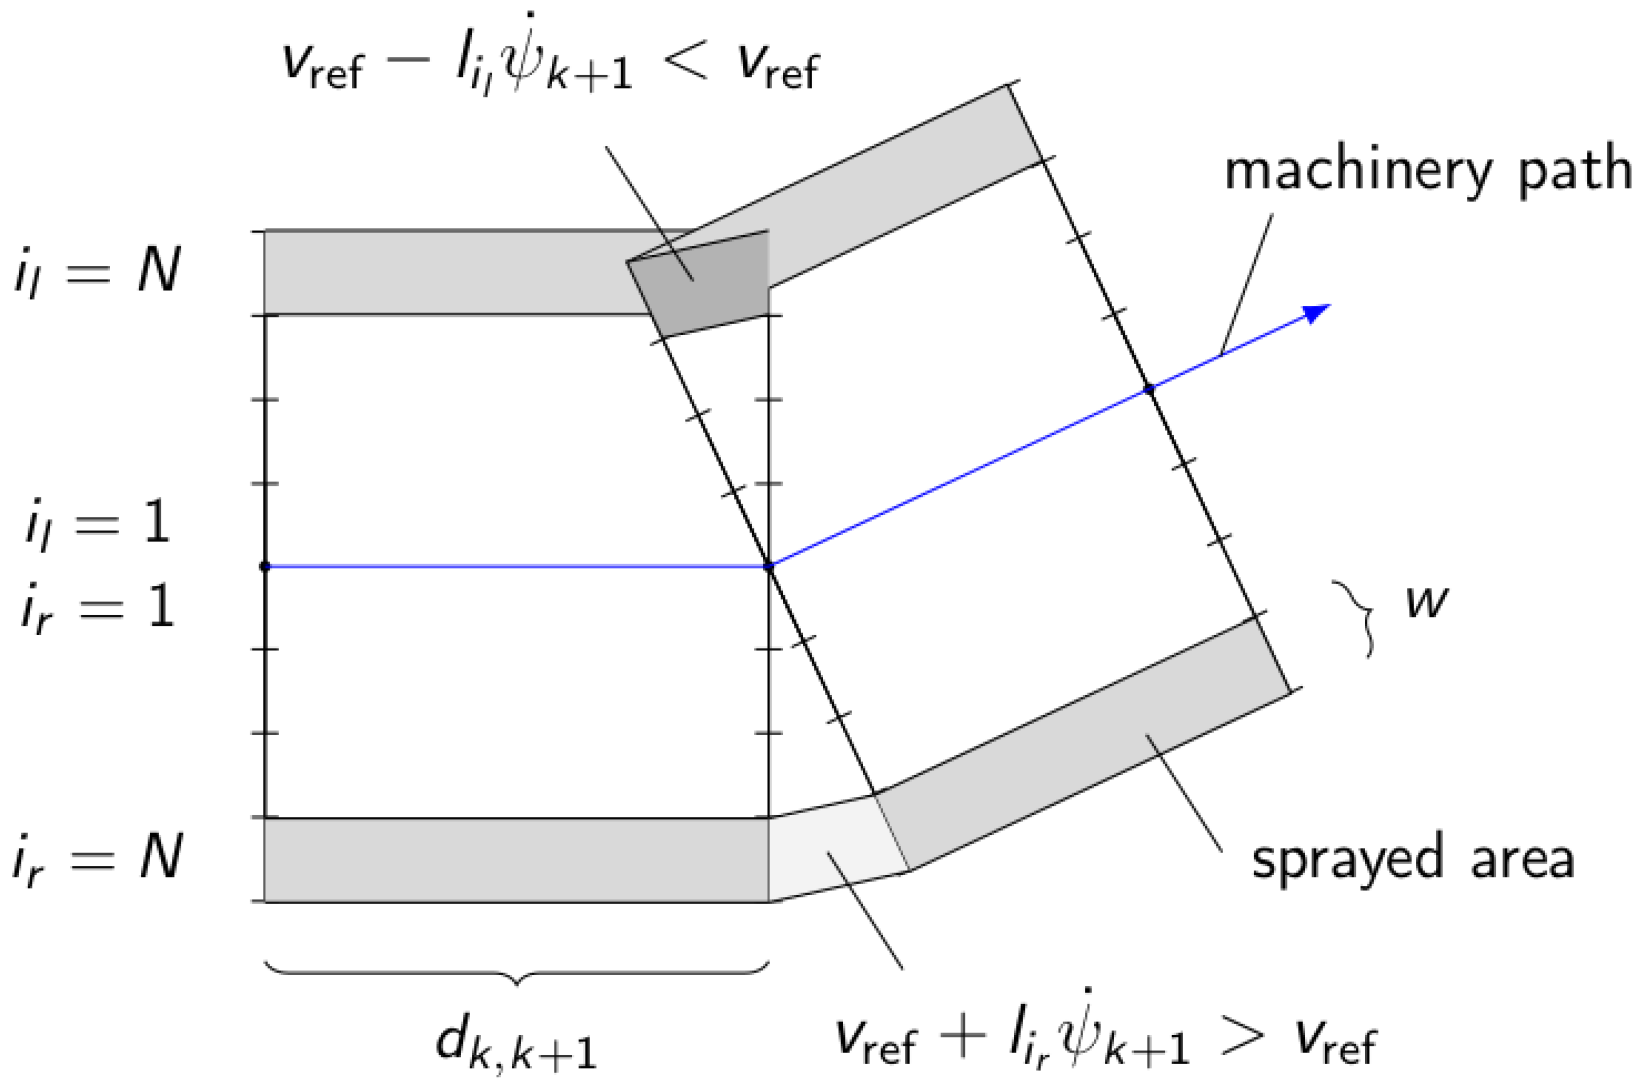
For the remainder of this paper the discretization method in Figure 13 is employed. It is distinguished between two types of polygons that each consists of 4 points. The first polygon type has an area of A k , k + 1 , = d k , k + 1 w , and is constructed by two sampling spaces along the machinery area coverage path and a given section width w > 0 .
The second polygon type is constructed at heading changes along the area coverage path and constructed by connecting boundary points of two polygons at the previous and next sampling space. At those heading changes the traveling velocity along different sections of the boom bar varies according to
v i = v ref + l i ψ ˙ k + 1 , i { i r , i l } , i r , i l { 1 , , N } ,
where N different sections are assumed both at the left and right hand-side of the machinery path; see Figure 13 for illustration. Depending on a left-turn or a right-turn the traveling velocity of a boom section may be larger or smaller than the machinery reference velocity v ref . Negative v i < 0 are possible, which imply ’backwards motion’ of section i that can occur during turn maneuvers and at low reference velocity v ref 0 .
Spray volumes are assumed to be uniform over the polygon areas for this discretization scheme.
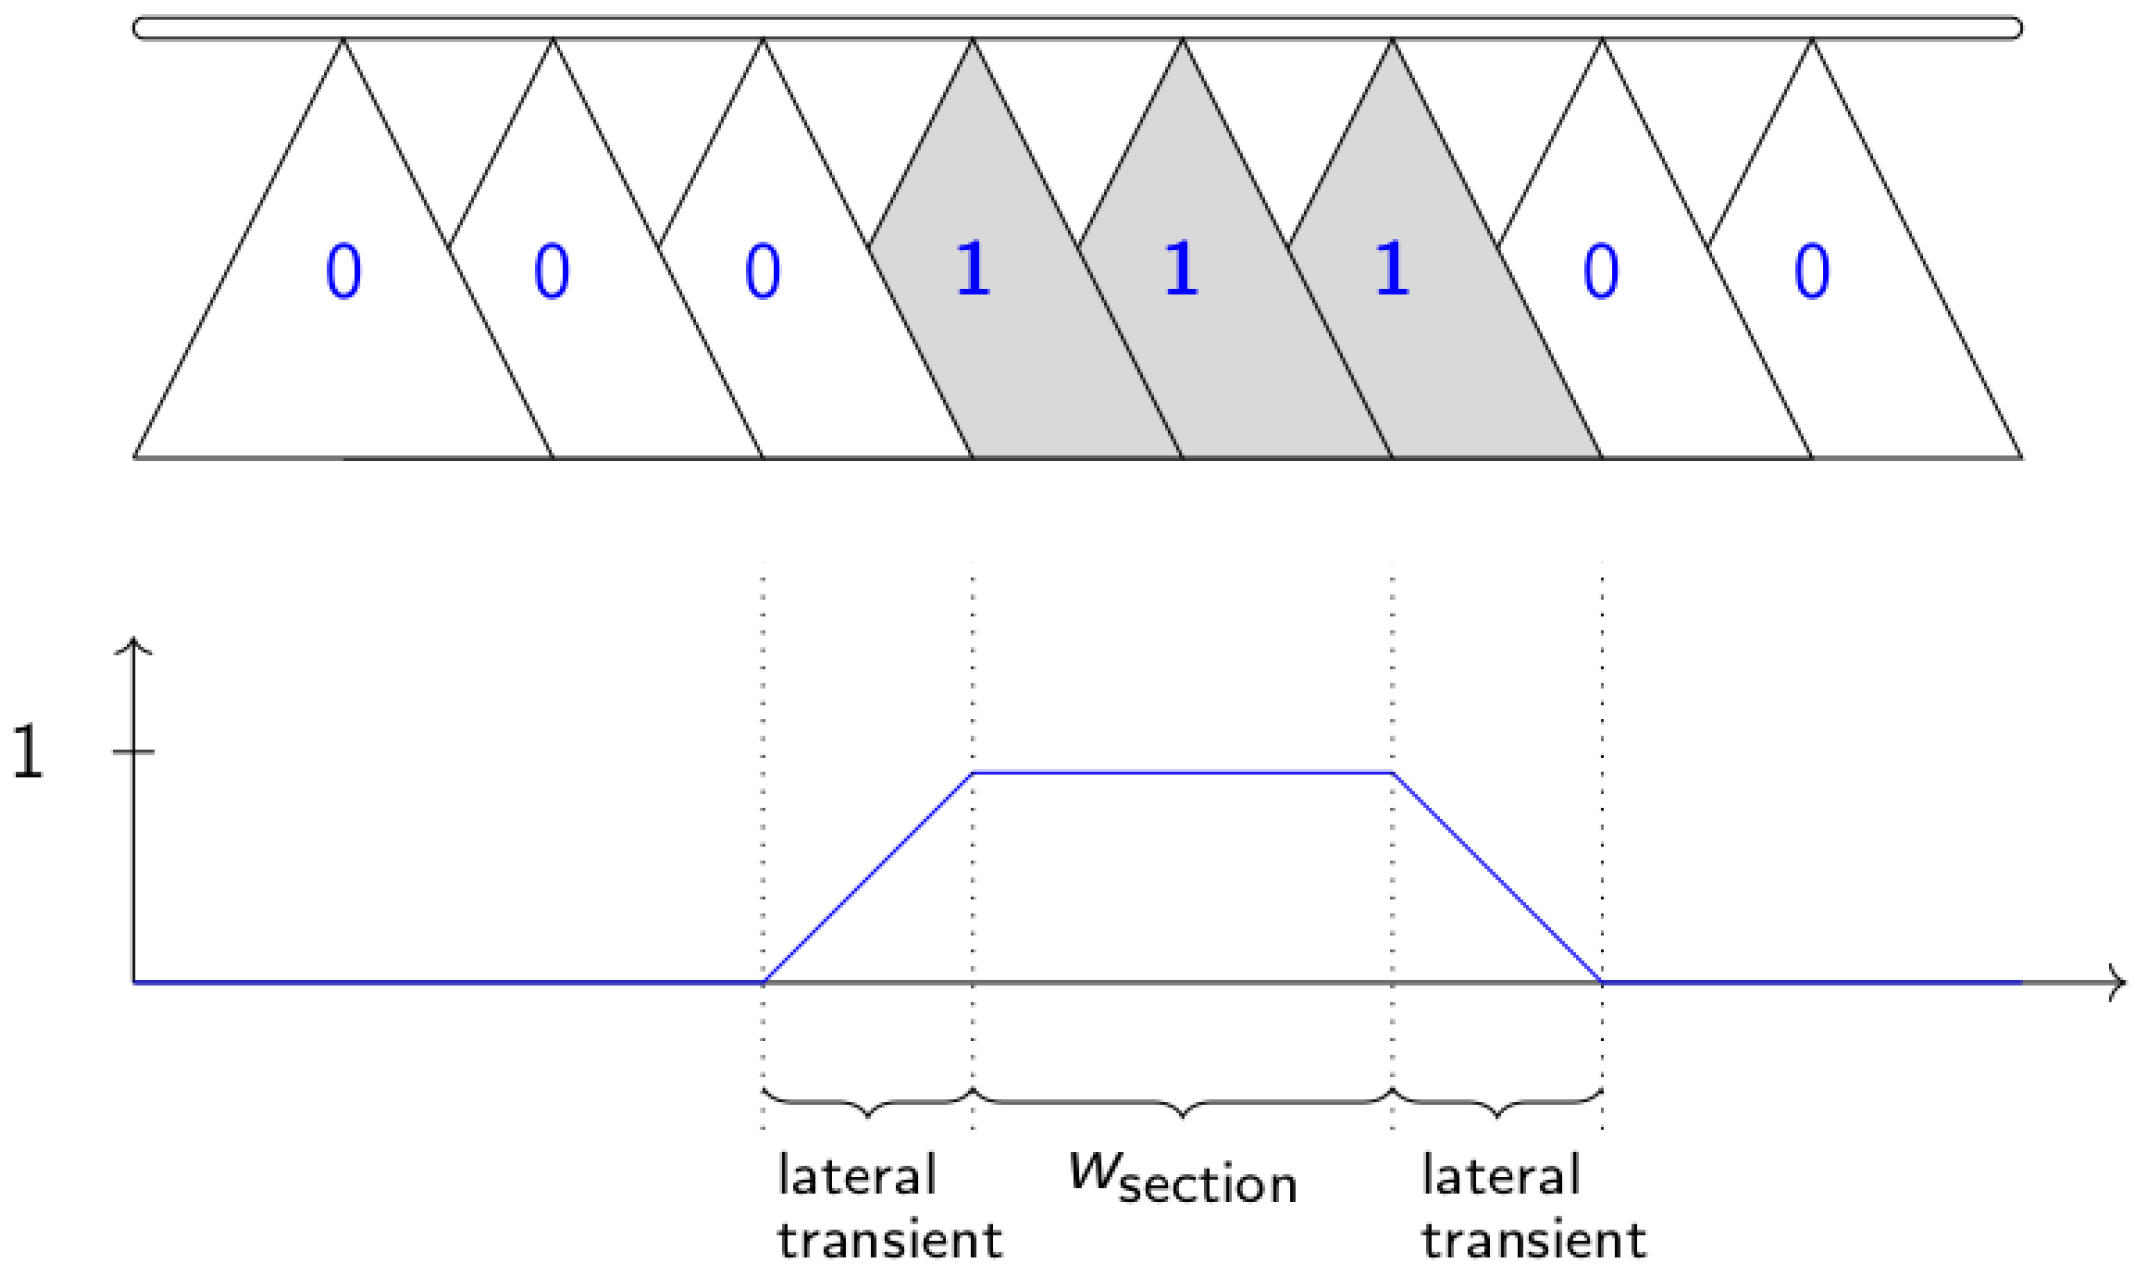
A section area width w has to be selected. This is not a straightforward choice since lateral transients result from spray overlap (see Figure 5). The smallest possible selection is
w = w nozzle ,
where w nozzle indicates the inter-nozzle spacing, as illustrated in Figure 4. For numerical experiments below this setting is used since it offers the finest discretization spacing possible.
Nevertheless, the simplification of assuming constant spray along this section despite an actual lateral transient according to Figure 5 is explicitly stressed. In Figure 5, three nozzles are illustratively treated as one section of width w section with 100% overlap, where the lateral spray distance on the ground is twice the nozzle spacing [15].
We assume the following linear relationship [15,20] between controllable section flow rates, f section i (/s) for N sections i { 1 , , N } on both the left- and right-hand side of the machinery path according to Figure 4, and actual spray volume s volume actual , i (/ha),
s volume actual , i = f section i v i w , i { i r , i l } , i r , i l { 1 , , N } ,
where w denotes the section width and v i R denotes the traveling speed of the centroid of section i according to (1). Throughout visualizations in this paper and in line with Figure 13 and (3), smaller and larger s volume actual , i are differentiated by brighter and darker gray colors, respectively.
Ideally, for uniform spraying the applied spray volume is constant for all non-overlapping section areas with
s volume actual , i = s volume ref , i { i r , i l } , i r , i l { 1 , , N } ,
where s volume ref > 0 denotes a desired reference spray volume. Reformulating (3) with reference (4) one obtains a nominal nozzle flow rate control signal,
f section i = s volume ref v i w , i { i r , i l } , i r , i l { 1 , , N } .
This nominal signal, which implies that higher flow rates are required for faster section velocities to maintain a constant reference spray volume, then serves as reference to low level controllers that actuate Pulse-Width-Modulated (PWM) solenoids to control the nozzle flow rate [14,24].
Starting from basis Equation (5), multiple customisations and refinements are possible. First, one may switch off for negative v i < 0 , which implies ’backwards motion’, which may occur during turn maneuvers and low reference velocity v ref 0 . Thus, f section i = 0 if v i < 0 .
Second, one may switch off, f section i = 0 , if there is an overlap with an already sprayed area or with an area that will be sprayed later within an predictive spraying scheme. The standard approach for this is an occupancy grid-based approach [29,33]. The advantage of this approach is computational simplicity. The disadvantage is that at least 1 hyperparameter needs to be set, which results in either spray gaps or spray overlaps, as Figure 14 demonstrates. Therefore, an alternative polygon-based approach is employed throughout the remainder of this paper. Here, (i) a polygon is recursively constructed from the area that has been sprayed so far, before (ii) at area coverage runtime for a potential spray section cell candidate it is evaluated whether it is an element of the polygon representing already sprayed area or not. If the centroid of a cell candidate is not yet element of the polygon the cell is sprayed and the polygon is augmented. For computational efficiency and to keep a constant size, the polygon is recursively updated by considering only the last 10 sampling spaces. This polygon approach is only applied along the headland path area.
Third, multiple nozzles may be uniformly controlled. For example, for the 1-sections case of Figure 2, one may set f section i = s volume ref v ref w , i { i r , i l } , i r , i l { 1 , , N } .
Fourth, and as a detail for nominal numerical experiments in Section 3, Equation (5) is recalculated at each sampling space along the area coverage path. No rate constraints on f section i are considered. This assumption is in line with the nominal experimental setup and best-case evaluation. Rate-constraints are regarded as PWM-associated uncertainties in Table 1.

2.6. Strategy 1: Automatic Section Control

The objective of ASC is to minimize spray overlap areas. The core idea is to (i) switch off spray nozzles on areas that have already been sprayed, and (ii) to dynamically adjust nozzle flow rates along the boom bar that holds the spray nozzles when velocities of boom sections vary during turn maneuvers. Several comments are made.
First, in contrast to an occupancy grid approach that was mentioned in Section 2.5 and that grids a field area into cells (i.e., discretised sub-areas of the field), here a different approach is taken. This is conducted to generate high-precision results and to avoid having to select discretization hyperparameters (see Figure 14). Here, the approach is used that (i) recursively extends a polygon that is constructed from the sprayed area so far, before (ii) evaluating at area coverage runtime if a potential spray section area is element of the polygon area or not.
Second, inter-mainfield lane priorities are assigned based on the accumulated heading changes throughout the traversal of each mainfield lane. Mainfield lanes with less accumulated heading changes are preferred since these permit simpler spraying. In cases of larger machinery turning radii and smaller operating widths, scenarios may, in general, occur at transitions between mainfield lanes and headland paths where sprayed areas associated with two adjacent mainfield lane traversals potentially overlap. In such scenarios the mainfield lane with less accumulated heading changes is granted priority for spraying.
Finally, two additional observations are made: (i) ASC must run automatedly since a large number of individually controlled nozzles (e.g., 48 nozzles for a 24 m wide boom bar and 0.5 m nozzle spacing) cannot be efficiently switched manually by a human operator at typical fast machinery traveling speeds. (ii) At least one localization sensor (e.g., for accurate RTK-GPS) is required to enable ASC-automation. Ideally, additional sensors are available to as accurately as possible measure the traveling velocity of individual nozzles (instead of estimating them from geometrical calculations subject to uncertainties such as mechanical oscillations that may occur for a wide boom bar during turn maneuvers). Thus, in general ASC is highly dependent on accurate sensor measurements and automation.

2.7. Strategy 2: GPS-Free, Maximal 2 Sections, and Visual Cues

In order to develop a strategy that is simpler than ASC and that may also be implemented manually, two considerations are made. First, a maximum of 1 or 2 sections are considered; see Figure 2. Note that even if only 1 or 2 sections are used for the spray logic this does not alter the number of nozzles along the boom bar. Multiple nozzles (either all or half) simply follow the same control signal at a given sampling time. Second, to avoid the need for GPS-sensors for localization a visual cues-approach is taken. Therefore, it is differentiated between headland and mainfield planting directions. Then, the visual difference in these two directions in the field (an ’intersection line’ of the two areas) can be used to trigger spray switching changes, i.e., to trigger on- and off-switching only when all sections of the boom bar have crossed the intersection line. See Figure 7 for illustration. Note that this setup can be used as basis for both the Boustrophedon-based and the alternative area coverage path planning method. So-called pre-emergence markers (marker disks that are trailed in the earth), which represent a mechanical solution and can be employed sensor-free, can help to build the intersection line during the seeding process and to maintain a constant distance in-between mainfield lanes.
See Figure 15 for the effect of employing only 1 or 2 sections in comparison to a multi-sections approach.

3. Results

3.1. Comparison of 6 Experimental Setups

To address aforementioned Research Questions the two area coverage path planning strategies from Section 2.3, M 1 and M 2 , were compared with three different sections control setups in Figure 2. Thus, overall six different setups were compared. The corresponding spray volumes are denoted as S M k j , k { 1 , 2 } , j { 1 , 2 , 48 } . The area coverage pathlengths for M 1 and M 2 shall be denoted by L M 1 and L M 2 . Note that the pathlengths are the same for all three sections setups.

3.2. 10 Nominal Real-World Field Examples

Parameters were used uniformly throughout all experiments. Vehicle dynamics were as in [38] with a minimum turning radius of 5 m. A reference spray volume of s volume ref = 5 gpa (gallons per acre) was assumed, which corresponds to 46.78 /ha. An inter-nozzle spacing of w nozzle = 0.5 m was assumed. For the variable rate case and working width W = 24 m this resulted in a maximum of 48 individually controllable sections. For the case of controlling multiple adjacent nozzles with the same signal (e.g., four nozzles resulting in w section = 2 m), the number of sections can in general be reduced up to controlling all nozzles as a single section. If the number individually controllable sections is reduced then also the performance of ASC is degraded, ultimately approaching the performance of the 1-section method.
For the generation of freeform mainfield lanes, for optimization of area coverage path planning, and for the smoothing of headland path edges and headland-to-mainfield lane transitions the methods from [9,36,38] were used with path discretization spacing of 1 m, respectively.
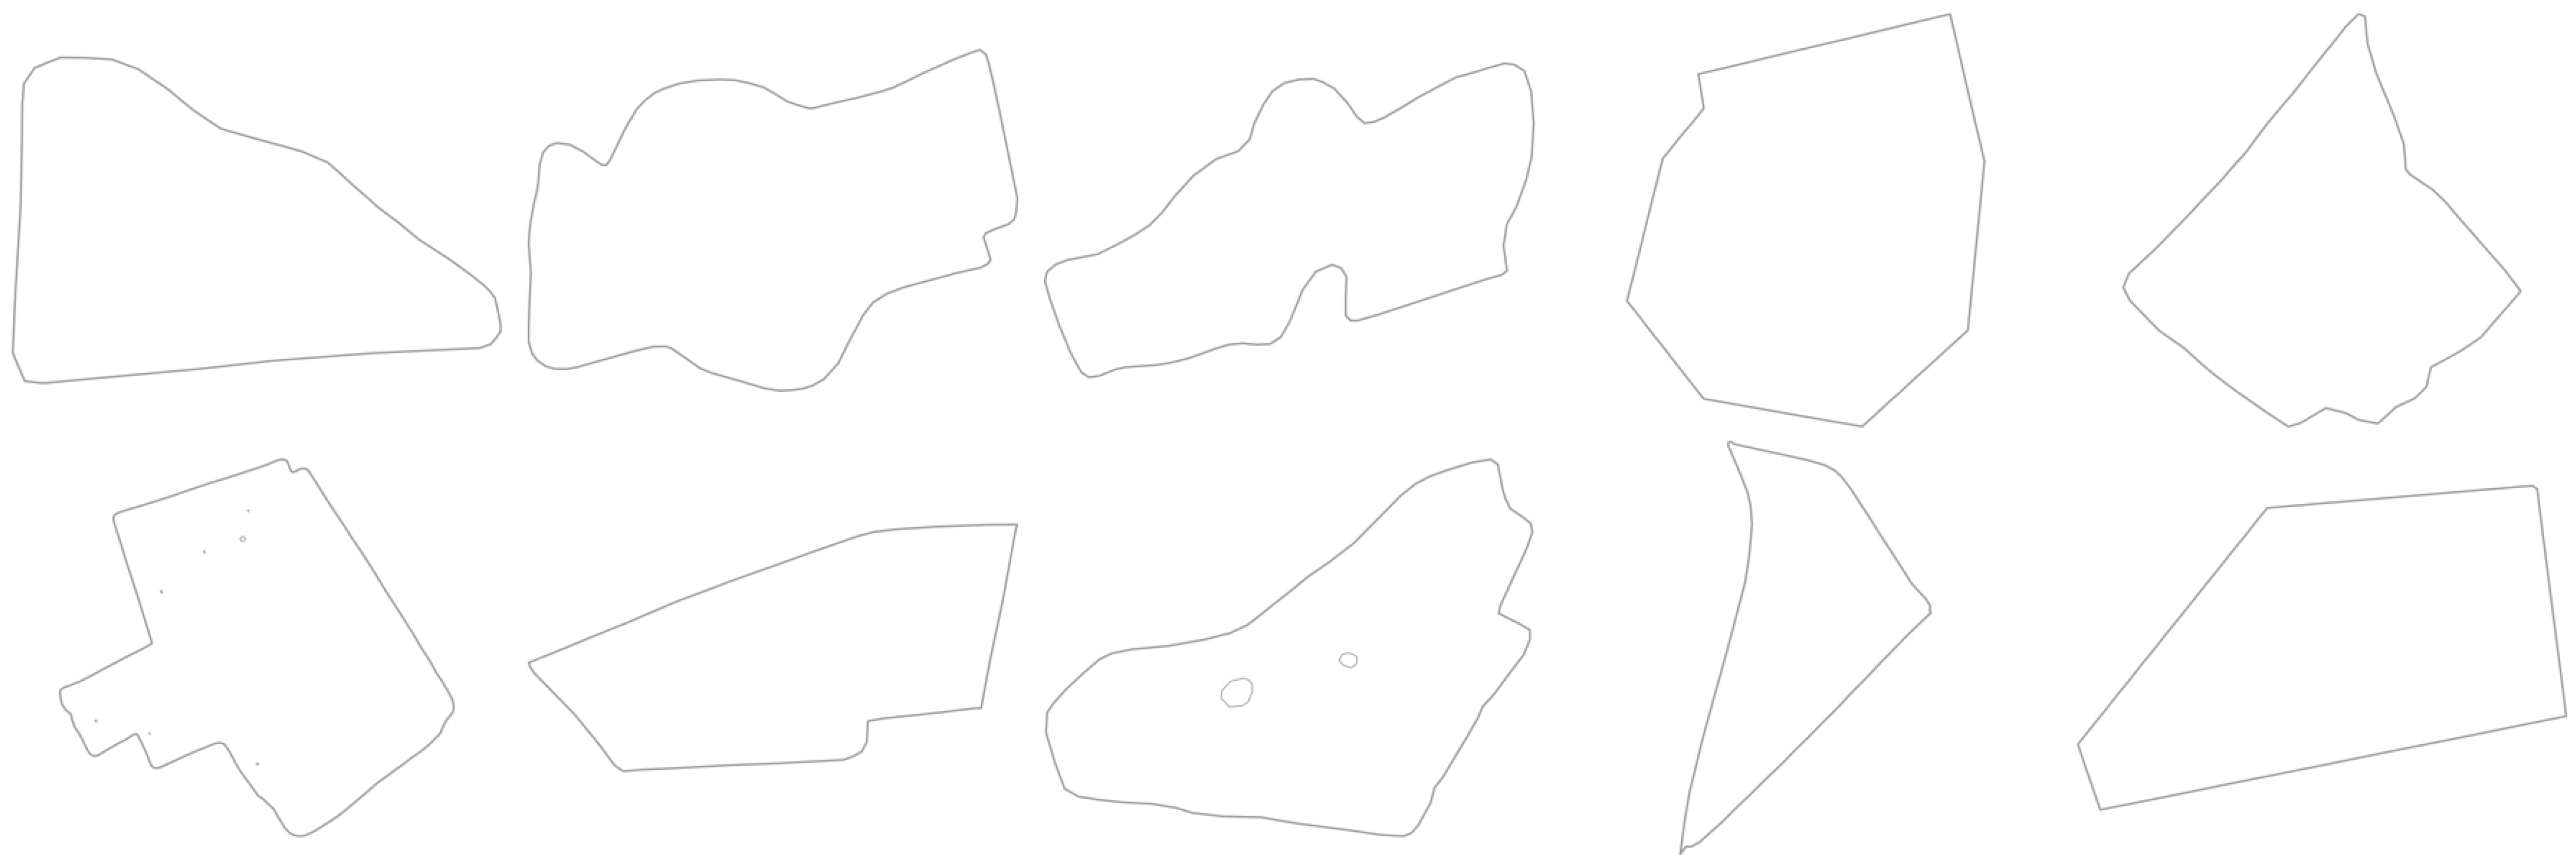
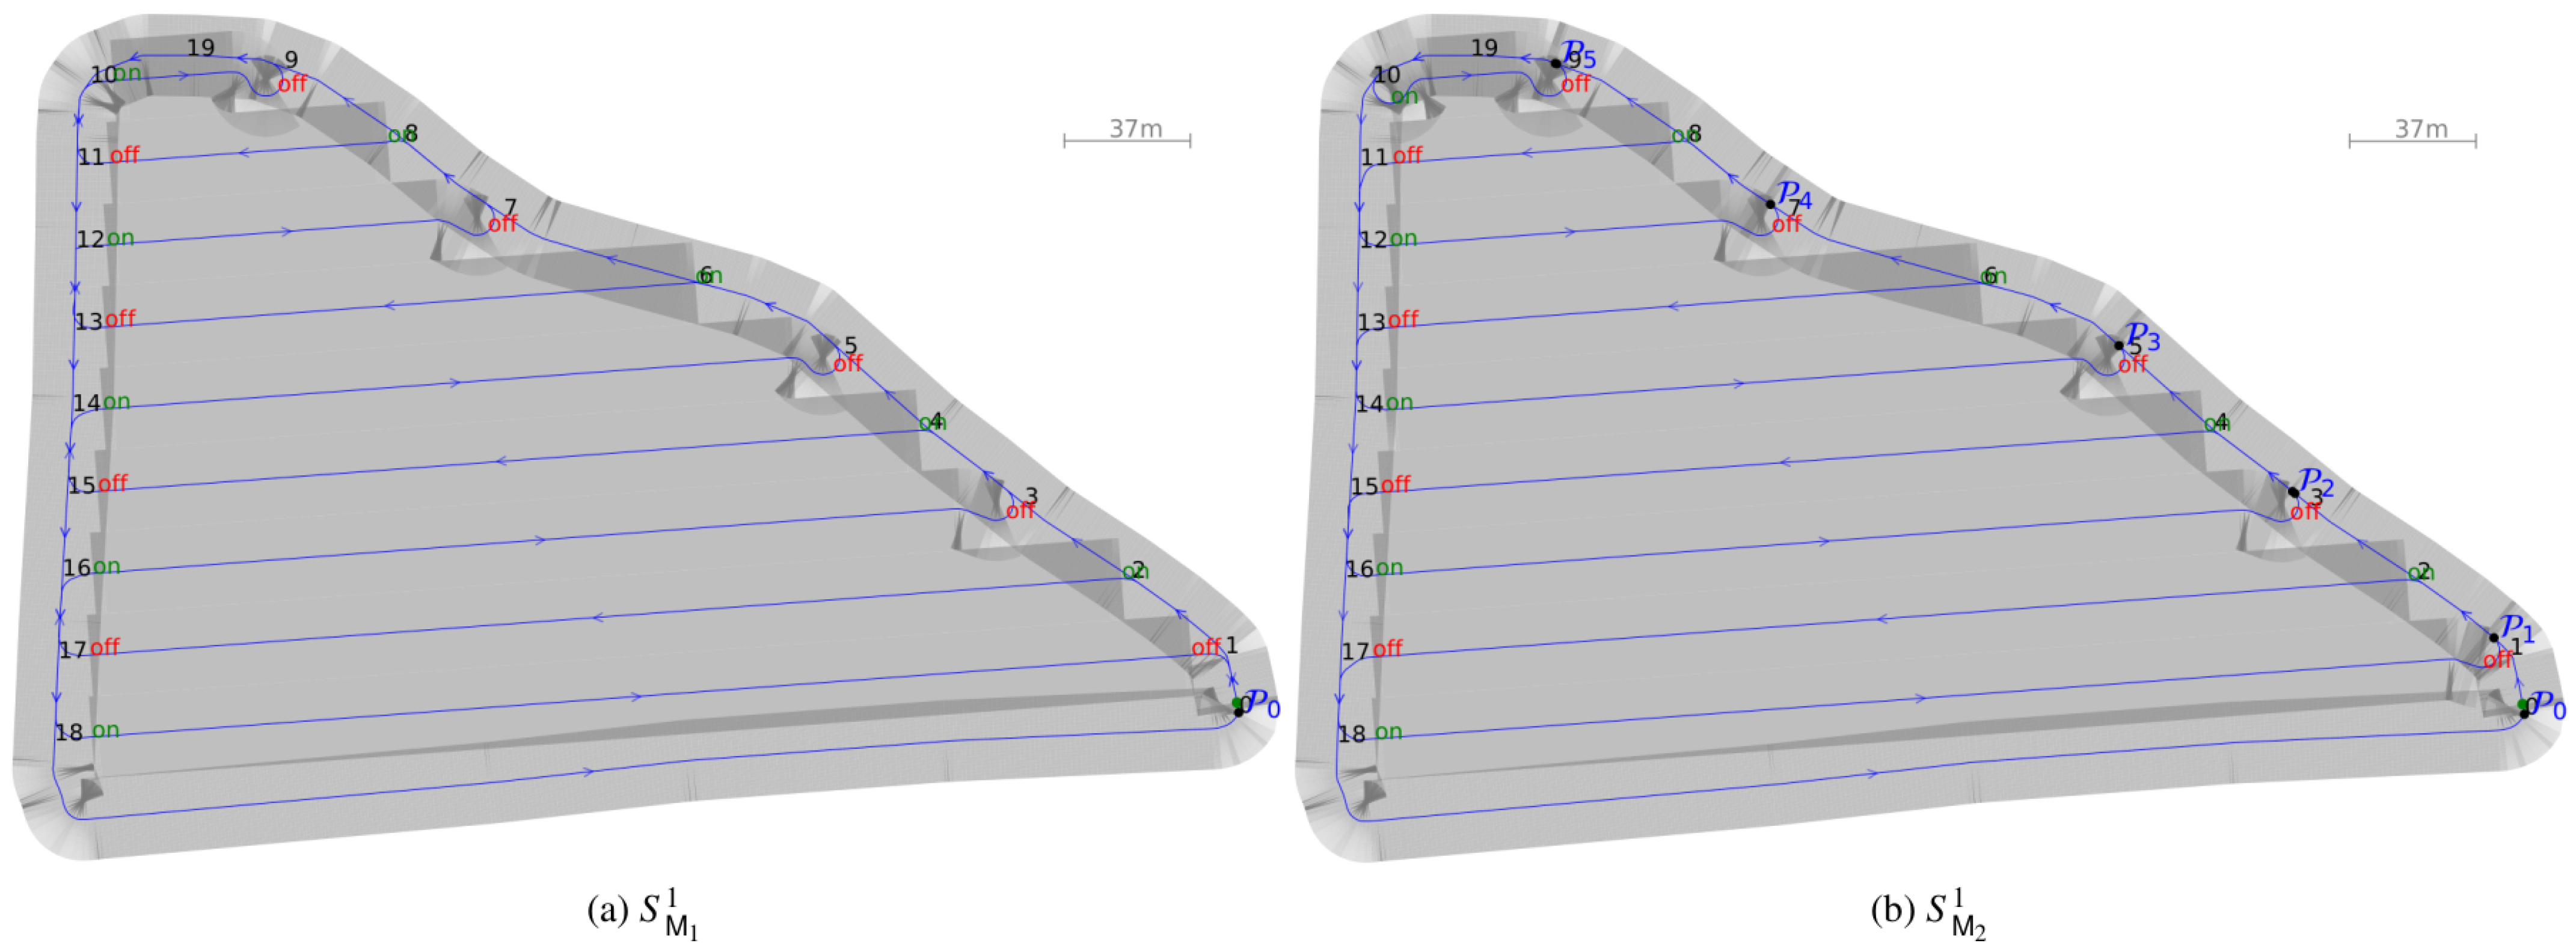
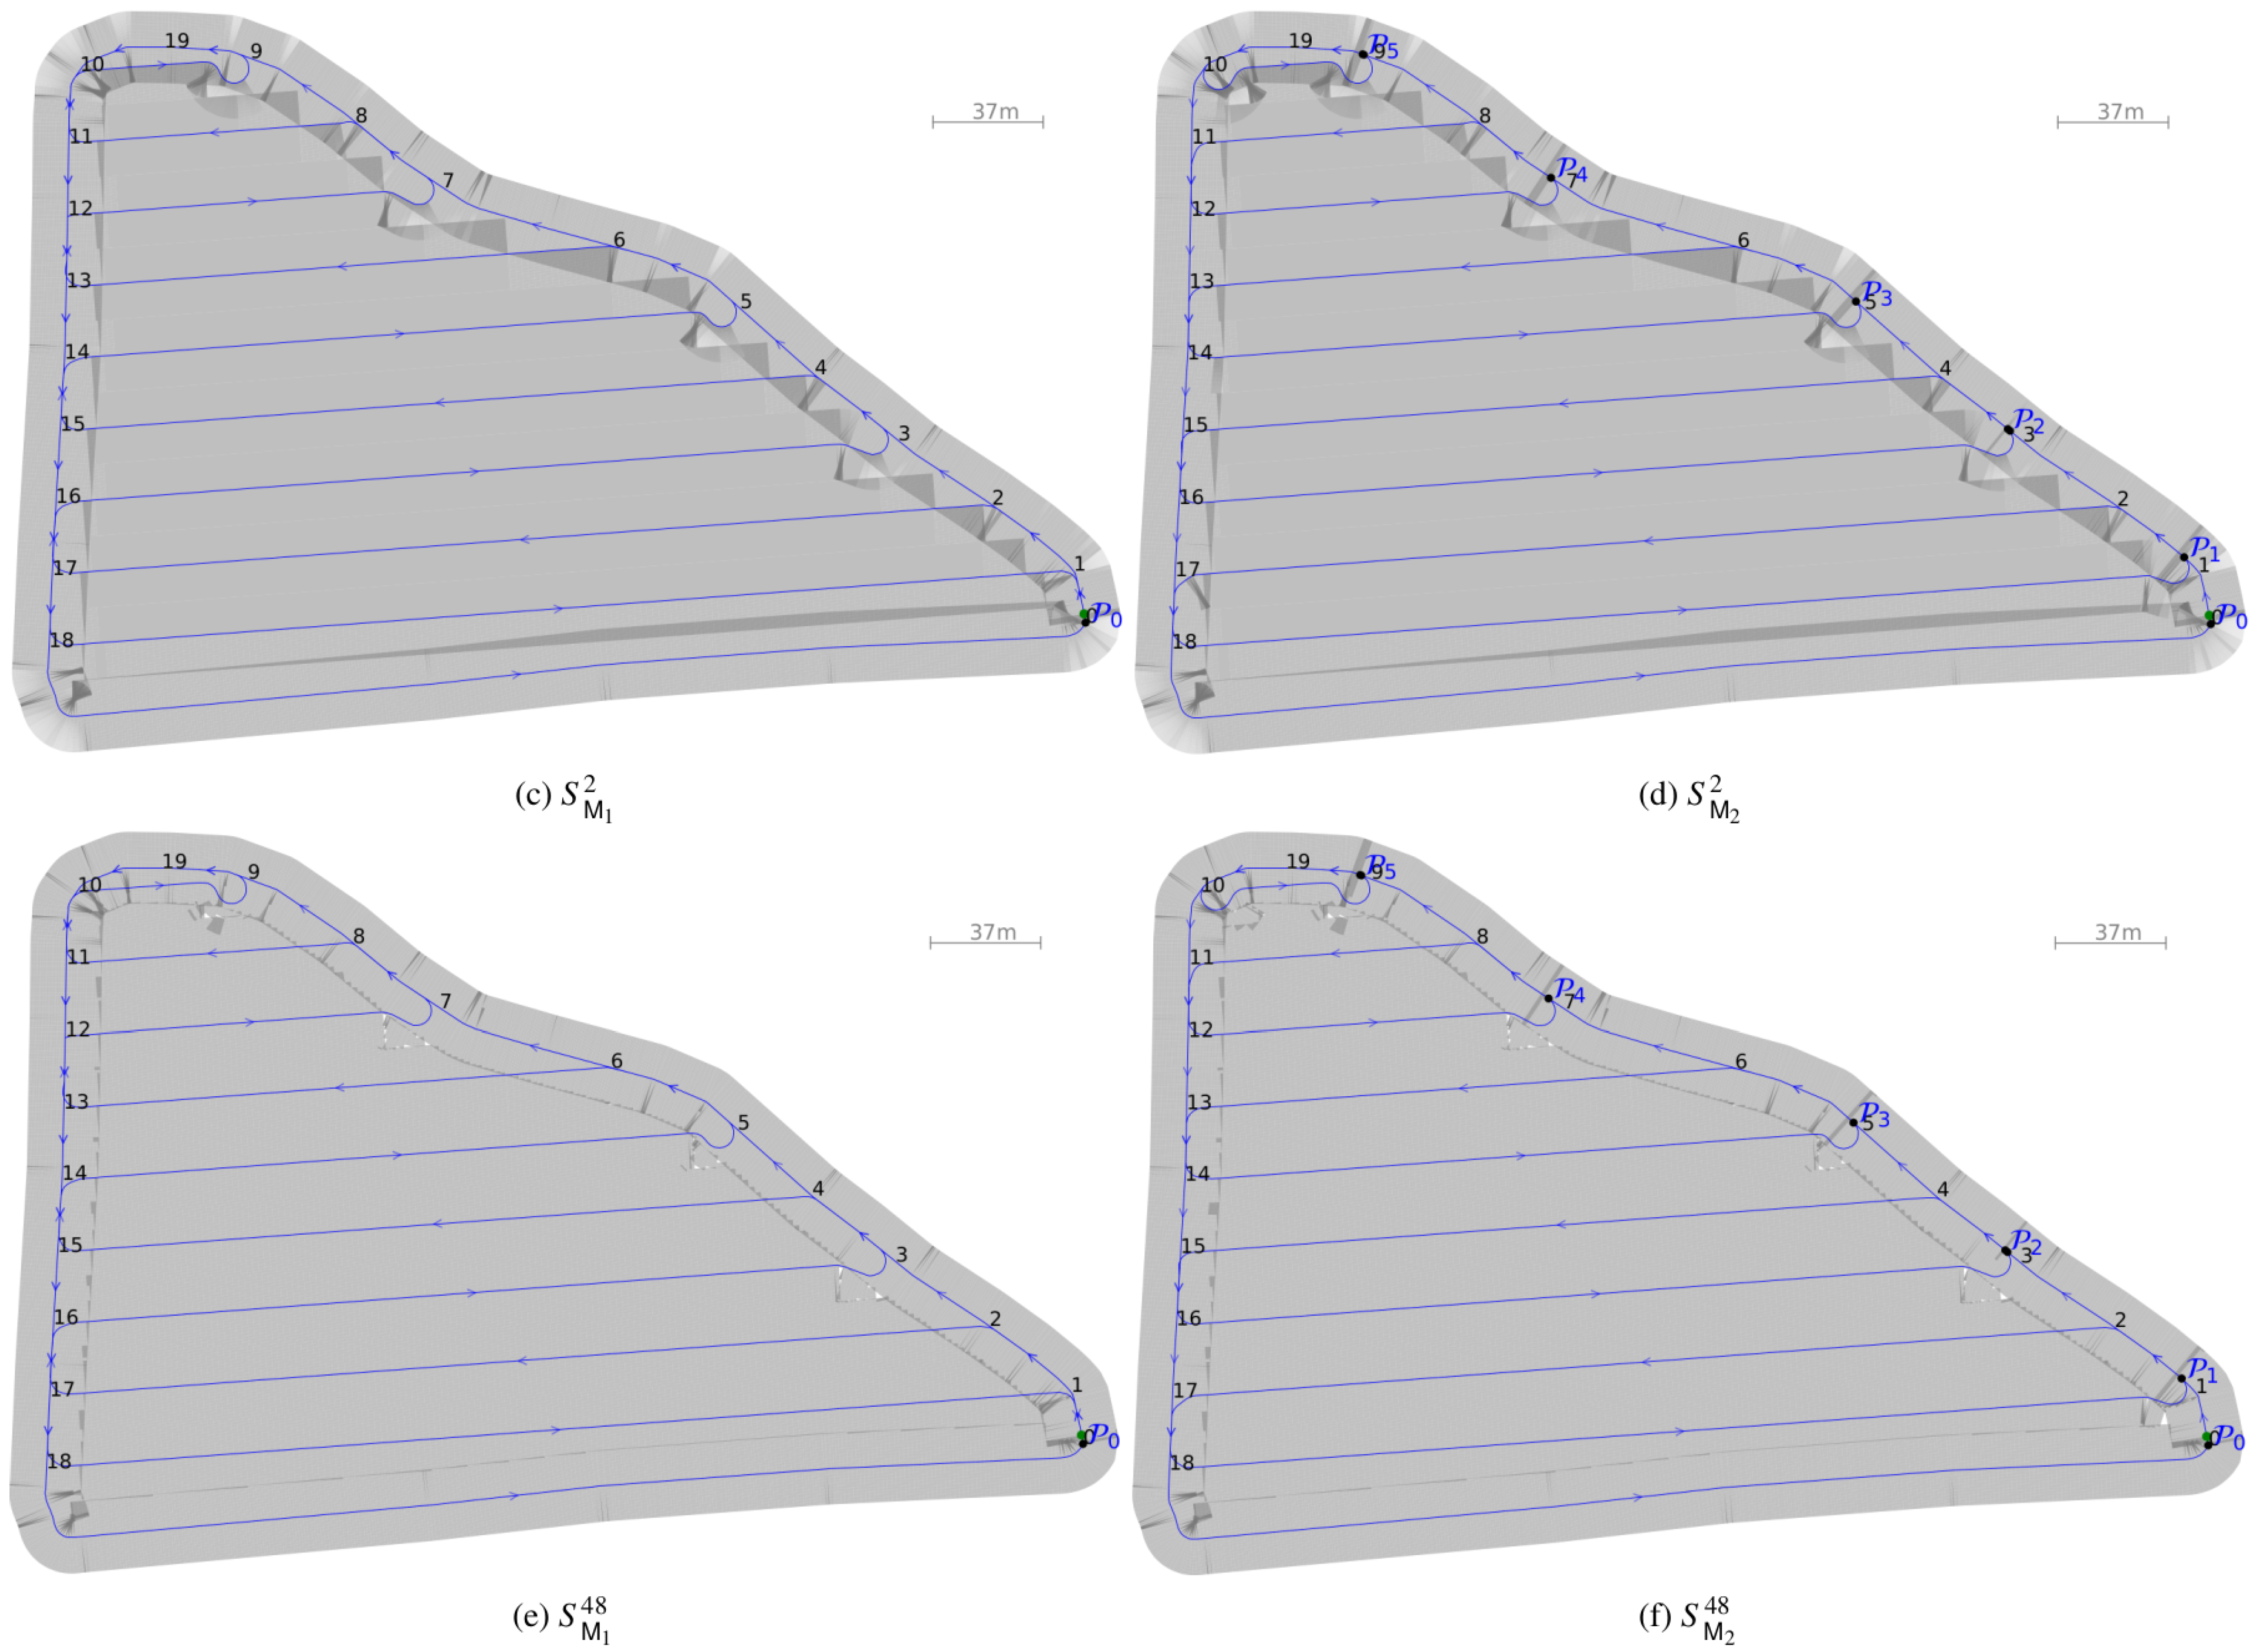
The 10 real-world fields used for evaluation are depicted in Figure 16. This data includes examples with multiple obstacle areas, freeform mainfield lanes, and non-convex field contours. Quantitative results are given in Table 2 and Table 3. Qualitative results for two examples are visualized in Figure 17 and Figure 18. Visualizations for all other examples are provided in the appendix of an online-available arXiv-version of this paper.

4. Discussion

4.1. Key Findings

The key findings of numerical experiments are discussed as follows:
  • The pathlength savings potential for the optimization-based M 2 method in comparison to the Boustrophedon-based M 1 method was between −3.9% and −12.3% (see Table 2). M 2 yielded better results throughout all experiments. Since path planning precedes spraying according to the hierarchical structure of Figure 6, it can be designed independently from the spraying technique.
  • Regarding spray volume results in Table 3 two main comments can be made. First, the multi-sections method S M 1 48 with 48 sections over a 24 m wide boom bar approached the reference spray volume S field ref . For field 1, the difference was 2.1%. For a higher number of sections this percentage is expected to further decrease. In contrast, for the 1- and 2-sections case, the percentage difference was higher. For example, for S M 1 2 and S M 1 1 the differences with respect to S field ref were 21% and 26.9%, respectively. Second, while these and similar increases in spray volumes for other fields in Table 3 seemed high, an important note with respect to spray composition is made. For cereal crop production the water ratio in a spray mixture is typically very high. For example, for a 100 spray volume typically around 99 are water and only 1 are chemical (fungicides, herbicides, etc). This is from an economic point of view very important, since economic input material costs for water and chemical greatly differ. Hence, the aforementioned 21% increase for S M 1 1 does not imply a 21% increase in input material costs. Instead, denoting chemical and water cost measured in monetary cost per litre (EUR/) by C chemical and C water and assuming a water ratio of 99%, the new cost is calculated as C cost = 0.01 · S M 1 1 · C chemical + 0.99 · S M 1 1 · C water . If C water C chemical the actual increase in input material costs is much lower than the aforementioned 21%. Implications are discussed in detail in the next Section 4.2.
  • Both the 1- and 2-sections setup can be implemented robustly, and crucially and in contrast to the ASC-setup, without the need for any localization sensors. This can be achieved by planting crops in a different direction along the headland and mainfield areas, before using the intersection line between those two areas as visual reference line at which spray switching commands can be triggered. This approach is also appropriate for manual operation. See Figure 7 for illustration.
In view of these findings plus the listing of the plethora of complexities associated with the spraying process in Table 1, the 1- and 2-sections setup present a reasonable alternative to ASC and offer multiple benefits. A recommended summary would be to (i) operate localization-sensor free (no expensive RTK-GPS needed), (ii) use the M 2 -method for area coverage path planning, (iii) prepare the intersection-line during the seeding process by planting crops in a different direction along the headland and mainfield areas, before (iv) switching manually with one or two sections according to the methods S M 2 1 or S M 2 2 . The economic cost benefits of this approach are discussed in the next section.
Finally, beyond spraying applications, the efficiency demonstrated by the M 2 method in path planning suggests significant potential for applicability in other agricultural operations that rely on optimized area coverage, such as seeding, tillage, or harvesting. This adaptability reinforces the broader value of the presented methodology.

4.2. Economic Cost Discusstion

Let the spray volume difference between a 1- or 2-sections solution and a multi-sections solution (ASC) be denoted by
Δ S M k j , ASC = S M k j S M k 48 , k { 1 , 2 } , j { 1 , 2 } .
Then, assuming a water ratio of 99% for the spray mixture, the corresponding cost difference is
Δ C M k j , ASC = ( 0.01 · C chemical + 0.99 · C water ) Δ S M k j , ASC ,
k { 1 , 2 } , j { 1 , 2 } .
Let the hectares-normalized values for (6) and (7) be denoted by Δ S ¯ M k j , ASC and Δ C ¯ M k j , ASC and measured in (/ha) and (EUR/ha), respectively. Let the purchase cost difference in EUR between a ASC-machinery and a simpler 1- or 2-sections alternative be denoted as Δ K ASC . Then, two economic cost discussions are given.
First, ASC promises to save spray volume. ASC is profitable in comparison to a simpler 1- or 2-sections solution if
Δ K ASC Δ C ¯ M k j , ASC .
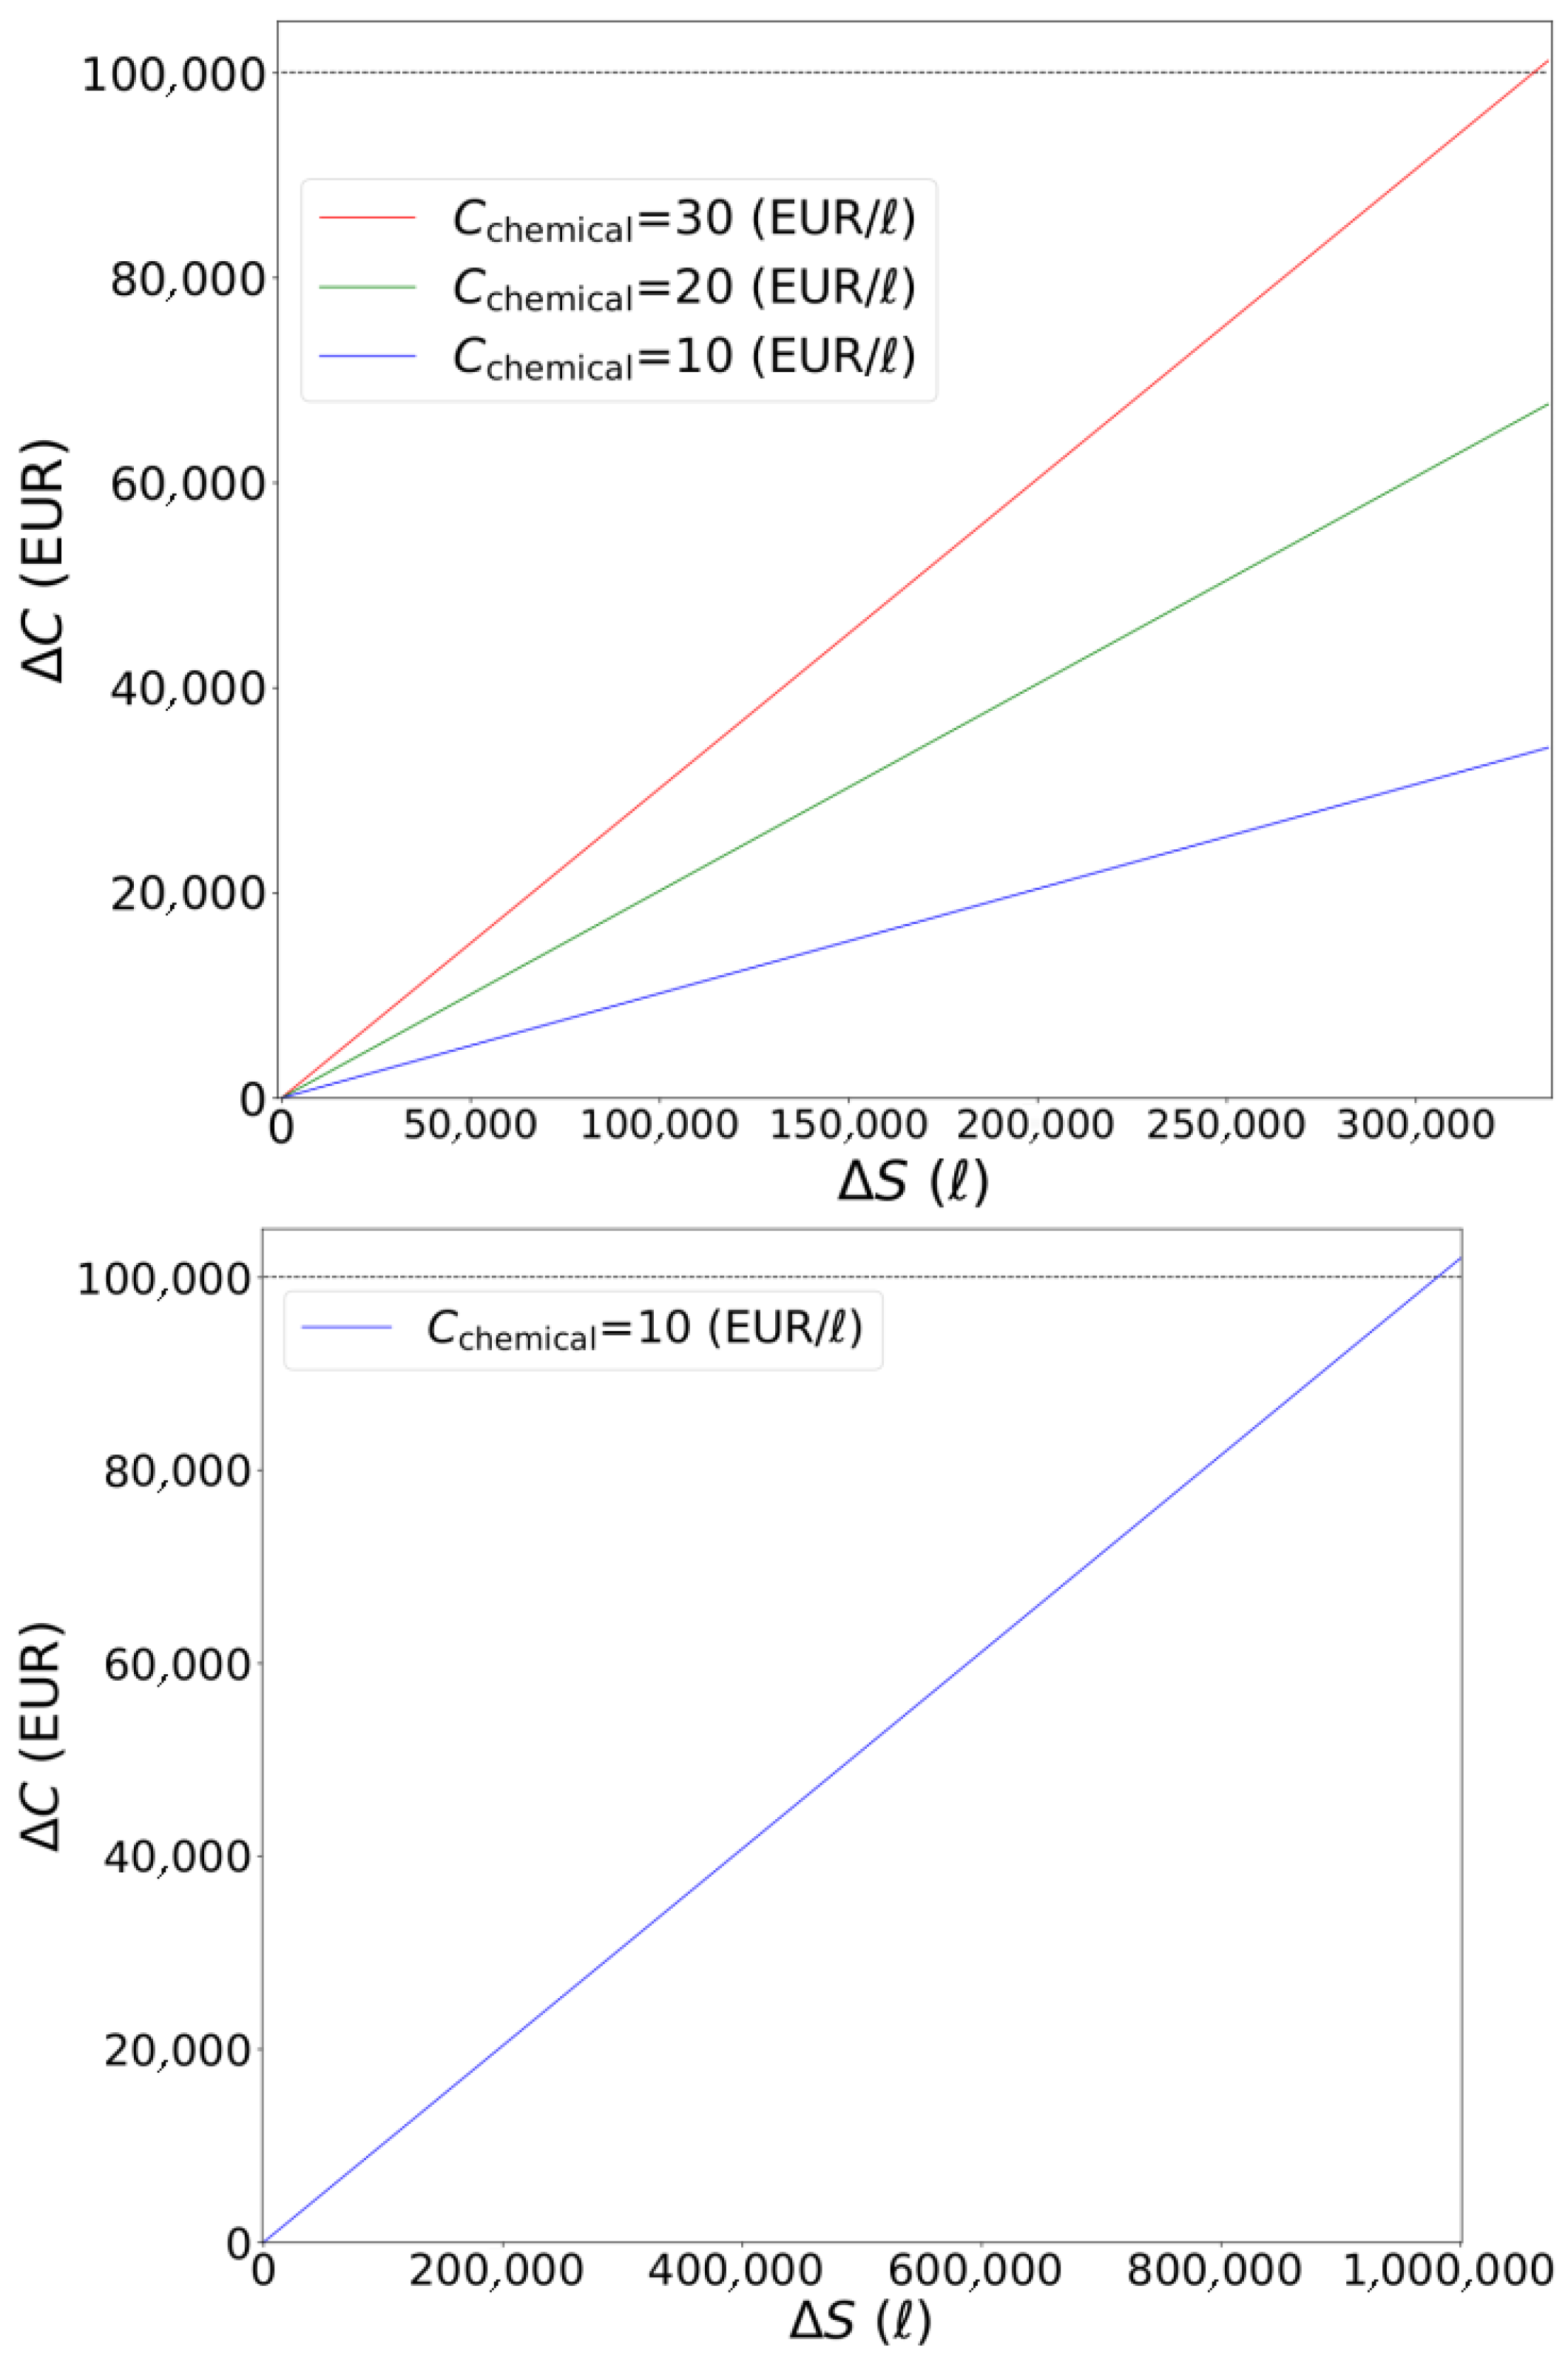
Evaluating (7) and assuming C water = 0.002 EUR/, the spray volume difference at which ASC first becomes profitable is 331k for C chemical = 30 EUR/ and 981k for C chemical = 10 EUR/, respectively. See Figure 19 for illustration. For reference, for the first field example of size 6ha the spray volume difference is Δ S M 2 1 , ASC = ( 89.9 6.9 ) = 83 . If a farm consisted of just this field and assuming C chemical = 30 EUR/, this field would require 3988 field runs before ASC becomes profitable. For a lower C chemical = 10 EUR/, a remarkable 11,819 field runs would be required. For a larger Δ K ASC greater than 100k EUR (which is not uncommon for modern sprayers) even more field runs would be required before (an optimal) ASC becomes profitable.
Second, an alternative to evaluate the economic potential of ASC can be provided by the following second inequality,
Δ K ASC Δ C ¯ M k j , ASC A total N runs field N years ,
where A total denotes total farm-wide field area in hectares, N runs field the number of field runs per year required for spraying, and N years a number of years, respectively. The reformulation of (9) permits to calculate after how many years the spray volume savings of an ASC-solution economically outweigh a simpler 1- or 2-sections alternative. The number of years at which equality is attained in (9) shall be denoted by N years .
To evaluate (9) multiple parameters have to be chosen. Δ C ¯ M k j , ASC is computed based on data, by (i) computing the average Δ S ¯ M k j , ASC from the 10 field examples according to Table 4 before (ii) computing its corresponding cost difference Δ C ¯ M k j , ASC according to (7). Values for C water , C chemical , A total and N runs field are selected according to Table 5. Results for the evaluation of (9) are presented in Table 6.
Several observations can be made. First, for small farms (e.g., A total = 30 ha) and for the given parameters, ASC does economically never outweigh a simpler 1- or 2-sections alternative. This is since only after decades the spray volume savings of an ASC-solution economically outweigh a simpler 1- or 2-sections alternative. For example, for A total = 30 ha, Δ S ¯ M 1 , / ha 1 , 48 =18.6/ha, C chemical = 30 EUR/ and Δ K ASC = 100,000 EUR, this occurs only after 74.2 years. For C chemical = 10 EUR/ even after only 219.7 years.
Second, for larger farm sizes of A total = 1000 ha the situation changes. For example, here it is N years , 30 = 2.2 years.
Overall, Table 6 demonstrates that different values for A total , C chemical , and Δ K ASC largely shape after how many years the spray volume savings of an ASC-solution economically outweigh a simpler 1- or 2-sections alternative. The smaller the farm, the smaller the cost for chemicals and the larger Δ K ASC , the less ASC is economically worth it.
Above results are not flattering with respect to the economic profitability of ASC. Therefore, the natural question arises: How inaccurate is above parameter-based economic cost discussion?
The cost of pesticides (including herbicides, fungicides, and insecticides) for cereal crop production can vary widely based on several factors, including the type of persticide used, regional market conditions, the size of the farm, and the specific application needs (e.g., pre-emergence, post-emergence products). It is also important to note that pesticide costs can vary greatly depending on the region, with some countries offering subsidies or differing regulations that might affect price points. Additionally, larger-scale operations might benefit from bulk discounts. Thus, overall parameter C chemical is difficult to estimate since it can regionally greatly vary. Above provided two inequalities, (8) and (9), permit a reader and practitioner to quickly evaluate their own cost models for C chemical , and similarly for C water . In contrast to C chemical , A total and N runs field are well measurable.
The water ratio is very influential on results. A water ratio of 99% was assumed for the spray mixture (see (7)). If this changed to 98% then N years results shown in Table 6 are approximately halved. Nevertheless, for A total = 30 ha N years , 30 would still in all scenarios in the order of multiple decades. Inversely, for a ratio larger than 99%, N years would be increased.
Δ S ¯ M k , / ha j , ASC is data-based. It depends on the methods from Section 2.2, Section 2.3, Section 2.4, Section 2.5, Section 2.6 and Section 2.7 and field contour data. Parameters include v ref , W, w and s volume ref . Several comments can be made. First, traveling velocities and path are the same for ASC and the proposed 1- and 2-sections alternatives. Therefore nominally, v ref has no effect on above relative comparison of the methods. In practice, ASC becomes more difficult for higher velocities. To avoid coverage gaps (which are more important to avoid then spray overlaps) ASC has to be set more conservatively, which would result in overlaps and reduction in spray volume savings.
Second, the larger w the more ASC converges to the 1- or 2-sections solution. The larger W the less the number of mainfield lanes and number of turns overall. On the other hand, during turns higher velocities at the outer sections along the boom bar.
Third, a change in s volume ref does not change switching signals but only the magnitude of spray volume. Thus, the coverage maps, e.g., in Figure 17 and Figure 18, do not change and thus also the relative difference between ASC and proposed 1- or 2-sections alternative does not change.
Fourth, above cost discussion is linear in parameters.
Finally, while the purchase price of an ASC-machinery is well measurable, the actual performance is in generally non-linear degraded by the effects listed in Table 1. Thus, above economic cost discussion is optimistic with respect to ASC since nominal optimal ASC was assumed for simulation experiments. This was conducted intentionally (as outlined in aforementioned Research Questions) to derive a best-case upper performance bound for ASC.
ASC-maintenance and software upgrade costs are not included in the cost analysis and would further degrade the economic potential of ASC, since these costs are expected to be higher than for a 1- or 2-sections sensor-free alternative. For greater clarity, ’sensor-free’ refers to the absence of complex and expensive sensors like RTK-GPS. While it relies on visual cues (which a human operator uses as a ’sensor’), the implementation is ’low-cost’ and ’free from advanced sensors’. However, it is important to acknowledge that reliance on visual cues can be susceptible to environmental conditions (fog, darkness) and variability in human perception, which could introduce a margin of error in application accuracy not captured under ’nominal conditions’.
To summarize, two inequalities (8) and (9) were used to evaluate the economic potential of ASC in comparison to a simpler 1- or 2-sections alternative. Overall, and assuming selected parameters according to Table 5 and Table 6, the results strongly suggest that ASC is purely economically speaking (and this is decisive for many small farms) not profitable for at least small farms, and a simpler 1- or 2-sections alternative is recommended. Margins in Figure 19 and Table 6 are simply too large to recommend otherwise. As long as costs C chemical are low and price difference Δ K ASC high this statement will hold. Above provided two inequalities (8) and (9) permit a practitioner to quickly evaluate their own cost models for C chemical and Δ K ASC .

4.3. Limitations

Limitations of the method are discussed. As stressed throughout the paper, nominal conditions are assumed to evaluate the best-case performance that ASC can deliver. Thus, performance in any real-world conditions are degraded according to the effects listed in Table 1. However, the methods S M 2 1 or S M 2 2 are naturally also affected by uncertainties and inaccuracies in practice. For example, human driving experience is required to compensate for delays when switching at the intersection line. The learning curve to achieve optimal precision may require training and practice, and variability in individual operator skill could introduce inconsistencies in application that need to be considered in a real-world scenario analysis. Nevertheless, the decisive advantages besides the economic benefits of the recommended method are the potential for (i) a sensor-free mechanical implementation, and (ii) robustness of this method.
Additionally, although the alternative method is suitable for manual operation, the effectiveness in compensating for switching delays through ’human driving experience’ (mentioned on line 430) can vary significantly among operators. The learning curve to achieve optimal precision may require training and practice, and variability in individual operator skill could introduce inconsistencies in application that need to be considered in a real-world scenario analysis.

5. Conclusions

This paper presented a nominal evaluation of Automatic Multi-Sections Control (ASC) in comparison to a proposed simpler one- or two-sections alternative with predictive spray switching. Four different hierarchical planning levels for area coverage were discussed. These include a path planning, a block switching, a section switching and an individual nozzle control-level. The focus of this paper was on the first three levels. Two area coverage path planning patterns, the Boustrophedon pattern and an alternative pattern, were discussed. Optimized block switching-logics for each of these two patterns were presented. Three different variations on the sections-switching level were compared.
The complexities of ASC were highlighted, including necessity for accurate localization sensors and automation to individually control a plethora of different nozzles.
In contrast to ASC, a preferred method is suggested that (i) minimizes area coverage path length by employing a technique different from Boustrophedon-based path planning, (ii) can be implemented sensor-free (low-cost) by visual inspection of the intersection line resulting when employing different planting directions in the mainfield and headland area, and (iii) is suitable for manual driving by following a pre-planned predictive spray switching logic and area coverage path plan.
The preferred method minimizes pathlength, however, requires overall more spray volume than more complex and expensive ASC. A detailed economic cost analysis was provided. Fundamental to this discussion was that spray mixtures consist to a very large degree out of water and only to a small degree, often 0.5–2%, out of chemical component (herbicides, fungicides and the like), but water costs are typically much cheaper than the cost for chemicals. Surprisingly strong economic arguments were found to not recommend ASC for small farms.
To advance the practical applicability of this promising alternative method, future research should focus on field validation under a variety of real-world conditions, quantifying the impact of factors such as wind and terrain variability. Furthermore, the development of low-cost support tools, such as mobile applications or simple visual displays that guide manual section switching based on predictive logic, could mitigate reliance on exclusive operator experience and standardize application quality, thereby maximizing the economic benefits identified in this study.

Funding

This research received no external funding.

Data Availability Statement

The raw data supporting the conclusions of this article was collected in 2024 and will be made available by the authors on request.

Conflicts of Interest

Author Mogens Plessen was employed by the company Findklein GmbH. The author declares that the research was conducted in the absence of any commercial or financial relationships that could be construed as a potential conflict of interest.

Abbreviations

The following abbreviations are used in this manuscript:
ASCAutomatic Section Control.
A field Field size, (ha).
A total Total farm size, (ha).
C chemical Cost for pesticides, (EUR/).
C water Cost for water for spray mixture, (EUR/).
Δ K ASC Purchase price difference for ASC, (EUR).
LPathlength for machinery, (m).
N runs field Number of field runs per crop cycle, (-).
N years Number of years until profitability for ASC, (-).
S field ref Spray volume reference for a given field, ().
SSpray volume required for a given field, ().
WMachinery working width, (m).
w nozzle Inter-nozzle spacing along the boom bar, (m).

References

  1. Portman, R.W. Calibrating Single Nozzle and Boom Sprayers; Washington State University: Pullman, WA, USA, 1979. [Google Scholar]
  2. Smith, D.; Oakley, D.; Williams, E.; Kirkpatrick, A. Broadcast spray deposits from fan nozzles. Appl. Eng. Agric. 2000, 16, 109–113. [Google Scholar] [CrossRef]
  3. Sharda, A. Boom Dynamics During Control System Response on Agricultural Sprayers. Ph.D. Thesis, Auburn University, Auburn, AL, USA, 2011. [Google Scholar]
  4. Vijayakumar, V.; Ampatzidis, Y.; Schueller, J.K.; Burks, T. Smart spraying technologies for precision weed management: A review. Smart Agric. Technol. 2023, 6, 100337. [Google Scholar] [CrossRef]
  5. Hafeez, A.; Husain, M.A.; Singh, S.; Chauhan, A.; Khan, M.T.; Kumar, N.; Chauhan, A.; Soni, S. Implementation of drone technology for farm monitoring & pesticide spraying: A review. Inf. Process. Agric. 2023, 10, 192–203. [Google Scholar] [CrossRef]
  6. Plessen, M. Path planning for spot spraying with uavs combining tsp and area coverages. Smart Agric. Technol. 2025, 11, 100965. [Google Scholar] [CrossRef]
  7. Hassen, N.S.; Sidik, N.A.C.; Sheriff, J.M. Effect of nozzle type, angle and pressure on spray volumetric distribution of broadcasting and banding application. J. Mech. Eng. Res. 2013, 5, 76–81. [Google Scholar] [CrossRef]
  8. Galceran, E.; Carreras, M. A survey on coverage path planning for robotics. Robot. Auton. Syst. 2013, 61, 1258–1276. [Google Scholar] [CrossRef]
  9. Plessen, M.G. Optimal in-field routing for full and partial field coverage with arbitrary non-convex fields and multiple obstacle areas. Biosyst. Eng. 2019, 186, 234–245. [Google Scholar] [CrossRef]
  10. Utamima, A.; Djunaidy, A. Agricultural routing planning: A narrative review of literature. Procedia Comput. Sci. 2022, 197, 693–700. [Google Scholar] [CrossRef]
  11. Pour Arab, D.; Spisser, M.; Essert, C. Complete coverage path planning for wheeled agricultural robots. J. Field Robot. 2023, 40, 1460–1503. [Google Scholar] [CrossRef]
  12. Höffmann, M.; Patel, S.; Büskens, C. Optimal guidance track generation for precision agriculture: A review of coverage path planning techniques. J. Field Robot. 2024, 41, 823–844. [Google Scholar] [CrossRef]
  13. Luck, J.; Pitla, S.; Shearer, S.; Mueller, T.; Dillon, C.; Fulton, J.; Higgins, S. Potential for pesticide and nutrient savings via map-based automatic boom section control of spray nozzles. Comput. Electron. Agric. 2010, 70, 19–26. [Google Scholar] [CrossRef]
  14. Han, S.; Hendrickson, L.L.; Ni, B.; Zhang, Q. Modification and testing of a commercial sprayer with PWM solenoids for precision spraying. Appl. Eng. Agric. 2001, 17, 591. [Google Scholar] [CrossRef]
  15. Johnson, M.; Swetnam, L. Sprayer Nozzles: Selection and Calibration; University of Kentucky: Lexington, KY, USA, 1996. [Google Scholar]
  16. Holterman, H.; Van De Zande, J.; Porskamp, H.; Huijsmans, J. Modelling spray drift from boom sprayers. Comput. Electron. Agric. 1997, 19, 1–22. [Google Scholar] [CrossRef]
  17. Wolf, T. Best management practices for herbicide application technology. Prairie Soils Crops J. 2009, 2, 24–30. [Google Scholar]
  18. Balsari, P.; Gil, E.; Marucco, P.; van de Zande, J.C.; Nuyttens, D.; Herbst, A.; Gallart, M. Field-crop-sprayer potential drift measured using test bench: Effects of boom height and nozzle type. Biosyst. Eng. 2017, 154, 3–13. [Google Scholar] [CrossRef]
  19. Mangus, D.L.; Sharda, A.; Engelhardt, A.; Flippo, D.; Strasser, R.; Luck, J.D.; Griffin, T. Analyzing the nozzle spray fan pattern of an agricultural sprayer using pulse width modulation technology to generate an on-ground coverage map. Trans. ASABE 2017, 60, 315–325. [Google Scholar] [CrossRef]
  20. Grisso, R.D.; Askew, S.D.; McCall, D.S. Nozzles: Selection and Sizing; Virginia Cooperative Extension: Danville, VA, USA, 2019. [Google Scholar]
  21. Cui, L.; Xue, X.; Ding, S.; Le, F. Development of a DSP-based electronic control system for the active spray boom suspension. Comput. Electron. Agric. 2019, 166, 105024. [Google Scholar] [CrossRef]
  22. Burgers, T.A.; Gaard, J.D.; Hyronimus, B.J. Comparison of three commercial automatic boom height systems for agricultural sprayers. Appl. Eng. Agric. 2021, 37, 287–298. [Google Scholar] [CrossRef]
  23. Vong, C.N.; Larbi, P.A. Development and prototype testing of an agricultural nozzle clog detection device. Trans. ASABE 2021, 64, 49–61. [Google Scholar] [CrossRef]
  24. Fabula, J.; Sharda, A.; Luck, J.D.; Brokesh, E. Nozzle pressure uniformity and expected droplet size of a pulse width modulation (PWM) spray technology. Comput. Electron. Agric. 2021, 190, 106388. [Google Scholar] [CrossRef]
  25. Wang, G.; Zhang, T.; Song, C.; Yu, X.; Shan, C.; Gu, H.; Lan, Y. Evaluation of spray drift of plant protection drone nozzles based on wind tunnel test. Agriculture 2023, 13, 628. [Google Scholar] [CrossRef]
  26. Wang, S.; Li, X.; Nuyttens, D.; Zhang, L.; Liu, Y.; Li, X. Evaluationof compact air-induction flat fan nozzles for herbicide applications: Spray drift and biological efficacy. Front. Plant Sci. 2023, 14, 1018626. [Google Scholar] [CrossRef] [PubMed]
  27. Hussain, I.; Han, X.; Zhang, Z.; Mao, X.; Guo, J. Enhancing precision agriculture with advanced variable-rate spraying and autonomous vehicles: A comprehensive review. Comput. Electron. Agric. 2025, 238, 110812. [Google Scholar] [CrossRef]
  28. Carreño Ruiz, M.; Bloise, N.; Guglieri, G.; D’Ambrosio, D. Numerical analysis and wind tunnel validation of droplet distribution in the wake of an unmanned aerial spraying system in forward flight. Drones 2022, 6, 329. [Google Scholar] [CrossRef]
  29. Luck, J.D.; Sharda, A.; Pitla, S.K.; Fulton, J.P.; Shearer, S.A. Generating ‘As-Applied’ Pesticide Distribution Maps from a Self-Propelled Agricultural Sprayer Based on Nozzle Pressure Data. In 2010 Pittsburgh, Pennsylvania, June 20–June 23, 2010; American Society of Agricultural and Biological Engineers: St. Joseph, MI, USA, 2010; p. 1. [Google Scholar]
  30. Plessen, M. Predictive Spray Switching for an Efficient Path Planning Pattern for Area Coverage. AgriEngineering 2025, 7, 235. [Google Scholar] [CrossRef]
  31. Sequeira, E.G. Structured vs. Unstructured Scan Path in Static Visual Search Performance. Master’s Thesis, Kansas State University, Manhattan, KS, USA, 1979. [Google Scholar]
  32. Tao, J.M.; Luh, J. Coordination of two redundant robots. In Proceedings of the 1989 IEEE International Conference on Robotics and Automation, Scottsdale, AZ, USA, 14–19 May 1989; IEEE Computer Society: Piscataway, NJ, USA, 1989; pp. 425–426. [Google Scholar]
  33. ISO 11783-10:2015; Tractors and Machinery for Agriculture and Forestry—Serial Control and Communications Data Network—Part 10: Task Controller and Management Information System Data Interchange. ISO 11783-10:2015: Geneva, Switzerland, 2015.
  34. Tan, C.S.; Mohd-Mokhtar, R.; Arshad, M.R. A comprehensive review of coverage path planning in robotics using classical and heuristic algorithms. IEEE Access 2021, 9, 119310–119342. [Google Scholar] [CrossRef]
  35. Jayalakshmi, K.; Nair, V.G.; Sathish, D. A Comprehensive Survey on Coverage Path Planning for Mobile Robots in Dynamic Environments. IEEE Access 2025, 13, 60158–60185. [Google Scholar] [CrossRef]
  36. Plessen, M.G. Freeform path fitting for the minimisation of the number of transitions between headland path and interior lanes within agricultural fields. Artif. Intell. Agric. 2021, 5, 233–239. [Google Scholar] [CrossRef]
  37. Plessen, M.M.G. Partial field coverage based on two path planning patterns. Biosyst. Eng. 2018, 171, 16–29. [Google Scholar] [CrossRef]
  38. Plessen, M. Smoothing of headland path edges and headland-to-mainfield lane transitions based on a spatial domain transformation and linear programming. Biosyst. Eng. 2025, 257, 104229. [Google Scholar] [CrossRef]
  39. He, Z.; Bao, Y.; Yu, Q.; Lu, P.; He, Y.; Liu, Y. Dynamic path planning method for headland turning of unmanned agricultural vehicles. Comput. Electron. Agric. 2023, 206, 107699. [Google Scholar] [CrossRef]
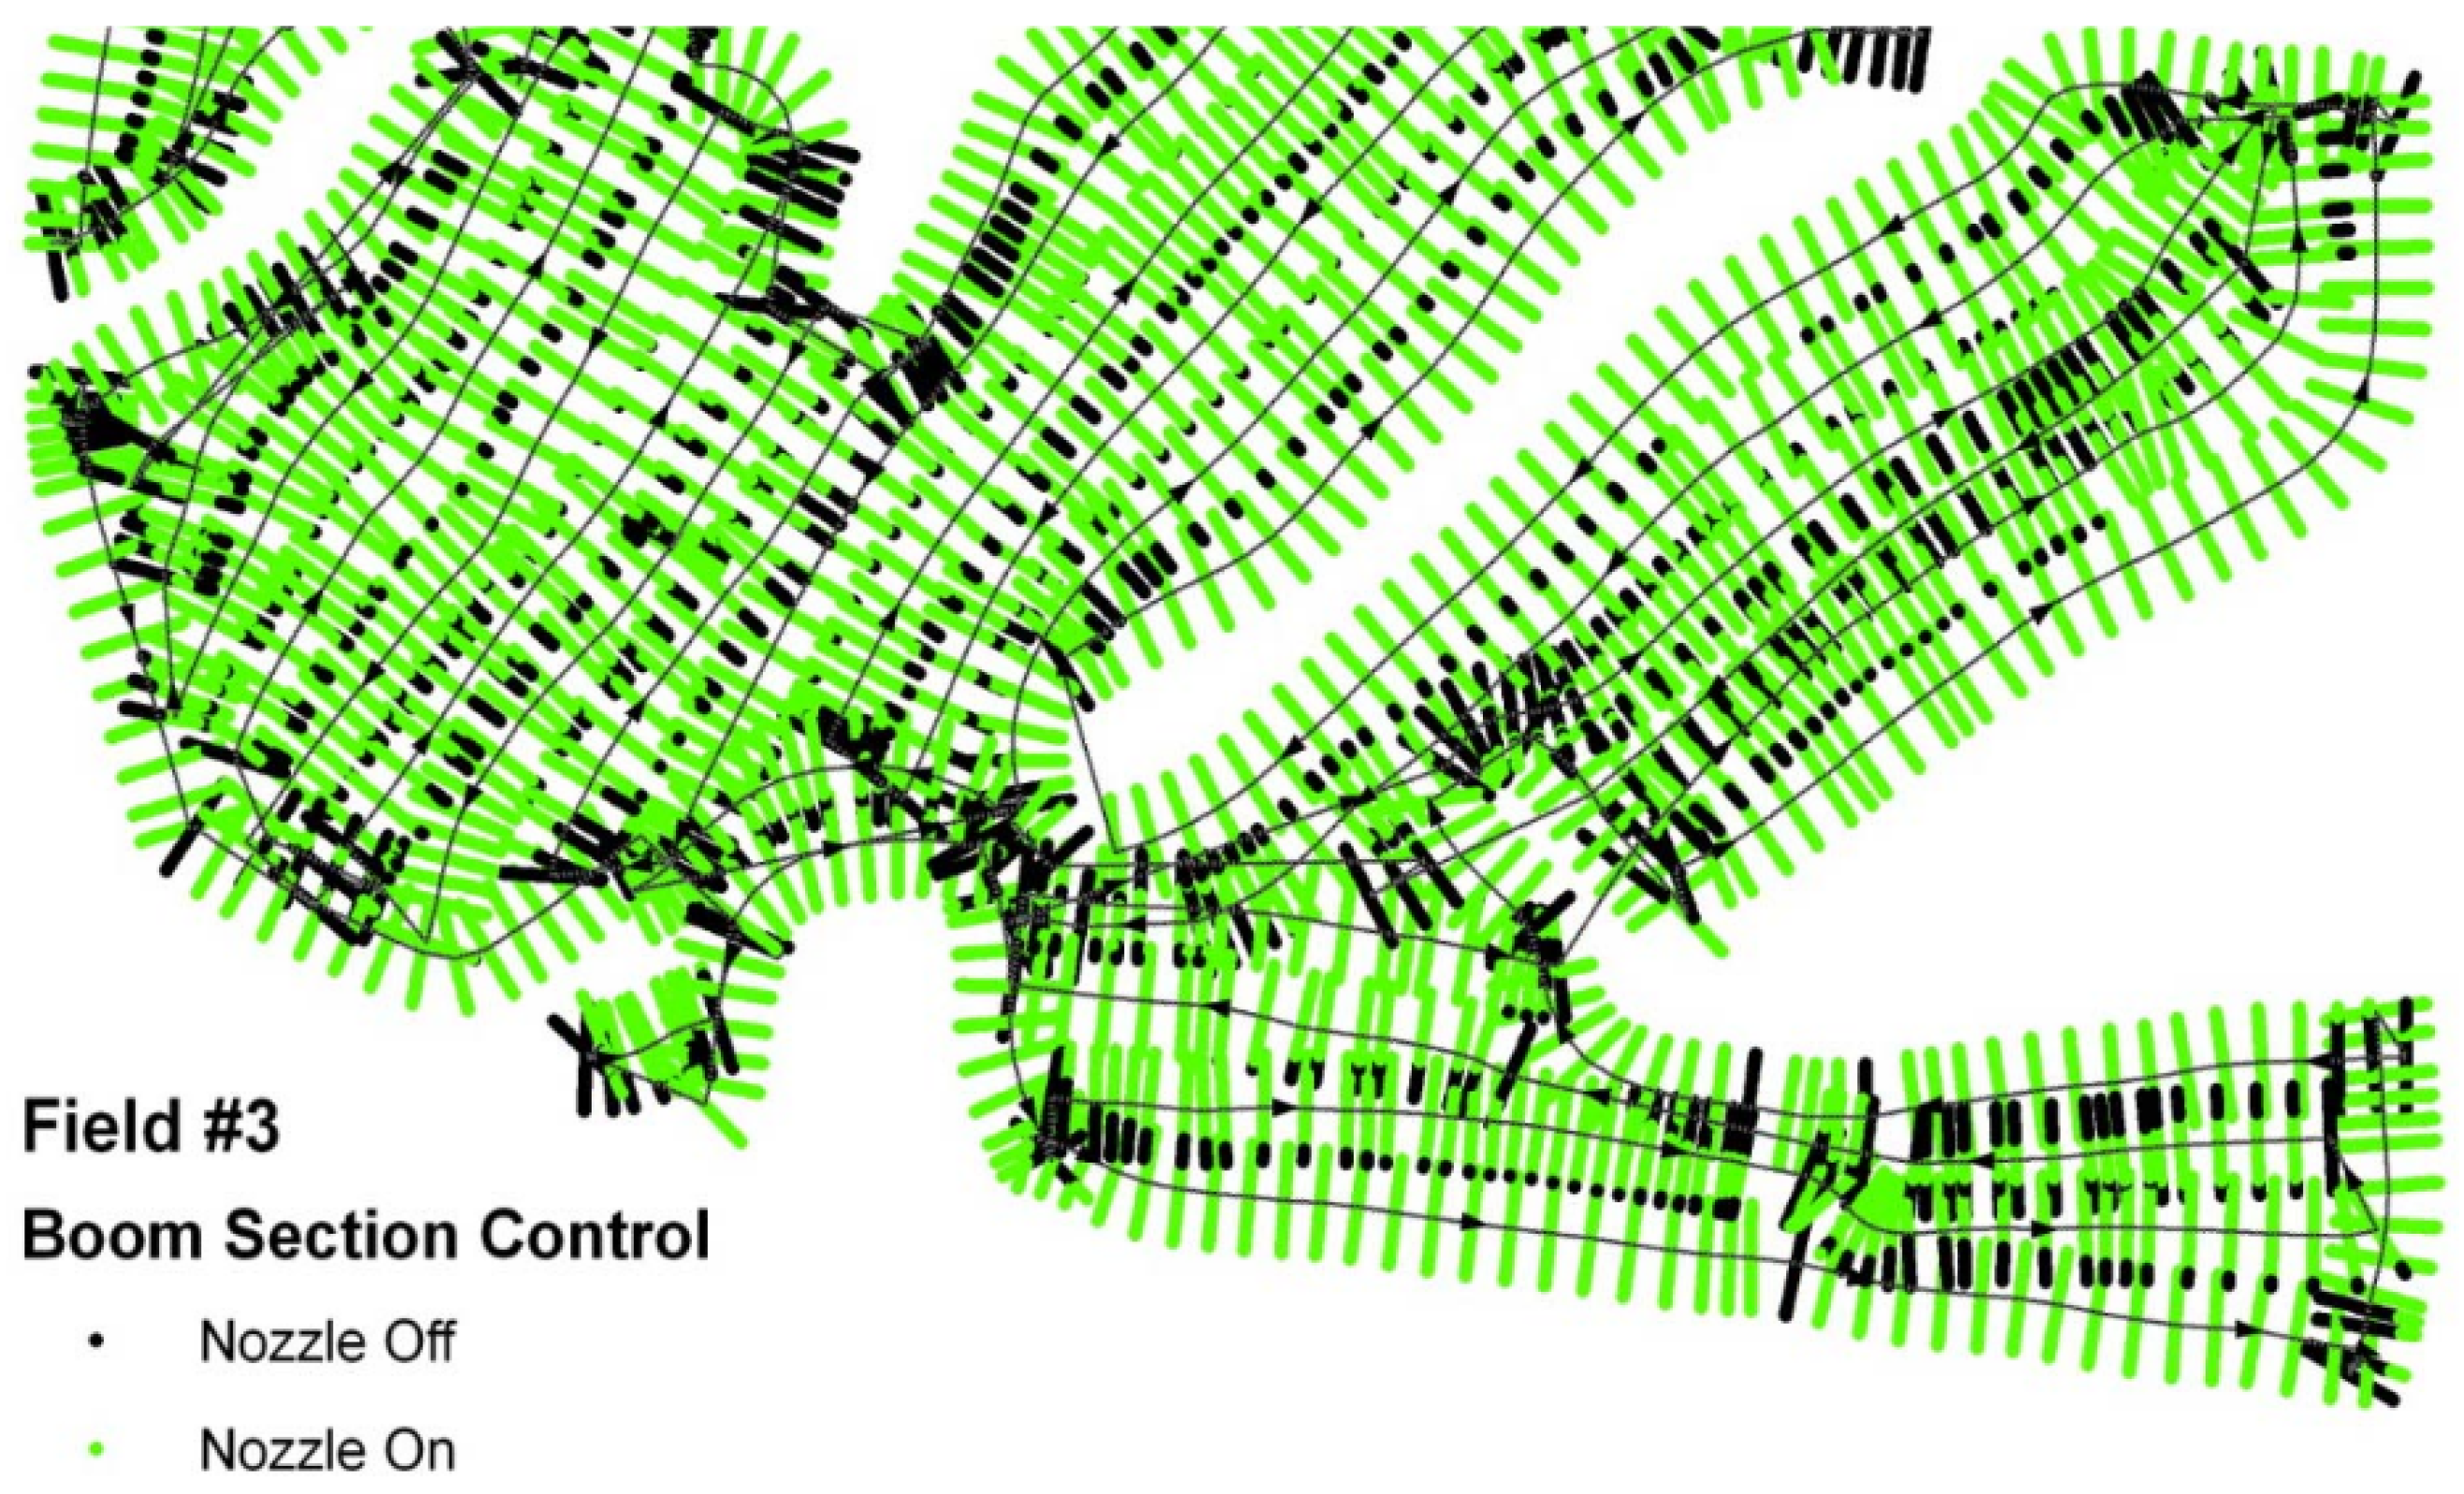
Figure 1. Illustration of switching results stemming from a map-based Automatic Section Control. The figure is from [29]. Four comments are made: (i) The gaps between green areas are due to the fact that boom section states (nozzle on- or off-states) are sampled discretely. (ii) Multiple overlapping green areas can still be observed. (iii) The discrete nature of the displayed results (large gaps between two sampled green areas) implies that delays between switching changes (from nozzle on- to an off-state and vice versa) naturally occur. (iv) It can further be observed that adjacent path segments (mainfield lanes) do not have a constant distance to each other. This results in excessive overlapping potential. The figure is given for visualization of four typical difficulties associated with ASC.
Agriculture 15 02304 g001
Figure 2. Distinction between three different sections control setups. The machinery working width is denoted by W. For the case of multiple sections, w denotes the section width, which is typically a fraction of the machinery working width. A numerical example is W = 24 m and w = 0.5 m, which results in 48 sections.
Agriculture 15 02304 g002
Figure 3. Complexities of the spraying process: a sketch illustrating different velocities along different sections of the boom bar during turn maneuvers.
Agriculture 15 02304 g003
Figure 4. Complexities of the spraying process: sketch illustrating (i) boom height H, (ii) inter-nozzle spacing w nozzle , (iii) spray angle γ , (iv) angle η for angled nozzles along the vertical axis (‘z-axis’) such that adjacent spray patterns do not intersect, and (v) typically ellipsoid spray patterns for flat-fan nozzles.
Agriculture 15 02304 g004
Figure 5. Complexities of the spraying process: a sketch illustrating (i) typical overlap of nozzle sprays to attain uniform spray coverage over the boom bar (‘broadcast spraying’), and (ii) illustration of lateral transients resulting from the overlap when only subsets of adjacent nozzles (‘sections’) are actuated.
Agriculture 15 02304 g005
Figure 6. Distinction between 4 hierarchical planning levels for area coverage: (i) path planning-level, (ii) block switching-level, (iii) sections switching-level, and (iv) a nozzle control-level (realization of individual nozzle actuation commands at the embedded machine level). The topic of this paper is the first three levels (iiii).
Agriculture 15 02304 g006
Figure 7. Illustration of steps from field contour data to area coverage. The practical usefulness of different planting directions in headland and mainfield area is highlighted. The intersection line between the two areas is useful for triggering spray switching changes (i.e., on- and off-switching) and is useful for both, (i) the Boustrophedon -based and (ii) the alternative planning method. An extension to the case with obstacle areas (tree islands) inside the field is straightforward by the introduction of obstacle area headland areas with planting areas different from the mainfield area. The headland and mainfield planting directions in above figure are sketched at a 90° angle to each other. Any other angle is also possible as long as an intersection line results that can be employed as a visual cue for switching command changes.
Agriculture 15 02304 g007
Figure 8. First hierarchical level according to Figure 6. The area coverage path planning. Comparison of two path patterns that can be used for area coverage (see [30]). These two area coverage path planning-setups are evaluated in numerical experiments.
Agriculture 15 02304 g008
Figure 9. Block Switching Method M 1 : State-of-the-art reactive switching logic for area coverage based on the Boustrophedon-path pattern in combination with an initial full headland path traversal. The field entrance and starting point of the path is indicated by the black dot.
Agriculture 15 02304 g009
Figure 10. Block Switching Method M 2 : Illustration of the predictive switching logic (af) according to the method from [30]. The switching logic exploits the structure of a specific path pattern. The concatenation of this path pattern and the concatenation of corresponding switching logics permits area coverage. Gray areas indicate sprayed area. Along transitions A–D, E–J and K–A it is switched off. Along transitions D–E, J–K and A–M it is switched on.
Agriculture 15 02304 g010
Figure 11. Block Switching Method M 2 : Concatenation of two path planning patterns. This figure illustrates how the concatenation of multiple path patterns enables spraying of a larger area [30].
Agriculture 15 02304 g011
Figure 12. Area Coverage Path Planning Method M 2 : Visualization of a full area coverage example resulting from the concatenation of multiple path patterns, and the application of proposed switching logic in Figure 10 for each path pattern.
Agriculture 15 02304 g012
Figure 13. Third hierarchical planning level according to Figure 6: sections switching-level. Illustration of the discretization method used for evaluation in numerical experiments. See Section 2.5 for details.
Agriculture 15 02304 g013
Figure 14. The path to be followed by a machinery is in blue. Sprayed area is in gray. Illustration of the disadvantage of an occupancy grid-based approach to determine if a small area has already been sprayed before or not (see also Figure 1). The effect of different hyperparameter choices for d G , which is a threshold that determines if the centroid of a small area candidate is close to the centroid of an already sprayed area via the Euclidean norm, is visualized. In (a) there are gaps if d G is too large. In (b,c) there are overlaps if d G is too small. In contrast, in (d) an alternative non-occupancy grid based approach is visualized. This is approach does not require a threshold hyperparameter and yields both less gaps as well as less overlapping.
Agriculture 15 02304 g014
Figure 15. The effect of mainfield lane endings that are not perpendicular with respect to the headland path is visualized for 3 different section setups according to Figure 2. See in particular the differences around the transition annotated with index number 6. In (a) all nozzles are simultaneously switched on or off. In contrast, in (c) each nozzle is switched individually.
Agriculture 15 02304 g015
Figure 16. Visualization of input data for 10 fields. Input data comprised coordinates of field contours and of obstacle areas if applicable. The first five fields are ordered in the upper row from left to right. The remaining five fields are ordered in the second row from left to right.
Agriculture 15 02304 g016
Figure 17. Field example 1: visual comparison of 6 different setups. See Table 3 for quantitative evaluation. The field coverage path according to method M 1 is given by the node sequence: [0, 1, 2, 3, 4, 5, 6, 7, 8, 9, 19, 10, 11, 12, 13, 14, 15, 16, 17, 18, 0, 1, 2, 17, 16, 3, 4, 15, 14, 5, 6, 13, 12, 7, 8, 11, 10, 9, 19, 10, 11, 12, 13, 14, 15, 16, 17, 18, 1, 0]. For method M 2 the sequence is: [0, 1, 2, 17, 18, 1, 2, 3, 4, 15, 16, 3, 4, 5, 6, 13, 14, 5, 6, 7, 8, 11, 12, 7, 8, 9, 19, 10, 9, 19, 10, 11, 12, 13, 14, 15, 16, 17, 18, 0]. The working width was W = 24 m.
Agriculture 15 02304 g017aAgriculture 15 02304 g017b
Figure 18. Field example 2: visual comparison of 6 different setups. See Table 3 for quantitative evaluation. The field coverage path according M 1 is: [0, 1, 43, 2, 3, 4, 5, 6, 7, 8, 9, 10, 11, 12, 13, 14, 15, 16, 17, 18, 19, 20, 21, 22, 44, 23, 24, 25, 26, 27, 28, 29, 30, 31, 32, 33, 34, 35, 36, 37, 38, 39, 40, 41, 42, 0, 1, 43, 2, 1, 0, 42, 3, 4, 41, 40, 5, 6, 39, 38, 7, 8, 37, 36, 9, 10, 35, 34, 11, 12, 33, 32, 13, 14, 31, 30, 15, 16, 29, 28, 17, 18, 27, 26, 19, 20, 25, 24, 21, 22, 23, 24, 25, 26, 27, 28, 29, 30, 31, 32, 33, 34, 35, 36, 37, 38, 39, 40, 41, 42, 0]. For method M 2 : [0, 1, 43, 2, 1, 43, 2, 3, 4, 5, 6, 39, 40, 5, 6, 7, 8, 37, 38, 7, 8, 9, 10, 35, 36, 9, 10, 11, 12, 33, 34, 11, 12, 13, 14, 31, 32, 13, 14, 15, 16, 29, 30, 15, 16, 17, 18, 27, 28, 17, 18, 19, 20, 25, 26, 19, 20, 21, 22, 23, 24, 21, 22, 44, 23, 24, 25, 26, 27, 28, 29, 30, 31, 32, 33, 34, 35, 36, 37, 38, 39, 40, 41, 42, 3, 4, 41, 42, 0]. The working width was W = 24 m.
Agriculture 15 02304 g018aAgriculture 15 02304 g018b
Figure 19. Visualization of (7) as a function of spray volume difference Δ S . C water = 0.002 EUR/ is assumed. The influence of three cost-levels for C chemical is compared in the top subplot. The results are highlighted for C chemical = 10 EUR/ in the bottom subplot.
Agriculture 15 02304 g019
Table 1. Factors that influence the spraying process. The list is provided to underline the high complexity of the spraying process in open-space agriculture. Variations from a calibrated reference setting for each of the listed factors make an accurate ASC-execution more difficult.
Nr.Factors Affecting Spraying ResultsReferences
1Machinery traveling speed changes[17]
2Varying traveling speeds of different[20]
boom sections along the boom bar
during turn maneuvers, see Figure 3
3Oscillations and inertia of mechanical[20,21]
boom structure during turn maneuvers
4Boom height and vertical boom bar[18,21,22]
oscillations, H in Figure 4
5Nozzle type selection[7,15,18]
6Nozzle spray overlap of adjacent nozzles[19]
7Nozzle spacing, w nozzle in Figure 4[7,20]
8Nozzle clogging[20,23]
9Water volume and spray composition[20]
10Spray pressure or nozzle flow rate[7,17,24]
11Spray droplet size[7,17,19]
12Spray fan angle, γ in Figure 4[7,19]
13Angled nozzles along the vertical axis[20]
(‘z-axis’) such that adjacent spray
patterns do not intersect, η in Figure 4
14Non-perpendicular spray angles towards[20]
field ground for 3D topography
15Section width selection,[20]
w section in Figure 5
16Cross wind and spray drift[16,17,25,26]
17Occupancy grid hyperparameters[33]
18For ASC requirement of at least 1[13,27]
accurate localization sensor
(e.g., RTK-GPS)
19Pulse-Width-Modulation (PWM) for[14,24]
individual nozzle flow rate control
20Reactive spraying (i.e., with delays) unless[30]
spraying is directly coupled to automated
vehicle steering and velocity control
Table 2. Pathlengths of numerical experiments for methods M 1 and M 2 .
Ex. A field L M 1 L M 2 Δ L (m) Δ L (%)
16.0 ha3394 m3166 m−228 m−6.7%
214.6 ha8002 m7368 m−634 m−7.9%
310.1 ha5995 m5488 m−507 m−8.5%
411.8 ha6428 m5954 m−474 m−7.4%
513.5 ha7231 m6784 m−447 m−6.2%
638.5 ha19413 m18447 m−966 m−5.0%
76.5 ha3512 m3346 m−166 m−4.7%
813.6 ha7713 m7087 m−625 m−8.1%
94.5 ha2834 m2485 m−349 m−12.3%
107.2 ha3890 m3739 m−151 m−3.9%
Table 3. Spray volume results for 6 different setups, S M k j , k { 1 , 2 } , j { 1 , 2 , 48 } . For a given field area A field , the theoretical ideal spray volume for uniform spraying is S field ref = A field s volume ref . The differences measured in meters and percent are Δ S M k , m j , ref = S M k , m j , ref S field ref and Δ S M k , % j , ref = ( S M k , m j , ref S field ref ) / S field ref , respectively.
Ex. A field S field ref S M 1 1 S M 1 2 S M 1 48 S M 2 1 S M 2 2 S M 2 48
Δ S M 1 , m 1 , ref Δ S M 1 , m 2 , ref Δ S M 1 , m 48 , ref Δ S M 2 , m 1 , ref Δ S M 2 , m 2 , ref Δ S M 2 , m 48 , ref
Δ S M 1 , % 1 , ref Δ S M 1 , % 2 , ref Δ S M 1 , % 48 , ref Δ S M 2 , % 1 , ref Δ S M 2 , % 2 , ref Δ S M 2 , % 48 , ref
16.0 ha282.8358.9342.3288.7372.7352.8289.7
76.159.55.989.970.06.9
26.9%21.0%2.1%31.8%24.7%2.4%
214.6 ha682.1881.2849.3695.7901.6856.0697.2
119.1167.213.6219.5173.915.1
29.2%24.5%2.0%32.2%25.5%2.2%
310.1 ha473.8676.3646.8487.2681.2645.8488.9
202.5173.013.4207.4172.015.1
42.7%36.5%2.8%43.8%36.3%3.2%
411.8 ha552.6702.9656.6560.6721.3665.5561.7
150.3104.08.0168.7112.99.1
27.2%18.8%1.4%30.5%20.4%1.6%
513.5 ha629.7780.2758.9638.7756.3733.1640.5
150.5129.29126.6103.410.8
23.9%20.5%1.4%20.1%16.4%1.7%
638.5 ha1799.72621.32592.11859.12627.22593.21860.9
821.6792.459.4827.5793.561.2
45.6%44.0%3.3%45.9%44.1%3.4%
76.5 ha304.6489.6486.8314.6495.9490.1315.1
185.0182.210.0191.3185.510.5
60.7%59.8%3.2%62.8%60.9%3.4%
813.6 ha636.4980.9938.5668.81086.4972.4665.5
344.5302.132.4450.0336.029.1
54.1%47.5%5.1%70.7%52.8%4.6%
94.5 ha211.1397.9371.8225.3479.1450.6225.8
186.8160.714.2268.0239.514.7
88.5%76.1%6.7%126.9%113.4%6.9%
107.2 ha336.3434.2410.8342.7436.5413.0343.3
97.974.56.4100.276.77.0
29.1%22.1%1.9%29.8%22.8%2.1%
Table 4. The hectares-normalized spray volumes that a 1- or 2-sections solution requires more than ASC. Data is deduced from Table 3.
Ex. A field Δ S M 1 , / ha 1 , ASC Δ S M 1 , / ha 2 , ASC Δ S M 2 , / ha 1 , ASC Δ S M 2 , / ha 2 , ASC
(ha) (/ha) (/ha) (/ha) (/ha)
16.011.78.913.810.5
214.612.710.514.010.9
310.118.715.819.013.5
411.812.08.113.58.8
513.510.58.98.66.9
638.519.819.019.919.0
76.526.926.527.826.9
813.622.919.830.922.6
94.538.432.656.350.0
107.212.79.412.99.7
Avg. 12.618.616.722.518.7
Table 5. Parameters used for economic cost calculations.
ParameterValueUnit
C water 0.002EUR/
C chemical { 10 , 30 } EUR/
A total { 30 , 100 , 300 , 600 , 1000 } ha
N runs field 8-
Table 6. Numerical results for the evaluation of (9). N years , 30 implies that cost C chemical = 30 EUR/ was assumed. For N years , 10 it was employed C chemical = 10 EUR/. Numbers in bold are for emphasis (see Section 4.2).
For Δ S ¯ M 1 , / ha 1 , 48 = 18.6 /haFor Δ S ¯ M 2 , / ha 1 , 48 = 22.5 /ha
Δ K ASC = 100,000 EUR Δ K ASC = 100,000 EUR
A total N years , 30 N years , 10 A total N years , 30 N years , 10
3074.2219.73061.3181.6
10022.365.910018.454.5
3007.422.03006.118.2
6003.711.06003.19.1
10002.26.610001.85.4
Δ K ASC = 200,000 EUR Δ K ASC = 200,000 EUR
A total N years , 30 N years , 10 A total N years , 30 N years , 10
30148.4439.330122.6363.2
10044.5131.810036.8109.0
30014.843.930012.336.3
6007.422.06006.118.2
10004.513.210003.710.9
For Δ S ¯ M 1 , / ha 2 , 48 = 16.7 /haFor Δ S ¯ M 2 , / ha 2 , ASC = 18.7 /ha
Δ K ASC = 100,000 EUR Δ K ASC = 100,000 EUR
A total N years , 30 N years , 10 A total N years , 30 N years , 10
3082.6244.73073.8218.5
10024.873.410022.165.5
3008.324.53007.421.8
6004.112.26003.710.9
10002.57.310002.26.5
Δ K ASC = 200,000 EUR Δ K ASC = 200,000 EUR
A total N years , 30 N years , 10 A total N years , 30 N years , 10
30165.2489.330147.6437.0
10049.6146.810044.3131.1
30016.548.930014.843.7
6008.324.56007.421.8
10005.014.710004.413.1
Disclaimer/Publisher’s Note: The statements, opinions and data contained in all publications are solely those of the individual author(s) and contributor(s) and not of MDPI and/or the editor(s). MDPI and/or the editor(s) disclaim responsibility for any injury to people or property resulting from any ideas, methods, instructions or products referred to in the content.