Article

Improving Rice Seed Quality Through the Combined Application of DBD Plasma and CuO NPs

by
Jira Praditwanich
1,
Yothin Chimupala
2,
Pilunthana Thapanapongworakul
3,
Choncharoen Sawangrat
4,
Dheerawan Boonyawan
5,
Chommanad Sawadeemit
6 and
Sa-nguansak Thanapornpoonpong
1,*
1
Department of Plant and Soil Science, Faculty of Agriculture, Chiang Mai University, Chiang Mai 50200, Thailand
2
Department of Industrial Chemistry, Faculty of Science, Chiang Mai University, Chiang Mai 50202, Thailand
3
Department of Entomology and Plant Pathology, Faculty of Agriculture, Chiang Mai University, Chiang Mai 50200, Thailand
4
Department of Industrial Engineering, Faculty of Engineering, Chiang Mai University, Chiang Mai 50200, Thailand
5
Plasma and Beam Physics Research Facility, Faculty of Science, Chiang Mai University, Chiang Mai 50200, Thailand
6
Department of Chemistry, Faculty of Science, Chiang Mai University, Chiang Mai 50202, Thailand
*
Author to whom correspondence should be addressed.
Agriculture 2025, 15(21), 2280; https://doi.org/10.3390/agriculture15212280 (registering DOI)
Submission received: 28 September 2025 / Revised: 24 October 2025 / Accepted: 31 October 2025 / Published: 1 November 2025
(This article belongs to the Section Seed Science and Technology)

Abstract

This study examined the effects of dielectric barrier discharge (DBD) plasma and copper oxide nanoparticles (CuO NPs) on rice seed quality, seedling growth, and fungal inhibition. Sanpatong 1 rice seeds were treated with DBD plasma at three exposure durations (0.4, 0.6, and 0.8 s/cm) and coated with CuO NP solutions at five concentrations (0, 0.02, 0.04, 0.06, and 0.08 M). The experiment followed a split-split-plot design within a randomized complete block design (RCBD), with storage time (0, 2, 4, and 6 months) as the main plot factor. Plasma etching improved seed surface wettability, while CuO NPs increased copper uptake and promoted growth at 0.04–0.06 M but caused toxicity at 0.08 M. Combined treatments suppressed Rhizopus sp. and Rhizoctonia solani, though Aspergillus spp. were less affected. Seed quality declined after six months of storage, likely due to oxidative stress. The best results were obtained with 0.6 s/cm plasma and 0.06 M CuO NPs, maximizing germination, vigor, and seedling growth without toxicity, demonstrating their potential as practical tools for improving rice seed quality and pathogen management.

1. Introduction

Rice is the main food crop for over 50% of the world’s population. Rice production is expected to increase by 40% by 2030 to meet the demands of the rapidly growing world population [1]. Rice cultivation requires high-quality, standardized seeds with high germination rates and vigor, as well as free from diseases and insects [2]. Generally, rice seed quality improvement involves sorting and cleaning seeds using sorting machines and then treating with plant protection chemicals.
In commercial seed processing, mechanical cleaning and gravity separation frequently lead to quantitative seed losses of about 2–10% of total output, depending on crop type and equipment adjustment. Overly strong air flow or separation intensity can remove viable but lighter seeds together with impurities, causing unnecessary loss of high-quality seeds and lowering overall seed recovery [3]. Chemical seed treatment aims to protect seeds and seedlings from seed pathogens (fungi, bacteria) and pests, enhancing overall germination rate and vigor. However, major drawbacks involve environmental and health risks due to chemical residue, potential toxicity to the seeds if applied incorrectly, and the risk of pests developing resistance over time.
Such limitations highlight the industrial need for alternative, non-mechanical conditioning technologies that can maintain seed quality while reducing physical loss and chemical dependence.
Plasma technology is one of the noteworthy techniques used to improve the condition of rice seeds, because it can improve germination and seed vigor while also efficiently eliminating seed-borne plant diseases [4,5,6]. This enables the improvement of rice seed quality without the need for strict sorting criteria, leading to reduced yield losses during the conditioning process.
Plasma is the fourth state of matter, based on the pattern of increasing energy levels, from solid to gas and finally to the ionized state of gas plasma. It can be subdivided into equilibrium (thermal) and nonequilibrium (low temperature) plasma [7]. Low-temperature plasma has been widely used in biological applications, including seed germination (G) enhancement [4,5,8,9,10].
Dielectric Barrier Discharge Plasma (DBD Plasma) is one of the low-temperature plasmas that can be easily excited at atmospheric pressure and room temperature. DBD plasma discharge can generate ultraviolet radiation, high electric fields, electrons, reactive oxygen–nitrogen species (RONS), etc., without using rare gases or vacuum devices to generate plasma [11]. There are also advantages in non-thermal discharge characteristics [with electron temperature (Te) being higher than the gas temperature (Tg)] and the uniform distribution of micro-discharge on the dielectric surface. This property makes DBD plasma ideal for use with heat-sensitive materials due to its low temperature and high uniformity [12].
DBD plasma significantly increased the G, germination index (GI), shoot length, root length, and seed vigor index of rice seeds [5]. Plasma exposure causes changes in the seed coat surface. When seeds are exposed to plasma, radical species react with the seed coat surface, causing erosion and making the seed surface more hydrophilic. As a result, the water absorption rate of the seeds increases and improves the G [4,5,13]. In addition, when the seeds are exposed to plasma, RONS is deposited on the seeds and may migrate into the seeds through cracks in the external surface. RONS induces an increase in ROS within the seed cells, followed by an increase in the activities of free radical scavenger enzymes and balancers such as the free proline and the total soluble carbohydrates, with a decrease in malondialdehyde (MDA) levels, an indicator of oxidative cell damage [5]. Moreover, plasma can also inhibit the growth of seed-borne pathogens. Numerous studies have reported that plasma inhibits fungal growth and infection in seeds [9,14]. For example, plasma treatment of seeds has been proven to inhibit the growth of Gibberella fujikuroi, the causative agent of rice bakanae disease [15].
Cold plasma technologies have been successfully applied to various crops beyond rice. For instance, treatment of wheat (Triticum aestivum) enhanced germination and vigor through changes in seed surface chemistry and water contact angle [16]. Similarly, atmospheric microplasma improved surface wettability and water absorption of wheat grains while preserving seed integrity [17]. These findings indicate that plasma treatment enhances germination through physicochemical surface modification across different crop species, not only rice.
However, the effects of plasma exposure are not always beneficial. Seed priming with cold plasma can alter plant responses under stress conditions. For example, Li et al. (2025) demonstrated that cold plasma pretreatment of rapeseed (Brassica napus L.) mitigated drought stress by improving antioxidant enzyme activity, but its efficacy was highly dependent on exposure parameters [18]. Meanwhile, Dilip et al. (2025) reported that atmospheric cold plasma modified plant traits in rice and negatively affected growth and development of the fall armyworm, showing that plasma-induced physiological changes can also influence pest–plant interactions [19]. These examples highlight that the plasma dose and treatment conditions must be carefully optimized to prevent undesirable biological effects.
Another promising approach that can be used to improve seed quality is the use of nanoparticles through the application of nanotechnology, which involves producing or manipulating matter with a size ranging from 1 to 100 nm [20]. Plants can absorb nanoparticles through natural openings such as stomata, bark, lenticels, cracks, and wounds. The absorption, transport, and accumulation of nanoparticles depend on the size of the particle, with nanoparticles smaller than the cell pores able to easily enter the cells [21]. Copper oxide nanoparticles (CuO NPs) can significantly inhibit the growth of plant pathogens. There are several reports that the use of CuO NPs can inhibit the growth of several plant pathogenic fungi in culture as well as increase the seed quality and antioxidant enzyme activity [22,23,24,25,26]. Nevertheless, CuO NPs, when used in appropriate amounts, can improve seed quality and the seedling growth rate. However, excessive use can cause toxicity and lead to reduced seed quality and growth rate [27,28]. In general, there are two ways that CuO NPs can affect plants. The first is the release of Cu. Although copper is an essential nutrient, excessive amounts can be toxic to plants. The toxicity mechanism is believed to be due to excessive ROS generation, which causes oxidative stress and cytotoxicity in plants. The second is the Fenton reaction, in which Cu ions convert hydrogen peroxide into hydroxyl radicals, damaging plant cells [29].
As mentioned above, the use of DBD plasma in combination with CuO NPs for seed conditioning is an interesting approach to improving seed quality. DBD plasma treatment can increase the G, GI, seedling growth rate (SGR) and eliminate pathogens on the seed surface. Meanwhile, CuO NPs can inhibit both intrinsic and extrinsic pathogens in seeds and stimulate the G and vigor. Moreover, plasma corrosion on the seed surface may enhance the entry of CuO NPs into the seed.
Given the reported benefits and potential limitations of cold plasma, combining dielectric barrier discharge (DBD) plasma with copper oxide nanoparticles (CuO NPs) could provide synergistic effects on rice seed conditioning. DBD plasma may enhance seed surface permeability and pathogen suppression, while CuO NPs contribute antimicrobial activity and physiological stimulation. Such combined treatment aims to enhance germination, vigor, and fungal inhibition without adversely affecting the seed quality.
The DBD plasma machines typically used for testing involve stationary seeds exposed to plasma [4,5,9,10,11,13,15,30,31,32]. This makes scaling up for industrial applications difficult. Therefore, in this experiment, the DBD plasma machine is specifically designed to overcome scalability challenges. Instead of stationary exposure, the machine moves seeds through the plasma, simulating a continuous-flow treatment system. High-voltage discharge is applied as the seeds pass through, ensuring treatment occurs within a fraction of a second. This design facilitates seamless scalability for industrial applications.
Furthermore, studies on the application of CuO NPs to rice seeds, including their use in combination with DBD plasma, are still limited. Thus, this experiment aims to investigate the effects of using DBD plasma combined with CuO NPs on rice seed storage quality and inhibit seed pathogens.

2. Materials and Methods

2.1. Rice Seed Sample

Rice seeds of the Sanpatong 1 variety, harvested in 2023 from the Chiang Mai Rice Seed Center in Chiang Mai, Thailand, had a moisture content of 11.5%.

2.2. Experimental Design

The experiment was designed as a split-split-plot within a randomized complete block design with three replications. The main plot factor was storage time at four levels (0, 2, 4, 6 months). The subplot factor was the seed conveying rate through the plasma, with three levels (0.4, 0.6, and 0.8 s/cm). The plasma exposure time represents the seed conveying rate of the ground electrode plate carrying the seeds through the plasma region (1 cm width). These values indicate the exposure time per centimeter (in seconds), which is calculated as follows:
Seed   conveying   rate   ( s / cm ) = ( D u r a t i o n   o f   s e e d   d i s p l a c e m e n t   ( s ) D i s t a n c e   t r a v e l e d   b y   t h e   g r o u n d   e l e c t r o d e   p l a t e   ( cm ) )
The sub sub-plot factor was the concentration of the CuO NPs solution at five levels (0, 0.02, 0.04, 0.06, and 0.08 M at a rate of 30 µL per rice seed 3 g). Untreated seeds were used as the control treatment.

2.3. Dielectric Barrier Discharge

The power supply to the electrode terminals comes from a high-voltage radio wave generator, which can be adjusted from an input of 0–220 V to supply voltage to the high-voltage transformer ranging from 0 to 2500 V and to the half-wave rectifier circuit to transmit power to the triode, which acts as a radio frequency power amplifier at 13.3 MHz. The electrode plates are made of stainless steel, with the positive electrode measuring 20 cm × 2 cm and the negative electrode measuring 40 cm × 25 cm. A 2 mm thick quartz glass insulator covers the positive electrode plates, and an argon gas outlet was positioned next to the plates to supply argon gas. The negative electrode serves as a substrate for seed placement. It was attached to a gear and motor to transport seeds through the plasma. Plasma discharge was initiated by injecting argon gas at a flow rate of 6 L/min and applying 1500 V to the system. The distance between the electrode plates was maintained at 5 mm for seed treatment (Figure 1).
The electrical power delivered to the discharge, derived from the applied 1500 V input, was 385 W. The active plasma region corresponded to the surface area of the positive electrode (40 cm2). Accordingly, the energy flux density (surface power density) was determined using
E s = P A  
where P   is the applied power (W) and A is the effective plasma-exposed area (cm2). Substituting the measured values gives
E s = 385 40 = 9.63   W / c m 2  
This value represents the mean electrical energy supplied per unit area of the plasma region and was used as a characteristic parameter for describing the discharge intensity and comparing plasma treatment conditions in subsequent analyses.

2.4. CuO NPs Preparation

A CuO nanoparticle (NP) solution with a concentration of 0.2 M was provided by the Department of Industrial Chemistry, Faculty of Science, Chiang Mai University. Initially, 16 g of CuO was obtained from a hydrothermal reaction at 120 °C for 24 h. The reaction was carried out using 49 g of copper (II) nitrate trihydrate (Cu(NO3)2·3H2O) dissolved in 80 mL of 5% w/w ammonium hydroxide solution in a 100 mL autoclave. The as-synthesized CuO displays a uniform rectangular prism morphology, with particle sizes distributed between 50 and 200 nm (see Figures S1 and S2 in Supplementary Materials). The precipitated CuO was then mixed with deionized (DI) water to bring the final volume to 1 L. A stock solution of CuO NPs at a concentration of 0.2 M was thoroughly mixed and stored in a dark box prior to use.
This stock solution was subsequently diluted with distilled water and a boiled tapioca starch solution to obtain CuO NP solutions with final concentrations of 0.02, 0.04, 0.06, and 0.08 M in 0.05% (w/v) boiled tapioca starch solution.

2.5. Seed Determination

The seed samples after treatment were determined as follows:

2.5.1. Optical Emission Spectrometer (OES) Analysis

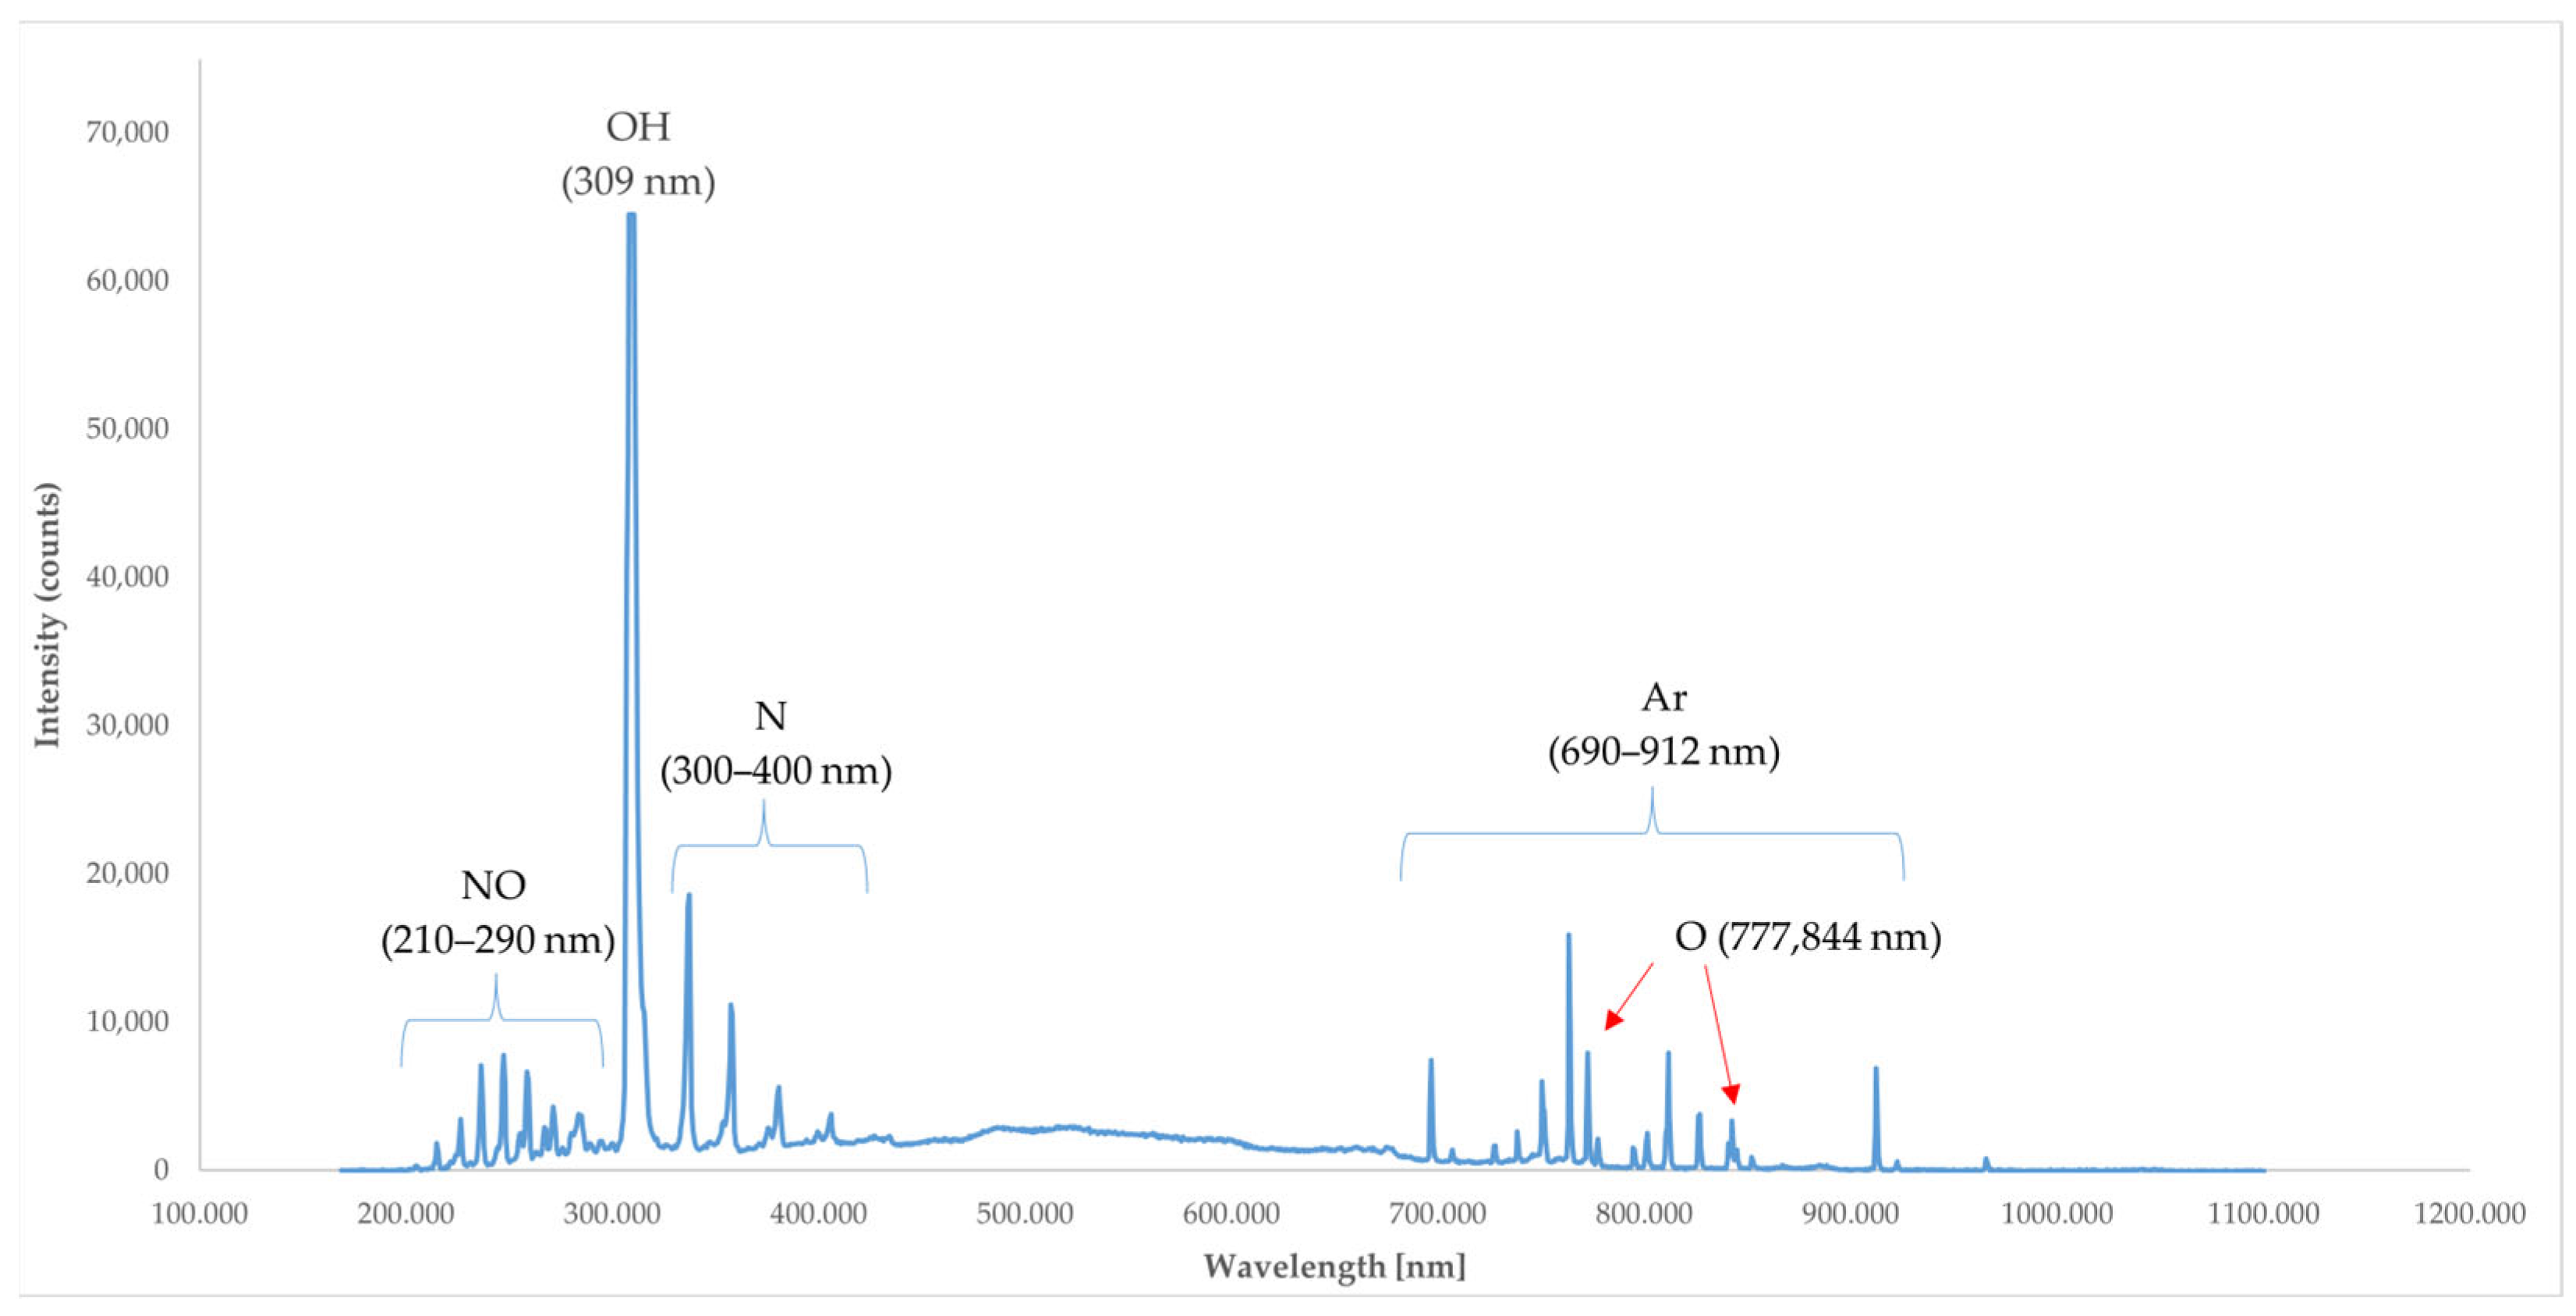
The type of radical species produced by the DBD plasma was measured using OES (Avaspec-ULS3648 Starline Spectrometer, Avantes, Apeldoorn, The Netherlands). The intensity was measured. Free radicals generated by plasma discharge emit light at specific wavelengths corresponding to their composition. The intensity of the emitted light at each wavelength was analyzed to identify the types of free radicals produced (Figure 2).

2.5.2. Determination of Electron Temperature by the Boltzmann Plot Method

The electron temperature (Te) of the discharge was estimated from optical emission spectra using the Boltzmann plot method. Emission intensities of several atomic lines in the 420–840 nm range were extracted from the averaged spectra obtained by the OES system described in Section 2.5.1. For each spectral line, the wavelength (λ), statistical weight (g), transition probability (A), and upper-level excitation energy (E) were obtained from the NIST Atomic Spectra Database. The logarithmic intensity term ln(Iλ/gA) was plotted as a function of E for all selected transitions that were free from self-absorption and spectral overlap.
A linear regression was performed according to the Boltzmann relation:
ln ( I λ g A =   C E k B T e )
where k B is the Boltzmann constant. The slope of the fitted line corresponds to −1/( k B T e ), from which the electron temperature was calculated. Only lines belonging to the same atomic species were used to ensure consistency of the excitation system. All spectral data were corrected for the instrumental response prior to analysis.
This method is widely employed for the spectroscopic evaluation of plasma parameters under the assumption of local thermodynamic equilibrium and optically thin emission [33].

2.5.3. Determination of Hydrogen Peroxide Concentration

Hydrogen peroxide (H2O2) in plasma-activated water (PAW) was quantified using the acidic permanganometric titration method described previously by Wei et al. (2021) [34]. The PAW samples were generated by exposing 10 mL of distilled water to a dielectric barrier discharge (DBD) plasma for 1 min. After plasma treatment, a 10 mL aliquot of the PAW was transferred into a 150 mL Erlenmeyer flask and mixed with 10 mL of 2.5 M sulfuric acid (H2SO4) to ensure a strongly acidic environment for complete reduction of MnO4 to Mn2+.
Titration was performed at room temperature using 0.0005 M KMnO4 solution, added dropwise from a micro-burette while gently swirling the mixture until a faint pink color persisted for approximately 30 s, indicating the endpoint. Blank titrations were carried out under identical conditions using deionized water and H2SO4. The average blank volume (0.167 mL) was subtracted from the sample readings before calculation.
The H2O2 concentration ( C H 2 O 2 ) was calculated according to Equation (4):
C H 2 O 2 = 5   C K M n O 4 ( V K M n O 4 V b l a n k ) 2   V s a m p l e × 2
where C K M n O 4 is the molarity of KMnO4 (M), V K M n O 4 and V b l a n k are the titration and blank volumes (mL), and V s a m p l e is the total liquid volume (20 mL). The final factor of 2 accounts for the 1:1 dilution of plasma water with H2SO4 prior to titration.
The calculated C H 2 O 2 from Equation (4) represents the molar concentration (mol L−1). To express the result in milligrams per liter (mg L−1), the molar value was multiplied by the molecular weight of H2O2 (34.0147 g mol−1) and converted to milligrams according to Equation (5):
C H 2 O 2 ( m g L 1 ) = C H 2 O 2 m o l L 1 × 34.0147   × 1000

2.5.4. Seed Physical Properties Test

Seed Temperature
The temperature increase in the rice seeds after plasma treatment at different speeds was measured using a Thermal Imager (OWON TI332, Lilliput Optoelectronics Technology Co., Ltd., Fujian, China). Temperature was analyzed using the Infrared Thermal Analysis Software program version 1.0.2. The mean temperature of rice seeds was examined by measuring rice seeds at 15 points evenly distributed across the plate.
Scanning Electron Microscopy (SEM)
Rice seed samples from different treatments were cross-sectioned with a freezing microtome (Leica CM1850, Leica Biosystems, Deer Park, IL, USA). Both SEM imaging and EDX mapping were performed on an SEM (JEOL JCM-7000, JEOL Ltd., Akishima, Tokyo, Japan) to analyze surface changes in the rice seeds after plasma treatment and to examine the copper content and distribution within the seeds after dressing with CuO NPs.
Water Contact Angle Measurement
Wettability changes were examined by measuring the water contact angle (WCA) on the seed surface. The contact angle between water droplets and the seed surface was measured to investigate the change in hydrophilicity of the rice seed surface after plasma treatment. Water was dropped onto the seed surface in a volume of 1.5 µL, and pictures were taken to calculate the contact angle using an Optical Contact Angle Meter & Interface Tensiometer (Kino SL250E, KINO Industry Co., Ltd., Somerville (Boston), MA, USA) (Figure 2).

2.6. Copper Uptake in Seedlings

The copper content in the rice seedlings was analyzed using atomic absorption spectroscopy (AAS) (contrAA 800, Analytik Jena GmbH+Co. KG, Jena, Germany). Seedlings were prepared using the BP method for 14 days, separated from the original seeds, and the stems and roots were dried at 50 °C for 7 days. The dried samples were ground into a fine powder, and 0.5 g of the ground material was digested using 10 mL of HNO3 and HClO4 at the ratio of 3:1 (v/v). The reaction was accelerated on a hot plate until the solution became clear with approximately 1 mL remaining. The sample was then diluted with 15 Ω distilled water to a volume of 50 mL. It was filtered using filter paper No.5 A calibration curve was prepared using Cu standards (0–5 mg/kg), and the resulting equation was applied to determine Cu concentrations in the samples (Figure 2).

2.7. Fungal Inhibition

The test was performed according to a modified method from ISTA [35], with adjustments to suit the experimental conditions. The experiment used the blotter method with four replications of 25 seeds each. The test was carried out in a 90 mm Petri dish with a No. 1 filter paper placed on top of three layers of germination test paper and moistened with sterile deionized water. The cultures were incubated in ambient conditions for 7 days. The cultures were examined to identify fungal species and assess the percentage of infection using a stereomicroscope and a compound microscope (Figure 2).
The treated rice seeds were stored for 6 months. The quality of the seeds was examined at 0, 2, 4, and 6 months of storage. They were stored in zip-lock plastic bags in ambient conditions, with temperature and relative humidity monitored using a mini data logger (Testo SE & Co. KGaA, Titisee-Neustadt, Baden-Württemberg, Germany). The experiments and seed quality assessments were conducted at the Seed Laboratory, Faculty of Agriculture, Chiang Mai University (Figure 2).

2.8. Seed Germination and Vigor

2.8.1. Germination (G)

Using the between-paper (BP) method and normal seedlings definition according to the International Seed Testing Association (ISTA) [36], experiments were conducted for each replicate with 100 seeds three times, incubated at 25 °C for 14 days. The number of normal seedlings and the results as the germination percentage was recorded.

2.8.2. Radicle Emergence (RE)

The number of seeds with radicle emergence was tested according to the ISTA method by counting the seeds with a radicle emergence length greater than 2 mm after 72 h of testing [36,37].

2.8.3. Germination Index (GI)

The number of normal seedlings according to the ISTA definition that grew each day for 14 days was recorded and the GI was calculated using the formula:
Germination   Index   =   Σ ( n u m b e r   o f   n o r m a l   s e e d l i n g s   g e r m i n a t e d   o n   d a y n u m b e r   o f   d a y )

2.8.4. Root and Shoot Length (RL and SL)

The BP method was used to test 60 seeds per treatment, divided into 3 replications of 20 seeds each. The seeds were placed in an incubator at 25 °C for 14 days [36], and the seedling growth rate data was recorded. The length of the roots and shoots was measured on the 7th (SL/RL 7) and 14th (SL/RL 14) day after the test.

2.8.5. Seedling Dry Weight

After the cultivation of rice seedlings using the BP method, conducted for 14 days at an incubation temperature of 25 °C [36], the seedlings were separated from the original seed parts. Roots and shoots were separated, placed into brown bags, and dried at 80 °C for 24 h. The dry weight was then measured, and the dry weight of the shoots (SDW), roots (RDW), and total dry weight (TDW) were calculated according to the formula:
Dry   weight   =   Σ ( d r y   w e i g h t   n u m b e r   o f   s e e d l i n g )

2.9. Statistical Analysis

Statistical analysis was carried out using an analysis of variance (ANOVA), and mean comparisons were performed using the least significant difference (LSD) test at a significance level of 0.05. The analysis was performed using R software version 4.1.0 (The R Foundation for Statistical Computing, Vienna, Austria) and the R/doebioresearch package.
A split-plot design in a randomized complete block design (RCBD) was applied for the analysis of water contact angle (WCA), copper uptake, and fungal inhibition data. For seed quality parameters and storage duration experiments, a split-split-plot design in RCBD was used to assess the main effects and interactions of the seed conveying rate through the plasma, CuO NP concentration, and storage time.

3. Results

3.1. Optical Emission Spectrometer (OES) Analysis

From the measurement of the plasma spectrum using an OES device, a very high hydroxyl radical (OH) activity was detected at a wavelength of 309 nm, with an intensity of 64,505 counts. In addition, various species were identified: nitrogen (N) was detected in the range of 300–400 nm, exhibiting a peak intensity at 337 nm of 18,591 counts; nitric oxide (NO) was observed in the range of 210–290 nm, with a maximum at 247 nm of 7767 counts; argon (Ar) was found in the range of 690–912 nm, peaking at 763 nm with 15,918 counts; and atomic oxygen (O) was detected at wavelengths of 777 and 844 nm, showing the highest intensity of 7950 counts at 777 nm (Figure 3) [5,13,31,38,39].

3.2. Determination of Electron Temperature by the Boltzmann Plot Method

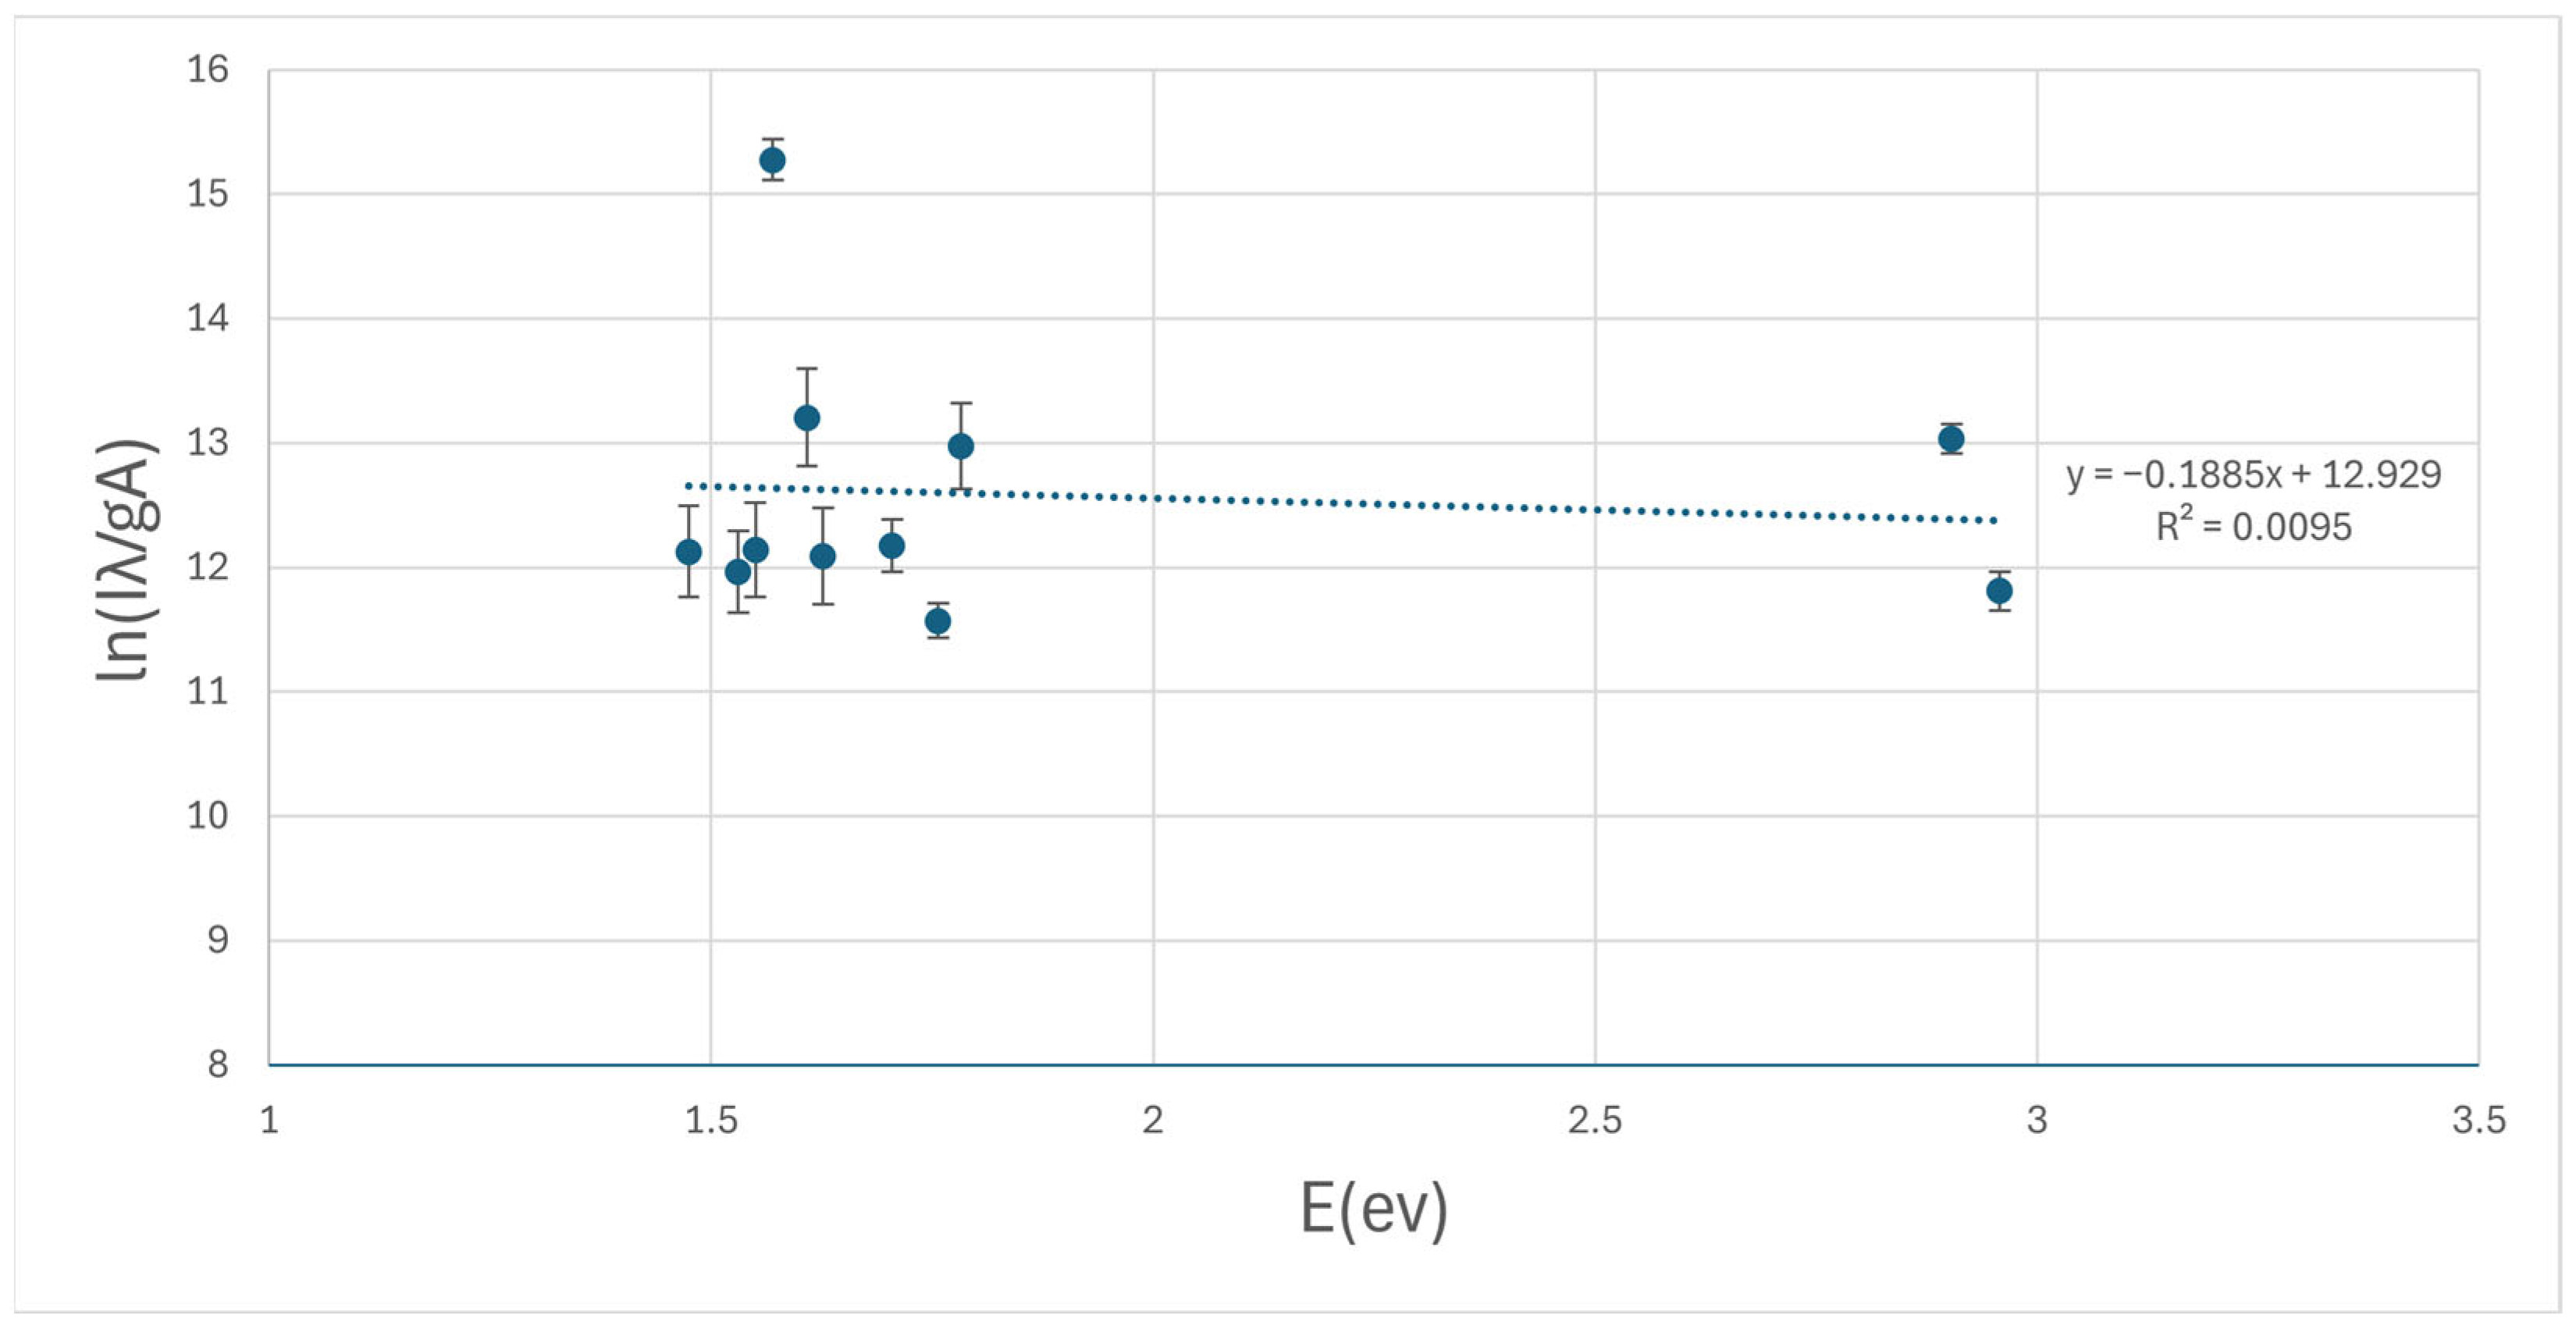
The electron temperature ( T e ) of the discharge was determined using the Boltzmann plot approach based on the optical emission spectra in the wavelength range of 420–840 nm. The emission lines used for the analysis were identified from the measured spectra, and the corresponding parameters—wavelength (λ), statistical weight (g), transition probability (A), and upper-level excitation energy (E)—were applied for each transition.
For every selected line, the logarithmic intensity term l n ( I λ / ( g A ) ) was plotted as a function of the excitation energy E (eV). The plotted points exhibited an approximately linear relationship, and the regression line obtained from these data showed a slope of −0.188. According to the Boltzmann relation
slope = 1 k B T e ,
where k B is the Boltzmann constant (8.617 × 10⁻⁵ eV K−1), the corresponding electron temperature was calculated as
T e = 1 ( 8.617 × 10 5 ) ( 0.188 ) 6.16 × 10 4   K   ( 5.30   e V ) .
In summary, the electron temperature ( T e ) determined from the Boltzmann plot was approximately 6.16 × 10⁴ K, corresponding to 5.30 eV, confirming that the generated plasma is a non-thermal discharge under atmospheric conditions (Figure 4).
The fitted line ( y = 0.1885 x + 12.929 , R2 = 0.0095) corresponds to an electron temperature of approximately 6.16 × 10⁴ K (5.30 eV), confirming the non-thermal nature of the plasma under atmospheric conditions.

3.3. Determination of Hydrogen Peroxide Concentration

The titration of plasma-treated water with 0.0005 M KMnO4 resulted in a gradual color change from purple to light pink at the endpoint. Blank titrations using deionized water and 2.5 M H2SO4 required 0.15–0.20 mL of KMnO4, giving an average blank volume of 0.167 mL. This value was subtracted from each plasma-treated sample to correct for background oxidation.
For the three replicate plasma samples, the total titration volumes were 0.50, 0.55, and 0.50 mL, respectively. After blank correction (−0.167 mL), the effective titration volumes were 0.33, 0.38, and 0.33 mL. These correspond to H2O2 concentrations of 1.36, 1.56, and 1.36 mg L−1, respectively, calculated on a plasma basis. The mean concentration of the three replicates was 1.49 ± 0.12 mg L−1 (n = 3), with a relative standard deviation (RSD) of 8.3%. (Table 1).
No turbidity or brown precipitation was observed, confirming that the acidity of 2.5 M H2SO4 was sufficient to maintain Mn2+ as the end-product and ensure precise determination of H2O2.

3.4. Seed Physical Properties Test

3.4.1. Seed Temperature

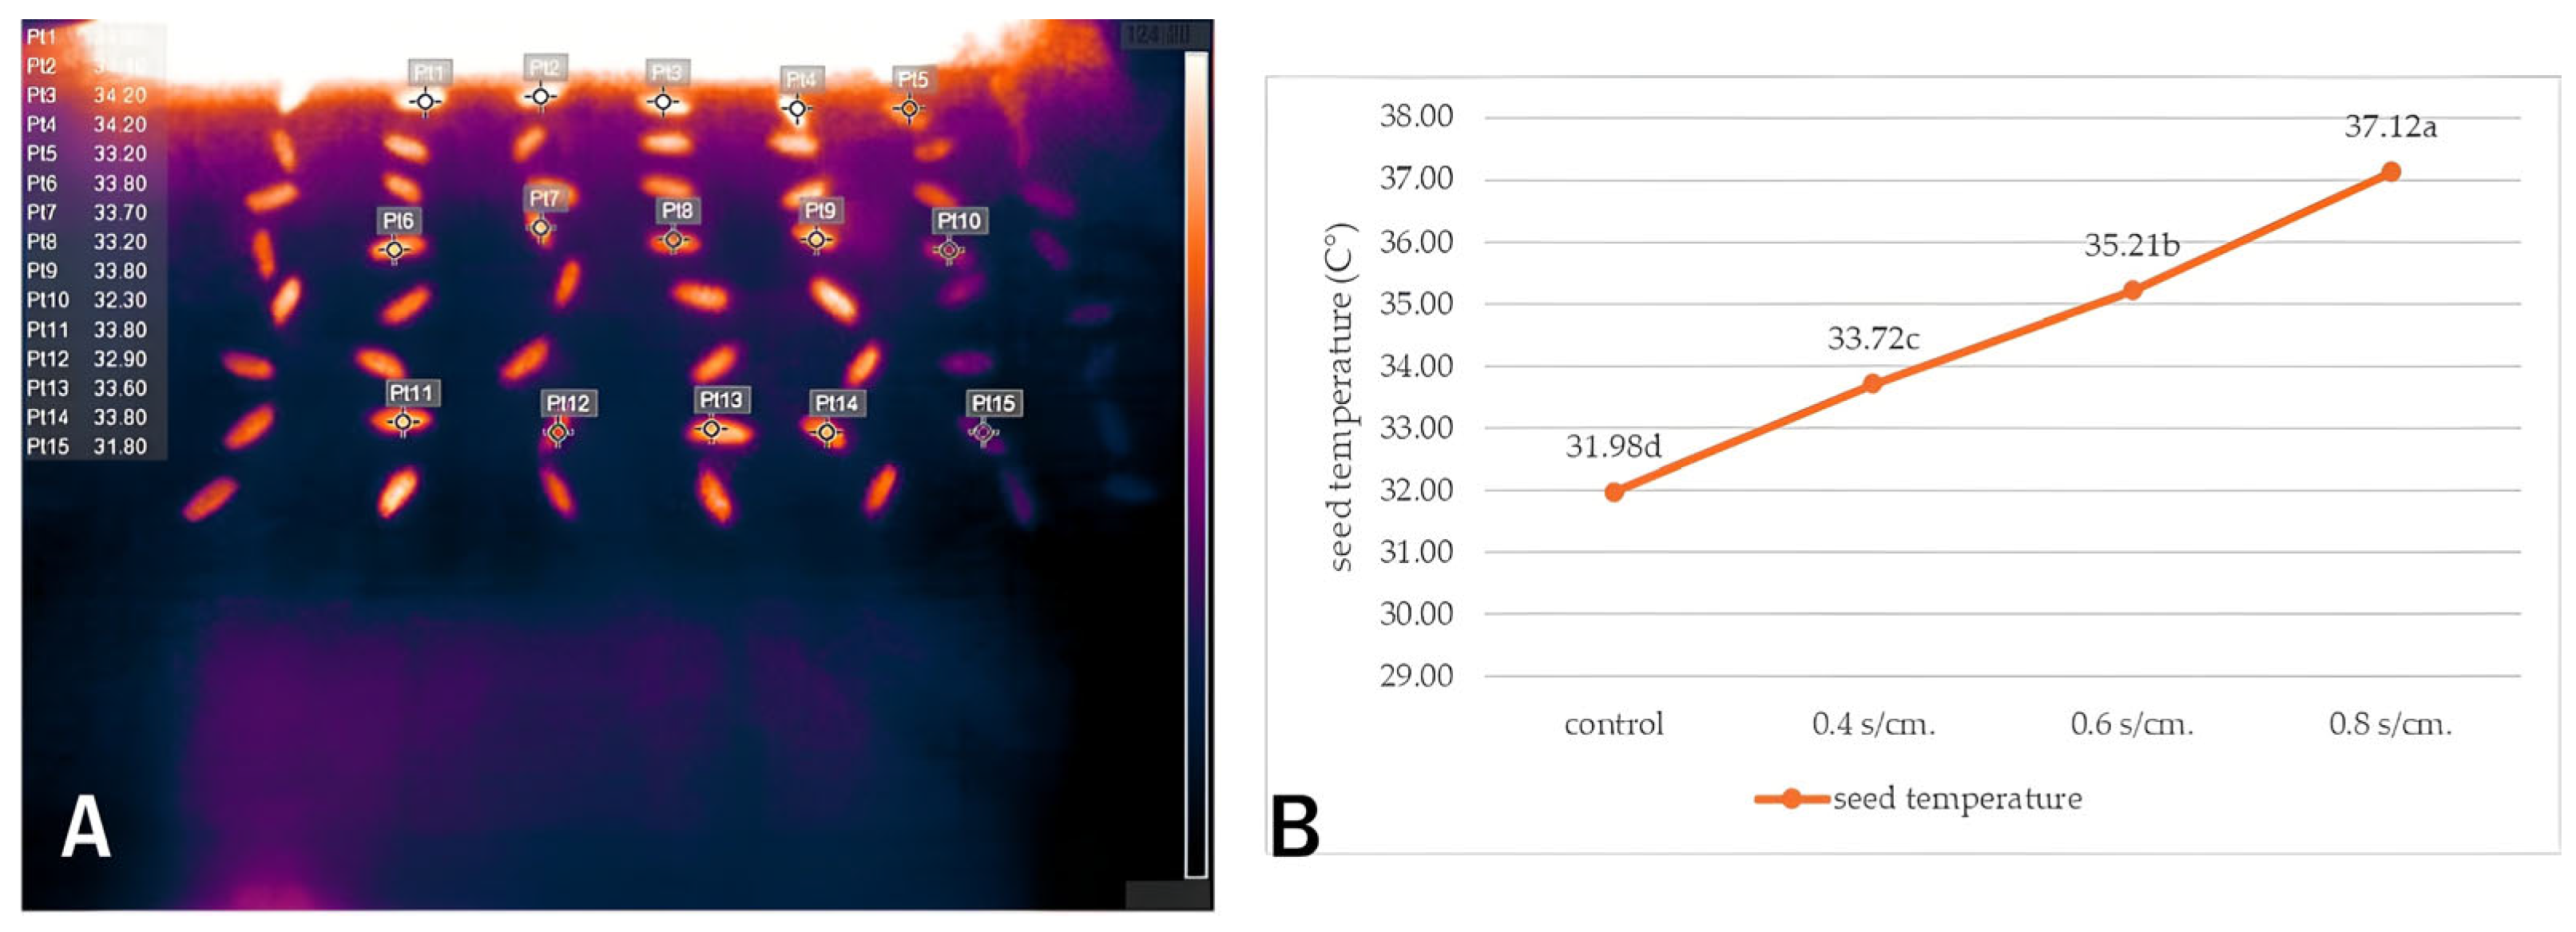
The examination of the seed temperature after plasma treatment revealed a linear increase in temperature with longer plasma exposure. As shown in Figure 5, the temperature of untreated seeds was 31.98 °C. Following treatment, seed temperatures increased to 33.72 °C, 35.21 °C, and 37.12 °C at S0.4, S0.6, and S0.8, respectively, with each increase being statistically significant.

3.4.2. Scanning Electron Microscopy

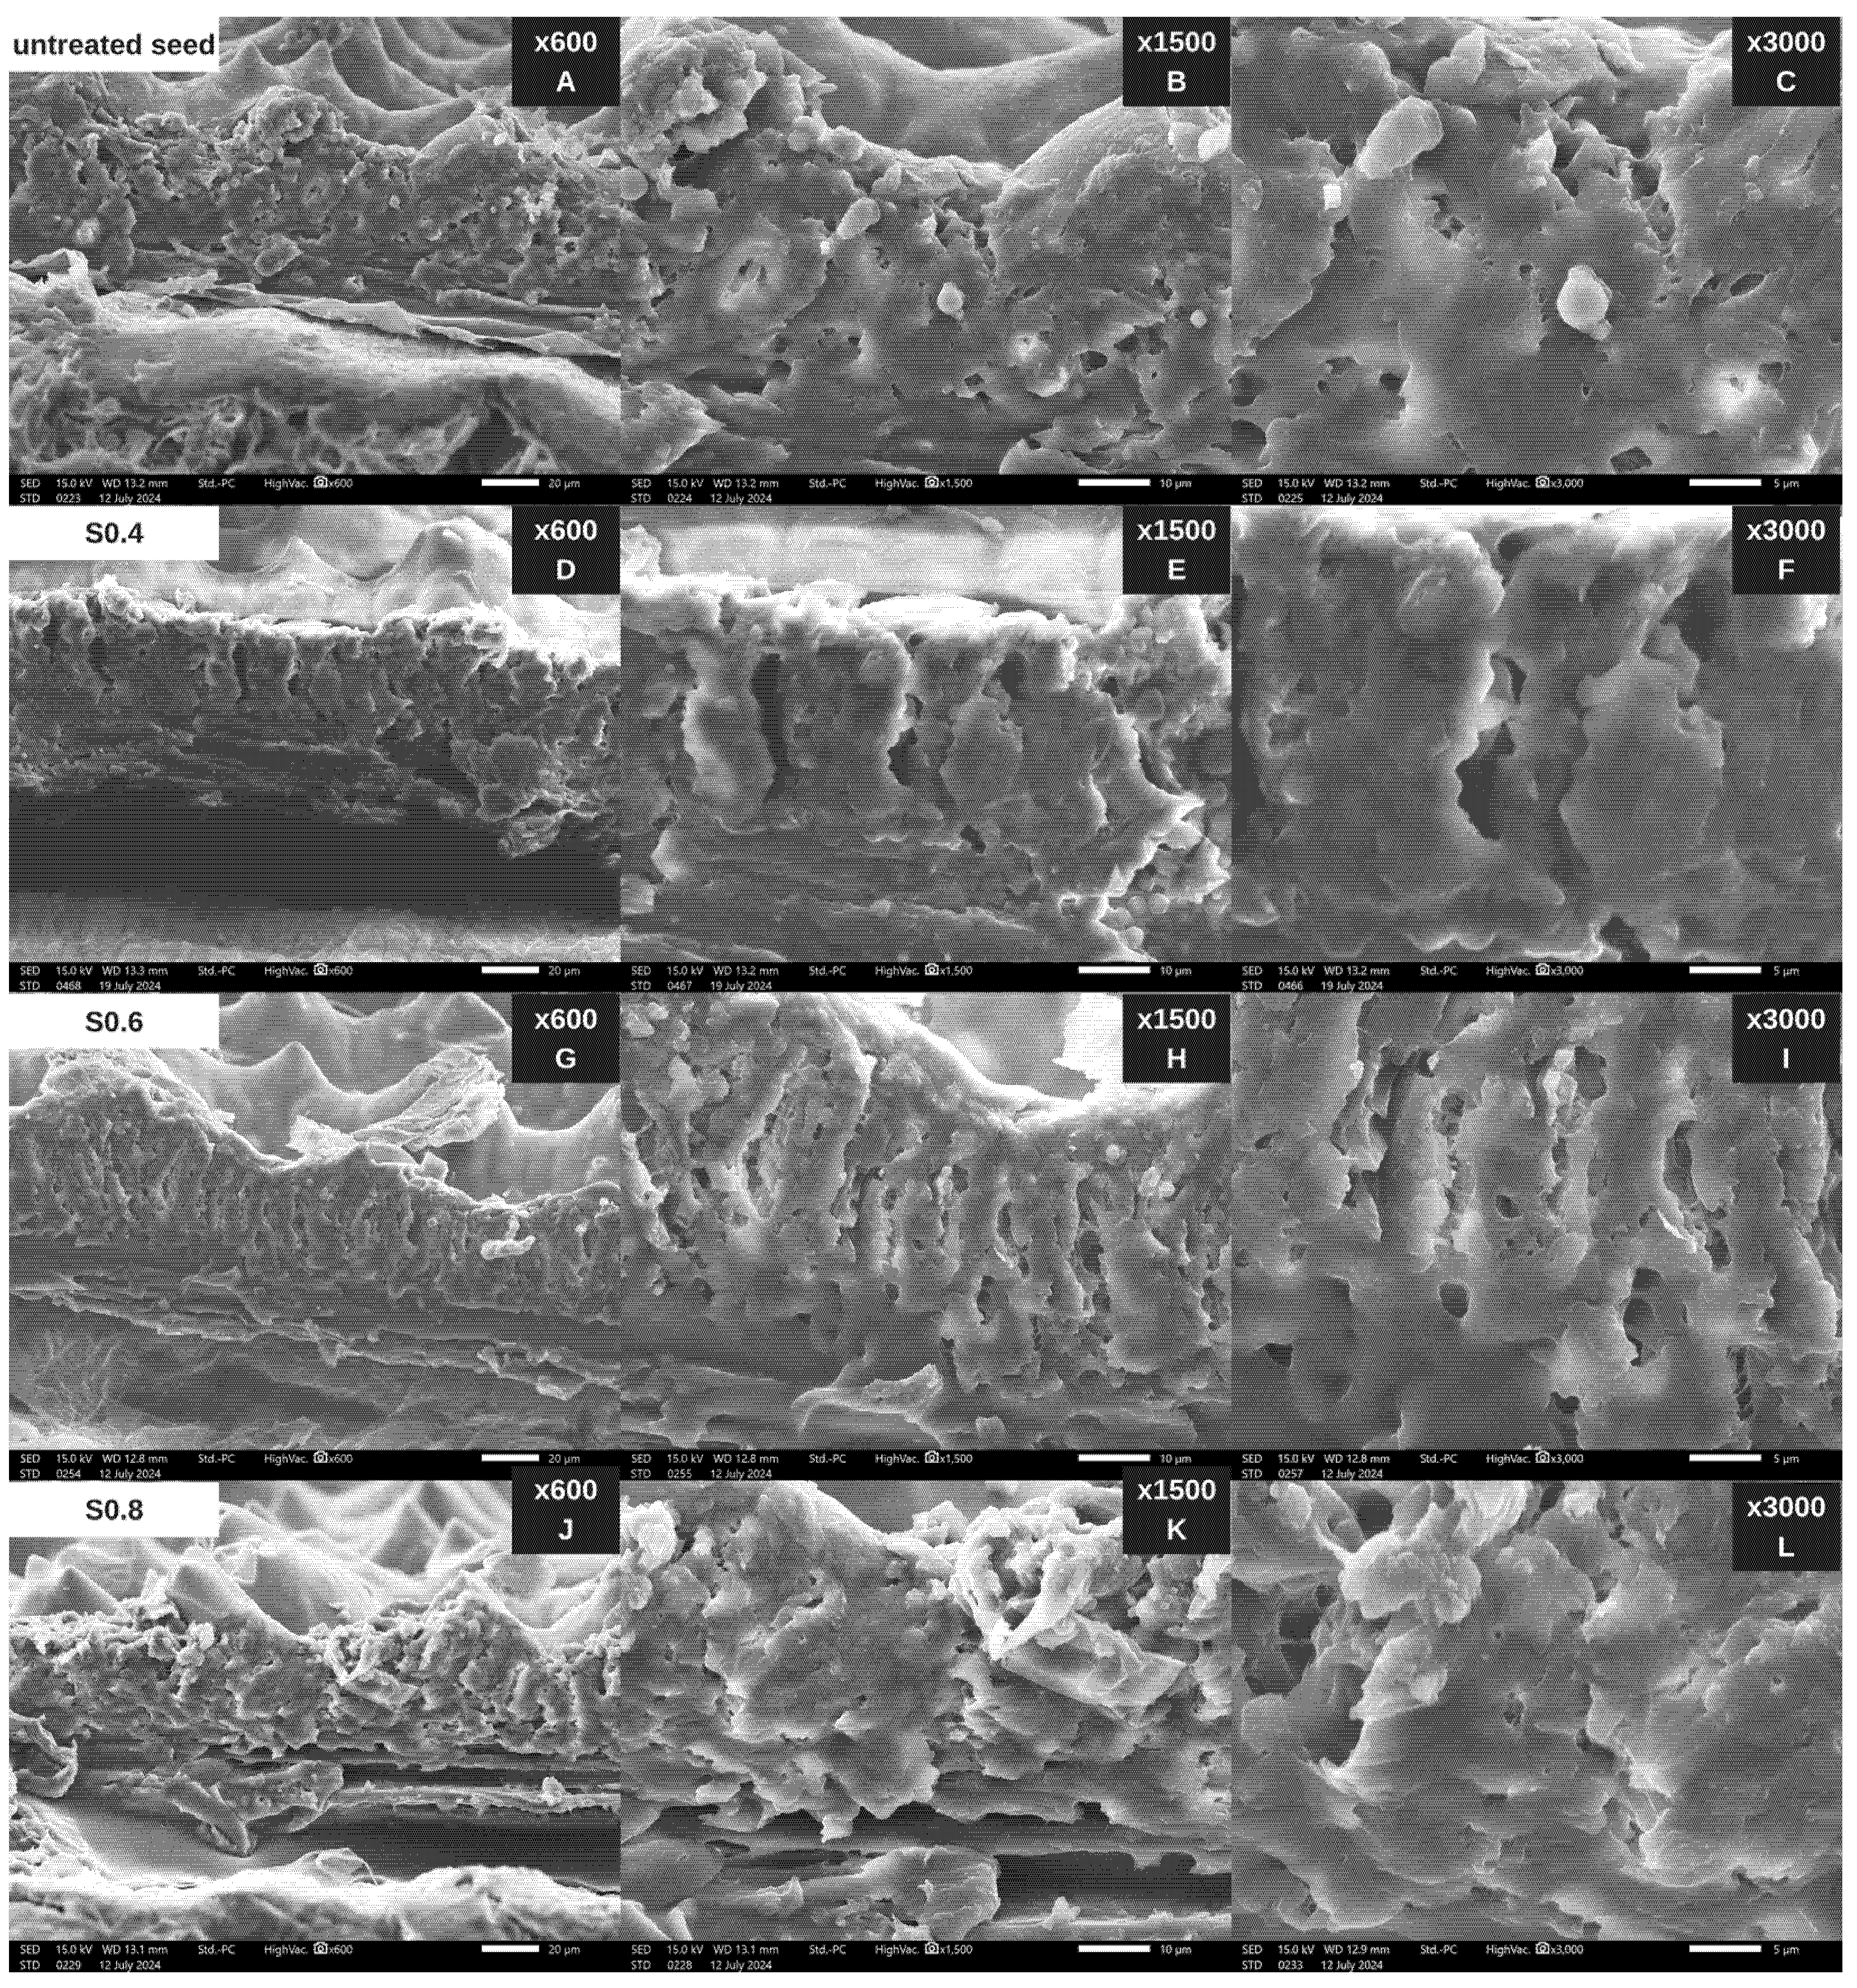
SEM images of rice seed husks at 600×, 1500×, and 3000× magnifications revealed that plasma treatment caused visible surface erosion of the husk. Untreated seeds showed a smooth and intact surface structure (Figure 6A–C). In contrast, plasma-treated seeds exhibited progressive surface damage, with clear signs of erosion beginning at S0.4, where the seed coat displayed grooves and internal voids formed by the erosion (Figure 6D–F). With further plasma exposure at S0.6, the erosion became more pronounced, with deeper grooves and larger internal voids, and the internal structure started to deteriorate, forming cavities (Figure 6G–I). At S0.8, the erosion and structural degradation were markedly intensified, resulting in the collapse and fragmentation of the seed husk (Figure 6J–L). These findings indicate that increasing plasma exposure induces surface erosion and structural alterations in the rice seed coat.
An examination of the copper distribution within cross-sectioned rice seeds using EDX mapping at 150× magnification revealed that copper was distributed throughout the seed hull and extended into the internal structures, including the bran and endosperm (Figure 7). As the concentration of CuO nanoparticles (NPs) employed for seed treatment increased, a corresponding rise in detected copper levels was observed. Specifically, Figure 7A–C show that seeds treated with CuO0.02 exhibited Cu signals as faint, diffuse light scattered across the images. An increase in the CuO concentration used in the treatments resulted in these signals becoming more pronounced (Figure 7D–L). Furthermore, analysis of the copper content expressed as a % of the mass indicated a clear increase in Cu levels with rising treatment concentrations. Notably, seeds treated with plasma at S0.6 and S0.8 displayed greater internal copper content than those treated at S0.4 (Table 2). This may be attributed to more extensive void formation resulting from plasma- induced surface erosion, which facilitated the internal penetration of CuO.
In contrast, EDX mapping could not be performed on seeds that were not coated with CuO NPs, as their copper content was reported as “NA.” This limitation led to distorted EDX signals, characterized by artificial light scattering throughout the images. Collectively, these results support the conclusion that the copper signals detected in the EDX mapping originated from the CuO NP treatments, thereby confirming that the copper observed within the seed structures was derived from the applied nanoparticles.

3.4.3. Contact Angle Measurement

Both the seed conveying rate through the plasmas and the CuO NP concentration influenced the WCA of the seeds.
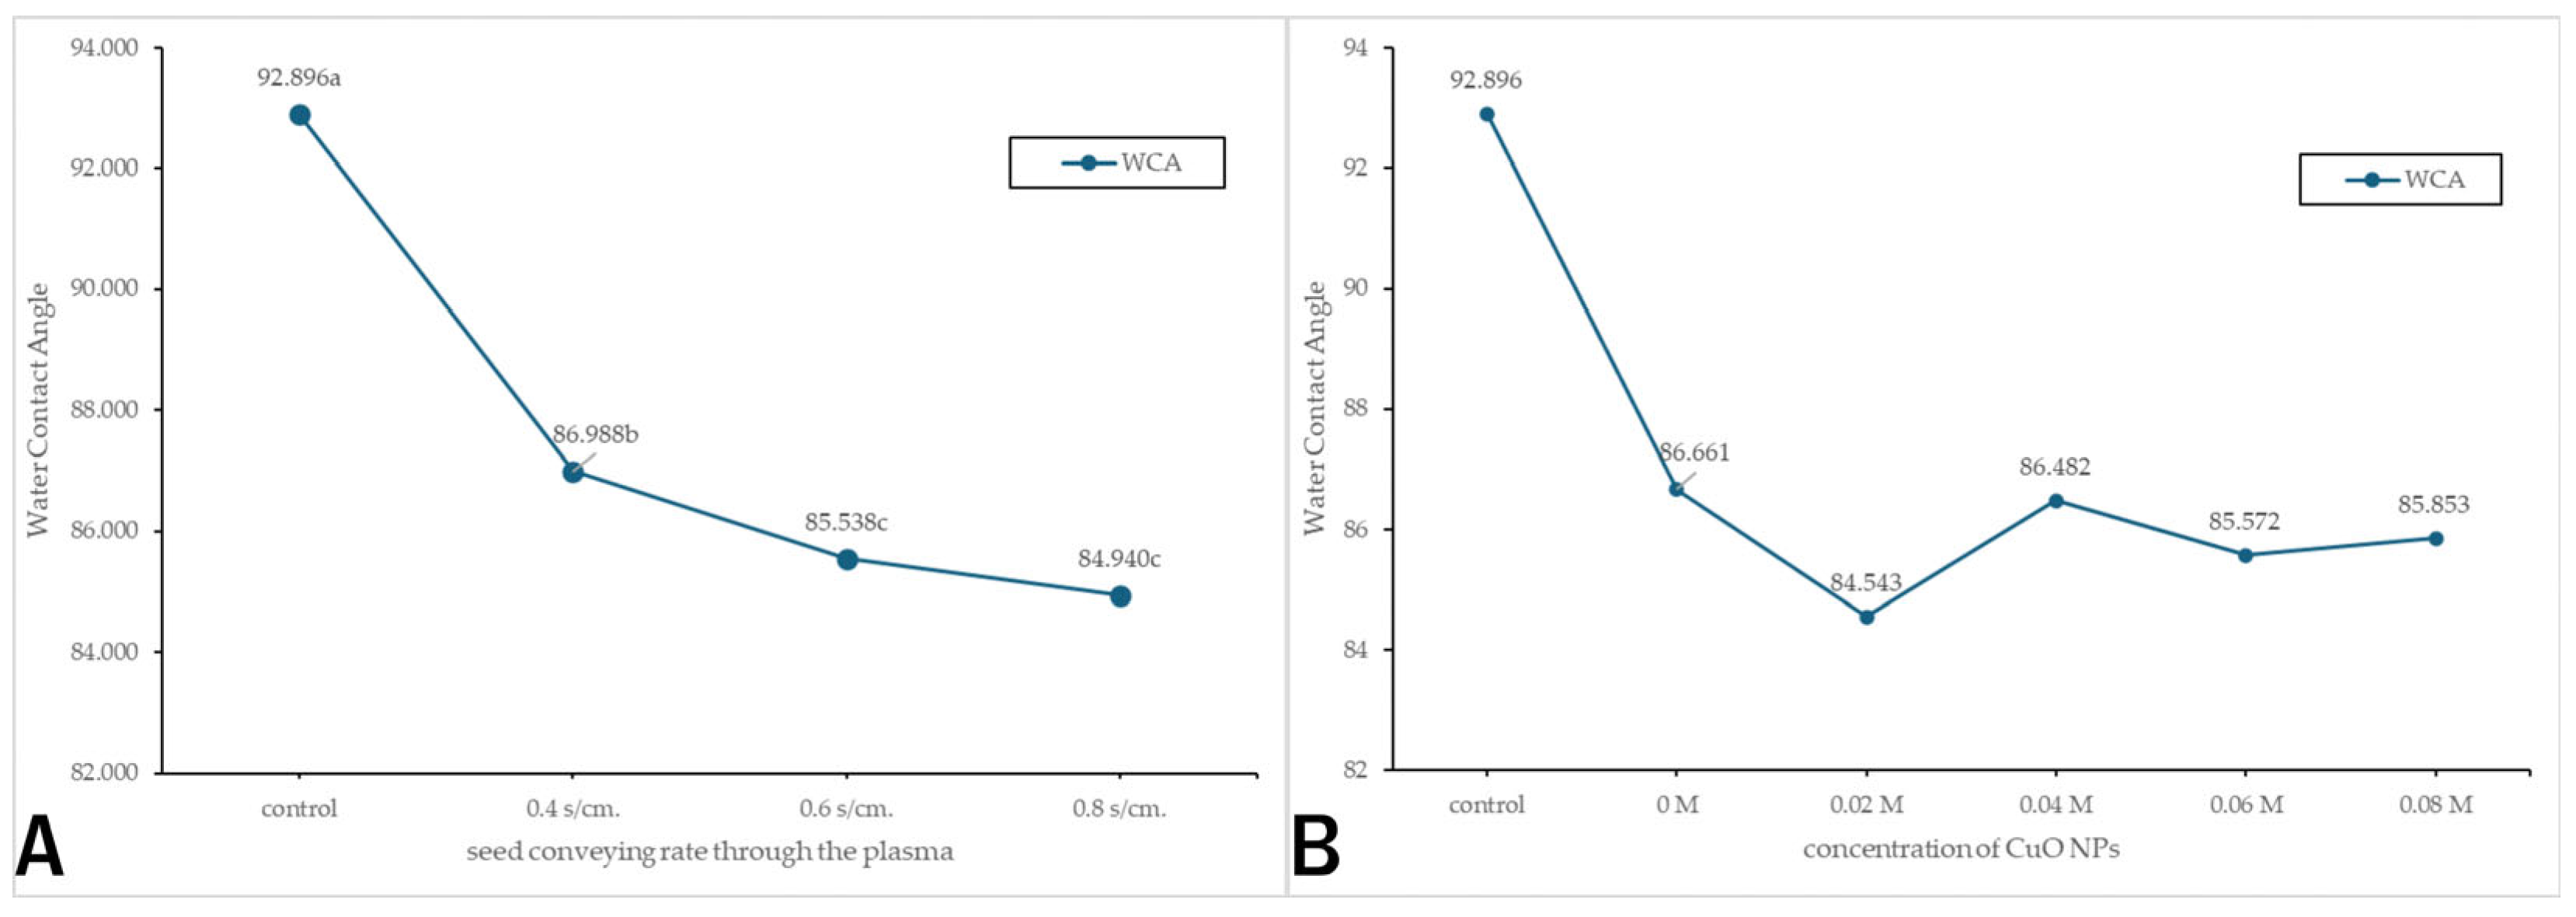
When different durations of plasma exposure per unit length were evaluated, the untreated seeds recorded a WCA of 92.896°, while treatments at S0.4, S0.6, and S0.8 yielded WCAs of 86.988°, 85.538°, and 84.940°, respectively. The differences observed among these values were statistically significant (Figure 8A). Notably, the data indicate that prolonging plasma exposure resulted in a progressive decline in WCA, suggesting an increase in the hydrophilic character of the rice seed coat surface and, consequently, an enhanced capacity for water absorption. This pattern was further corroborated by the SEM images (Figure 8), which illustrated more pronounced surface erosion on the rice seed husk with extended plasma treatment durations. Collectively, these effects improved the seeds’ ability to absorb water, thereby supporting the subsequent germination process.
Regarding CuO NPs concentration, coating the seeds with CuO0.02 initially decreased the WCA. However, as the concentration increased, the WCA gradually rose, eventually reaching levels comparable to those of seeds treated with plasma only (Figure 8B).

3.5. Copper Uptake in Seedlings

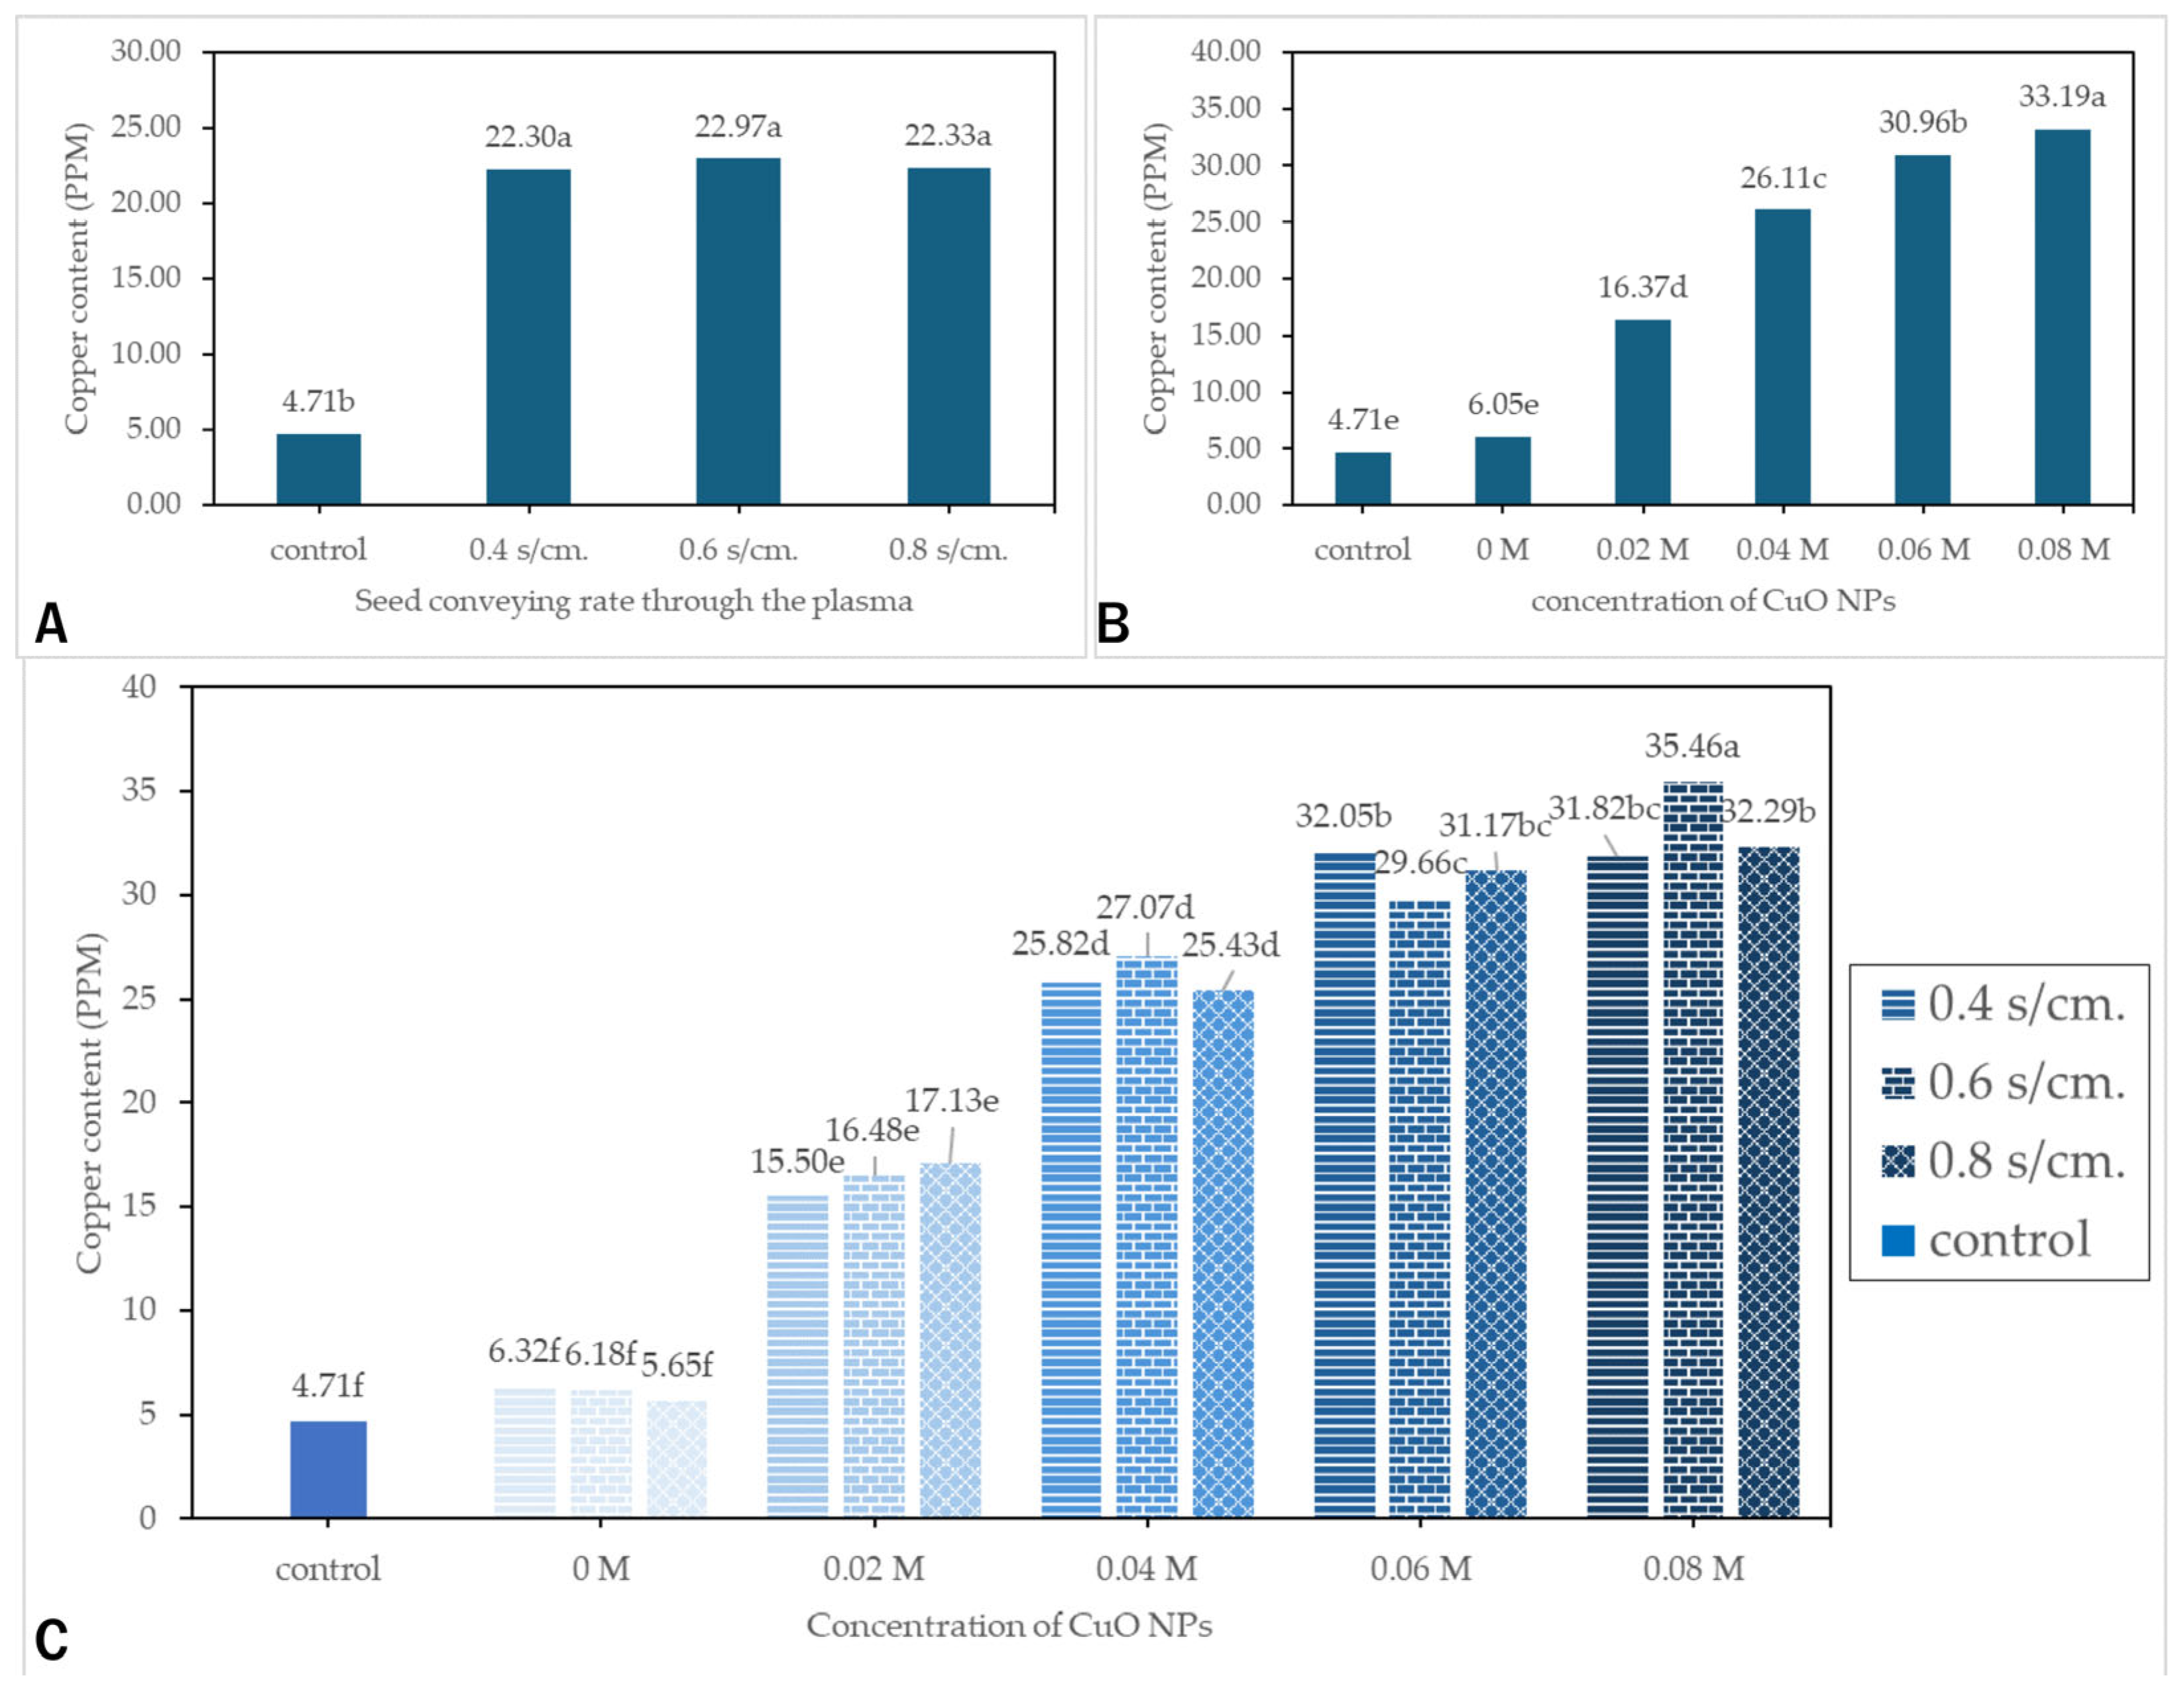
AAS analysis showed a significant increase in the copper content in seedlings from treated seeds compared to untreated ones. Among different seed conveying rates through the plasmas, results indicated that the treated seeds had a higher copper content in the seedlings than the untreated seeds. However, there was no difference between the copper content in the seedlings of the three seed conveying rates through the plasmas (Figure 9A). When comparing different CuO NP concentrations (Figure 9B), the copper content in the seedlings of plasma-treated seeds alone (0 M) did not significantly differ from that of untreated seeds. In addition, the copper content in the seedlings of CuO NP-treated seeds increased with an increasing CuO NP concentration, with statistically significant differences. Moreover, the interaction between the seed conveying rate through the plasma and CuO NP concentration followed a similar trend (Figure 9C). The copper content in seedlings of seeds treated with CuO NPs showed a progressive increase with higher CuO NP concentrations. These results indicate an enhanced copper absorption by rice seedlings, as evidenced by the elevated copper content in the seedlings.

3.6. Fungal Inhibition

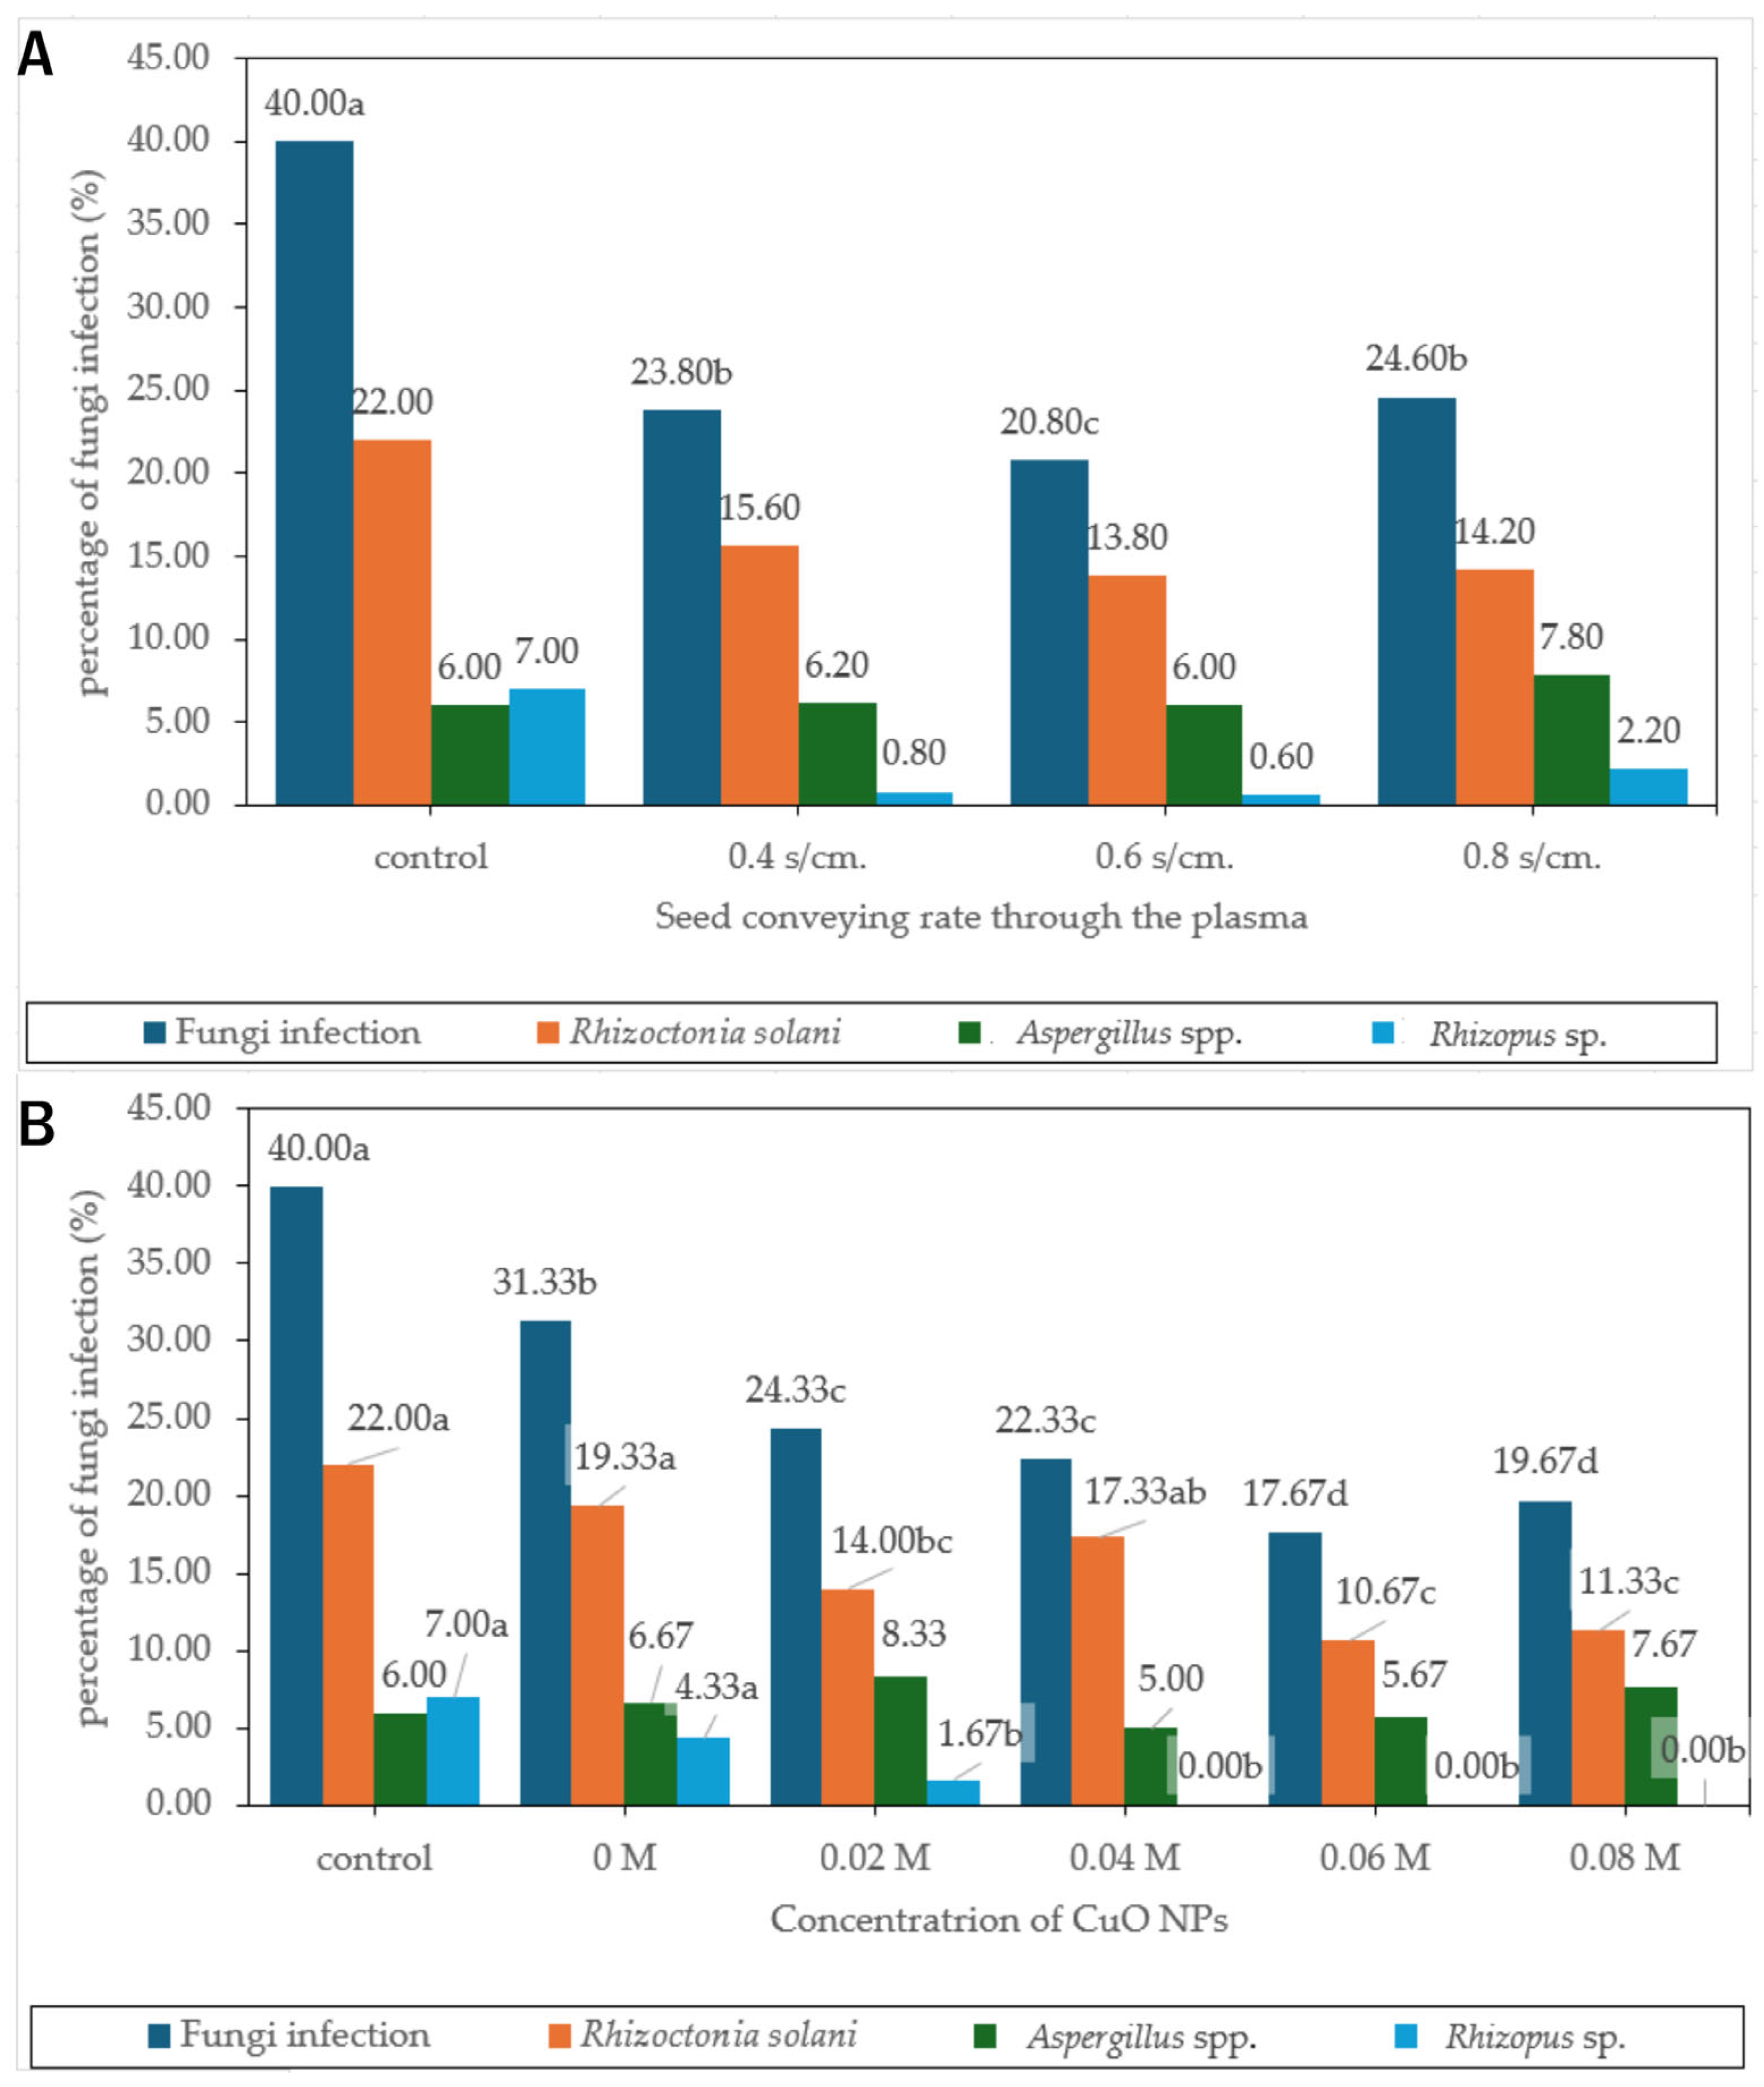
Figure 10A shows that total fungal infection was significantly reduced in all seed conveying rates through the plasmas compared to untreated seeds. Seeds treated with S0.6 had the lowest infection rate (Figure 10A). It is possible that when the seeds were treated with plasma for a longer period (S0.8), the rice seed coat was excessively eroded, making the seeds more susceptible to fungal growth and damage.
In the CuO NP concentration group, the percentage of total fungal infection was significantly reduced (Figure 10). As shown in Figure 10B, plasma treatment alone significantly reduced the percentage of fungal infection, and this effect was further enhanced when the seeds were coated with CuO NPs. The infection percentage declined as the concentration of CuO NPs increased. Additionally, both R. solani and Rhizopus sp. exhibited a decline in infection rates with increasing CuO NP concentrations. Notably, Rhizopus sp. infection decreased to 0% at concentrations of 0.04 M and above (Figure 10B). However, Aspergillus spp. did not respond to the treatment, as the percentage of infection was not significantly different from that of the control (Figure 10B).

3.7. Seed Germination and Vigor

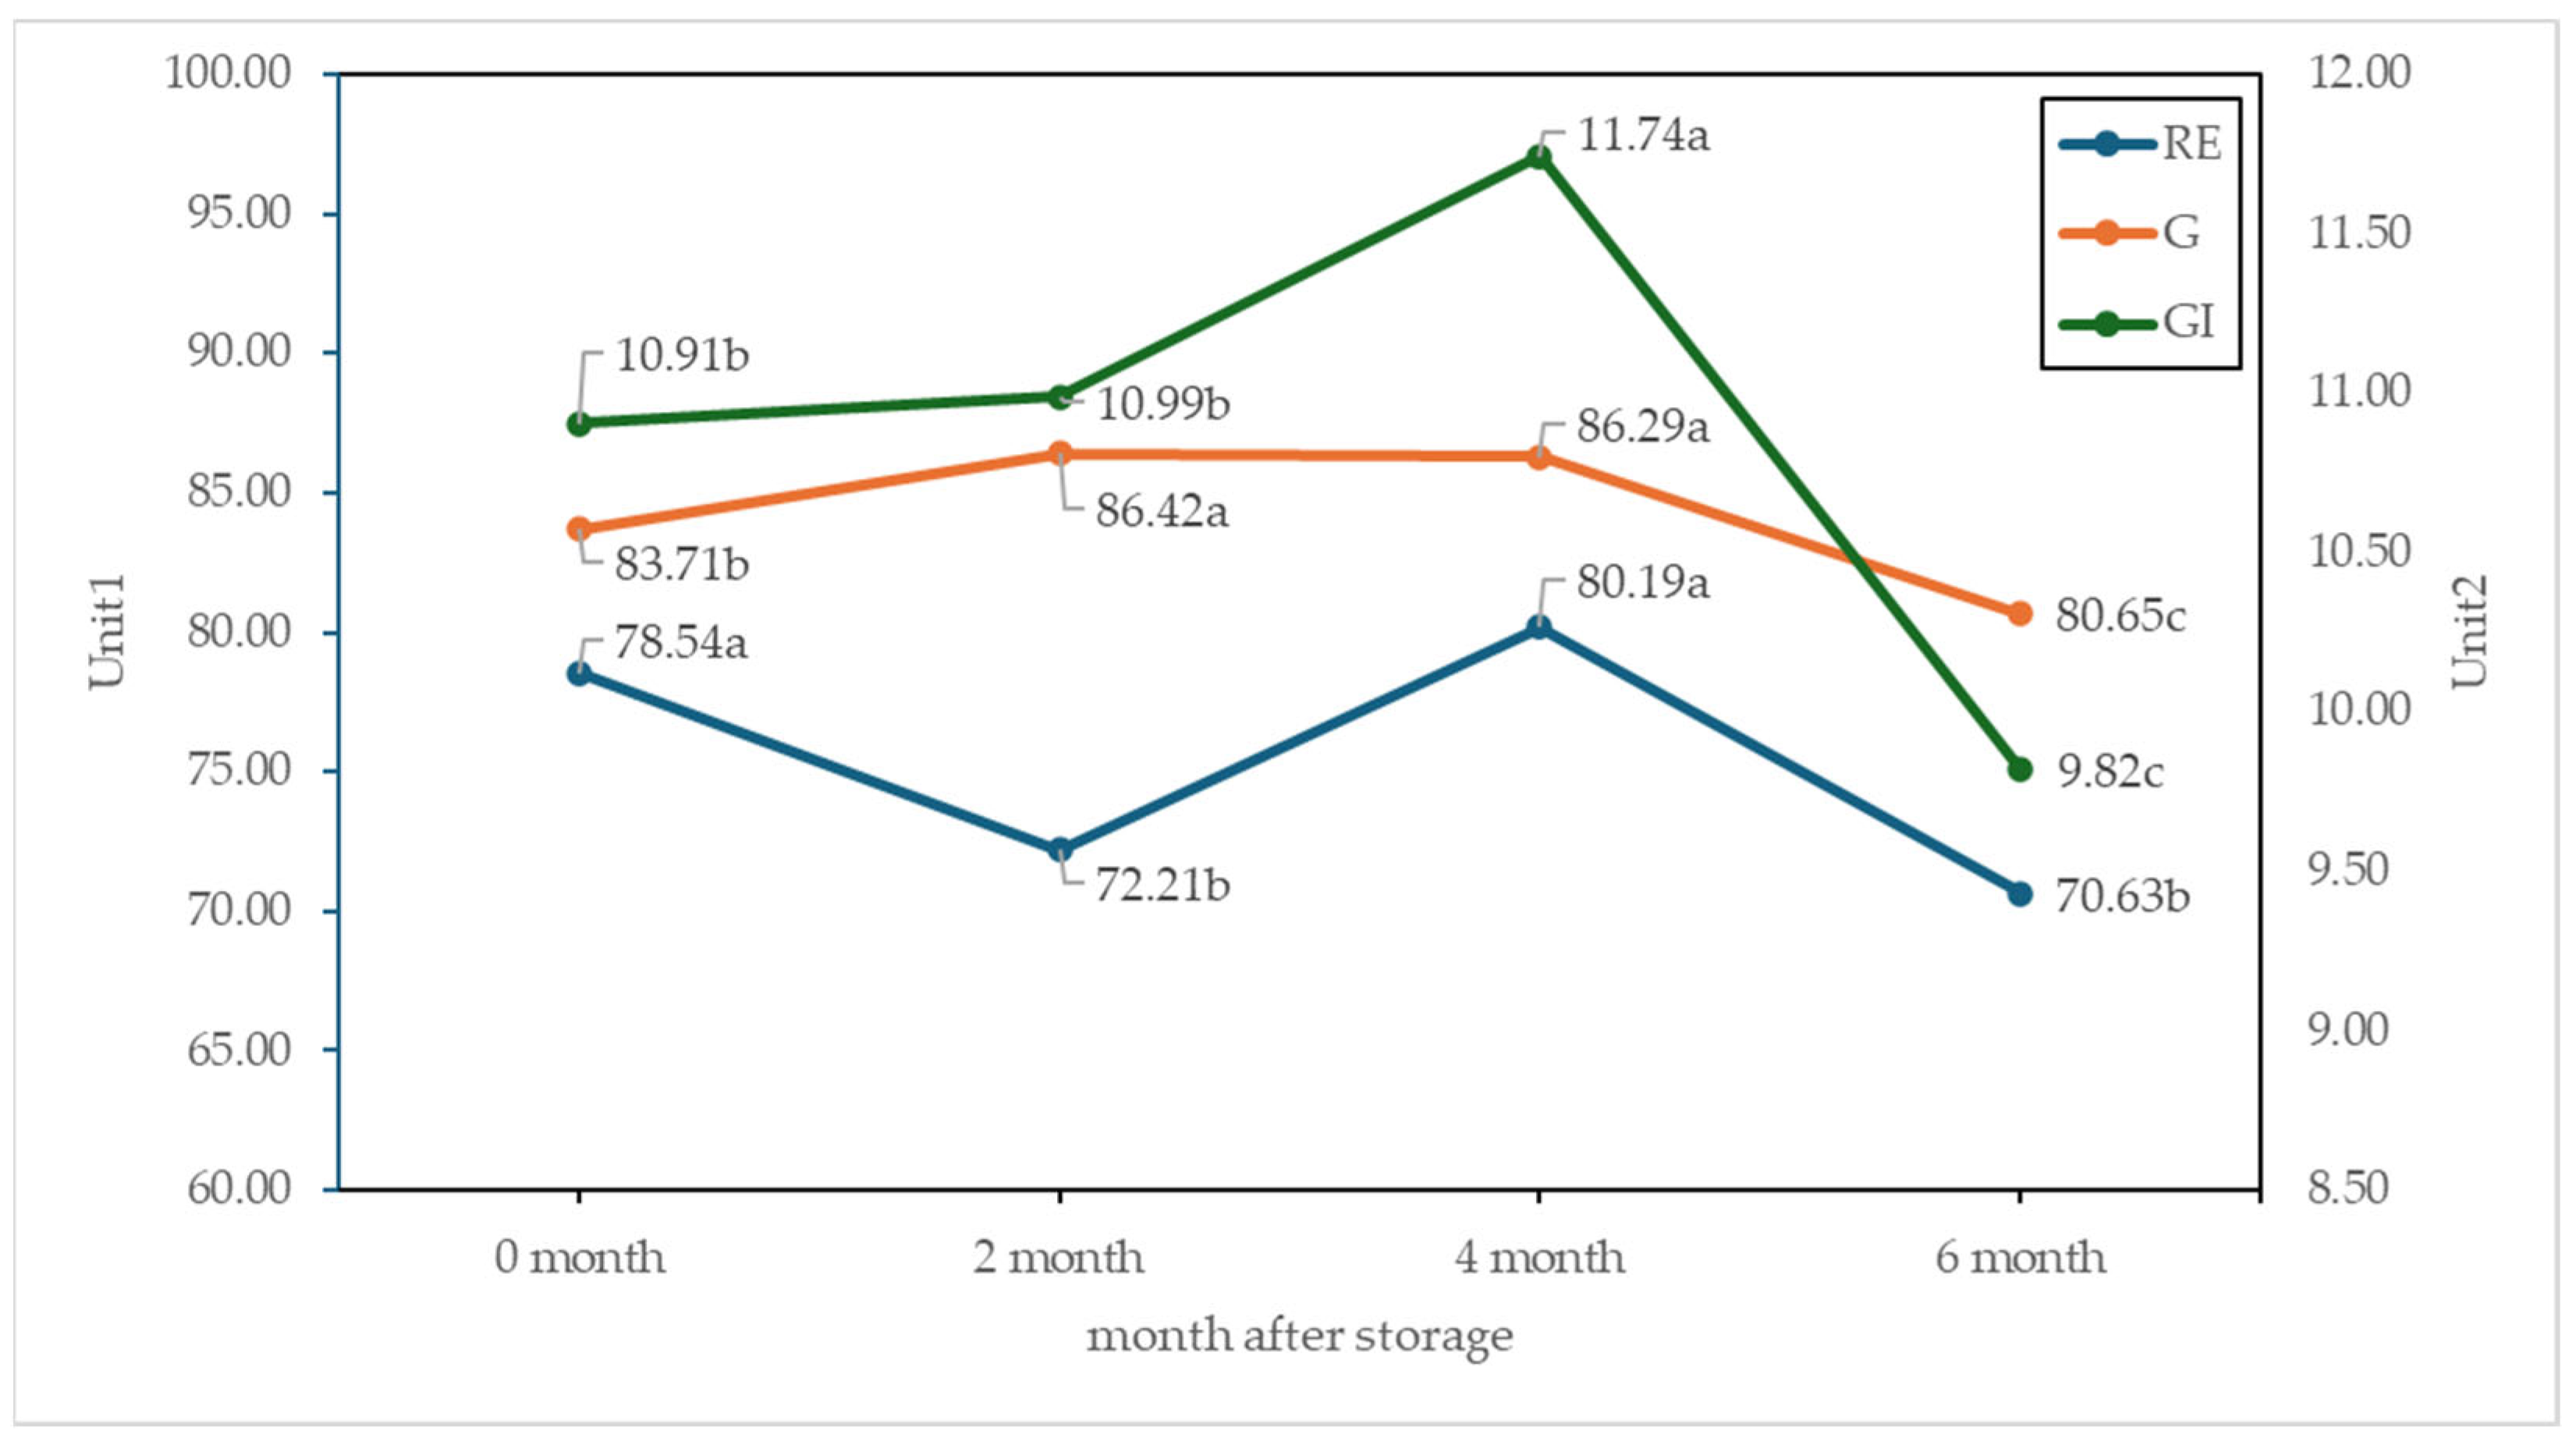
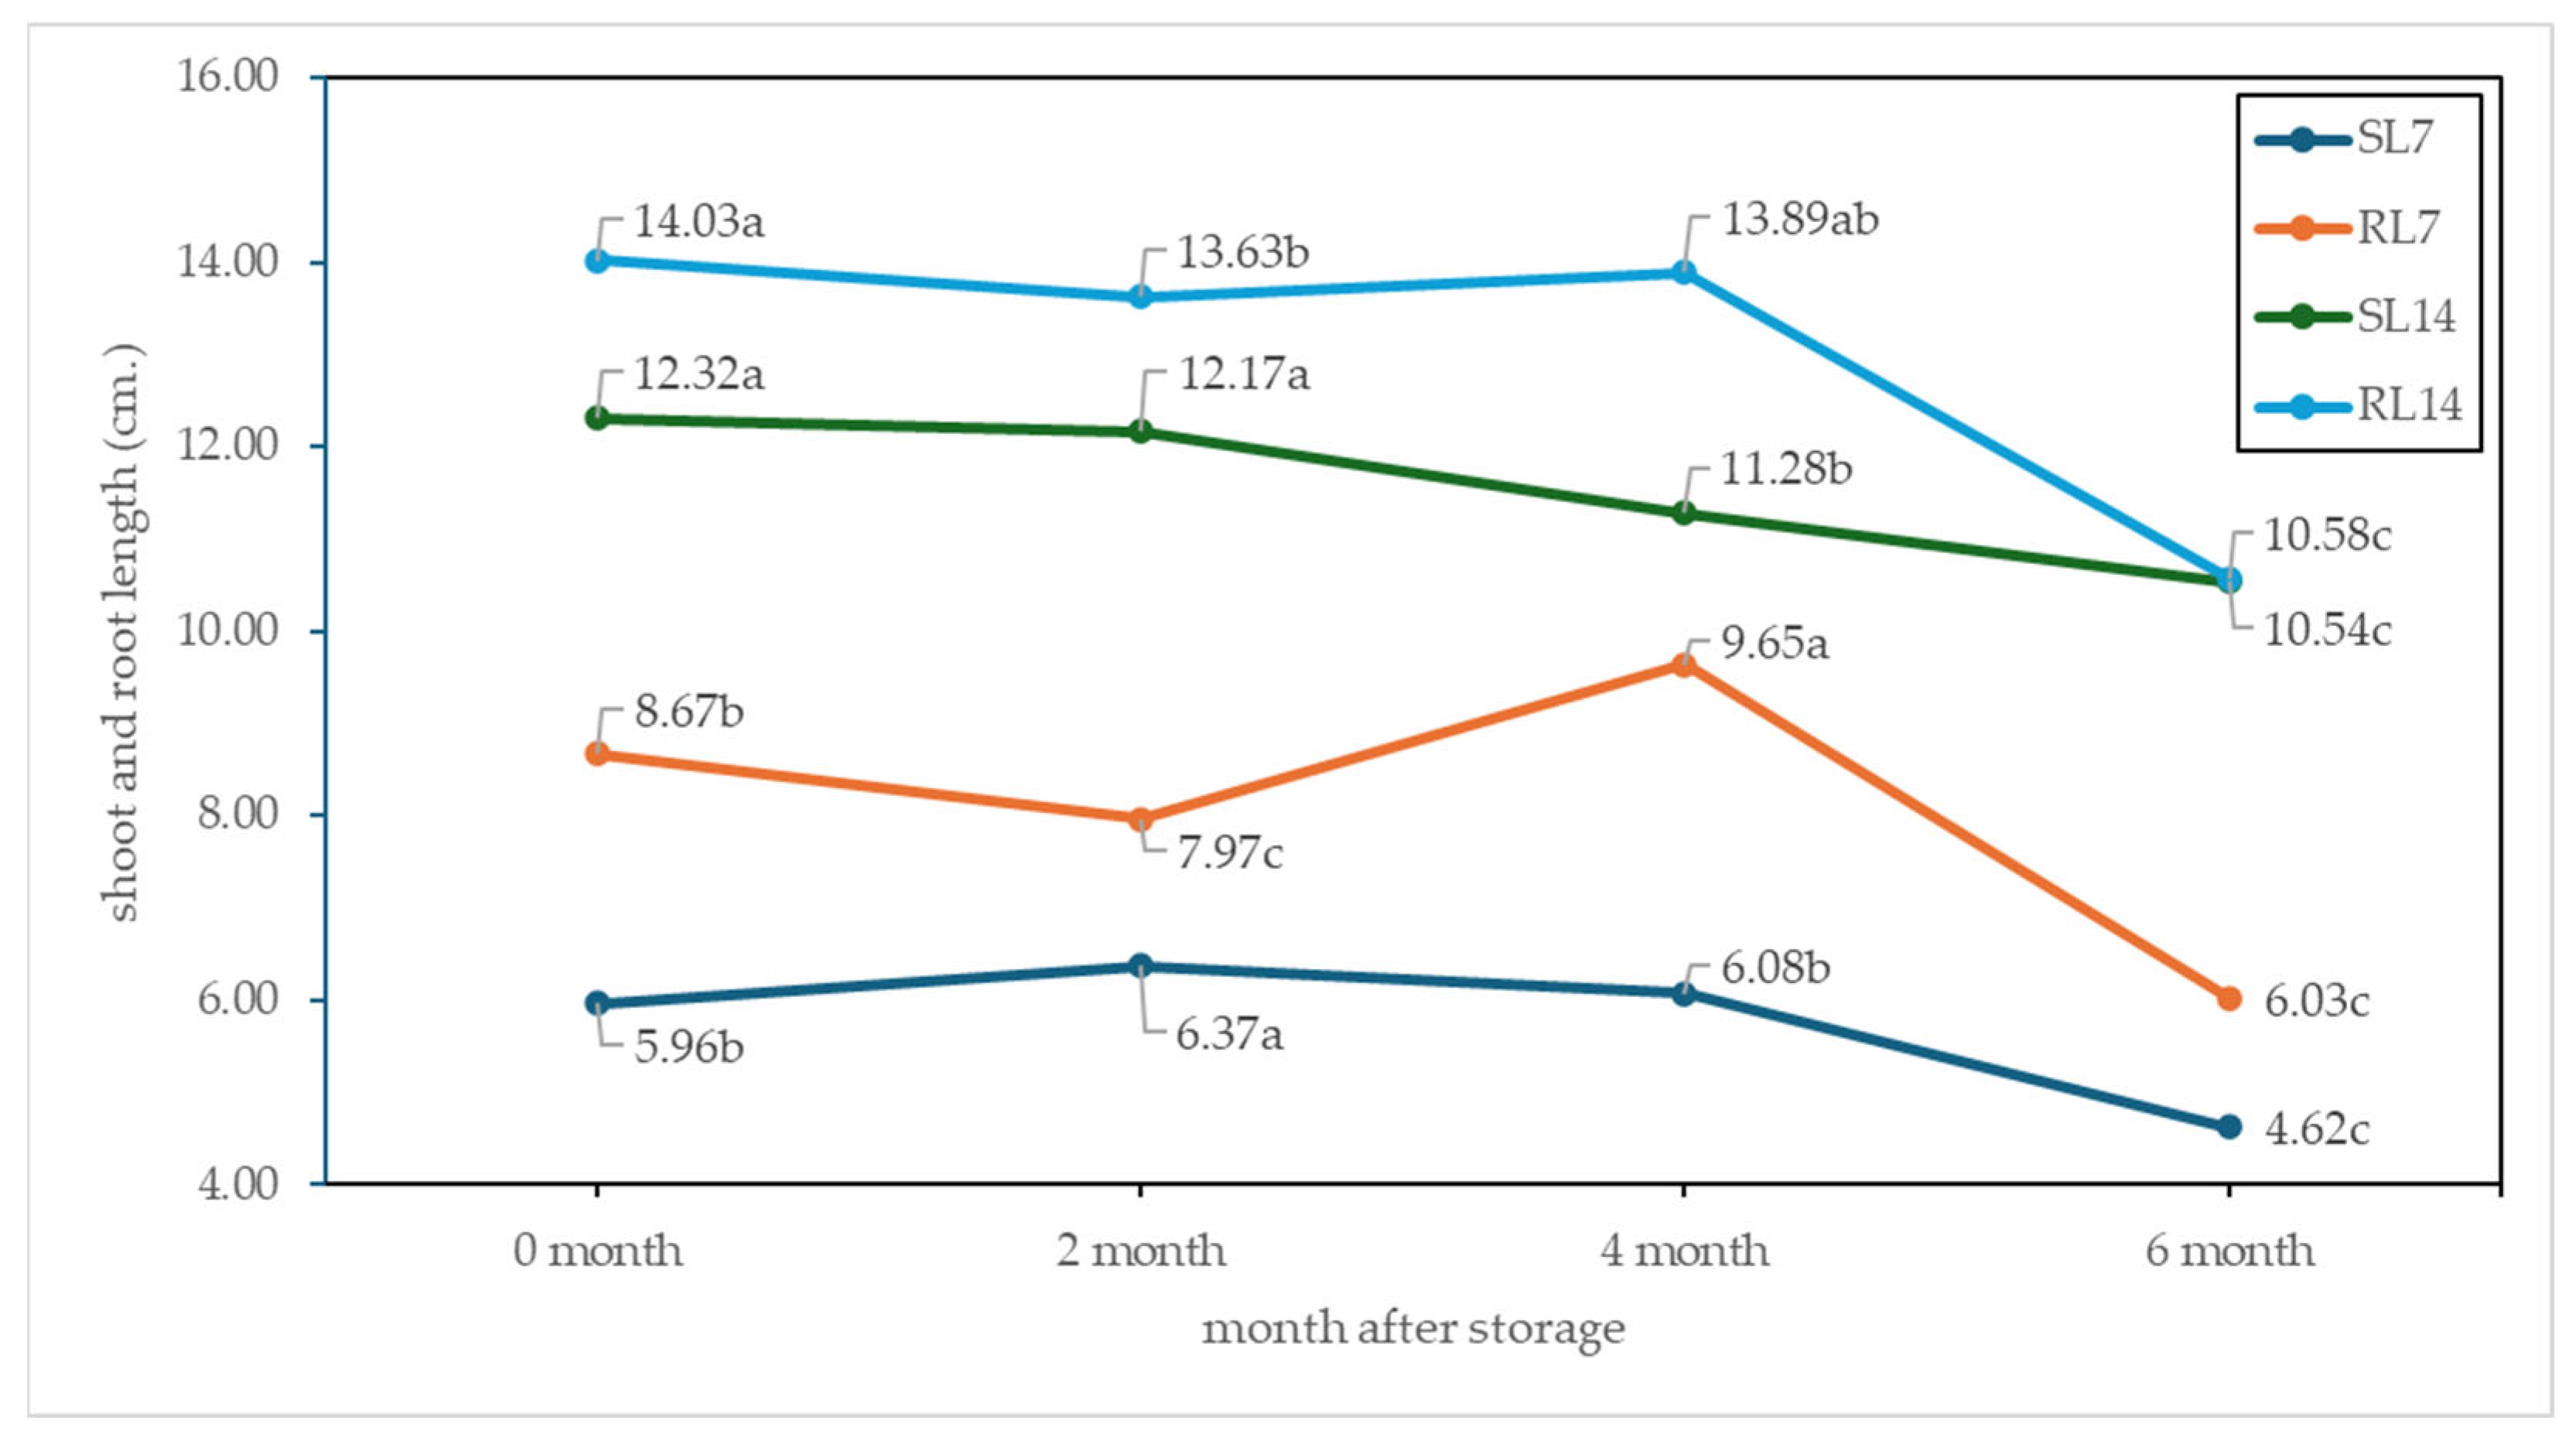
The storage duration had a clear influence on seed quality across all assessed parameters (Table 3 and Table 4). Noticeable reductions in RE, G, and GI were recorded after six months of storage (Figure 11). This decline corresponded with a reduction in seedling growth and the dry weight in SL7, SL14, RL7, and RL14, which all showed markedly lower values at the six-month point (Figure 12). Furthermore, SDW, RDW, and TDW also experienced substantial decreases at this storage stage (Figure 13).
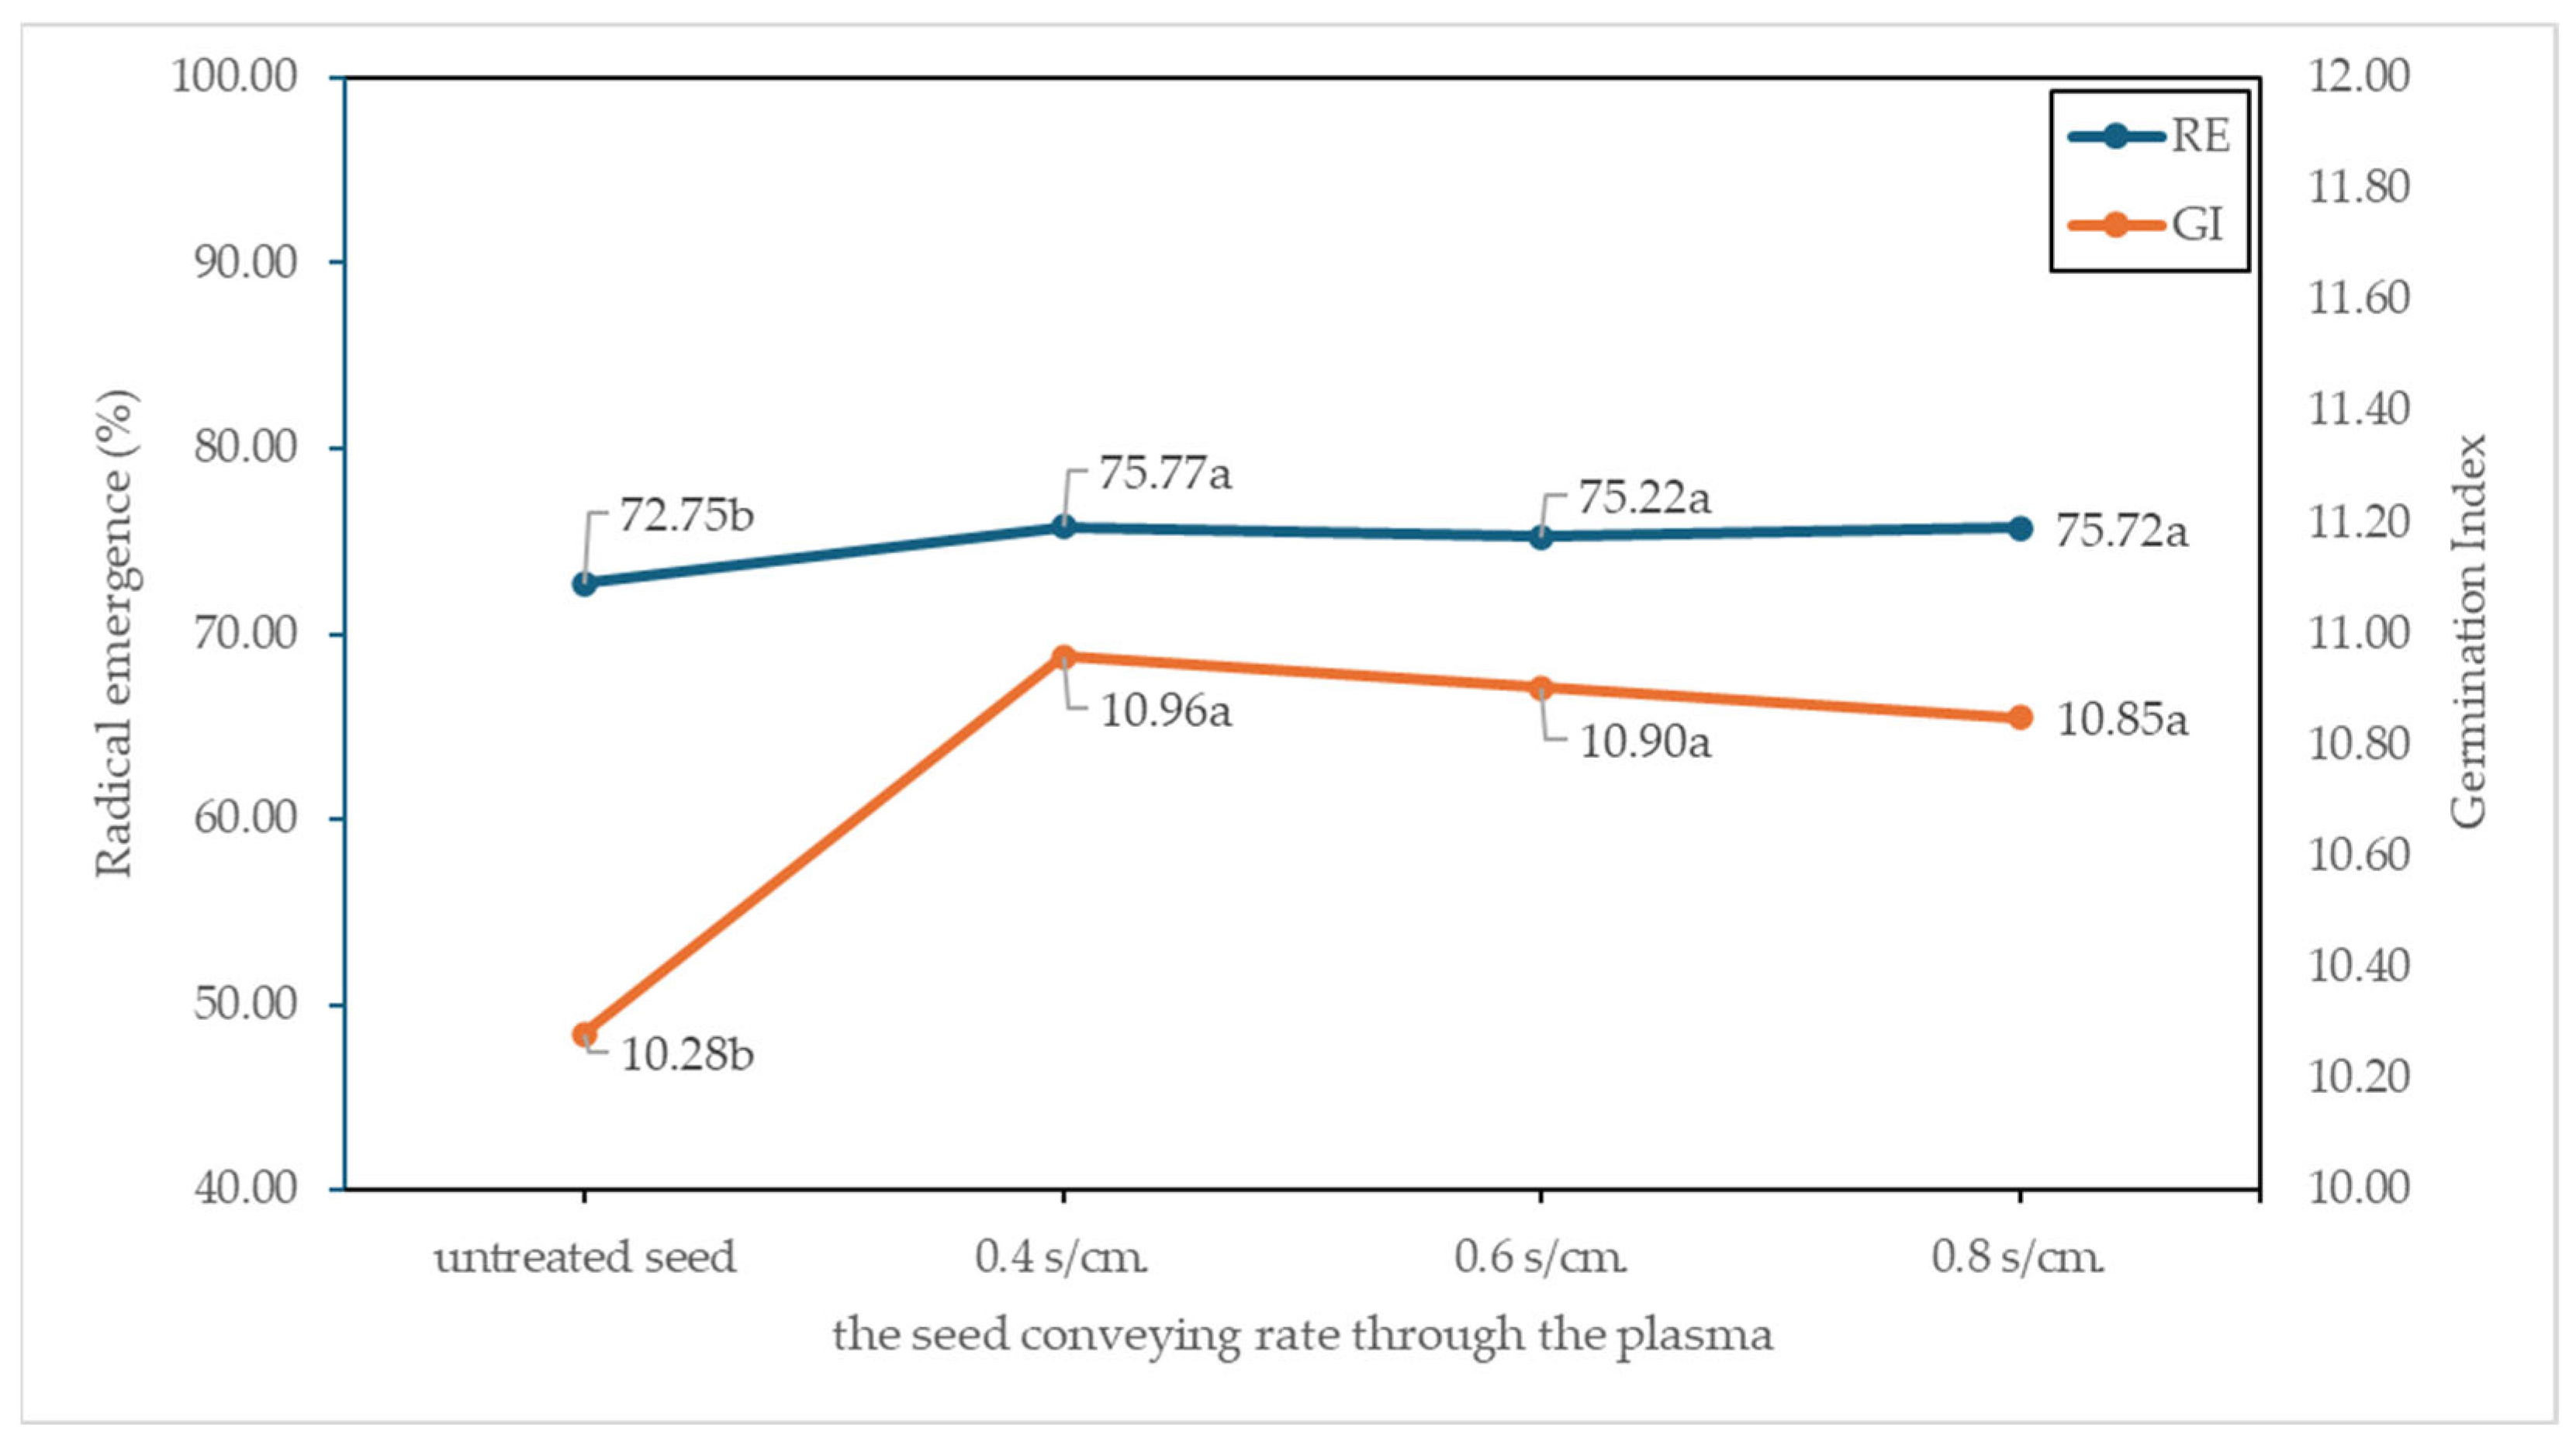
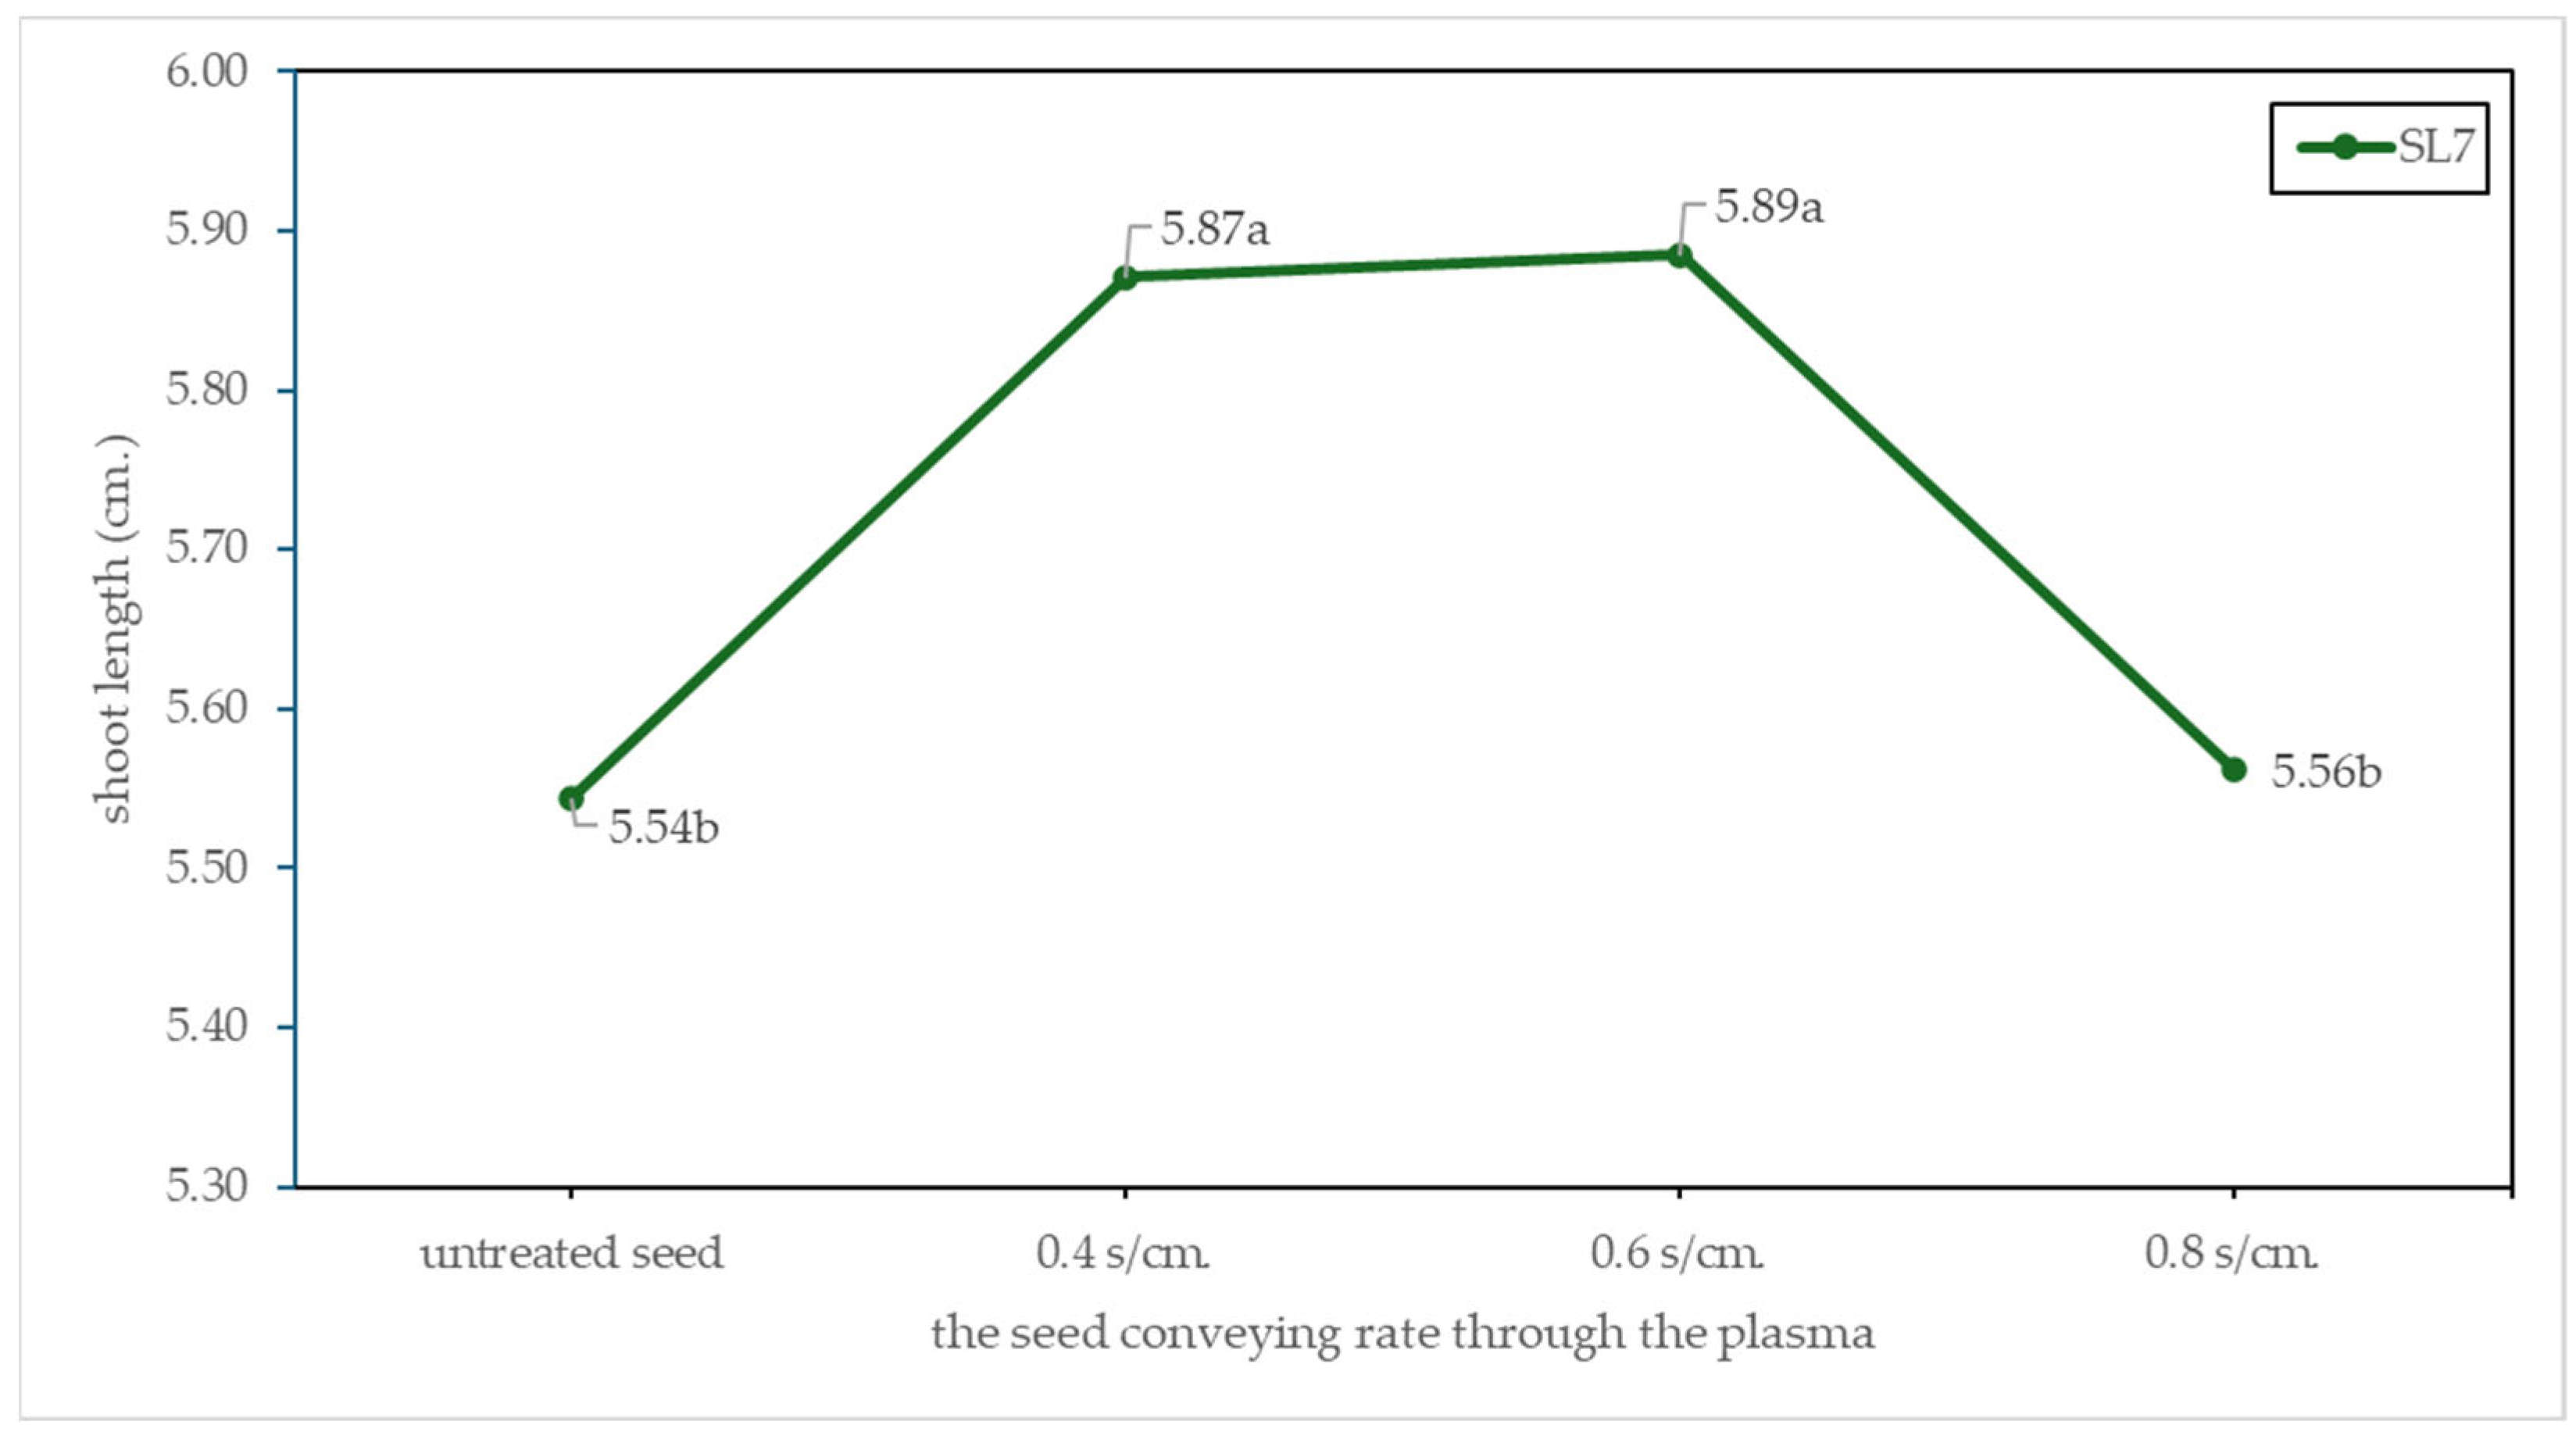
The duration of plasma exposure had statistically significant effects on RE, GI, and SL7 (Table 3). Seeds treated with DBD plasma at S0.4, S0.6, and S0.8 exhibited significantly higher RE and GI compared to untreated seeds (Figure 14). Plasma exposure also influenced the SL7, with increased shoot lengths observed at S0.4 and S0.6. However, the SL7 declined at S0.8, which may be attributed to prolonged plasma exposure leading to excessive reactive particle accumulation, thereby negatively impacting seedling growth (Figure 15).
The concentration of CuO NPs had statistically significant effects on seed quality parameters, including RE, G, GI, SL7, SL14, and TDW (Table 3 and Table 4).
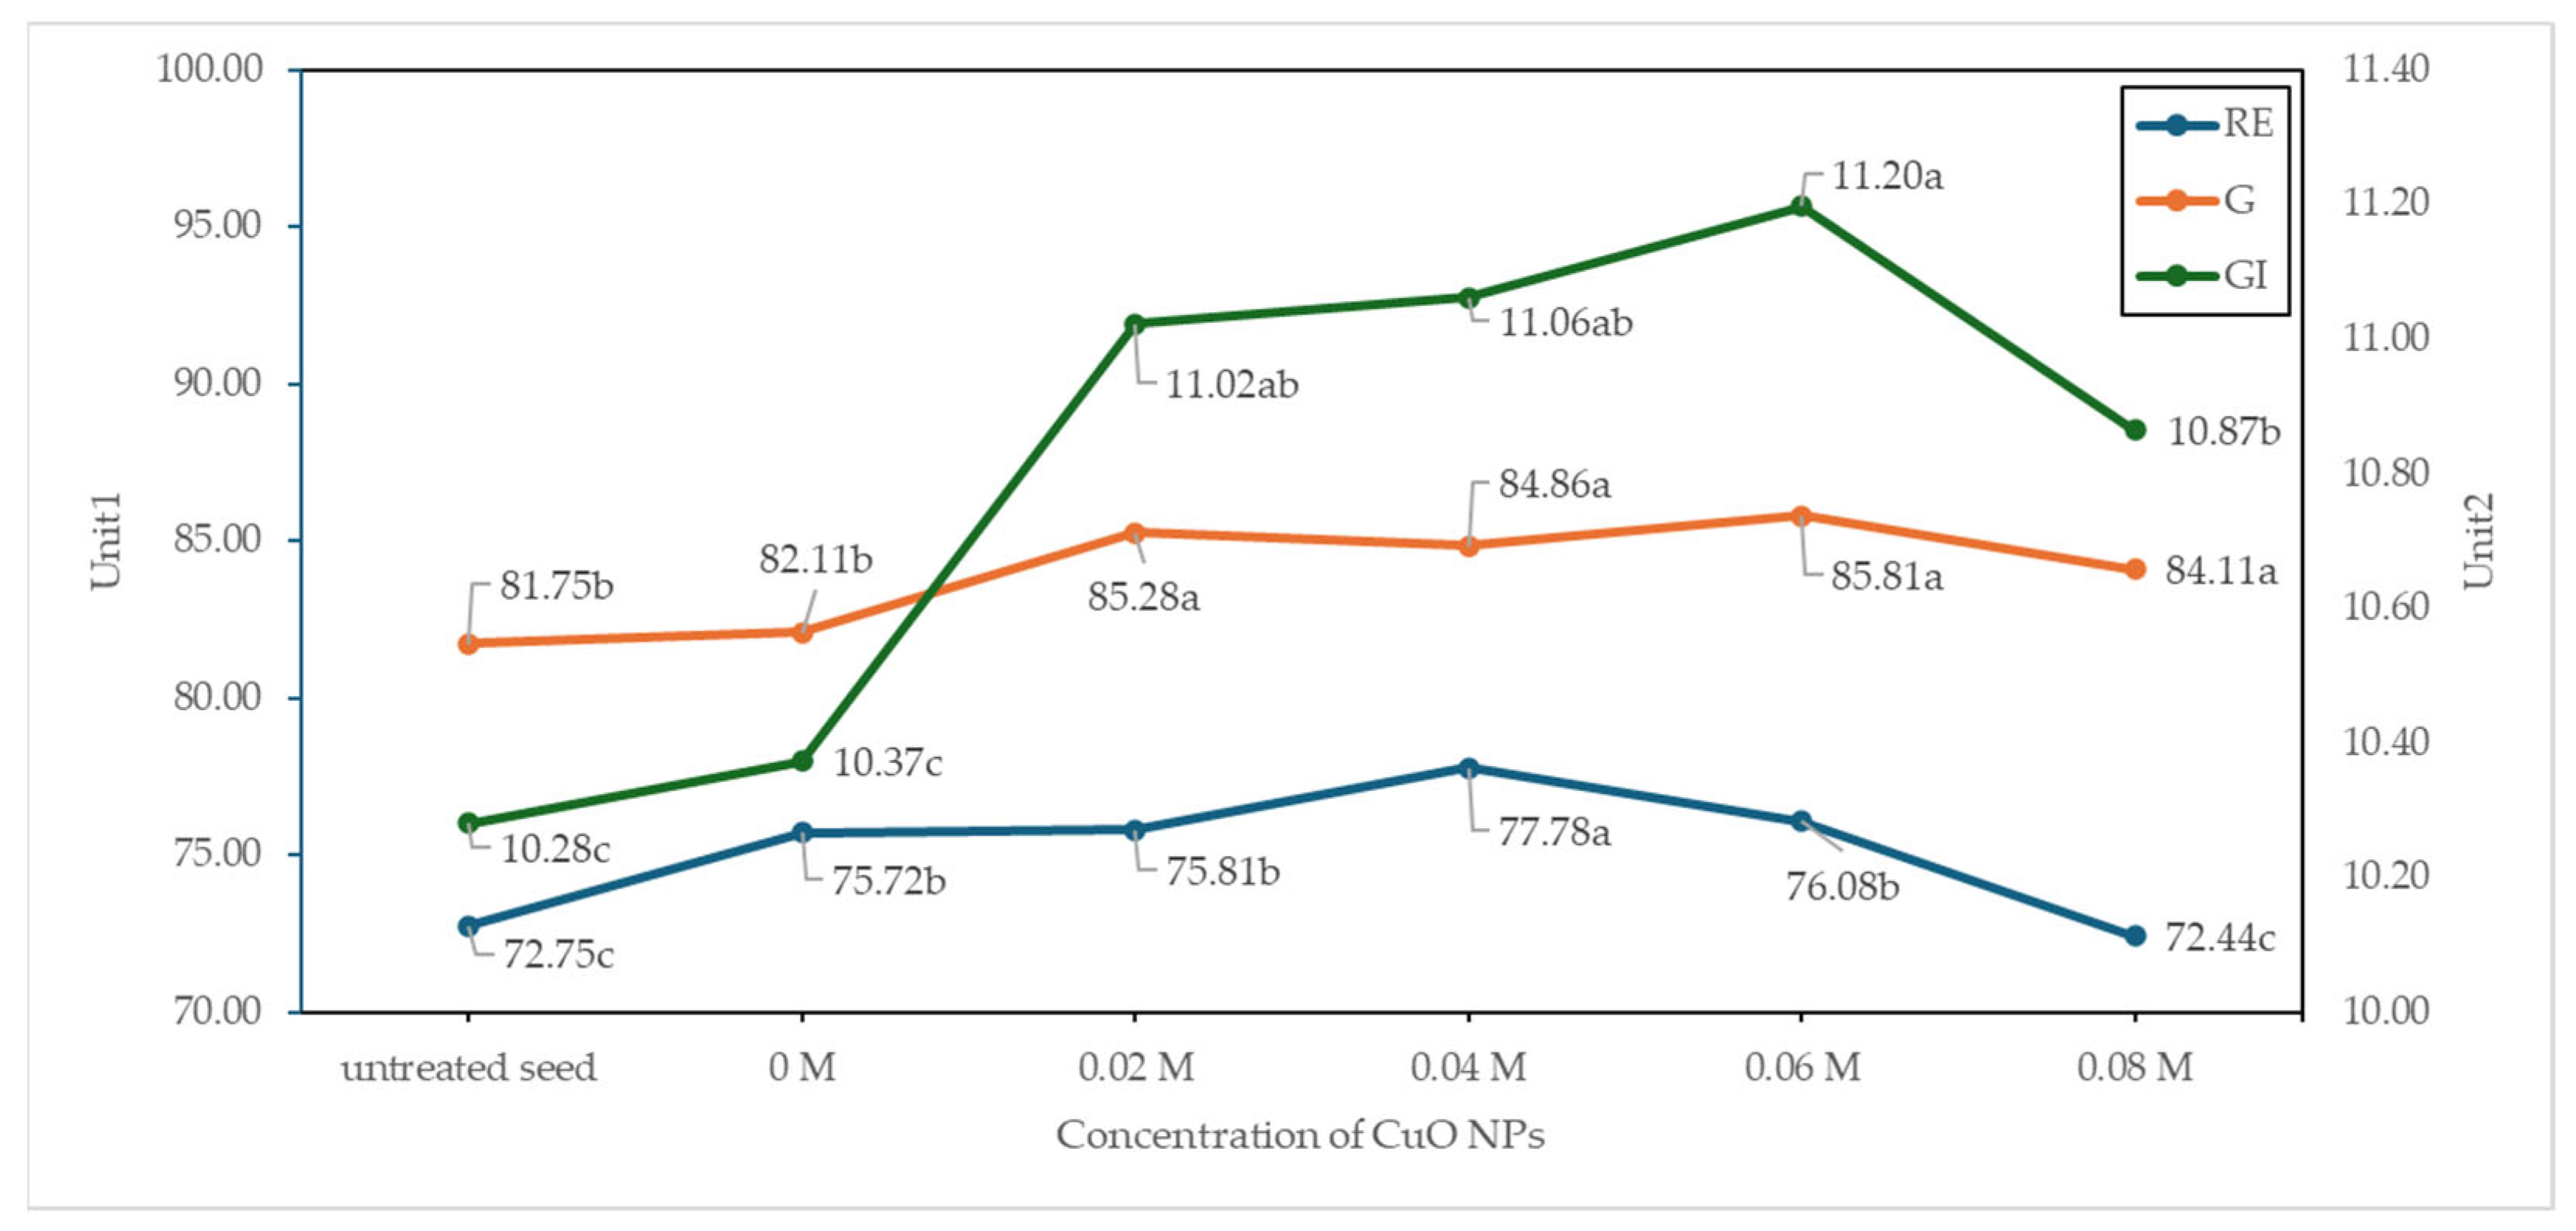
Seeds treated with plasma only exhibited an increase in RE, while the highest RE was observed at CuO0.04. However, RE decreased when the concentration increased to CuO0.06 or higher. A similar trend was found for GI: seeds treated with CuO NPs showed an increase in GI with rising concentrations, but GI declined at CuO0.08. Overall, both RE and GI tended to increase with the CuO NP concentration but decreased when excessive concentrations were applied. In terms of G, seeds treated with CuO NPs showed higher values compared to both the untreated control and the plasma-only treatment group (Figure 16).
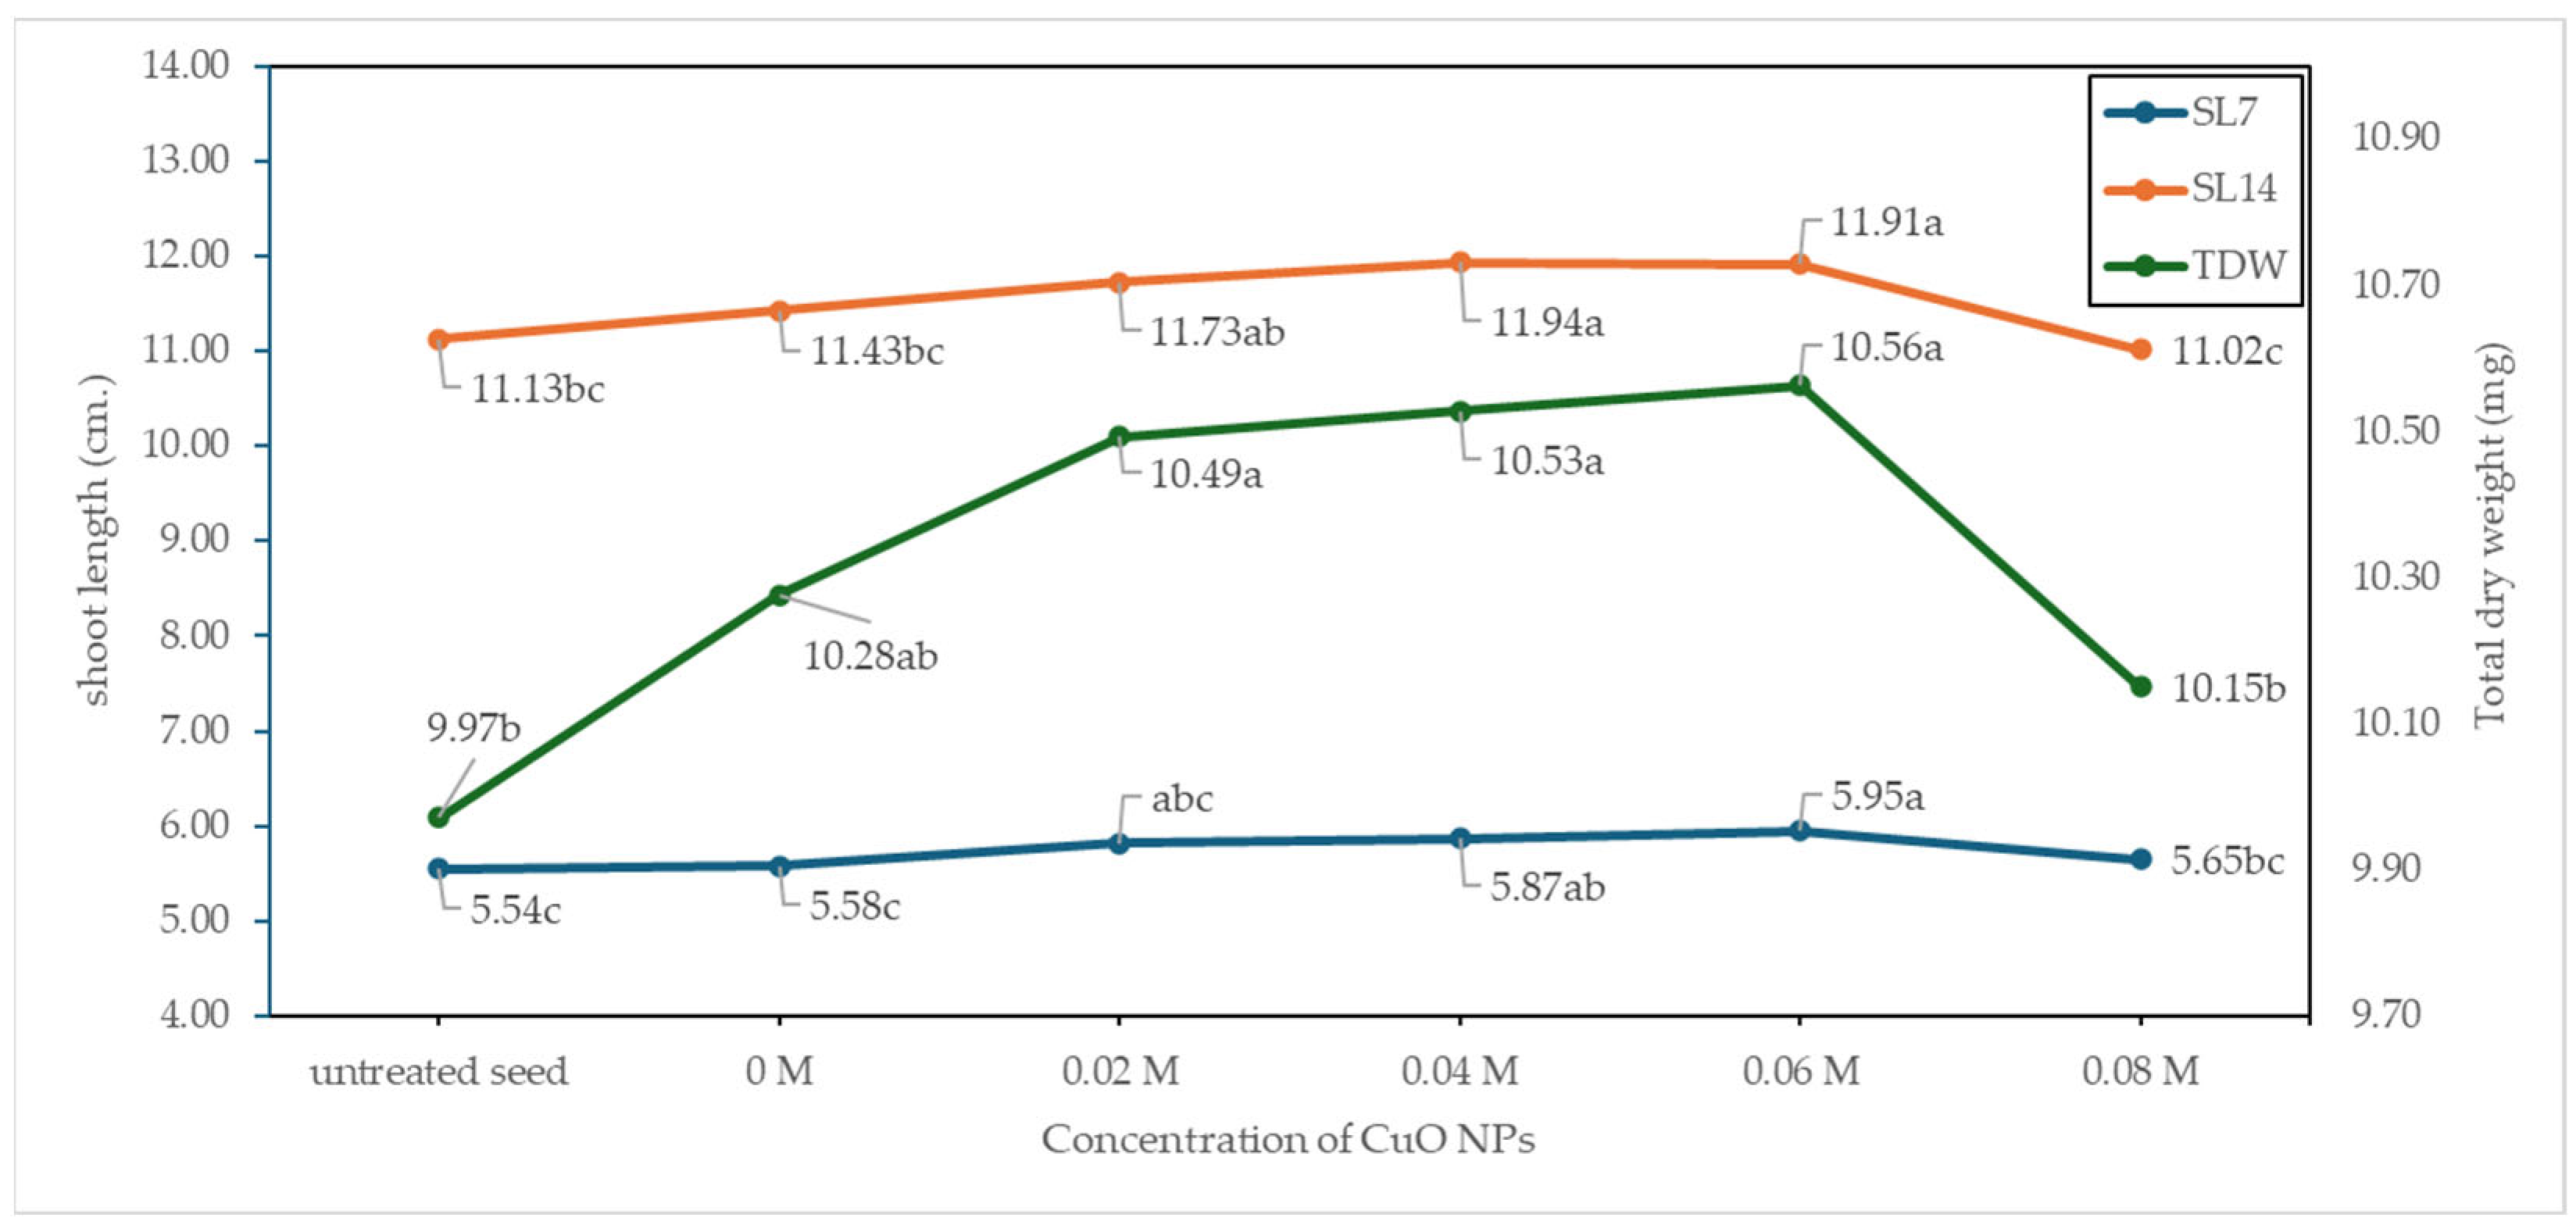
SL7 and SL14 increased with rising concentrations of CuO NPs, reaching their highest values at CuO0.06, followed by a decline at CuO0.08. A similar trend was observed for TDW. Seeds treated with plasma only showed an increase in TDW, which further improved when combined with CuO NPs. TDW increased with CuO NPs concentration and peaked at CuO0.06, but declined at CuO0.08 (Figure 17).

4. Discussion

4.1. Seed Physical Properties

Optical emission spectroscopy measurements in this study exhibited a strong OH emission at 309 nm (Figure 3), which lies within the range of 306.068 to 315.874 nm reported by Qusnudin et al. [40], who observed stable OH radical intensities under dielectric barrier discharge (DBD) plasma at 10 kV. In their study, OH emissions at 313.54 nm varied between 4678.5 and 13,644.7 counts, confirming consistent OH production under these plasma conditions. Yao et al. [41] provided further insights into the formation sequence of OH in an O2/H2O pulsed DBD system. They demonstrated that energetic electrons first collide with O2 molecules, generating electronically excited oxygen atoms O(1D). These O(1D) species subsequently react with water molecules via O(1D) + H2O → 2OH, leading to OH(A→X) emissions centered around 308 nm. Their study also showed that the OH emission intensity increased linearly with discharge power, underscoring the importance of discharge energy in promoting these stepwise reactions.
The calculated electron temperature ( T e ) of approximately 5 eV indicates that the discharge operates within the typical range of non-thermal plasma (Figure 4). As described by Laroussi (2017), atmospheric-pressure dielectric barrier discharges (DBDs) generally exhibit T e between 0.2 and 5 eV for diffuse plasmas, while the neutral gas temperature remains near 300–350 K [42]. This large difference between electron and gas temperatures defines the non-equilibrium nature of cold plasmas.
Although the present value is near the upper limit of that range, it is still consistent with the energy domain of cold atmospheric plasmas, where only electrons are highly energetic, and the heavy species remain close to ambient conditions. Similar results were noted in the computational study of DBDs by Khan et al. (2021), who reported electron temperatures on the order of 1 eV under comparable conditions [43]. The higher instantaneous T e observed here likely reflects transient micro discharge peaks rather than thermal heating of the gas.
Consequently, the obtained T e confirms that the plasma produced in this work belongs to the non-thermal (cold) atmospheric plasma regime, in which energetic electrons sustain reactive-species formation without elevating the neutral gas temperature.
The detection of hydrogen peroxide in plasma-activated water (PAW) confirmed that the dielectric barrier discharge (DBD) plasma device effectively produced reactive oxygen species during the 1 min treatment applied in this work. The average H2O2 concentration of 1.49 ± 0.12 mg L−1 demonstrates that even a short plasma exposure can introduce measurable oxidative species into the liquid phase (Table 1). This finding aligns with the mechanistic explanation summarized by Wong et al. 2023, who reviewed that hydroxyl radicals (•OH) generated at the gas–liquid interface recombine to form H2O2; in their survey, typical DBD or plasma-jet treatments of 1–10 min yielded peroxide concentrations ranging from a few tens to several hundred µM depending on gas composition and discharge power [44]. The detection of H2O2 in this study thus provides direct evidence that electron-impact dissociation of O2 and H2O occurred in the discharge, confirming the generation of OH radicals within the plasma region.
The measured concentration also corresponds well with the value reported by Zambon et al. 2020, who produced PAW by an air DBD plasma operated for 10 min, obtaining 13.5 ± 1.3 mg L−1 H2O2 [45]. Considering that the treatment time in the present work was only one-tenth of theirs, the peroxide yield scales reasonably with exposure duration, reflecting the progressive accumulation of long-lived oxidants with extended plasma contact. Such agreement confirms that the DBD configuration used here generated reactive species efficiently under mild oxidative conditions.
Overall, the measurable amount of H2O2 obtained from the 1 min DBD treatment confirms the successful conversion of energetic hydroxyl radicals into stable oxidants in the aqueous phase. This validates that the plasma system used in this study effectively produced •OH and other reactive oxygen species (ROS), providing a solid mechanistic basis for its subsequent application in seed or plant experiments using plasma-activated water.
In this study, plasma treatment progressively increased the surface temperature of rice seeds from 31.98 °C in untreated seeds to 37.12 °C under the longest exposure. During DBD plasma treatment, the observed rise in seed surface temperature can be attributed to two primary thermal mechanisms: dielectric heating, which originates from energy dissipation within the dielectric barrier under an alternating electric field, and gas heating, arising from inelastic collisions between high-energy electrons or ions and neutral gas molecules. The heat produced in the gaseous phase is subsequently conducted to the seed surface, leading to a measurable temperature elevation. While the DBD plasma is conventionally categorized as non-thermal, such localized heating can still raise the seed surface temperature several degrees above ambient conditions without compromising seed integrity [46]. El Shaer et al. [5] similarly found that DBD plasma raised the seed surface temperatures from 26.6 °C to around 30 °C after 10 min. They explicitly stated that “this is considered in an acceptable range not inducing seed’s morphological changes.” They supported this by showing enhanced germination potential, germination rate, and germination index. They increased shoot and root lengths after treatment, indicating that such temperature elevations did not impair the seed structure or the initial growth performance. Additionally, Tanakaran et al. [31] observed that in a multi-pin corona discharge system, the temperatures measured between the electrodes did not exceed 35 °C, while still achieving improvements in seed germination and early growth of jasmine rice. These consistent findings across different plasma configurations reinforce that the moderate temperature increases reported under these treatment conditions do not adversely affect the seed morphology or vigor.
SEM images revealed corrosion on the rice seed coat following plasma treatment (Figure 6). This corrosion was attributed to hydroxyl radicals (OH) generated by DBD plasma. OES analysis confirmed that DBD plasma produced a significant amount of OH (Figure 3), a highly oxidative species capable of forming hydrogen bonds with surface molecules, leading to surface degradation [47]. These chemical interactions resulted in notable alterations to the seed surface, enhancing water uptake [31]. From Figure 6, it is evident that the seed coat of untreated rice seeds exhibits a compact, intact layer. However, following plasma treatment at S0.4, surface erosion was observed, resulting in the formation of grooves on the seed coat. This structural modification facilitated improved water uptake, as indicated by the water contact angle (WCA) measurements. Specifically, untreated seeds showed a WCA of 92.869°, which decreased to 86.988° after plasma exposure at S0.4. The WCA further declined with increasing plasma exposure times (Figure 8A). These findings are consistent with the SEM images, which demonstrated that rice seed coats subjected to plasma treatments at S0.6 and S0.8 exhibited progressively more pronounced erosion patterns corresponding to longer plasma exposure durations. Plasma treatment reduces the WCA as a consequence of modifications occurring in both surface chemistry, notably the introduction of polar functional groups such as hydroxyl and carboxyl groups, and surface morphology, which is characterized by increased surface roughness and etching. Together, these effects serve to enhance the hydrophilicity of the seed surface [48,49]. Typically, a WCA below 90° indicates a hydrophilic surface, while values above 90° are considered hydrophobic. Most seeds initially exhibit WCA values between 90° and 120° [48]. This resulted in plasma-treated seeds exhibiting significantly higher RE and GI compared to untreated seeds (Figure 14). Furthermore, Table 2 demonstrates that at CuO concentrations ranging from 0.04 to 0.06, seeds treated with S0.6 and S0.8 showed higher Cu levels than those treated with S0.4. This observation is consistent with the EDX mapping images, where the Cu signals in seeds treated at S0.6 and S0.8 were more pronounced (Figure 7).
Reports in the literature have shown that cold plasma treatment can alter seed coat properties by increasing the surface hydrophilicity through the incorporation of oxygen-containing functional groups and by inducing micro-scale etching, thereby enhancing water absorption and permeability [50]. Other studies have demonstrated that plasma exposure can create micro-cracks and cause surface morphological changes due to interactions between charged particles, reactive species, and the outer seed layers, which can partially remove protective structures and facilitate inward diffusion of external agents [51].
In the present work, EDX mapping revealed copper signals across the seed hull, bran, and endosperm, with the intensity increasing alongside the CuO NP concentration and plasma treatment intensity (Table 2, Figure 7). This pattern is consistent with the surface modifications described in previous studies, suggesting that similar plasma-induced mechanisms—micro-etching, crack formation, and removal of superficial barriers—may have facilitated deeper penetration and adsorption of CuO NPs within seed tissues under our treatment conditions.
AAS analysis further showed that seedlings derived from plasma-treated seeds coated with CuO NPs accumulated significantly higher copper concentrations than untreated controls, with a dose-dependent trend. Although varying the seed conveying rate through the plasma did not significantly change the copper levels at a given NP concentration, the combination of higher NP doses with plasma treatment consistently resulted in a greatest copper accumulation (Figure 9). These findings, considered alongside established literature, indicate that plasma-induced surface restructuring can play a decisive role in enhancing nanoparticle internalization and subsequent nutrient translocation during early seedling growth.

4.2. Fungal Inhibition

The analysis of seed fungal contamination revealed that plasma and CuO NP treatments significantly reduced both the overall fungal load and the incidence of specific fungal species in rice seeds. The percentage of seed infection was significantly reduced following treatment. However, Aspergillus spp. did not respond to the treatments, and Rhizoctonia solani was not completely suppressed. These fungi are thought to possess resistance mechanisms that reduce their susceptibility to disinfection [52,53].
R. solani is a seed- and soil-borne pathogen that survives through sclerotia, rigid mycelial structures that enable the fungus to withstand adverse environmental conditions. These sclerotia act as the primary inoculum, initiating the production of mycelia under favorable conditions. The mycelia then develop into infection structures capable of penetrating plant tissues [54,55]. In response to reactive oxygen species (ROS) stress induced by hosts or chemical treatments, R. solani upregulates several antioxidant biosynthesis genes, including those responsible for thiamine (vitamin B1) and pyridoxine (vitamin B6) production [52,56]. These biosynthetic pathways help alleviate ROS-induced stress under both abiotic and biotic conditions [52,56], thereby contributing to the pathogen’s resistance to ROS generated by plasma and CuO NP treatments.
Similarly, Aspergillus spp. possess robust antioxidant defenses. These fungi can synthesize antioxidant enzymes such as superoxide dismutase (SOD) to mitigate ROS effects [53]. In addition, Aspergillus spp. have been reported to produce melanin, which provides protection against UV radiation and environmental stress [53].
Although neither fungal species was completely eliminated, the infection rate of R. solani decreased significantly with increasing concentrations of CuO NPs, with the lowest infection percentage observed at 0.08 M (Figure 10B). This finding aligns with the results of Ahmad et al. [25], who demonstrated that CuO NPs exhibit significant antifungal activity against apple pathogens, likely through Cu ions disrupting microbial DNA by binding to it and damaging the helical structure. Similarly, Zakharova et al. [22] reported that CuO NPs significantly inhibited Alternaria solani by reducing colony growth and spore formation. Other studies further suggest that internalized copper ions may interfere with essential biochemical processes in microbial cells [25], although the precise mechanisms remain to be fully elucidated.

4.3. Seed Quality and Seed Storage

After six months of storage, rice seeds exhibited a pronounced decline in their physiological performance, indicating an accelerated aging process. RE, G, and GI were significantly reduced, reflecting impaired germination capacity and vigor. Seedling growth traits, including shoot length (SL7 and SL14) and root length (RL7 and RL14), also decreased markedly, suggesting restricted development of both aerial and root systems. Parallel reductions in seedling biomass, as evidenced by lower SDW, RDW, and TDW, further confirmed the deterioration of seed vigor. Collectively, these results demonstrate that storage beyond six months critically compromises seed viability and growth potential. Bailly [57] explained that the loss of seed viability during storage is largely attributed to the build-up of reactive oxygen species (ROS) such as superoxide (O2), hydrogen peroxide (H2O2), and hydroxyl radicals (OH·). These species tend to accumulate under low-moisture conditions when antioxidant enzymes become inactivated, and upon imbibition, the renewed metabolic activity generates additional ROS, further intensifying oxidative stress and ultimately reducing seed vigor. The substantial reductions observed after six months in this study are therefore most likely linked to oxidative stress [58,59].
Both low-temperature plasma and CuO NP treatments are known to contribute to ROS and RNS production. These reactive species can adhere to and penetrate seed coats, inducing intracellular ROS accumulation and activating antioxidant enzyme systems [5]. In the case of CuO NPs, exposure has been shown to promote lipid peroxidation and elevate H2O2 in a concentration-dependent manner, thereby stimulating SOD activity [58,59,60]. Although such responses initially act as protective mechanisms, prolonged storage exacerbates ROS accumulation. Together with natural seed aging, this overwhelms the antioxidant defense capacity, leading to oxidative injury and a decline in seed viability [61,62].
For seeds exposed to plasma, a statistically significant rise in RE and GI was observed compared to the untreated control (Figure 14). This effect has been attributed to OH radicals generated by DBD plasma. These radicals, with their strong oxidative potential, can react with hydrogen bonds at the seed surface, producing surface corrosion [47]. SEM observations and WCA measurements supported this interpretation, showing that plasma treatment altered the seed coat surface and improved hydrophilicity (Figure 6 and Figure 8). Such modifications agree with earlier studies demonstrating that plasma-generated radicals modify physical surface properties, which in turn enhance water uptake, germination, and seedling development [31].
However, excessive plasma exposure can also induce undesirable effects. Los et al. (2019) observed that while short-term atmospheric cold plasma treatments (30–60 s) enhanced wheat germination and vigor, prolonged exposure (≥180 s) markedly suppressed germination and seedling growth. This inhibitory response was attributed to oxidative stress and excessive accumulation of reactive oxygen and nitrogen species that disrupted membrane integrity and metabolic activity [16].
From an industrial perspective, DBD plasma technology offers high scalability and operational efficiency. Non-thermal plasma has already been applied in several industries, including agriculture and food processing, due to its low-temperature, chemical-free, and energy-efficient nature [63]. The generation of highly reactive species within milliseconds allows seed surface modification even under extremely short exposures. Recek et al. (2021) demonstrated that physiological effects and a complete hydrophilization of bean seed coats could occur after only 0.5 s of plasma treatment [64]. This finding is consistent with our own experimental results, in which measurable changes in seed surface properties and subsequent improvements in germination behavior were observed under similarly short DBD exposure. Such agreement confirms the feasibility of continuous-flow DBD plasma systems, where sub-second exposure ensures uniform, non-thermal processing of large seed batches. Consequently, DBD plasma represents a sustainable, rapid, and scalable technology for industrial-scale seed enhancement. Similarly, treatment with CuO NPs resulted in significant increases in RE and GI with rising concentrations, although these parameters declined at the highest dose (0.08 M) (Figure 16). This reduction is most likely attributable to copper toxicity. Supporting this, AAS analysis revealed that higher NP concentrations led to greater copper accumulation in rice seedlings (Figure 9). CuO NPs are able to penetrate cell membranes and release Cu ions, which subsequently react with oxygen molecules to generate OH radicals detrimental to plant cells [65].
An analogous pattern was observed for seedling growth traits. Increases in SL7, SL14, and TDW were recorded with increasing CuO NP concentrations, peaking at 0.06 M before declining at 0.08 M (Figure 17). These results are consistent with Wang et al. [58], who reported that CuO NPs enhanced shoot and root growth at lower concentrations but inhibited growth at higher levels. A comparable trend was also observed in wheat [28]. Such outcomes suggest that while copper can act as a beneficial secondary nutrient at low concentrations, excessive levels induce toxicity that suppresses seedling growth.

5. Conclusions

This study demonstrated that DBD plasma and CuO nanoparticles improved the surface properties of rice seeds, enhanced seed quality, and reduced fungal infections. Plasma treatment increased hydrophilicity through surface erosion, promoting radicle emergence (RE) and increased germination index (GI). CuO NPs enhanced copper uptake and supported seedling growth at concentrations of 0.04–0.06 M, whereas 0.08 M caused toxicity. Combined treatments suppressed Rhizopus sp. and R. solani, though seed quality declined after six months of storage, likely due to oxidative stress. The optimal condition was 0.6 s/cm plasma with 0.06 M CuO NPs, maximizing germination and vigor without toxicity.

Supplementary Materials

The following supporting information can be downloaded at: https://www.mdpi.com/article/10.3390/agriculture15212280/s1, Figure S1: SEM image and particle size distribution of the synthesized CuO nanoparticles; Figure S2: EDS analysis of the CuO nanoparticles showing representative spectra from three measurement points on the same nanoparticle agglomerate (CuO nanoparticle synthesis.docx).

Author Contributions

Conceptualization, J.P., P.T., Y.C. and S.-n.T.; methodology, J.P., P.T., Y.C. and S.-n.T.; software, J.P.; validation, J.P., P.T., Y.C. and S.-n.T.; formal analysis, J.P. and S.-n.T.; investigation, J.P.; resources, C.S. (Choncharoen Sawangrat) and Y.C.; data curation, J.P.; writing—original draft preparation, J.P.; writing—review and editing, P.T., Y.C. and S.-n.T.; visualization, J.P.; supervision, C.S. (Chommanad Sawadeemit) and D.B.; project administration, S.-n.T.; funding acquisition, C.S. (Choncharoen Sawangrat) and S.-n.T. All authors have read and agreed to the published version of the manuscript.

Funding

This research was financially supported by Chiang Mai University.

Data Availability Statement

Data are contained within the article.

Acknowledgments

This research was partially supported by the Science and Technology Park and Chiang Mai University. The authors sincerely thank the Central Laboratory, Faculty of Agriculture, for providing research equipment. The authors also gratefully acknowledge Dielectric Technology Co., Ltd., particularly Rachan Singjai, Kiattisak Jaikaew, and Nitikorn Wongchankaeo, for their valuable technical collaboration and support in plasma system development. Special thanks are extended to Kunasin Sonthi, Nicha Paochai, and Ratchanon Wilaiwan for their technical assistance throughout the experimental work.

Conflicts of Interest

The authors declare no conflicts of interest.

References

  1. Yan, Y.; Zhu, X.; Qi, H.; Wang, Y.; Zhang, H.; He, J. Rice Seed Storability: From Molecular Mechanisms to Agricultural Practices. Plant Sci. 2024, 348, 112215. [Google Scholar] [CrossRef] [PubMed]
  2. Prasertsak, A. Rice Seed Multiplication System. Thai Rice Res. J. 2022, 13, 106–117. [Google Scholar]
  3. Kumar, R. Effectiveness of Seed Processing Machinery on Seed Quality Improvement in Paddy (Oryza sativa L.). J. AgriSearch 2016, 3, 187–190. [Google Scholar] [CrossRef]
  4. Mazandarani, A.; Goudarzi, S.; Ghafoorifard, H.; Eskandari, A. Evaluation of DBD Plasma Effects on Barley Seed Germination and Seedling Growth. IEEE Trans. Plasma Sci. 2020, 48, 3115–3121. [Google Scholar] [CrossRef]
  5. El Shaer, M.; Abdel-azim, M.; El-welily, H.; Hussein, Y.; Abdelghani, A.; Zaki, A.; Mobasher, M. Effects of DBD Direct Air Plasma and Gliding Arc Indirect Plasma Activated Mist on Germination, and Physiological Parameters of Rice Seed. Plasma Chem. Plasma Process. 2023, 43, 1169–1193. [Google Scholar] [CrossRef]
  6. Veerana, M.; Yu, N.; Ketya, W.; Park, G. Application of Non-Thermal Plasma to Fungal Resources. J. Fungi 2022, 8, 102. [Google Scholar] [CrossRef]
  7. Misra, N.N.; Schlüter, O.; Cullen, P.J. (Eds.) Cold Plasma in Food and Agriculture: Fundamentals and Applications; Elsevier: Amsterdam, The Netherlands; Academic Press: Boston, MA, USA, 2016; ISBN 978-0-12-801365-6. [Google Scholar]
  8. Starič, P.; Vogel-Mikuš, K.; Mozetič, M.; Junkar, I. Effects of Nonthermal Plasma on Morphology, Genetics and Physiology of Seeds: A Review. Plants 2020, 9, 1736. [Google Scholar] [CrossRef] [PubMed]
  9. Lee, Y.; Lee, Y.Y.; Kim, Y.S.; Balaraju, K.; Mok, Y.S.; Yoo, S.J.; Jeon, Y. Enhancement of Seed Germination and Microbial Disinfection on Ginseng by Cold Plasma Treatment. J. Ginseng Res. 2021, 45, 519–526. [Google Scholar] [CrossRef]
  10. Varnagiris, S.; Vilimaite, S.; Mikelionyte, I.; Urbonavicius, M.; Tuckute, S.; Milcius, D. The Combination of Simultaneous Plasma Treatment with Mg Nanoparticles Deposition Technique for Better Mung Bean Seeds Germination. Processes 2020, 8, 1575. [Google Scholar] [CrossRef]
  11. Yawirach, S.; Sarapirom, S.; Janpong, K. The Effects of Dielectric Barrier Discharge Atmospheric Air Plasma Treatment to Germination and Enhancement Growth of Sunflower Seeds. J. Phys. Conf. Ser. 2019, 1380, 012148. [Google Scholar] [CrossRef]
  12. Park, J.; Cha, M.S. Successive Multi-Microdischarges Occurring in Pin-to-Line Geometry of Dielectric Barrier Discharge. Plasma Chem. Plasma Process. 2023, 43, 1435–1452. [Google Scholar] [CrossRef]
  13. Rongsangchaicharean, T.; Srisonphan, S.; Onwimol, D. Responses of Rice Seed Quality to Large-Scale Atmospheric Nonthermal Plasmas. Plasma Chem. Plasma Process. 2022, 42, 1127–1141. [Google Scholar] [CrossRef]
  14. Mravlje, J.; Regvar, M.; Starič, P.; Mozetič, M.; Vogel-Mikuš, K. Cold Plasma Affects Germination and Fungal Community Structure of Buckwheat Seeds. Plants 2021, 10, 851. [Google Scholar] [CrossRef]
  15. Jo, Y.-K.; Cho, J.; Tsai, T.-C.; Staack, D.; Kang, M.-H.; Roh, J.-H.; Shin, D.-B.; Cromwell, W.; Gross, D. A Non-Thermal Plasma Seed Treatment Method for Management of a Seedborne Fungal Pathogen on Rice Seed. Crop Sci. 2014, 54, 796–803. [Google Scholar] [CrossRef]
  16. Los, A.; Ziuzina, D.; Boehm, D.; Cullen, P.J.; Bourke, P. Investigation of Mechanisms Involved in Germination Enhancement of Wheat (Triticum aestivum) by Cold Plasma: Effects on Seed Surface Chemistry and Characteristics. Plasma Process. Polym. 2019, 16, 1800148. [Google Scholar] [CrossRef]
  17. Shorstkii, I.; Mounassar, E.H. Atmospheric Microplasma Treatment Based on Magnetically Controlled Fe–Al Dynamic Platform for Organic and Biomaterials Surface Modification. Coatings 2023, 13, 1362. [Google Scholar] [CrossRef]
  18. Li, L.; Zhang, L.; Dong, Y. Seed Priming with Cold Plasma Mitigated the Negative Influence of Drought Stress on Growth and Yield of Rapeseed (Brassica napus L.). Ind. Crops Prod. 2025, 228, 120899. [Google Scholar] [CrossRef]
  19. Dilip, D.; Modupalli, N.; Rahman, M.M.; Kariyat, R. Atmospheric Cold Plasma Alters Plant Traits and Negatively Affects the Growth and Development of Fall Armyworm in Rice. Sci. Rep. 2025, 15, 3680. [Google Scholar] [CrossRef] [PubMed]
  20. Hofmann, T.; Lowry, G.V.; Ghoshal, S.; Tufenkji, N.; Brambilla, D.; Dutcher, J.R.; Gilbertson, L.M.; Giraldo, J.P.; Kinsella, J.M.; Landry, M.P.; et al. Technology Readiness and Overcoming Barriers to Sustainably Implement Nanotechnology-Enabled Plant Agriculture. Nat. Food 2020, 1, 416–425. [Google Scholar] [CrossRef]
  21. Saritha, G.N.G.; Anju, T.; Kumar, A. Nanotechnology—Big Impact: How Nanotechnology Is Changing the Future of Agriculture? J. Agric. Food Res. 2022, 10, 100457. [Google Scholar] [CrossRef]
  22. Zakharova, O.; Kolesnikov, E.; Shatrova, N.; Gusev, A. The Effects of CuO Nanoparticles on Wheat Seeds and Seedlings and Alternaria Solani Fungi: In Vitro Study. IOP Conf. Ser. Earth Environ. Sci. 2019, 226, 012036. [Google Scholar] [CrossRef]
  23. Gaber, S.E.; Hashem, A.H.; El-Sayyad, G.S.; Attia, M.S. Antifungal Activity of Myco-Synthesized Bimetallic ZnO-CuO Nanoparticles against Fungal Plant Pathogen Fusarium Oxysporum. Biomass Convers. Biorefinery 2023, 14, 25395–25409. [Google Scholar] [CrossRef]
  24. Kamel, S.M.; Elgobashy, S.F.; Omara, R.I.; Derbalah, A.S.; Abdelfatah, M.; El-Shaer, A.; Al-Askar, A.A.; Abdelkhalek, A.; Abd-Elsalam, K.A.; Essa, T.; et al. Antifungal Activity of Copper Oxide Nanoparticles against Root Rot Disease in Cucumber. J. Fungi 2022, 8, 911. [Google Scholar] [CrossRef]
  25. Ahmad, H.; Venugopal, K.; Bhat, A.H.; Kavitha, K.; Ramanan, A.; Rajagopal, K.; Srinivasan, R.; Manikandan, E. Enhanced Biosynthesis Synthesis of Copper Oxide Nanoparticles (CuO-NPs) for Their Antifungal Activity Toxicity against Major Phyto-Pathogens of Apple Orchards. Pharm. Res. 2020, 37, 246. [Google Scholar] [CrossRef]
  26. Faraz, A.; Faizan, M.; Rajput, V.D.; Minkina, T.; Hayat, S.; Faisal, M.; Alatar, A.A.; Abdel-Salam, E.M. CuO Nanoparticle-Mediated Seed Priming Improves Physio-Biochemical and Enzymatic Activities of Brassica Juncea. Plants 2023, 12, 803. [Google Scholar] [CrossRef]
  27. Kadri, O.; Karmous, I.; Kharbech, O.; Arfaoui, H.; Chaoui, A. Cu and CuO Nanoparticles Affected the Germination and the Growth of Barley (Hordeum vulgare L.) Seedling. Bull. Environ. Contam. Toxicol. 2022, 108, 585–593. [Google Scholar] [CrossRef]
  28. Ibrahim, A.S.; Ali, G.A.M.; Hassanein, A.; Attia, A.M.; Marzouk, E.R. Toxicity and Uptake of CuO Nanoparticles: Evaluation of an Emerging Nanofertilizer on Wheat (Triticum aestivum L.) Plant. Sustainability 2022, 14, 4914. [Google Scholar] [CrossRef]
  29. Feigl, G. The Impact of Copper Oxide Nanoparticles on Plant Growth: A Comprehensive Review. J. Plant Interact. 2023, 18, 2243098. [Google Scholar] [CrossRef]
  30. Billah, M.; Karmakar, S.; Mina, F.B.; Haque, M.d.N.; Rashid, M.d.M.; Hasan, M.d.F.; Acharjee, U.K.; Talukder, M.R. Investigation of Mechanisms Involved in Seed Germination Enhancement, Enzymatic Activity and Seedling Growth of Rice (Oryza sativa L.) Using LPDBD (Ar+Air) Plasma. Arch. Biochem. Biophys. 2021, 698, 108726. [Google Scholar] [CrossRef] [PubMed]
  31. Tanakaran, Y.; Matra, K. The Influence of Atmospheric Non-Thermal Plasma on Jasmine Rice Seed Enhancements. J. Plant Growth Regul. 2022, 41, 178–187. [Google Scholar] [CrossRef]
  32. Guragain, R.P.; Baniya, H.B.; Pradhan, S.P.; Pandey, B.P.; Shrestha, B.; Fronczak, M.; Kierzkowska-Pawlak, H.; Subedi, D.P. Growth Enhancement of Radish Seed Induced by Low-Temperature Argon Plasma. Plasma Chem. Plasma Process. 2023, 43, 111–137. [Google Scholar] [CrossRef]
  33. Stetzler, J.; Tang, S.; Chinni, R.C. Plasma Temperature and Electron Density Determination Using Laser-Induced Breakdown Spectroscopy (LIBS) in Earth’s and Mars’s Atmospheres. Atoms 2020, 8, 50. [Google Scholar] [CrossRef]
  34. Wei, Y.; Zhang, J.; Zheng, Q.; Miao, J.; Alvarez, P.J.; Long, M. Quantification of Photocatalytically-Generated Hydrogen Peroxide in the Presence of Organic Electron Donors: Interference and Reliability Considerations. Chemosphere 2021, 279, 130556. [Google Scholar] [CrossRef] [PubMed]
  35. International Seed Testing Association. Detection of Trichoconiella padwickii in Oryza sativa (Rice) Seed (Method 7-012). In International Rules for Seed Testing 2024: Validated Seed Health Testing Methods; International Seed Testing Association: Wallisellen, Switzerland, 2024; pp. 7-012-3–7-012-4. [Google Scholar]
  36. International Seed Testing Association. International Rules for Seed Testing; International Seed Testing Association: Zurich, Switzerland, 2019; p. i-19-8. [Google Scholar] [CrossRef]
  37. Shahin, N.; Islam, M.Z.; Zohura, F.; Mahmud, M.d.N.; Rahman, M.; Biswas, B. Prediction and Standardization of Relative Emergence and Seed Vigour in Rice (Oryza sativa L.) Through Radicle Emergence Analysis. J. Agric. Food Environ. 2022, 3, 39–44. [Google Scholar] [CrossRef]
  38. Falahat, A.; Ganjovi, A.; Taraz, M.; Ravari, M.N.R.; Shahedi, A. Optical Characteristics of a RF DBD Plasma Jet in Various Ar/O2 mixtures. Pramana 2018, 90, 27. [Google Scholar] [CrossRef]
  39. Song, W.S.; Kang, J.E.; Hong, S.J. Spectroscopic Analysis of CF4/O2 Plasma Mixed with N2 for Si3N4 Dry Etching. Coatings 2022, 12, 1064. [Google Scholar] [CrossRef]
  40. Qusnudin, A.; Kusumandari, K.; Saraswati, T.E. OH Radical Intensity of Dielectric Barrier Discharge (DBD) Plasma Measured by Optical Emission Spectroscopy (OES). J. Phys. Conf. Ser. 2021, 1825, 012072. [Google Scholar] [CrossRef]
  41. Yao, S.; Weng, S.; Tang, Y.; Zhao, C.; Wu, Z.; Zhang, X.; Yamamoto, S.; Kodama, S. Characteristics of OH Production by O2/H2O Pulsed Dielectric Barrier Discharge. Vacuum 2016, 126, 16–23. [Google Scholar] [CrossRef]
  42. Laroussi, M.; Lu, X.; Keidar, M. Perspective: The Physics, Diagnostics, and Applications of Atmospheric Pressure Low Temperature Plasma Sources Used in Plasma Medicine. J. Appl. Phys. 2017, 122, 020901. [Google Scholar] [CrossRef]
  43. Khan, T.M.; Khan, S.U.; Raffi, M.; Khan, R. Theoretical–Computational Study of Atmospheric DBD Plasma and Its Utility for Nanoscale Biocompatible Plasmonic Coating. Molecules 2021, 26, 5106. [Google Scholar] [CrossRef]
  44. Wong, K.S.; Chew, N.S.L.; Low, M.; Tan, M.K. Plasma-Activated Water: Physicochemical Properties, Generation Techniques, and Applications. Processes 2023, 11, 2213. [Google Scholar] [CrossRef]
  45. Zambon, Y.; Contaldo, N.; Laurita, R.; Várallyay, E.; Canel, A.; Gherardi, M.; Colombo, V.; Bertaccini, A. Plasma Activated Water Triggers Plant Defence Responses. Sci. Rep. 2020, 10, 19211. [Google Scholar] [CrossRef] [PubMed]
  46. Rodrigues, F.; Pascoa, J.; Trancossi, M. Heat Generation Mechanisms of DBD Plasma Actuators. Exp. Therm. Fluid Sci. 2018, 90, 55–65. [Google Scholar] [CrossRef]
  47. Boonyawan, D. Physics of Plasma; Chiang Mai University, Ed.; Science CMU Printing Service: Chiang Mai, Thailand, 2020; ISBN 974-672-036-8. [Google Scholar]
  48. Holc, M.; Mozetič, M.; Recek, N.; Primc, G.; Vesel, A.; Zaplotnik, R.; Gselman, P. Wettability Increase in Plasma-Treated Agricultural Seeds and Its Relation to Germination Improvement. Agronomy 2021, 11, 1467. [Google Scholar] [CrossRef]
  49. Hoppanová, L.; Medvecká, V.; Dylíková, J.; Hudecová, D.; Kaliňáková, B.; Kryštofová, S.; Zahoranová, A. Low-Temperature Plasma Applications in Chemical Fungicide Treatment Reduction. Acta Chim. Slovaca 2020, 13, 26–33. [Google Scholar] [CrossRef]
  50. Holc, M.; Gselman, P.; Primc, G.; Vesel, A.; Mozetič, M.; Recek, N. Wettability and Water Uptake Improvement in Plasma-Treated Alfalfa Seeds. Agriculture 2022, 12, 96. [Google Scholar] [CrossRef]
  51. Shelar, A.; Singh, A.V.; Dietrich, P.; Maharjan, R.S.; Thissen, A.; Didwal, P.N.; Shinde, M.; Laux, P.; Luch, A.; Mathe, V.; et al. Emerging Cold Plasma Treatment and Machine Learning Prospects for Seed Priming: A Step towards Sustainable Food Production. RSC Adv. 2022, 12, 10467–10488. [Google Scholar] [CrossRef]
  52. Samsatly, J.; Chamoun, R.; Gluck-Thaler, E.; Jabaji, S. Genes of the de Novo and Salvage Biosynthesis Pathways of Vitamin B6 Are Regulated under Oxidative Stress in the Plant Pathogen Rhizoctonia solani. Front. Microbiol. 2016, 6, 1429. [Google Scholar] [CrossRef]
  53. Zakaria, L. An Overview of Aspergillus Species Associated with Plant Diseases. Pathogens 2024, 13, 813. [Google Scholar] [CrossRef]
  54. Datta, S.; Sarkar, M.; Chowdhury, A.; Rakwal, R.; Agrawal, G.K.; Sarkar, A. A Comprehensive Insight into the Biology of Rhizoctonia solani AG1-IA Kühn, the Causal Organism of the Sheath Blight Disease of Rice. J. Plant Pathol. 2022, 104, 79–98. [Google Scholar] [CrossRef]
  55. Senapati, M.; Tiwari, A.; Sharma, N.; Chandra, P.; Bashyal, B.M.; Ellur, R.K.; Bhowmick, P.K.; Bollinedi, H.; Vinod, K.K.; Singh, A.K.; et al. Rhizoctonia solani Kühn Pathophysiology: Status and Prospects of Sheath Blight Disease Management in Rice. Front. Plant Sci. 2022, 13, 881116. [Google Scholar] [CrossRef] [PubMed]
  56. Copley, T.R.; Duggavathi, R.; Jabaji, S. The Transcriptional Landscape of Rhizoctonia solani AG1-IA during Infection of Soybean as Defined by RNA-Seq. PLoS ONE 2017, 12, e0184095. [Google Scholar] [CrossRef] [PubMed]
  57. Bailly, C. Active Oxygen Species and Antioxidants in Seed Biology. Seed Sci. Res. 2004, 14, 93–107. [Google Scholar] [CrossRef]
  58. Wang, W.; Liu, J.; Ren, Y.; Zhang, L.; Xue, Y.; Zhang, L.; He, J. Phytotoxicity Assessment of Copper Oxide Nanoparticles on the Germination, Early Seedling Growth, and Physiological Responses in Oryza sativa L. Bull. Environ. Contam. Toxicol. 2020, 104, 770–777. [Google Scholar] [CrossRef]
  59. Shaw, A.K.; Hossain, Z. Impact of Nano-CuO Stress on Rice (Oryza sativa L.) Seedlings. Chemosphere 2013, 93, 906–915. [Google Scholar] [CrossRef]
  60. Yang, Z.; Xiao, Y.; Jiao, T.; Zhang, Y.; Chen, J.; Gao, Y. Effects of Copper Oxide Nanoparticles on the Growth of Rice (Oryza sativa L.) Seedlings and the Relevant Physiological Responses. Int. J. Environ. Res. Public Health 2020, 17, 1260. [Google Scholar] [CrossRef] [PubMed]
  61. Tahir, A.; Afzal, I.; Khalid, E.; Razzaq, M.; Arif, M.A.R. Rice Seed Longevity in the Context of Seed Moisture Contents and Hypoxic Conditions in the Storage Environment. Seed Sci. Res. 2023, 33, 39–49. [Google Scholar] [CrossRef]
  62. Zheng, X.; Yuan, Z.; Yu, Y.; Yu, S.; He, H. OsCSD2 and OsCSD3 Enhance Seed Storability by Modulating Antioxidant Enzymes and Abscisic Acid in Rice. Plants 2024, 13, 310. [Google Scholar] [CrossRef]
  63. Mildaziene, V.; Ivankov, A.; Sera, B.; Baniulis, D. Biochemical and Physiological Plant Processes Affected by Seed Treatment with Non-Thermal Plasma. Plants 2022, 11, 856. [Google Scholar] [CrossRef]
  64. Recek, N.; Holc, M.; Vesel, A.; Zaplotnik, R.; Gselman, P.; Mozetič, M.; Primc, G. Germination of Phaseolus vulgaris L. Seeds after a Short Treatment with a Powerful RF Plasma. Int. J. Mol. Sci. 2021, 22, 6672. [Google Scholar] [CrossRef]
  65. Arif, N.; Yadav, V.; Singh, S.; Tripathi, D.K.; Dubey, N.K.; Chauhan, D.K.; Giorgetti, L. Chapter 13—Interaction of Copper Oxide Nanoparticles with Plants: Uptake, Accumulation, and Toxicity. In Nanomaterials in Plants, Algae, and Microorganisms; Tripathi, D.K., Ahmad, P., Sharma, S., Chauhan, D.K., Dubey, N.K., Eds.; Academic Press: Cambridge, MA, USA, 2018; pp. 297–310. ISBN 978-0-12-811487-2. [Google Scholar]
Figure 1. Diagram of Dielectric Barrier Discharge plasma.
Agriculture 15 02280 g001
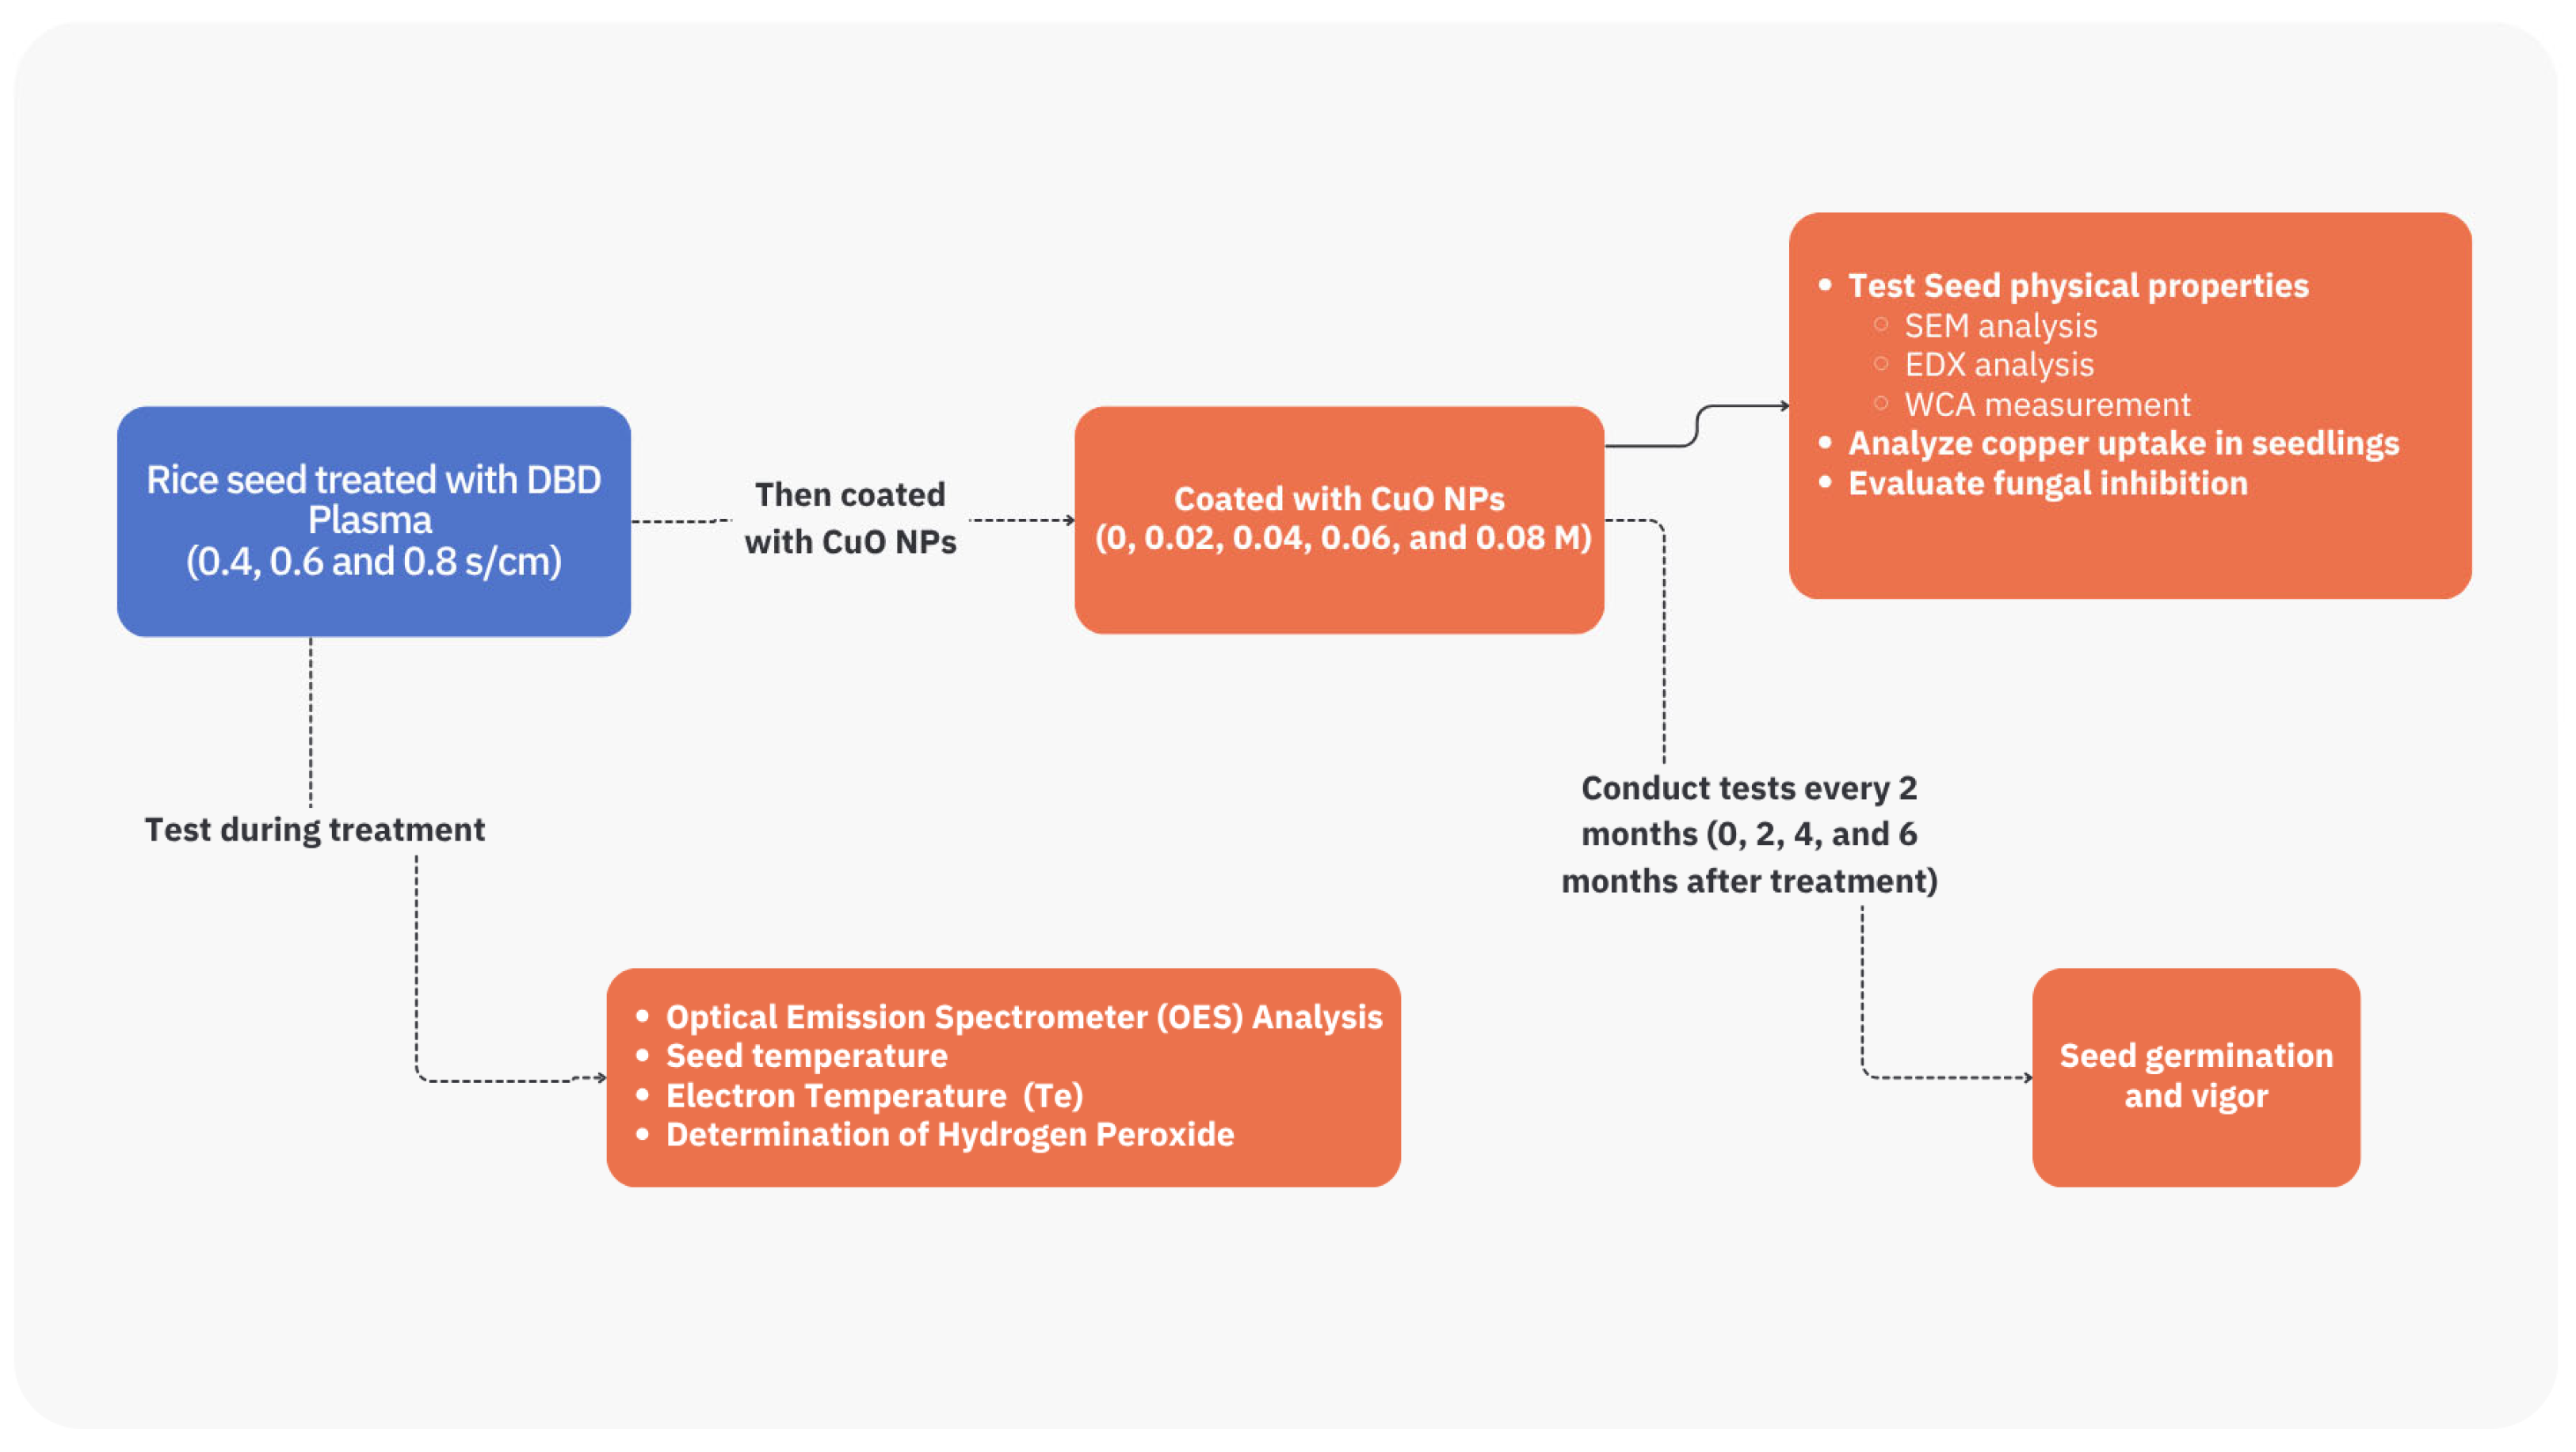
Figure 2. Experimental procedure flowchart.
Agriculture 15 02280 g002
Figure 3. DBD plasma is measured by an Optical Emission Spectrometer (OES).
Agriculture 15 02280 g003
Figure 4. Boltzmann plot of l n ( I λ / g A ) versus excitation energy E (eV) derived from optical emission spectra of the DBD plasma.
Agriculture 15 02280 g004
Figure 5. (A) Temperature image from a thermal camera and the characteristics of the temperature measurement points, (B) the temperature of the seeds after plasma treatment. Different letters indicate significant differences among treatments at p < 0.05.
Agriculture 15 02280 g005
Figure 6. SEM images showing the corrosion characteristics of plasma on rice seed husks at different seed conveying rate through the plasma: (AC) untreated seed; (DF) S0.4; (GI) S0.6; (JL) S0.8, observed at ×600, ×1500, and ×3000 magnifications, respectively.
Agriculture 15 02280 g006
Figure 7. EDX mapping images showing the distribution of Cu signals on cross-sectioned rice seeds treated with CuO nanoparticles (CuO NPs) at different concentrations and seed conveying rates through the plasma: (AC) 0.02 M CuO NPs; (DF) 0.04 M; (GI) 0.06 M; (JL) 0.08 M for S0.4, S0.6, and S0.8, respectively.
Agriculture 15 02280 g007
Figure 8. WCA values of rice seeds; (A) comparison among seed conveying rate through the plasma factors; (B) comparison among CuO NPs concentration factors. Different letters indicate significant differences among treatments at p < 0.05.
Agriculture 15 02280 g008
Figure 9. Copper content in rice seedlings was measured by AAS. (A) Comparison among plasma permeability factors; (B) comparison among CuO NP concentration factors; (C) comparison of the interaction between the two factors. Different letters indicate significant differences among treatments at p < 0.05.
Agriculture 15 02280 g009
Figure 10. The percentage of seed infection was compared in groups of plasma passage speed factors (A) and groups of CuO NPs concentration factor (B). Different letters indicate significant differences among treatments at p < 0.05.
Agriculture 15 02280 g010
Figure 11. Effects of storage duration (0–6 months) on radicle emergence (RE), germination (G), and germination index (GI) of seeds. Different letters indicate significant differences among treatments at p < 0.05. (Radicle emergence (%) and germination (%) (Unit 1); germination index (Unit 2)).
Agriculture 15 02280 g011
Figure 12. Shoot and root lengths of seedlings at 7 and 14 days after testing from seeds stored for 0 to 6 months. Different letters indicate significant differences among treatments at p < 0.05.
Agriculture 15 02280 g012
Figure 13. Shoot, root, and total dry weights of seedlings grown from seeds stored for 0 to 6 months. Different letters indicate significant differences among treatments at p < 0.05.
Agriculture 15 02280 g013
Figure 14. Radicle emergence (RE) and germination index (GI) of seeds treated with plasma at different exposure durations. Different letters indicate significant differences among treatments at p < 0.05.
Agriculture 15 02280 g014
Figure 15. Shoot length of seedlings at 7 days after testing from seeds treated with plasma at different exposure durations. Different letters indicate significant differences among treatments at p < 0.05.
Agriculture 15 02280 g015
Figure 16. Effects of CuO NPs treatments at different concentrations on radicle emergence, germination, and the germination index of seeds. Different letters indicate significant differences among treatments at p < 0.05. (Radicle emergence (%) and germination (%) (Unit 1); germination index (Unit 2)).
Agriculture 15 02280 g016
Figure 17. Shoot lengths at 7 and 14 days after testing and total dry weight of seedlings grown from seeds treated with different concentrations of the CuO nanoparticles. Different letters indicate significant differences among treatments at p < 0.05.
Agriculture 15 02280 g017
Table 1. Quantification of hydrogen peroxide (H2O2) in plasma-activated water (PAW) by acidic KMnO4 titration method.
Treatment No. C K M n O 4
(M)
V K M n O 4
(mL)
V b l a n k
(mL)
V K M n O 4 V b l a n k
(mL)
V s a m p l e
(mL)
C H 2 O 2
(mg L−1)
10.00050.500.1670.33201.36
20.00050.550.1670.38201.56
30.00050.500.1670.33201.36
Mean ± SD 0.35 ± 0.03 1.49 ± 0.12
Table 2. The table shows the %mass values of copper measured by EDX-Mapping in the proportion of C, O, Si, and Cu.
Concentration/Speed0.4 s/cm.0.6 s/cm.0.8 s/cm.
0 MNANANA
0.02 M 0.04   ± 0.02 0.04   ± 0.02 0.03   ± 0.03
0.04 M 0.03   ± 0.05 0.08   ± 0.03 0.09   ± 0.03
0.06 M 0.04   ± 0.03 0.07   ± 0.03 0.07   ± 0.03
0.08 M 0.09   ± 0.02 0.08   ± 0.02 0.09   ± 0.02
Table 3. ANOVA of seed quality based on split-split plot in RCBD.
SOVdfREGGISL7RL7SL14RL14
Rep247.36 *5.640.050.060.582.420.43
Storage (A)31052.44 *354.32 *30.09 *28.87 *112.20 *33.00 *129.48 *
Whole-plot Error612.3915.670.190.180.490.600.43
Seed conveying rate through the plasma (B)333.45 *36.151.57 *1.53 *2.240.944.83
A × B978.91 *25.180.74 *0.271.260.333.95
Sub-plot Error2410.6013.170.240.311.201.202.96
Concentration (C)4134.87 *74.48 *3.67 *0.83 *1.725.35 *2.39
C × A1263.87 *18.950.360.62 *1.091.251.71
C × B877.47 *9.960.120.480.581.432.60
C × A × B2459.23 *22.690.64 *0.56 *1.180.991.78
Sub-sub-plot Error9612.6413.920.240.291.130.992.64
* = Indicates a significant difference among treatments at p < 0.05.
Table 4. ANOVA of seedling dry weight based on split-split plot in RCBD.
SOVdfSWRWTDW
Rep20.090.010.14
Storage (A)35.93 *2.20 *8.86 *
Whole-plot Error60.080.070.18
Seed conveying rate through the plasma (B)30.190.210.72
A × B90.120.130.36
Sub-plot Error240.190.110.31
Concentration (C)40.440.31 *1.16 *
C × A120.150.210.52
C × B80.290.140.62
C × A × B240.280.150.44
Sub-sub-plot Error960.200.110.40
* = Indicates a significant difference among treatments at p < 0.05.
Disclaimer/Publisher’s Note: The statements, opinions and data contained in all publications are solely those of the individual author(s) and contributor(s) and not of MDPI and/or the editor(s). MDPI and/or the editor(s) disclaim responsibility for any injury to people or property resulting from any ideas, methods, instructions or products referred to in the content.