Article

Erosion Assessment by a Fast and Low-Cost Procedure in a Vineyard Under Different Soil Management

1
CREA—Consiglio per la Ricerca in Agricoltura e l’Analisi dell’Economia Agraria, Centro di Ricerca Agricoltura e Ambiente (CREA-AA), Via di Lanciola 12A, 50125 Firenze, Italy
2
CREA—Consiglio per la Ricerca in Agricoltura e l’Analisi dell’Economia Agraria, Centro di Ricerca Agricoltura e Ambiente (CREA-AA), Laboratorio di Gelsibachicoltura, Via Leonardo Eulero 6A, 35143 Padova, Italy
*
Author to whom correspondence should be addressed.
Agriculture 2025, 15(21), 2218; https://doi.org/10.3390/agriculture15212218
Submission received: 11 September 2025 / Revised: 15 October 2025 / Accepted: 21 October 2025 / Published: 24 October 2025
(This article belongs to the Special Issue Effects of Different Managements on Soil Quality and Crop Production)

Abstract

Soil erosion in vineyards is a major environmental problem, particularly in hilly Mediterranean environments. Our study evaluated the effectiveness of permanent grass cover (PG), continuous tillage (CT), and green manure (GM) in reducing soil erosion. Furthermore, a new software tool (ISUMmate_1.1.xlsm), based on the improved stock unearthing method (ISUM), was developed and tested to quantify soil mobilization between successive transects along vineyard inter-row. The field trial was carried out over a three-year period in a Tuscany (Italy) vineyard. The results showed that PG significantly improved aggregate stability and soil organic carbon (SOC) content, while exhibiting the lowest erosion rates. In contrast, GM showed the highest erosion rates as a result of soil disturbance associated with cultivation operations and the occurrence of unexpected intense rainfalls. ISUMmate_1.1 has proven to be a reliable tool for monitoring both water- and tillage-induced erosion, providing valuable information for sustainable vineyard management.

1. Introduction

Erosion is one of the major forms of soil degradation in Europe. According to Panagos et al. [1] and to the EUSO Soil Degradation Dashboard (https://esdac.jrc.ec.europa.eu/euso/euso-dashboard, URL accessed on 2 October 2025), it is estimated that, in 2015, 37.4% of European agricultural areas had a mean annual water erosion value exceeding the critical threshold of 2 Mg ha−1 yr−1. The percentage of such areas is even higher in Mediterranean countries, which are particularly vulnerable due to their unique topographic, edaphic, and climatic characteristics (e.g., 53.7%, 49.0%, and 44.4% in Italy, Greece, and Spain, respectively). Among the agricultural ecosystems most prone to erosion are vineyards [2], widely distributed in hilly environments and often characterized by soils evolved from fine-textured marine sediments [3], where their intrinsic susceptibility to erosion is made even more severe by compaction and the loss of organic matter induced by heavy mechanization and improper soil management systems [4,5]. Furthermore, the ongoing issue of climate change is expected to increase the frequency of intense rainfall events [6,7]. Consequently, in Europe rainfall erosivity is estimated to increase by 18% in 2050 [8].
Tillage breaks down soil aggregates, reducing aggregate stability and increasing susceptibility to detachment via raindrop impact and runoff. This structural degradation accelerates erosion processes, particularly under high-intensity rainfall events [9]. In particular, conventional tillage by ploughing typically incorporates or removes crop residues, leaving the soil surface bare. The absence of protective cover enhances raindrop impact, leading to surface sealing, reduced infiltration, and increased runoff [10]. Moreover, tillage itself redistributes soil along slopes. Downslope soil movement during repeated tillage operations results in net soil loss from convex positions and accumulation in concave areas, a process termed tillage erosion. In some landscapes, tillage erosion can exceed water erosion rates [11]. Proper management of the vineyard floor can significantly reduce soil erosion susceptibility [12]. The use of cover crops is unanimously considered the most attractive strategy, due to the multiple benefits it can provide, beyond erosion control, under a sustainable management perspective [13,14]. Vegetation cover reduces the impact energy of rainfall and the speed of surface runoff, while roots help to stabilize the soil structure against erosive forces. Moreover, cover crop residues promote the accumulation of organic matter in the surface layers, which in turns enhances biological activity, increases porosity, and improves soil aggregate stability [15]. Hence, to evaluate the effect of management on erosion susceptibility, the following two key soil properties can be monitored: aggregate stability and soil organic carbon (SOC) content. These properties are closely related to good soil structure conditions [16] and play a crucial role in counteracting erosion processes [17,18,19].
Several studies in Italy and in Mediterranean countries have highlighted a significant reduction in erosion rates in vineyards with cover crops [20,21,22,23,24]. However, in the Mediterranean region, winegrowers are reluctant to use permanent cover crops due to possible water and nutrient competition with the vine [25], and tend to favour the use of temporary cover crops [26].
In vineyards and tree crops in general, green manure can be an alternative to permanent cover crops, helping to maintain or restore soil health. To maximize the benefits of this management technique, however, a careful choice of green manure species and correct agronomic management is needed [27,28].
Quantifying soil erosion at the scale of single vineyard is essential to provide winemakers with information necessary to evaluate the effectiveness of different soil management practices. Several methods have been developed to determine soil loss, ranging from field-based measures (e.g., sediment collection, erosion pins, and rill and gully measurement) to indirect measurement approaches (e.g., modelling, remote sensing and GIS, topographic analysis, tracer techniques, terrestrial laser scanning, and photogrammetry). Each method has its advantages and limitations, and the choice depends on the scale, accuracy, resources and data availability, and on the purpose of the assessment. On the field scale, when the effect of different management practices on all forms of erosion must be evaluated, the quantification of soil loss by measurements in experimental plots seems to provide more accurate results [29,30].
Remote sensing technologies enable non-invasive erosion monitoring by capturing topographical variations [31]. Among the most common is Terrestrial Laser Scanning (TLS), which generates high-density 3D point clouds using laser pulses [32]. It is widely used and considered a benchmark for accuracy, but its high cost limits its use [33]. Another available technology is the 3D reconstruction from images; based on Structure-from-Motion (SfM) photogrammetry, it reconstructs 3D models from overlapping images without the need for calibration or control points [34]. It is inexpensive and versatile, but its accuracy has only been evaluated in the laboratory, not in the field [35].
TLS and SfM perform differently, and their comparison is crucial for finding cheaper alternatives to TLS via studies aimed to evaluate the accuracy of SfM in real-world conditions and compare it with TLS, as performed by Gao et al. [36] who conducted runoff experiments on slopes of the Loess Plateau (China).
In this context, the Improved Stock Unearthing Method (ISUM) has been successfully employed in vineyards to quantify soil mobilization [37]. ISUM allows the monitoring of soil surface dynamics over time without using expensive measurement stations that monitor soil loss through specific sensors or apparatus [38]. The basic principle, developed by Brenot et al. [39], is to use the vine grafting point as a reference to measure the changes in the soil surface level, under the assumption that, at planting, it was uniformly placed 2 cm above the soil surface. The main disadvantage of this method is that it requires a large number of manual measurements, which must be taken with great precision and organized rigorously in order to cover, without errors, a sufficiently representative surface. It is therefore a repetitive task that can become very tedious. The data processing phase, although based on elementary geometric concepts, is also rather delicate, as it requires structuring several data series in a very specific way, accurately modelling the terrain surface, and performing many calculations in sequence. For this series of reasons the procedure is prone to errors, and so a software tool (ISUMmate_1.1.xlsm, https://github.com/SUVISA-project/ISUMmate, URL accessed on 4 October 2025) was conceived and developed with a triple function, which is as follows: (i) to simplify for the user the implementation of the method, starting from the field measurement phase, through an intuitive and self-guided interface; (ii) to help the user correctly structure the measurements, minimizing the probability of error; and (iii) to accurately model the terrain and perform the estimation of erosion and deposition volumes, as well as the derived quantities.
ISUMmate_1.1 was tested in a real-world context by quantifying soil erosion and deposition in a vineyard under different inter-row management systems, including Continuous Tillage (CT), Permanent Grass cover (PG), and Green Manure (GM). The objectives of this study were as follows: (i) to evaluate the effect of different inter-row management systems on soil erosion susceptibility, (ii) to quantify soil mobilization using the ISUMmate_1.1.xlsm application, and (iii) to assess the potentiality of ISUMmate_1.1.

2. Materials and Methods

2.1. Study Site

The study area is located in Tuscany (central Italy; 43°24′ N; 11°37′ E), at the Barone Ricasoli farm, inside the Chianti Classico wine district. The vineyard, planted in 2005 at an altitude of 440 m asl, covers about 4.5 ha; it is approximately 100 m long and placed on a hilly area with an arrangement of downslope rows and an average slope of 19%. The vineyard, with a planting space of 0.75 × 2.00 m, is managed with the cordon spur training system. The soil, classified as Skeletic Calcaric Cambisol (Loamic), is characterized by an Ap horizon (0–25 cm) with clay loam texture, low SOC content (0.85%), frequent (3–15%) skeletal and abundant (15–50%) medium- to large-sized (7.5–50 mm diameter) stones on the ground surface [40]. During the years preceding the trial (from 2005 to 2019), the vineyard had been managed according to the ordinary farm management system, which organized CT and PG in alternate rows, with treatments reversed every four years (Figure 1).
At the end of 2019 and before the start of the trial, the whole vineyard soil was tilled to 0.30–0.35 m depth by a subsoiler with hydraulic adjustment and roller. Subsequently, vineyard management was differentiated into the following three types: (I) CT, consisting of subsoiling across all inter-rows; (II) PG on all inter-rows; and (III) GM, consisting of alternating green manure and grass-covered inter-rows. Each treatment was assigned to a single experimental plot consisting of five inter-rows, one of which was selected as sub-unit for field surveys and the monitoring of soil properties. In particular, CT and PG were investigated in inter-rows that had already received these treatments before the experiment, to obtain information on a longer temporal scale. In contrast, GM (never used before in this area) was investigated in a previously tilled inter-row. This means that at the start of the trial, the CT and GM soils were in the same conditions. The botanical composition of the cover crops was provided by the farm (Table 1). The PG cover was established using a mix of three self-reseeding species, two from Poaceae (67%) and one from Fabaceae (33%), with the aim to ensure over-time stability to the cover. Both Lolium perenne and Festuca rubra are well known to provide a high rate of establishment and regrowth after cuttings, not only from seeds, but also through the production of new stems from buds at the base of the plants. This ability also characterizes Trifolium subterraneum and allows the winemaker to cut the grass even before the seeds ripen, as is often performed to prevent excessive grass growth coinciding with the vegetative restart of the vines. For GM, the goal of the farm was mainly the improvement in soil fertility in terms of nitrogen content, and then the enhancement of the soil structure; for these reasons, a mix of seven annual-sown species was used, including three from Fabaceae (66%), two from Poaceae (28%), and two from Brassicaceae (6%).
Due to prolonged weather conditions that were unfavourable for field operations (Table 2) and later no longer suitable for a successful seed germination, the first sowing of cover crops (the only one for permanent grass cover) needed to be postponed to the end of February 2020. The choice of sowing date also had to combine experimental needs with ordinary vineyard management priorities, as often happens in experiments conducted on real farms.
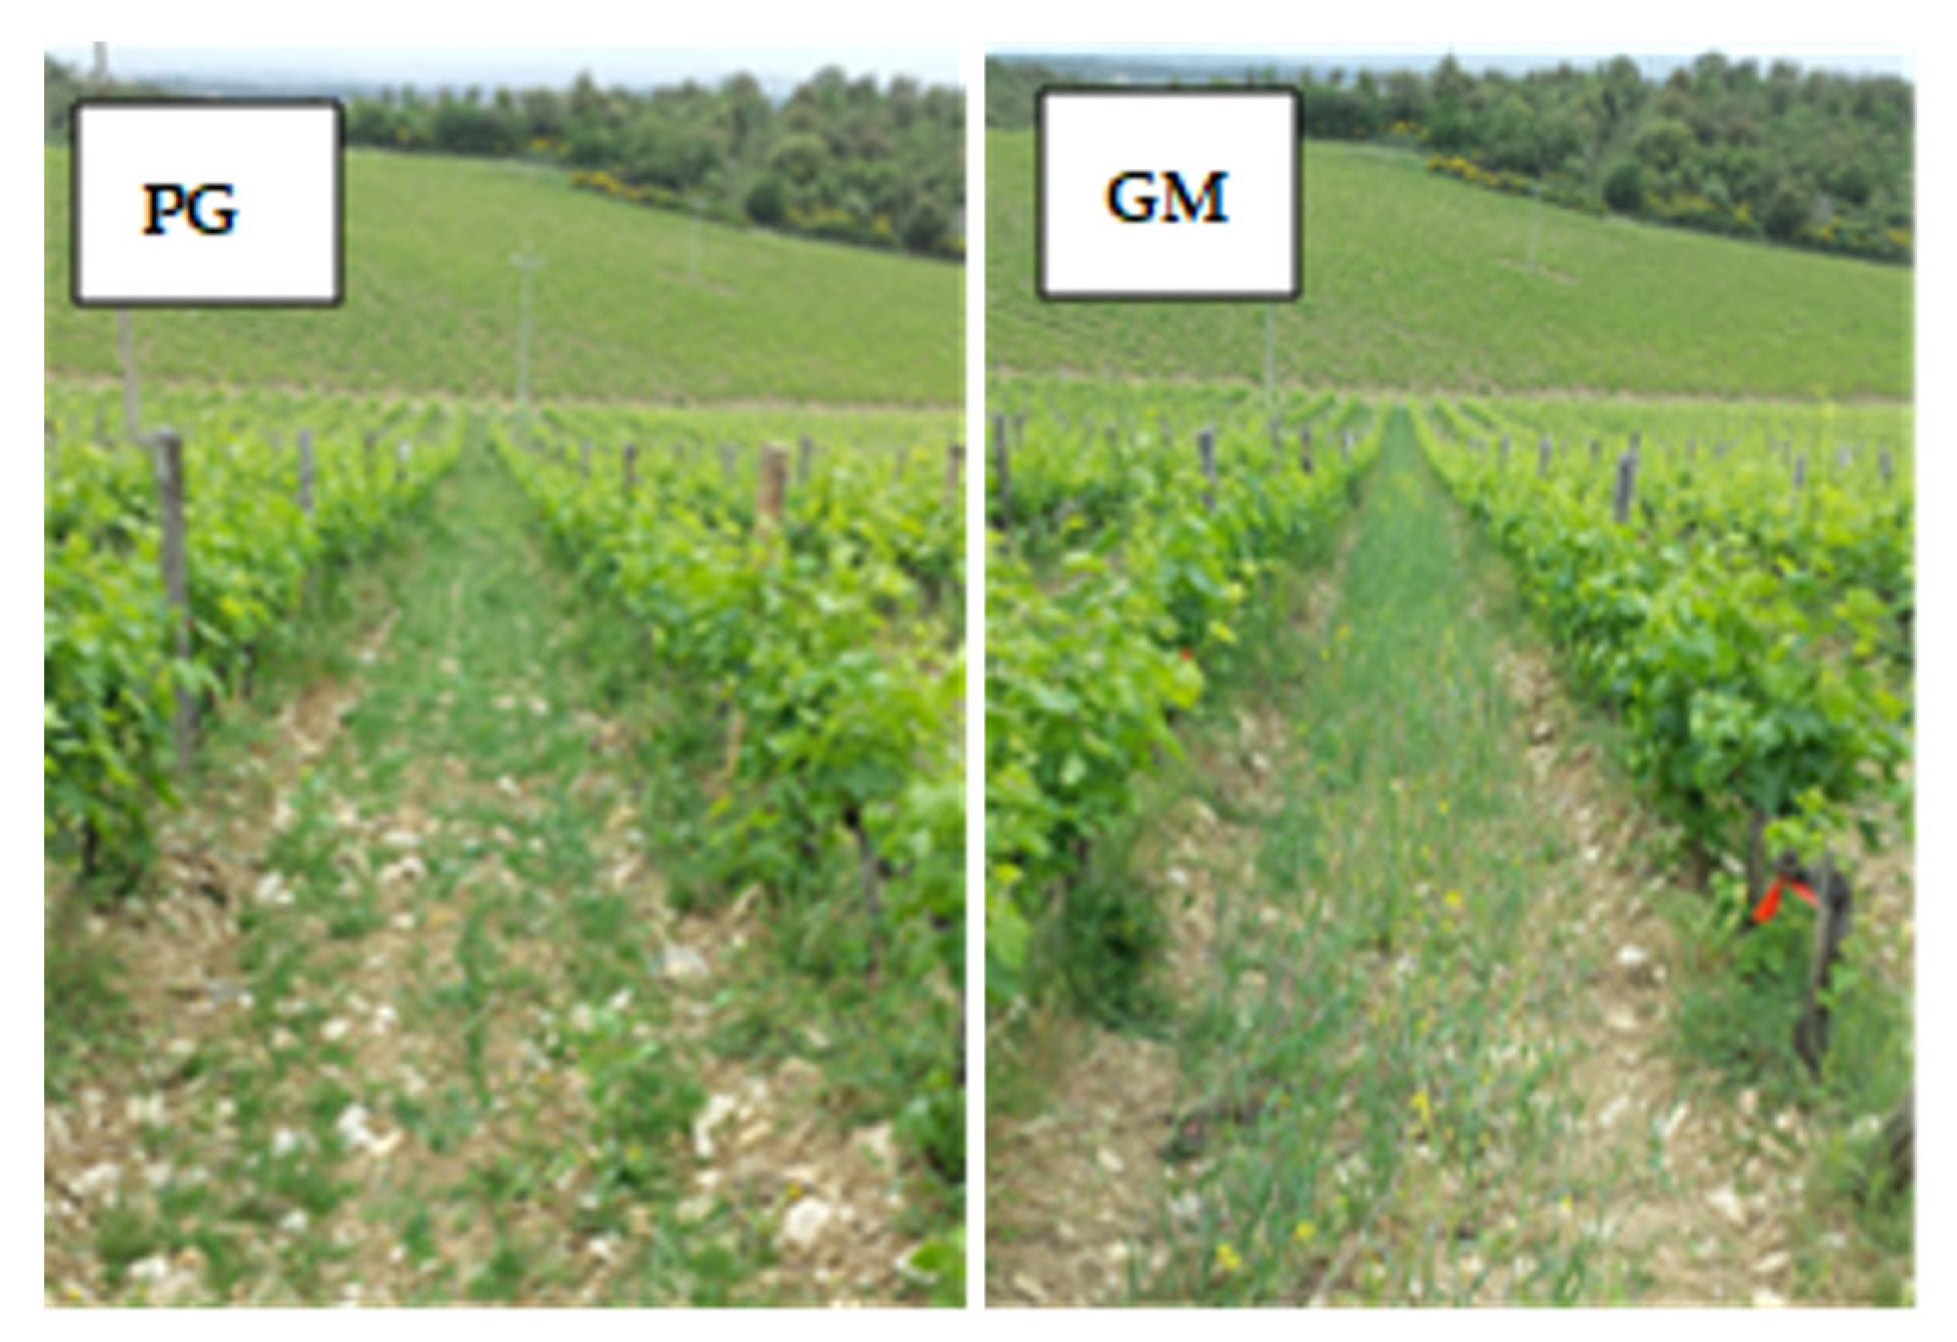
While, on the one hand, this delay precluded a full crop cycle, on the other hand, it allowed for at least some degree of soil coverage (Figure A1). In this regard, although the selected PG and GM species are typically sown in the fall, they also adapt well to early spring sowing.
Annually, the differently managed inter-rows were treated by the following operations: (CT) two ripping at 0.30–0.35 m depth, one in late spring–summer and one after harvest; (GM) burying of green manure crop in May by ripping at 0.30–0.35 m depth; crop reseeding in autumn, through a preliminary ripping at 0.30–0.35 m for seedbed preparation, followed by sowing (160 kg seeds/ha−1) with a pneumatic seeder combined with a rotary harrow (0.15 m depth); and (PG) one or two cuttings of the permanent grass, the first in May, the second in summer, with the cut grass left on the ground as mulch. In all vineyard plots, weed control was carried out mechanically using a disc cultivator to till the soil (0.10 m depth) along the rows.

2.2. Soil Sampling and Analyses

During the trial period, soil samplings were carried out every year at the end of summer, with the aim to monitor aggregate stability and SOC content. The aggregate stability was determined by wet sieving [42], and the mean weight diameter (MWD) was calculated. From each sampling point, soil aggregates were collected down to 0.1 m depth, air dried, weighted, and separated into different-sized fractions (10–20, 4.75–10, 2–4.75, 1–2, <1 mm) by a vibrating sieve shaker (Retsch, Verder Company, Düsseldorf, Germany). Twenty grams of aggregates from the most abundant size class (4.75–10 mm) were directly soaked for 5 min on the top of a nest of 4.75, 2, 0.25, and 0.05 mm diameter sieves immersed in water (fast wetting). We preferred this wetting procedure instead of capillary rise because, according to Legout et al. [43], it should effectively mimic the breakdown mechanisms that aggregates experience under high intensity (>30 mm h−1) rainfalls events. The nest of sieves with its content was then vertically shaken in water for 10 min using an electronic-controlled machine with a stroke of 40 mm, at a rate of 30 complete oscillations per min.
Soil sampling for SOC analysis was performed using an auger, from the 0–0.30 m layer. For each sampling point, a single composite sample was obtained from three spaced sub-samples pooled together. The samples were air-dried and ground to 2 mm, then the 30 g sub-samples were homogenized to <0.5 mm using a Fritsch Pulverisette ball mill (Fritsch, Idar-Oberstein, Germany). SOC content was measured via dry combustion with a Thermo Flash 2000 analyzer (Thermo Fisher, Waltham, MA, USA). Since the soil was calcareous, 15 to 20 mg of soil were weighed into Ag-foil capsules to be treated with 10% HCl until complete removal of carbonates before analysis.

2.3. Soil Surface Survey

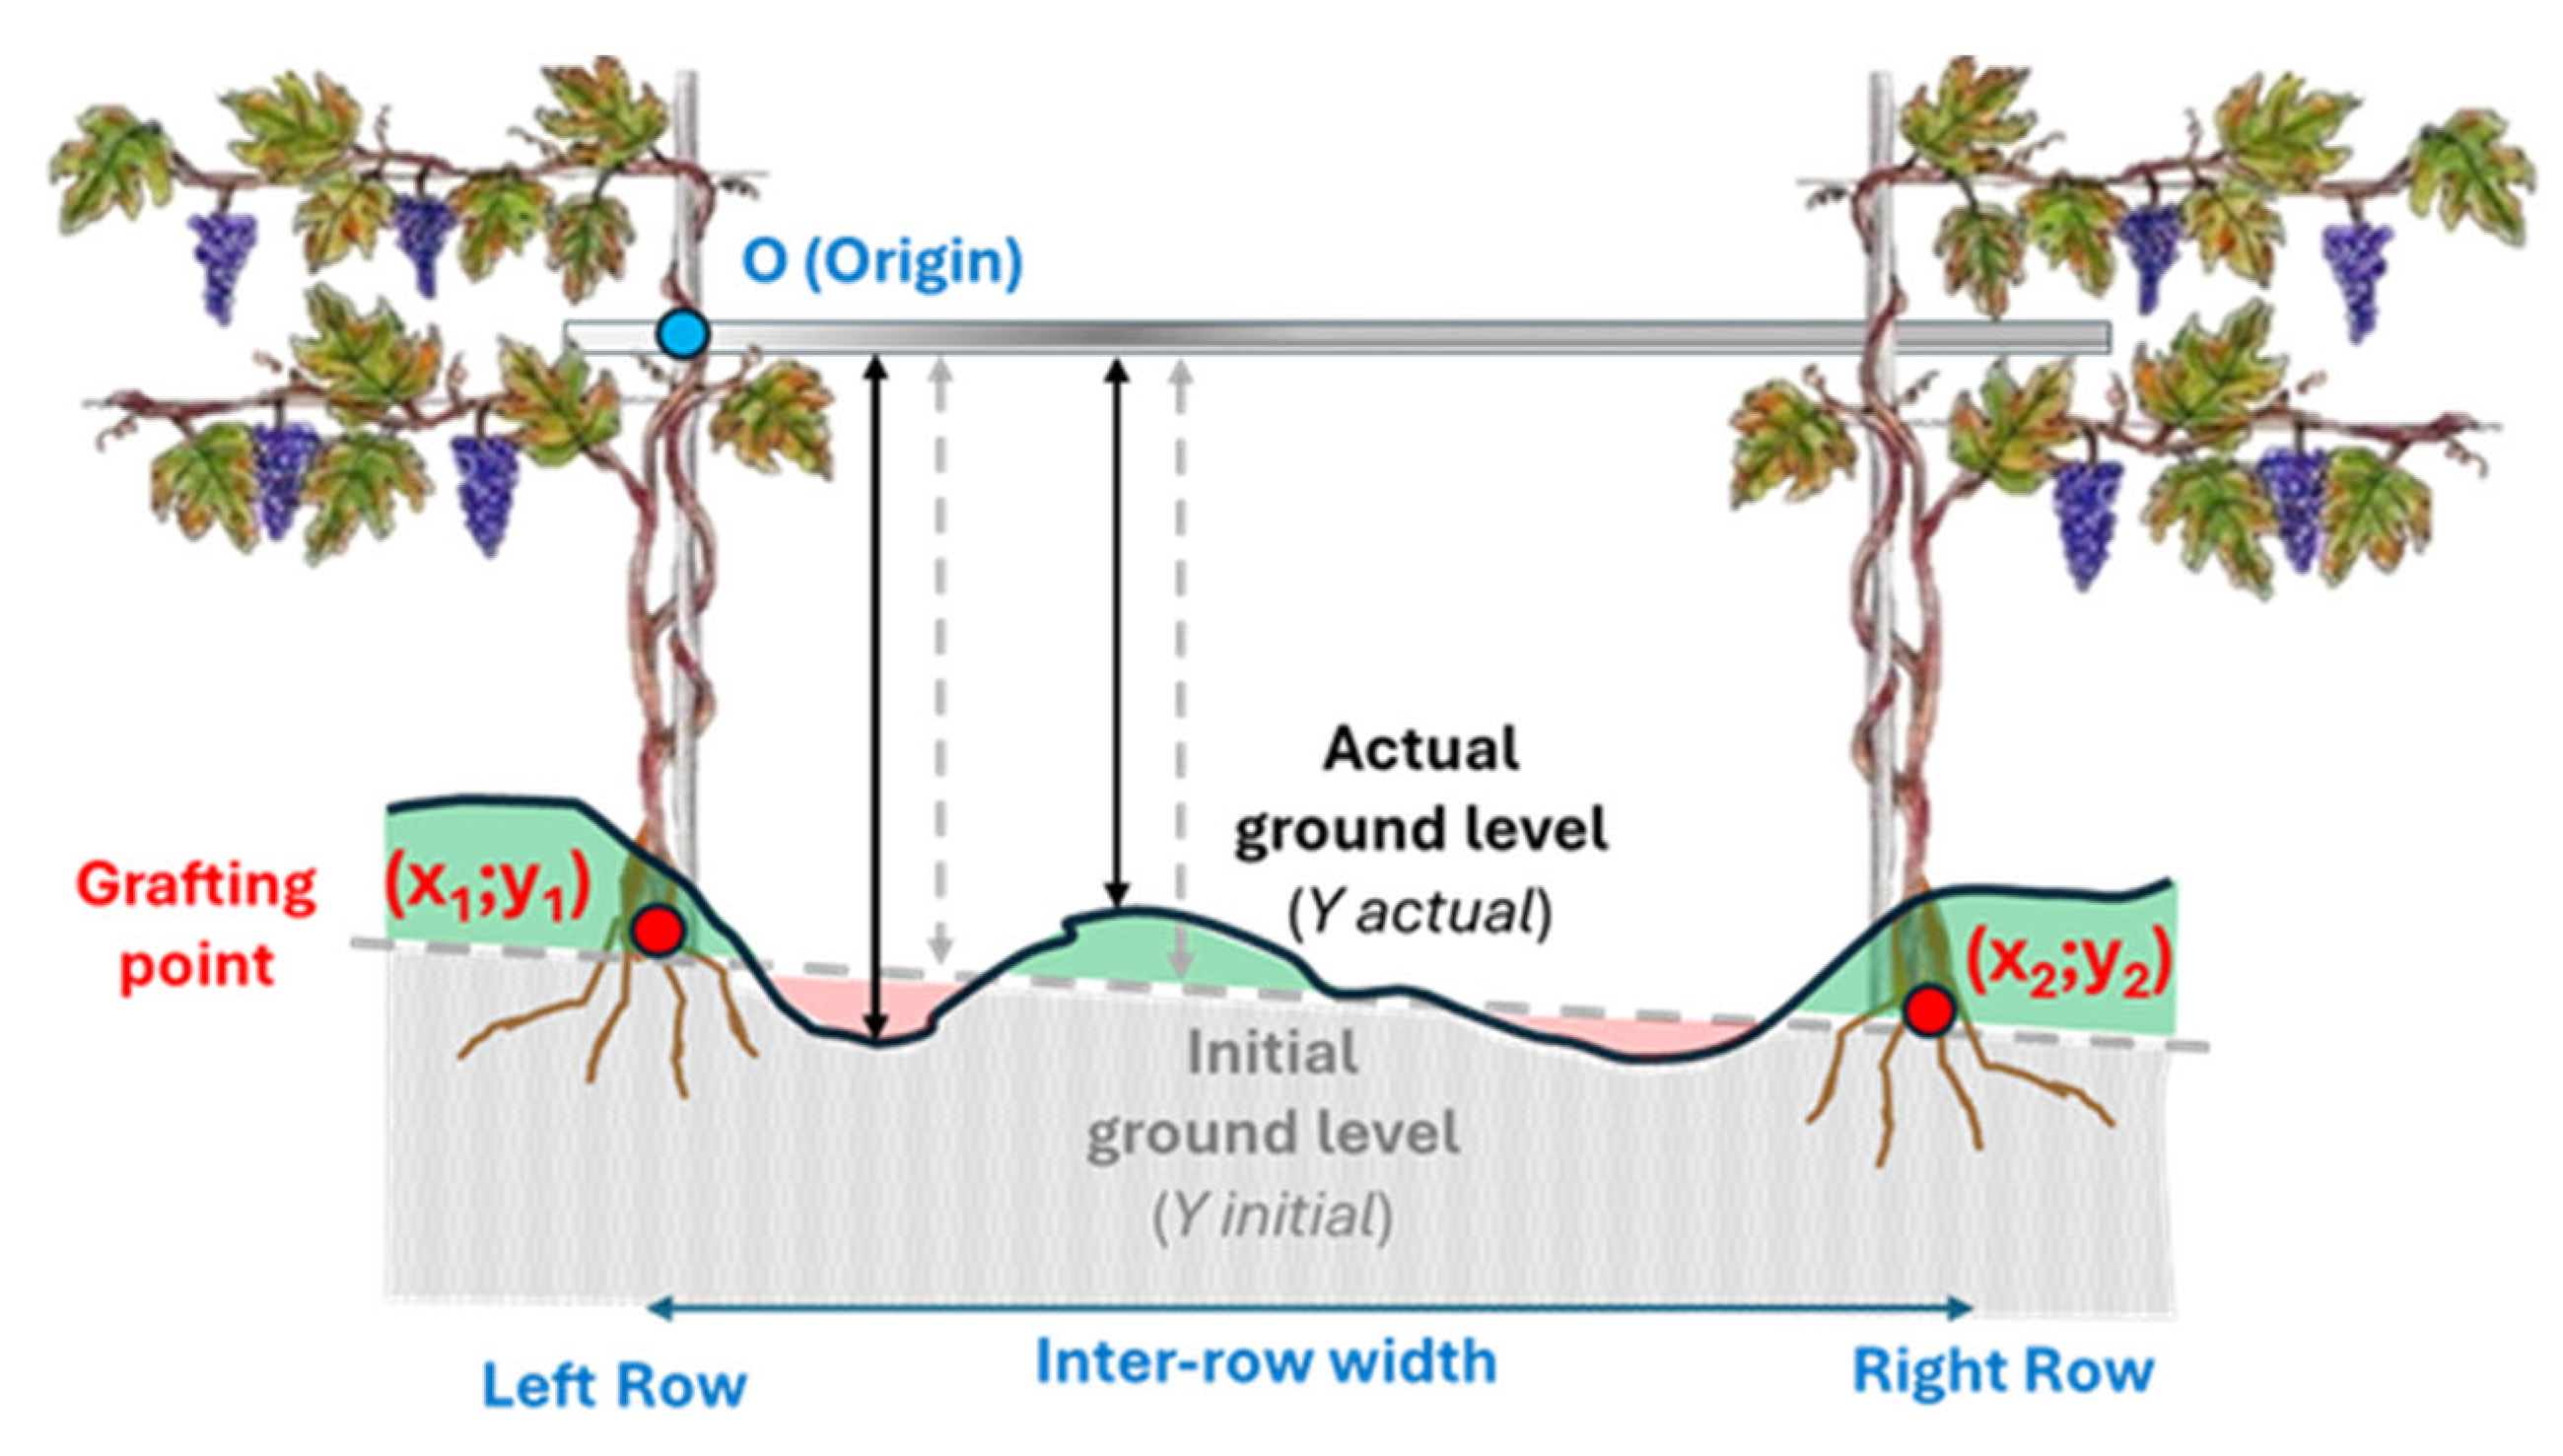
The original ISUM was modified by replacing the string, stretched between the grafting points of two vines placed on opposite sides of a transect, with a rigid telescopic rod graduated at 10 cm intervals. The rod was anchored on the top of the vineyard’s supporting frame at about 0.5 m from the actual ground level (Figure 2). This allowed repeatable measurements over time, since information relating to the position of the transect along the row, the positioning of the rod (e.g., upstream/downstream position of the rod with respect to the pole), and the presence of vine shoots between the rod and wire were simultaneously recorded. Moreover, the distance of the grafting point from the wire was measured to identify the original soil profile elevation along the transect (Figure 2, dashed line). To this aim, a telemeter (METRICA© S.p.A., Milano, Italy) with millimetric resolution (±2 mm) was employed to measure the ground level on each transect. Once all the data on the reference position of the rod and the rootstock were acquired, during the subsequent field surveys only the distances between the rod and the actual ground level (Figure 2, solid line) were collected; these distances were measured at 10 cm intervals along the rod, as suggested by Rodrigo-Comino et al. [44], from the origin (O) on the left row to the right row (Figure 2).
Two survey campaigns were carried out in October 2020 and 2022. On each date, 11 transects were measured, spaced about 10 m apart. For each management (CT, GM, and CT) and over a surface of nearly 217 m2, the overall number of measurements amounted to 231 points, obtained from 21 points per transect × 11 transects. This density corresponds to approximately 10,000 measurements per hectare.

2.4. Data Elaboration with ISUMmate_1.1

(a)
Calculation of the cross-sectional area
A 2D cross-sectional model of the initial topsoil and actual ground level at each transect was first created using a coordinate system with its origin at O (Figure 2). The initial soil profile was represented by a linear function Y(x) passing through the grafting points, (x1, y1) and (x2, y2) (Equation (1)), as follows:
Y i n i t i a l = y 1 + y 2 y 1 x 2 x 1 x x 1
The actual ground level (Yactual, m) was modelled by fitting data points with a 9th degree polynomial function (Equation (2)), as follows:
Y a c t u a l = c 0 + c 1 x +   c 2 x 2 +   + c 9 x 9
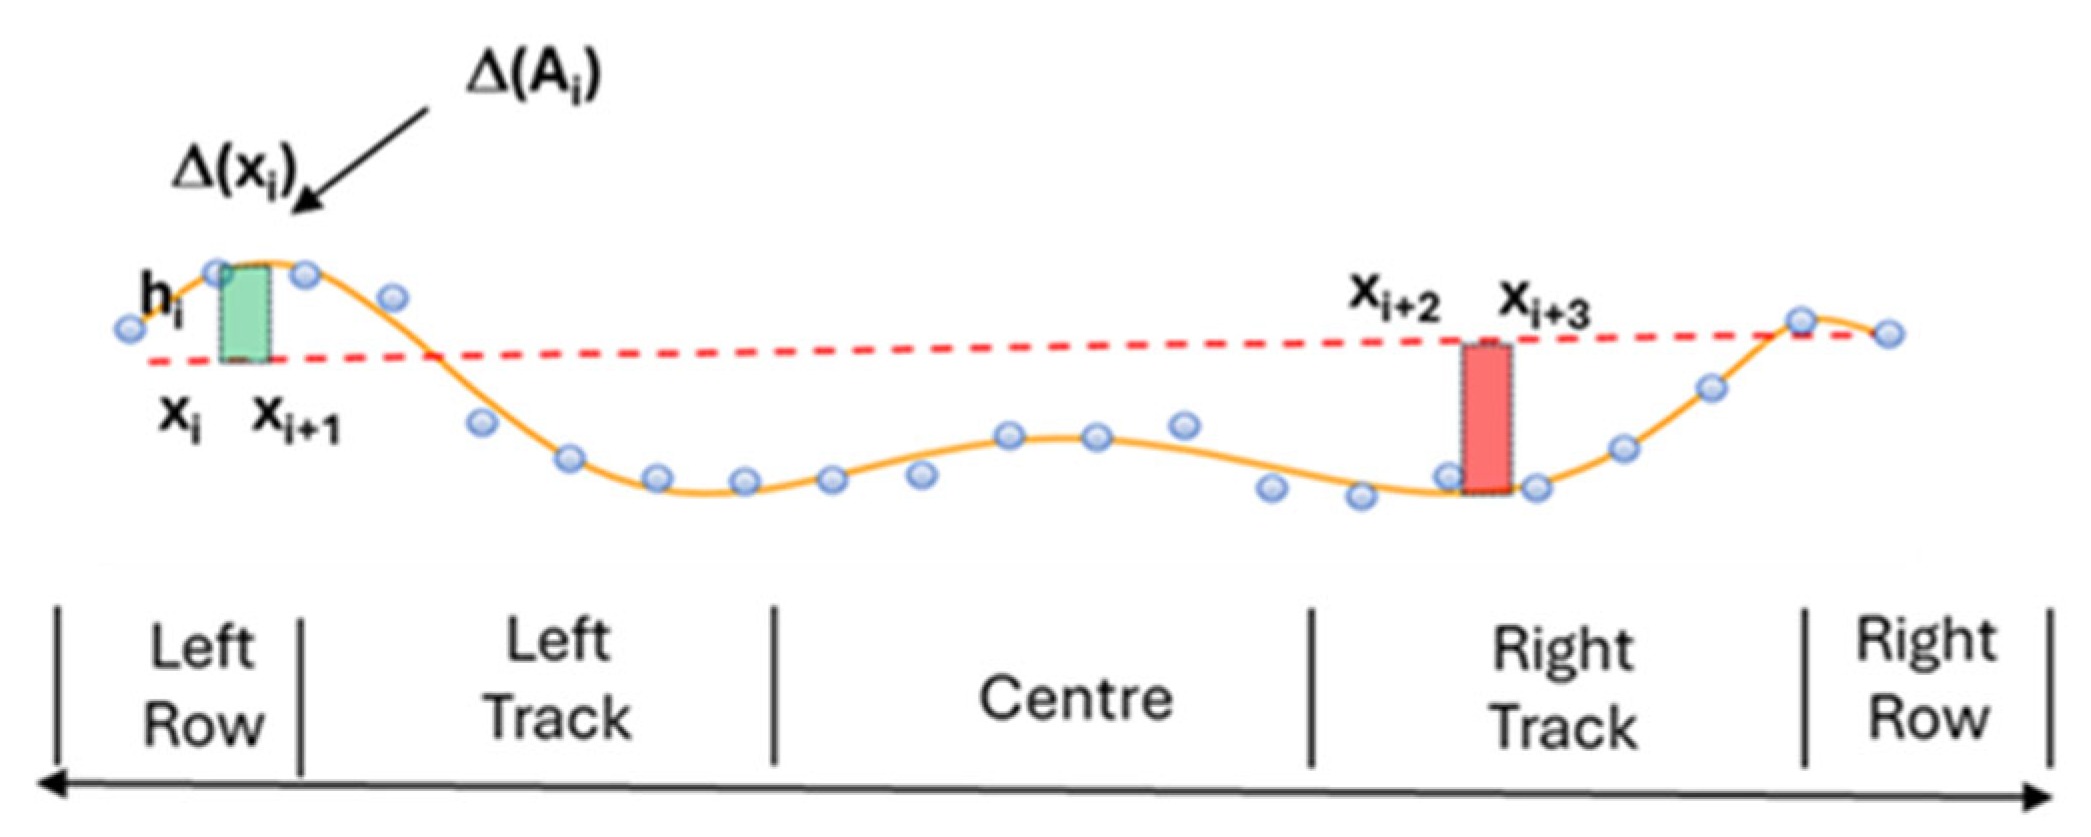
Using this approach, soil erosion was identified in the positions where Yinitial > Yactual (red area), while soil accumulation occurred where Yactual > Yinitial (green area) (Figure 2). Therefore, the amount of erosion or deposition along the transect was determined by calculating the area between Yinitial and Yactual, after approximating it to a Riemann sum. The inter-row was divided into finite intervals Δx = (xi + 1 − xi) and at the leftmost point of each one (xi), the distance hi = [Yactual(xi) − Yinitial(xi)] was calculated, so to individuate elementary rectangles with area ΔAi = Δxi * hi. Soil erosion and accumulation areas were given by summing up all ΔAi (m2) with negative (erosion) and positive (accumulation) hi (m) values, respectively. The possible effects of tillage operations and tractor transit on soil translocation were assessed by identifying some specifically affected sub-zones (Row and Track) along the inter-row (Figure 3).
The width of each sub-zone was automatically determined by ISUMmate_1.1 once the operator entered the inter-row spacing and the tractor and wheel/track width.
(b)
Volume of soil mobilized between two consecutive transects
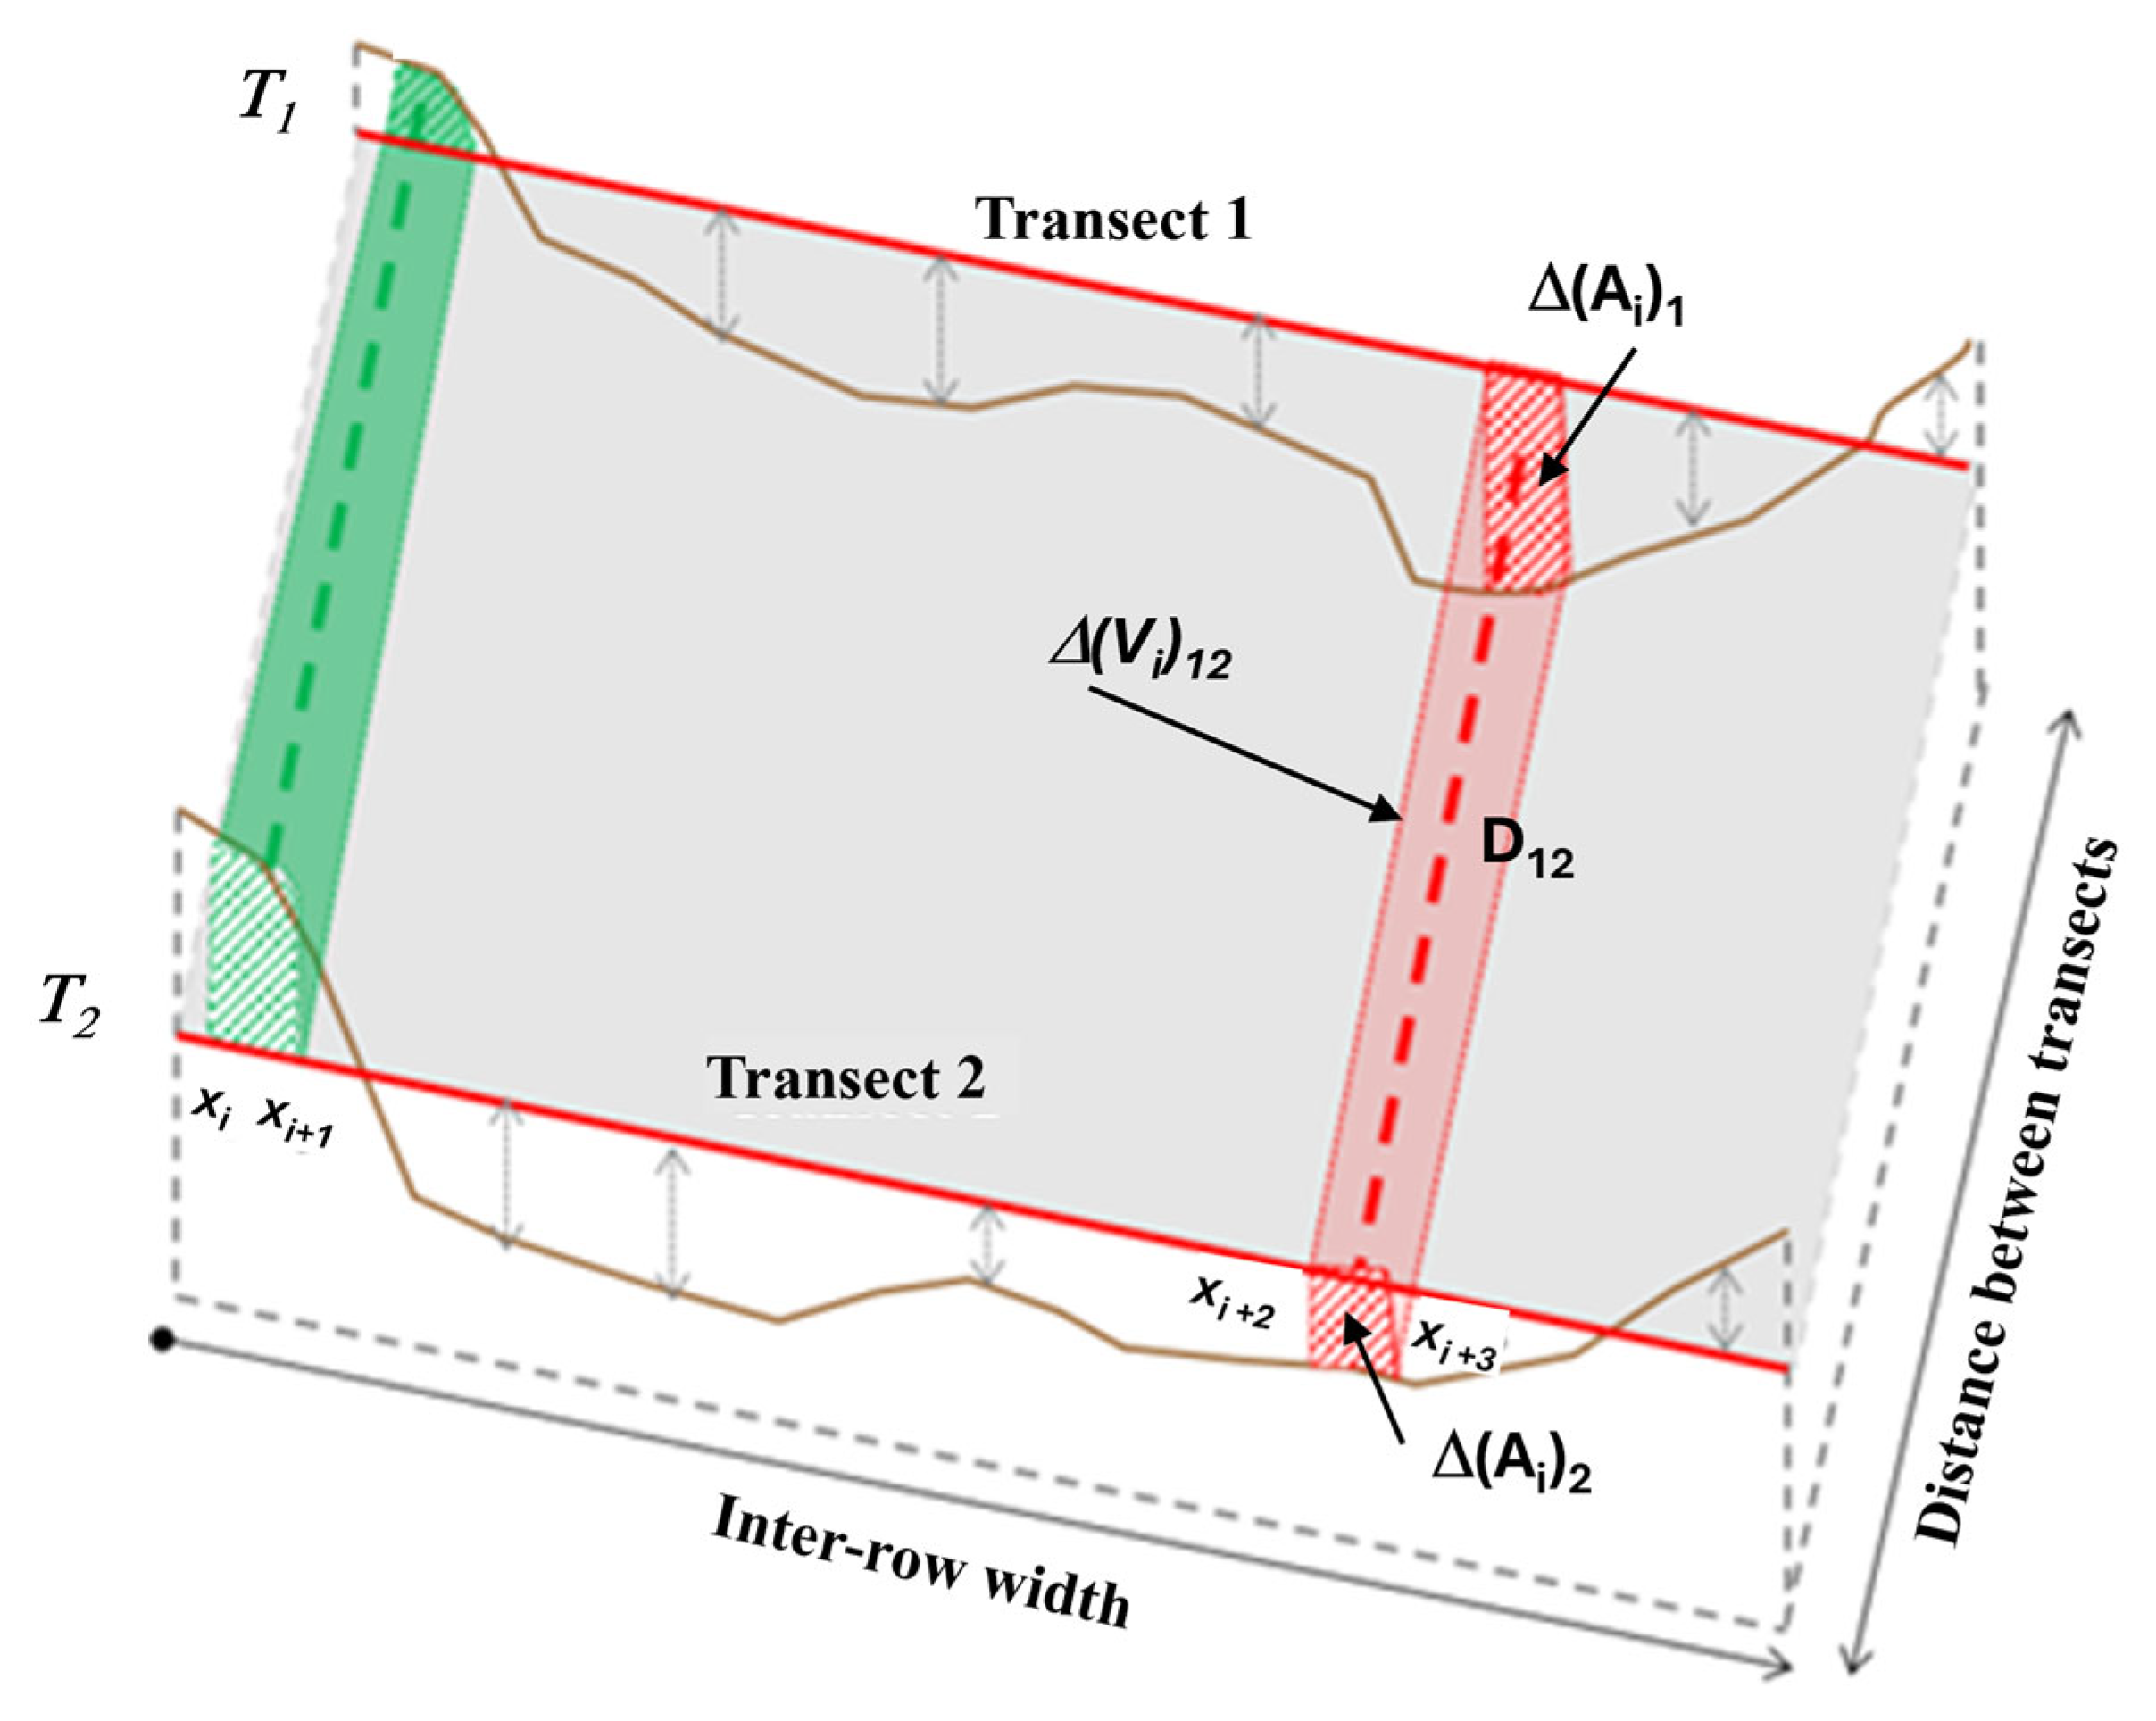
Based on the 2D reconstruction of the soil surface profile, the soil volume mobilized between two consecutive transects (e.g., T1 and T2) can be calculated by the sum of the volumes of finite longitudinal slices, each with volume equal to Δ(Vi)12 (Figure 4).
Each slice is represented by a trapezoidal prism, where height is the longitudinal distance D12 (m) between two consecutive transects. The two finite bases of the prism are represented by the trapezoidal areas Δ(Ai)1 and Δ(Ai)2, identified, respectively, on transect T1 and T2. The finite volume Δ(Vi)12 in any position xi on the rod of the pair of transects T1 and T2, is then calculated by the following equation:
V i 12 = A i 1 + A i 2 2 D 12
For each pair of transects (T1 and T2), total erosion and deposition volumes (m3) are calculated by summing the finite volumes (ΔVi)12, which can be positive or negative (Figure 3, green or red prisms), and calculated by applying Equation (4), as follows:
V 12 = i = 1 i = n V i 12
where (∆Vi)12 is the finite volume (m3), and n is the number of “slices” identified on both transects T1 and T2.
(c)
Average rate of soil mobilized between consecutive transects T1 and T2
ISUMmate_1.1 allows for the conversion into mass of the volume of soil mobilized between two adjacent transects (e.g., T1 and T2), by multiplying this volume by the bulk density (BD, Mg m−3) of the Ap horizon, which is assumed constant and estimated using the pedotransfer function (PTF) of Saxton et al. [45]. Successively, this data is converted into an average annual soil mobilization rate (ER—Mg ha−1 yr−1) using the equation of Paroissien et al. [46]:
E R 12 = 10 4 B D V 12 A g e A 12
where A12 is the surface (m2) of the inter-row segment between transects T1 and T2, Age is the number of years since the vines were planted, and 104 is the multiplier to convert Mg m−2 yr−1 into Mg ha−1 yr−1.
(d)
Total volume of mobilized soil
The total volume of mobilized soil (m3 ha−1) is obtained by summing the contribution of the different inter-row segments using the following equation:
V = i = 1 i = k V k
where k is the number of segments identified in the vineyard and Vk the volume (m3) of the kth segment calculated by (Equation (4)).
E R = B D 10 4 V A g e A
where A is the total surface of the vineyard (m2).
Because of the instrument sensitivity of ±2 mm, the erosion measurements were affected by an average error of about 1.2 Mg ha−1 yr−1, based on a bulk density value of 1.1 g/cm3 and a vineyard age of 17 years.

2.5. Statistical Analysis

All data were analyzed by a two-way (Management and Year) analysis of variance (ANOVA). Post hoc mean separation was performed by Duncan’s multiple range test at the p ≤ 0.05 significance level. Additionally, Pearson’s correlation analysis was employed to identify the relationship between redistributed soil mass (Erosion and Deposition) and main vineyard geometric properties (Slope and Row-Length) for each management system. All analyses were carried out using the StatSoft Statistica 10.0 software package (StatSoft, Tulsa, OK, USA). Relative root mean square error (%) was calculated to assess the accuracy of the interpolation method employed by ISUMmate_1.1 to reconstruct the terrain profile on each transect (Table A1).

3. Results

3.1. Dynamics of Soil Aggregate Stability and Organic Carbon Content

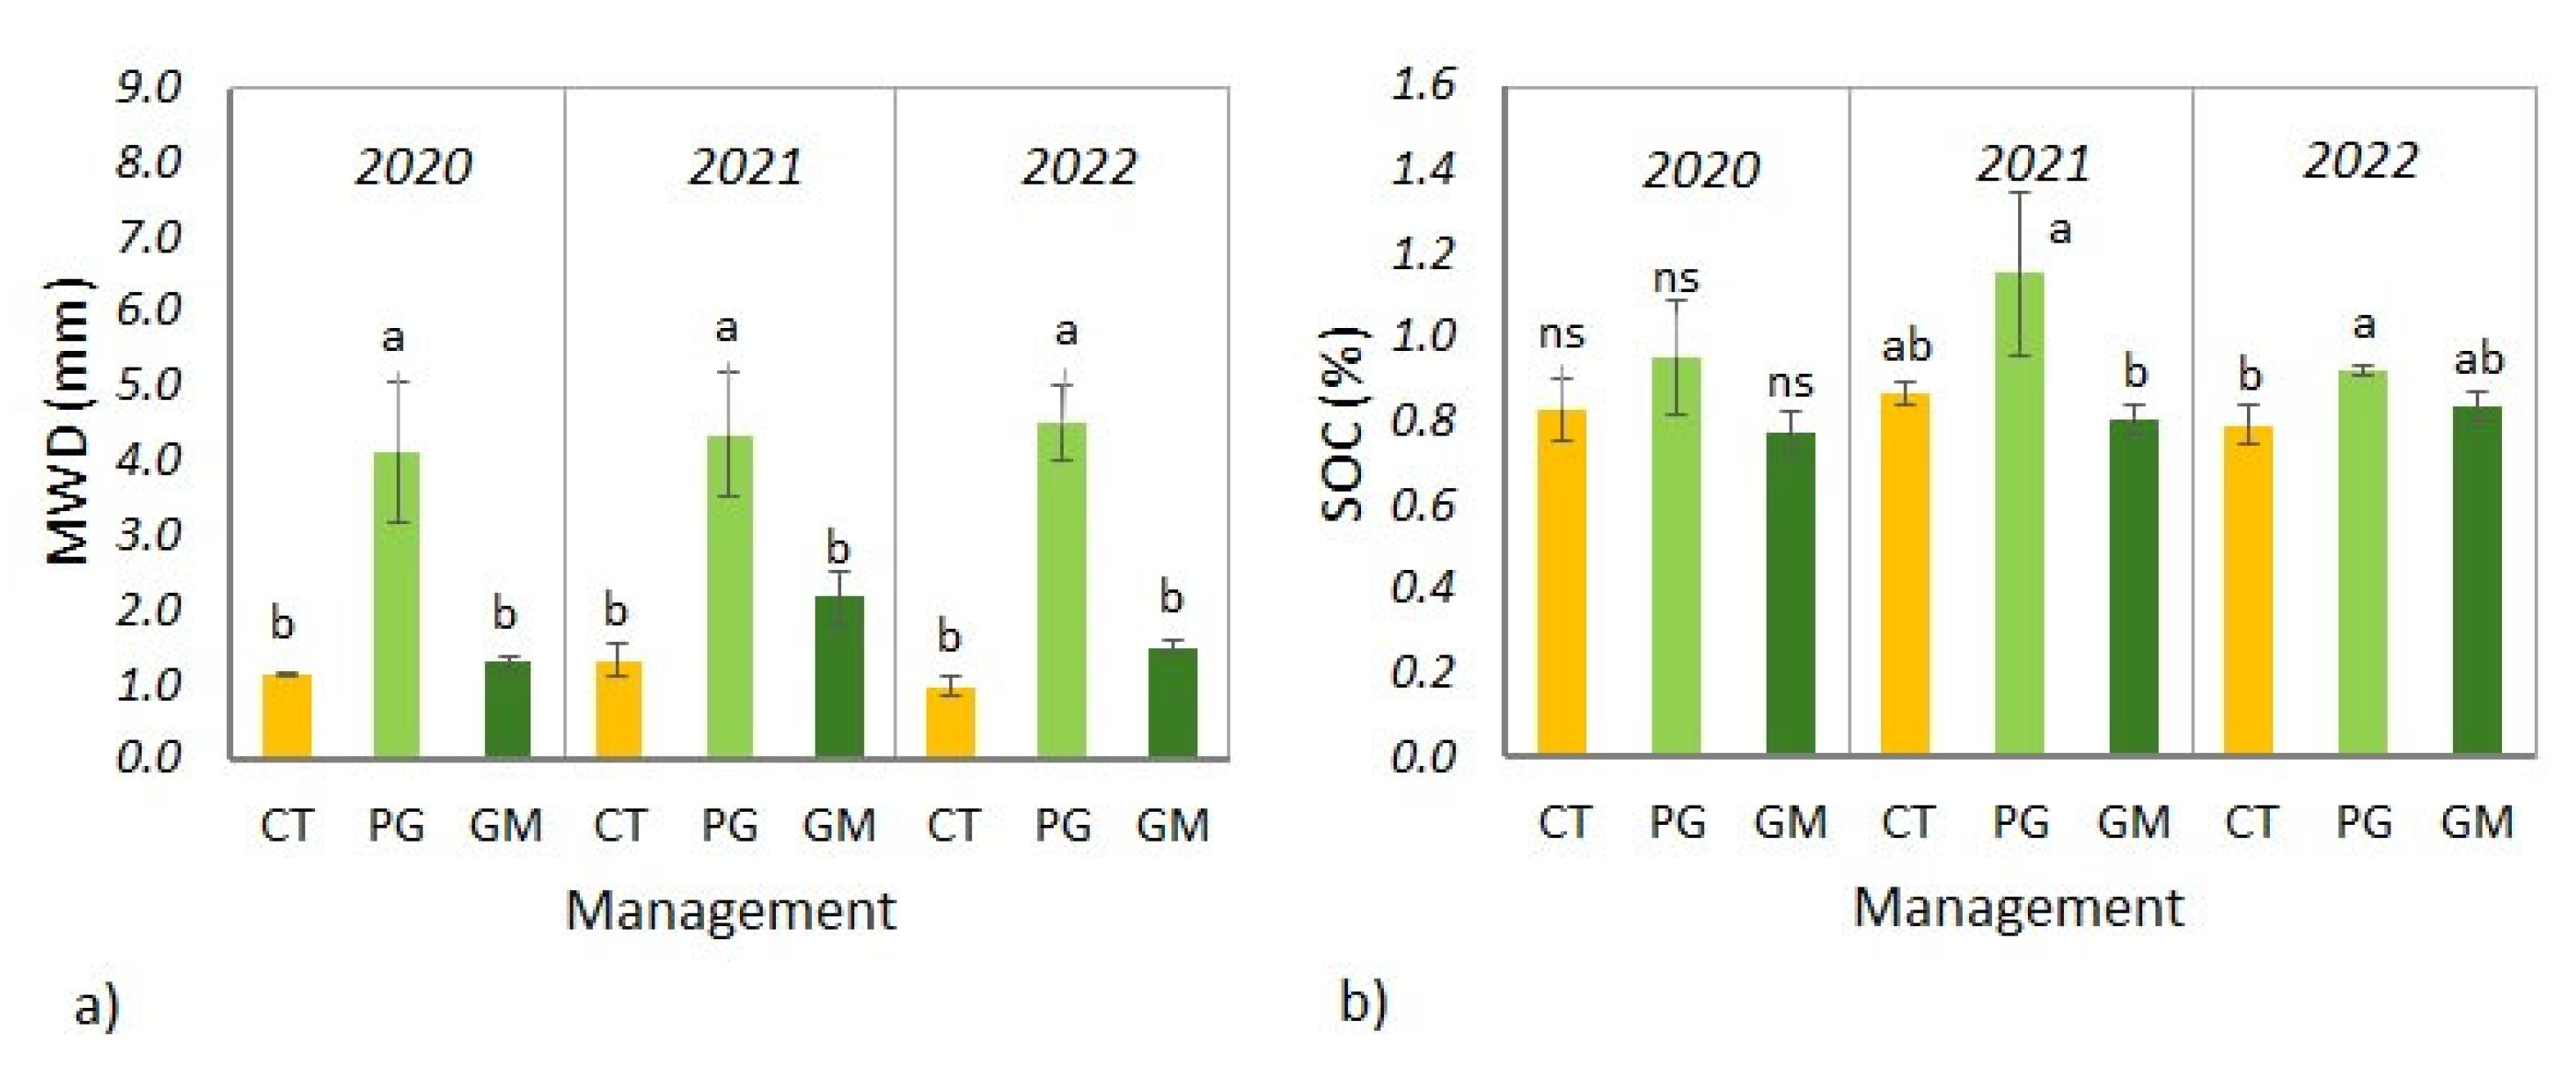
The different soil management systems significantly affected aggregate stability (Figure 5a); during the three years of monitoring, PG always showed higher MWD values than CT and GM. With regard to SOC (Figure 5b), in 2020, the differences between treatments were not significant. In the following years, soil response gradually changed, and in 2022 PG promoted a significant SOC increase compared to CT. A slight increase in SOC was also observed in GM.

3.2. Soil Erosion Quantification

In Table 3, the total erosion and total deposition for each year, and the soil management system are reported. Statistical analysis showed that the Year factor and the Year × Management interaction were not significant.
Within each treatment, no significant differences were observed between 2022 and 2020, either in terms of total erosion or total deposition. However, significant differences were found between the management systems. As expected, in agreement with aggregate stability and SOC results, PG exhibited a lower soil loss in comparison to CT and GM. GM, in particular, showed the highest erosion (approximately double that of PG). The total deposition was lowest in GM and highest in CT.

3.3. Distribution of Eroded and Deposited Soil Along the Slope and Within the Inter-Row

Figure 6, Figure 7 and Figure 8 show the management-induced soil mobilization rates (Mg ha−1 yr−1) in each inter-row portion between two consecutive transects, as resulting from ISUMmate_1.1.
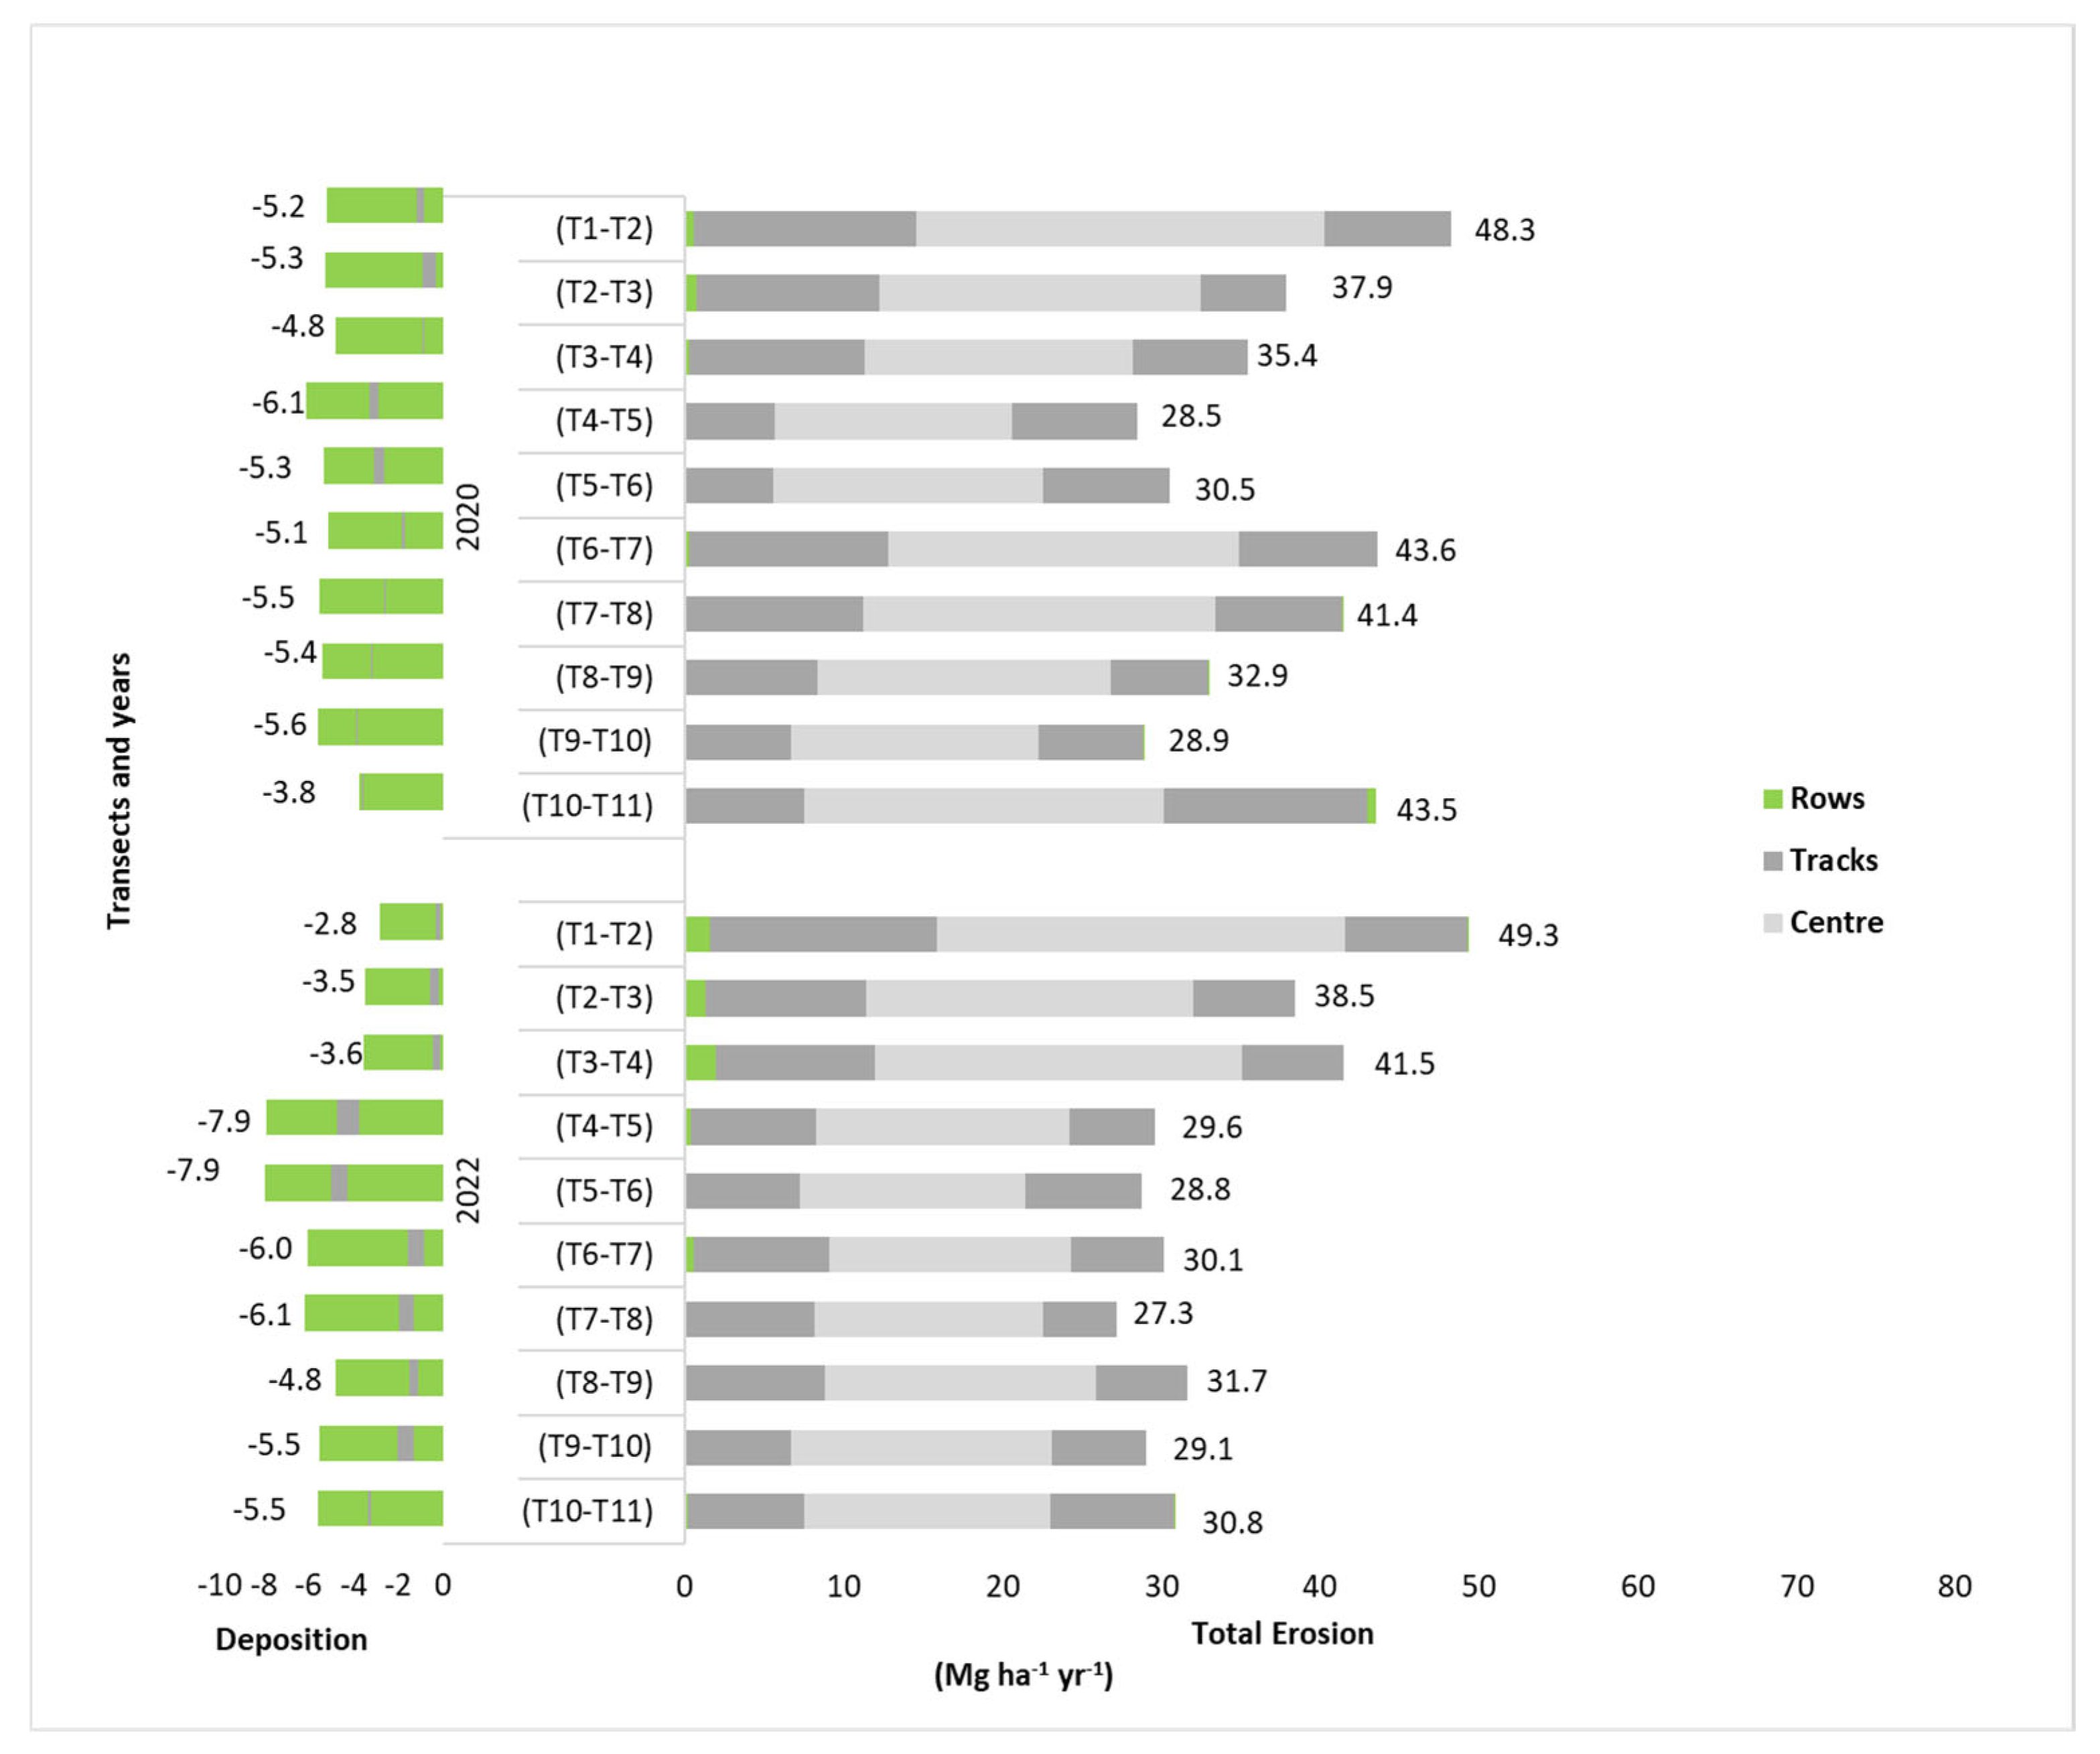
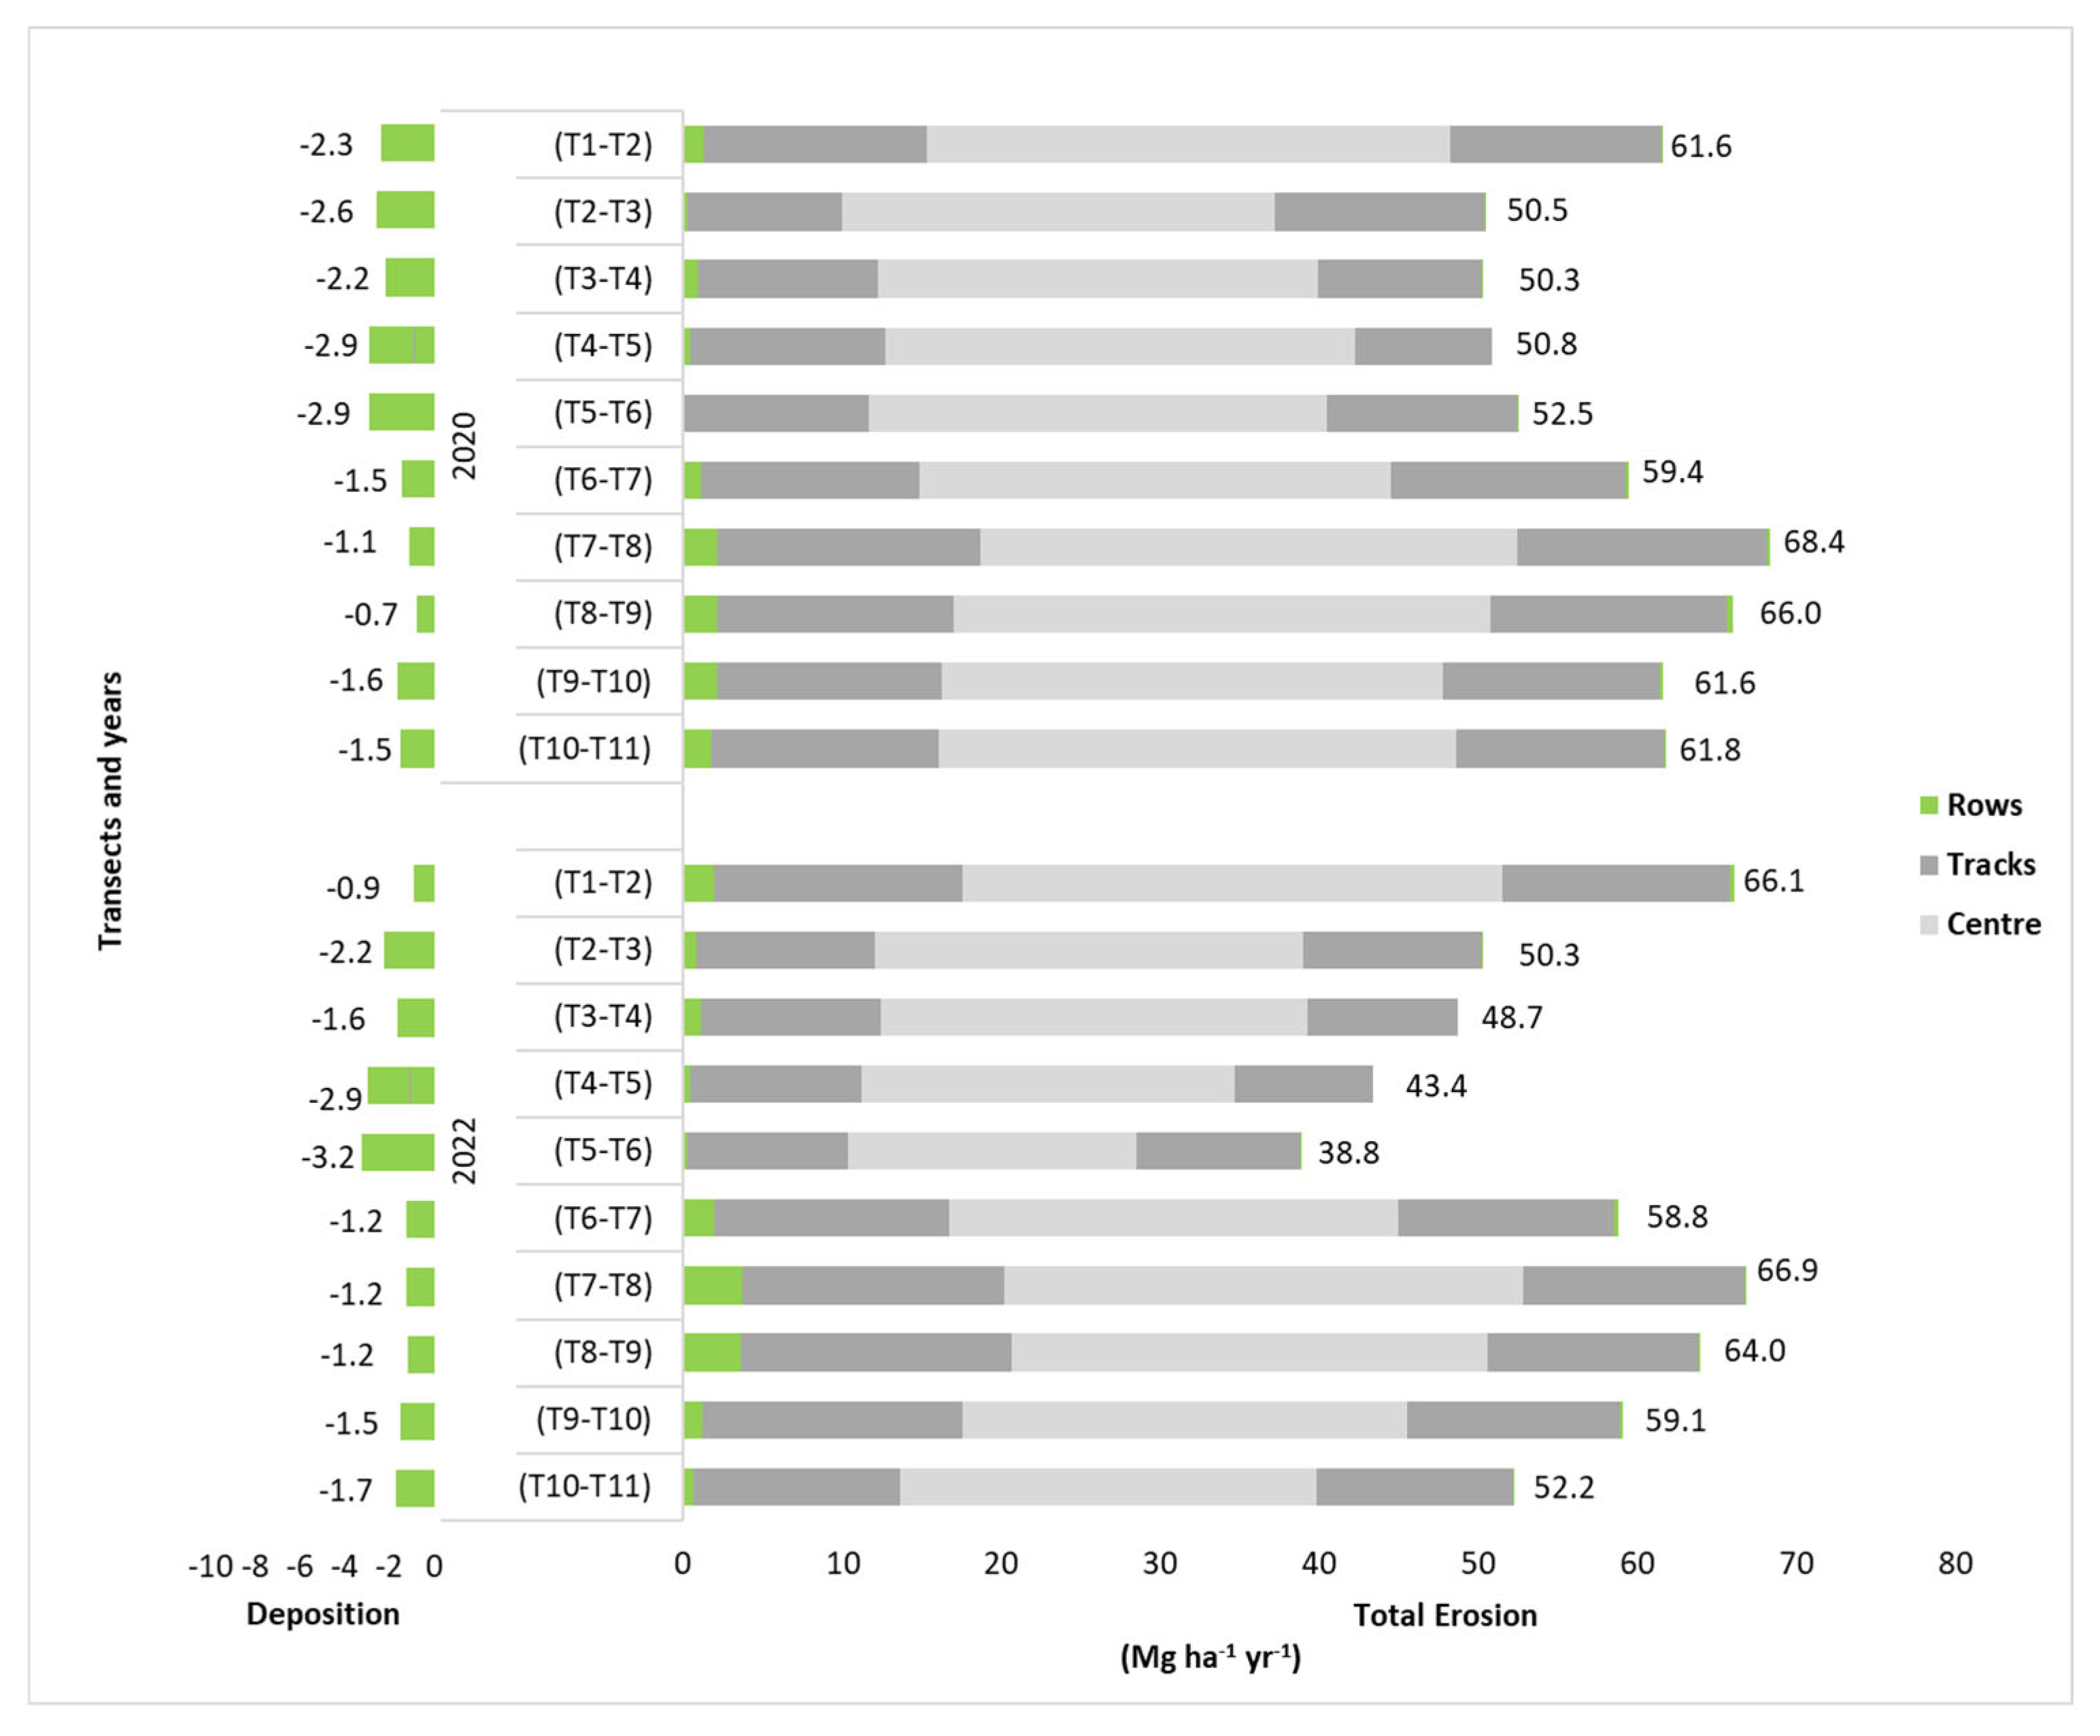
Along the inter-rows under managements that involved soil tillage (CT and GM) (Figure 6 and Figure 7), despite some variability, even between years, it can be observed in total erosion rates that the highest values were always found in correspondence with the first pair of transects (T1– T2), namely 48.3 and 49.3 Mg ha−1 yr−1 in CT, and 61.6 and 66.1 Mg ha−1 yr−1 in GM, in 2020 and 2022, respectively. In GM, the rates remain around 50 Mg ha−1 yr−1 (2020) or progressively decrease until the 6th pair of transects (T6–T7), whereupon rates start to increase again, and, at the 7th pair of transects, a second peak of 68.4 and 66.9 Mg ha−1 yr−1, respectively, in 2020 and 2022 is registered. Instead, a trend towards decreasing erosion characterizes the inter-row in the lower part of the slope. In the case of CT, the behaviour changes over the years; in 2020, two peaks were observed, specifically at the 6th (T6–T7) and last (T10–T11) pair of transects, both characterized by erosion values around 44 Mg ha−1 yr−1. In 2022, conversely, soil loss rate was uniform, around 30 Mg ha−1 yr−1, from the 4th pair of transects (T4–T5) onwards.
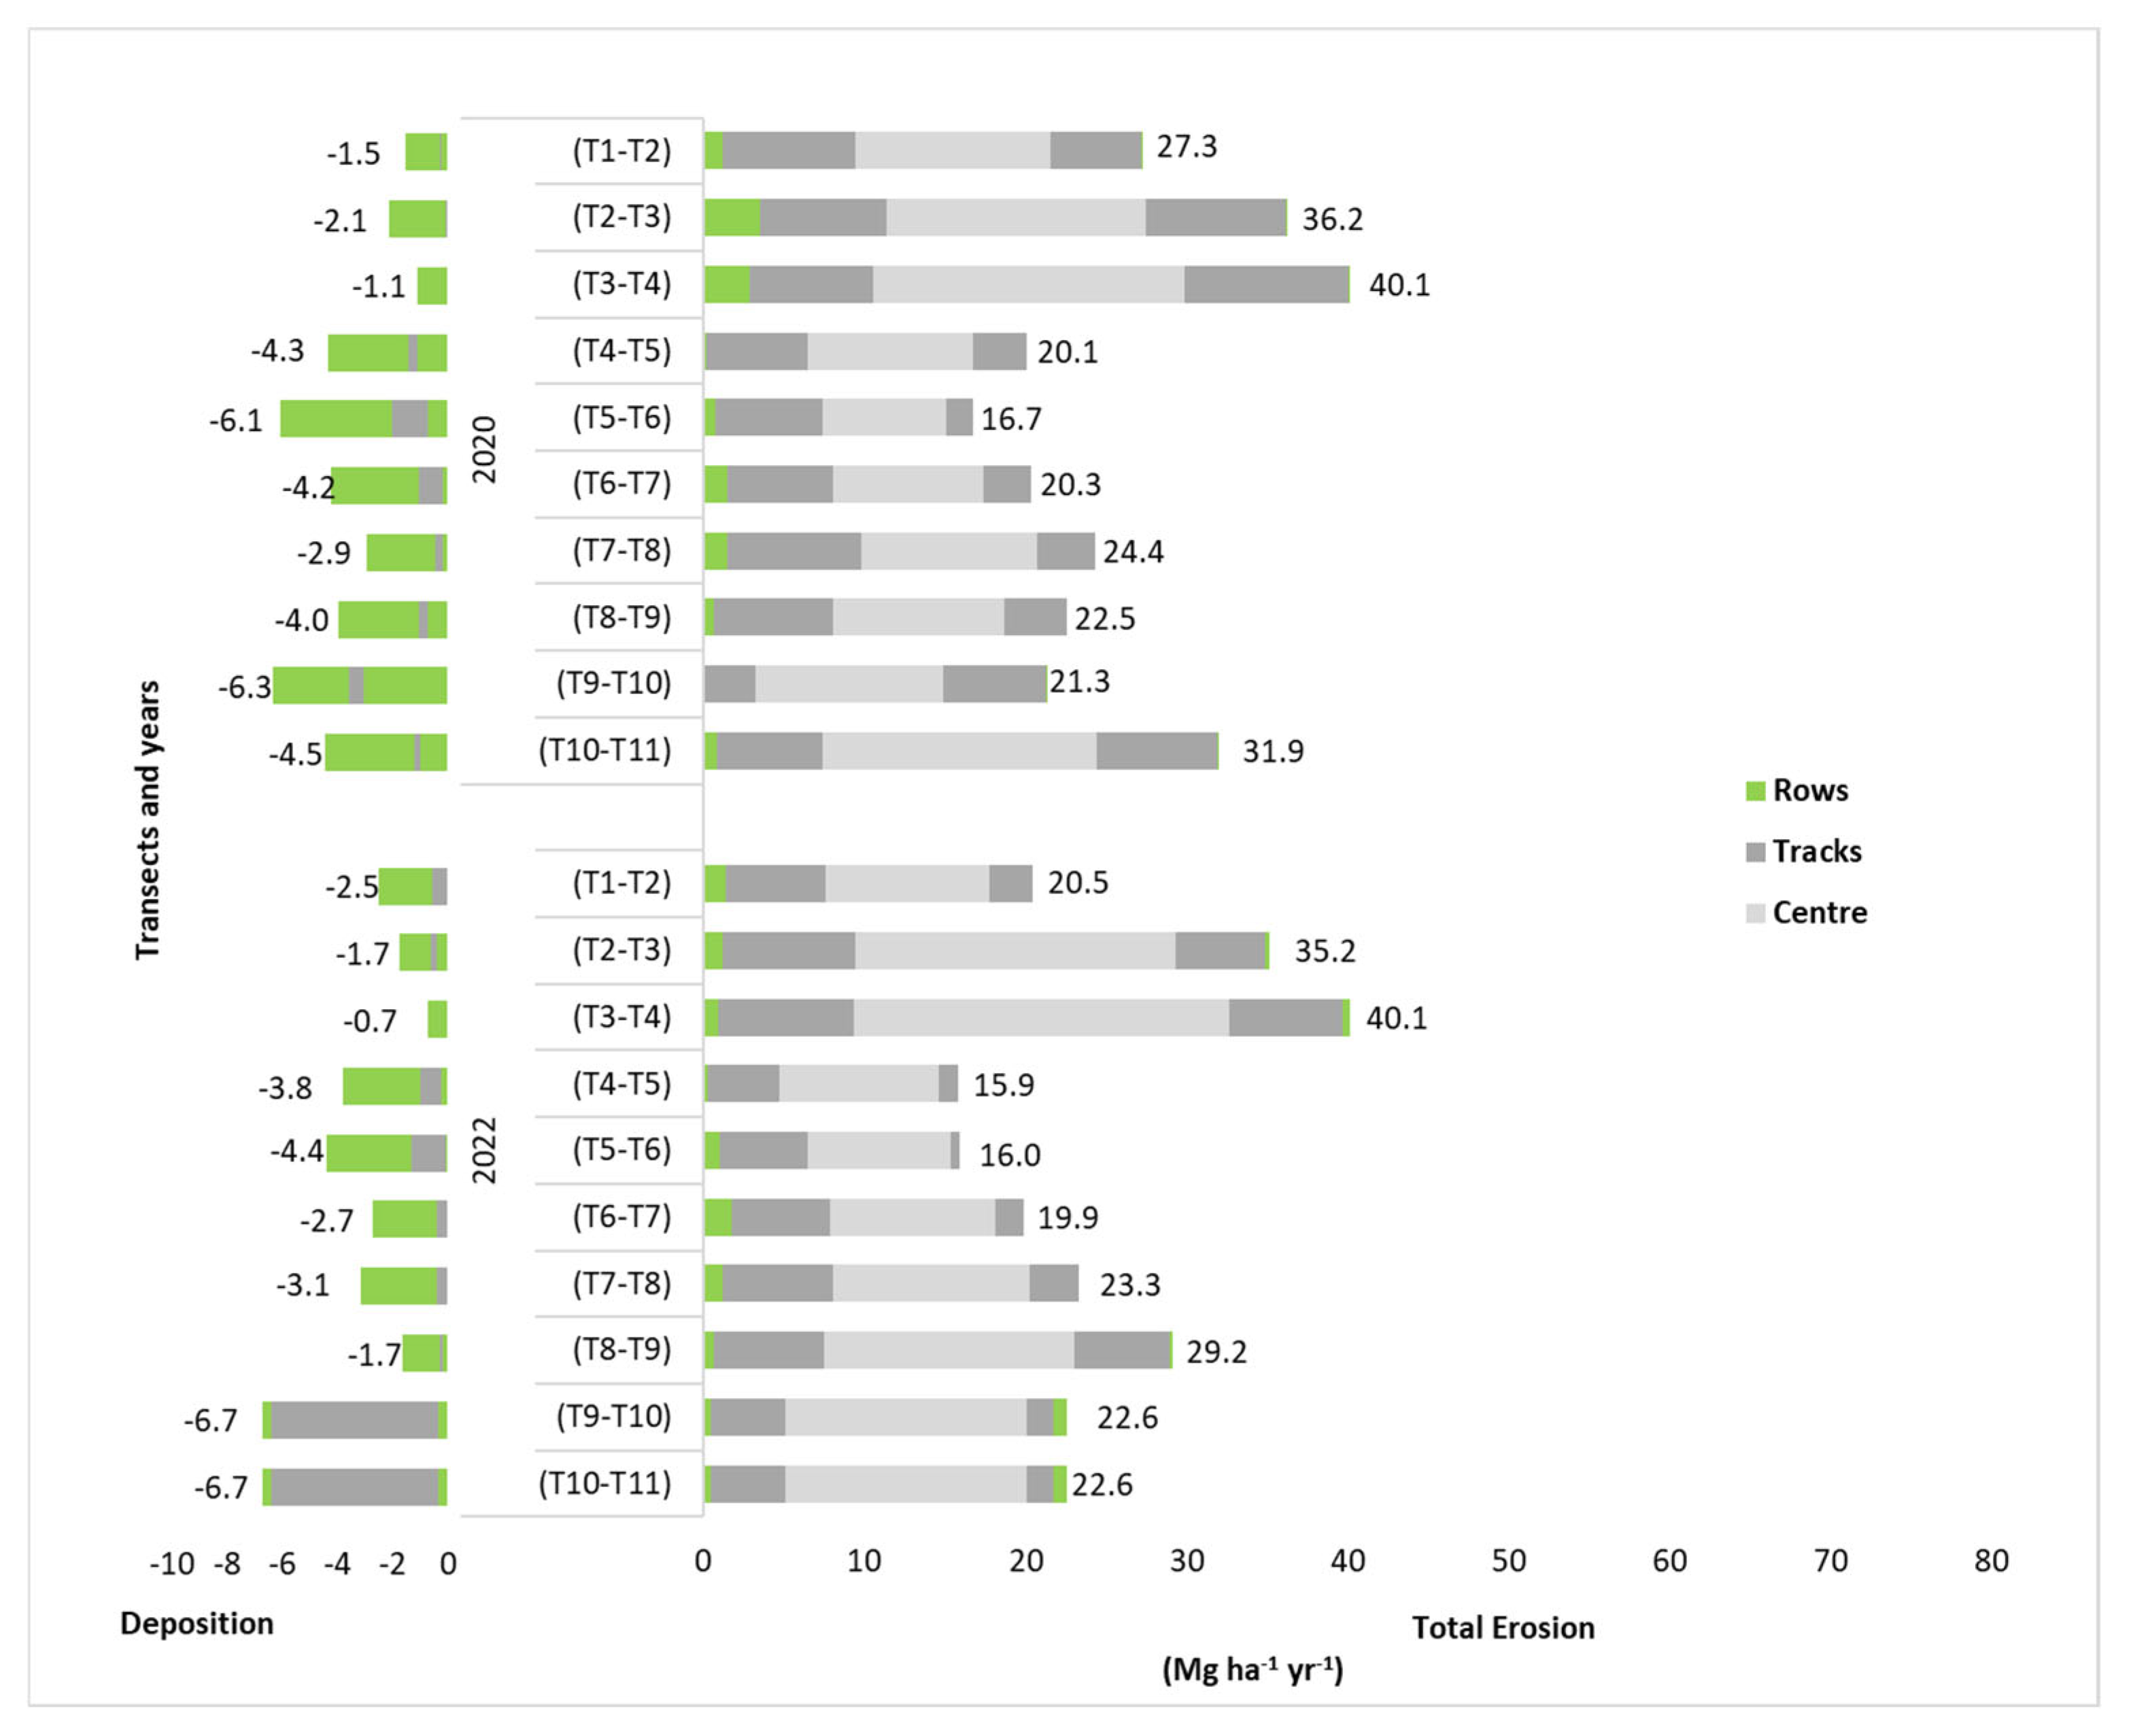
With regard to PG (Figure 8), in both years an increasing trend in erosion was observed from the upper part of the vineyard until the third pair of transects (T3–T4), where the maximum value was recorded (40 Mg ha−1 yr−1); for the remaining part of the slope, soil loss remained essentially constant, with average values around 22 Mg ha−1 yr−1.
With regard to deposition phenomena, these occurred mainly along the row in both years and for all managements. One exception is observed in PG 2022, where transects T9–T10 and T10–T11 reached a peak of −6.7 Mg ha−1 yr−1, affecting primarily the Track zone rather than the Row area. These pairs of transects have the same Erosion and Deposition values (Figure 8) because, since the measurement could not be taken at T10 due to the disturbance caused by the uprooting of some dead plants, the Erosion and Deposition values attributed to T9–T10 and T10–T11 correspond to half the measurement taken between transects T9 and T11, considering, in this case, a double distance between the transects, approximately 18 m, instead of 9 m. The deposition rate slightly changes along the vineyard rows in each treatment, every year. An exception occurred in CT 2020, in which a uniform deposition rate along the entire slope is observed (Figure 6).
Table 4 summarizes the results reported in Figure 6, Figure 7 and Figure 8 to verify the possible presence of zones, along the transects, in which soil mobilization preferentially occurs. Since the Year factor and the Year × Zone interactions were not significant (Table 4), for each treatment, the comparison between the different inter-row zones was carried out considering both 2020 and 2022 data. In all the treatments, soil erosion is lower, and deposition higher, along the row; higher soil erosion rates are measured in the Centre zone of both CT and GM, while in PG there is no difference between Centre and Track zones.

3.4. Correlation Between Redistributed Soil Mass and Main Vineyard Geometric Properties for Each Management System

The correlation matrices (Table 5) highlight that, for all the management systems, the total erosion rate (E_Total) is significantly (p < 0.01) and negatively related with the deposition rate (D_Total). In fact, as an example, in 2022 (Figure 6, Figure 7 and Figure 8), the lowest deposition rates (CT = −2.8; PG = −0.7 and GM = −1.2 Mg ha−1 yr−1) are measured in correspondence with the maximum erosion peaks (CT = 49.3; PG = 40.1 and GM = 66.9 Mg ha−1 yr−1).
Furthermore, the Slope is inversely correlated (p < 0.001) with the Length (i.e., the distance from the drainage divide), which means that the upper part of all the rows is steeper and as you travel from upstream to downstream the Slope decreases (concave longitudinal topographic profile.
For CT and PG managements only, E_Total is positively correlated with the Slope (p < 0.01). No significant correlation was observed between E_Total and the Slope in GM. This suggests that, under this management system, soil redistribution within the inter-row and on the rows is primarily controlled by tillage operations.
With regard to the total deposition, only in PG is this significantly correlated with both the Slope (negative, p < 0.001) and the Length factor, which is the distance from the divide (positive, p < 0.01).

4. Discussion

After three years of experimentation, aggregate stability and SOC showed, albeit with variable trends, a significant increase in PG compared to CT and GM, suggesting a potential improvement in the soil’s resistance to erosion [18]. However, while aggregate stability increased in the first year of experimentation, the increase in SOC was significant only from the second year onwards. Therefore, we hypothesize that the short-term stabilizing effect of grass cover on soil structure was mainly of a physical nature, due to the trapping of soil aggregates by roots (enmeshing effect). Regarding the possible contribution of organic matter to aggregate stabilization through chemical–physical mechanisms, it is expected that, as a medium- to long-term process, this is linked to the accumulation rate of organic compounds effective in the chemical binding of soil particles and dependent on the mineralization and humification of herbaceous residues by soil microbial communities under the influence of environmental factors (soil properties, climate, and grass management) [47].
The soil loss results confirm the higher effectiveness of permanent grassing in decreasing erosion compared to management systems involving tillage operations, even in the presence of vegetation cover (as in GM).
In general, under optimal crop management, green manuring is expected to provide greater erosion control than continuous tillage, combined with an increase in the soil’s organic matter content and fertility. Conversely, its effectiveness against erosion tends to be lower compared to permanent grass, due to the temporary nature of the soil cover and the tillage-induced soil disturbance during the burying and reseeding of the crop, which impact soil aggregate stability and expose soil organic matter to a higher mineralization rate. In any case, GM performance can be highly variable, depending on the characteristics of the crop species used, their ability to adapt to local soil and environmental conditions, crop cycle management, and the interaction of the soil/crop system with the intensity and distribution of rainfall events [27,28]. In this study the species used in the mix met some specific farm objectives, particularly improving soil nitrogen fertility, which led the winemaker to choose a mixture rich in legumes, which less effective in countering erosion [28].
GM’s performance was strongly affected by the extraordinary rainfall events that occurred in 2019 and 2020, which precluded autumn sowing in 2019 (thus leaving the soil exposed to the winter rainfall) and continued with a highly erosive impact until the end of spring 2020. Particularly influential was the unexpected and intense rainfall, contrasting with the long-term average climate trend (Table 2), that fell between 4 and 14 June 2020 (64.9 mm in three events of 17.3, 24.3 and 23.3 mm), when the soil had recently been worked for the burial of the crop (26 May), and, therefore, was made more vulnerable to erosion.
These results highlight some critical issues with green manure as a management system for soils susceptible to erosion. The first issue is undoubtedly linked to the aforementioned soil disturbance associated with the burying and reseeding of the crop, typically carried out during periods that could be potentially subject to rainfall. On the other hand, burying green manure in May is a common practice in this area and primarily addresses the winegrower’s need to interrupt the crop cycle in conjunction with the vine’s vegetative restart, to prevent potential crop competition with vines for water and nutrients. It is clear that this farmer’s priority may compromise soil protection from possible late rains and contribute to enhanced erosion.
The failure of the autumn sowing, as previously cited, was unfortunately due to unforeseen weather conditions, which forced the farmer to sow in late February. In this regard, the winemaker’s choice to use the same mix of crop species is certainly questionable, although they also adapt well to early spring sowing. In our case, we encountered no problems with germination and plant growth, but the degree of soil coverage achieved was low. The aforementioned critical issues also contributed to limiting the performance of GM in terms of improving soil fertility and structure stability over the considered period. Beyond the effects of the environmental and management factors, a further factor that may have contributed to the absence of significant increases in SOC and soil structural stability in GM is the fact that legume-enriched green manure crops provide the soil with rapidly mineralized organic matter, which contributes mostly to the actively cycled organic carbon pool and is therefore less effective in carbon sequestration, as well as in providing active organic agents in the chemical–physical stabilization of soil structure [48].
Surprisingly, the erosion losses under GM were even higher than those in CT. This apparent inconsistency can be interpreted by hypothesizing that the modest rainfall that occurred in the previous month of May (24.6 mm, in seven events with low to no erosivity) caused a settling of the soil surface in CT (tilled on May 6th), which was able to reduce the detachment and transport of soil particles by runoff under the following June rains [49].
The 2022 results reflected those of 2020, which is explained by the fact that throughout the 2020–2022 period there were no further statistically significant contributions of rainfall to total erosion.
However, it is interesting to note that, despite the lack of statistical significance, the different treatments in 2022 showed a common trend toward slightly lower soil losses than in 2020. This is attributable to the lower amount and erosivity of annual rainfall in the 2021–2022 period compared to the 2019–2020 period (Table 2).
One more aspect to consider is that soil erosion in GM and CT was due to the interaction between water and tillage erosion. Tillage increases soil erodibility [50] by amplifying the action of erosive rainfall. This explains the greater reduction in erosion compared to PG. The fact that the magnitude of the reduction is equal in CT and GM can be explained by considering the following two factors: (i) tillage intensity (frequency and type of tillage), which was higher in GM than in CT; and (ii) vegetation cover, only present in GM. In GM, the latter factor seems to perfectly compensate for the greater effect of the former.
Overall, the erosion rates measured in PG and CT agreed with those observed by other authors. Napoli et al. [51], in similar pedoclimatic conditions (Tuscany, Italy) and with the same methodological approach, measured an average erosion of 42 Mg ha−1 yr−1, while, in Spain, Rodrigo-Comino et al. [44] found an average erosion of 25 Mg ha−1 yr−1. Furthermore, a survey by Barrena-González et al. [52], based on the ISUM methodology, showed an average erosion of 45 Mg ha−1 yr−1 in a 20-year-old vineyard managed using continuous tillage (three times a year).
Regarding the methodological approach used in this work, we believe that the added value of the ISUM, coupled with the complementary software tool ISUMmate_1.1.xlsm, lies in its ability to provide detailed information on soil erosion and deposition zones, which are useful for monitoring the impact of a given soil management system on these processes over time and space.
The systematic occurrence of high erosion rates in the first pair of transects in CT and GM can be attributed to the higher slope in the upper part of the vineyard, as confirmed by the inverse correlation between Slope and Length (Table 5) under all treatments. However, given that in the upper part of the slope, even though steeper, surface runoff is unlikely to reach volumes and velocities sufficient to trigger water erosion, it is reasonable to assume that the erosion peaks observed in this part of the CT and GM plots were primarily due to tillage-induced translocation phenomena [50]. In the same portion of the PG plot, erosion was lower due to the presence of herbaceous cover and reached its maximum value at the third transect (T3), located approximately 30 m from the divide, a distance sufficient to trigger water erosion [53].
With regard to the inter-row zones most prone to erosion, the central ones showed higher values in all treatments. However, only in CT and GM were these values statistically higher than those measured on the tracks (Table 4). These results demonstrate that soil loss occurred throughout the entire inter-row zone, rather than primarily in the wheel track area, as often happens [54] where infiltration is reduced and runoff volume is greater.
According to our experimental evidence, erosion was greater where the soil was less compacted by agricultural machinery and therefore had a lower cohesion. More compacted soils generally exhibit higher bulk density, increased penetration resistance, and shear strength [55]. The latter is defined as “the maximum shear stress that the soil may sustain without experiencing failure” [56] and is a mechanical soil property strictly related to splash detachment processes occurring when runoff flow becomes erosive [57].
We therefore hypothesize that rainfall distribution and erosivity were the drivers of the detachment and transport of particles in the central part of the inter-row, where the soil was less compact. At the same time, it is likely that along the wheel tracks there were no conditions allowing for the critical shear stress to exceed soil strength [58].
The amount of deposition varied depending on the type of tillage (Table 4). In CT, part of the soil that was lifted during ripping fell laterally along the row, becoming susceptible to redeposition, which was therefore greater than in PG. Conversely, seedbed preparation in GM resulted in a levelling and lowering of the soil surface right up to the row, which resulted in a decrease in the amount of deposition compared to PG. The predominant effect of mechanization on the deposition rate in CT and GM was confirmed by correlation analysis. The deposition process was affected by the geometric properties of the vineyard only in PG, where it was negatively correlated to the Slope and positively to the Length of the vineyard.
However, a significant negative correlation between the Erosion and Deposition rate observed in all treatments (Table 5) suggests that there is no transversal soil movement on vineyard transects from the erosion zones (Centre and Track) to the deposition ones.

5. Conclusions

Over the three-year considered period, aggregate stability proved to be a rapid and reliable indicator of water erosion susceptibility, suitable for the short-term assessment of soil management. In contrast, SOC requires longer periods to reflect changes. PG was confirmed as the most effective soil conservation strategy, combining minimal erosion with maximum organic carbon enrichment. These agro-environmental benefits are accompanied by minimal maintenance costs, thanks to the reduced number of cultivation operations required (initial grass establishment and annual cuttings). Economic sustainability would be even greater with natural grass cover, although its viability must be evaluated on a case-by-case basis, depending on its potential competitive effect on vines.
GM, on the other hand, provided results far below expectations, with erosion rates even higher than those under CT and no benefits in terms of C sequestration or aggregate stability. The main critical issues with GM appeared to be soil disturbance caused by the required cultivation operations and the occurrence of unexpected intense rainfalls. Our results also highlighted the key importance of a proper selection of crop species according to specific soil and environmental conditions.
The ISUMmate_1.1 allows for the efficient monitoring of water and tillage erosion through streamlined field surveys, structured data input, and customized reporting. Its low cost and ease of use make it suitable for both long- and short-term assessments.
Early application is recommended, especially in the first years after vineyard establishment, when soils are particularly vulnerable to erosion [59]. Zone-specific measurements within inter-rows can therefore allow the precise identification of erosion hotspots and prioritization of interventions. Beyond the case study presented, ISUMmate_1.1 shows potential for application at different spatial and temporal scales. At the plot or experimental scale, it can serve as a low-cost and replicable tool for testing the effect of management practices on soil erosion. At the vineyard scale, it provides winegrowers with detailed and site-specific information on erosion hotspots, supporting targeted interventions. At broader scales (e.g., farm district or regional level), ISUMmate_1.1 could be integrated with remote-sensing or GIS-based approaches to upscale erosion assessment, provided that representative sampling strategies are adopted. This scalability makes ISUMmate_1.1 a versatile tool for both applied research and decision-making in sustainable viticulture.
The ISUMmate_1.1.xlsm application is downloadable at https://github.com/SUVISA-project/ISUMmate (accessed on 1 September 2025), where further programme versions will be continuously updated, and tutorials and handbooks added.

Author Contributions

Conceptualization, M.C.A., S.P., and N.V.; methodology, M.C.A., G.F., S.P., and N.V.; software, M.C.A., and G.F.; validation, M.C.A., S.P., C.B., N.V., G.V., and G.F.; formal analysis, M.C.A., C.B., N.V., G.F., and G.V.; investigation, M.C.A., S.P., and N.V.; data curation, M.C.A., G.F., C.B., G.V., S.P., and N.V.; writing—original draft preparation, M.C.A.; writing—review and editing, M.C.A., S.P., G.F., G.V., and N.V.; visualization, M.C.A., and C.B.; funding acquisition, S.P., N.V., and G.V. All authors have read and agreed to the published version of the manuscript.

Funding

This research was funded by the Ministry of Agriculture, Food, Forestry, and Tourism (MiPAAFT) as part of the sub-project “SUVISA-Viticoltura” (AgriDigit programme) (DM n. 36510/7305/18 of 20 December 2018).

Institutional Review Board Statement

Not applicable.

Data Availability Statement

The data presented in this study will be available upon request to the corresponding author.

Acknowledgments

The authors thank the Barone Ricasoli S.p.A. Società Agricola for hosting the trial and Massimiliano Biagi and Jacopo Nannicini for their support in maintaining the experimental sites and for their help in field data collection.

Conflicts of Interest

The authors declare no conflicts of interest. The funders had no role in the design of the study; in the collection, analyses, or interpretation of data; in the writing of the manuscript; or in the decision to publish the results.

Abbreviations

The following abbreviations are used in this manuscript:
ASurface of the vineyard
BDBulk density
CTContinuous tillage
DDistance
D_TotalTotal deposition rate
E_TotatTotal erosion rate
GMGreen manure
MWDMean weight diameter
PTotal annual rainfall depth
PGPermanent grass cover
PTFPedotransfer function
SOCSoil organic carbon
T(n)Transect (number)
VVolume

Appendix A

Appendix A.1

Figure A1. Photographs of PG and GM inter-row taken on 18 May 2020. The poor development of cover crops can be noted in both management systems. In GM, one week before the burying of the green manure crop by ripping (26 May 2020), only some of the sown plants germinated and none reached the full development.
Agriculture 15 02218 g0a1

Appendix A.2

Table A1. Accuracy of the interpolation method used by the ISUMmate_1.1 tool to reconstruct the terrain profile on each transect expressed in terms of relative root mean square error (RRMSE). For each thesis, the overall RRMSE (%) is calculated on 11 transects and for both years.
ThesesGMPGCT
RRMSE (%) 1.691.391.80

References

  1. Panagos, P.; Ballabio, C.; Poesen, J.; Lugato, E.; Scarpa, S.; Montanarella, L.; Borrelli, P. A Soil Erosion Indicator for Supporting Agricultural, Environmental and Climate Policies in the European Union. Remote Sens. 2020, 12, 1365. [Google Scholar] [CrossRef]
  2. Rodrigo-Comino, J. Five Decades of Soil Erosion Research in “Terroir”. The State-of-the-Art. Earth-Sci. Rev. 2018, 179, 436–447. [Google Scholar] [CrossRef]
  3. Corti, G.; Cavallo, E.; Cocco, S.; Biddoccu, M.; Brecciaroli, G.; Agnelli, A. Evaluation of Erosion Intensity and Some of Its Consequences in Vineyards from Two Hilly Environments Under a Mediterranean Type of Climate, Italy. In Soil Erosion Issues in Agriculture; Godone, D., Ed.; InTech: London, UK, 2011; ISBN 978-953-307-435-1. [Google Scholar]
  4. Pessina, D.; Galli, L.E.; Santoro, S.; Facchinetti, D. Sustainability of Machinery Traffic in Vineyard. Sustainability 2021, 13, 2475. [Google Scholar] [CrossRef]
  5. Prosdocimi, M.; Jordán, A.; Tarolli, P.; Keesstra, S.; Novara, A.; Cerdà, A. The Immediate Effectiveness of Barley Straw Mulch in Reducing Soil Erodibility and Surface Runoff Generation in Mediterranean Vineyards. Sci. Total Environ. 2016, 547, 323–330. [Google Scholar] [CrossRef]
  6. Borrelli, P.; Robinson, D.A.; Panagos, P.; Lugato, E.; Yang, J.E.; Alewell, C.; Wuepper, D.; Montanarella, L.; Ballabio, C. Land Use and Climate Change Impacts on Global Soil Erosion by Water (2015–2070). Proc. Natl. Acad. Sci. USA 2020, 117, 21994–22001. [Google Scholar] [CrossRef]
  7. Intergovernmental Panel On Climate Change (IPCC). Climate Change 2021—The Physical Science Basis: Working Group I Contribution to the Sixth Assessment Report of the Intergovernmental Panel on Climate Change, 1st ed.; Cambridge University Press: Cambridge, UK, 2023; ISBN 978-1-009-15789-6. [Google Scholar]
  8. Panagos, P.; Ballabio, C.; Meusburger, K.; Spinoni, J.; Alewell, C.; Borrelli, P. Towards Estimates of Future Rainfall Erosivity in Europe Based on REDES and WorldClim Datasets. J. Hydrol. 2017, 548, 251–262. [Google Scholar] [CrossRef]
  9. Lal, R. Soil Organic Matter Content and Crop Yield. J. Soil Water Conserv. 2020, 75, 1. [Google Scholar] [CrossRef]
  10. Baloch, S.B.; Ali, S.; Bernas, J.; Konvalina, P.; Naveed, M.; Baloch, F.B.; Jamali, Z.H.; Lošák, T.; Roubík, H.; Ghafoor, A.; et al. Crop Residue Management for Soil Health and Environmental Sustainability: A Comprehensive Review. J. Soil Sci. Plant Nutr. 2025, 25, 7808–7828. [Google Scholar] [CrossRef]
  11. Blanco, H.; Lal, R. Tillage Erosion. In Soil Conservation and Management; Springer Nature: Cham, Switzerland, 2023; pp. 103–125. ISBN 978-3-031-30340-1. [Google Scholar]
  12. Silva, T.P.; Bressiani, D.; Ebling, É.D.; Reichert, J.M. Best Management Practices to Reduce Soil Erosion and Change Water Balance Components in Watersheds under Grain and Dairy Production. Int. Soil Water Conserv. Res. 2024, 12, 121–136. [Google Scholar] [CrossRef]
  13. Kaye, J.P.; Quemada, M. Using Cover Crops to Mitigate and Adapt to Climate Change. A Review. Agron. Sustain. Dev. 2017, 37, 4. [Google Scholar] [CrossRef]
  14. López-Vicente, M.; Calvo-Seas, E.; Álvarez, S.; Cerdà, A. Effectiveness of Cover Crops to Reduce Loss of Soil Organic Matter in a Rainfed Vineyard. Land 2020, 9, 230. [Google Scholar] [CrossRef]
  15. Cárceles Rodríguez, B.C.; Durán Zuazo, V.H.D.; Herencia Galán, J.F.H.; Lipan, L.; Soriano, M.; Hernández, F.; Sendra, E.; Carbonell-Barrachina, Á.A.; Ruiz, B.G.; García-Tejero, I.F. Soil Management Strategies in Organic Almond Orchards: Implications for Soil Rehabilitation and Nut Quality. Agronomy 2023, 13, 749. [Google Scholar] [CrossRef]
  16. Pagliai, M.; Vignozzi, N.; Pellegrini, S. Soil Structure and the Effect of Management Practices. Soil Tillage Res. 2004, 79, 131–143. [Google Scholar] [CrossRef]
  17. Amézketa, E. Soil Aggregate Stability: A Review. J. Sustain. Agric. 1999, 14, 83–151. [Google Scholar] [CrossRef]
  18. Barthès, B.; Roose, E. Aggregate Stability as an Indicator of Soil Susceptibility to Runoff and Erosion; Validation at Several Levels. CATENA 2002, 47, 133–149. [Google Scholar] [CrossRef]
  19. Six, J.; Bossuyt, H.; Degryze, S.; Denef, K. A History of Research on the Link between (Micro)Aggregates, Soil Biota, and Soil Organic Matter Dynamics. Soil Tillage Res. 2004, 79, 7–31. [Google Scholar] [CrossRef]
  20. Bagagiolo, G.; Biddoccu, M.; Rabino, D.; Cavallo, E. Effects of Rows Arrangement, Soil Management, and Rainfall Characteristics on Water and Soil Losses in Italian Sloping Vineyards. Environ. Res. 2018, 166, 690–704. [Google Scholar] [CrossRef]
  21. Biddoccu, M.; Ferraris, S.; Opsi, F.; Cavallo, E. Long-Term Monitoring of Soil Management Effects on Runoff and Soil Erosion in Sloping Vineyards in Alto Monferrato (North–West Italy). Soil Tillage Res. 2016, 155, 176–189. [Google Scholar] [CrossRef]
  22. Biddoccu, M.; Guzmán, G.; Capello, G.; Thielke, T.; Strauss, P.; Winter, S.; Zaller, J.G.; Nicolai, A.; Cluzeau, D.; Popescu, D.; et al. Evaluation of Soil Erosion Risk and Identification of Soil Cover and Management Factor (C) for RUSLE in European Vineyards with Different Soil Management. Int. Soil Water Conserv. Res. 2020, 8, 337–353. [Google Scholar] [CrossRef]
  23. Stanchi, S.; Zecca, O.; Hudek, C.; Pintaldi, E.; Viglietti, D.; D’Amico, M.E.; Colombo, N.; Goslino, D.; Letey, M.; Freppaz, M. Effect of Soil Management on Erosion in Mountain Vineyards (N-W Italy). Sustainability 2021, 13, 1991. [Google Scholar] [CrossRef]
  24. Liebhard, G.; Guzmán, G.; Gómez, J.A.; Winter, S.; Zaller, J.G.; Bauer, T.; Nicolai, A.; Cluzeau, D.; Popescu, D.; Bunea, C.; et al. Vineyard Cover Crop Management Strategies and Their Effect on Soil Properties across Europe. Eur. J. Soil Sci. 2024, 75, e13573. [Google Scholar] [CrossRef]
  25. Ruiz-Colmenero, M.; Bienes, R.; Marques, M.J. Soil and Water Conservation Dilemmas Associated with the Use of Green Cover in Steep Vineyards. Soil Tillage Res. 2011, 117, 211–223. [Google Scholar] [CrossRef]
  26. Salomé, C.; Coll, P.; Lardo, E.; Metay, A.; Villenave, C.; Marsden, C.; Blanchart, E.; Hinsinger, P.; Le Cadre, E. The Soil Quality Concept as a Framework to Assess Management Practices in Vulnerable Agroecosystems: A Case Study in Mediterranean Vineyards. Ecol. Indic. 2016, 61, 456–465. [Google Scholar] [CrossRef]
  27. Verma, N.S.; Yadav, D.; Chouhan, M.; Bhagat, C.; Kochale, P. Understanding Potential Impact of Green Manuring on Crop and Soil: A Comprehensive Review. Biol. Forum-Int. J. 2023, 15, 832–839. [Google Scholar]
  28. Wang, Y.; Yu, A.; Shang, Y.; Wang, P.; Wang, F.; Yin, B.; Liu, Y.; Zhang, D.; Chai, Q. Research Progress on the Improvement of Farmland Soil Quality by Green Manure. Agriculture 2025, 15, 768. [Google Scholar] [CrossRef]
  29. Boix-Fayos, C.; Martínez-Mena, M.; Arnau-Rosalén, E.; Calvo-Cases, A.; Castillo, V.; Albaladejo, J. Measuring Soil Erosion by Field Plots: Understanding the Sources of Variation. Earth-Sci. Rev. 2006, 78, 267–285. [Google Scholar] [CrossRef]
  30. Kuhn, N.J.; Greenwood, P.; Fister, W. Use of Field Experiments in Soil Erosion Research. In Developments in Earth Surface Processes; Elsevier: Amsterdam, The Netherlands, 2014; Volume 18, pp. 175–200. ISBN 978-0-444-63402-3. [Google Scholar]
  31. Bailey, G.; Li, Y.; McKinney, N.; Yoder, D.; Wright, W.; Washington-Allen, R. Las2DoD: Change Detection Based on Digital Elevation Models Derived from Dense Point Clouds with Spatially Varied Uncertainty. Remote Sens. 2022, 14, 1537. [Google Scholar] [CrossRef]
  32. Li, L.; Nearing, M.A.; Nichols, M.H.; Polyakov, V.O.; Cavanaugh, M.L. Using Terrestrial LiDAR to Measure Water Erosion on Stony Plots under Simulated Rainfall. Earth Surf. Process. Landf. 2020, 45, 484–495. [Google Scholar] [CrossRef]
  33. Yang, S.; Guan, Y.; Zhao, C.; Zhang, C.; Bai, J.; Chen, K. Determining the Influence of Catchment Area on Intensity of Gully Erosion Using High-Resolution Aerial Imagery: A 40-Year Case Study from the Loess Plateau, Northern China. Geoderma 2019, 347, 90–102. [Google Scholar] [CrossRef]
  34. Nadal-Romero, E.; Revuelto, J.; Errea, P.; López-Moreno, J.I. The Application of Terrestrial Laser Scanner and SfM Photogrammetry in Measuring Erosion and Deposition Processes in Two Opposite Slopes in a Humid Badlands Area (Central Spanish Pyrenees). Soil 2015, 1, 561–573. [Google Scholar] [CrossRef]
  35. Li, P.; Ren, F.; Hu, J.; Yan, L.; Hao, M.; Liu, L.; Gao, J.; Dang, T. Monitoring Soil Erosion on Field Slopes by Terrestrial Laser Scanning and Structure-from-motion. Land Degrad. Dev. 2023, 34, 3663–3680. [Google Scholar] [CrossRef]
  36. Gao, C.; Li, P.; Hu, J.; Yan, L.; Latifi, H.; Yao, W.; Hao, M.; Gao, J.; Dang, T.; Zhang, S. Development of Gully Erosion Processes: A 3D Investigation Based on Field Scouring Experiments and Laser Scanning. Remote Sens. Environ. 2021, 265, 112683. [Google Scholar] [CrossRef]
  37. Rodrigo-Comino, J.; Davis, J.; Keesstra, S.D.; Cerdà, A. Updated Measurements in Vineyards Improves Accuracy of Soil Erosion Rates. Agron. J. 2018, 110, 411–417. [Google Scholar] [CrossRef]
  38. Kinnell, P.I.A. A Review of the Design and Operation of Runoff and Soil Loss Plots. CATENA 2016, 145, 257–265. [Google Scholar] [CrossRef]
  39. Brenot, J.; Quiquerez, A.; Petit, C.; Garcia, J.-P. Erosion Rates and Sediment Budgets in Vineyards at 1-m Resolution Based on Stock Unearthing (Burgundy, France). Geomorphology 2008, 100, 345–355. [Google Scholar] [CrossRef]
  40. Costantini, E.A.C. Linee Guida dei Metodi di Rilevamento e Informatizzazione dei Dati Pedologici; S.EL.CA.: Firenze, Italy, 2007. [Google Scholar]
  41. Diodato, N.; Bellocchi, G. Estimating Monthly (R)USLE Climate Input in a Mediterranean Region Using Limited Data. J. Hydrol. 2007, 345, 224–236. [Google Scholar] [CrossRef]
  42. Kemper, W.D.; Rosenau, R.C. Aggregate Stability and Size Distribution. In Methods of Soil Analysis; American Society of Agronomy: Madison WI, USA, 1986; Volume 1, pp. 425–442. [Google Scholar]
  43. Legout, C.; Leguédois, S.; Le Bissonnais, Y. Aggregate Breakdown Dynamics under Rainfall Compared with Aggregate Stability Measurements. Eur. J. Soil Sci. 2005, 56, 225–238. [Google Scholar] [CrossRef]
  44. Rodrigo-Comino, J.; Keshavarzi, A.; Zeraatpisheh, M.; Gyasi-Agyei, Y.; Cerdà, A. Determining the Best ISUM (Improved Stock Unearthing Method) Sampling Point Number to Model Long-Term Soil Transport and Micro-Topographical Changes in Vineyards. Comput. Electron. Agric. 2019, 159, 147–156. [Google Scholar] [CrossRef]
  45. Saxton, K.E.; Rawls, W.J.; Romberger, J.S.; Papendick, R.I. Estimating Generalized Soil-water Characteristics from Texture. Soil Sci. Soc. Am. J. 1986, 50, 1031–1036. [Google Scholar] [CrossRef]
  46. Paroissien, J.-B.; Lagacherie, P.; Le Bissonnais, Y. A Regional-Scale Study of Multi-Decennial Erosion of Vineyard Fields Using Vine-Stock Unearthing–Burying Measurements. CATENA 2010, 82, 159–168. [Google Scholar] [CrossRef]
  47. De Notaris, C.; Jensen, J.L.; Olesen, J.E.; Stumpf Da Silva, T.; Rasmussen, J.; Panagea, I.; Rubæk, G.H. Long-Term Soil Quality Effects of Soil and Crop Management in Organic and Conventional Arable Cropping Systems. Geoderma 2021, 403, 115383. [Google Scholar] [CrossRef]
  48. White, K.E.; Brennan, E.B.; Cavigelli, M.A.; Smith, R.F. Winter Cover Crops Increase Readily Decomposable Soil Carbon, but Compost Drives Total Soil Carbon during Eight Years of Intensive, Organic Vegetable Production in California. PLoS ONE 2020, 15, e0228677. [Google Scholar] [CrossRef]
  49. Lee, S.; Chu, M.L.; Guzman, J.A.; Flanagan, D.C. Modeling Soil Erodibility and Critical Shear Stress Parameters for Soil Loss Estimation. Soil Tillage Res. 2022, 218, 105292. [Google Scholar] [CrossRef]
  50. Wang, Y.; Zhang, J.H.; Zhang, Z.H.; Jia, L.Z. Impact of Tillage Erosion on Water Erosion in a Hilly Landscape. Sci. Total Environ. 2016, 551–552, 522–532. [Google Scholar] [CrossRef] [PubMed]
  51. Napoli, M.; Cecchi, S.; Orlandini, S.; Mugnai, G.; Zanchi, C.A. Simulation of Field-Measured Soil Loss in Mediterranean Hilly Areas (Chianti, Italy) with RUSLE. CATENA 2016, 145, 246–256. [Google Scholar] [CrossRef]
  52. Barrena-González, J.; Rodrigo-Comino, J.; Gyasi-Agyei, Y.; Pulido Fernández, M.; Cerdà, A. Applying the RUSLE and ISUM in the Tierra de Barros Vineyards (Extremadura, Spain) to Estimate Soil Mobilisation Rates. Land 2020, 9, 93. [Google Scholar] [CrossRef]
  53. Torri, D.; Sfalanga, M.; Chisci, G. Threshold Conditions for Incipient Rilling. In Rill Erosion: Processes and Significance; Catena, Supplement; Bryan, R.B., Ed.; Catena Verlag: Cremlingen, Germany, 1987; Volume 8, pp. 97–105. ISBN 3-923381-07-7. [Google Scholar]
  54. Capello, G.; Biddoccu, M.; Ferraris, S.; Cavallo, E. Effects of Tractor Passes on Hydrological and Soil Erosion Processes in Tilled and Grassed Vineyards. Water 2019, 11, 2118. [Google Scholar] [CrossRef]
  55. Celik, I.; Gunal, H.; Budak, M.; Akpinar, C. Effects of Long-Term Organic and Mineral Fertilizers on Bulk Density and Penetration Resistance in Semi-Arid Mediterranean Soil Conditions. Geoderma 2010, 160, 236–243. [Google Scholar] [CrossRef]
  56. Hillel, D.I. Fundamentals of Soil Physics; Academic Press: New York, NY, USA, 1980; ISBN 978-0-08-091870-9. [Google Scholar]
  57. Brunori, F.; Penzo, M.C.; Torri, D. Soil Shear Strength: Its Measurement and Soil Detachability. CATENA 1989, 16, 59–71. [Google Scholar] [CrossRef]
  58. Zhang, B.; Jia, Y.; Fan, H.; Guo, C.; Su, F.; Li, S.; Fu, J.; Zhang, X.; Yu, M.; Yang, M.; et al. Impact of Soil Compaction on the Rill Erosion of Mollisol by Waterflow: A Comparative Analysis before and after the Seasonal Freezing and Thawing. Int. Soil Water Conserv. Res. 2025, 13, 756–770. [Google Scholar] [CrossRef]
  59. Rodrigo Comino, J.; Keesstra, S.D.; Cerdà, A. Connectivity Assessment in Mediterranean Vineyards Using Improved Stock Unearthing Method, LiDAR and Soil Erosion Field Surveys. Earth Surf. Process. Landf. 2018, 43, 2193–2206. [Google Scholar] [CrossRef]
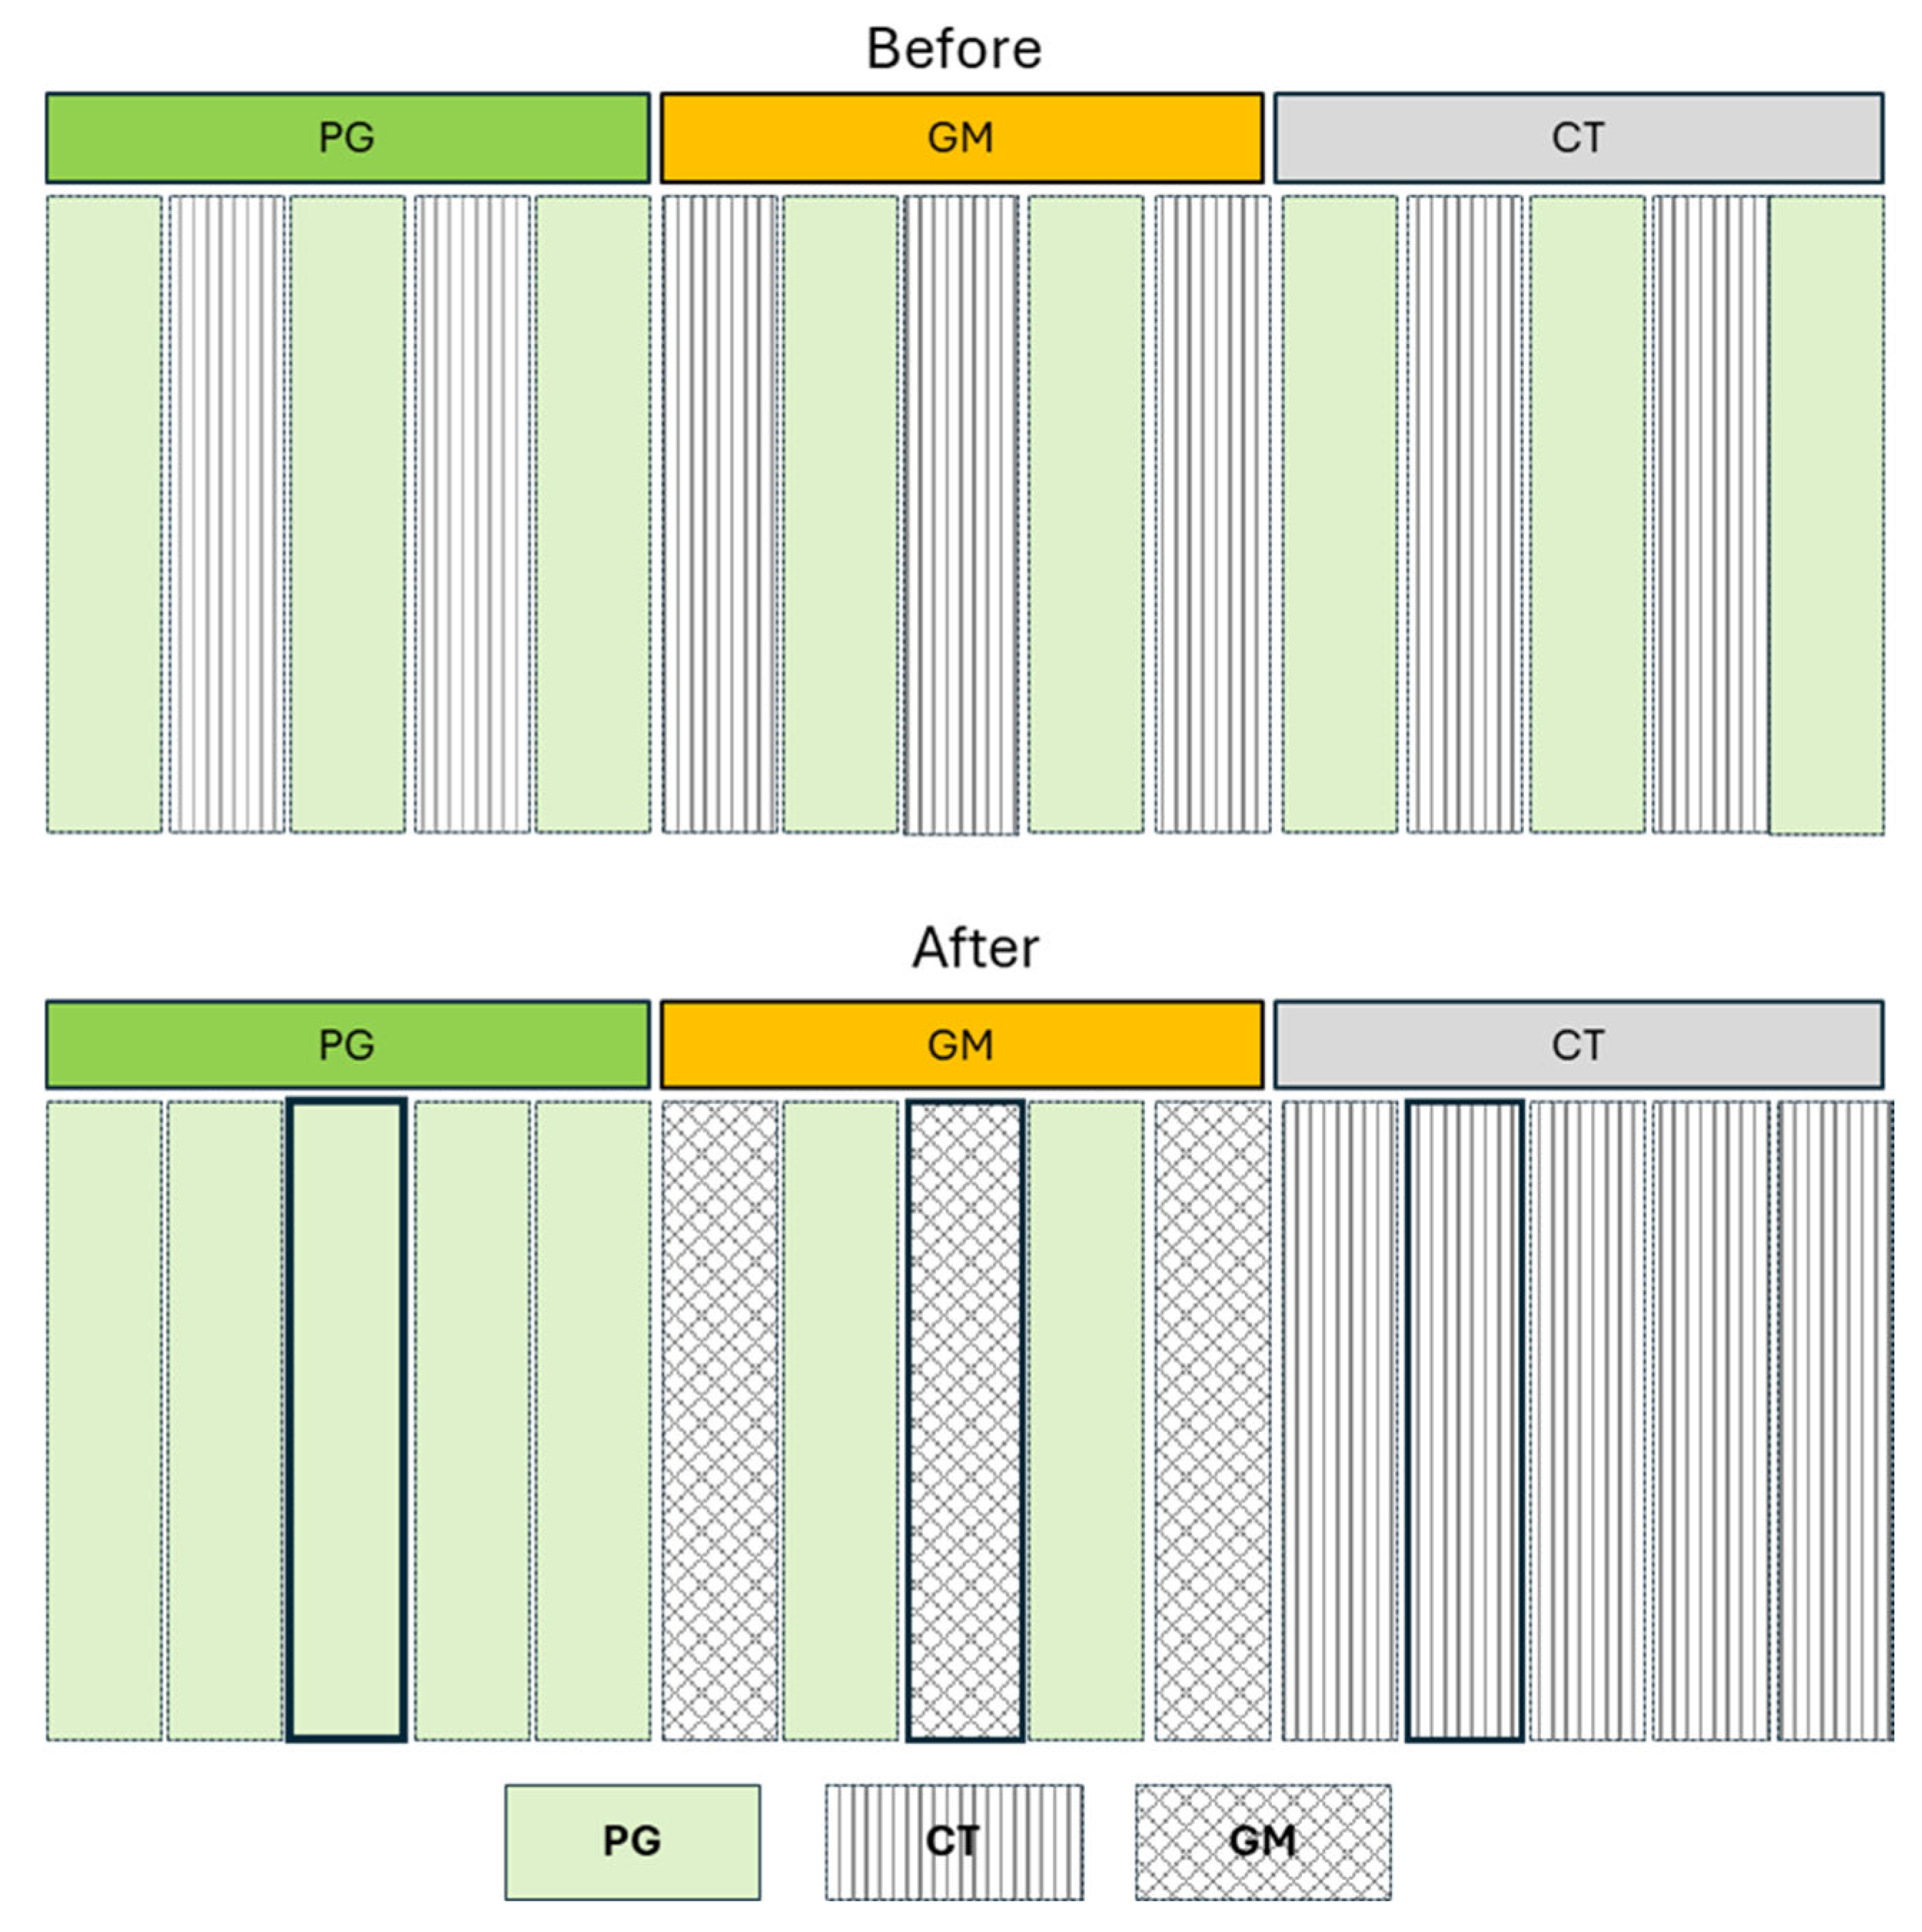
Figure 1. Inter-rows management scheme before and after the start of the experiment. The surveyed inter-rows are highlighted in bold.
Agriculture 15 02218 g001
Figure 2. Scheme of surface survey along a transect on the inter-row; erosion and accumulation areas are identified by red and green colour, respectively. The origin of the coordinate system is set at point O.
Agriculture 15 02218 g002
Figure 3. Schematic representation of the calculation of erosion and accumulation areas along a transect; the dashed line is the initial soil surface, the circles indicate experimental data points, and the solid line is the fitted curve representing the actual surface.
Agriculture 15 02218 g003
Figure 4. Schematic representation of the finite soil volume (ΔVi)12 estimation between consecutive transects (T1 and T2). The solid red lines indicate the initial ground surface, while the green and red trapezoidal prisms represent volumes of accumulated and eroded soil, respectively.
Agriculture 15 02218 g004
Figure 5. Dynamics of (a) aggregate stability, expressed as mean weight diameter (MWD), and (b) soil organic carbon (SOC) content during the three monitoring years in the plots under different soil management. For each year, different letters indicate significantly different values (p ≤ 0.05) according to Duncan’s multiple range test. (ns = not significantly different values).
Agriculture 15 02218 g005
Figure 6. Soil mobilization rates (Mg ha−1 yr−1) between consecutive transects of the CT inter-row in October 2020 and 2022.
Agriculture 15 02218 g006
Figure 7. Soil mobilization rates (Mg ha−1 yr−1) between consecutive transects of the GM inter-row in October 2020 and 2022.
Agriculture 15 02218 g007
Figure 8. Soil mobilization rates (Mg ha−1 yr−1) between consecutive transects of the PG inter-row in October 2020 and 2022.
Agriculture 15 02218 g008
Table 1. Botanical composition of the cover crops used.
CropPlant SpeciesFamilySeed (%)
PGLolium perenne L. (perennial ryegrass)Poaceae33
Trifolium subterraneum L. (subterranean clover)Fabaceae33
Festuca rubra L. (red fescue)Poaceae33
GMVicia faba L. var. “Minor” Beck (fava bean)Fabaceae40
Lupinus albus L. (white lupine)Fabaceae8
Pisum sativum L. (garden pea)Fabaceae18
x Triticosecale Wittm. [Secale × Triticum] (triticale)Poaceae15
Hordeum vulgare L. (common barley)Poaceae13
Sinapis alba L. (white mustard)Brassicaceae3.6
Brassica napus L. (rape)Brassicaceae2.4
Table 2. Monthly and annual erosivity calculated according to Diodato and Bellocchi [41], and total annual rainfall depth (P) in the experimental area during the study period (2019–2022) and over the long-term period.
YearMonthly Erosivity (MJ mm ha−1 h−1)Annual ErosivityP
(mm)
JFMAMJJASOND
2019251604116928629616369355214816241054
202051481891374527817861053341329616001075
20212952794249939101310301602461398918
202237926624423061122490147621039754
Long term67159180224153703333103124135711353955
Table 3. Effects of different soil management systems on total erosion and total deposition (Mg ha−1 yr−1). Different letters indicate significantly different values (p ≤ 0.05) according to Duncan’s multiple range test. Standard error is reported in parentheses. (n.s. = not significant *** = p ≤ 0.001).
Total ErosionTotal Deposition
Yearn.s.n.s.
Management******
Year × Managementn.s.n.s.
2020CT37.1 (2.2) b5.2 (0.2) a
GM58.3 (2.1) a2.3 (0.2) c
PG26.1 (2.4) c3.7 (0.6) b
2022CT33.7 (2.2) b5.4 (0.6) a
GM54.8 (3.1) a1.8 (0.2) c
PG24.5 (2.5) c3.4 (0.6) b
MeanCT35.4 (1.6) b5.3 (0.3) a
GM56.6 (1.9) a2.1 (0.2) c
PG25.3 (1.7) c3.6 (0.4) b
Table 4. Total erosion and total deposition (Mg ha−1) in the different inter-row zones. For each treatment, different letters indicate significantly different values (p ≤ 0.05) according to Duncan’s multiple range test. Standard error is reported in parentheses (n.s. = not significant; *** = p ≤ 0.001).
Treatments
CTPGGM
Total erosion
Yearn.s.n.s.n.s.
Zone*********
Year × Zonen.s.n.s.n.s.
Centre18.68 (0.84) a13.25 (0.94) a29.09 (0.87) a
Track16.23 (0.71) b10.79 (0.81) a25.97 (0.91) b
Row0.47 (0.12) c1.27 (0.19) b1.5 (0.24) c
Total deposition
Yearn.s.n.s.n.s.
Zone*********
Year × Zonen.s.n.s.n.s.
Centre0 (0) b0 (0) b0 (0) b
Track0.38 (0.06) b0.98 (0.39) b0.21 (0.08) b
Row4.9 (0.25) a2.57 (0.32) a1.84 (0.17) a
Table 5. Correlation matrices between mobilized soil mass and main vineyard geometric properties (n.s. = not significant; * = p ≤ 0.05 ** = p ≤ 0.01; *** = p ≤ 0.001).
CTE_TotalD_TotalSlopeLength
E_Total
D_Total−0.675 **
Slope0.637 **−0.43 n.s.
Length−0.38 n.s.0.141 n.s.−0.875 ***
PGE_TotalD_TotalSlopeLength
E_Total
D_Total−0.641 **
Slope0.494 *−0.708 ***
Length−0.22 n.s.0.656 **−0.912 ***
GME_TotalD_TotalSlopeLength
E_Total
D_Total−0.645 **
Slope−0.158 n.s.0.085 n.s.
Length0.310 n.s.−0.307 n.s.−0.871 ***
Disclaimer/Publisher’s Note: The statements, opinions and data contained in all publications are solely those of the individual author(s) and contributor(s) and not of MDPI and/or the editor(s). MDPI and/or the editor(s) disclaim responsibility for any injury to people or property resulting from any ideas, methods, instructions or products referred to in the content.