1. Introduction
In agricultural pest control operations, unmanned agricultural machinery has emerged as a pivotal tool for enhancing production efficiency and reducing labor costs, primarily due to its advanced autonomous navigation technology. It is extensively utilized in various agricultural tasks, including weeding, pesticide application, crop monitoring, and harvesting [
1,
2,
3]. Currently, mainstream navigation systems predominantly employ a fusion positioning approach that integrates the Global Navigation Satellite System (GNSS) with an Inertial Measurement Unit (IMU) [
4]. However, the intricate nature of field environments often leads to weak GNSS signals, while the cumulative error associated with the IMU can substantially increase during prolonged operations. When these two systems fail to coordinate effectively, it may result in trajectory deviations or even operational disruptions [
5].
Vision-based navigation technology exhibits superior environmental adaptability through real-time analysis of crop row line features, rendering it particularly suitable for operational scenarios characterized by severe signal obstruction [
6,
7]. However, the temporal matching issue between dynamic perception and motion control in visual systems can significantly impact path tracking accuracy, as it is susceptible to mechanical motion status and image processing delays. Unlike autonomous passenger vehicles that travel on regular roads, agricultural operations need extremely high precision when conducted between crop rows to avoid damaging precious crops during close-range operations. Agricultural vehicles operate at a lower speed and with significant variations, which means that a perception delay of just a few hundred milliseconds could lead to significant and corrective spatial deviations. Therefore, compensating for the visual delay is a necessary condition for achieving stable and undamaged autonomous agricultural operations. To improve the autonomous operational accuracy of agricultural machinery and achieve dynamic coordination between visual navigation and motion control, it is crucial to develop stable and reliable path tracking algorithms and control strategies.
The core of path tracking lies in the application of control technology, which encompasses a variety of strategies including proportional-integral-derivative (PID) control, adaptive control, SMC, linear quadratic regulator (LQR), MPC and machine learning methods. Among these, the strong robustness of SMC and the optimization capabilities of MPC render their combined architecture promising for addressing uncertainties in complex systems. Zhang et al. designed an adaptive model predictive controller for tracking unmanned aerial vehicles, demonstrating the robust stability and control accuracy of the associated control algorithm [
8]. Dong et al. combined sliding mode control with MPC to enhance vehicle trajectory tracking performance on slippery roads [
9].Qi et al. proposed a sliding mode model predictive controller integrated with thrust allocation (TA) and utilized sliding mode control to ensure robust stability [
10]. Teng et al. introduced an improved MPC motion stability controller that combines sliding mode variable structure active steering to enhance trajectory tracking stability of vehicles in extreme scenarios [
11]. These studies underscore the potential of MPC-SMC fusion architectures in improving robustness and tracking performance. However, in agricultural machinery visual navigation scenarios, existing fusion schemes still fall short in synergistic optimization of significant perception delays and control responses.
Meanwhile, a large number of studies have focused on tracking algorithms using MPC and its nonlinear MPC [
12,
13,
14]. Mehraban et al. incorporated fuzzy logic into the MPC framework to adaptively generate controller weighting factors [
15]. Yin et al. combined extended Kalman filtering with robust tube-based model predictive control to enhance tracking performance [
16]. Considering the unique characteristics of agricultural machinery, Soitinaho et al. designed a path tracking and obstacle avoidance method based on nonlinear model predictive control specifically for front-wheel-drive tractors. The speed and steering actuators were simulated as first-order systems without time delay, achieving precise path tracking and obstacle avoidance by optimizing the cost function [
17]. However, the increased algorithmic complexity poses real-time bottlenecks for agricultural machinery embedded platforms, leading to two distinct optimization approaches: Zhou et al. proposed an adaptive learning model predictive control strategy that utilizes Bayesian optimization to dynamically adjust control rules and reduce computational burden [
18]; Wang et al. employed a particle swarm optimization algorithm to achieve adaptive optimization of the prediction range [
19]. Both approaches break through computational efficiency constraints from data-driven and time-domain optimization perspectives, respectively. To further enhance the robustness of path tracking algorithms in various environments, Zhao et al. integrated an adaptive Extended Kalman Filter (EKF) with model mismatch estimation for state compensation, achieving unbiased path following [
20]. Zhu et al. proposed a fault-tolerant MPC method based on a time-varying intermediate estimator to mitigate the effects of actuator faults [
21]. In the field of collaborative optimization of visual navigation and path tracking, Chris et al. proposed a learning-based nonlinear model predictive control approach, providing insights for the collaborative optimization of visual perception and control models [
22].While their work provides valuable insights, it does not explicitly tackle the fundamental challenge of synchronizing visual perception latency with the motion response in dynamic operational scenarios.
In summary, although existing vehicle path tracking research has made significant strides in enhancing the accuracy of kinematic models and robust control mechanisms, there remains a notable lack of focus on the development of pure vision-based navigation path tracking algorithms that incorporate robust control mechanisms. This is particularly true in complex farmland environments characterized by considerable perception delays [
23].
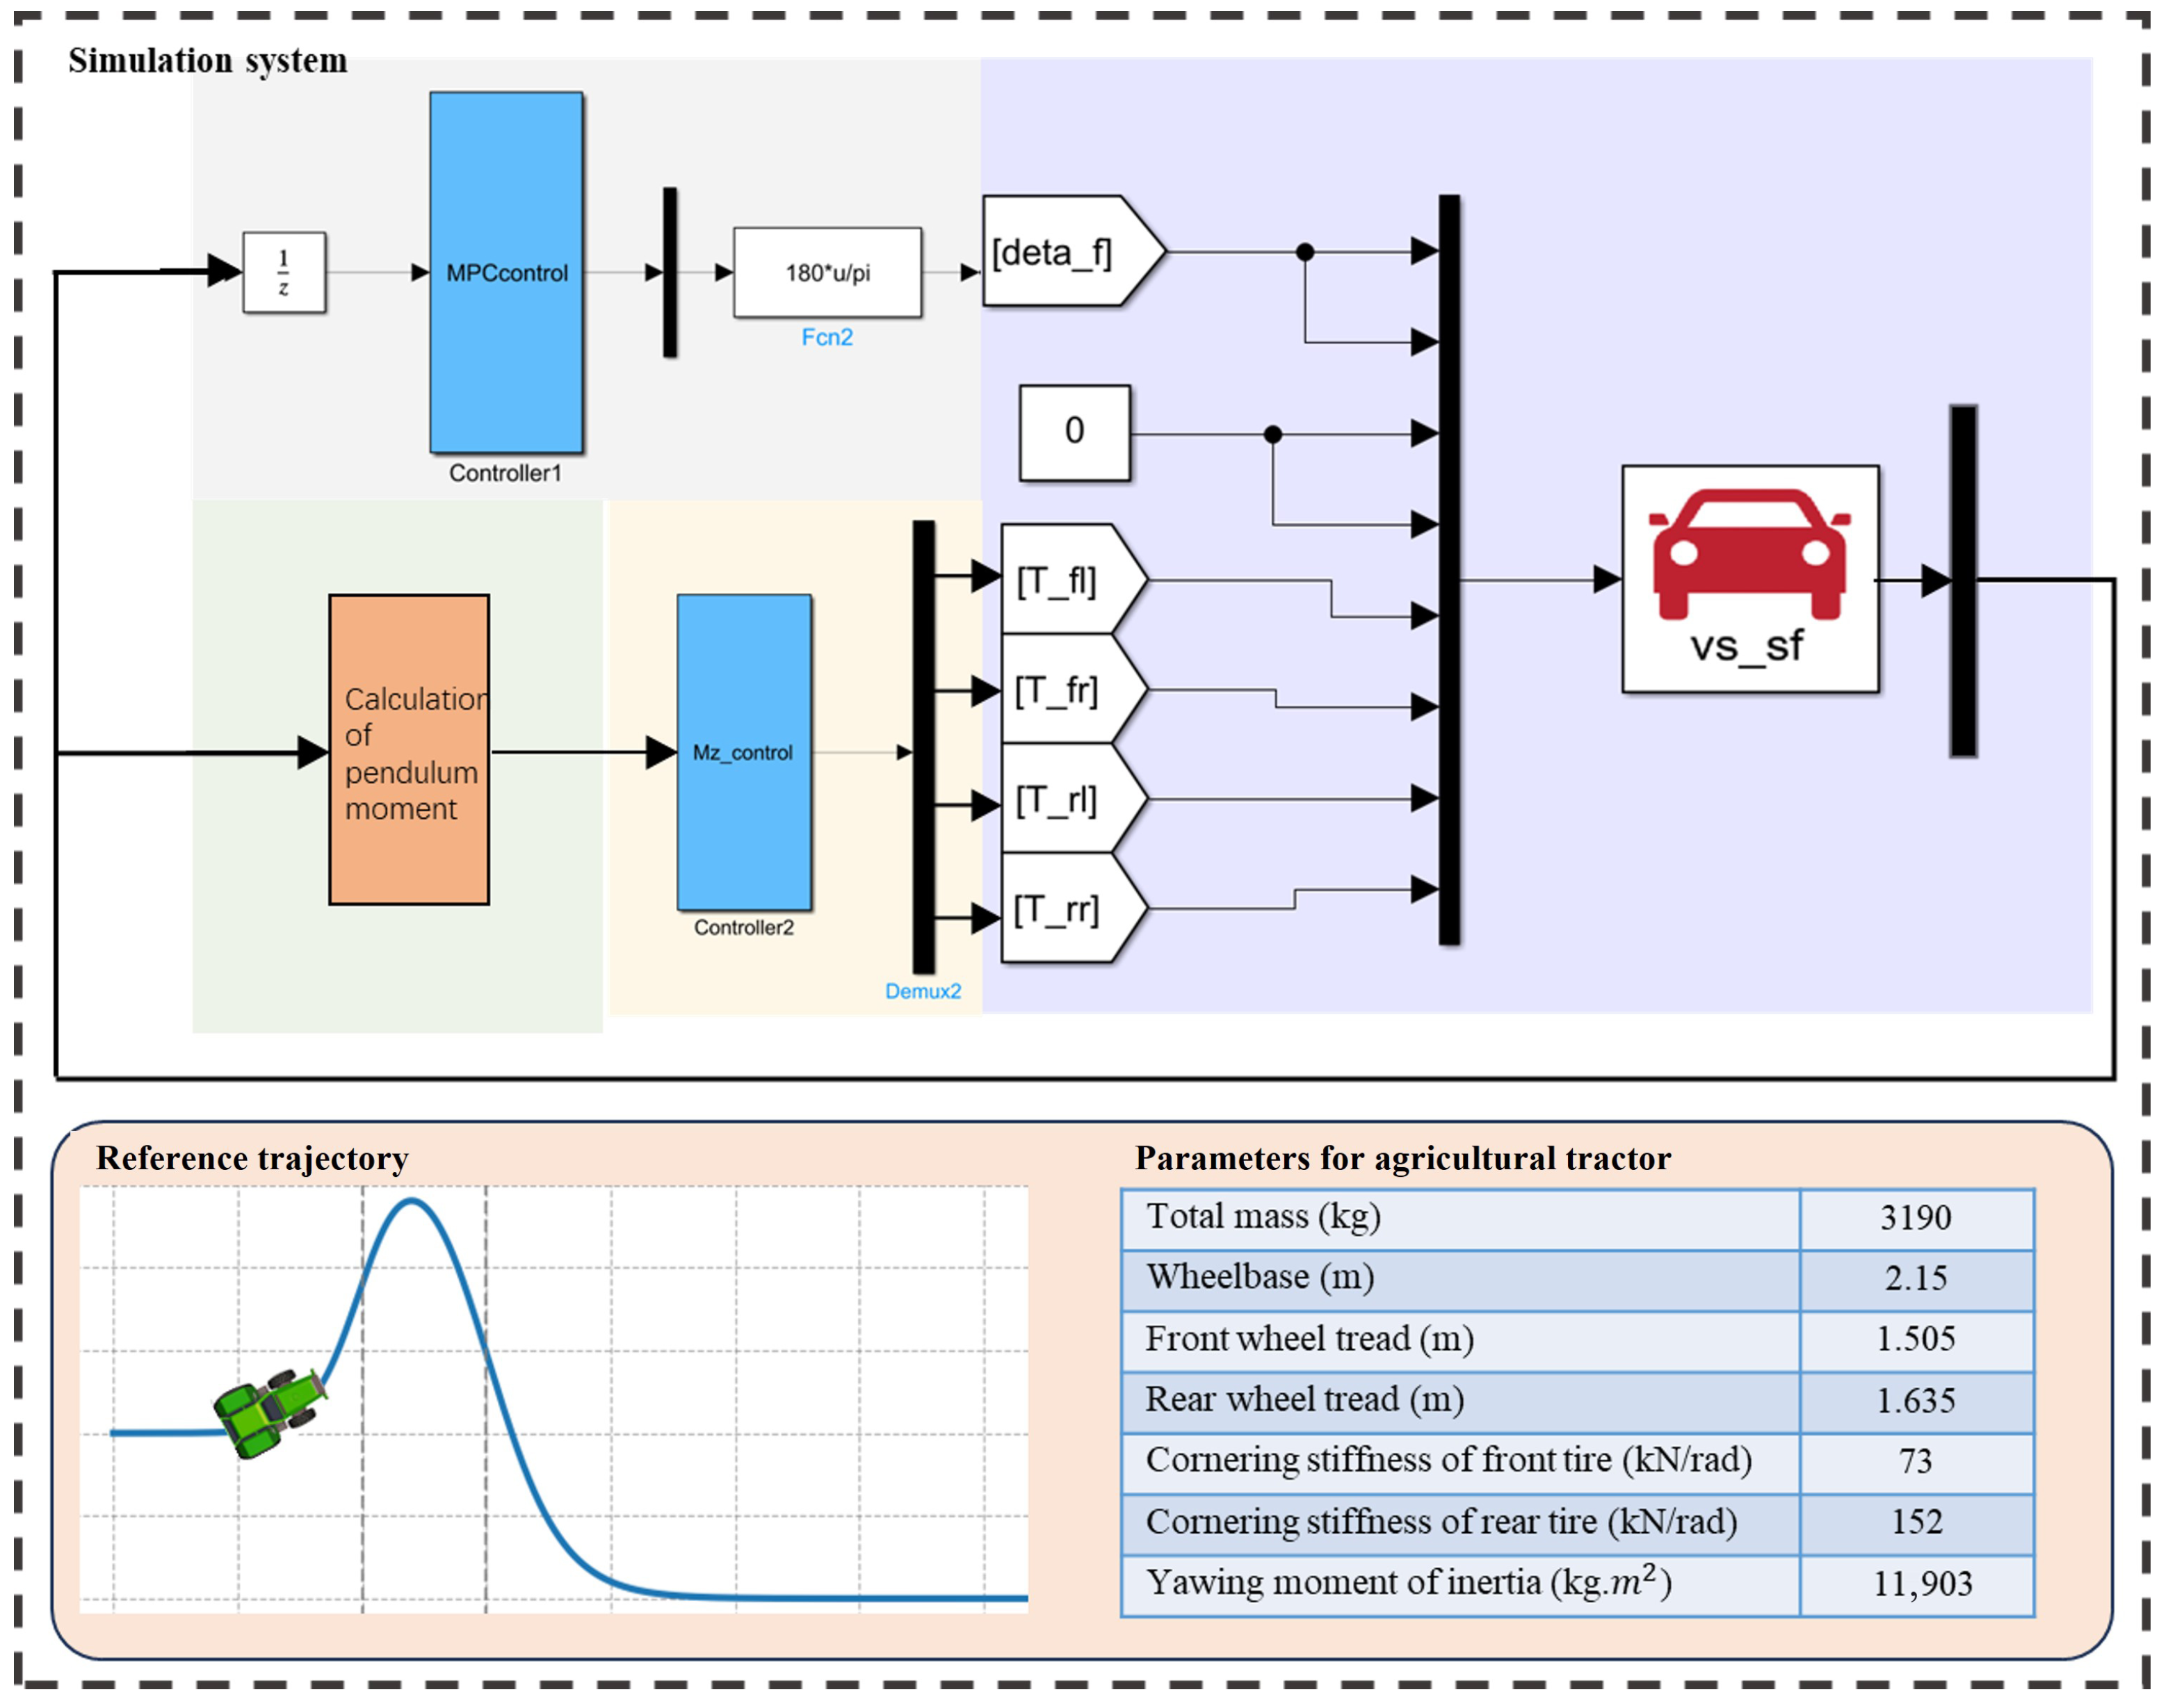
To address this gap, we propose a predictive control architecture termed HDC-CC. The overall structure framework is illustrated in
Figure 1, which integrates visual delay compensation and motion control co-optimization. The core contributions of this work are as follows: (1) To tackle the significant delay issues encountered in agricultural machinery vision systems within farmland environments, we introduce a delay compensation algorithm that based on historical compensation errors. By synergizing a delay state observer with the dynamic characteristics of agricultural machinery, we can real-time predict path drift and integrate a real-time compensation correction module at the forefront of the MPC controller. This approach effectively mitigates path tracking deviations caused by delays in image acquisition and processing; (2) We construct a hierarchical coupling framework that interlinks MPC and SMC, fostering a profound synergy between path tracking and dynamic stability through a bidirectional constraint transmission mechanism. The MPC layer generates precise front wheel steering angle commands based on forward-looking optimization, while the SMC layer continuously monitors vehicle stability boundaries in real time and utilizes the sliding surface to swiftly respond and generate active yaw moments, thereby enhancing the system’s robust adaptability to unstructured farmland environments.
2. Vehicle Model
The typical operating trajectory of an agricultural tractor in the field necessitates traveling in a straight line within a single working line, executing a turn at the end of the row, and subsequently entering the next working line. Throughout this operational process, high-performance straight-line trajectory tracking is critical to the effectiveness of tillage and constitutes the majority of the operation. Concurrently, high-precision curve trajectory tracking, particularly at the end of the row, is of paramount importance, as it not only ensures that the tractor smoothly and accurately transitions into the next working line but also significantly mitigates the risk of repeated trampling in the field caused by improper operation.
To address the demand for high-precision, robust operational trajectory tracking in complex and variable farmland environments, an accurate vehicle model is essential as the foundation for the path tracking control system [
24,
25]. Vehicle models are primarily categorized into kinematic models and dynamic models: kinematic models describe vehicle pose changes based on geometric relationships, providing the advantage of simplified calculations; dynamic models incorporate parameters such as mass, moment of inertia, and tire mechanics to more accurately characterize a vehicle’s dynamic response characteristics on unstructured terrain, particularly demonstrating superior predictive capability for complex conditions such as side slip and load transfer. For agricultural machinery operating at moderate speeds with significant lateral dynamics influences, full vehicle models with higher degrees of freedom offer superior fidelity but introduce prohibitive computational complexity for real-time model predictive control applications. Conversely, purely kinematic models lack the necessary dynamic coupling representation for accurate path tracking under varying soil conditions. The 2-DoF and 3-DoF dynamic models thus represent an optimal compromise, capturing essential lateral-yaw-roll couplings while maintaining computational tractability for embedded implementation. Given the pronounced disturbance characteristics of uneven road surfaces and time-varying soil parameters in agricultural operational environments, the development of a dynamic vehicle model is a prerequisite for achieving reliable path tracking. Among these, two-degree-of-freedom and three-degree-of-freedom vehicle models are commonly selected due to their favorable balance between model accuracy and computational complexity.
2.1. 2-DoF Vehicle Dynamics Model
The two-degree-of-freedom model of the vehicle is predicated on several idealized assumptions:
Constant Longitudinal Motion: The vehicle maintains a constant speed, resulting in zero translational acceleration along the x-axis (longitudinal direction);
Planar Ground Motion: Disregarding the effects of the suspension system, the vehicle body is constrained to perform only planar motion parallel to the ground, meaning that vertical motion, pitch motion, and roll motion are all restricted to zero;
Simplified Steering Input: The dynamics of the steering system are not considered; instead, the steering angle of the front wheels is directly utilized as the model input.
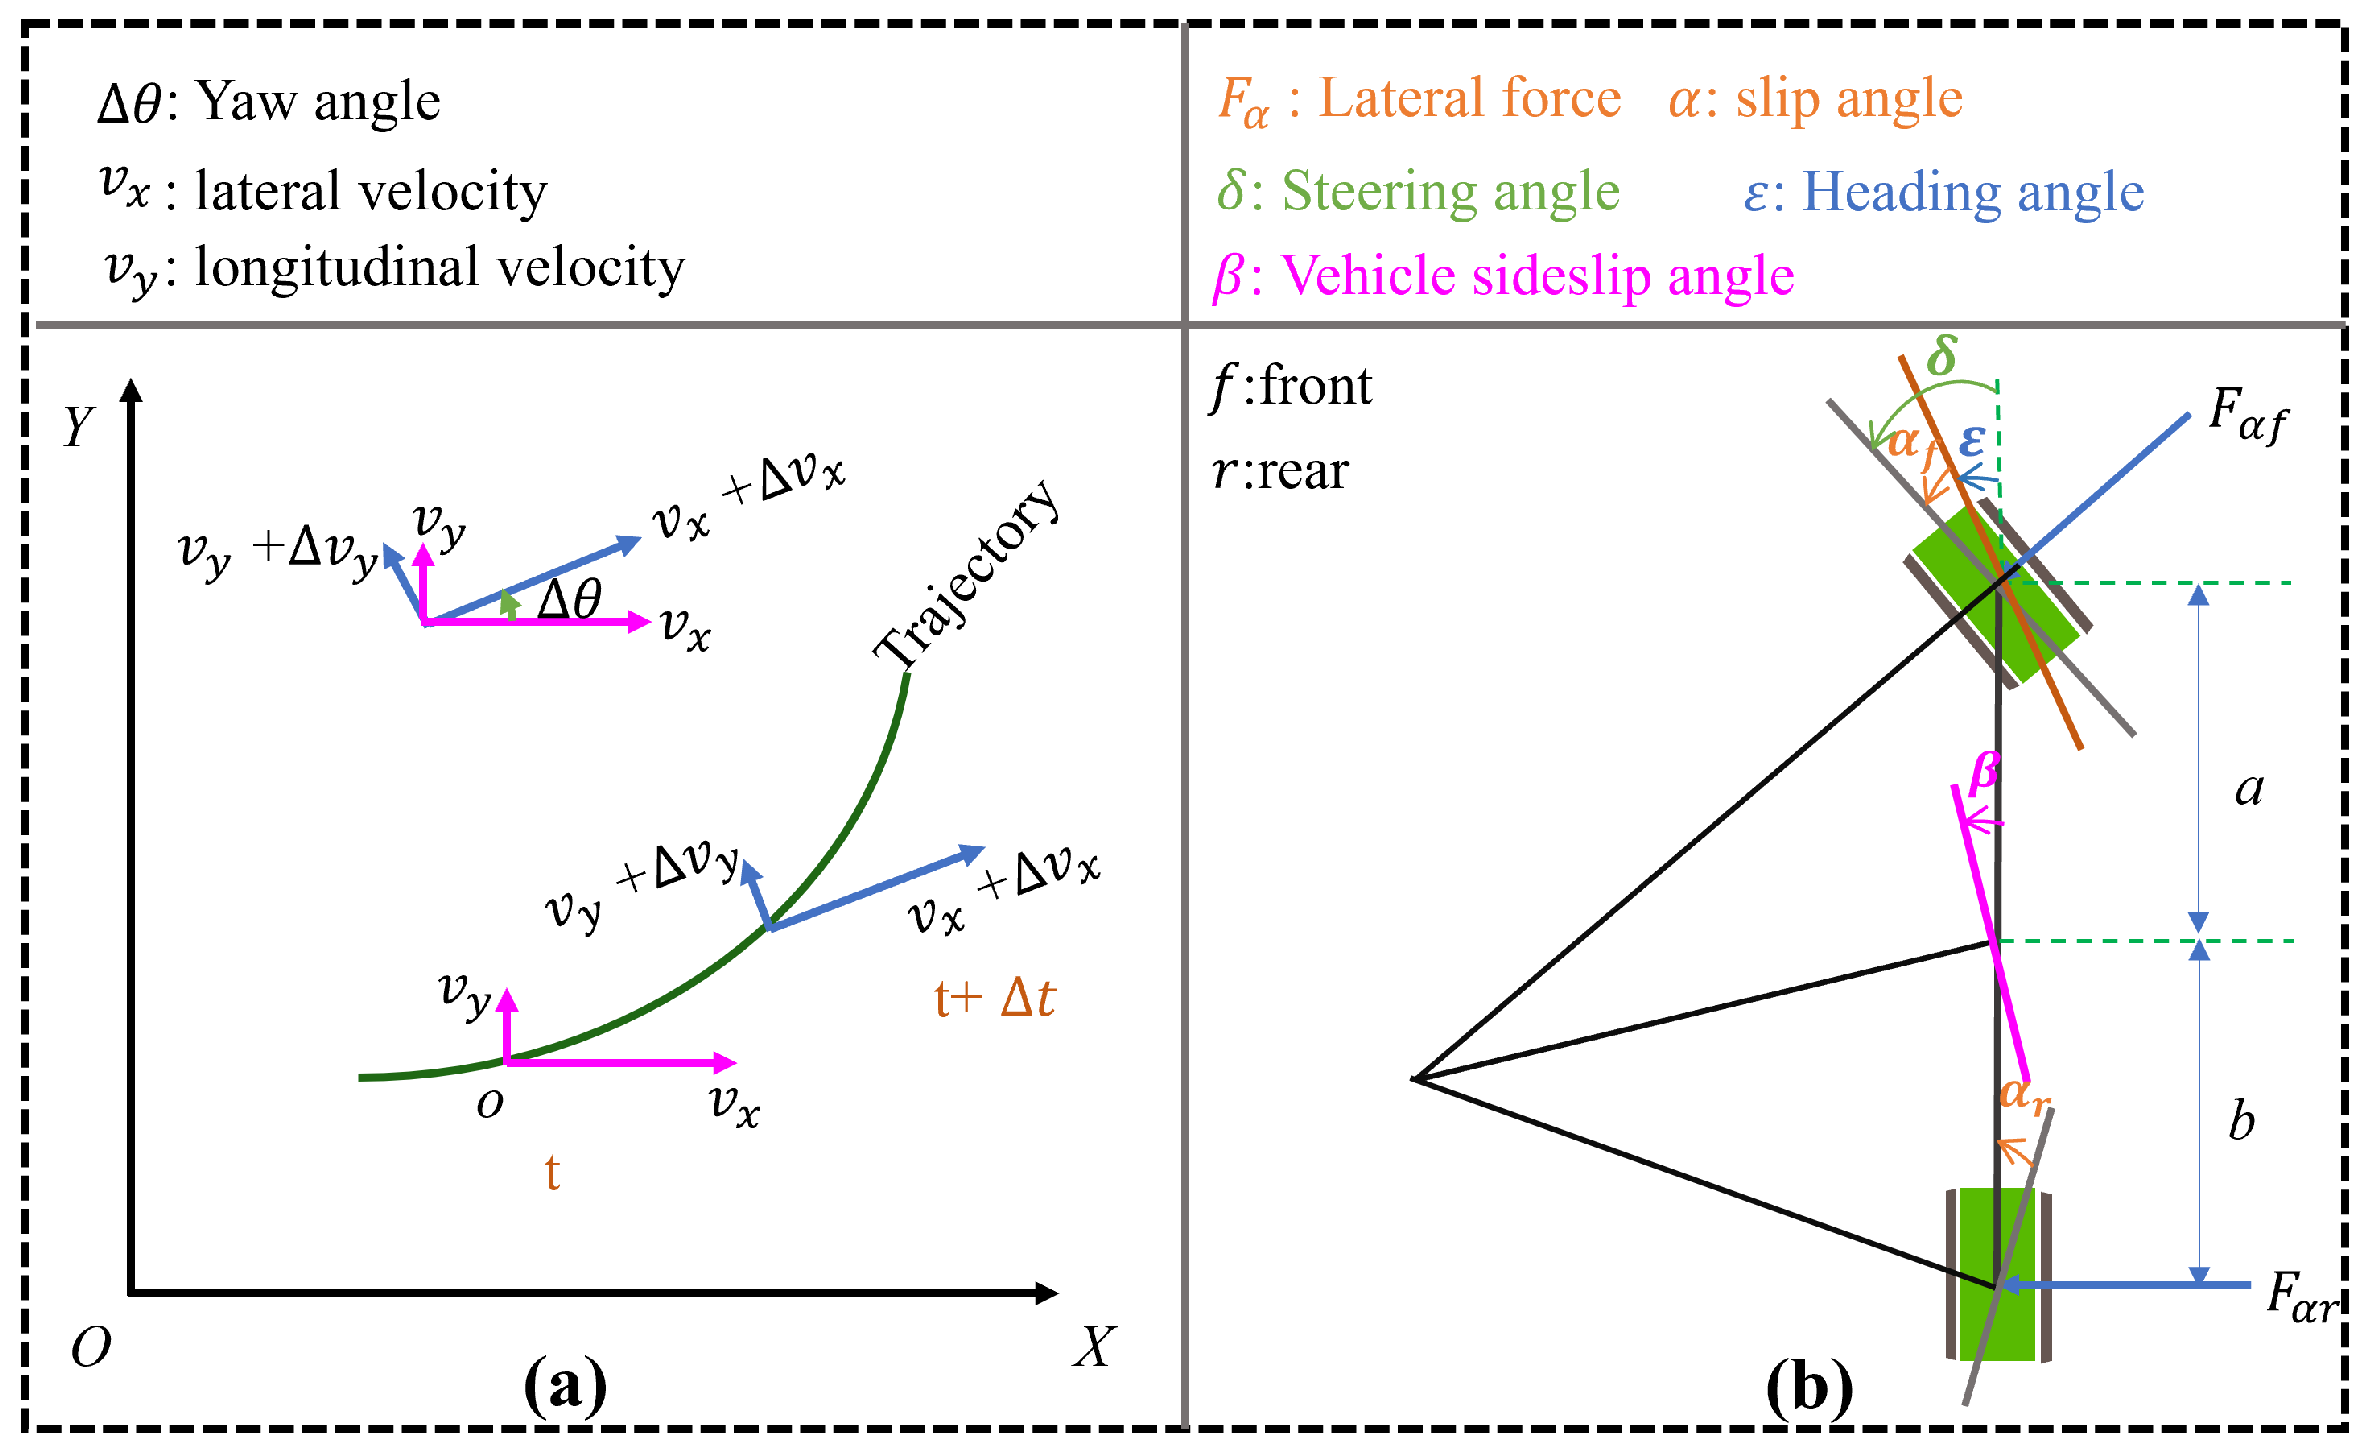
Based on these assumptions, vehicle motion is simplified to a single-track model that incorporates only lateral translational motion (along the y-axis) and yaw motion (rotation about the z-axis). While these simplifications ignore suspension dynamics and terrain-induced roll/pitch effects, which may reduce model fidelity on highly uneven terrain, they provide a sufficient dynamics representation for designing the upper-layer path tracking controller during typical steady-state field operations. Furthermore, the model presumes that the lateral stiffness of the left and right wheels on the same axle is identical, allowing a single wheel to effectively represent the entire axle. The motion and force diagram of the single-track model is illustrated in
Figure 2.
Figure 2a illustrates the change in the vehicle’s state from time
t to
. From the geometric relationship, the rate of change of velocity along the
x and
y axes of the ground coordinate system is described by Equation (
1), where
represents the yaw angular velocity,
and
represent the longitudinal and lateral velocities respectively.
Figure 2b depicts a simplified vehicle subjected solely to lateral forces acting on the front and rear axles. When the lateral acceleration of the vehicle is limited to 0.4 g or below, the lateral characteristics of the tires remain within the linear range, indicating that the lateral force
and lateral stiffness
are equivalent [
26]. Based on Newton’s second law and Euler’s law of rotation, let the vehicle mass be denoted as
m,
as the moment of inertia of the vehicle about the z-axis, a as the distance from the front axle to the center of mass, and b as the distance from the rear axle to the center of mass. The differential equations describing the dynamics of this two-degree-of-freedom system are established as shown in Equation (
2).
When
is small, the calculations for the heading angle
and the center of mass lateral deviation angle
are presented in Equations (
3) and (
4).
Thus, let
and
(constant), and calculate the lateral deviation angles of the front and rear wheels using Equations (
5) and (
6).
During agricultural straight-line tracking and gentle turning maneuvers, the vehicle exhibits sufficiently small yaw rates and sideslip angles, which confine the lateral dynamics to the linear region of tire forces. Under these conditions of small angular velocities,
= 1. By substituting Equations (
5) and (
6) into Equation (
2), let
and
, further linearizing the model as shown in Equation (
7).
The simplification yields:
2.2. 3-DoF Vehicle Dynamics Model
The three-degree-of-freedom model and the two-degree-of-freedom model differ in their capacity to comprehensively describe the vehicle’s motion state. The three-degree-of-freedom model, in addition to accounting for the vehicle’s lateral displacement and heading angle, incorporates an additional roll degree of freedom that characterizes the vehicle’s rotational motion around the vertical axis. This inclusion allows for a more accurate representation of the lateral dynamic coupling effects observed during the steering maneuvers of agricultural machinery. The model is constructed based on the previously stated assumptions 2 and 3. Under the specified force conditions, it is simplified into a three-degree-of-freedom model encompassing longitudinal, lateral, and yaw motions. The vehicle dynamics equations are presented in Equation (
10):
where
and
denote the longitudinal forces acting on the front and rear tires of the vehicle, respectively, while
and
represent the lateral forces acting on the front and rear tires. By employing a linear tire model, the lateral force Equation (
11) and longitudinal force Equation (
12) for the tires can be derived as follows:
where
and
signify the longitudinal stiffnesses;
and
indicate the lateral stiffnesses;
and
denote the slip rates; and
and
represent the lateral angles. Substituting Equations (
11) and (
12) into (
10) and rearranging the terms yields the following results:
Using Equations (
8), (
9), and (
13)–(
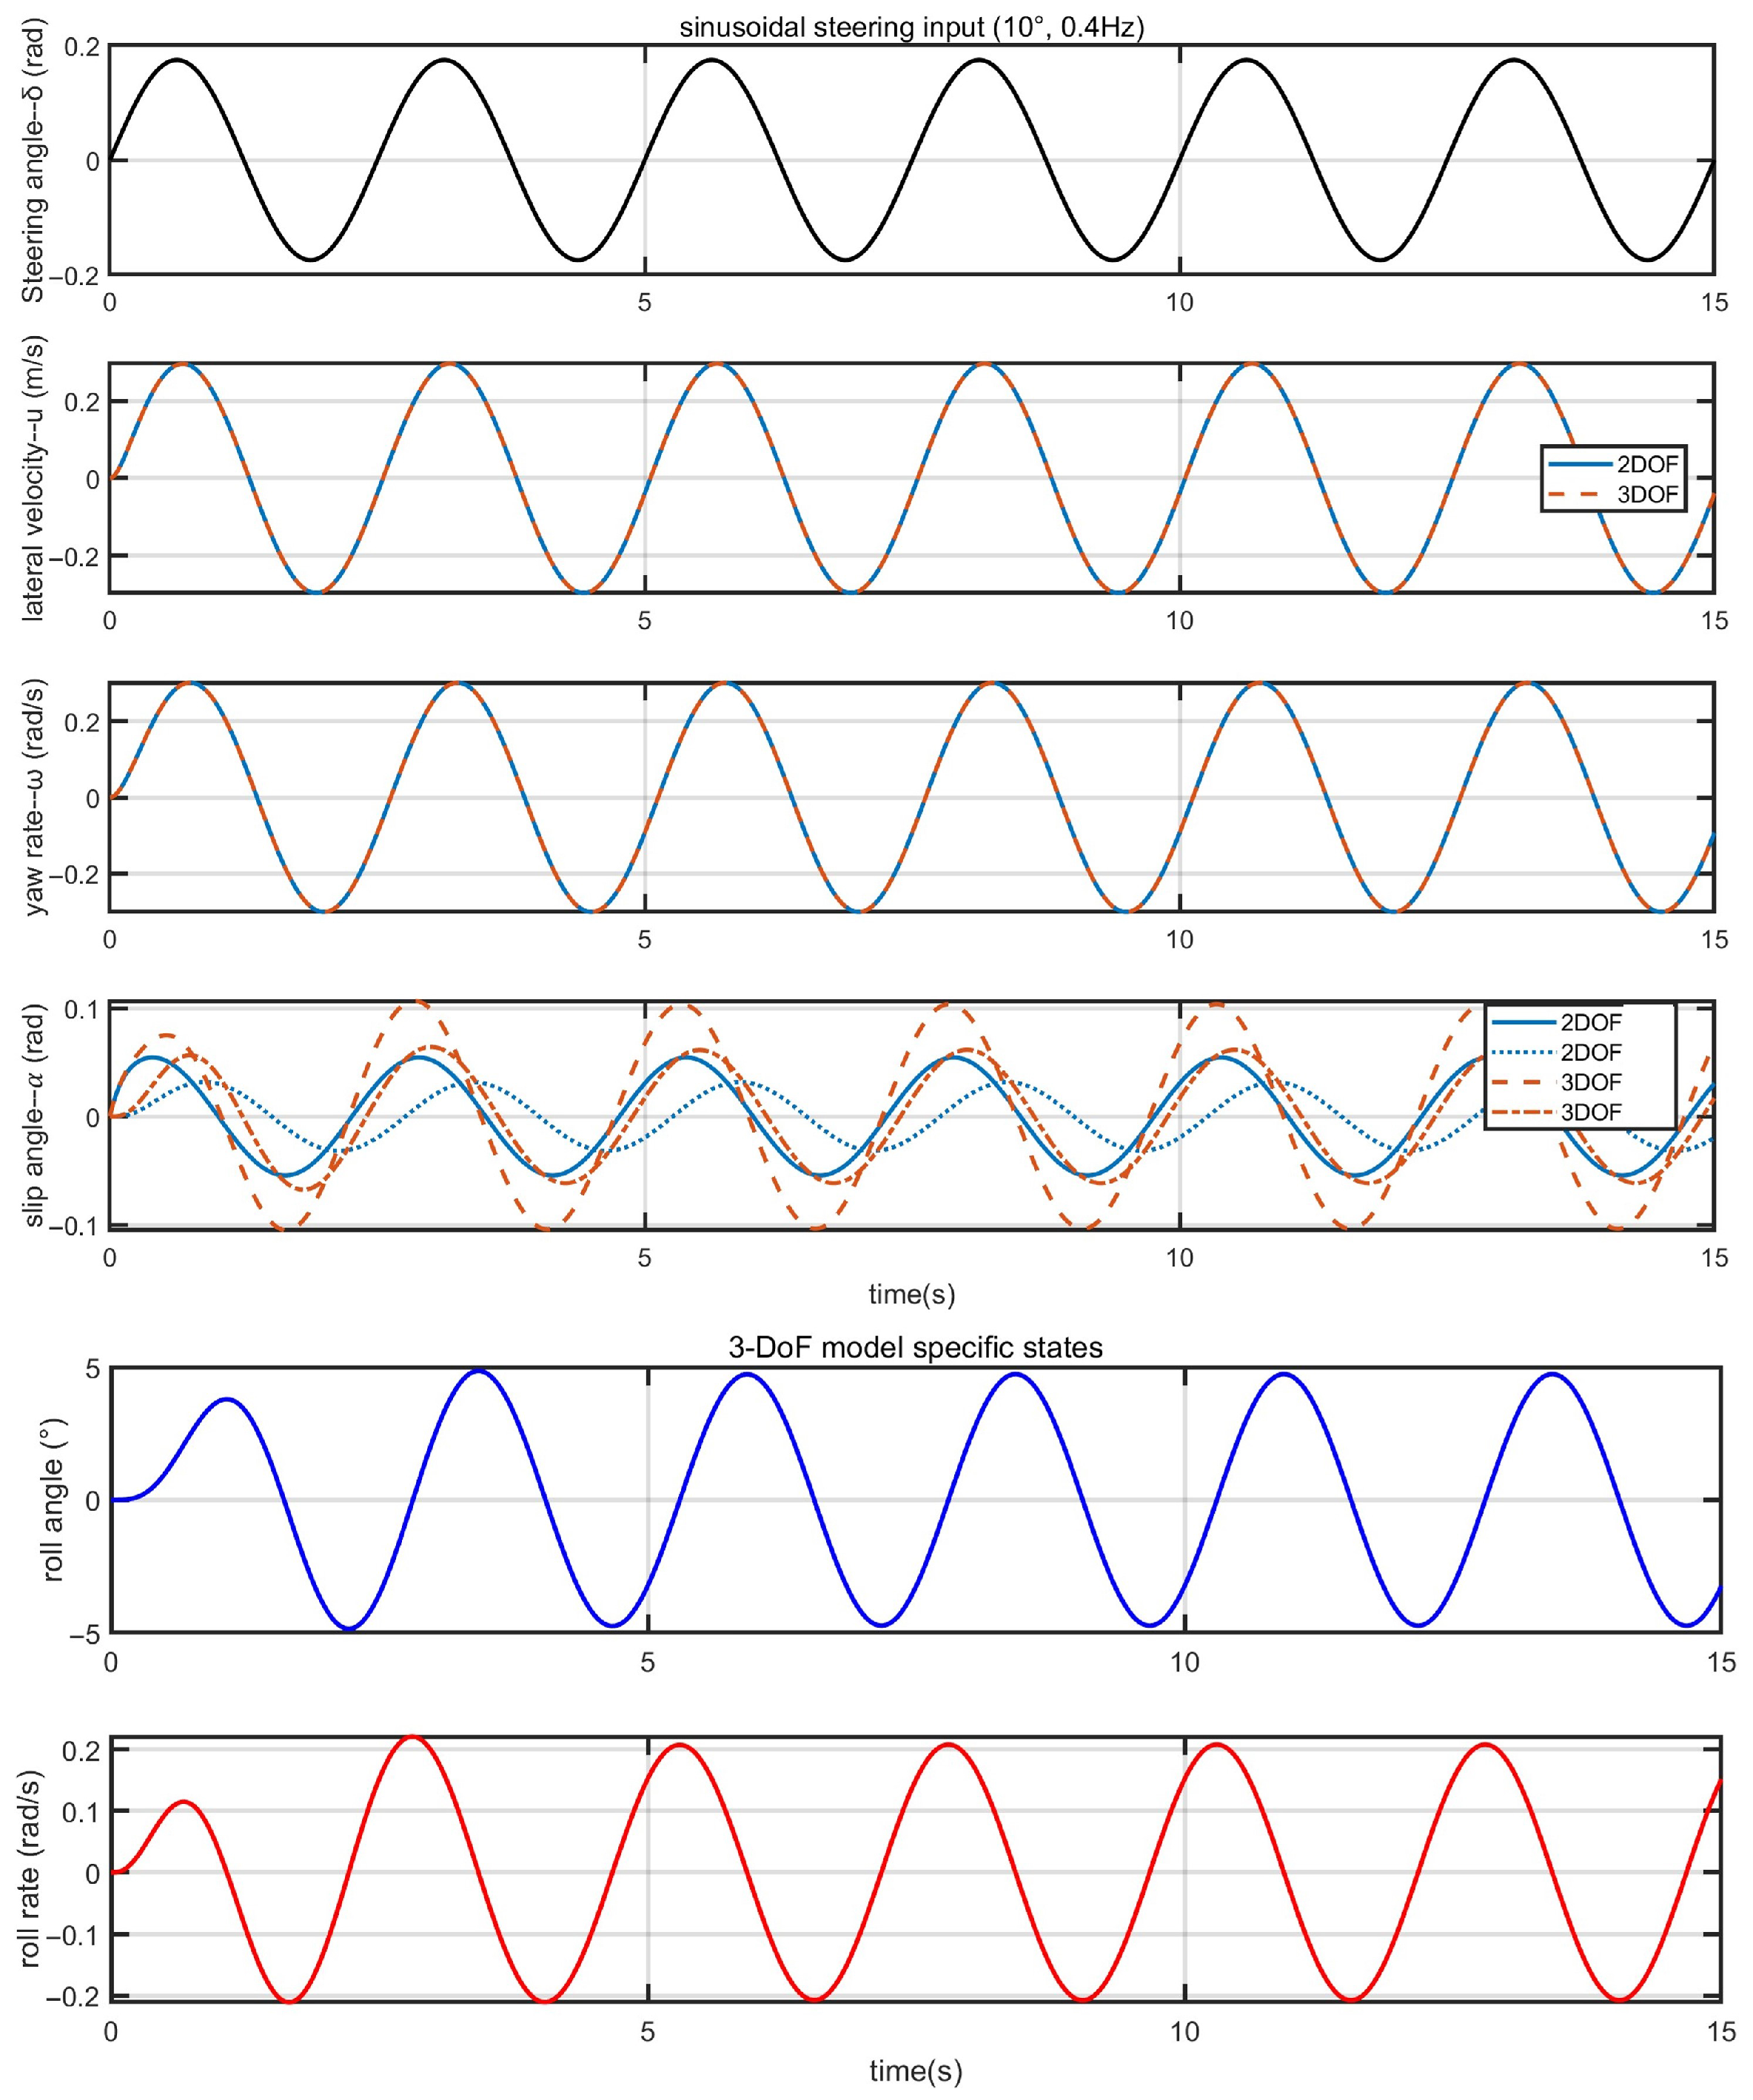
15) to construct the state-space representation, both 2-DOF and 3-DOF single-track models were implemented in MATLAB (version R2021b) and Simulink (version R2021b), with their simulation results compared. With initial values of
and
set to 0 and
initialized at 5 m/s, simulations were conducted for the sinusoidal angle input scenario. The front wheel steering input was defined as
, reflecting the typical frequency of human steering wheel rotation, approximately 0.3 to 0.5 Hz. As depicted in
Figure 3, the comparison curves illustrate that both models exhibit a high degree of consistency in the trends of lateral velocity and yaw angular velocity, with their waveform characteristics and phase relationships generally aligning.This observation suggests that both models are grounded in the same theoretical framework regarding fundamental dynamic characteristics. Analysis of the tire slip angle response confirms that the 3-DOF model accurately characterizes centrifugal load transfer dynamics. Notably, the front wheel slip angle increases from
to
, while the slip angle rises from
to
during center-of-gravity shifts, accurately quantifying tire load transfer. This characteristic is critical for predicting unique tire wear patterns and adhesion boundary changes in agricultural field operations. During a
sharp turn at 5 m/s, the 3-DOF model predicts a maximum roll angle of
. By including roll dynamics, the model captures roll-tire coupling phenomena through integrated tire-ground interaction mechanics. Consequently, the 3-DOF model demonstrates high fidelity for typical agricultural scenarios involving low-speed, high-steer maneuvers.
3. MPC Path Tracking Controller Design
In path tracking control for visual autonomous driving systems, the visual perception module plays a crucial role in environmental perception and the extraction of crop row center lines. However, field visual navigation line extraction algorithms that rely on deep learning (as referenced in [
27,
28,
29,
30]) require between 100 to 500 ms for image processing, which results in vehicle posture information being significantly delayed relative to the actual state. To mitigate the reduction in control performance caused by the inherent time delay in visual perception, this paper proposes an MPC architecture that incorporates a visual delay compensation strategy. The fundamental concept of this architecture is to leverage the vehicle dynamics model and real-time motion state to construct a state prediction compensator. Specifically, the system first acquires the visual pose observation values, which are subject to inherent delays, while simultaneously recording the corresponding control input sequence within a historical time window. Subsequently, utilizing the vehicle dynamics model, forward integration calculations are performed to dynamically advance the delayed visual observations and adjust them in real-time to the present moment, thereby yielding an accurate estimate of the current system state. The compensated state estimate is employed directly as the initial state of the MPC prediction model, allowing the controller to optimize the future control sequence in each optimization cycle based on real-time state information.
3.1. Delay State Observer Design
The visual system output at time
t,
, corresponds to the vehicle state at time
. To address this latency, a time-delay state observer is designed that estimates the current state by integrating historical control inputs
over
with the delayed vision output, as formulated in Equation (
16):
where
denotes the estimated state at time
t, and
represents the forward integration operator based on the vehicle dynamics model. Within
, control inputs are known while state evolution depends on instantaneous states. The visual delay time
is primarily determined by the image processing pipeline, including image acquisition, feature extraction, and navigation line computation. In practical implementations,
can be empirically measured as the average processing latency of the vision system. For the purpose of delay compensation,
is treated as a known system parameter. The proposed delay state observer does not require real-time estimation of
, but rather focuses on compensating for its effects through model-based forward prediction. For delay compensation, integration initiates from the vision-measured state at
, propagating forward to current time
t via numerical integration. The continuous-time forward integration is mathematically expressed in Equation (
17):
Here,
denotes the vehicle dynamics model.The forward integration is implemented numerically using the explicit Euler method due to its computational efficiency and suitability for real-time control applications. Combining Equations (
10)–(
15), the simplified vehicle dynamics model in state-space form is expressed as Equation (
18):
where the state vector
, control input
, and output vector
,
Given a sampling time
, the delay steps are calculated as
. For implementation in discrete-time systems, numerical integration of Equation (
17) proceeds as follows:
The delayed state obtained from the vision system at time step , serves as the integration initial condition. Forward integration is then performed from to using the dynamics model and recorded control inputs . After executing integration steps, the current state estimate at time is obtained.
3.2. Prediction Model Construction
To perform prediction and control based on the compensated state, the compensated estimate
is treated as the current state
. An extended state vector is constructed by augmenting this state with the previous control input, as shown in Equation (
20):
where
and
. Utilizing a 3-DOF agricultural vehicle dynamics model, a prediction model that accounts for the visual delay period is established through linearization and discretization, which describes the evolution law of the extended state under the control increment
. The prediction model is presented in Equations (
21) and (
22):
where
,
,
and
are state and control matrices from the linearized-discrete dynamics at
.
I is the identity matrix, and
represents the discretization error and linearization truncation error.
The MPC controller predicts the future output of the system by iterating the system Equations (
20)–(
22). Over prediction horizon
and the control horizon
, the vectorized output prediction equation is provided by Equation (
23):
where,
is the output sequence,
is the control increment sequence, and
is the error sequence.
3.3. Objective Function
Building upon the prediction model framework, this study presents a refined objective function design for model predictive control. The parameters for the MPC controller as listed in
Table 1.
The function is designed to minimize the error between the predicted state variables and the desired values in the time domain while constraining the controller output. Traditional MPC formulations exhibit significant limitations in vision-based navigation systems due to inherent visual processing latency, compromising real-time performance and robustness in dynamic environments. To address this, a modified objective function retains conventional tracking error and control penalty terms while incorporating a novel delay compensation error penalty, establishing an MPC path-tracking controller suitable for visual delay scenarios, as shown in Equation (
24).
Here,
represents a slack variable, and
serves as its penalty weight for managing constraint conflict. The error compensation term accounts for the cumulative error generated during the forward integral compensation process. When optimizing at timestep
k, the compensation error from the most recent
M steps is employed to construct the penalty term. By weighting the historical compensation errors, the controller is compelled to consider past compensation accuracy when optimizing future control actions, thus suppressing the cumulative drift caused by visual delay. The historical compensation error penalty term is defined as illustrated in Equation (
25).
where,
denotes the historical compensation error from m steps prior,
represents the error weight, and S is a positive definite diagonal weight matrix prioritizing positional tracking accuracy. To facilitate the solution process, Equation (
24) is reformulated into standard quadratic programming form based on the prediction Equations (
21) and (
22). The resulting quadratic programming problem in Equation (
26) is solved using the quadprog solver from MATLAB’s Optimization Toolbox.
s.t.
During the optimization at a single time step
k, the historical errors
for
are already known and fixed values. Therefore, the entire term
is a scalar constant during the minimization of
with respect to the future control sequence
. Since adding a constant to an objective function does not change the optimal solution
, this term is omitted when constructing the standard Quadratic Programming (QP) problem in Equation (
26). However, this term plays a vital role across consecutive control steps: the compensation error
is updated at every time step based on the difference between the predicted state and the newly available (but delayed) vision measurement. This creates a feedback mechanism on the quality of the delay compensation, influencing the controller’s behavior over time by shifting the state prediction baseline
.
The objective function incorporates the following constraints: steering angle ; steering angle change rate . Additionally, path tracking boundary constraints are imposed to ensure that the agricultural machinery does not deviate excessively from the predefined path during operation, with constraints of lateral deviation and heading angle deviation . Given the earlier assumption that the tires operate within the linear region, the tire force calculation employs an approximate expression. To ensure that the lateral force of the tire is linearly related to the lateral deviation angle and that the tire force remains within the adhesion limit, restrictions are applied to the slip angles of the tire and center of mass: , , and , the controller sampling time is s.
The controller implements the first element of the optimized control sequence U as the vehicle’s actuation command. This rolling horizon optimization process repeats each control cycle, enabling continuous trajectory tracking. The objective function design achieves precise path following while compensating for vision-induced cumulative errors, enhancing system robustness and control smoothness in dynamic environments.
4. Stability Controller Design
Within the MPC path tracking framework, which incorporates visual delay compensation, the vehicle acquires environmental information via the visual perception system and generates a reference path. The MPC controller computes the front wheel steering angle , through a rolling optimization process. However, under typical agricultural conditions, such as navigating rough terrain or experiencing localized variations in adhesion, path tracking may lead to vehicle instability due to uneven ground or interference from crop residues. To address this limitation, a stability controller is implemented as a lower-layer actuator, forming a coordinated control architecture with the predictive controller. Following visual delay compensation, the corrected path information feeds into the MPC module. Its output steering command then directly inputs to the stability controller for execution.
4.1. Calculation of Expected Yaw Angular Velocity
The core input parameters for the stability controller include: Yaw rate reference value generated by MPC
; Longitudinal vehicle speed
(m/s); Front wheel steering angle
; Road adhesion coefficient
. Based on vehicle dynamic stability conditions, the yaw rate safety boundary under current operating conditions is calculated through Equation (
27),
g is the acceleration due to gravity (
).
A safeguard mechanism sets a minimum speed threshold
to prevent boundary overflow during low-speed operation. A dual-layer decision logic generates the final desired value per Equation (
28), where
retains the steering direction sign from MPC.
This architecture prioritizes vehicle dynamic stability. When approaches the safety boundary, stability intervention is triggered, prompting the MPC controller to temporarily relax path-tracking accuracy. This achieves a dynamic trade-off between safety and tracking precision.
4.2. Additional Yaw Moment Calculation
The required additional yaw moment
is computed via a sliding mode control algorithm based on the deviation between the desired yaw rate
and the actual yaw rate
. Defining the yaw rate tracking error as
, the sliding surface function is designed as Equation (
29). When the system state reaches the sliding surface,
.
Here,
represents a positive weighting coefficient balancing error magnitude and error change rate. To ensure robustness during the approach phase and reduce chattering, a constant-velocity reaching law is adopted, as shown in Equation (
30):
To rigorously demonstrate the stability of the designed sliding mode control law and verify that the sliding condition is satisfied, a Lyapunov stability analysis is conducted. Consider the following candidate Lyapunov function:
This function is positive definite, as
for all
, and
only when
. The time derivative of
V is obtained as:
Substituting the reaching law,
from Equations (
30)–(
32) yields:
For
, the sign function can be expressed as
. Therefore, the derivative simplifies to:
Given that the parameter
is strictly positive (
), it follows from Equation (
33) that
for all
, with equality holding only if
. Specifically,
for any
. This satisfies the reaching condition of sliding mode motion, guaranteeing that the system state will be driven from any initial point in the phase space to the sliding manifold
within a finite time. Once the system state reaches the manifold, its dynamics are governed by the equation
defined in Equation (
29), ensuring that the tracking error
converges to zero exponentially.
Combining Equations (
15), (
29) and (
30), the additional yaw moment derivation proceeds as follows:
This dynamically compensates for unstable moments generated by front-wheel steering inputs, ensuring rapid tracking of by the actual yaw rate.
4.3. Torque Distribution Optimization
After obtaining the additional yaw torque
, it is essential to convert it into execution commands for the four-wheel hub motors through the optimized distribution of drive torque. Considering the uneven vertical load distribution
on each wheel and the sudden changes in local road adhesion coefficient
in agricultural environments, an optimization problem is formulated to minimize the tire force utilization ratio. Since tire lateral forces are coupled with driving forces and are relatively small compared to driving forces, only driving force distribution is considered. The objective function is formulated as shown in Equation (
34).
This objective function minimizes the sum of squared ratios of each tire’s longitudinal force to its adhesion limit .
The torque allocation must strictly satisfy vehicle-level dynamic requirements from the upper-layer controller, enforced through two key equality constraints (
35) and (
36). Longitudinal Force Equilibrium: The sum of longitudinal tire force projections along the vehicle coordinates system’s x-axis must equal the force required to achieve the target longitudinal acceleration
.
Yaw Moment Equilibrium: The moment generated by the differential longitudinal forces between left and right tires must equal the additional yaw moment
computed by the upper controller.
Here,
and
denote the front and rear axle track widths, respectively. This constraint produces the required
through driven wheel torque differentiation. Each hub motor’s torque capacity is bounded, directly constraining tire longitudinal forces per Equation (
37).
represents the maximum brake torque deliverable by each hub motor, while is the effective wheel radius. This constitutes a quadratic programming problem with linear constraints. The MATLAB fmincon solver computes optimal longitudinal forces for all four tires. The torque command for each hub motor is derived as . The motor controller executes precise torque tracking based on these commands. The presented torque distribution strategy is agnostic to the actuator implementation. For tractors with standard differential braking systems, the optimized yaw moment is naturally executed as a differential braking force between the left and right wheels.
6. Conclusions
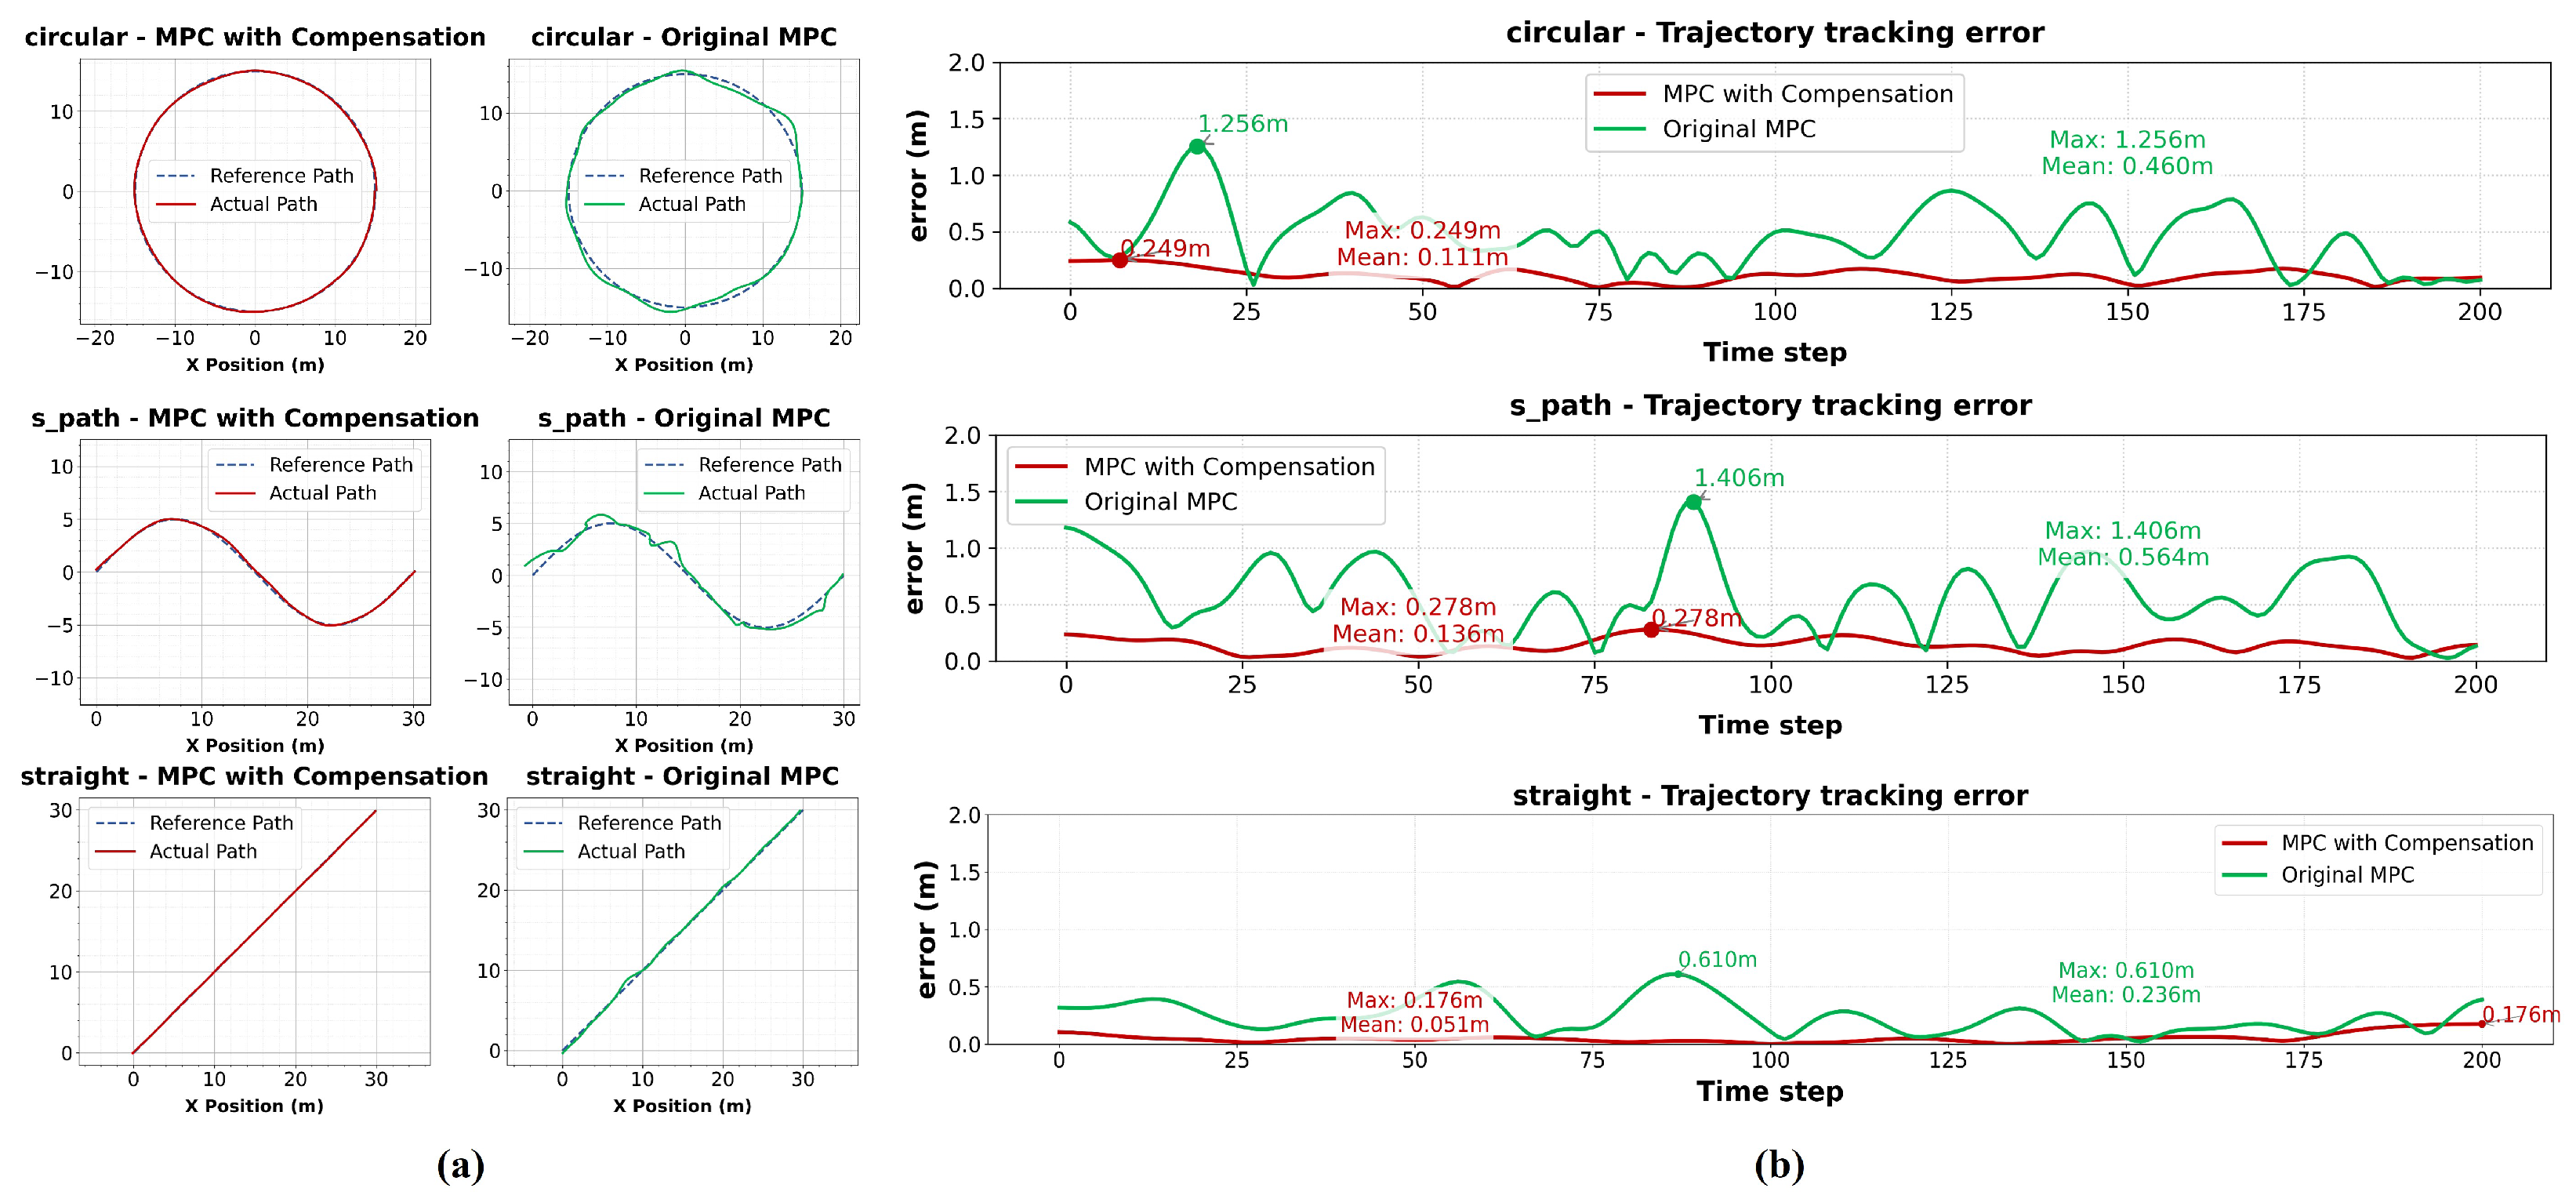
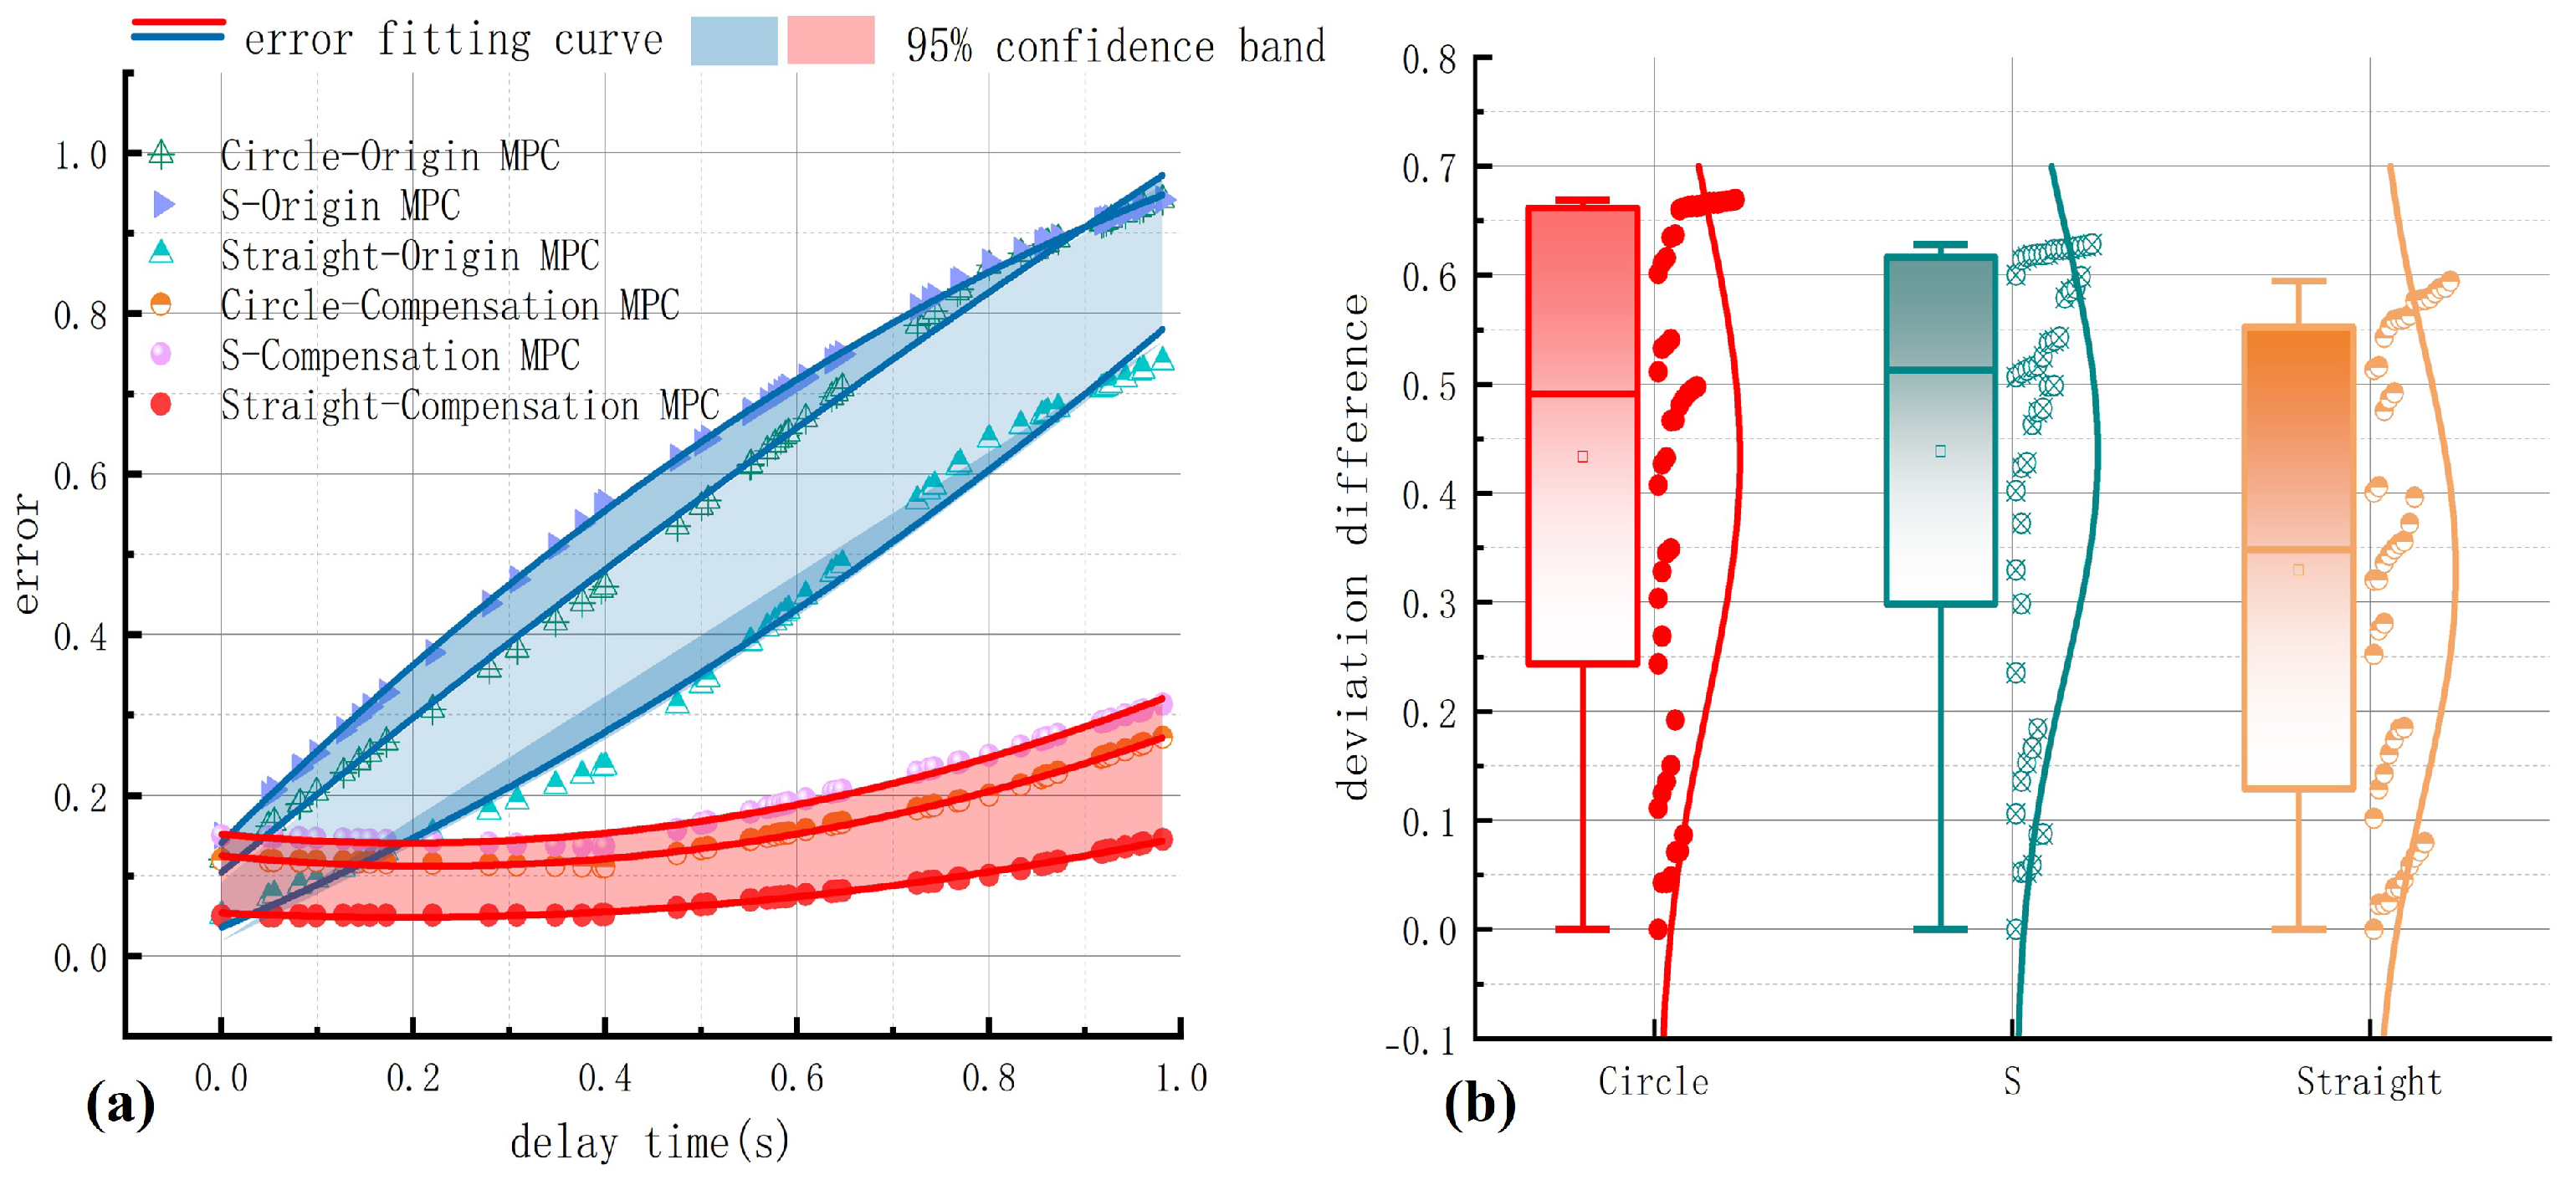
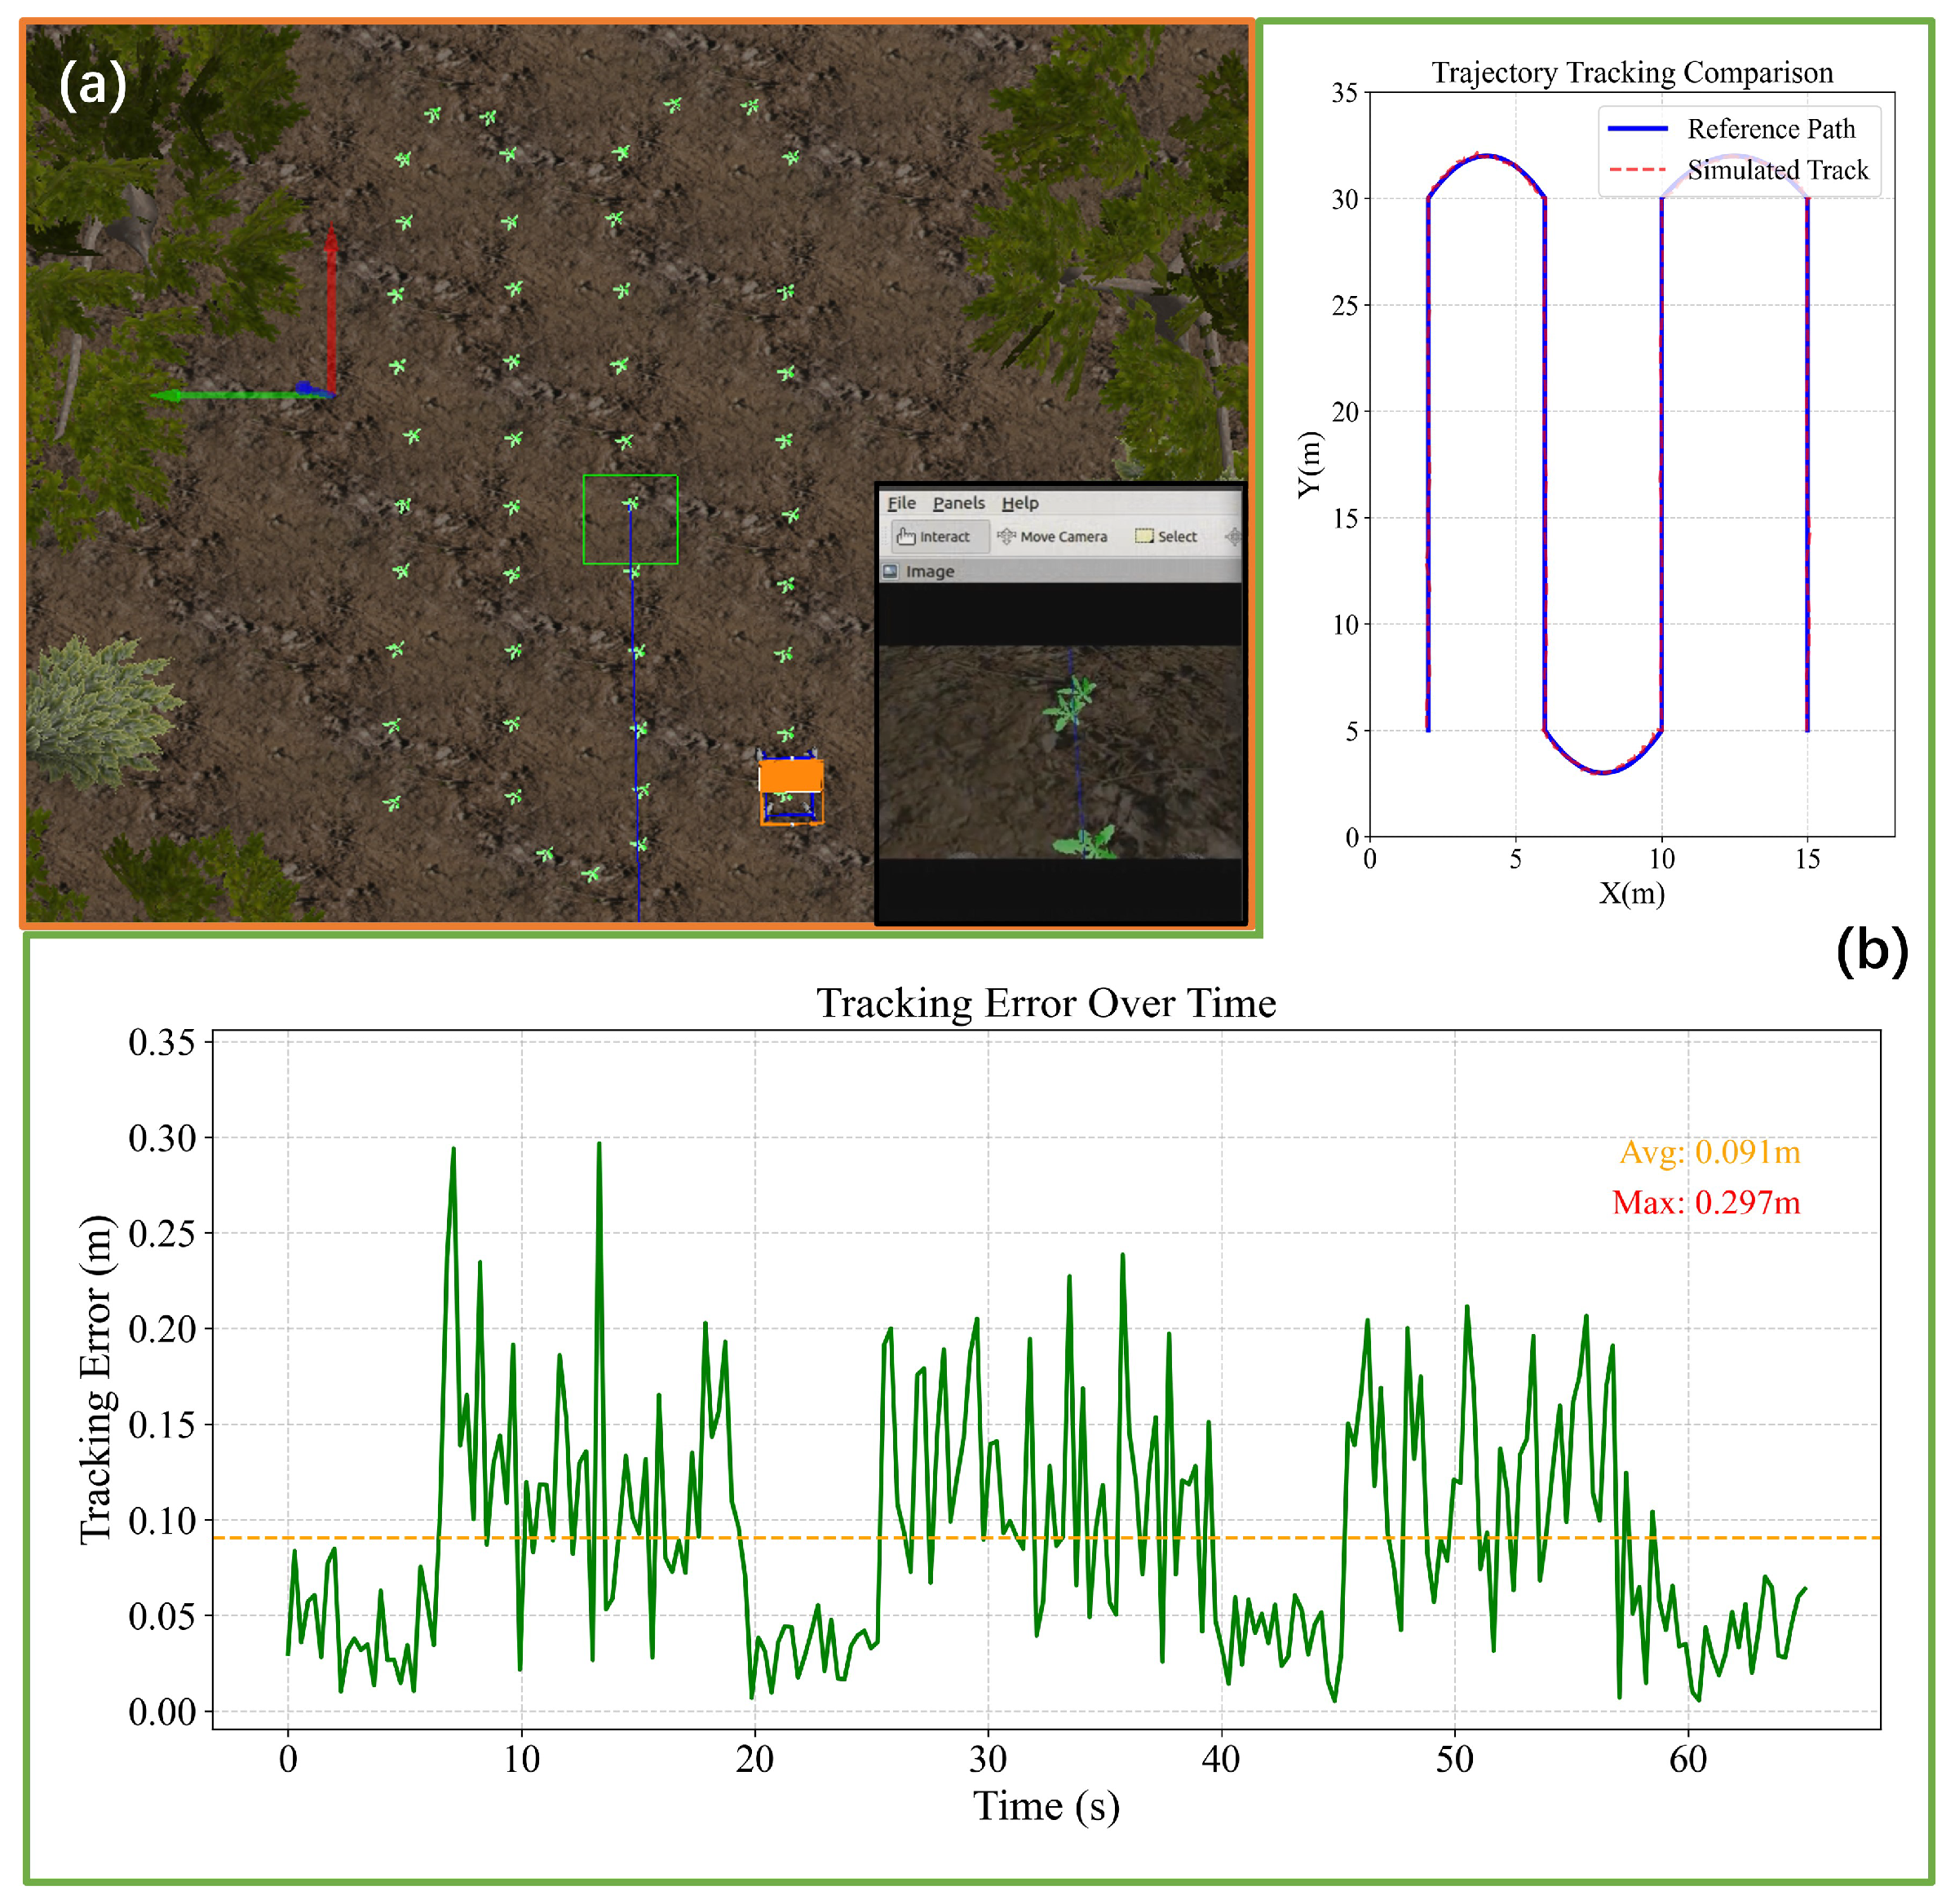
This study presents a hierarchical delay-compensated cooperative control (HDC-CC) method for vision-based navigation of agricultural machinery, addressing the critical need for precision in field operations such as targeted spraying and weeding. This method constructs a real-time pose prediction compensator based on the forward integral of vehicle dynamics, effectively overcoming inherent delays in image processing. Experimental results demonstrate that under a visual delay of 0.4 s, the proposed method reduces the S-curve path tracking error from 0.564 m to 0.136 m, while maintaining near-zero error levels within a 0.8 s delay range. In dual-line shifting tests, the system achieves a tracking accuracy of 0.0113 m on high-friction surfaces and sustains a control error of 0.0356 m on low-friction surfaces, improving robustness by 56% over MPC. By incorporating historical-error regularization, the average tracking error is reduced by 42.1% compared to the SFP method, confirming the effectiveness of accumulated error compensation. In the Gazebo farmland simulation, an average tracking error of 0.091 m for the snake-shaped path verifies that the proposed method mitigates control mismatch caused by visual latency through state prediction and dynamic synergy optimization. This provides a reliable technical foundation for enhancing operational accuracy and cost efficiency in precision agriculture.
Despite these promising outcomes, it is important to note that the current validation is based on simulation experiments. Future work will include real-world implementation on a dedicated agricultural robotic platform to evaluate performance under unpredictable field conditions. Additionally, optimizing the computational load of the MPC and SMC modules for deployment on embedded systems will be a critical step toward practical application.

