Abstract
Fire hazards during cotton picker operations pose a significant safety concern, primarily caused by cotton blockages and friction-induced heat generation between the picking spindle and seed cotton under high-load conditions. Existing fire monitoring systems typically employ a uniform temperature threshold across multiple sensors. However, this approach overlooks the distinct characteristics of different cotton picker mechanisms and the influence of seed cotton moisture content, resulting in frequent false alarms and missed detections. To address these issues, this study pioneers and tests a dynamic, tiered temperature threshold warning strategy. This approach accounts for key cotton picker components and varying seed cotton moisture content (MC), specifically MC 9–12% and MC 12–15%. Additionally, based on the operational characteristics of the cotton conveying tube, this study proposes monitoring the wall surface temperature of the conveying tube and investigates the threshold for this temperature. Results indicate that during seed cotton open burning, the average temperature is 324 °C for MC < 9%, 261.9 °C for MC 9–12%, and 178.4 °C for MC 12–15%. After transitioning to smoldering, the temperatures were 226.6 °C, 191.5 °C, and 163.5 °C, respectively, with 163.5 °C being the lowest threshold for seed cotton open burning in the cotton bin. For smoldering seed cotton, the temperature thresholds were 240 °C for MC < 9% and MC 9–12%, and 280 °C for MC 12–15%. The temperature threshold for the cotton conveyor pipe wall surface was 49 °C. The friction-induced heat generation temperature threshold at the picking head, determined through combined testing and simulation, is set at 289 °C for MC < 9%, 306 °C for MC 9–12%, and 319 °C for MC 12–15%. The aforementioned tiered early warning strategy, developed through multi-source experiments and simulations, can be directly configured into controllers. It enables dynamic threshold alarms based on harvester location, seed cotton moisture content, and temperature zones, providing quantitative support for cotton harvester fire monitoring and risk management.
1. Introduction
1.1. Research Background and Questions
With the continuous advancement of agricultural mechanization, cotton pickers—as key equipment for raw cotton harvesting—have significantly enhanced picking efficiency and production scale. However, during operation, these machines face significant fire risks due to friction, mechanical failures, and other factors. Field practice shows that cotton picker fires not only compromise equipment integrity and operational continuity but also lead to reduced raw cotton yields and pose safety hazards to both personnel and machinery [1]. Existing fire monitoring systems predominantly rely on single temperature thresholds for different components. This approach struggles to adapt to the frequent fluctuations in environmental humidity and operating conditions during the harvest season, resulting in high rates of false alarms and missed detections. Consequently, farmers lose trust in the warning systems, often disabling them during operation—thereby further increasing the fire risk for cotton pickers. Therefore, the critical role of temperature monitoring systems in fire detection cannot be overlooked. Accurately setting temperature thresholds is essential to ensuring system effectiveness.
Existing cotton picker fire monitoring systems typically use a multi-sensor approach for early fire detection. Yu Bo [2] focused on the core hardware of fire detection devices for cotton pickers, emphasizing the design of detection circuits as essential technological support for monitoring early fire parameters. Wang Jian [3] conducted a quantitative performance analysis and optimization of Yu Bo’s cotton picker fire detection device, identifying optimal installation within the cotton conveying pipeline to achieve an effective detection range of 3–5 m. The device triggers alerts when either temperature reaches ≥ 150 °C or smoke concentration exceeds ≥ 0.8 mg/m3. Miao Zhonghua [4] developed a specialized spark detection system targeting cotton pipelines, which are high-risk areas for cotton picker fires. Li Yang [5] categorized fire hazards as “typical cotton picker malfunctions,” enabling early fire risk diagnosis through multi-condition parameter fusion and emphasizing coordinated fire alerts over isolated monitoring. Han Kelai [6] designed a CAN-bus-based distributed operational status monitoring system for cotton pickers, offering a solution for real-time, reliable transmission of fire parameters across multiple locations and long distances. Wu Yanbo [7] positioned fire monitoring as a core module of an early safety warning system, focusing on low cost and lightweight design to meet the practical needs of small and medium-sized cotton pickers, thereby promoting wider adoption of fire monitoring technology. Li Wenchun [8] reviewed the development status, challenges, and trends in global cotton picker fire monitoring technology from 2015 to 2020, providing direction for future research. Shi [9,10,11] approached the issue from the fundamental logic of fire causation and combustion processes, offering a scientific basis for sensor selection, warning threshold setting, and monitoring phase classification. They constructed a multi-sensor system integrating infrared temperature and CO detection, proposing a BP fusion algorithm optimized by a hybrid Gray Wolf + Particle Swarm Optimization (MGWO-PSO) algorithm. Sensors were deployed at multiple points—harvesting heads, cotton conveyors, and cotton bins—while addressing visual detection of flames and smoldering fires in cotton bins/conveying zones. A lightweight modified YOLOv11 served as a rapid visual front end for fire confirmation, complementing temperature and gas channels. Zhang [12] designed a cotton picker fire monitoring system based on GA-optimized BP neural networks, utilizing CO concentration and SHT21 temperature/humidity sensors, with real-time display or alerts via an onboard industrial control computer. These studies established a critical foundation for cotton picker fire monitoring technology, evolving from single-parameter monitoring to multi-parameter fusion. However, these systems perform poorly in practical applications due to the use of uniform thresholds. Different components exhibit significantly varying operating conditions and fire hazard characteristics, rendering existing uniform temperature thresholds inadequate for adapting to diverse fire risks. Fire hazards in the picking head often arise from friction-induced heat, while risks in cotton conveying pipes and bins relate closely to the flow state of seed cotton and ambient temperature. Traditional universal temperature threshold methods struggle to address fire hazards comprehensively across all components. Previous studies primarily determined seed cotton autoignition points between 250 and 340 °C under static laboratory conditions [13,14,15,16,17], without considering dynamic variations during field operations. When the picking head becomes clogged, the load on the picking spindle increases rapidly, far exceeding the uniform friction conditions observed in the lab, resulting in significantly different heat accumulation rates. Furthermore, daily humidity fluctuations during Xinjiang’s cotton-picking season are substantial—morning moisture content ranges from 12% to 15%, while midday drops to 8–10%. Thresholds established under constant laboratory humidity cannot adapt to dynamic field humidity changes. Lastly, seed cotton flows through conveyor pipes at speeds of 15–25 m/s, and static laboratory temperature measurement methods cannot simulate temperature monitoring in high-speed gas–solid transport conditions. This study addresses these gaps by conducting dual-dimensional threshold calibration for both location and humidity, bridging the divide between laboratory findings and practical agricultural machinery applications.
1.2. Research Objectives and Contributions
Addressing the issues in existing cotton picker fire monitoring systems, which use a uniform temperature threshold and overlook the varying fire risk characteristics of different mechanical components and the dynamic impact of seed cotton moisture content (MC), leading to false alarm rates exceeding 25% and false negative rates of about 8%, this study employs a combined approach of multi-scenario experiments and numerical simulation. It systematically analyzes fire initiation mechanisms and temperature response patterns in the three critical zones: the picking head, cotton conveyor tube, and cotton box. A dynamic, multi-dimensional temperature threshold early warning strategy based on component type and seed cotton moisture content is constructed and validated. Ultimately, this research lays a strong foundation for developing fire monitoring systems for cotton pickers. We developed and validated a dual-dimensional dynamic layered temperature threshold warning strategy based on component type and seed cotton moisture content. This approach provides quantifiable threshold parameters directly configurable in controllers, enhancing fire warning accuracy and reliability while reducing the risks of equipment damage and yield loss.
The primary contributions of this research are as follows:
- We proposed and validated a dynamic, multi-tiered temperature threshold system based on key component characteristics and seed cotton moisture content. Differentiated thresholds accurately match fire risks across regions, resolving false alarms and missed detections while significantly improving the system’s adaptability.
- This study quantitatively elucidates for the first time how seed cotton moisture content influences combustion characteristics. It defines critical parameters such as open flame temperature and smoldering temperature at different moisture levels, generating a threshold table directly configurable in controllers. This provides clear parameter support for the engineering implementation of fire monitoring systems.
- This research shifts cotton harvester fire management from reactive post-fire alarms to a predictive paradigm that enables proactive intervention before thresholds are triggered. We also propose developing an intelligent early warning system that integrates real-time moisture sensing, airflow monitoring, and other multi-source information.
2. Materials and Methods
2.1. Experimental Materials
The experimental seed cotton was sourced from the Shihezi cotton-growing region in Xinjiang (44°18′ N, 86°03′ E), which is Xinjiang’s core cotton-producing area, accounting for 15% of the region’s total output. The seed cotton variety ‘Xinluzao 57’ is the primary local cultivar, occupying over 60% of the planting area in the Shihezi zone. Impurity content (branches, leaves, and dust) was maintained between 3% and 5%, meeting the Chinese National Standard (GB/T1103.1-2021 “Cotton Part 1: Saw-processed Fine Cotton”) [18] requirement of “≤5% impurity content for field-harvested seed cotton.” This ensures the test material matches the characteristics of seed cotton processed by actual cotton pickers.
The main components of seed cotton are cellulose and cottonseed, which are highly flammable and burn rapidly when exposed to open flames. During field harvesting, seed cotton contains impurities such as branches and leaves. Ginned cotton seed combustion occurs in two forms: flaming and smoldering combustion. Flaming combustion involves visible flames and intense burning, typically occurring under ample oxygen and relatively dry seed cotton. Smoldering combustion, characterized by no visible flames and slow burning, releases large amounts of gases such as CO and CO2, and often occurs under oxygen-deficient conditions, like in densely accumulated seed cotton. Fire hazards in cotton pickers primarily arise from two heat sources: mechanical friction and electrical faults. During operation, high-speed motion between seed cotton and components like picking spindles and cotton-removal disks generates significant frictional heat. If seed cotton accumulates densely or causes temporary blockages, heat builds up more readily. Local temperatures can quickly approach and exceed the spontaneous combustion threshold of seed cotton, creating a direct ignition source. Meanwhile, aging insulation, poor electrical contacts, and component overloads in the machine’s wiring can lead to persistent overheating, arcing, or sparking. Such sparks contacting combustible fibers or dust can also initiate fires. While electrical faults can be addressed during pre-field preparation or maintenance, mechanical friction occurs only in the field. Therefore, studying the friction characteristics of seed cotton is essential.
2.1.1. Friction Characteristics of Seed Cotton
In the seed cotton picking zone, relative sliding occurs between the seed cotton, the picking spindle, and the cotton-removing disk. The heat generated by friction can be approximated as:
where is the interfacial friction coefficient, FN is the normal contact load, is the relative sliding velocity between seed cotton and the picking spindle, and is expressed as:
represents the tangential velocity of the metal surface during lint removal, denotes the flow velocity of seed cotton along the metal surface in the contact zone, and is expressed as:
where is the spindle radius and is the spindle speed, typically between 3500 and 4300 rpm. During the routine operation of a cotton picker, the picking spindle primarily extracts seed cotton from split bolls using tensile and frictional forces. This force must overcome the adhesion between the cotton fibers and the boll shell, as well as the inherent strength of the fibers. The required force is relatively small and steady, typically ranging from 10 to 50 N for a single picker head, with minimal fluctuations in , , and . Friction-induced heat generation between the picker head and seed cotton remains manageable. However, when seed cotton becomes entangled, accumulates, or is improperly adjusted, compression causes to increase exponentially. In related literature, the total pressure on a single picker can reach 3000 to 12,000 N [19,20], which can lead to near-stagnation of seed cotton movement, with approaching zero. This increases relative slip , while seed cotton contamination and compaction further heighten . The relationship in Equation (1) rapidly enhances heat generation, shortening the time frame to reach critical temperature. It is essential to note that seed cotton is a three-phase porous medium. While increased moisture content improves thermal conductivity and volumetric heat capacity, local density increases from seed cotton blockage cause the thermal diffusion coefficient to decrease. A smaller indicates greater thermal inertia in the system and more persistent hot spots. Additionally, heat absorption from moisture evaporation and the flame-suppressing effect raise the critical temperature needed for seed cotton to transition from smoldering to flaming combustion, extending the induction period. Therefore, the fire ignition threshold is linked to seed cotton moisture content. Under low humidity, the threshold temperature and time are lower, making ignition more prone to friction or electrical overheating. In contrast, high humidity requires higher temperatures or longer heating durations for ignition. Thus, examining the relationship between seed cotton moisture and fire behavior is crucial for establishing temperature thresholds in cotton picker fire monitoring systems.
2.1.2. Definition and Measurement of Seed Cotton Moisture Content
Moisture Content (MC) measures the water proportion in seed cotton. Two common methods are used in industrial and agricultural testing.
In the equation, represents wet-basis moisture content, denotes dry-basis moisture content, is the mass of water in the sample, is the wet mass of the sample, and is the mass of dry matter in the sample. In the seed cotton harvesting industry, an MC of 8–10% is considered the ideal harvest moisture level, as seed cotton is relatively dry at this point. Therefore, MC < 9% was selected for this trial. Mainstream cotton pickers (Example: John Deere Round Baler) have moisture meters calibrated around 9–13%, where lint quality is optimal during harvest. Thus, this trial set 9–12% as the mid-range. Increased moisture content in cellulose materials raises the ignition or smoldering threshold temperature of seed cotton and significantly prolongs the time to reach this threshold. Consequently, MC 12–15% was designated as the upper range “harvestable but with increased risk”. This study categorizes seed cotton moisture content (wet basis) into three ranges: MC < 9%, MC 9–12%, and MC 12–15%. This classification addresses three considerations: industry quality standards, equipment measurement ranges, and differences in combustion mechanisms. Seed cotton moisture content was measured and categorized using a moisture meter. The experimental materials, as shown in Figure 1, underwent corresponding seed cotton combustion tests.
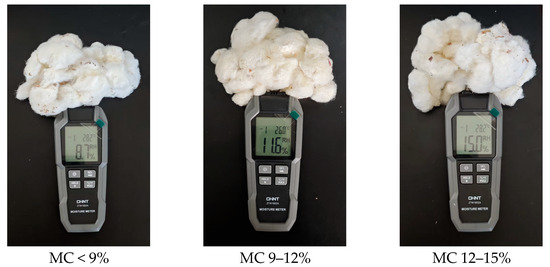
Figure 1.
Test Seed Cotton.
2.1.3. Comparison and Improvement of Fire Monitoring Methods for Cotton Pickers
A systematic comparison of traditional mainstream monitoring methods and the approach proposed in this paper is conducted across core dimensions, including threshold-setting logic, monitoring point and parameter selection, environmental adaptation strategies, and fire incident judgment triggers. Specific comparison details are presented in Table 1.

Table 1.
Comparison and Improvement of Fire Monitoring Methods for Cotton Pickers.
2.1.4. Method for Establishing Differentiated Thresholds for Different Components of Cotton Pickers
This paper establishes a localized threshold determination strategy for cotton pickers based on the differences in fire mechanisms across their components, including fire mechanism analysis, temperature monitoring, experimental testing, simulation prediction, and threshold output, as shown in Figure 2.
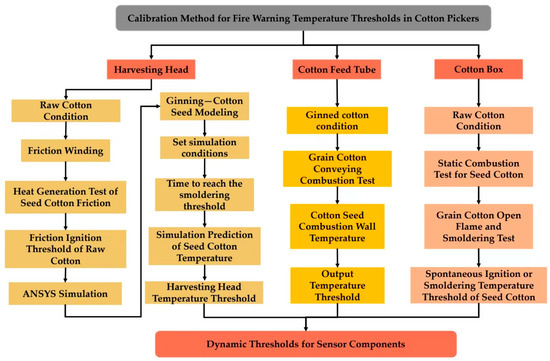
Figure 2.
Threshold Determination Strategy.
Through research on location-specific thresholds, the cotton-picking head, cotton-conveying pipe, and cotton bin of the cotton picker were identified as the three critical nodes for contact, transportation, and storage. These areas also present the highest fire risk, where flames are most likely to ignite and spread rapidly. This allows for the assignment of differentiated monitoring metrics and test pathways for each component.
- (1)
- Fire Early Warning for Picking Heads: A friction test rig was used to replicate actual load and blockage conditions, measuring the critical temperature that triggers smoldering combustion. Combined with numerical simulation (ANSYS 2022R1) to predict the time required to reach this temperature under typical rotational speeds and loads, dual temperature-time thresholds were established for proactive early warning.
- (2)
- Fire Warning for Cotton Picker Conveyor Pipes: These pipes involve high-speed pneumatic solid–liquid transport, making surface temperature measurement challenging. Early-stage smoldering in seed cotton is more sensitive to gaseous products, so CO is the primary monitoring parameter. Thresholds were adjusted based on CO sensor alarm ranges. A cotton conveyor pipe test rig was constructed, using burning seed cotton moving through the pipe to obtain wall temperatures and establish thresholds for temperature monitoring.
- (3)
- Early Fire Warning for Cotton Picker Hopper: As a relatively static heat storage scenario, the hopper exhibits slow heat evolution and large thermal scales for seed cotton. Small-scale combustion tests using infrared surface temperature measurement defined the minimum temperatures for smoldering and flaming seed cotton, creating a localized threshold table. Based on this analysis of fire mechanisms for different components, we designed the following targeted experiments.
2.2. Seed Cotton Open-Flame Test
Before conducting the seed cotton open-flame test, the selection of fire warning sensors must be addressed. Sensors installed on cotton pickers must withstand harsh field conditions while meeting precise harvesting requirements. They should be adaptable to adverse environments, offer high detection performance, allow for compact modular installation, and coordinate with industrial bus systems. Additionally, they must balance ease of maintenance, extended service life, and cost-effectiveness. The temperature sensor selected for non-contact monitoring is the FST600-400A infrared thermometer ((Firstrate Corporation, Changsha, Hunan Province, China)), as shown in Figure 3. This sensor uses thermosensitive and photoelectric detectors to convert infrared radiation into electrical signals and calculates temperature values based on radiation laws. With a measurement range of 0 °C to 1200 °C, an RS485 output signal, an operating voltage of 10–30 V, a measurement accuracy of ±3% of reading, a spectral response range of 8–14 μm, an ambient temperature tolerance of 0–+60 °C, and a response time of 300 ms, it meets the test requirements. The CO sensor used is the JX-CO-103 (China Shandong Weihai Jingxun Changtong Electronic Technology Co., Weihai, China, as shown in Figure 3). This sensor employs the NDIR principle with a thermopile detector, as CO has an absorption band at approximately 4.65 μm. The central aluminum optical chamber houses the infrared optical path, with the black cylinder serving as the inlet and outlet ports. The white brackets at both ends secure the chamber to the PCB. It has a measurement range of 0–1,000,000 ppm, a resolution of 1 ppm, an accuracy of ±5% F.S. (at 2 °C), a response time of under 30 s (at 2 °C), an operating voltage of 9–24 V and operates within a humidity range of 0–95% RH (non-condensing). Its operating temperature range is −10 °C to 75 °C, with an infrared light source band of 2–14 μm, meeting the test requirements. To protect the sensor and facilitate airflow, it incorporates a protective housing, ventilation fan, and air exchange tube. The ventilation fan uses an independent power supply to ensure stable operating voltage.
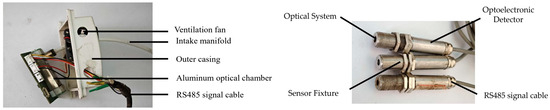
Figure 3.
Fire Early Warning Sensor.
The FST600-400A infrared temperature sensor uses a unique calibration method with a constant-temperature chamber (0–450 °C). Inside the chamber, a matte-black iron block holds a calibrated mercury thermometer as the contact reference. After preheating the sensor for over 15 min at an emissivity of 0.95, the sensor is vertically aligned through a small aperture at the top of the oven to target the iron block. Calibration occurs at three points: 100 °C, 200 °C, and 300 °C. When readings stabilize, the infrared and reference temperatures are recorded. These values are then fitted using least squares regression and applied to all temperature data. Before installation, perform single-point verification at approximately 200 °C, ensuring the sensor’s spot size is smaller than the target surface and the incident angle is less than 45°. This completes the calibration of the infrared temperature sensor. The CO sensor, based on infrared optical principles, undergoes multi-point calibration at the factory. Its calibration accuracy meets testing requirements, eliminating the need for complex traceability calibration; only on-site verification is necessary. In the high-speed gas–solid two-phase flow environment of the cotton feed pipe, fiber dust, lint, oil mist, and sudden humidity changes can cause transient reading disturbances and minor cross-contamination. Setting the threshold too low (10–30 ppm) may trigger false alarms due to dust disturbances. Therefore, the alarm threshold is set at 50 ppm to avoid environmental interference. This is complemented by a joint trigger mechanism using the temperature of the cotton conveyor pipe wall, significantly reducing false alarms while maintaining early sensitivity for detecting genuine smoldering or fire smoke.
Open-flame ignition tests were conducted by igniting 30 g of seed cotton with varying moisture contents using a small flame. The ignition temperature was measured while observing the combustion state and duration. Multiple infrared temperature sensor readings were taken to determine the ignition temperature range. The setup for the ignition test is illustrated in Figure 4.
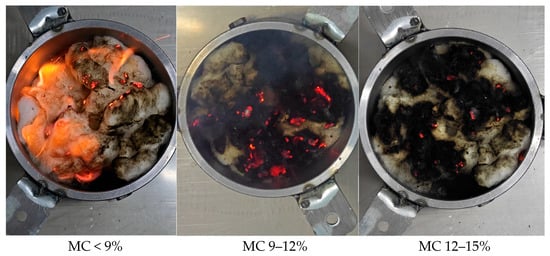
Figure 4.
Open Flames on Raw Cotton.
Observing seed cotton during small flame ignition tests shows that at MC < 9%, ignition delay is short, flames self-sustain easily, and spread quickly to outer fibers. After flame removal, sustained burning occurs with rapid flaming characteristics similar to dry cotton fabrics, eventually transitioning to smoldering. At MC 9–12%, a noticeable ignition delay and intermittent flames are present. Loose surface cotton fibers burn out instantly. After removing the flame, it transitions to slow smoldering with a distinct convective smoke plume. Prolonged exposure to flame or strong ventilation is needed for localized open burning. At MC 12–15%, maintaining a sustained open flame is difficult, with minimal combustion of surface fluff. Upon flame removal, smoldering occurs immediately. Reapplying the flame fails to restart open combustion, and smoke generation is low. Detailed open-flame test data are presented in Table 2.
Table 2.
Ignition of Seed Cotton at Different Humidity Levels.
2.3. Seed Cotton Smoldering Test
Existing research defines smoldering combustion as a flame-free process primarily involving the oxidation of condensed-phase surfaces or char layers. Heat accumulates mainly in the solid phase and propagates slowly through the fiber-pore network. Characteristic temperatures are significantly lower than those of open flames, with weak gas-phase radical reactions and higher CO and CO2 yields compared to open flames. Based on prior research and the methodology used in this study, the criteria for identifying smoldering in seed cotton are as follows: (1) Absence of visible flames; (2) Fibers on the seed cotton surface exhibit shrinkage, curling, localized collapse, and pulverization; (3) Formation of a brittle char layer with a distinct char front; (4) Persistent filamentous smoke accompanied by a burnt or pungent odor; (5) Slow combustion progression continues even after removing the heat source. If all these conditions are met during seed cotton combustion, smoldering is confirmed. The cone-shaped heater model used in the experiment was DL394490 (Deli, Ningbo, China), as shown in Figure 5.
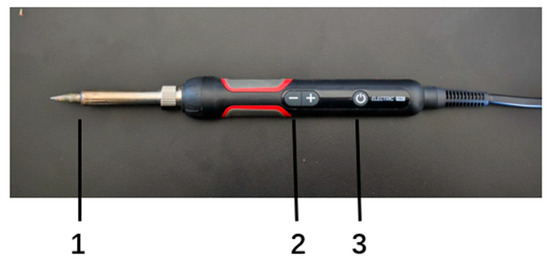
Figure 5.
Tapered heater. 1. Heating port 2. Temperature control knob 3. Power switch.
Heating temperature range: 140–480 °C, meeting test requirements. Test temperatures are set at 140 °C, 180 °C, 200 °C, 225 °C, 250 °C, 275 °C, 300 °C, 310 °C, and 320 °C. Heating of seed cotton begins at 140 °C, with timing initiated until it reaches the smoldering condition. At this point, the internal temperature of the seed cotton is measured, and an error value is added to determine the smoldering temperature. The seed cotton moisture content remains within three ranges: <9% RH, 9–12% RH, and 12–15% RH.
2.4. Friction Heat Generation Test of Seed Cotton from Cotton Picker Heads
The seed cotton friction heat generation test simulates real-world cotton blockage in field-operated cotton pickers to determine the smoldering ignition temperature of seed cotton. By increasing the packing density of seed cotton, fixing the rotor speed, and limiting the insertion depth, a sustained contact environment is created between the picker spindle and seed cotton with minimal heat dissipation. This setup allows for the measurement of the smoldering ignition temperature and provides a basis for calibrating the temperature threshold for cotton blockage in the picking head. The test is conducted on a modified vertical rotating friction test bench, as shown in Figure 6. The spindle clamps the picker and operates at a constant speed of 3500 rpm, reflecting the rated field operating speed of the Xinjiang Boshiran 4MZ-6 cotton picker (Wusu City, China). A metal seed cotton barrel is placed on the workbench and filled with seed cotton of varying humidity levels, leveled with the rim of the barrel. To simulate the density of seed cotton inside the picker head during clogging [21], relevant literature indicates that moderate cotton blockage (packing density 110–130 kg·m−3) accounts for 65% of cases, representing the most common high-risk condition. Therefore, the seed cotton is packed at 120 kg·m−3. This approach increases the residence time of cotton fibers near the picking spindle while enhancing effective normal compression per unit contact area, both amplifying the localized accumulation of friction energy and heat within the metal cylinder. During testing, the metal cylinder is secured to a test bench, with the picking spindle inserted at a constant depth of 3 cm. A preliminary assessment is conducted using the smoldering detection method for seed cotton proposed in Section 2.3. Afterward, the seed cotton is removed from the cylinder, and a comprehensive determination of whether smoldering has occurred is made by observing color changes.
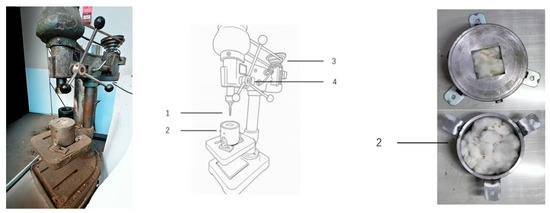
Figure 6.
Friction Test Bench Structure. 1. Spool Remover 2. Seed Cotton Metal Drum 3. Speed Pulley 4. Up-Down Mechanism.
The test began when smoldering occurred in the seed cotton inside the barrel. At that moment, the picker head was removed, and its surface temperature was measured using the UNI-T Uti260B (Dongguan, China) infrared thermometer, indirectly determining the seed cotton surface temperature. This instrument has a temperature range of −15 °C to +550 °C, an accuracy of ±2 °C, a thermal imaging sensitivity of <60 mk, and a frame rate of <25 Hz, meeting the experimental temperature measurement requirements.
To validate the bench test results and predict the temperature rise, we established the following simulation model: The extractor is modeled as a rigid body, while the seed cotton is treated as a compressible, porous and flexible body. Under cotton-clogging conditions, significant contact and friction-induced heating occur between the two components. Considering the conical geometry of the picker head and the complex tooth profile at its ends, this study focuses on the central region of the picker head with a uniform radius. This approach avoids interference from irregularities at the ends, enhancing the representativeness and reproducibility of the results. A segment-element integration strategy combining “geometric contact discretization and transient thermal response superposition” was employed: the central study band length was uniformly divided into segments () along the picker spindle axis to describe local contact and heat generation within each segment, as shown in Figure 7. Convolution superposition in the time domain was used to obtain surface temperature rise, determining the time required to reach the temperature threshold. The integration modeling is illustrated in Figure 8.
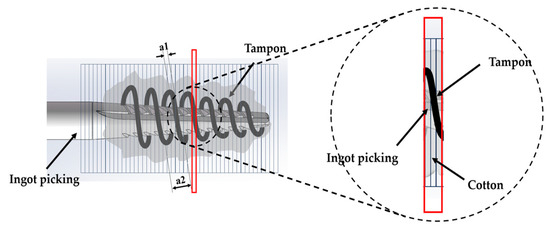
Figure 7.
Cross-section of the middle part of the bale. a1: Seed cotton sliver a2: Sliver spacing.
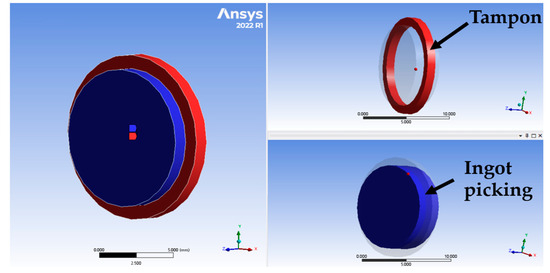
Figure 8.
Integrated modeling of seed cotton in the bale.
Using a finite element/explicit solver, this study develops an equivalent model to determine the temperature increase brought on by friction-induced heating during seed cotton removal. It provides unified boundary conditions and parameter values: The catalog is the source of the material constants, and the core material is 20CrMnTi. The body of seed cotton is regarded as an anisotropic porous fiber. Effective thermal conductivity k = 0.10 W·m−1·K−1 and effective density ρ = 120 kg·m−3 are used to specify packing density. The fiber/air/water three-phase mixture is weighted by mass fraction to determine specific heat. The air/moisture phases are weighted by their respective contents, and the oil film volume fraction is 0.35 with an equivalent elastic modulus E = 30 MPa. The equivalent elastic modulus is E = 30 MPa, and the oil film volume percent is 0.35, MC < 9%, MC 9–12%, and MC 12–15% are the moisture settings for cotton seeds. For varying moisture levels, the simulated threshold alarm lines are 290 °C, 300 °C, and 330 °C, respectively. With contact pressure, the interfacial heat transfer coefficient, h = 2 × 10⁻⁶ W·m−2·K−1, is updated online. ω = 3500 rpm is the spindle rotation speed. The equivalent effective area, calibrated by the test bench force sensor, is used to determine the normal load Fn. It is set at 6000 N and updated inside the contact window based on the withdrawal process. The ambient temperature is set to 30 °C, the dynamic coefficient is 0.11, and the friction coefficient μ0 is roughly 0.22.
2.5. Test of the Cotton Burning Temperature on the Cotton Conveyor Pipe’s Wall Surface in a Cotton Picker
To address the challenge of unstable and unrepeatable surface temperature measurements on moving cotton bales caused by high-speed airflow within cotton transport pipes, this study established a detection strategy primarily relying on CO levels, supplemented by radiant wall temperature. CO serves as the early chemical indicator for smoldering combustion, with an alarm threshold of ≥50 ppm, while pipe wall radiant temperature characterizes structural heat accumulation. Specifically, unburned and burning seed cotton were conveyed through a cotton picker test rig (as shown in Figure 9). The thermal changes induced by the movement and collision of both types of seed cotton against the wall surface were compared to determine the combustion temperature threshold for the cotton conveyor pipe wall. Ambient air temperature was maintained at 29 °C.
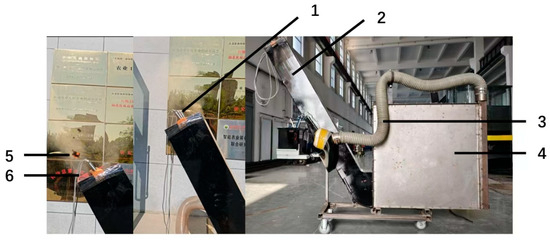
Figure 9.
Cotton Picker Picking Head Test Machine. 1. Infrared temperature sensor; 2. Cotton feed tube; 3. Air feed tube; 4. Picking head; 5. Burning seed cotton; 6. Fire smoke. Note: The plaque at the rear was awarded to the college for its achievements and is unrelated to this research.
3. Results and Discussion
3.1. Results of the Open-Flame Test on Seed Cotton
Ten small flame ignition tests were conducted on 30 g samples of seed cotton at three moisture content levels. Based on data from this test design, including open flame ignition temperature, smoldering ignition temperature, and flame extinction duration, the quantitative results are compiled in Table 3 as follows.
Table 3.
Seed Cotton Open-Flame Test Data.
To facilitate comparison and trend analysis, the sequential test data in Table 3 were grouped by moisture content, with ΔT defined as the difference between the open-flame and smoldering temperatures. Based on this, composite temperature plots and duration plots were generated to visually illustrate the influence of moisture content on combustion behavior (see Figure 10 and Figure 11).
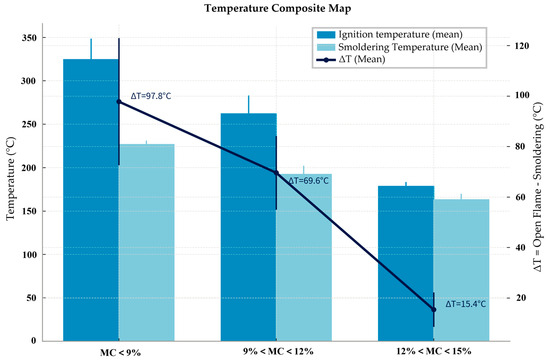
Figure 10.
Comprehensive Chart of Seed Cotton Ignition Temperatures.
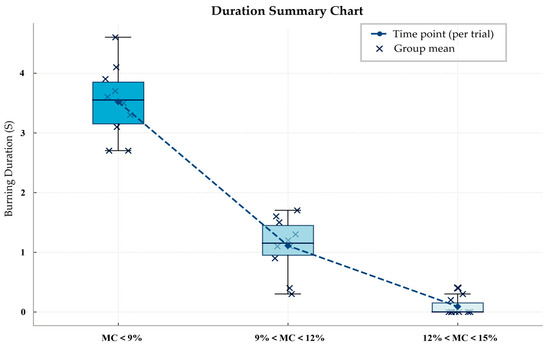
Figure 11.
Comprehensive Chart of Open-Flame Duration for Seed Cotton.
The higher the moisture content, the more difficult it is to sustain open-flames, with smoldering becoming dominant and shifting to the inner layers of seed cotton that are not visible. Specifically, as the humidity of seed cotton increases, both the open flame temperature and duration decrease simultaneously. The temperature difference ΔT rapidly shrinks from 97.8 °C to 15.4 °C, while the duration of open flame burns drops from 3.5 s to 0.1 s.
When 12% < MC < 15%, the fire typically ignites instantly and then smolders immediately. This indicates that at low seed cotton moisture levels, the primary concern is preventing flame spread; at medium moisture levels, ventilation or disturbance can easily reignite the fire; while at high moisture levels, the main risks are internal smoldering heat accumulation and the hidden danger of unseen reignition.
3.2. Seed Cotton Smoldering Test Results
Based on the five criteria for determining seed cotton smoldering in Section 2.3, experiments were conducted using the DL394490 cone heating apparatus. The critical temperatures and durations for seed cotton smoldering at various humidity levels obtained from this experimental protocol are summarized in Table 4.
Table 4.
Smoldering Data for Seed Cotton.
The above experiments demonstrate that when MC < 9%, as the heater temperature gradually increases, the seed cotton changes from a light yellow surface color to a light yellow with black specks. The heated section eventually turns entirely black, accompanied by smoke and a burnt odor at the test site. Even after removing the heater, the combustion reaction persists, resulting in smoldering of the seed cotton. At MC 9–12%, the seed cotton changed from light yellow to speckled with black dots, with internal temperatures also rising. As temperatures continued to increase, localized blackening appeared in the seed cotton, followed by the formation of a black carbon layer. After removing the heater, combustion persisted, resulting in smoldering of the seed cotton. At MC 12–15%, as seed cotton moisture increased, it transitioned from light yellow to deep yellow and then to yellowish-black, exhibiting smoldering. For data comparison and analysis, experimental results were visualized as shown in Figure 12.
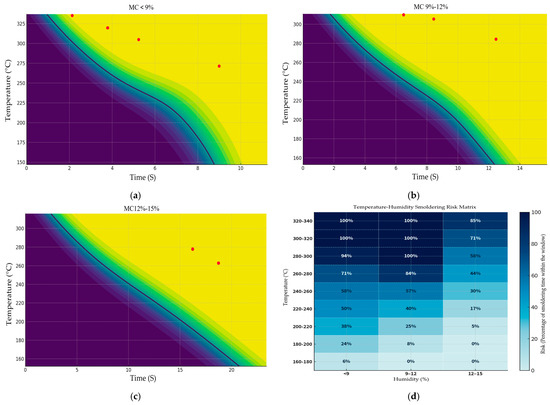
Figure 12.
Temperature-Time vs. Smoldering Risk Matrix: (a) MC < 9%; (b) MC 9–12%; (c) MC 12–15%; (d) Smoldering Risk Matrix Chart.
Figure 12a–c shows three isoprobability plots. The horizontal axis represents time, the vertical axis represents temperature, and colors indicate the probability of smoldering combustion. Yellow indicates high probability, purple indicates low probability, and the dark curve represents the threshold line. The red dots in the figure denote smoldering points. The equal probability curve shifts rightward and downward as moisture content increases, indicating an equivalent sensitization relationship between temperature and exposure duration, with high moisture content significantly raising the smoldering threshold for seed cotton. Smoldering risk matrices were obtained at temperatures ranging from 160 to 340 °C. When MC < 9%, the probability of smoldering at 260 °C reached 58–71%. For MC 9–12%, the probability at 260 °C ranged from 57% to 84%, while MC 12–15% required temperatures as high as 300 °C to achieve 58–71%. Figure 12d indicates that 240–260 °C constitutes a smoldering transition zone, with probabilities of 58%, 57%, and 30%, respectively. Temperatures below 200 °C present overall low risk, though residual risks of 6–24% persist even at MC < 9%. Therefore, it is recommended to set alarm thresholds in tiers: trigger smoldering warnings at MC < 9% and MC 9–12% when temperatures exceed 240 °C, and trigger warnings for MC 12–15% when temperatures exceed 280 °C.
3.3. Heat Generation from Seed Cotton Friction and Simulation Test Results
Experiments were conducted using a vertical rotating friction test rig while simultaneously constructing an ANSYS model. The smoldering determination and temperature data obtained from the experiments are compiled in Table 5, while the simulated temperature and time data are summarized in Table 6. The experimental results are presented in the following tables.
Table 5.
Heat Generation Experiment for Seed Cotton Friction.
Table 6.
Seed Cotton Simulation.
Integrate the surface temperature scatter points of seed cotton at different humidity levels, the statistical threshold risk line (threshold −12 °C), the smoldering average, and the smoldering warning range into a single coordinate system, as shown in Figure 13.
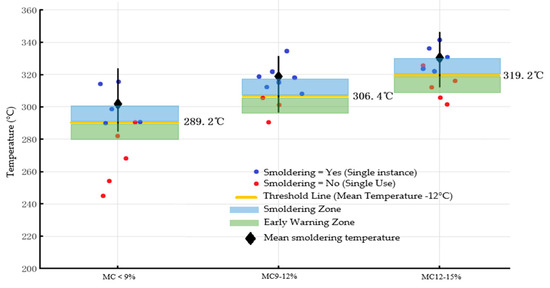
Figure 13.
Friction-Induced Heat Generation Temperature Threshold for Seed Cotton.
The test results indicate that under simulated conditions of cotton blockage in the picking head, the critical temperature at which friction-induced heat from seed cotton triggers smoldering increases monotonically with moisture content. For the MC < 9% group, the threshold is approximately 289.2 °C, with single-point data predominantly clustered around 290–300 °C and closely aligned with the threshold line, exhibiting the highest probability of threshold crossing. For MC 9–12%, the threshold was approximately 306.4 °C, with most single-point data distributed between 300 and 320 °C, exhibiting lower threshold-crossing probability than the MC < 9% group. For MC > 12%, the threshold rose to 319.2 °C. Although samples exceeding the threshold decreased relatively, once surpassed, peak temperatures often rapidly surged to 330–345 °C, exhibiting stronger thermal instability tendencies. This phenomenon aligns with the mechanism where “water content increases equivalent heat capacity and thermal conductivity while latent heat of vaporization reduces heat accumulation” [22]. Under equivalent friction work, heat dissipates more readily, thereby elevating the apparent critical temperature required for self-sustaining reactions. Individual cases where seed cotton was judged to have no smoldering typically involved no continued smoldering in the metal drum after removing the spindle, indicating that although it experienced instantaneous high temperatures, it did not reach a sustainable thermal positive feedback state. Therefore, under cotton-clogging conditions, graded warnings and interventions should be implemented based on moisture content, with warning thresholds set at approximately 289 °C (MC < 9%), 306 °C (MC 9–12%), and 319 °C (MC 12–15%).
The simulated cloud map for seed cotton is shown in Table 6.
As shown in Table 6, the high-temperature red zone in the simulation gradually expands over time. This indicates that increased seed cotton moisture elevates the smoldering temperature, consistent with the results from friction tests, demonstrating the feasibility of the simulation. After the simulation reaches the test temperature point, it continues to predict subsequent temperature changes, as illustrated in Figure 14.
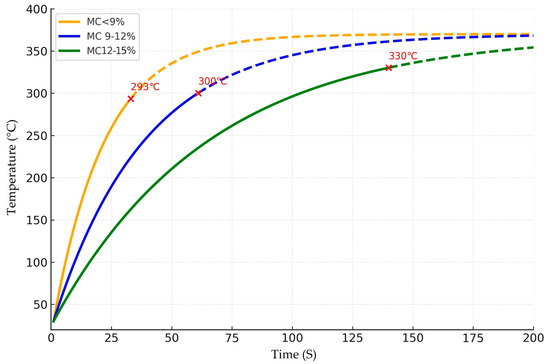
Figure 14.
Simulation Prediction of Seed Cotton Temperature.
As shown in Figure 14, the solid line represents the temperature trend of seed cotton during simulation until reaching the set smoldering point, while the dashed line indicates the temperature change after exceeding this point. When seed cotton MC < 9%, the curve rises steeply, rapidly approaching 293 °C within approximately 18–20 s. This indicates that low-moisture seed cotton generates heat quickly through friction, with heat dissipation being difficult, making it more prone to smoldering ignition. Conversely, at MC 9–12%, the rate of temperature rise slows significantly, delaying the critical point to approximately 36 s at around 300 °C. As humidity further increases to MC 12–15%, the curve rises gradually over an extended period, requiring over 80 s to reach 330 °C. Here, the critical temperature shifts significantly upward, highlighting the flame-retardant effect under high-humidity conditions. The overall trend indicates that humidity not only alters the rate of friction heat accumulation in seed cotton but also elevates the smoldering threshold. This result corroborates the preceding combustion experiments and simulation analyses, further validating the necessity of setting temperature thresholds based on humidity levels. It provides a robust theoretical foundation for optimizing fire monitoring systems in cotton harvesters.
3.4. Test Results for Cotton Conveyor Pipe Wall Temperature
Based on the combined monitoring strategy of CO and cotton-feeding tube wall temperature, wall temperature variations between burned and unburned seed cotton were compared on a cotton picker test bench. Using 10 temperature data points obtained from this test, Table 7 was compiled to illustrate the wall temperature differences under the two operating conditions, as shown below.
Table 7.
Cotton Feed Pipe Wall Temperature Test.
The above tests demonstrate that when unburned seed cotton passes through the conveyor pipe, the pipe-wall temperature remains relatively stable, with an average value close to ambient temperature. When burning seed cotton passes through, the pipe-wall temperature shows a significant increase. The lowest measured temperature was 49 ± 3 °C, obtained during the first measurement. Subsequent readings showed a gradual increase. This simulates continuous operation where the pipe-wall accumulates heat from burning cotton, resulting in higher temperatures than the initial reading. Therefore, the temperature threshold range for the cotton conveyor pipe wall is set as the average of the first test temperature and the measured temperature in this test, defined as 49–58.4 °C. This pertains solely to the temperature threshold determination. When a fire occurs inside the cotton picker’s conveyor pipe, the CO sensor first detects early-stage fire smoke signals. Subsequently, the wall temperature rises to reach the threshold range. These two factors provide a combined early warning system to prevent false alarms or missed detections caused by high ambient temperatures reaching the conveyor pipe’s temperature threshold.
3.5. Test Uncertainty and Sensitivity Analysis
3.5.1. Test Uncertainty Analysis
All key experiments in this study were conducted with 10 replicates. Data dispersion was quantified using mean ± standard deviation and coefficient of variation (CV = SD/mean × 100%), reflecting the uncertainty introduced by experimental replication. Specific results are shown in Table 8.
Table 8.
Test Uncertainty.
Calculation of Standard Deviation and Coefficient of Variation
The standard deviation, which represents the dispersion of data, is a measurement of the degree to which individual measurements deviate from the mean across ten repeated trials. For instance, use the surface temperatures measured at 312, 325, 366, 314, 329, 308, 315, 342, 282, and 351 to determine the mean surface temperature () of the 10 open-flame tests for the MC < 9% group in the seed cotton open-flame test. Determine this indicator’s mean first.
Calculate the sum of squares of deviations
Calculate the sample standard deviation (SD)
The test table’s surface temperature (open flame, °C) of 312 ± 3 is a simplified representation based on the sum of test dispersion and sensor measurement accuracy (±3 °C). The dispersion range of ±3 °C that corresponds to sensor accuracy is used for final external reporting. Nonetheless, the standard deviation of ten duplicate data points continues to serve as the foundation for the computation logic.
The standard deviation to mean ratio, represented as a percentage, is the coefficient of variation (CV, %). It is employed to remove the influence that variations in the magnitude of means across different indicators have on dispersion comparisons. The mean and standard deviation of the same indicator serve as the foundation for the computation.
Sources of Uncertainty and Control
- (1)
- Sensor Error: The CO sensor (JX-CO-103) has an accuracy of ±5% of full scale (F.S.), but the infrared temperature sensor (FST600-400A) has an accuracy of ±3 °C with respect to the measured value. Through on-site CO sensor verification and three-point infrared sensor calibration, this study decreased such inaccuracies.
- (2)
- Operating Condition Control Error: In friction tests, the centrifugal fan speed was adjusted to control the air velocity in the cotton feed pipe and the extractor’s insertion depth (3 cm), with an error of ≤±5%. A moisture meter (ZTW1602A, Chint, Yueqing, China) was used to control the moisture content of seed cotton, with an inaccuracy of ≤±0.5%.
- (3)
- Human Operational Error: A timer regulates the 0.3 s contact time with the little flame in the seed cotton open-flame test. To reduce subjective mistakes, two test personnel cross-verify the combustion status during the smoldering test.
- (4)
- Pattern of Error Reduction for Multiple Measurements: The standard error of the mean is calculated using the standard deviation calculation logic developed in Section 3.5.1 and the data from 10 repeated trials provided in Table 3 (standard error = standard deviation of a single measurement/number of repetitions). For instance, the standard error of the mean for the seed cotton group with MC < 9% (mean ignition temperature 324.4 °C, standard variation 3 °C) is 3/10 ≈ 0.95 °C. The real precision decreases from ±3 °C per measurement to within ±1 °C after averaging. Similarly, the average precision for the two groups is ±1.1 °C and ±1.7 °C, respectively, based on data from Table 2 for the seed cotton groups with MC 9–12% (standard deviation 3 °C) and the MC 12–15% seed cotton group (standard deviation 3 °C). The low dispersion results in Table 7 (MC < 9% group CV = 0.92% and MC 12–15% group CV = 1.68%) are consistent with this.
3.5.2. Sensitivity Analysis of Test Parameters
Sensitivity analysis makes it clear which on-site risk control methods should be prioritized. Abnormal increases in normal load (e.g., cotton obstruction in the picking head) should be the main focus of fire monitoring in cotton pickers. Real-time threshold modifications using moisture content sensors should receive secondary focus. Excessive calibration is unnecessary because thresholds are not significantly affected by changes in rotational speed. Table 9 displays the findings of the sensitivity analysis.
Table 9.
Sensitivity Analysis of the Experiment.
In order to create unique tests for figuring out the temperature thresholds of the fire monitoring system, the previously mentioned studies examined the properties of raw cotton at three different locations: the cotton bin, picking head, and conveyor pipe. Conveyor pipe and cotton bin early alerts were set up. Nonetheless, it is crucial to model and forecast the friction between the picking spindles and raw cotton inside the picking head because of the constant friction that occurs between them. The accuracy and resilience of the system under complex field conditions are improved by evaluating simulation predictions and experimental thresholds together. A hierarchical temperature threshold system based on dynamic responses to fiber properties and moisture content was developed in the study. The smoldering and blazing characteristics of seed cotton are determined by its moisture level, according to consistent simulation and experimental evidence. This calls for a change from static to dynamic fire warning strategies. Table 10 below provides a summary of the thresholds established in this study, which form the direct foundation for system integration.
Table 10.
Summary of Dynamic Temperature Threshold System for Fire Monitoring in Cotton Pickers.
4. Conclusions
- (1)
- This study tackles the fundamental problem in cotton picker fire monitoring, which is the persistently high false alarm rates caused by traditional fixed temperature thresholds that are unable to adjust to the dynamic fluctuations in seed cotton moisture content (MC) and the various heat generation characteristics of the picking head, cotton conveyor tube, and cotton bin components. We created a dynamic threshold calibration system that connects seed cotton humidity and multi-point monitoring. In order to thoroughly examine the fire hazard characteristics of the three crucial parts—the picking head, cotton conveyor tube, and cotton bin—multi-scenario empirical tests, open-flame, smoldering, and friction bench tests on seed cotton, as well as numerical simulation techniques, were integrated. The drawbacks of conventional monitoring systems that depend on consistent, fixed thresholds are addressed by this method.
- (2)
- This study identified the key factors influencing and quantified the heat generation and combustion characteristics of seed cotton friction. Under simulated field cotton-clogging conditions (seed cotton density: 120 kg/m3), the friction heat power between the picker and seed cotton reached 7.26 × 10³ W. A single 0.1 s friction event generates 326.7 J of effective heat, sufficient to raise the temperature of 30 g of seed cotton by 8.4 °C. When this heat accumulates continuously for 10 s, the seed cotton temperature approaches the 289 °C smoldering ignition threshold of the picking head, confirming that accumulated friction heat is the core cause of cotton picker fires. Simultaneously, through the pretreatment of seed cotton samples and standardized experimental variables, fluctuations in material reflectance coefficients were effectively eliminated from infrared measurements, providing a reliable data foundation for quantifying fire risk analysis.
- (3)
- This study advances fire risk management for cotton pickers from a reactive response model to a predictive proactive model. The proposed thresholds enable the system to perform anticipatory interventions before catastrophic consequences occur. However, certain research limitations exist. Future work will focus on integrating this strategy into commercial cotton pickers and conducting field validation under diverse agronomic conditions. This experiment referenced the picker parameters of the Boshiran 4MZ-6 cotton picker. However, field cotton pickers vary widely in models (e.g., John Deere, Case); differences in picker tooth count, rotational speed range, cotton feed tube diameter, and component materials may lead to variations in the rates of friction heat generation and wall temperature distributions. Subsequent collaboration with agricultural machinery manufacturers will involve conducting multi-model threshold validation tests to establish a machine-model threshold matching table, enhancing the universality of the threshold system. Furthermore, integrating multi-source information such as real-time moisture sensing and airflow monitoring to build a more robust intelligent early warning system represents a promising direction for future research.
Author Contributions
Conceptualization, C.H., Z.S. and D.S.; methodology, F.W. and D.S.; design, Z.S., Y.W. and D.S.; analysis, Z.S., Y.W. and D.S.; D.S. and Z.S. wrote the paper. All authors have read and agreed to the published version of the manuscript.
Funding
This research was funded by the Xinjiang Uygur Autonomous Region Natural Science Foundation Project ‘Research on Fire Mechanism and Detection System of Cotton Picker’ (2022D01A77); Xinjiang agricultural machinery R&D and manufacturing promotion and application integration project ‘Cotton picker automatic alignment navigation and fire detection system R&D and manufacturing promotion and application’ (YTHSD 2022-08).
Institutional Review Board Statement
Not applicable.
Informed Consent Statement
Not applicable.
Data Availability Statement
The dataset used in this research is available upon valid request to any of the authors of this research article.
Conflicts of Interest
The authors declare no conflicts of interest.
References
- Shi, M.; Gao, X.; Zhang, W.; Ran, K.; Zhong, L.; Xu, L. Current Status and Prospects of Key Technologies for Cotton Pickers. Trans. Chin. Soc. Agric. Mach. 2025, 56, 167–183. [Google Scholar]
- Yu, B.; Zhang, H.; Ma, W.; Yang, Z. Design and Experimental Study of Detection Circuit for Fire Detection and Early Warning Device in Cotton Pickers. Xinjiang Agric. Reclam. Sci. Technol. 2015, 38, 33–35. [Google Scholar]
- Wang, J.; Yu, B.; Liu, Q.; Zhang, H.; Ma, W.; Zhang, X. Analysis of Detection Performance of Fire Detection Device in Cotton Pickers. J. Shihezi Univ. (Nat. Sci. Ed.) 2016, 34, 649–653. [Google Scholar] [CrossRef]
- Miao, Z.; Wei, C. Development of a Spark Detection System for Cotton Conveying Pipes in Cotton Pickers. Autom. Instrum. 2016, 37, 50–53. [Google Scholar] [CrossRef]
- Li, Y. Research on Working Condition Monitoring and Typical Fault Diagnosis of Cotton Pickers. Master’s Thesis, China Academy of Agricultural Mechanization Sciences, Beijing, China, 2017. [Google Scholar]
- Han, K.; Hao, F.; Miao, Z.; Han, Z.; Gan, X.; Li, B.; Yu, P. Design and Development of a CAN-Bus-Based Monitoring System for Cotton Picker Operational Status. Agric. Mach. 2019, 9, 91–97. [Google Scholar] [CrossRef]
- Wu, Y.; Chen, K.; Yan, K.; Zhou, X.; Shi, Z. Design Research on Safety Detection and Early Warning System for Cotton Pickers. Light Ind. Sci. Technol. 2019, 35, 89–90+141. [Google Scholar]
- Li, W.; Zhang, J.; Wang, C.; Yu, T.; Zhang, H. Current Status and Prospects of Fire Monitoring Systems for Cotton Pickers. Xinjiang Agric. Mech. 2020, 3, 25–28. [Google Scholar] [CrossRef]
- Shi, Z.; Han, C.; Xue, Y. Review of Research on Fire Occurrence Mechanisms in Cotton Pickers. South. Agric. Mach. 2023, 54, 1–5. [Google Scholar]
- Shi, Z.; Wu, F.; Han, C.; Song, D. Research on Fire Detection of Cotton Picker Based on Improved Algorithm. Sensors 2025, 25, 564. [Google Scholar] [CrossRef] [PubMed]
- Shi, Z.; Wu, F.; Han, C.; Song, D.; Wu, Y. Detection Model for Cotton Picker Fire Recognition Based on Lightweight Improved YOLOv11. Agriculture 2025, 15, 1608. [Google Scholar] [CrossRef]
- Zhang, W.; Zhao, B.; Gao, S.; Zheng, Y.; Zhou, L.; Liu, S. Development of Cotton Picker Fire Monitoring System Based on GA-BP Algorithm. Sensors 2023, 23, 5553. [Google Scholar] [CrossRef] [PubMed]
- Bao, R.; Zhang, Y.; Gu, H.; Huang, H. Thermal Analysis Study on the Spontaneous Combustion Risk of Cotton. Fire Sci. Technol. 2012, 31, 100–103. [Google Scholar]
- Hagen, B.C.; Frette, V.; Kleppe, G.; Arntzen, B.J. On set of smoldering in cotton: Effects of density. Fire Saf. J. 2011, 46, 73–80. [Google Scholar] [CrossRef]
- Hagen, B.C. Ignition of smoldering in cotton: 3D-heat-transfer-modeling. Am. Sci. Res. J. Eng. Technol. Sci. 2018, 50, 66–87. Available online: https://asrjetsjournal.org/American_Scientific_Journal/article/view/4530 (accessed on 19 August 2025).
- Ohlemiller, T.J. Smoldering Combustion Hazards of Thermal Insulation Materials; NBSIR81-2350; National Bureau of Standards(NIST): Gaithersburg, MD, USA, 1981. [Google Scholar] [CrossRef]
- Hagen, B.C. On Set of Smoldering and Transition to Flaming Fire. Ph.D. Thesis, University of Bergen, Bergen, Norway, 2012. [Google Scholar]
- State Administration for Market Regulation of the People’s Republic of China, Standardization Administration of China. GB/T 1103.1-2021; Cotton—Part 1: Fine-Staple Cotton Processed by Saw Gin. China Standards Press: Beijing, China, 2021. [Google Scholar]
- Liu, C.; Gulibahar, T.; Maimaitiming, A.; Hu, G. Dynamic Characteristics Analysis of Rigid-Flexible Coupling in Flexible Vertical Picker-Type Cotton Harvesting System Based on ADAMS. Agric. Mech. Res. 2025, 47, 36–42. [Google Scholar] [CrossRef]
- Nur Aihamati, W.; Yisifujiang, S.; Zhao, T.; Maimaitiming, A. Optimal Design of Structural Parameters and Finite Element Analysis of Vertical Plucking Spindles. Jiangsu Agric. Sci. 2020, 48, 206–213. [Google Scholar] [CrossRef]
- Fang, L.; Zhang, R.; Duan, H.; Chang, J.; Zeng, Z.; Qian, Y.; Hong, M. Resistive Sensing of Seed Cotton Moisture Regain Based on Pressure Compensation. Sensors 2023, 23, 8421. [Google Scholar] [CrossRef] [PubMed]
- Abreu, F.F.; Rodrigues, L.H.A. Monitoring mini-tomatoes growth: Anon-destructive machine vision-based alternative. Agric. Agric. Agric. Eng. J. 2022, 58, 123–135. [Google Scholar] [CrossRef]


Disclaimer/Publisher’s Note: The statements, opinions and data contained in all publications are solely those of the individual author(s) and contributor(s) and not of MDPI and/or the editor(s). MDPI and/or the editor(s) disclaim responsibility for any injury to people or property resulting from any ideas, methods, instructions or products referred to in the content. |
© 2025 by the authors. Licensee MDPI, Basel, Switzerland. This article is an open access article distributed under the terms and conditions of the Creative Commons Attribution (CC BY) license (https://creativecommons.org/licenses/by/4.0/).