Author Contributions
Y.Z.: Writing—original draft, Writing—review & editing, Methodology, Software, Validation, Data curation, Formal analysis, Visualization. J.B.: Writing—review & editing, Validation, Data curation. W.L.: Conceptualization, Supervision, Project administration, Funding acquisition, Writing—review & editing. J.X.: Methodology, Formal analysis, Writing—review & editing, Project administration. L.W.: Resources, Validation, Writing—review & editing, Project administration, Funding acquisition. X.W.: Conceptualization, Methodology, Supervision, Project administration, Funding acquisition, Writing—review & editing. C.H.: Resources, Validation, Investigation, Project administration. All authors have read and agreed to the published version of the manuscript.
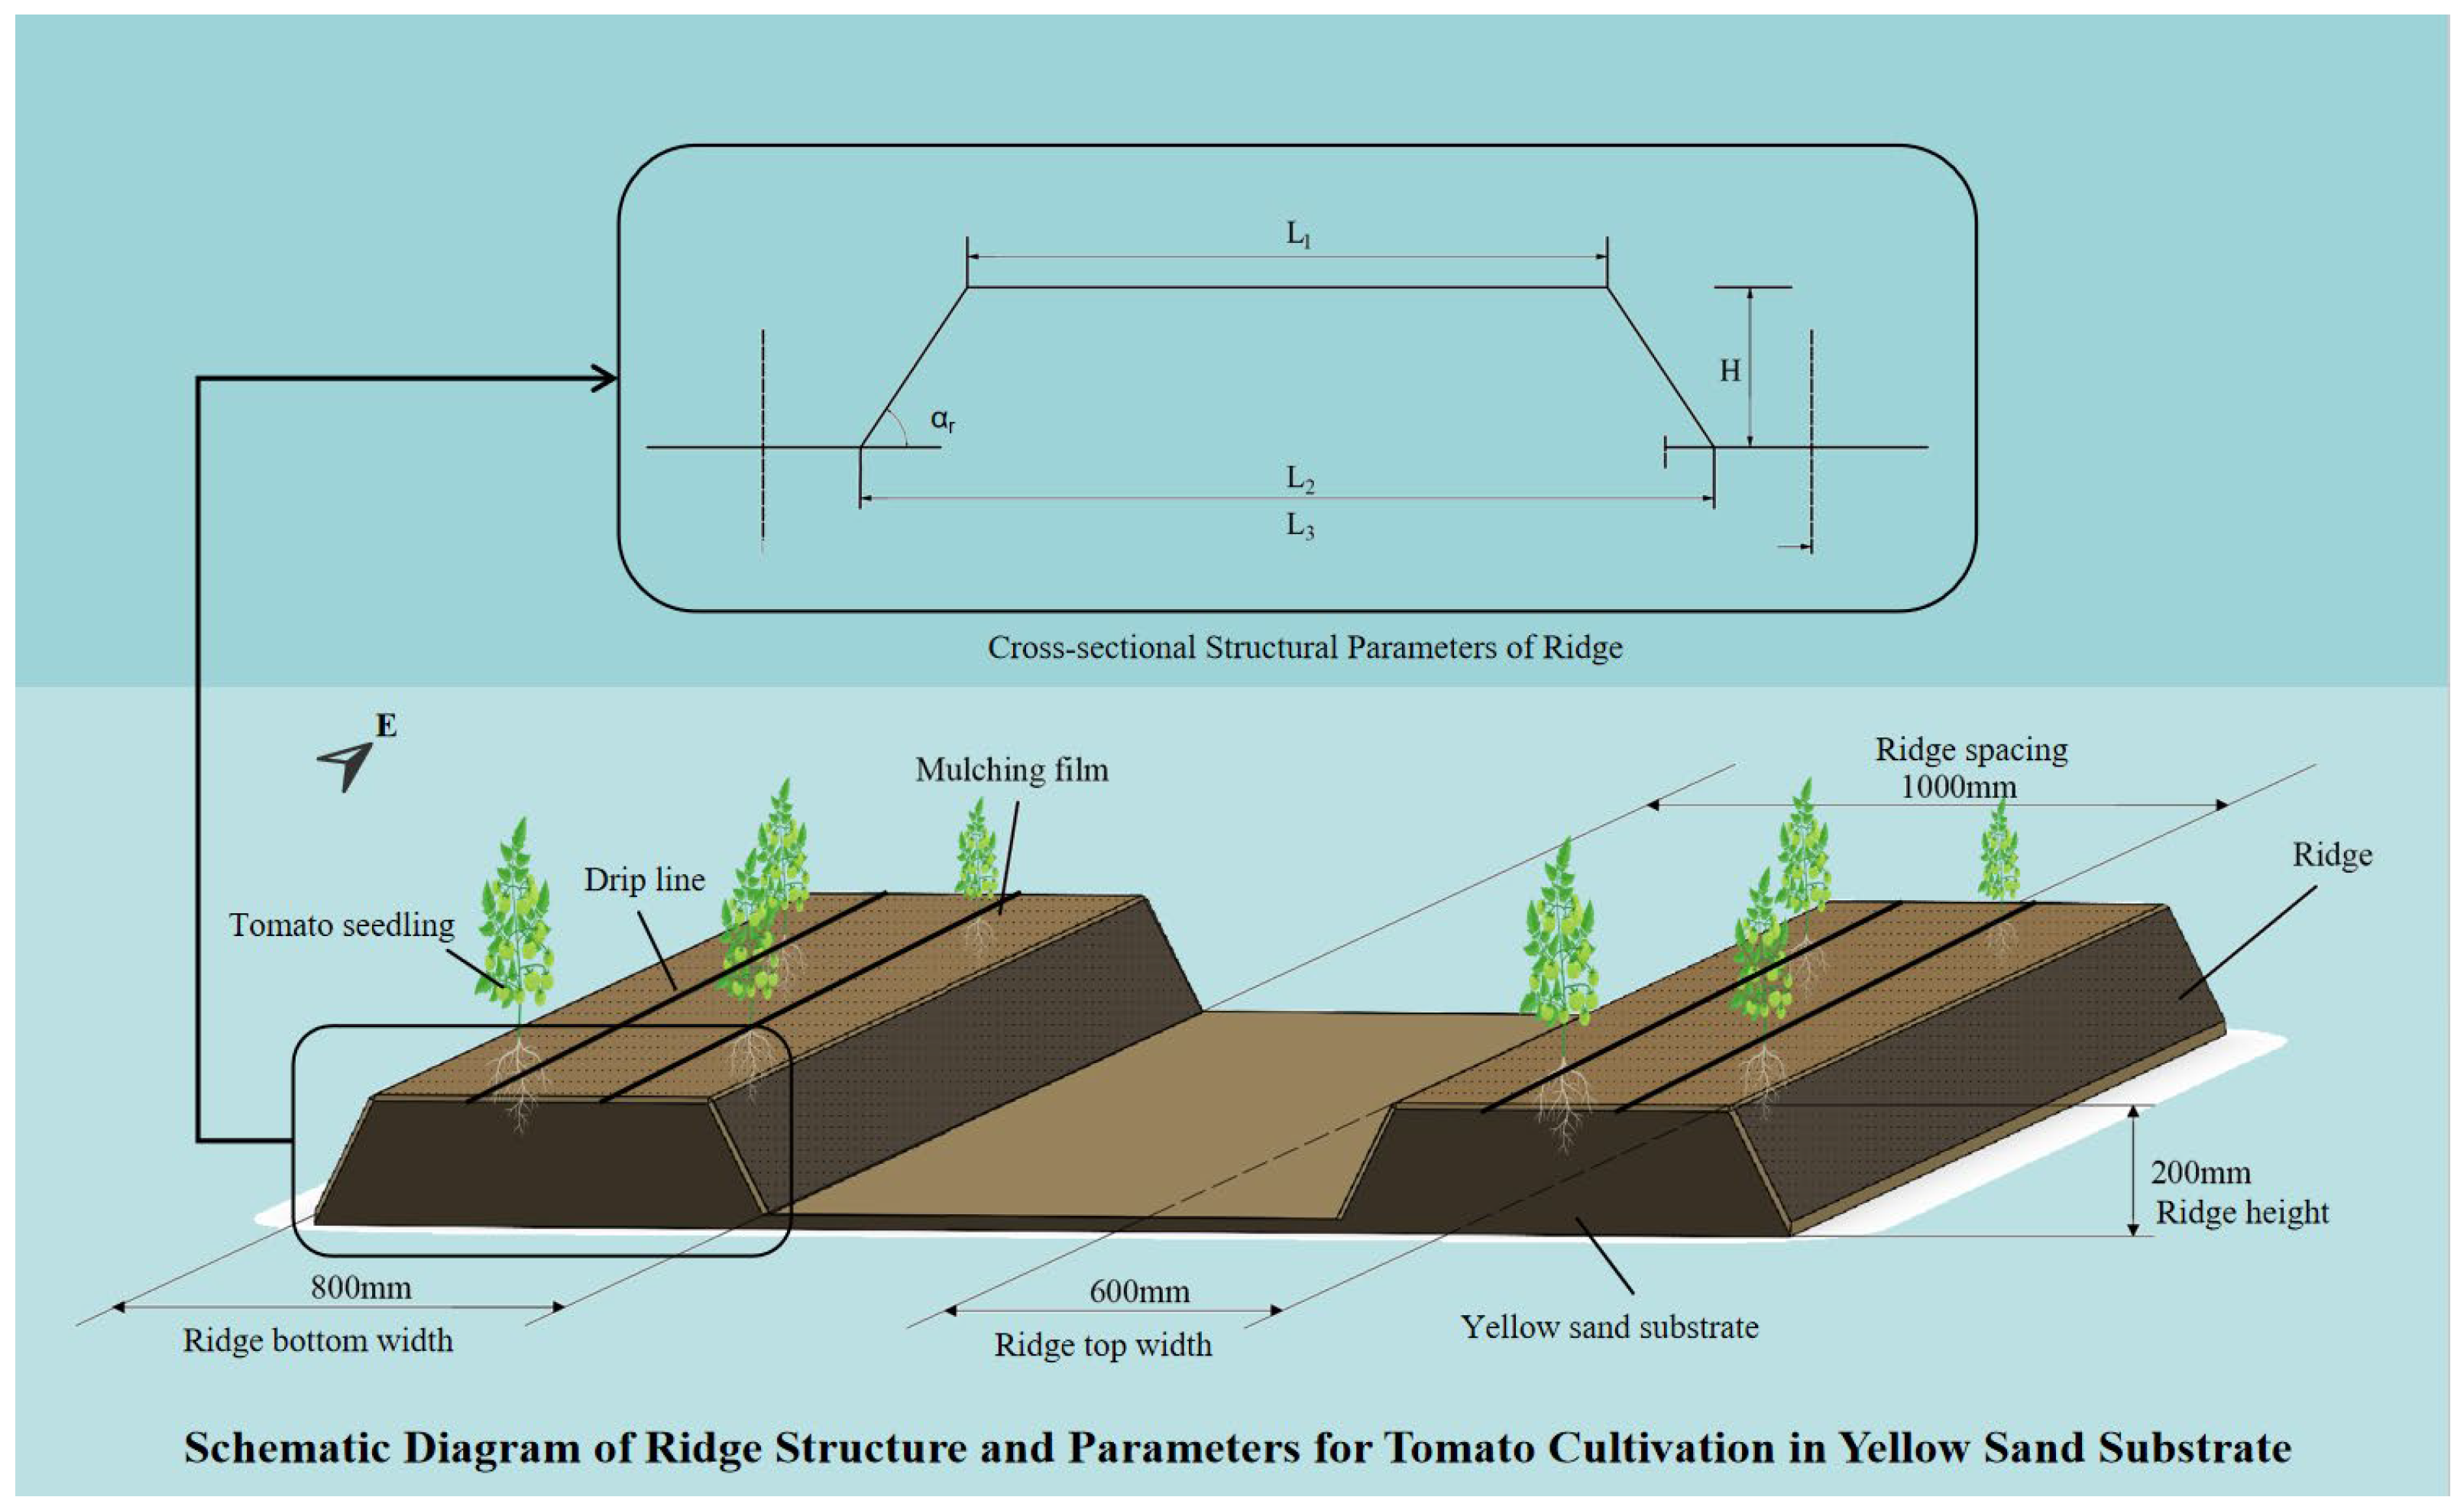
Figure 1.
Structural configuration and parameters of the ridge profile for tomato cultivation in yellow sand substrate.
Figure 1.
Structural configuration and parameters of the ridge profile for tomato cultivation in yellow sand substrate.
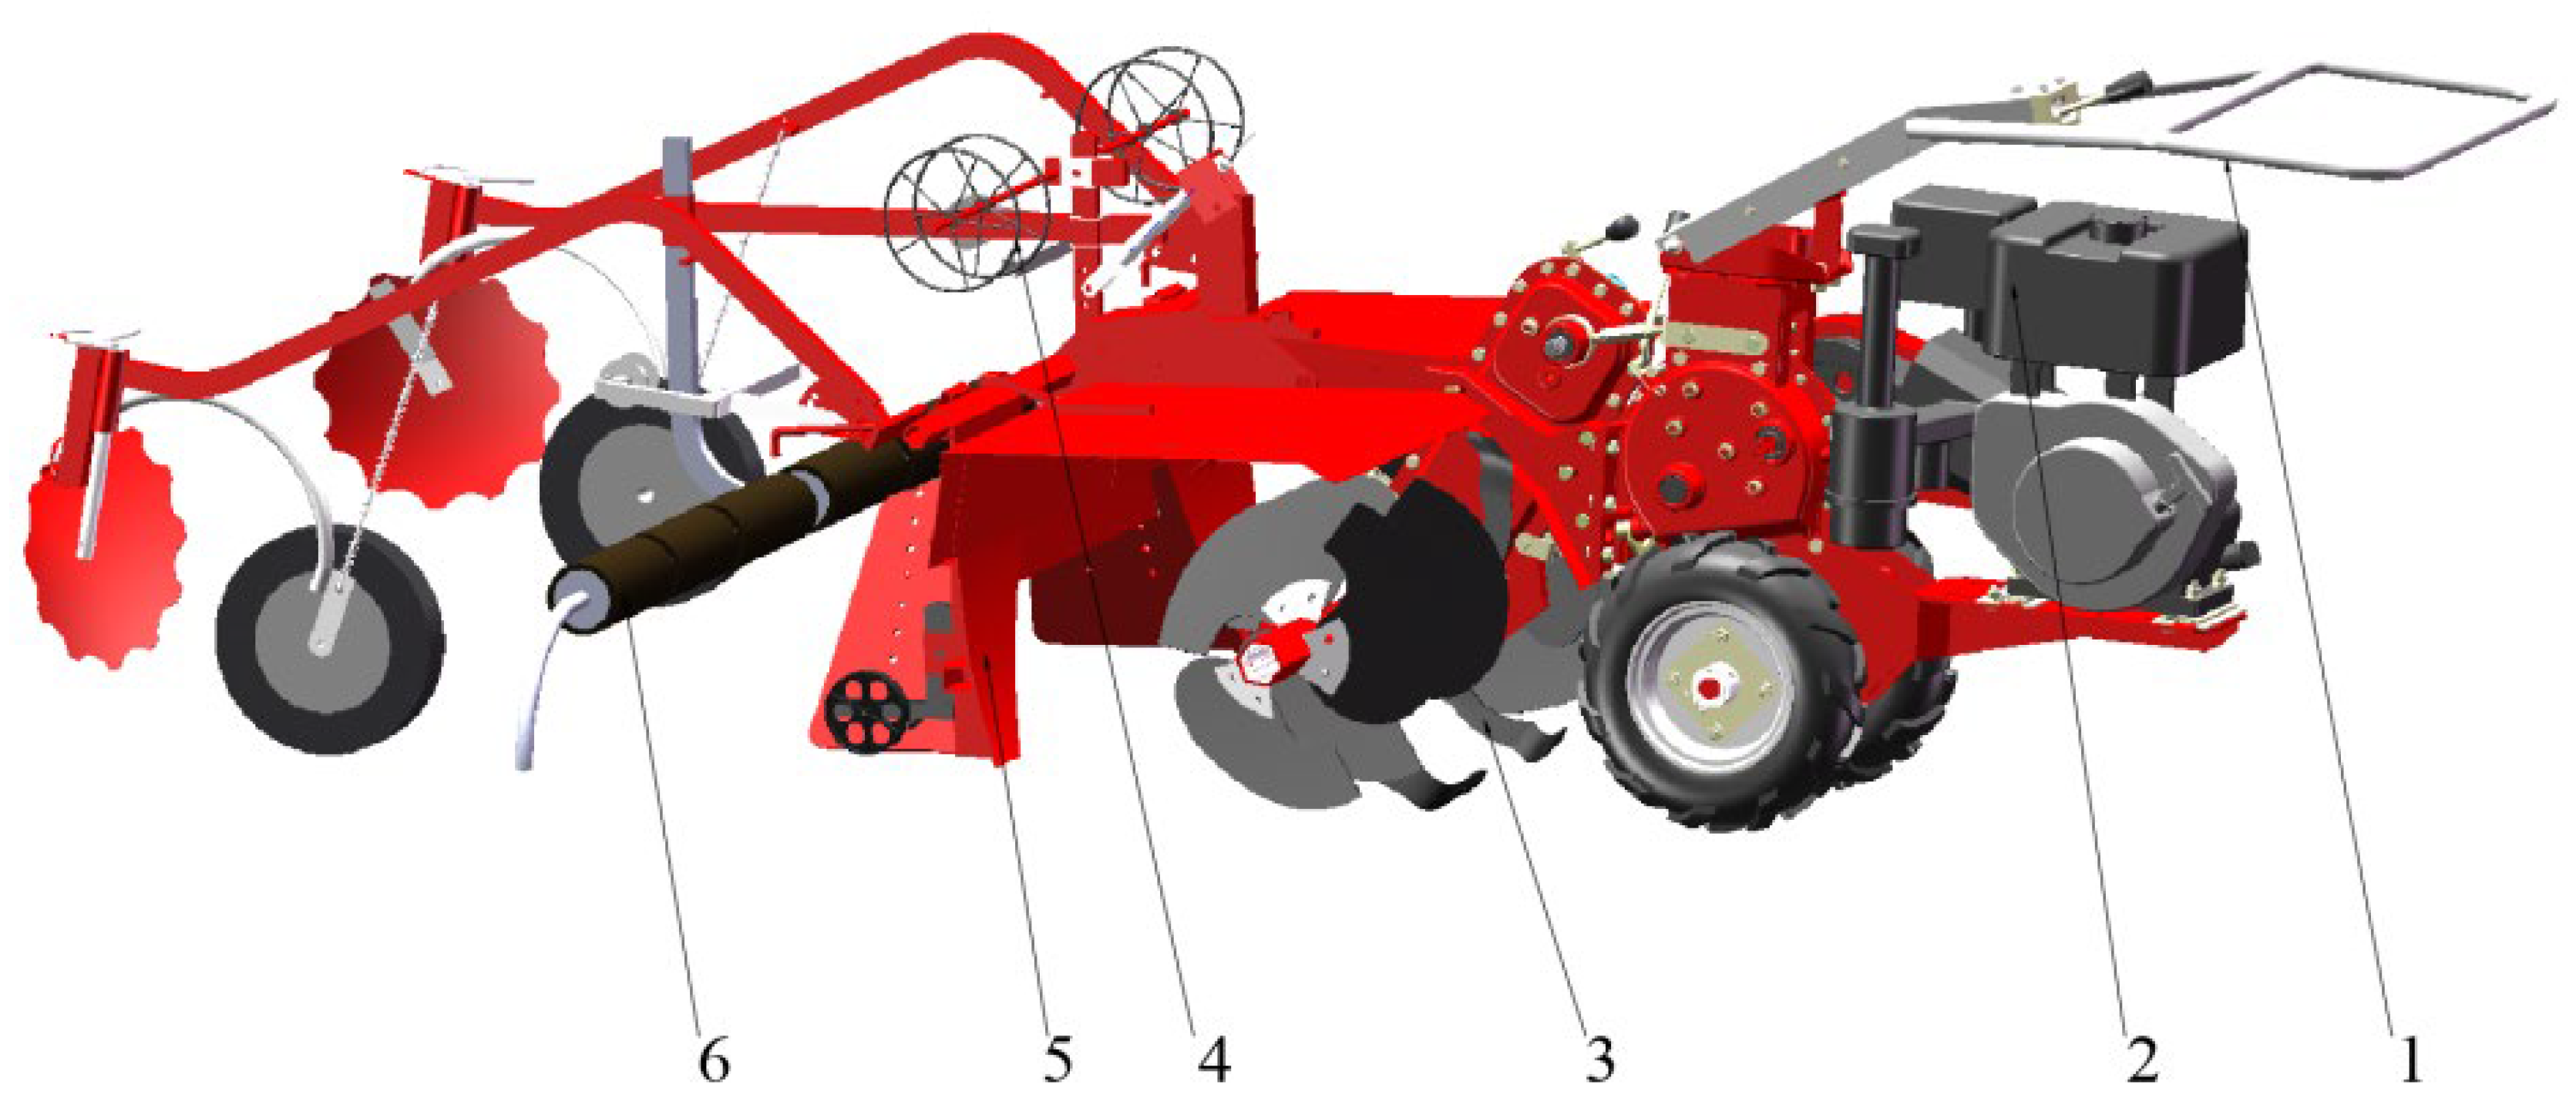
Figure 2.
Structural schematic of the ridge-forming and film-mulching machine: 1 walk-behind tractor; 2 gasoline engine; 3 ridging mechanism; 4 drip irrigation tape laying mechanism; 5 shaping mechanism; 6 film-mulching mechanism.
Figure 2.
Structural schematic of the ridge-forming and film-mulching machine: 1 walk-behind tractor; 2 gasoline engine; 3 ridging mechanism; 4 drip irrigation tape laying mechanism; 5 shaping mechanism; 6 film-mulching mechanism.
Figure 3.
Arrangement of rotary–ridging blades.
Figure 3.
Arrangement of rotary–ridging blades.
Figure 4.
Variable-pitch helical curve of the ridging blade: (a) Schematic of the variable-pitch helical geometry; (b) Development diagram of the variable-pitch helical curve.
Figure 4.
Variable-pitch helical curve of the ridging blade: (a) Schematic of the variable-pitch helical geometry; (b) Development diagram of the variable-pitch helical curve.
Figure 5.
Unfolded layout of the rotary–ridging blade arrangement.
Figure 5.
Unfolded layout of the rotary–ridging blade arrangement.
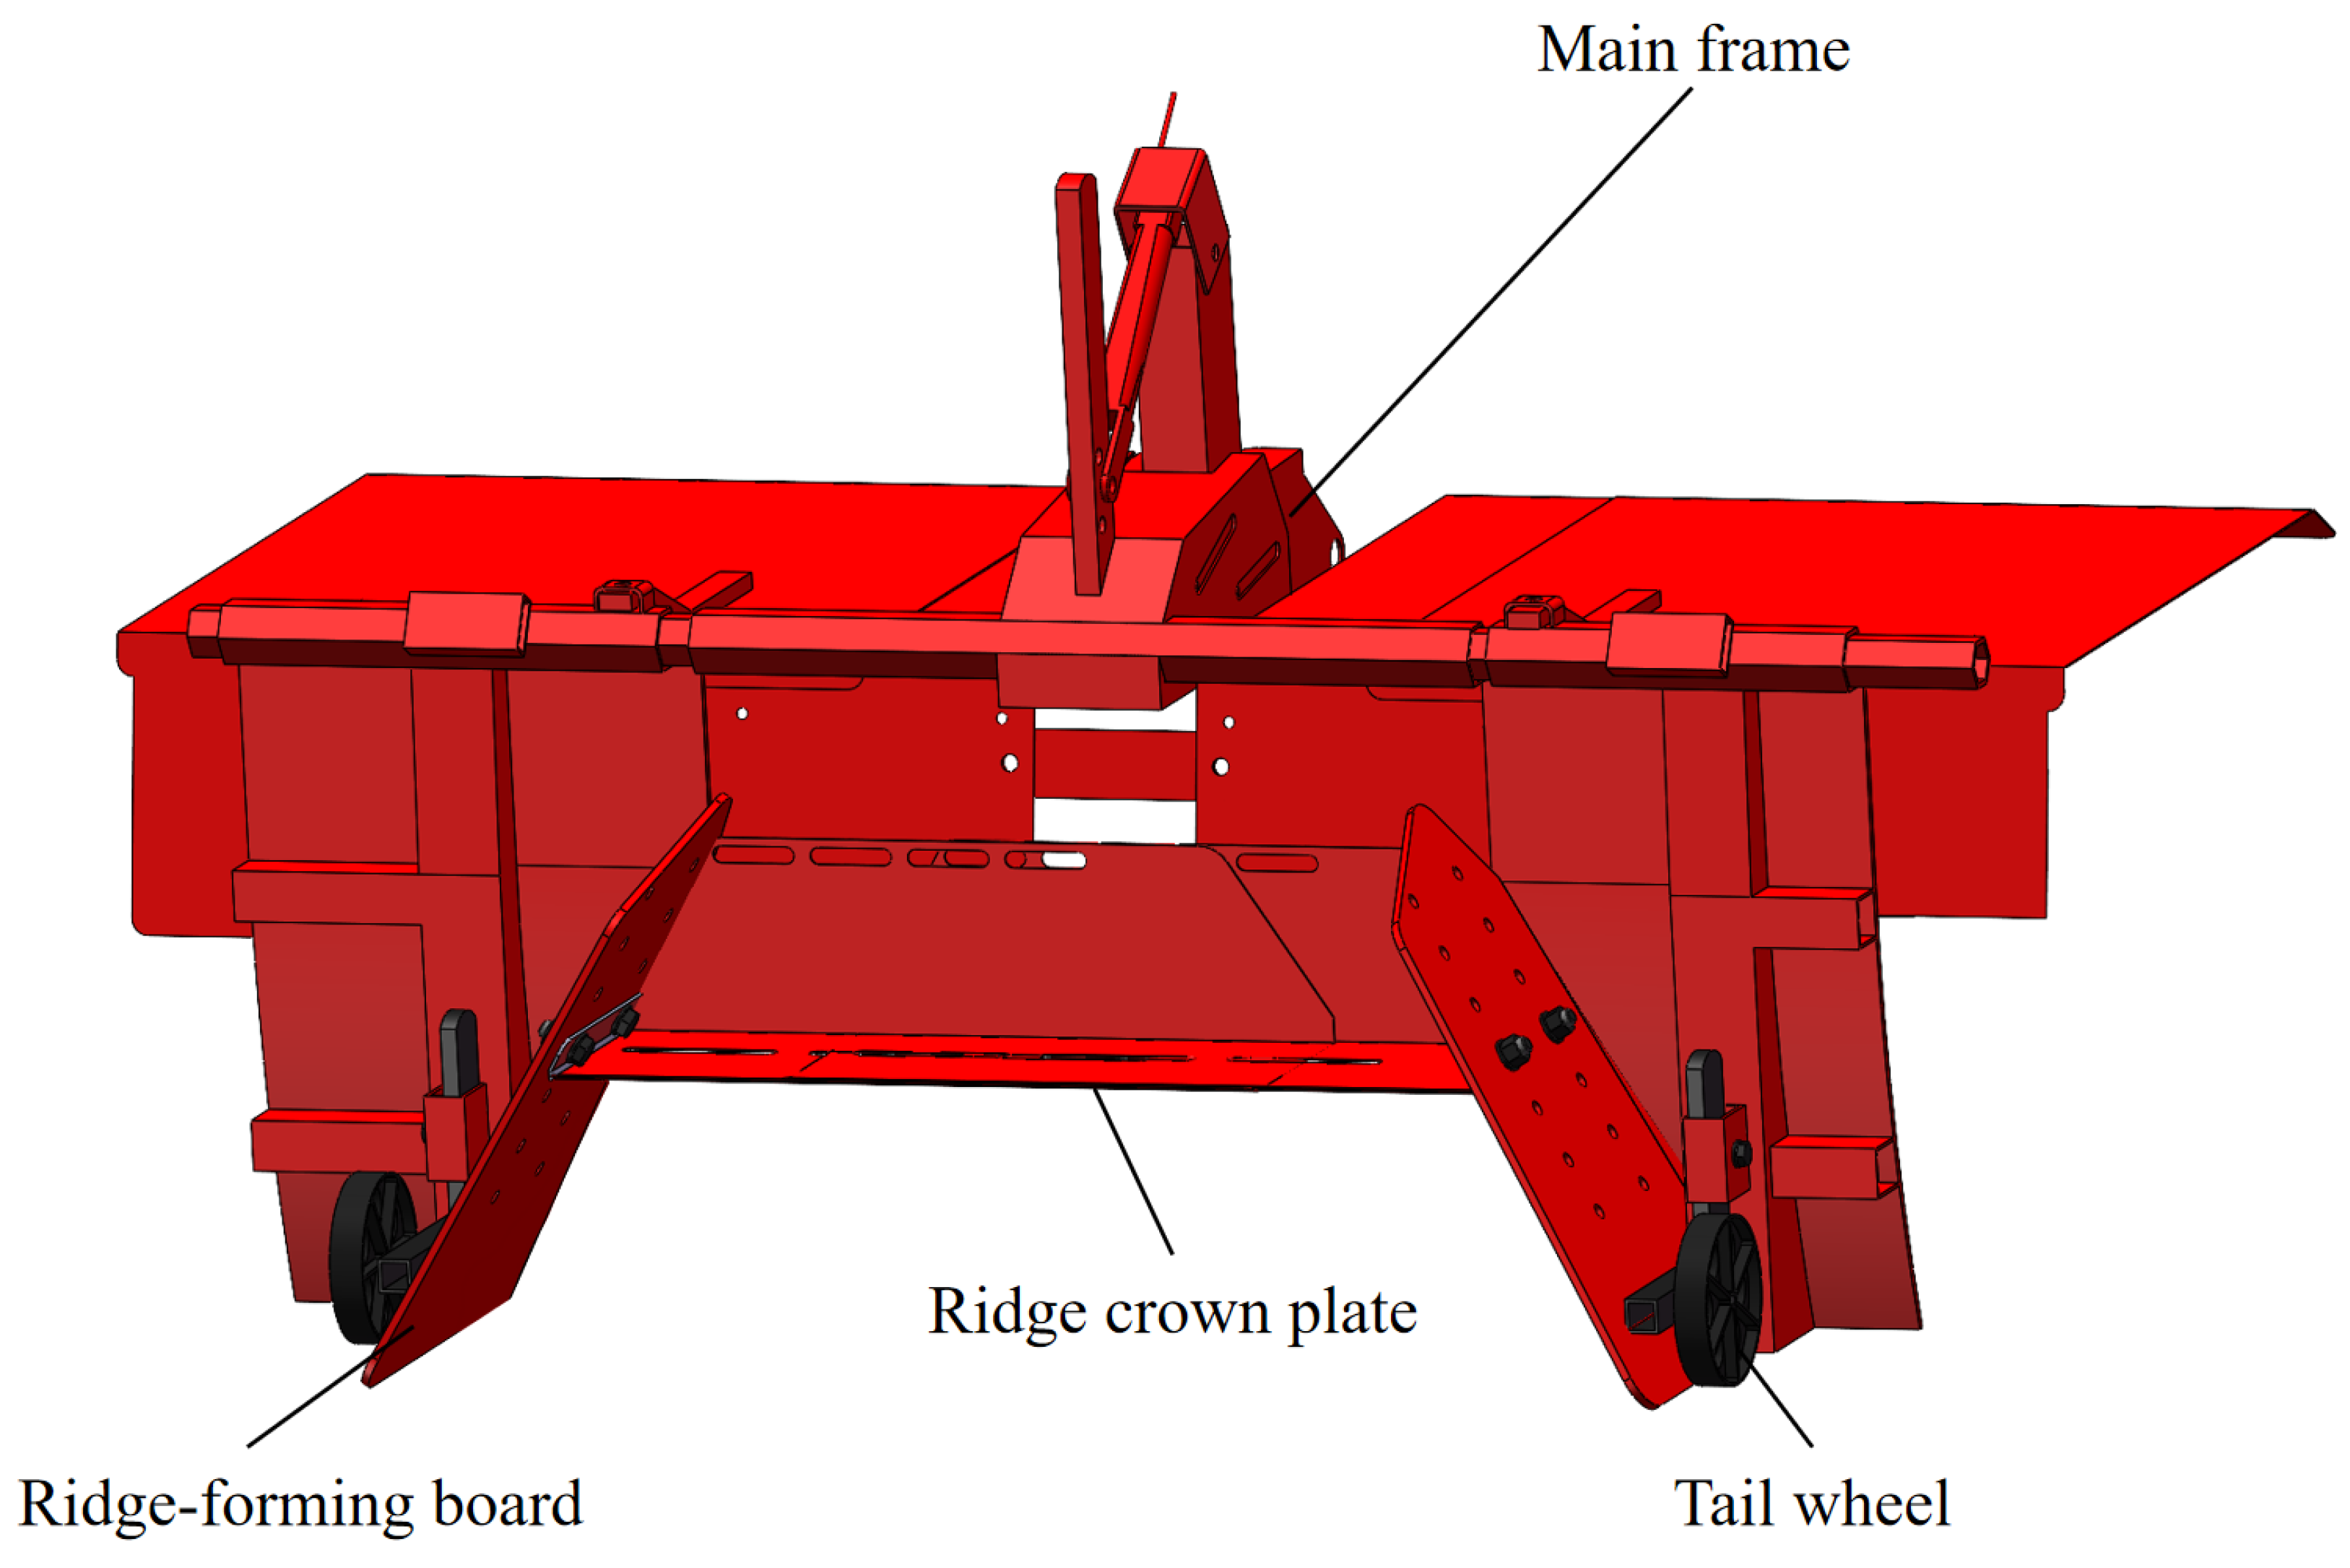
Figure 6.
Structural schematic of the ridge-shaping system.
Figure 6.
Structural schematic of the ridge-shaping system.
Figure 7.
Structural schematic of the mulching device. 1 walking wheel; 2 mulch rack; 3 pressing roller; 4 spring; 5 pressing wheel; 6 soil-covering disc.
Figure 7.
Structural schematic of the mulching device. 1 walking wheel; 2 mulch rack; 3 pressing roller; 4 spring; 5 pressing wheel; 6 soil-covering disc.
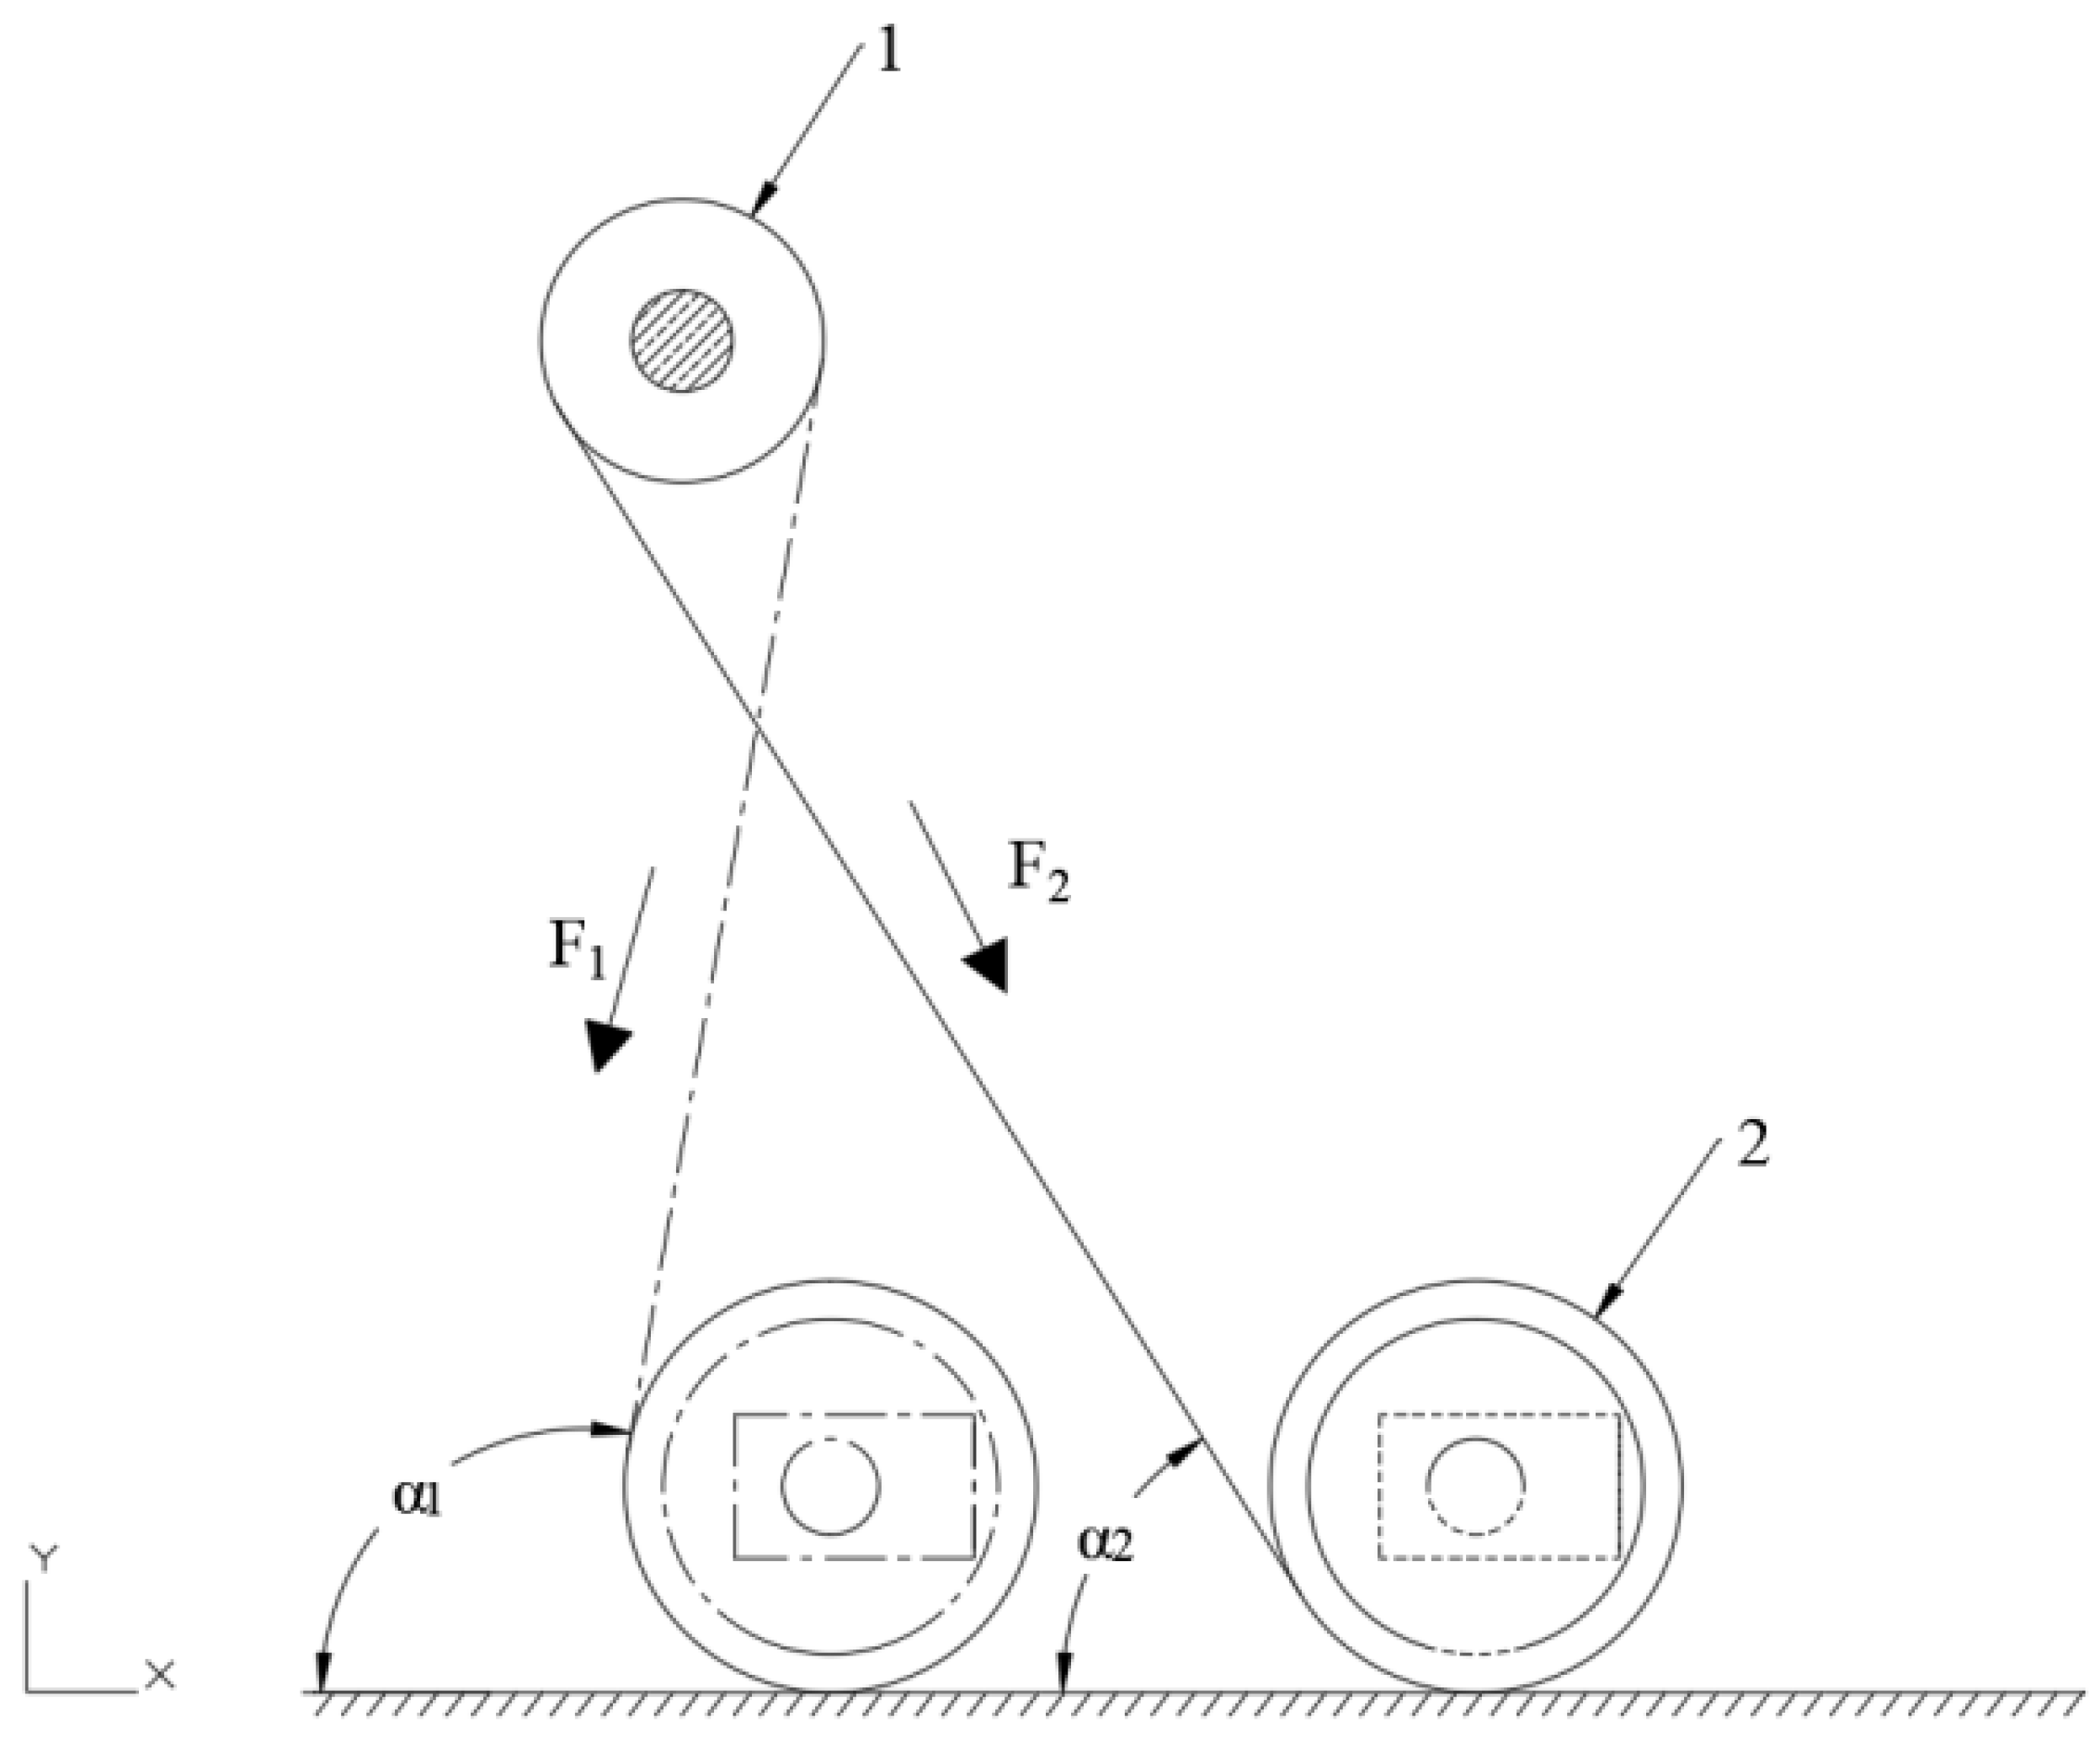
Figure 8.
Analysis of the positioning of the plastic film during mulching operation: 1 plastic film roll; 2 pressing roller.
Figure 8.
Analysis of the positioning of the plastic film during mulching operation: 1 plastic film roll; 2 pressing roller.
Figure 9.
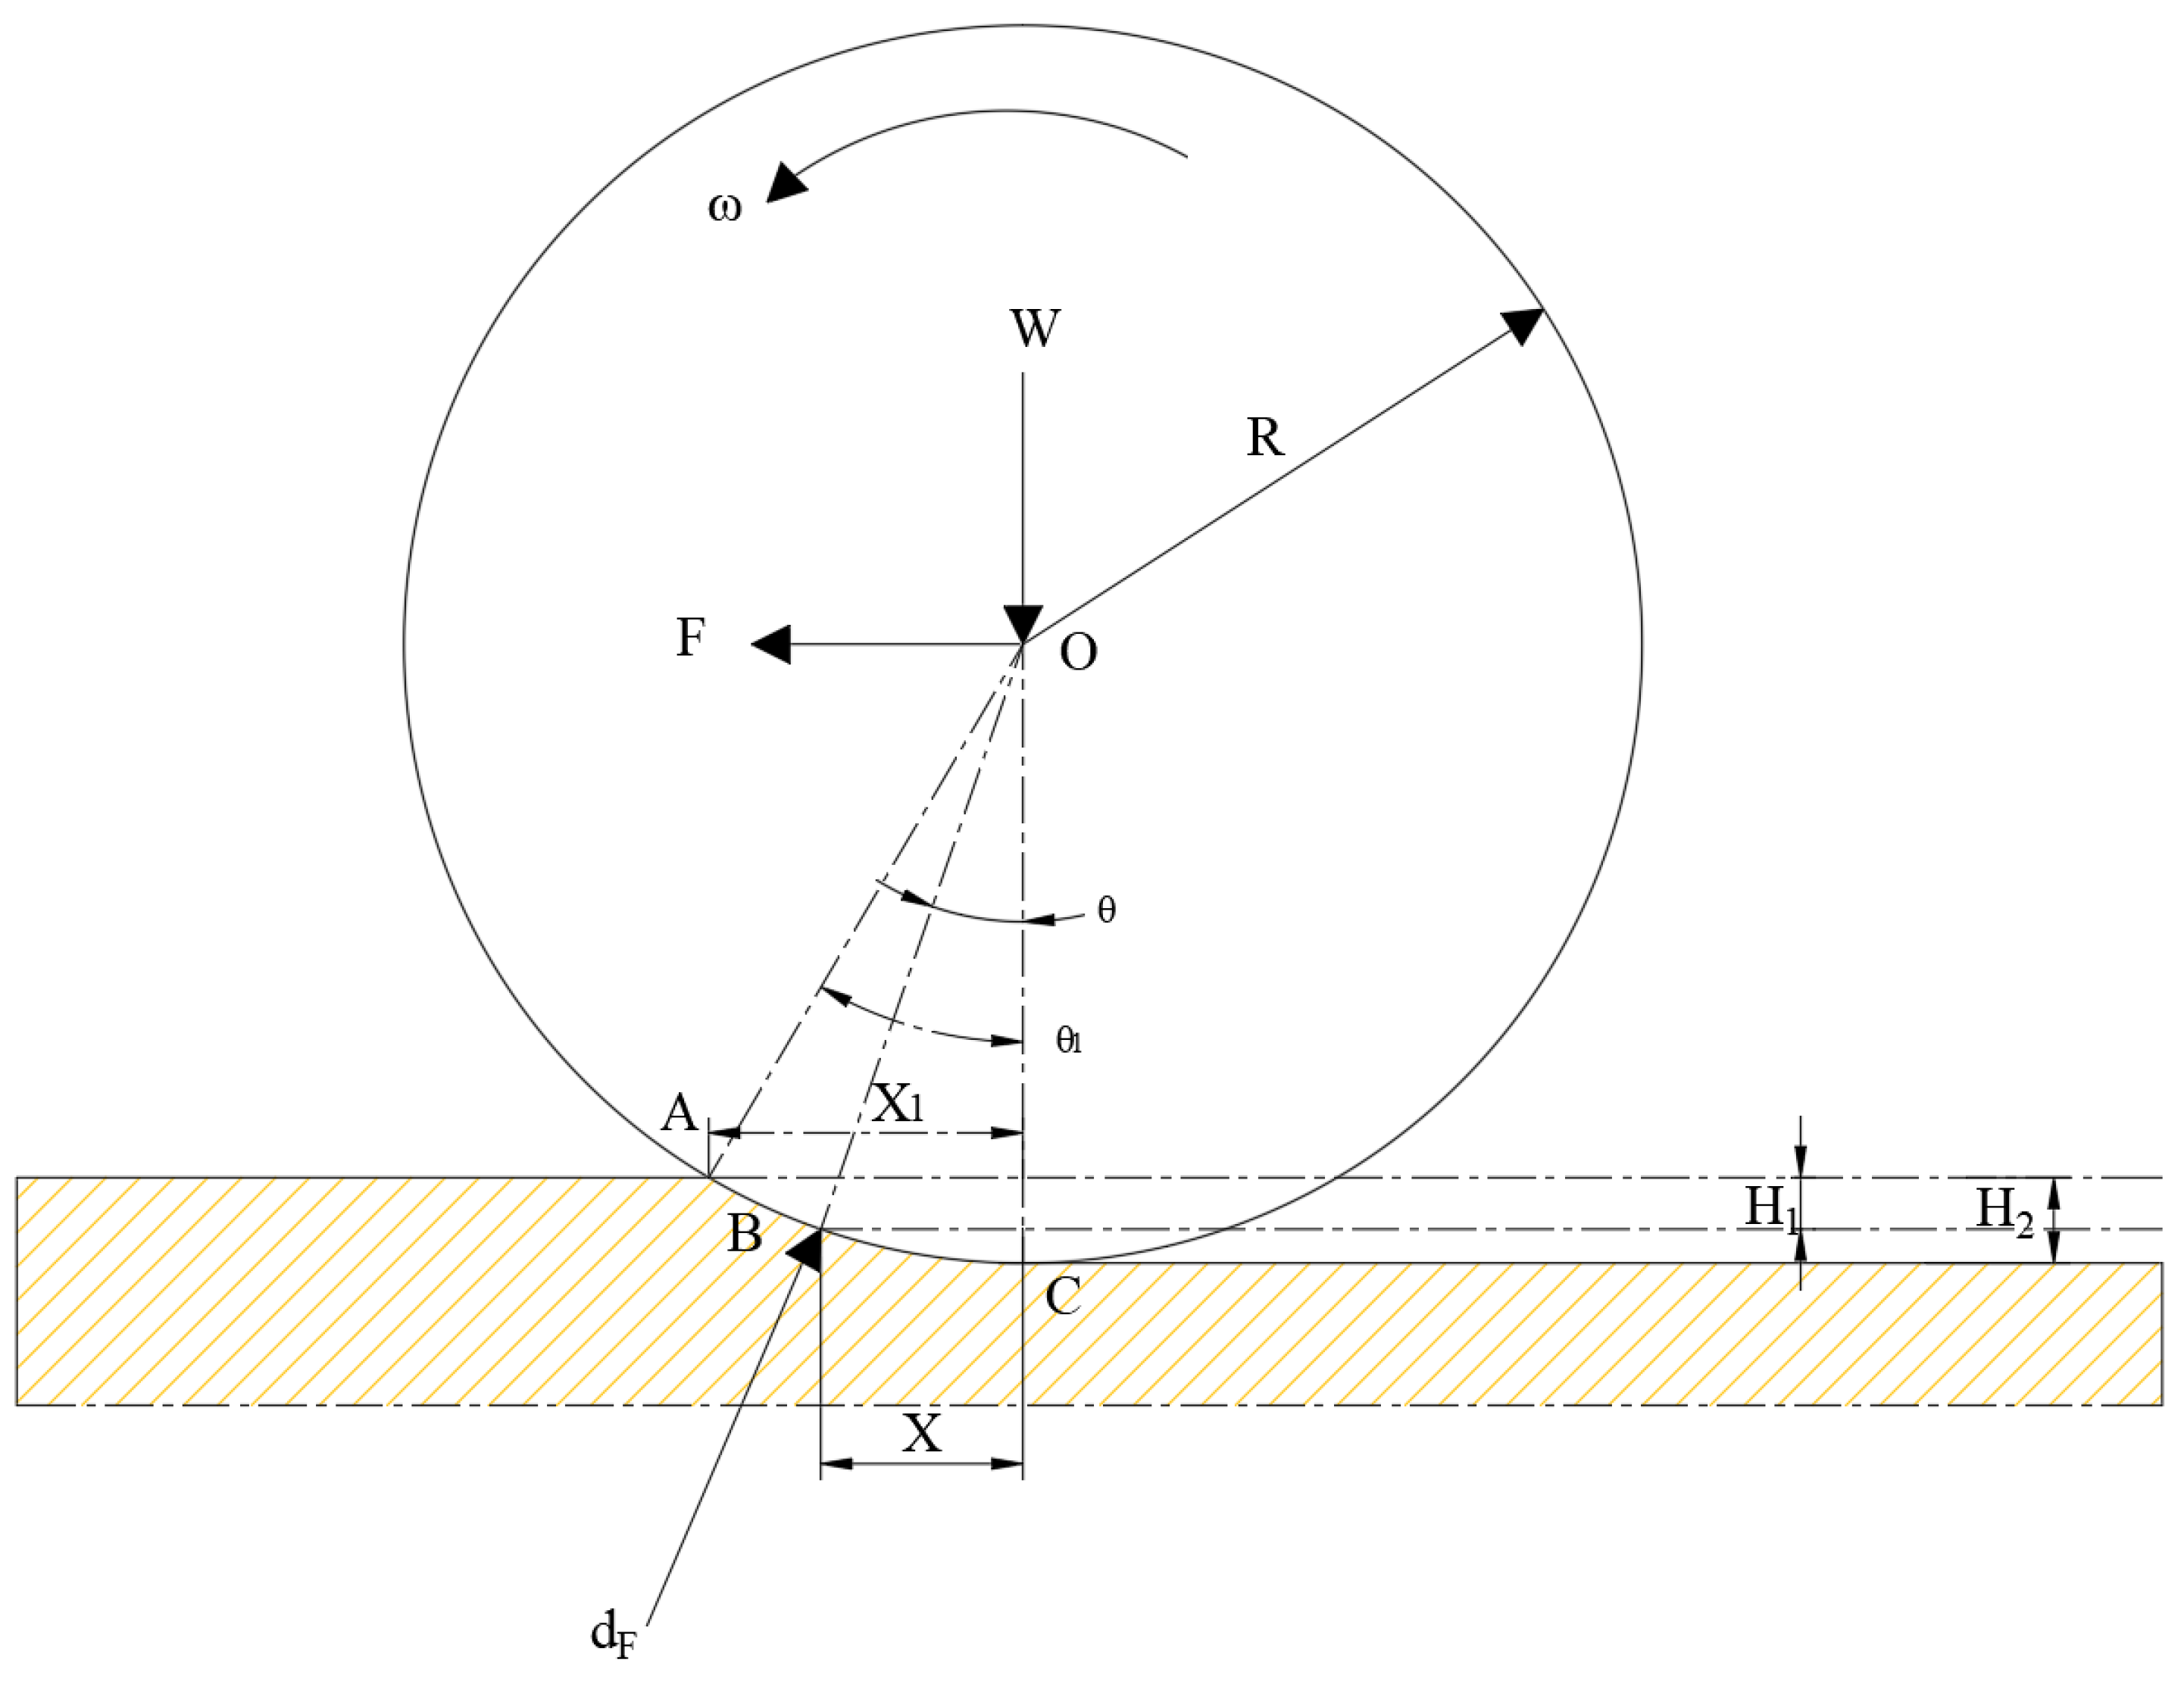
Force analysis of the mulch pressing roller. The yellow area represents the soil beneath the roller, which is subjected to pressure during the rolling process. A is the point where the roller contacts the soil surface, B is the point where the force vector F intersects the soil surface, and C is the point where the force F is applied to the soil at a certain distance X.
Figure 10.
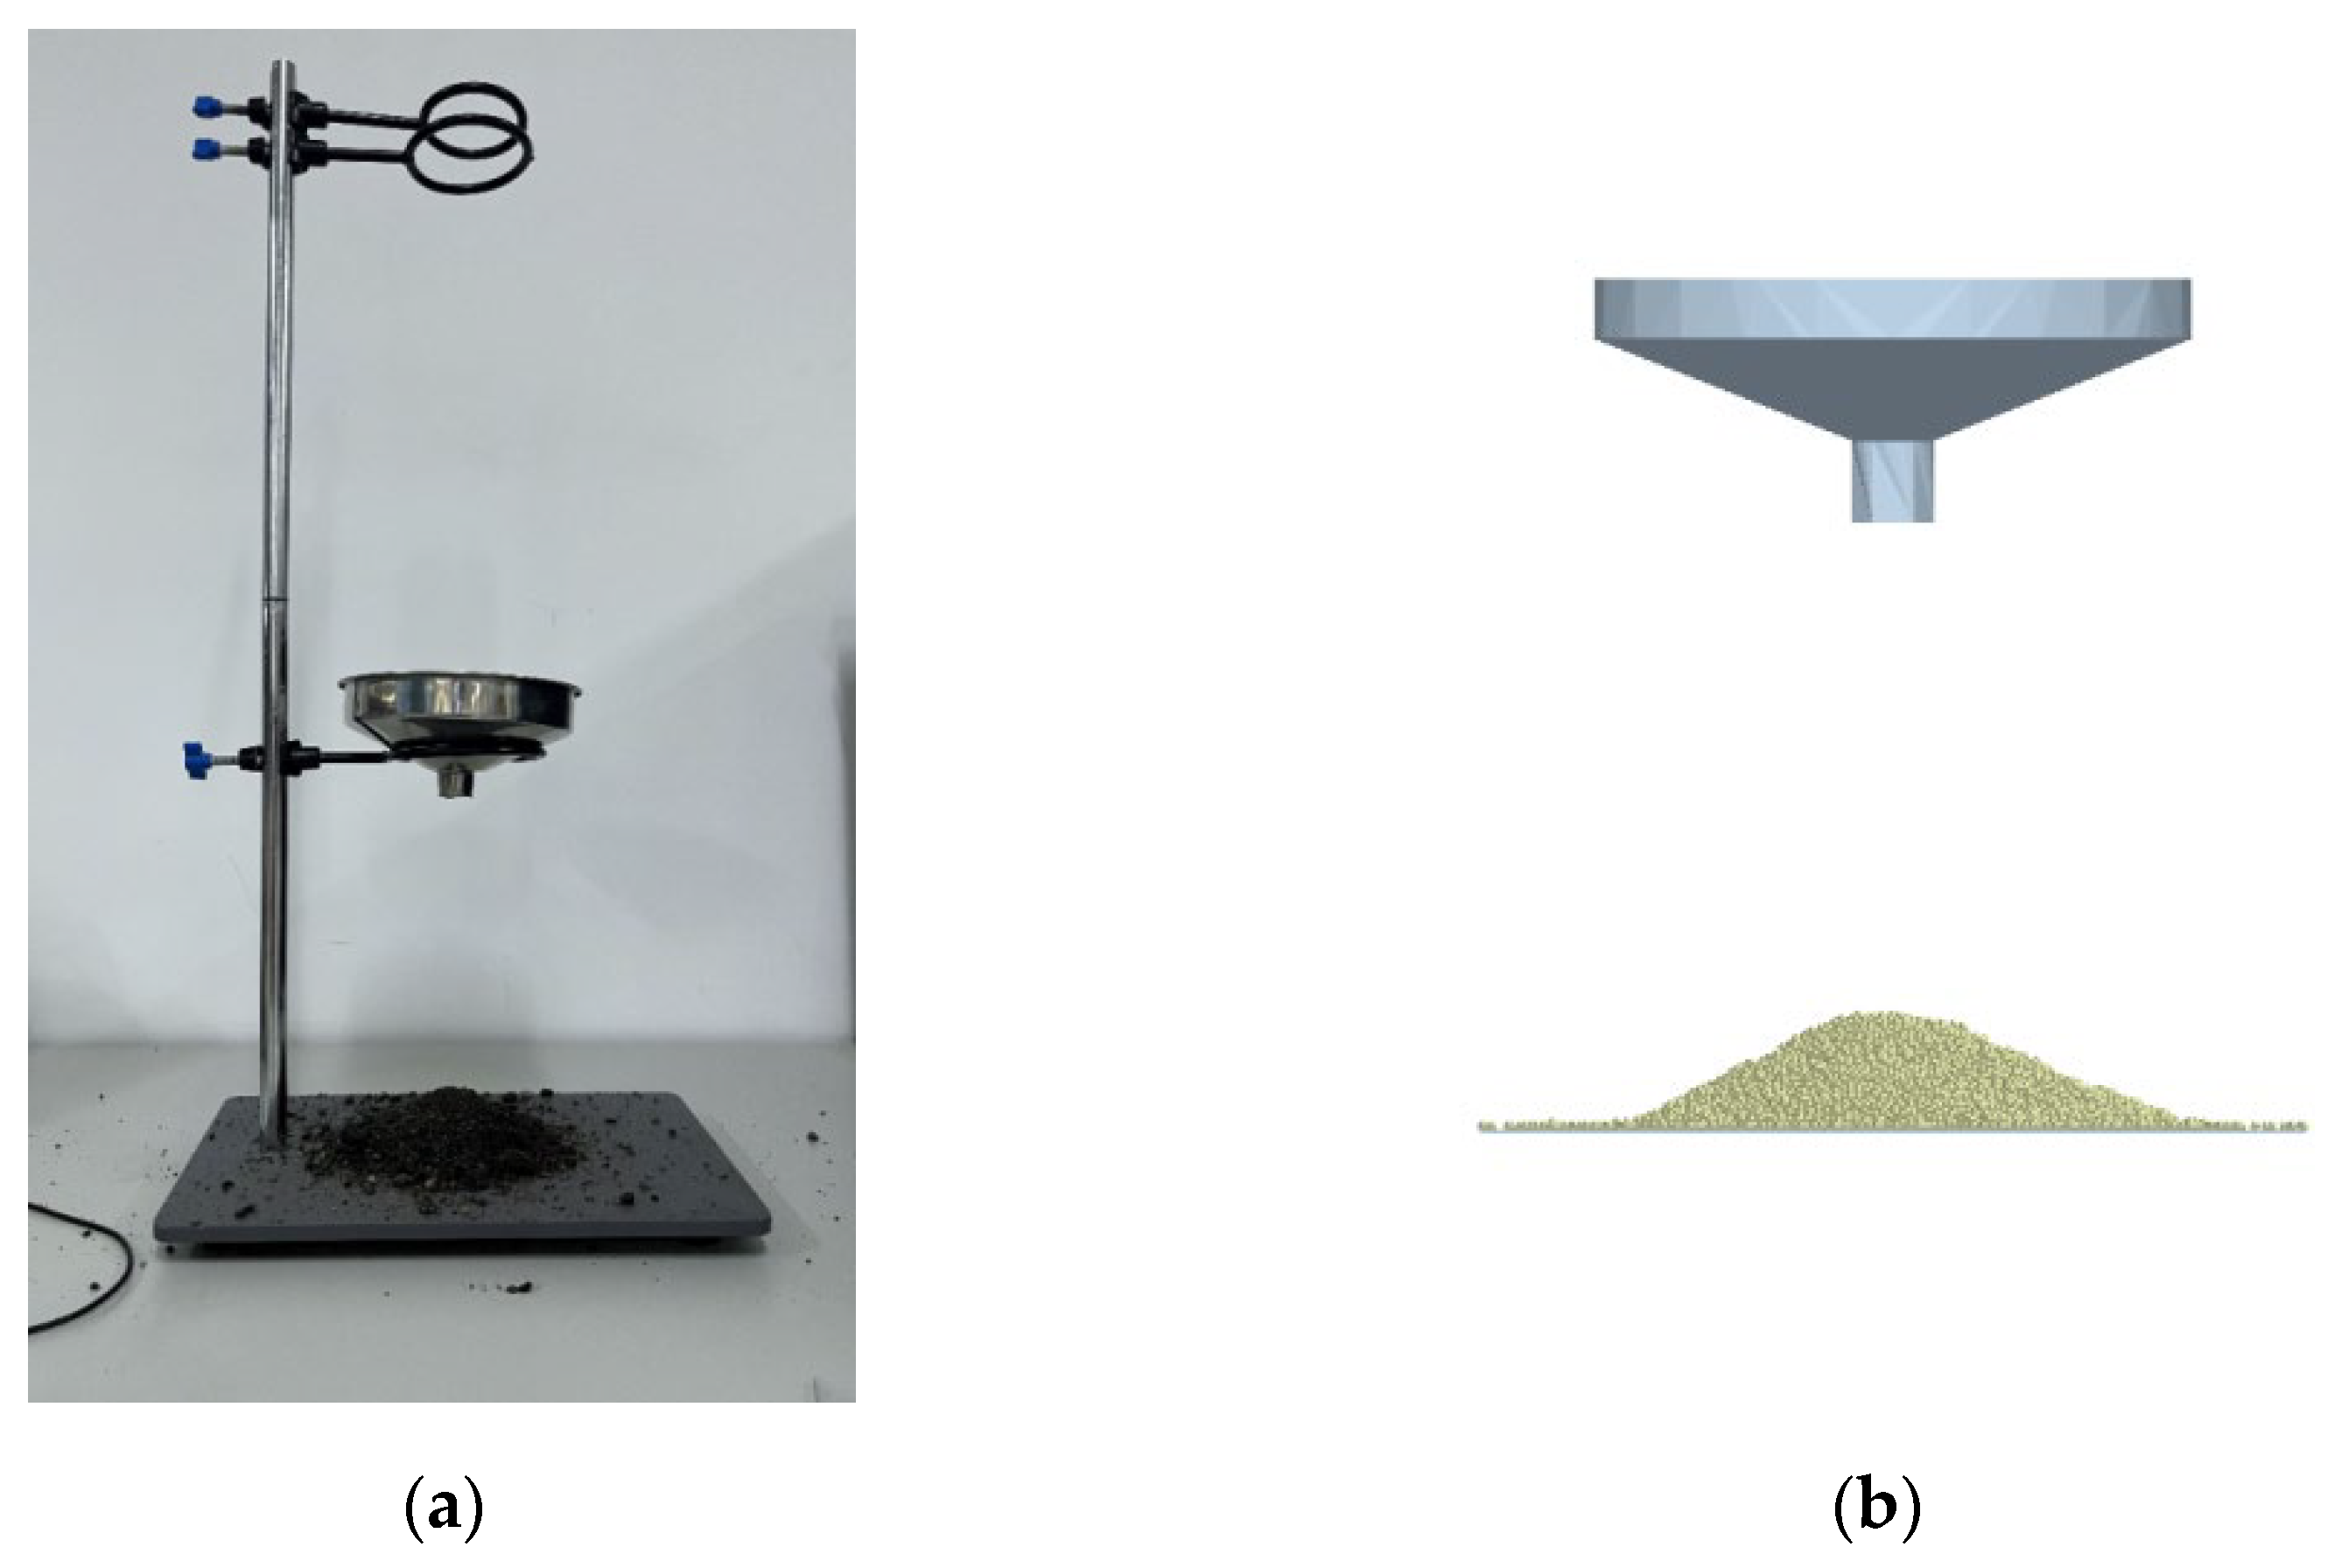
Measurement and DEM simulation of the angle of repose of the yellow sand substrate. (a) Experimental setup for angle of repose measurement; (b) DEM simulation in EDEM reconstructing particle piling and repose angle (average angle of repose = 34.85°).
Figure 10.
Measurement and DEM simulation of the angle of repose of the yellow sand substrate. (a) Experimental setup for angle of repose measurement; (b) DEM simulation in EDEM reconstructing particle piling and repose angle (average angle of repose = 34.85°).
Figure 11.
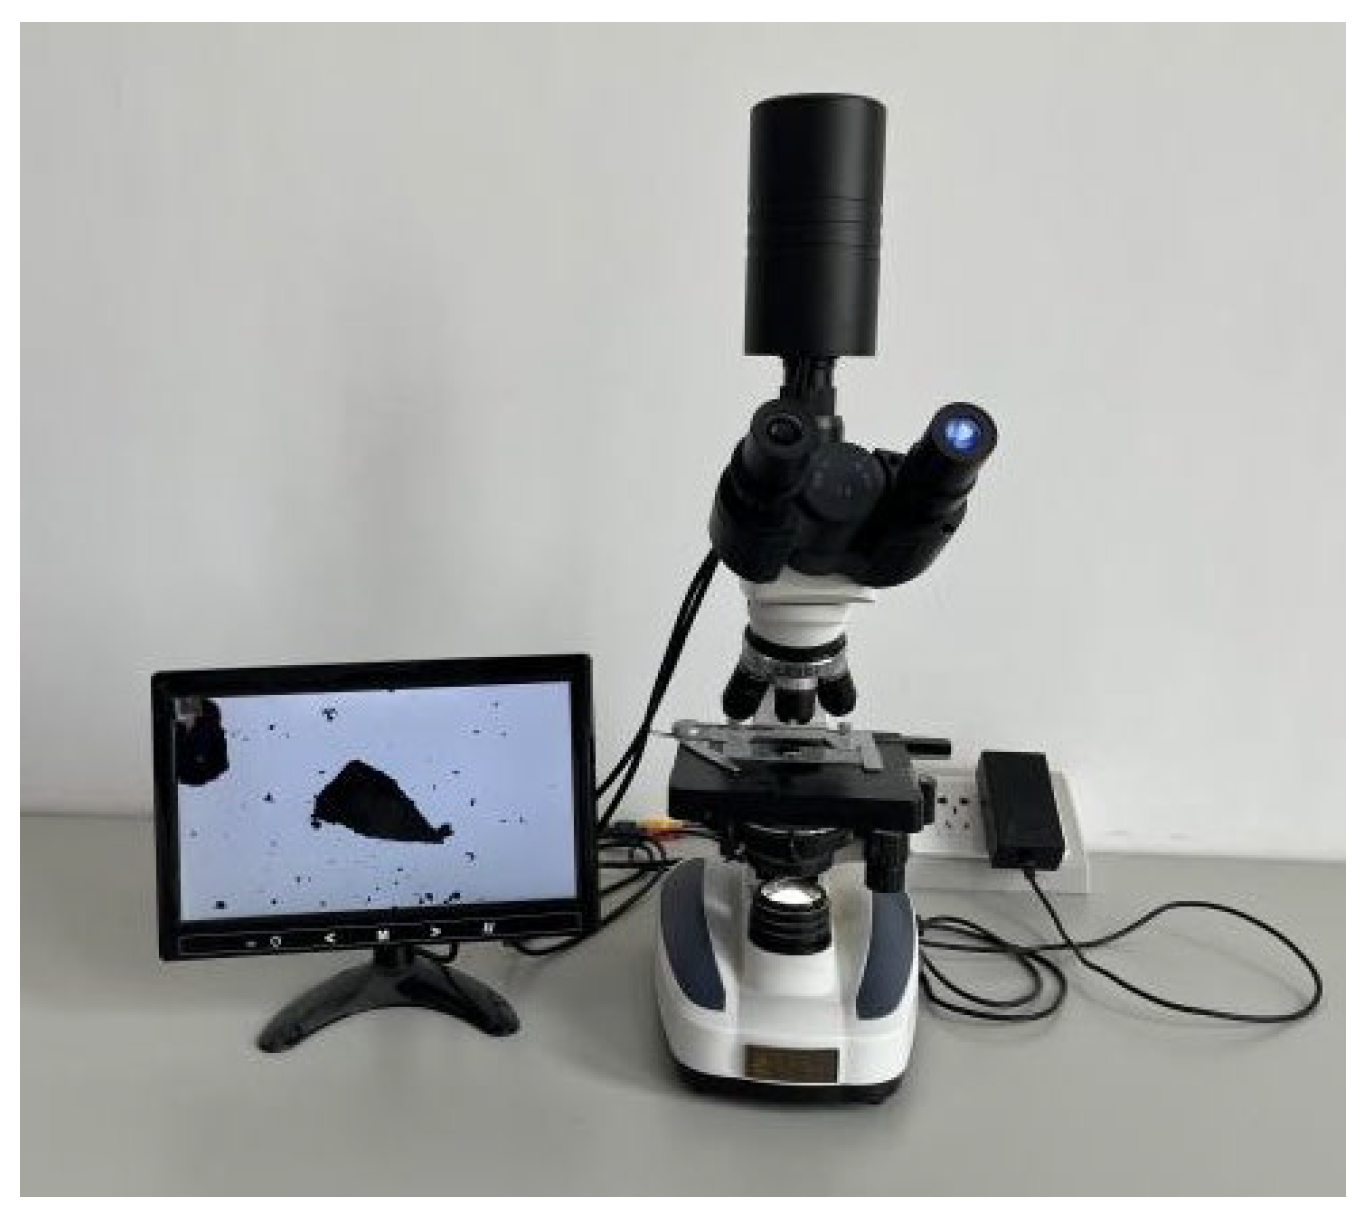
Optical microscope image of the particle size analyzer. The system consists of a digital microscope and an image acquisition module, enabling direct observation and measurement of particle morphology and equivalent size distribution. Image processing was applied to extract parameters such as aspect ratio and sphericity, providing key input for DEM particle modeling and parameter calibration.
Figure 12.
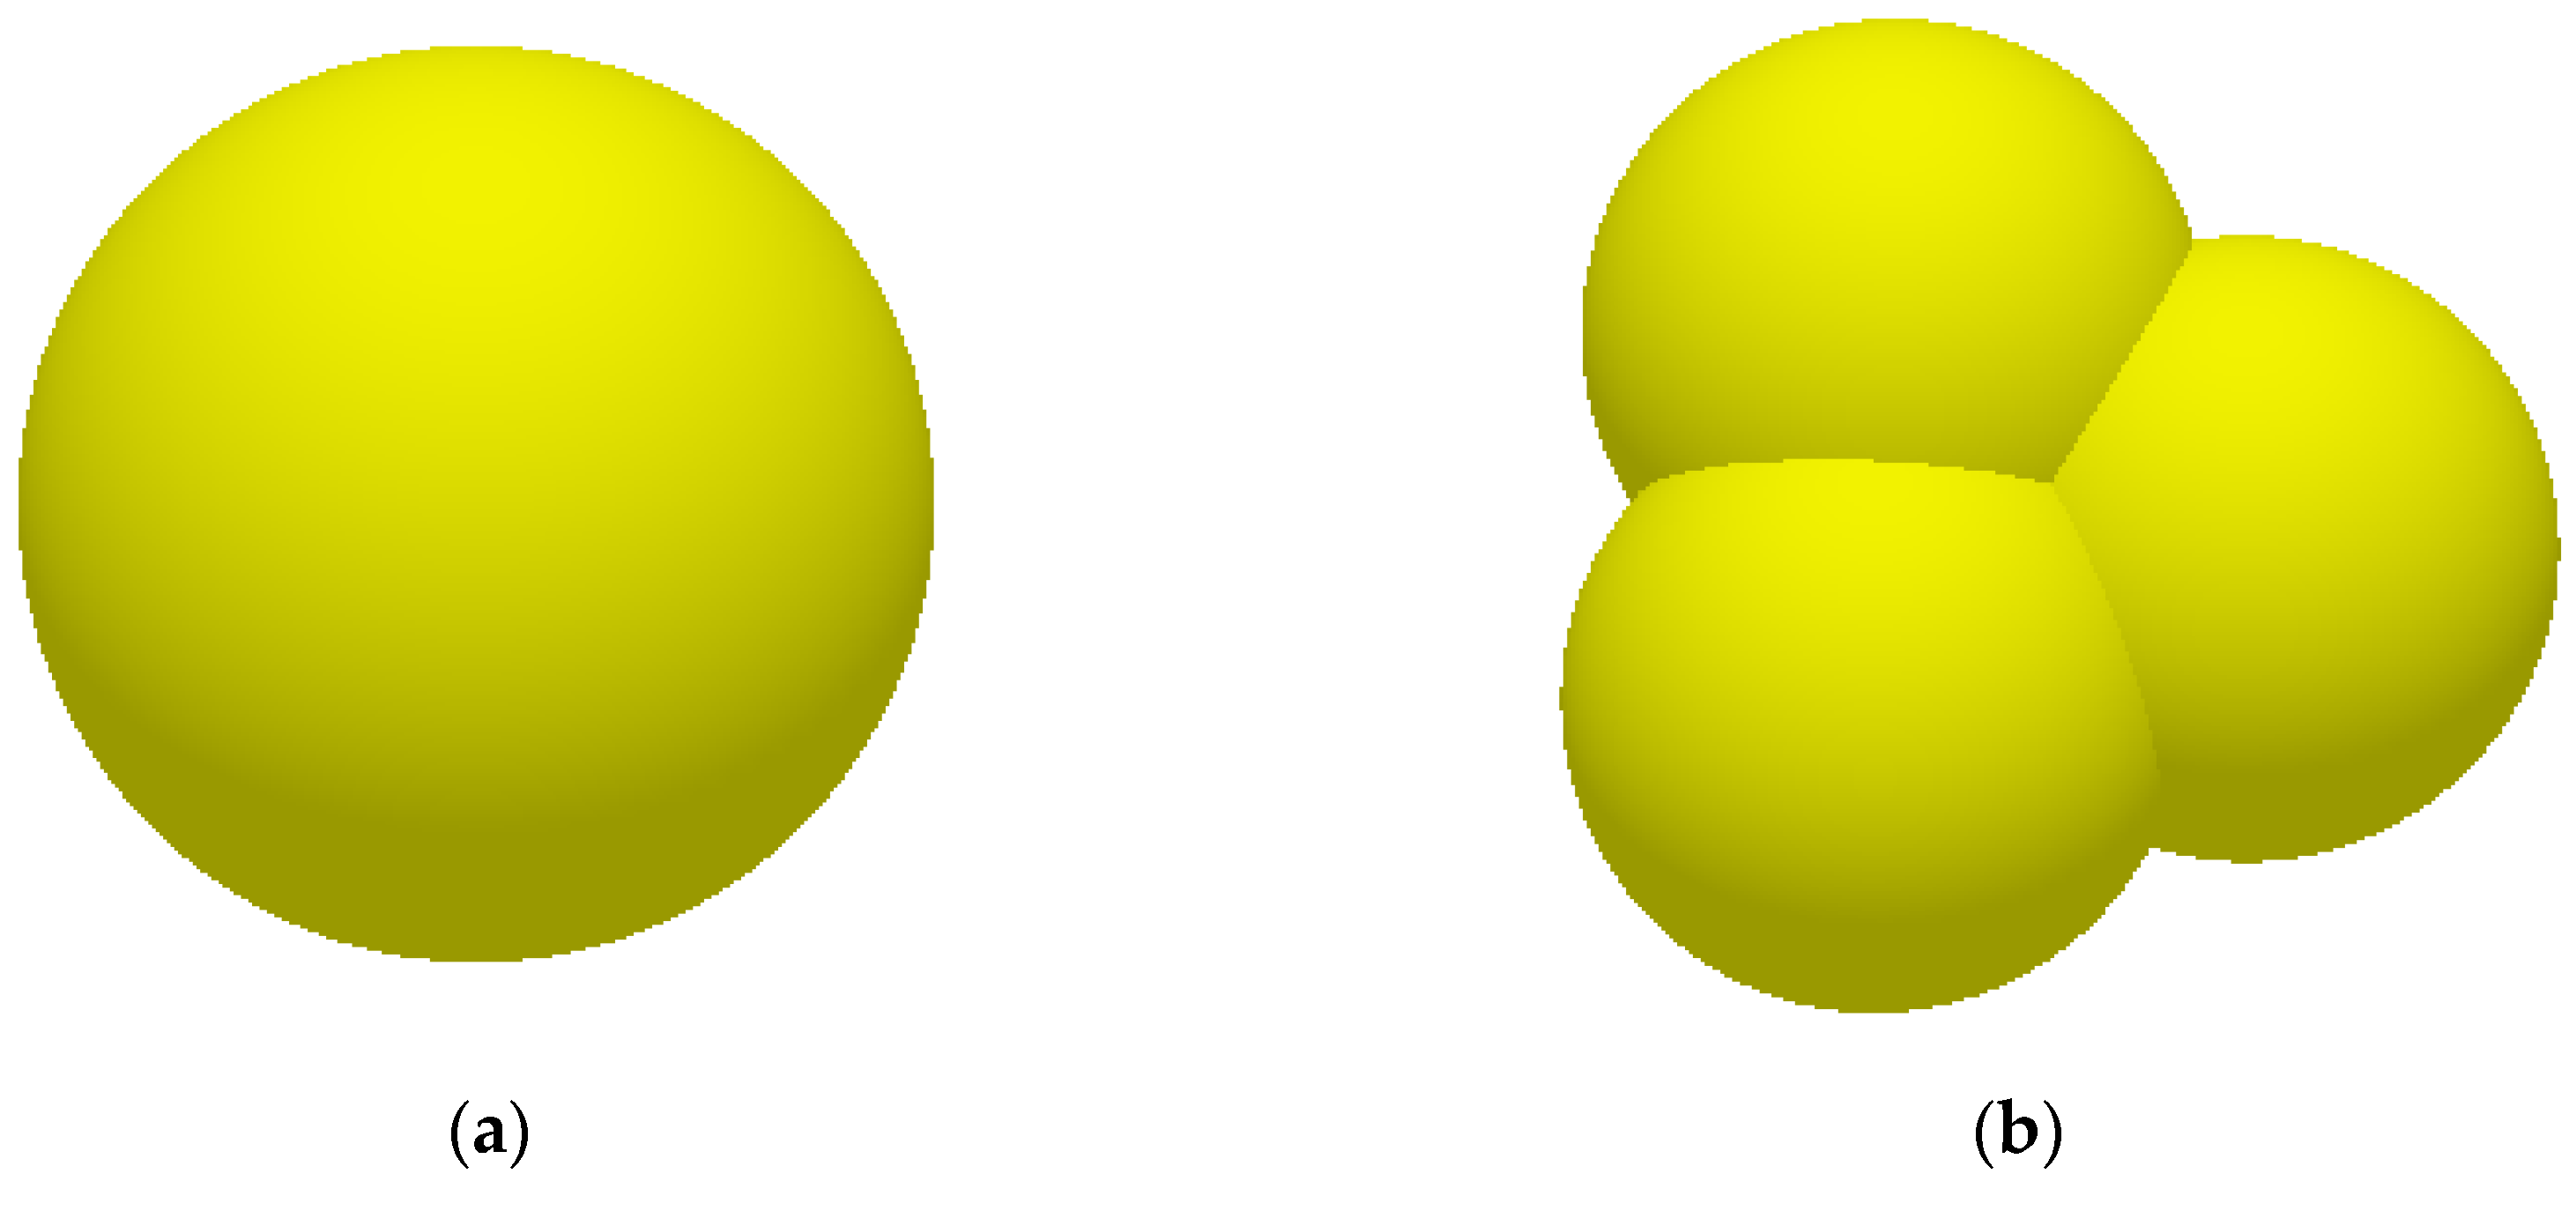
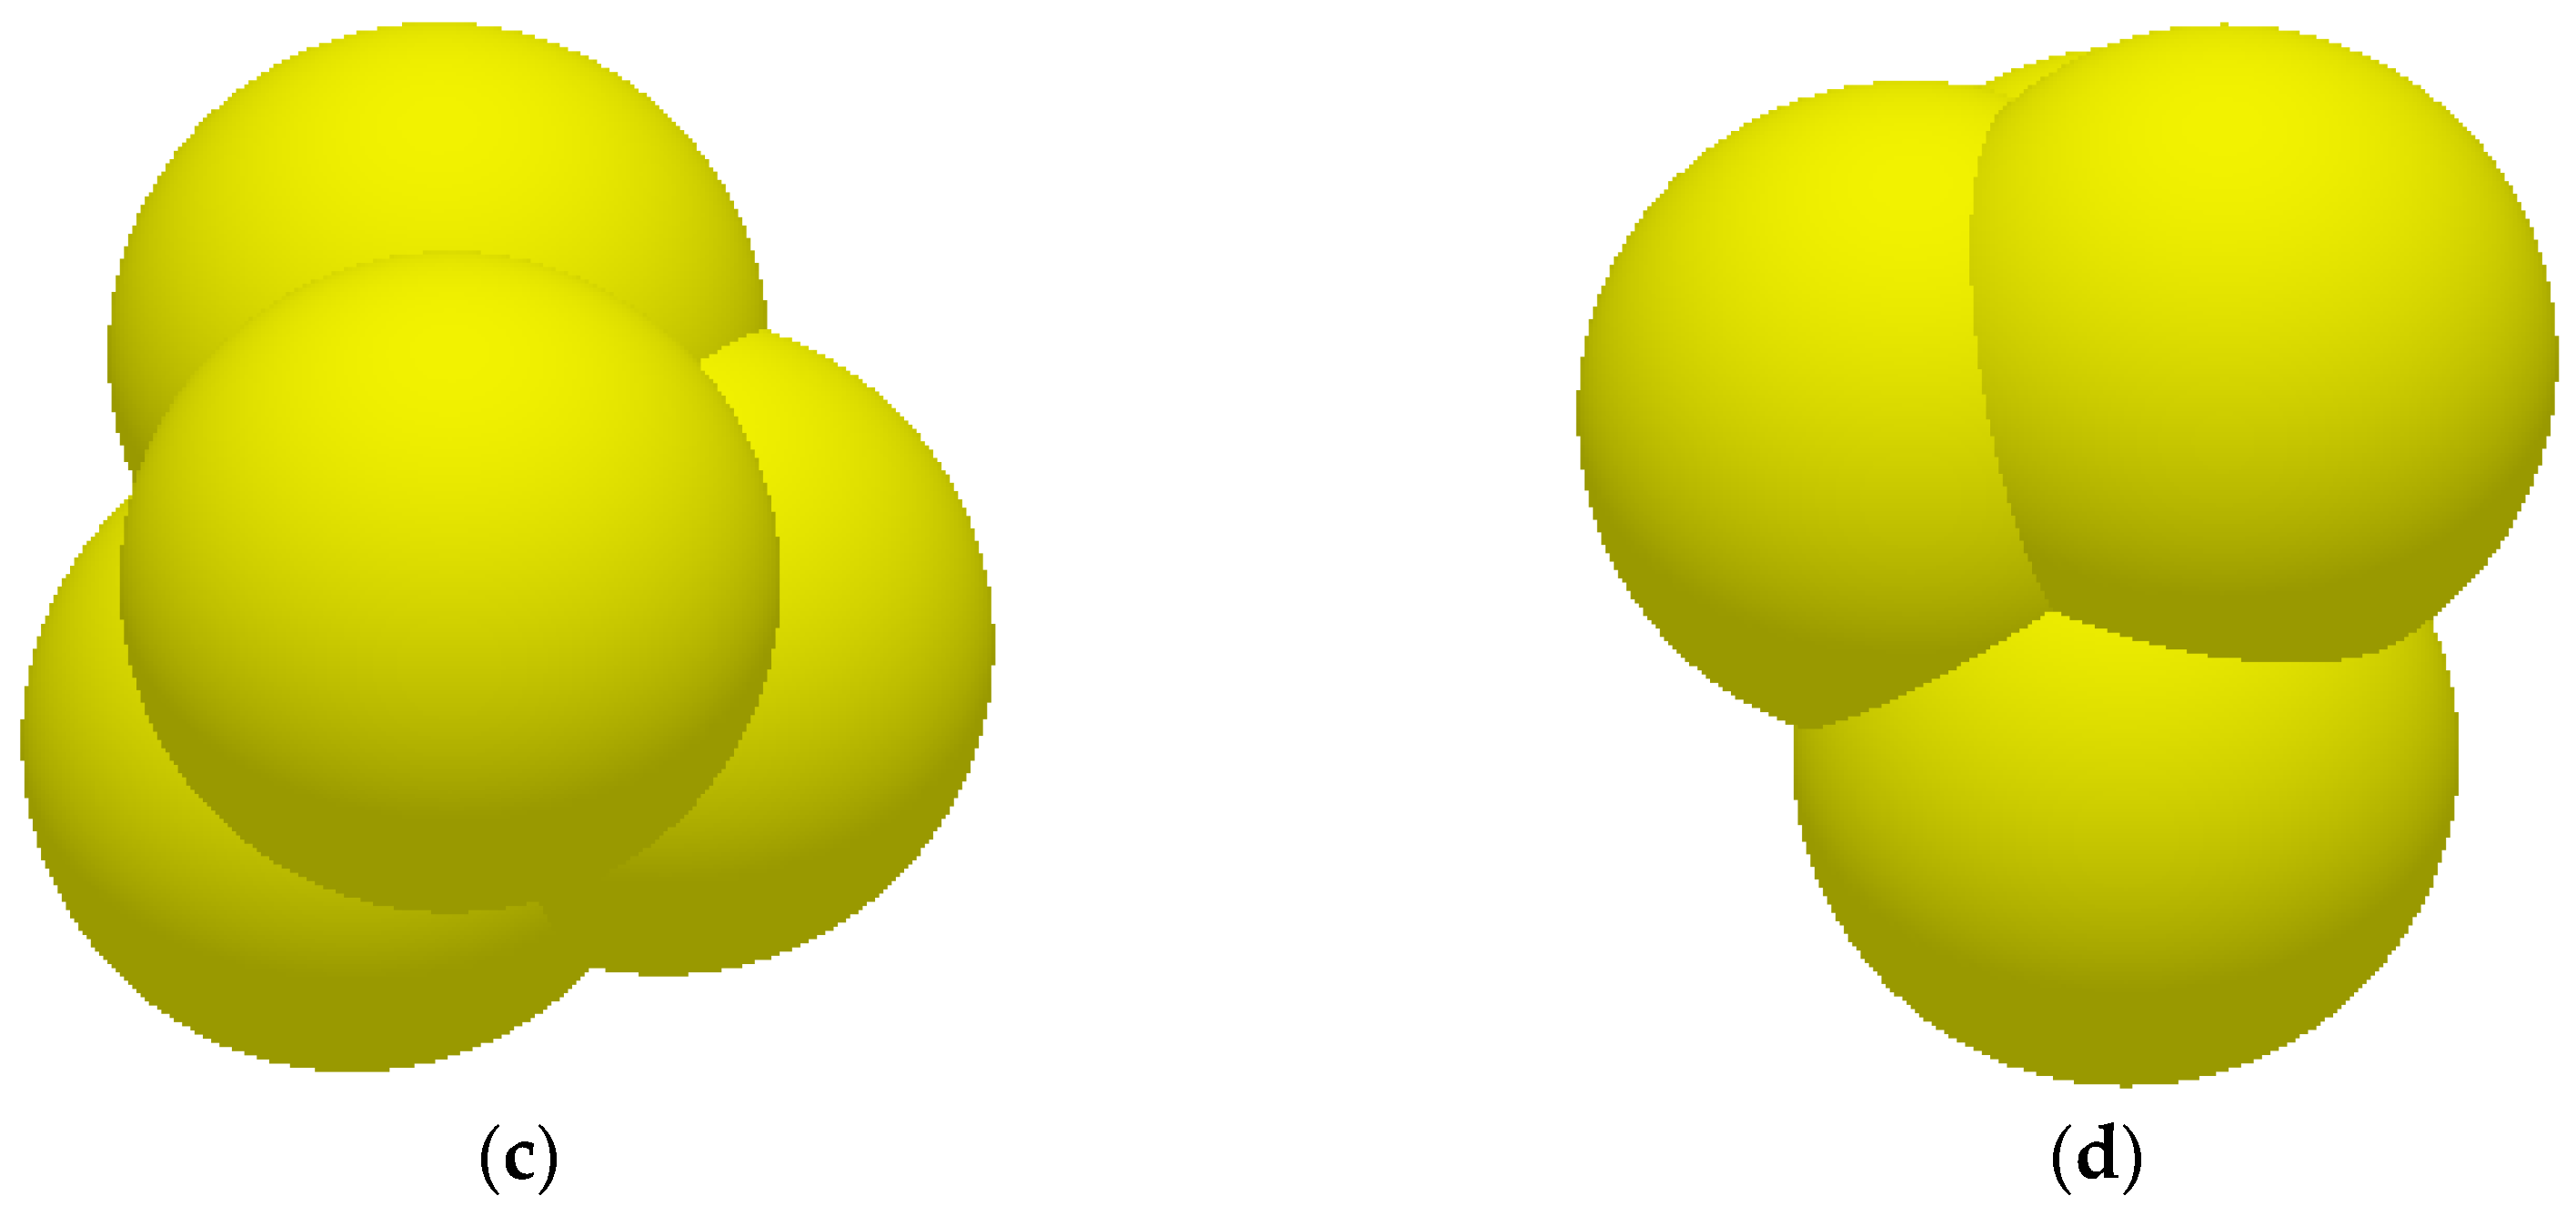
Schematic of the particle model: (a) single-sphere element (radius 5 mm) representing yellow sand particles, balancing computational efficiency and physical accuracy; (b) four-sphere clump model on the X-axis plane, approximating the irregular geometry of slag particles to better capture bulk density and contact behavior; (c) four-sphere clump model on the Y-axis plane, showing the arrangement of the spheres from a different perspective; (d) four-sphere clump model on the Z-axis plane, representing another view of the clump configuration to ensure realistic reproduction of the repose pile.
Figure 13.
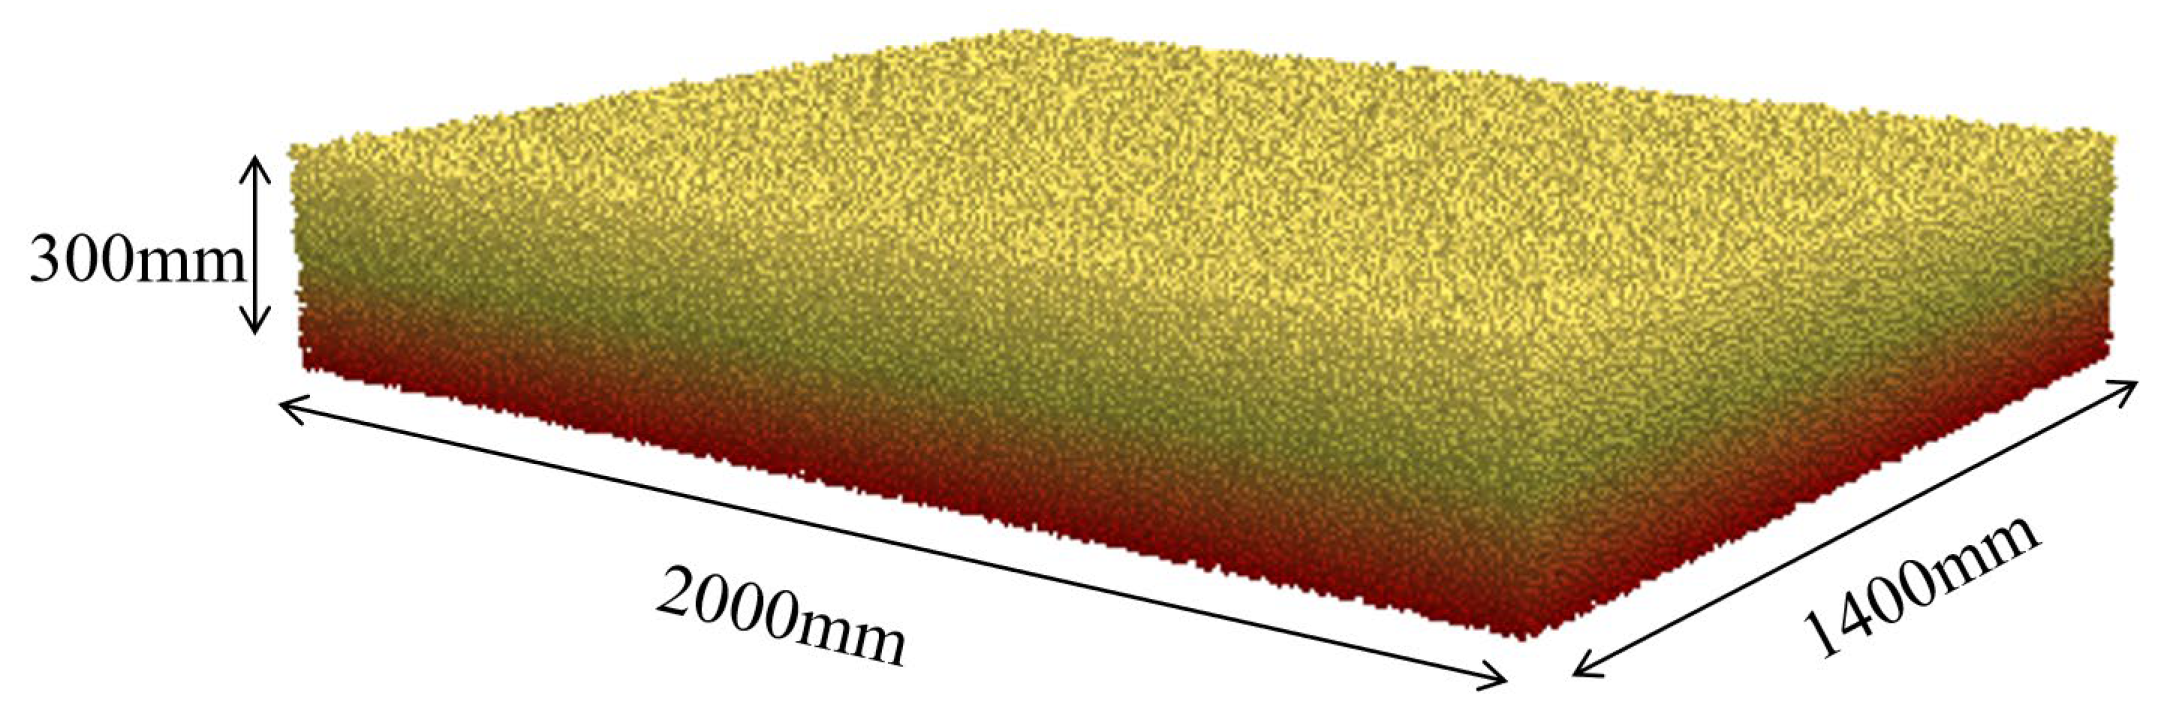
Simulated soil-bin model of the yellow sand substrate used for discrete element analysis.
Figure 13.
Simulated soil-bin model of the yellow sand substrate used for discrete element analysis.
Figure 14.
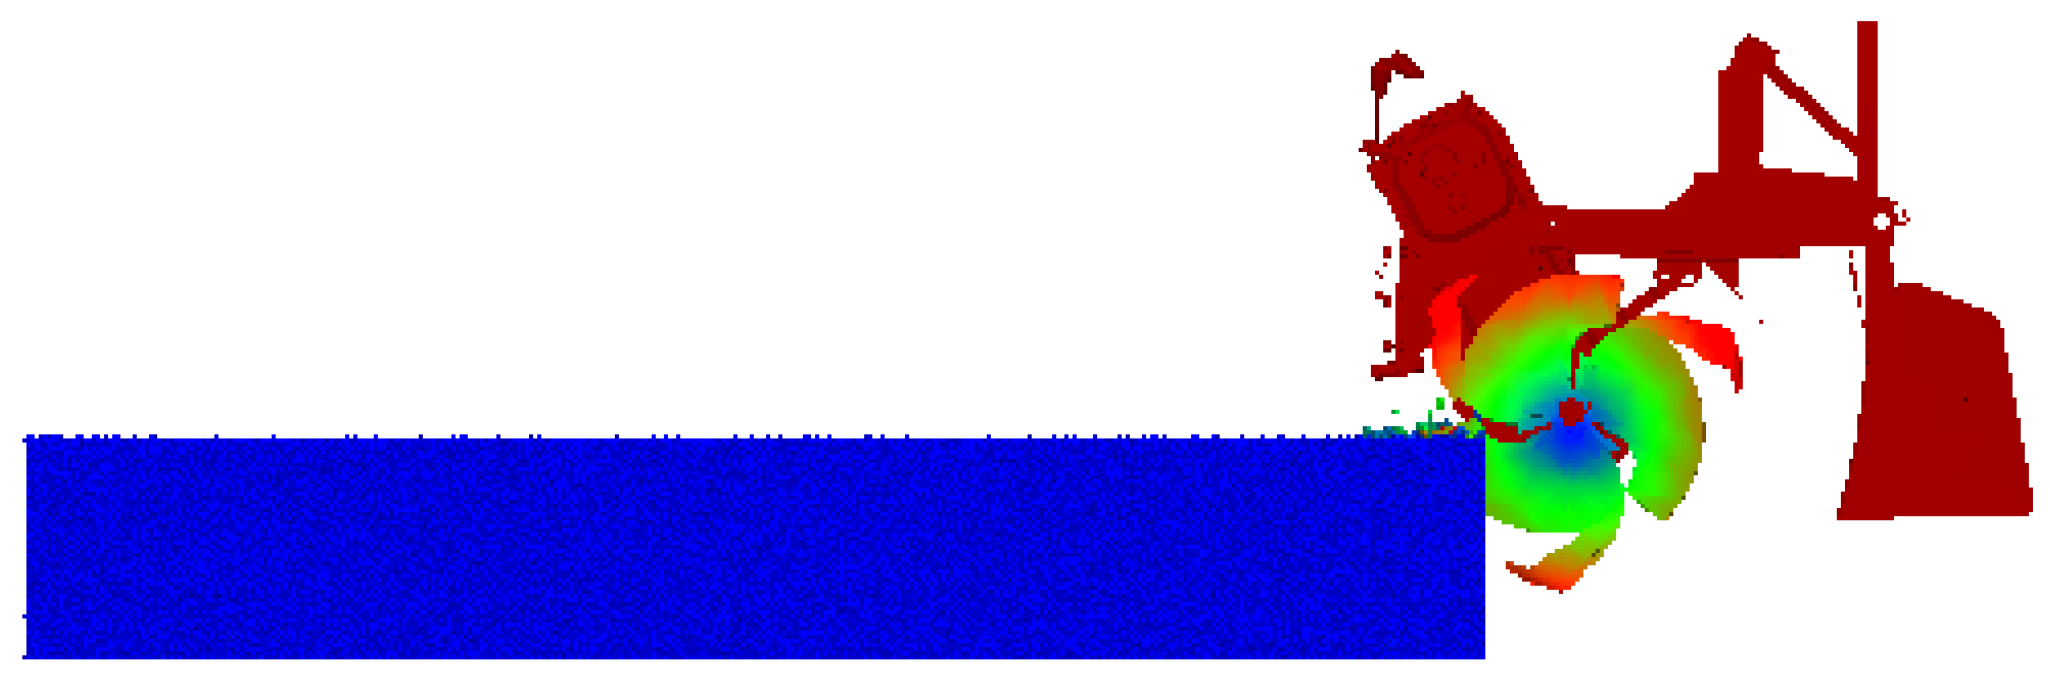
Schemes follow the same formatting. The rotary tiller, ridging blades, gearbox, and shaping plates were imported into the stabilized soil bin in STEP geometry format. This simulation framework enables quantitative evaluation of soil disturbance and ridge morphology under different operating parameters. The colors represent the soil disturbance intensity: blue indicates regions with low disturbance (soil), green and yellow represent moderate disturbance, red indicates areas with high disturbance, and dark red represents the shaping plates of the machine.
Figure 15.
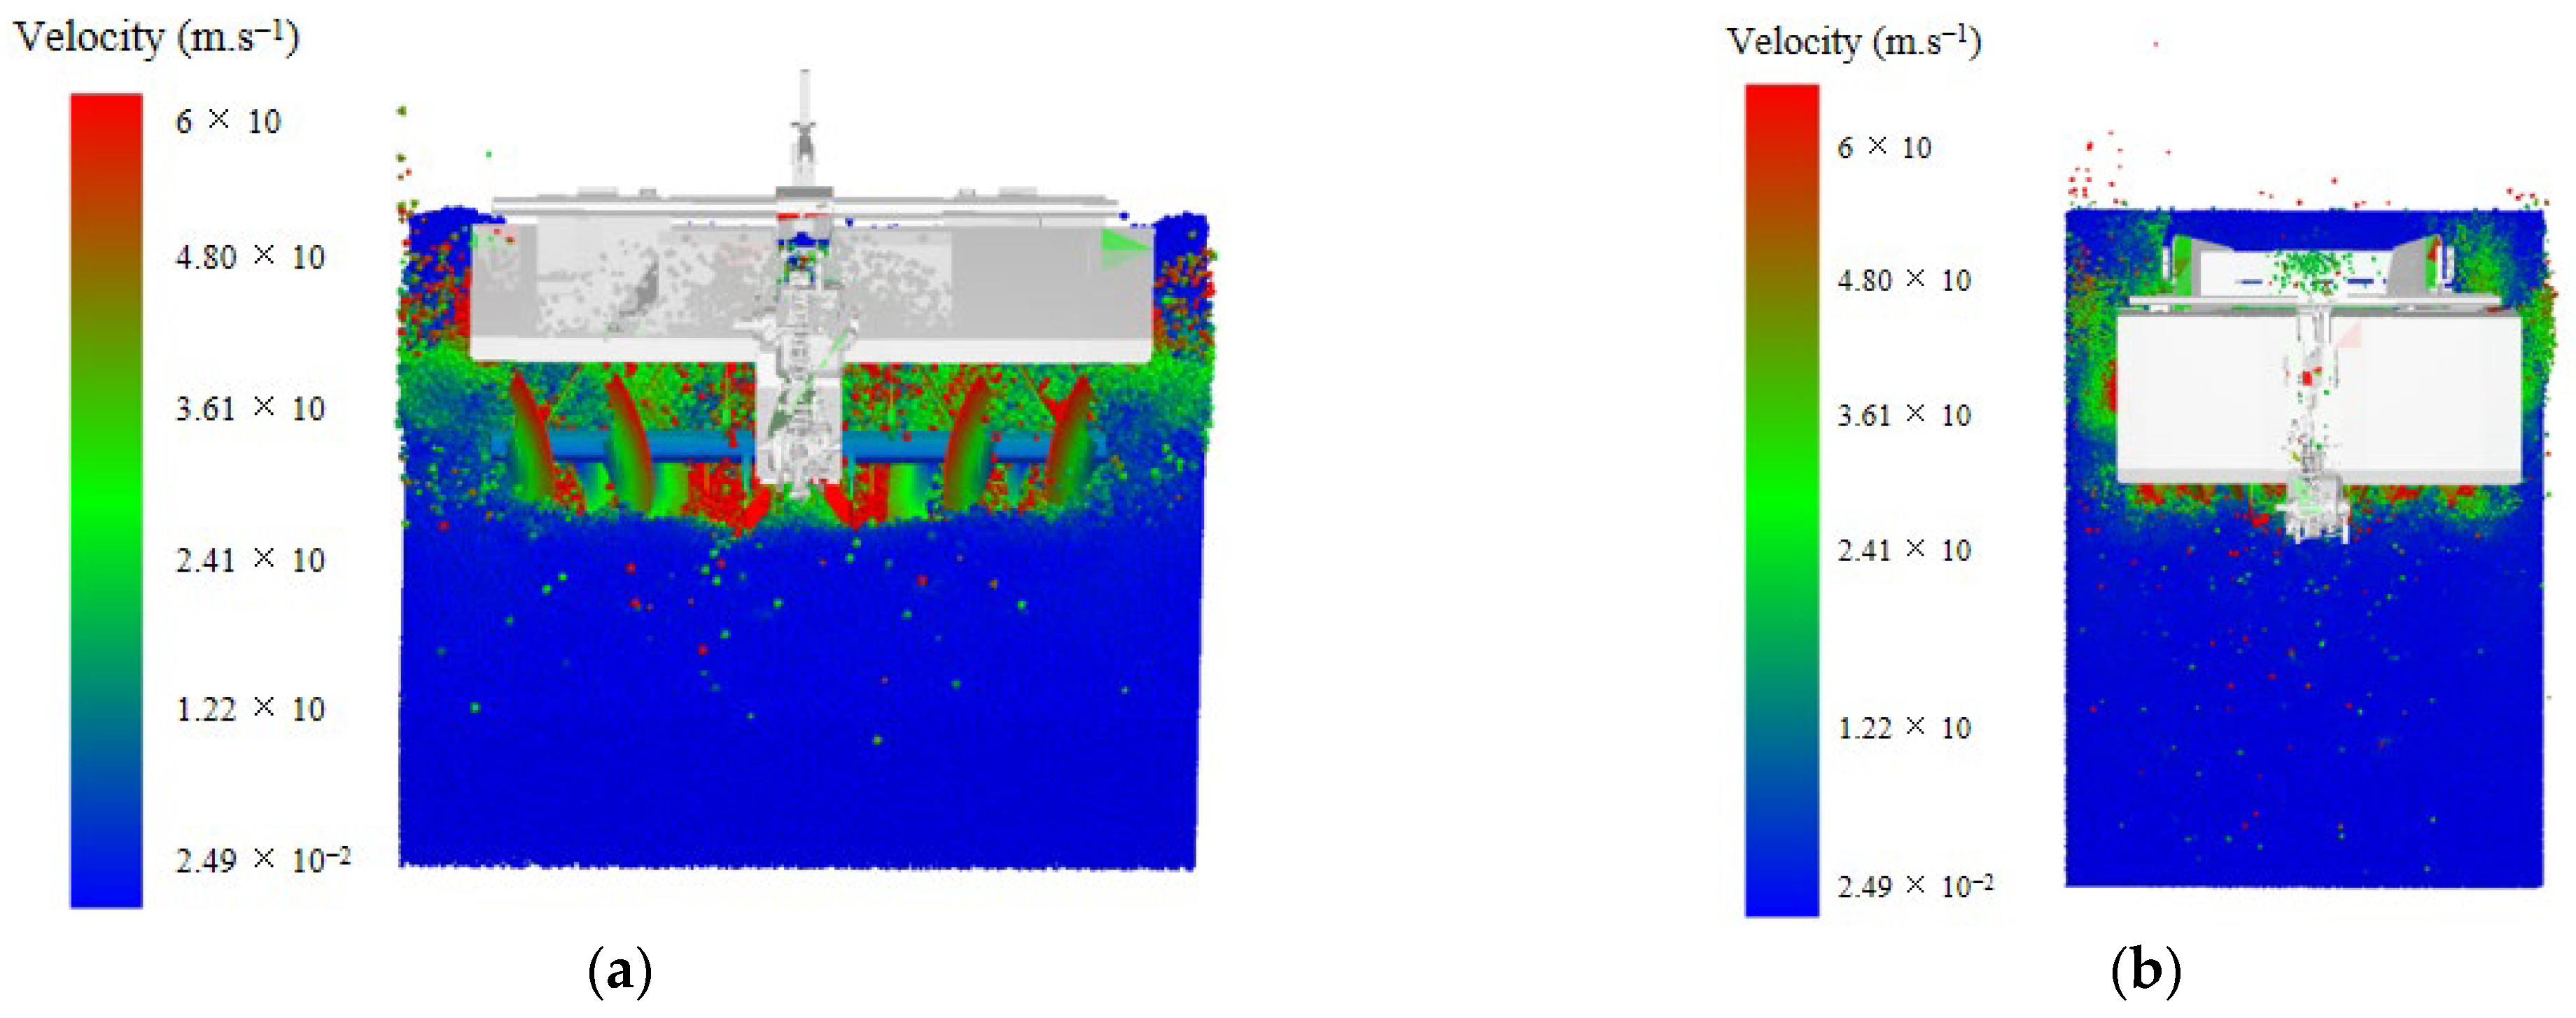
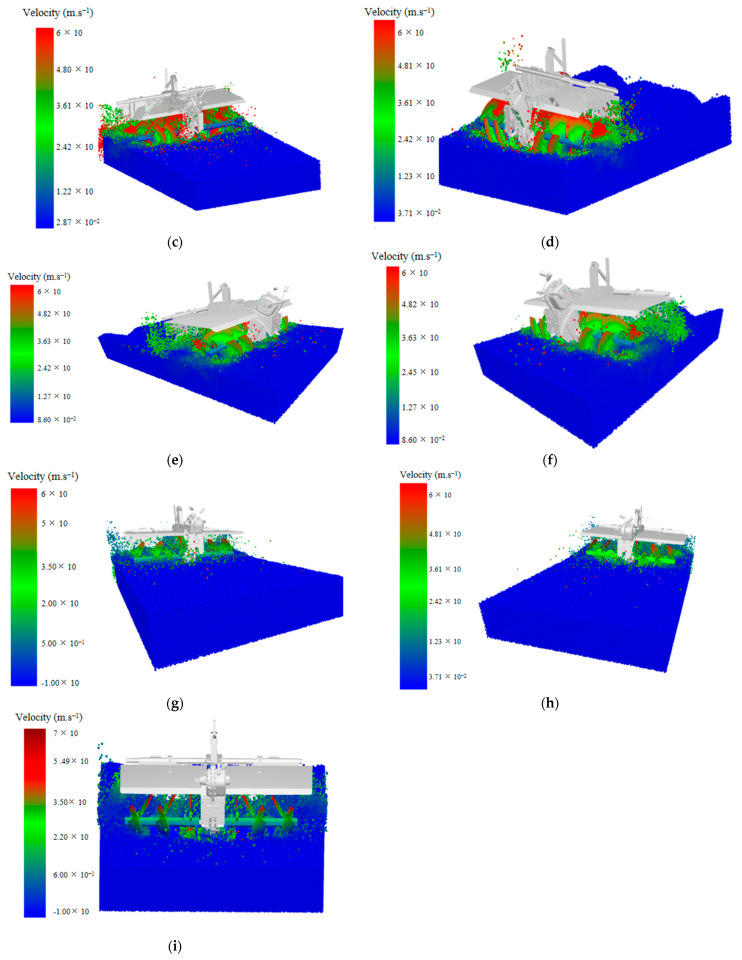
Simulation test design: Simulation of the ridging–mulching machine under different operating conditions. The simulations illustrate the influence of various operating parameters on soil particle dynamics and ridge stability. Soil particle velocity. Notes: (a) forward speed v = 0.6 m·s−1, blade shaft speed n = 240 rpm, tillage depth 150 mm; (b) v = 0.6 m·s−1, n = 250 rpm, tillage depth 150 mm; (c) v = 0.6 m·s−1, n = 260 rpm, tillage depth 150 mm; (d) v = 0.8 m·s−1, n = 240 rpm, tillage depth 150 mm; (e) v = 0.8 m·s−1, n = 250 rpm, tillage depth 150 mm; (f) v = 0.8 m·s−1, n = 260 rpm, tillage depth 150 mm; (g) v = 1 m·s−1, n = 240 rpm, tillage depth 150 mm; (h) v = 1 m·s−1, n = 250 rpm, tillage depth 150 mm; (i) v = 1 m·s−1, n = 260 rpm, tillage depth 150 mm.
Figure 16.
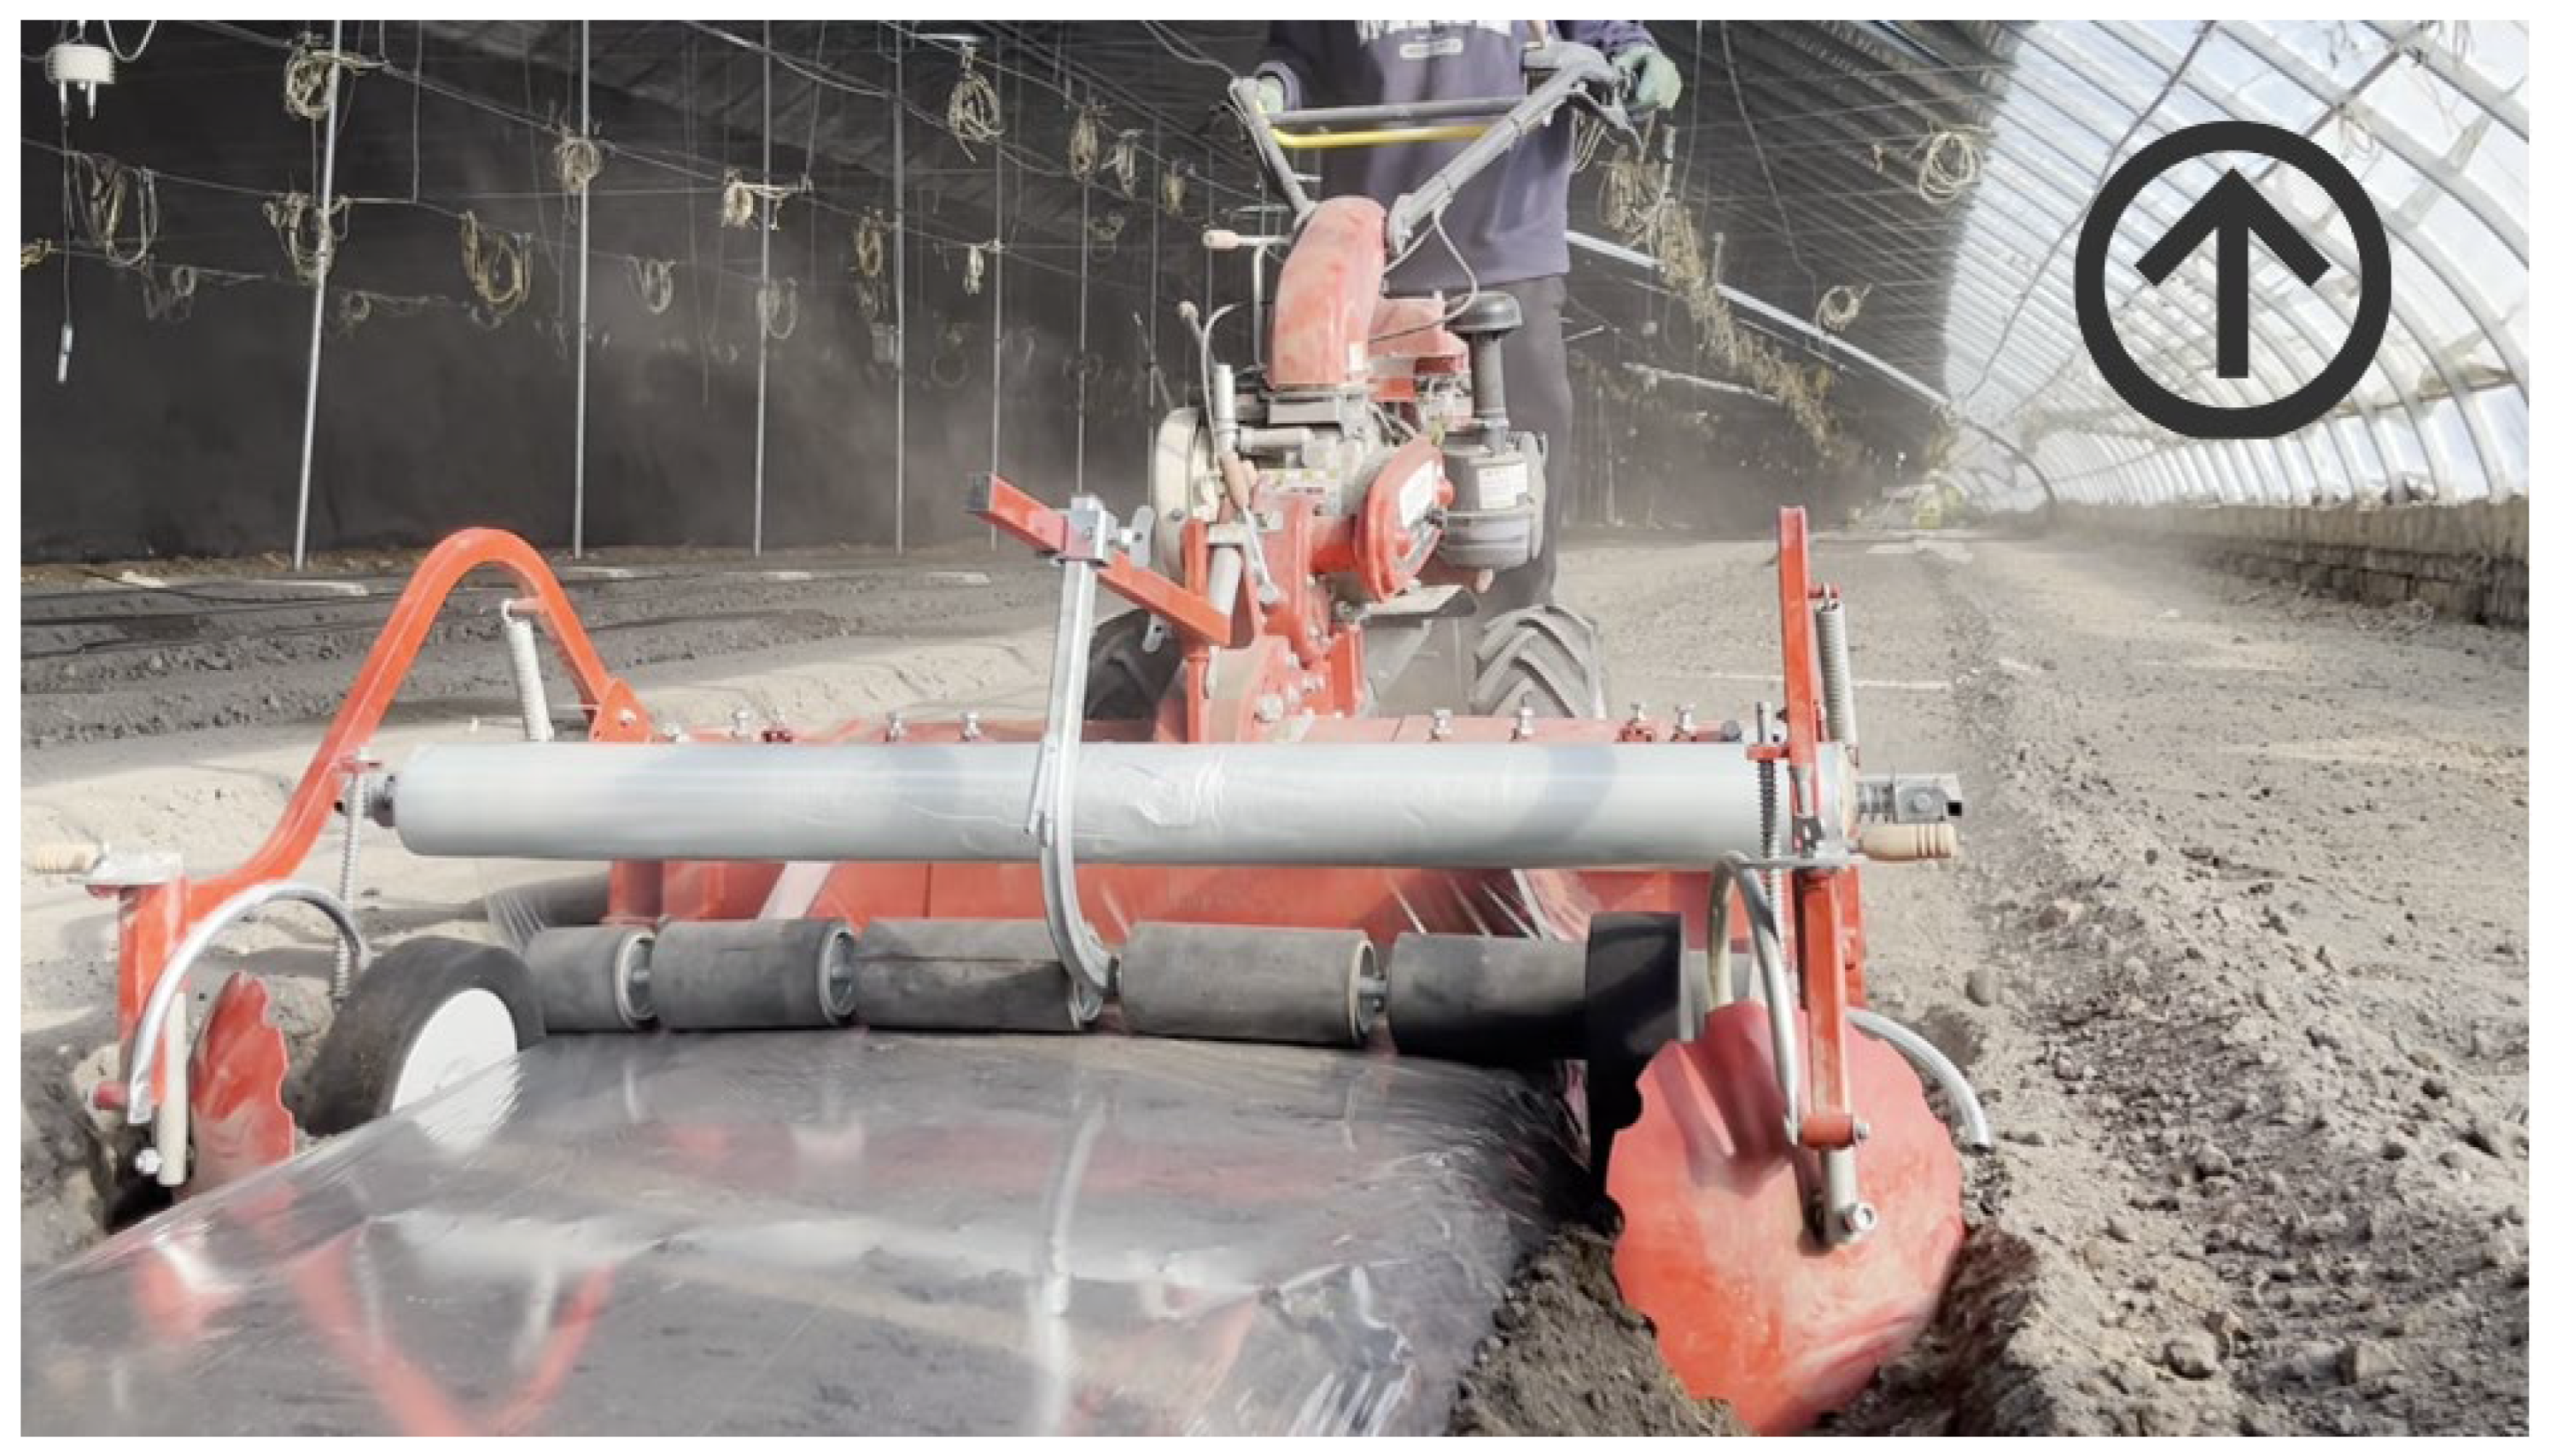
Field testing of the ridge–mulching machine. The arrow indicates the forward direction of the machine.
Figure 16.
Field testing of the ridge–mulching machine. The arrow indicates the forward direction of the machine.
Figure 17.
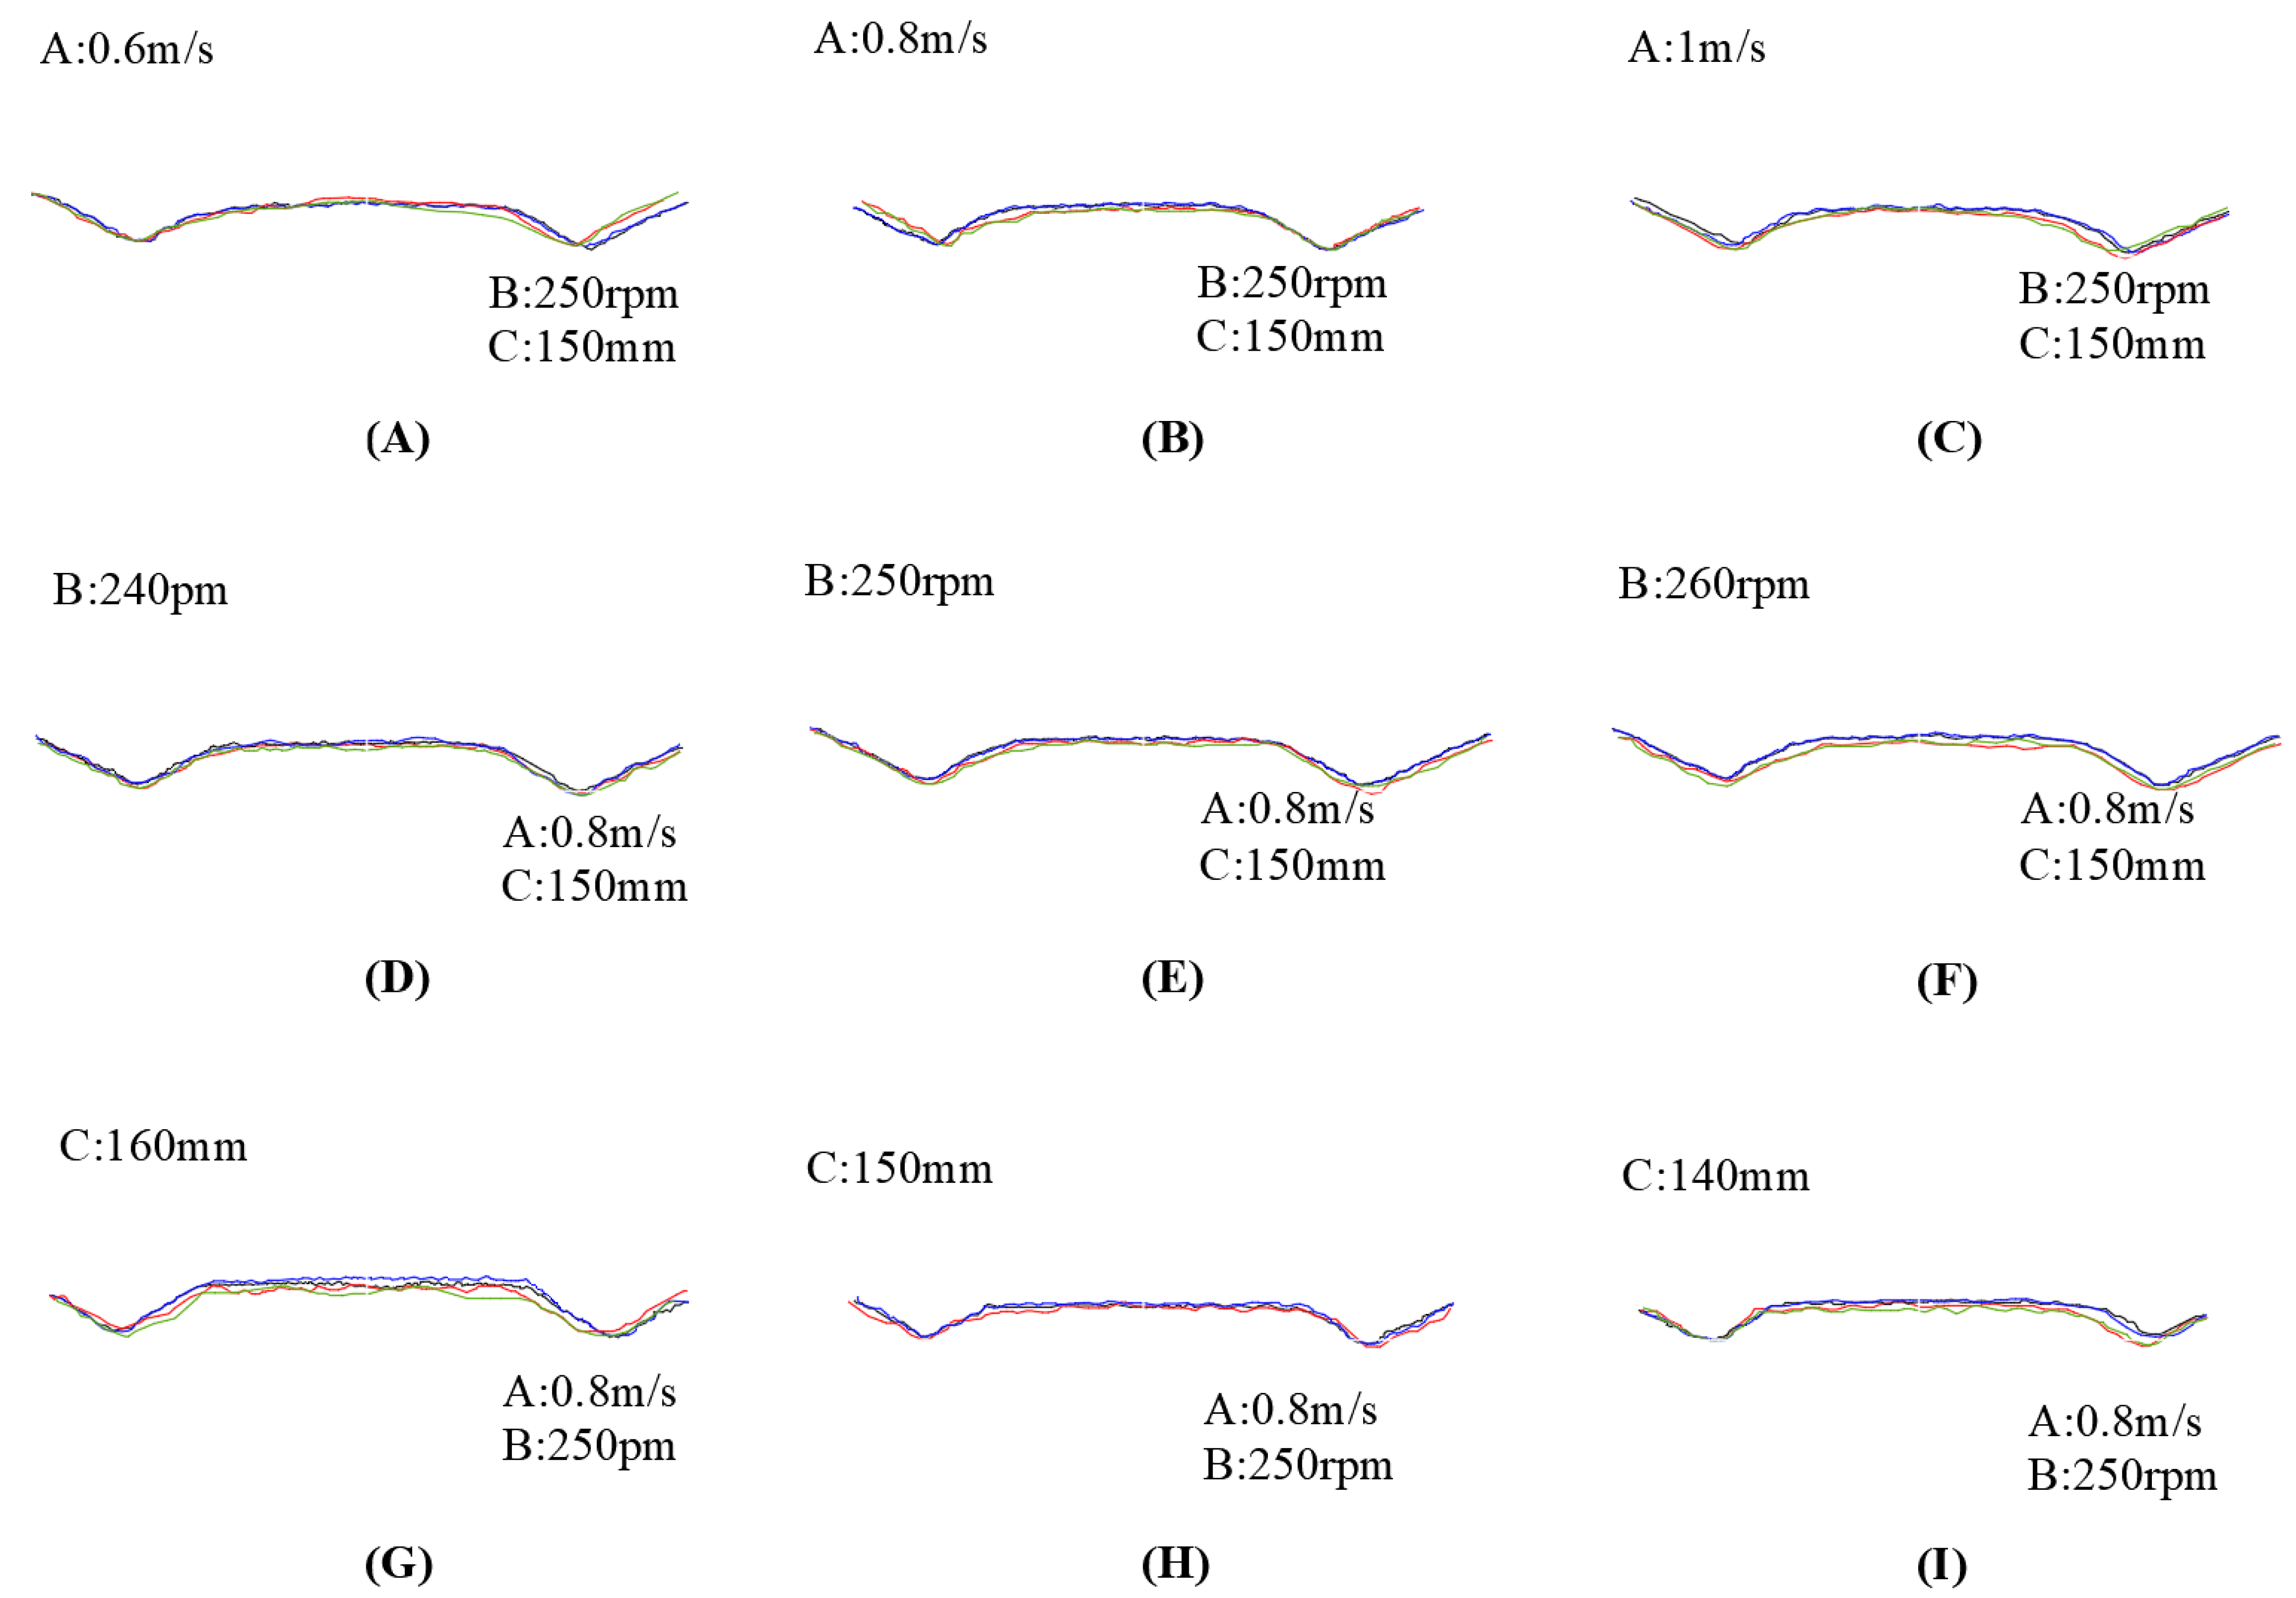
Effects of experimental factors on ridge profile and height. A: Effect of forward speed on ridge profile and height; B: Effect of blade shaft speed on ridge profile and height; C: Effect of ditching depth on ridge height. Black line—ridge profile at the center cross-section for the variable-pitch helical blade shaft; Blue line—ridge profile at 0.5 m from the center cross-section for the variable-pitch helical blade shaft; Red line—ridge profile at the center cross-section for the constant-pitch blade shaft; Green line—ridge profile at 0.5 m from the center cross-section for the constant-pitch blade shaft.
Figure 18.
Effect of operating parameters on ridge height stability coefficient and ridge height uniformity coefficient: (a) Effect of forward speed; (b) Effect of rotary shaft speed.
Figure 18.
Effect of operating parameters on ridge height stability coefficient and ridge height uniformity coefficient: (a) Effect of forward speed; (b) Effect of rotary shaft speed.
Figure 19.
Traction Force Comparison Between the Designed and Conventional Machines Under Different Operational Conditions. (a) Effect of Forward Speed on Traction Force of Designed and Conventional Machines, with Tillage Depth Fixed at 150 mm. (b) Effect of Tillage Depth on Traction Force of Designed and Conventional Machines, with Forward Speed Fixed at 0.8 m/s.
Figure 20.
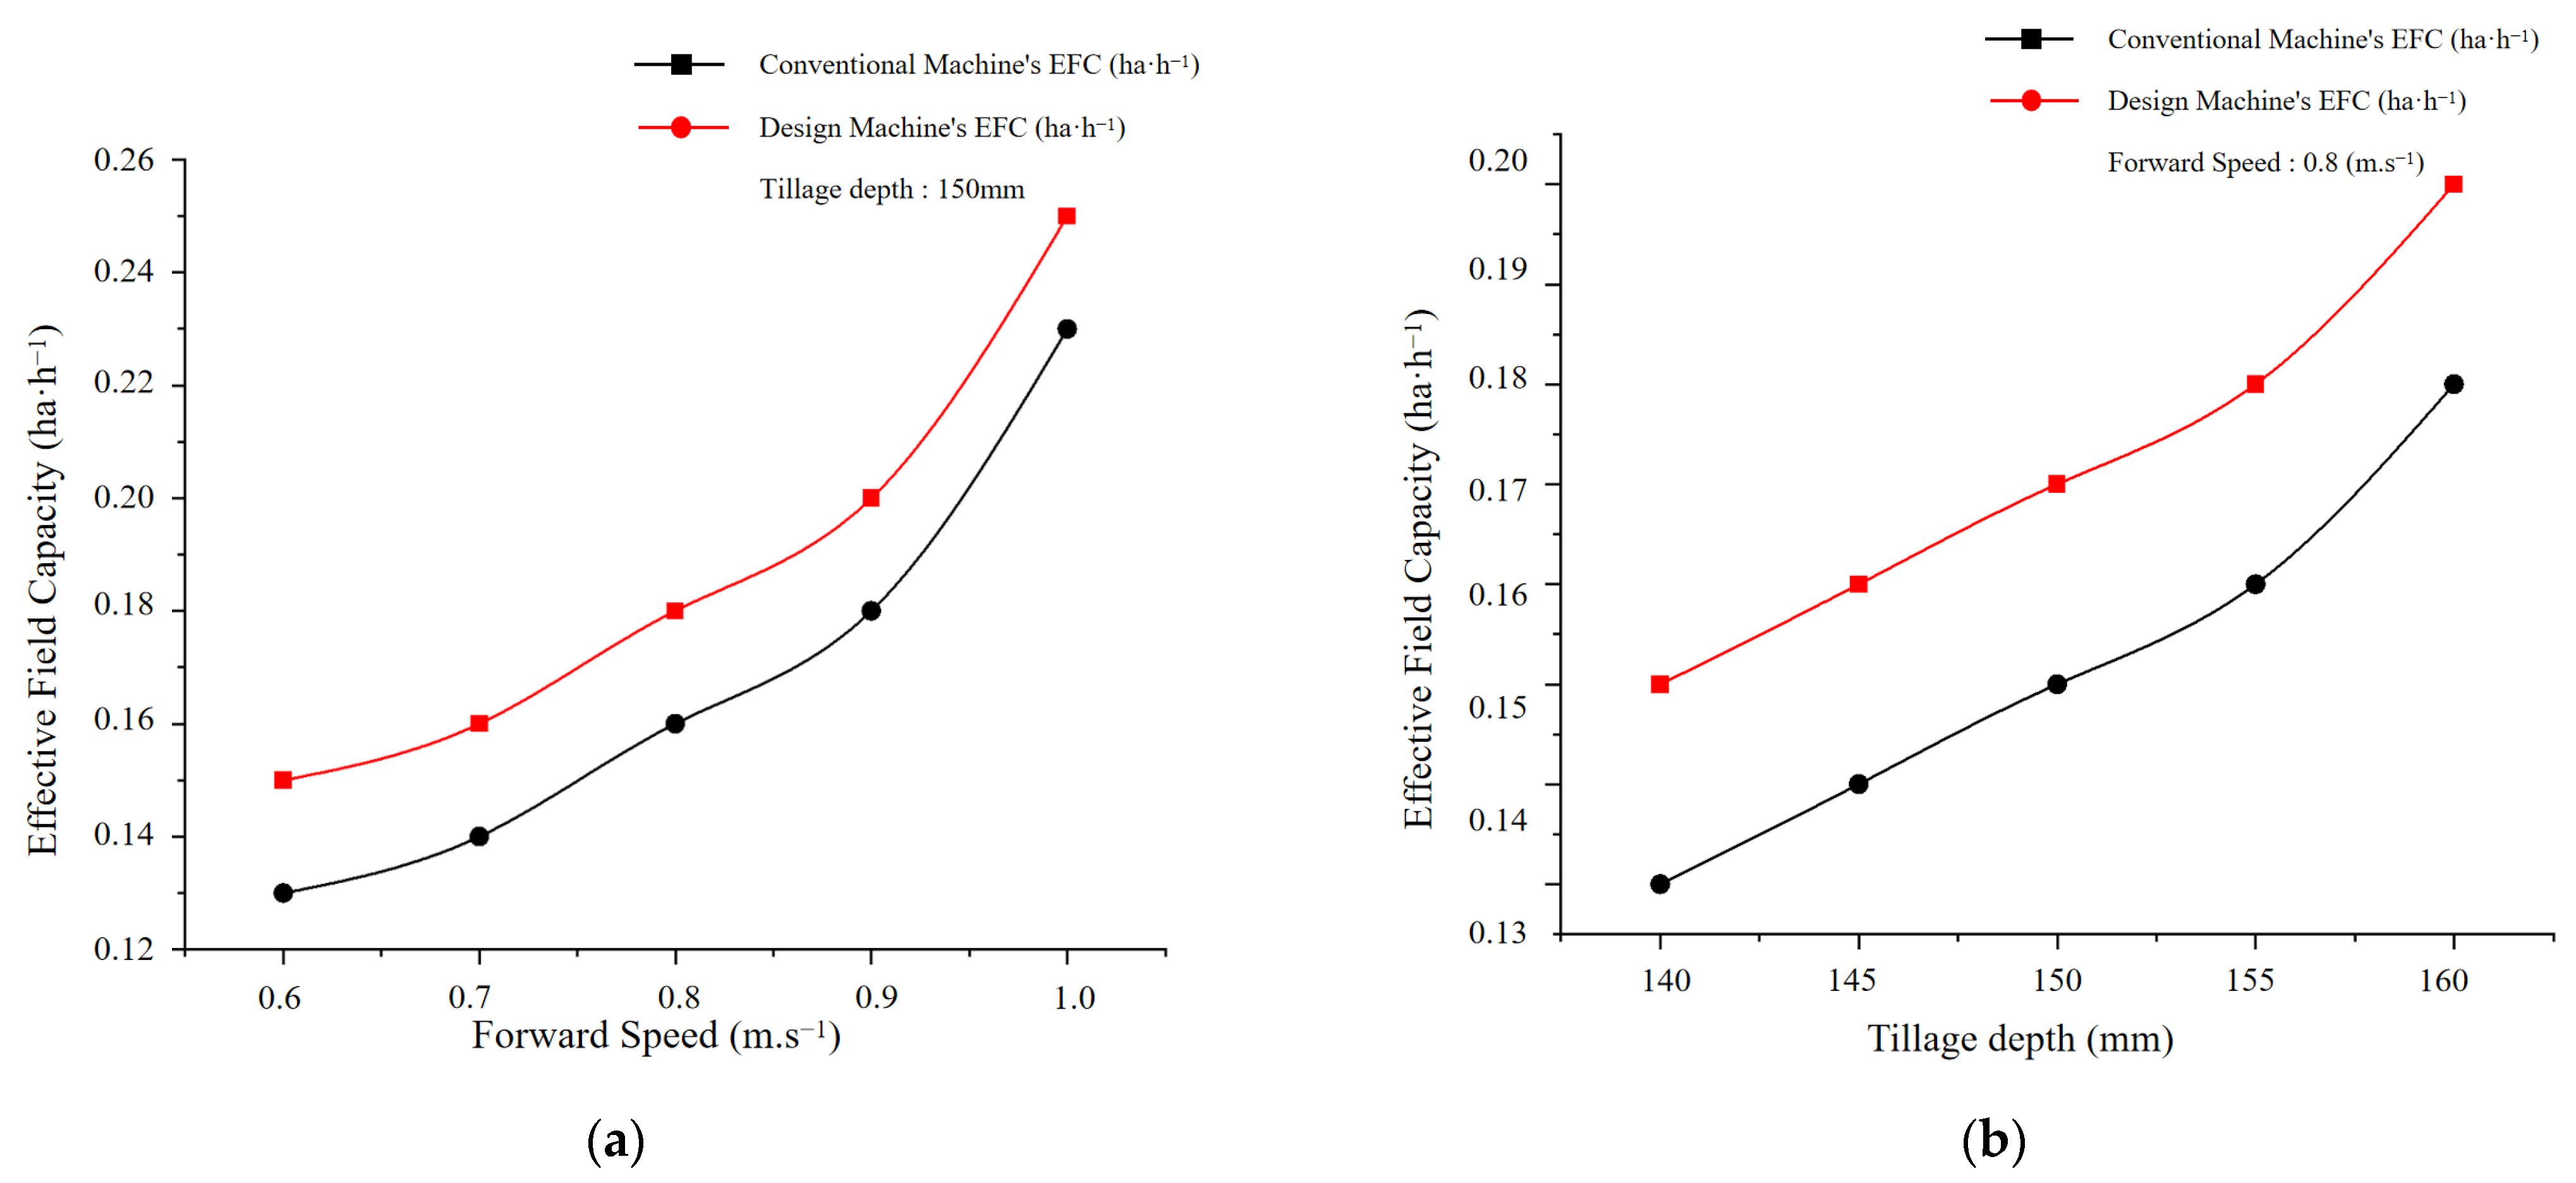
Comparison of Effective Field Capacity (EFC) Between the Designed and Conventional Machines Under Different Operational Conditions. (a) Effect of Forward Speed on Effective Field Capacity (EFC) of the Designed and Conventional Machines, with Tillage Depth Fixed at 150 mm. (b) Effect of Tillage Depth on Effective Field Capacity (EFC) of the Designed and Conventional Machines, with Forward Speed Fixed at 0.8 m/s.
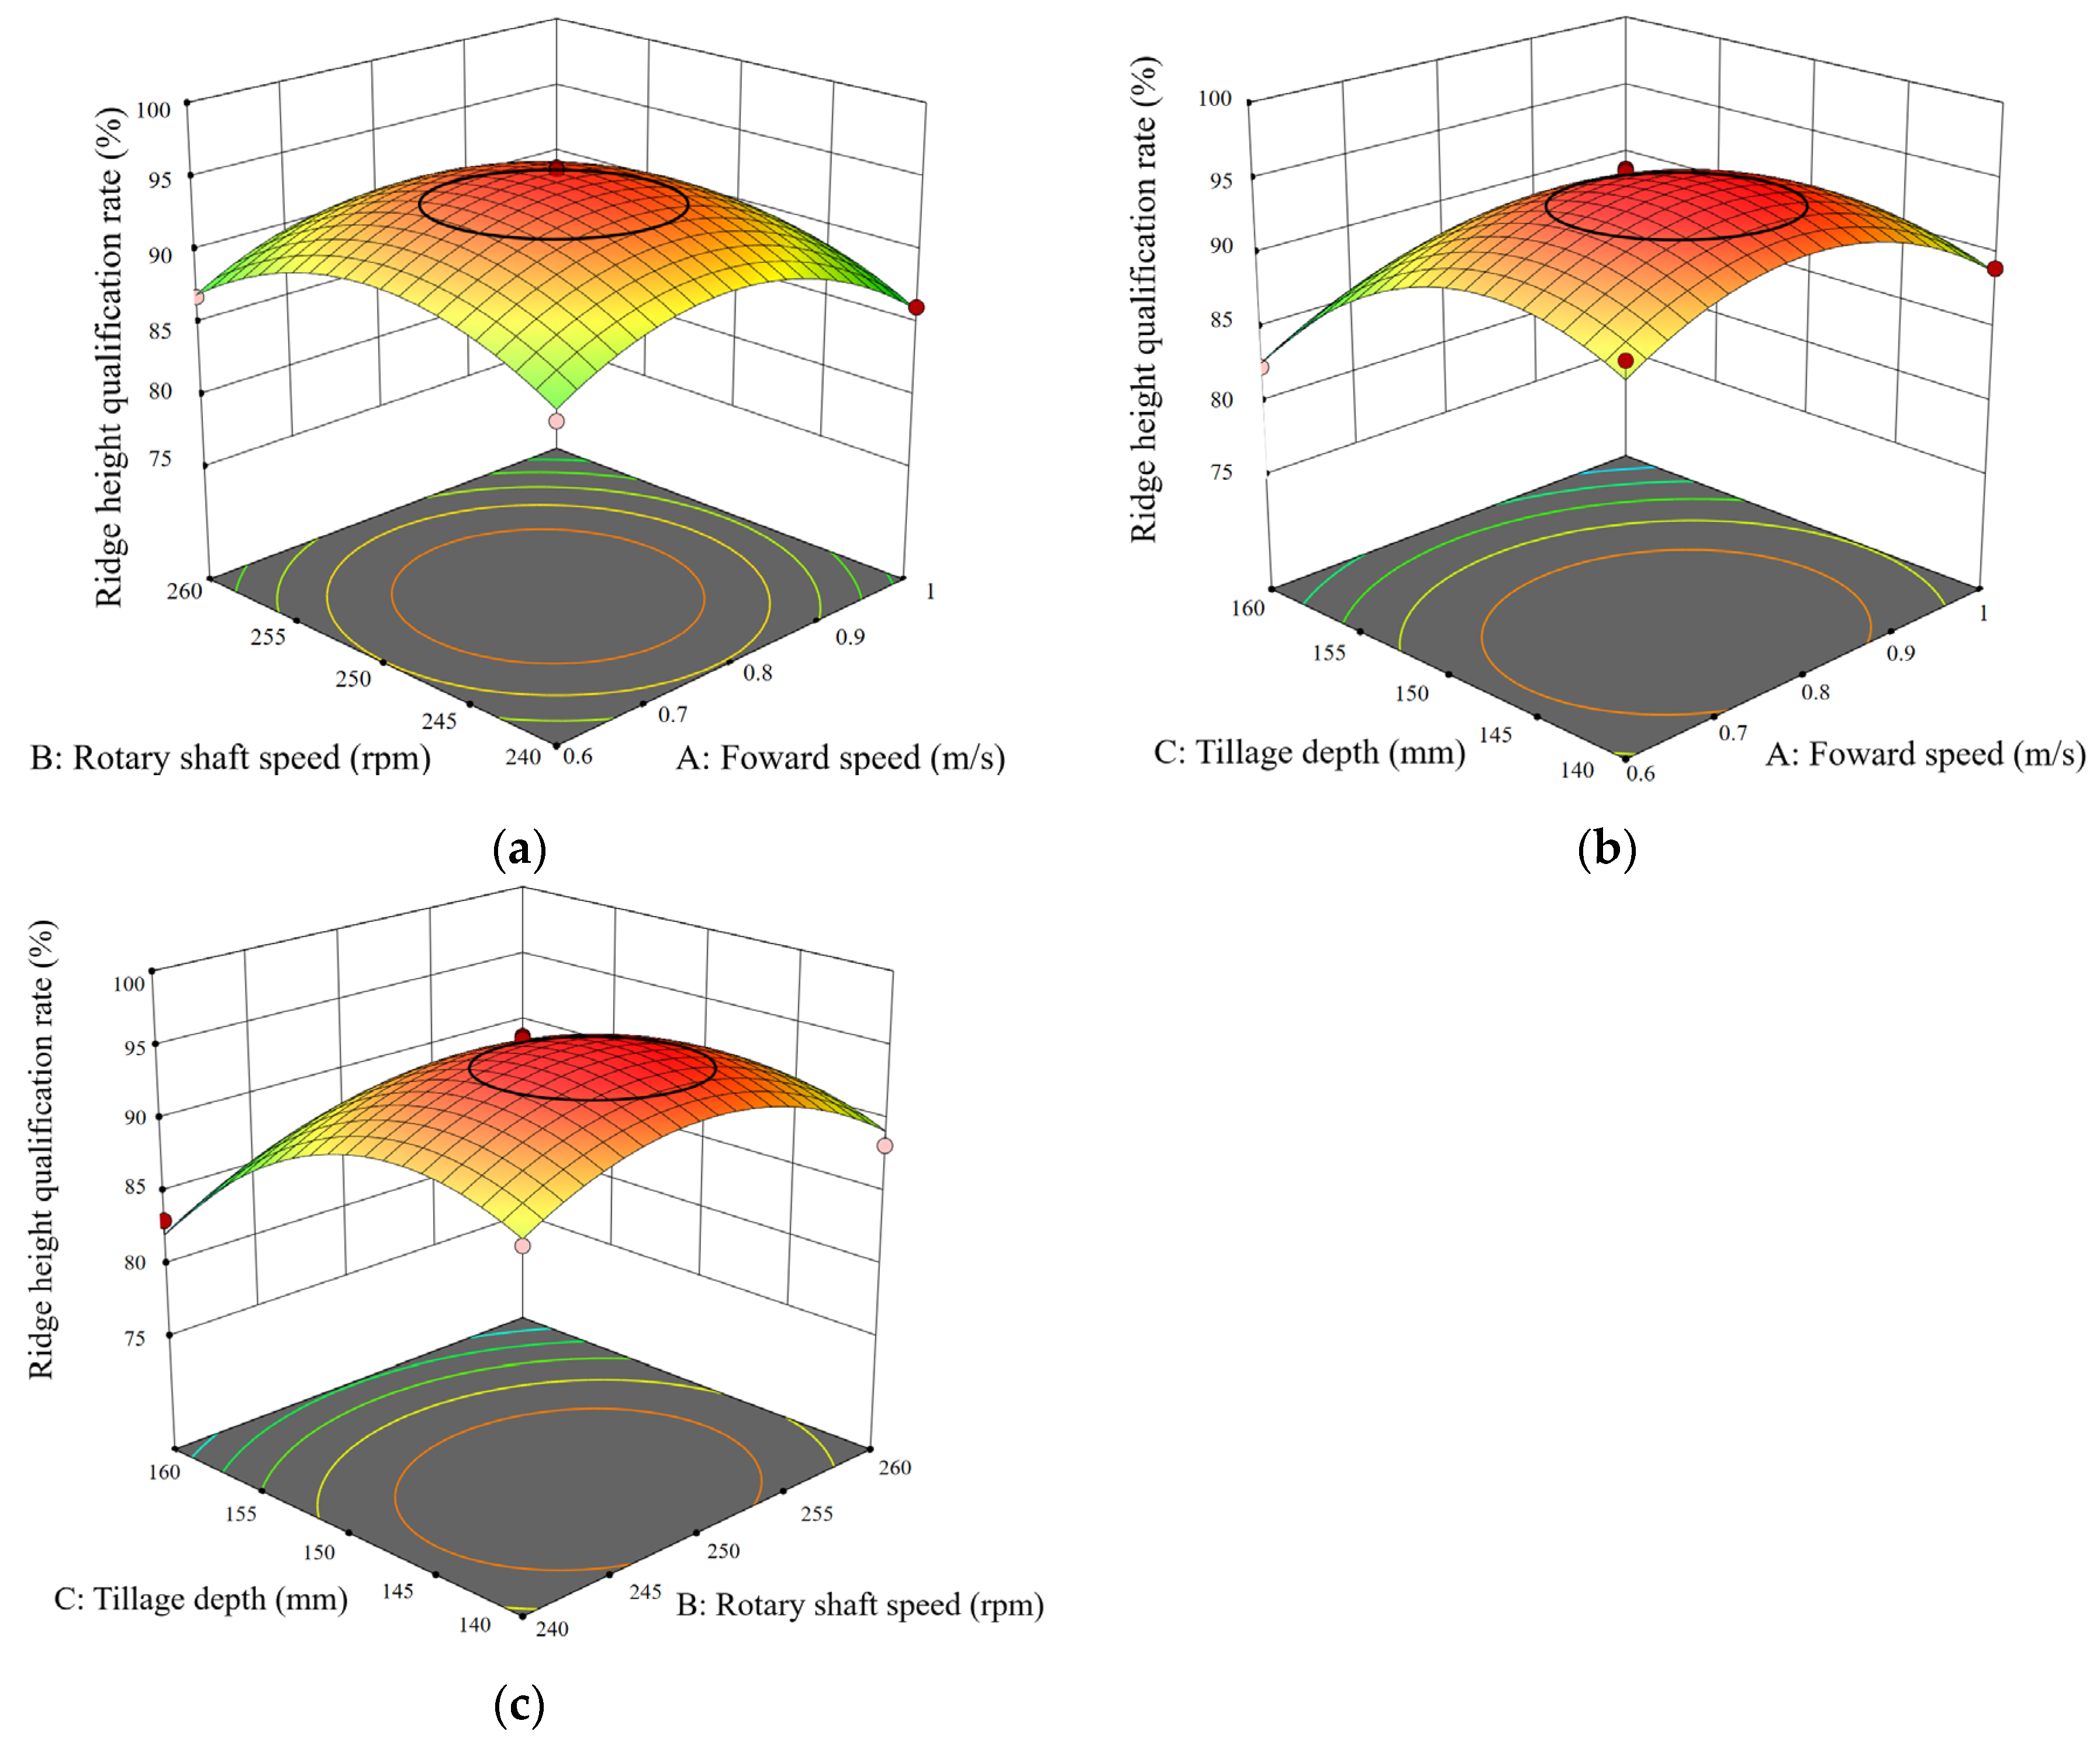
Figure 21.
The contour plots of the response surfaces showing the interactive effects of significant factors on ridge height qualification rate. (a) A, B: interactive response surface and contour lines. (b) A, C: interactive response surface and contour lines. (c) B, C: interactive response surface and contour lines. The colors in the figures represent the ridge height qualification rate: red indicates a higher qualification rate, while green and yellow indicate lower qualification rates.
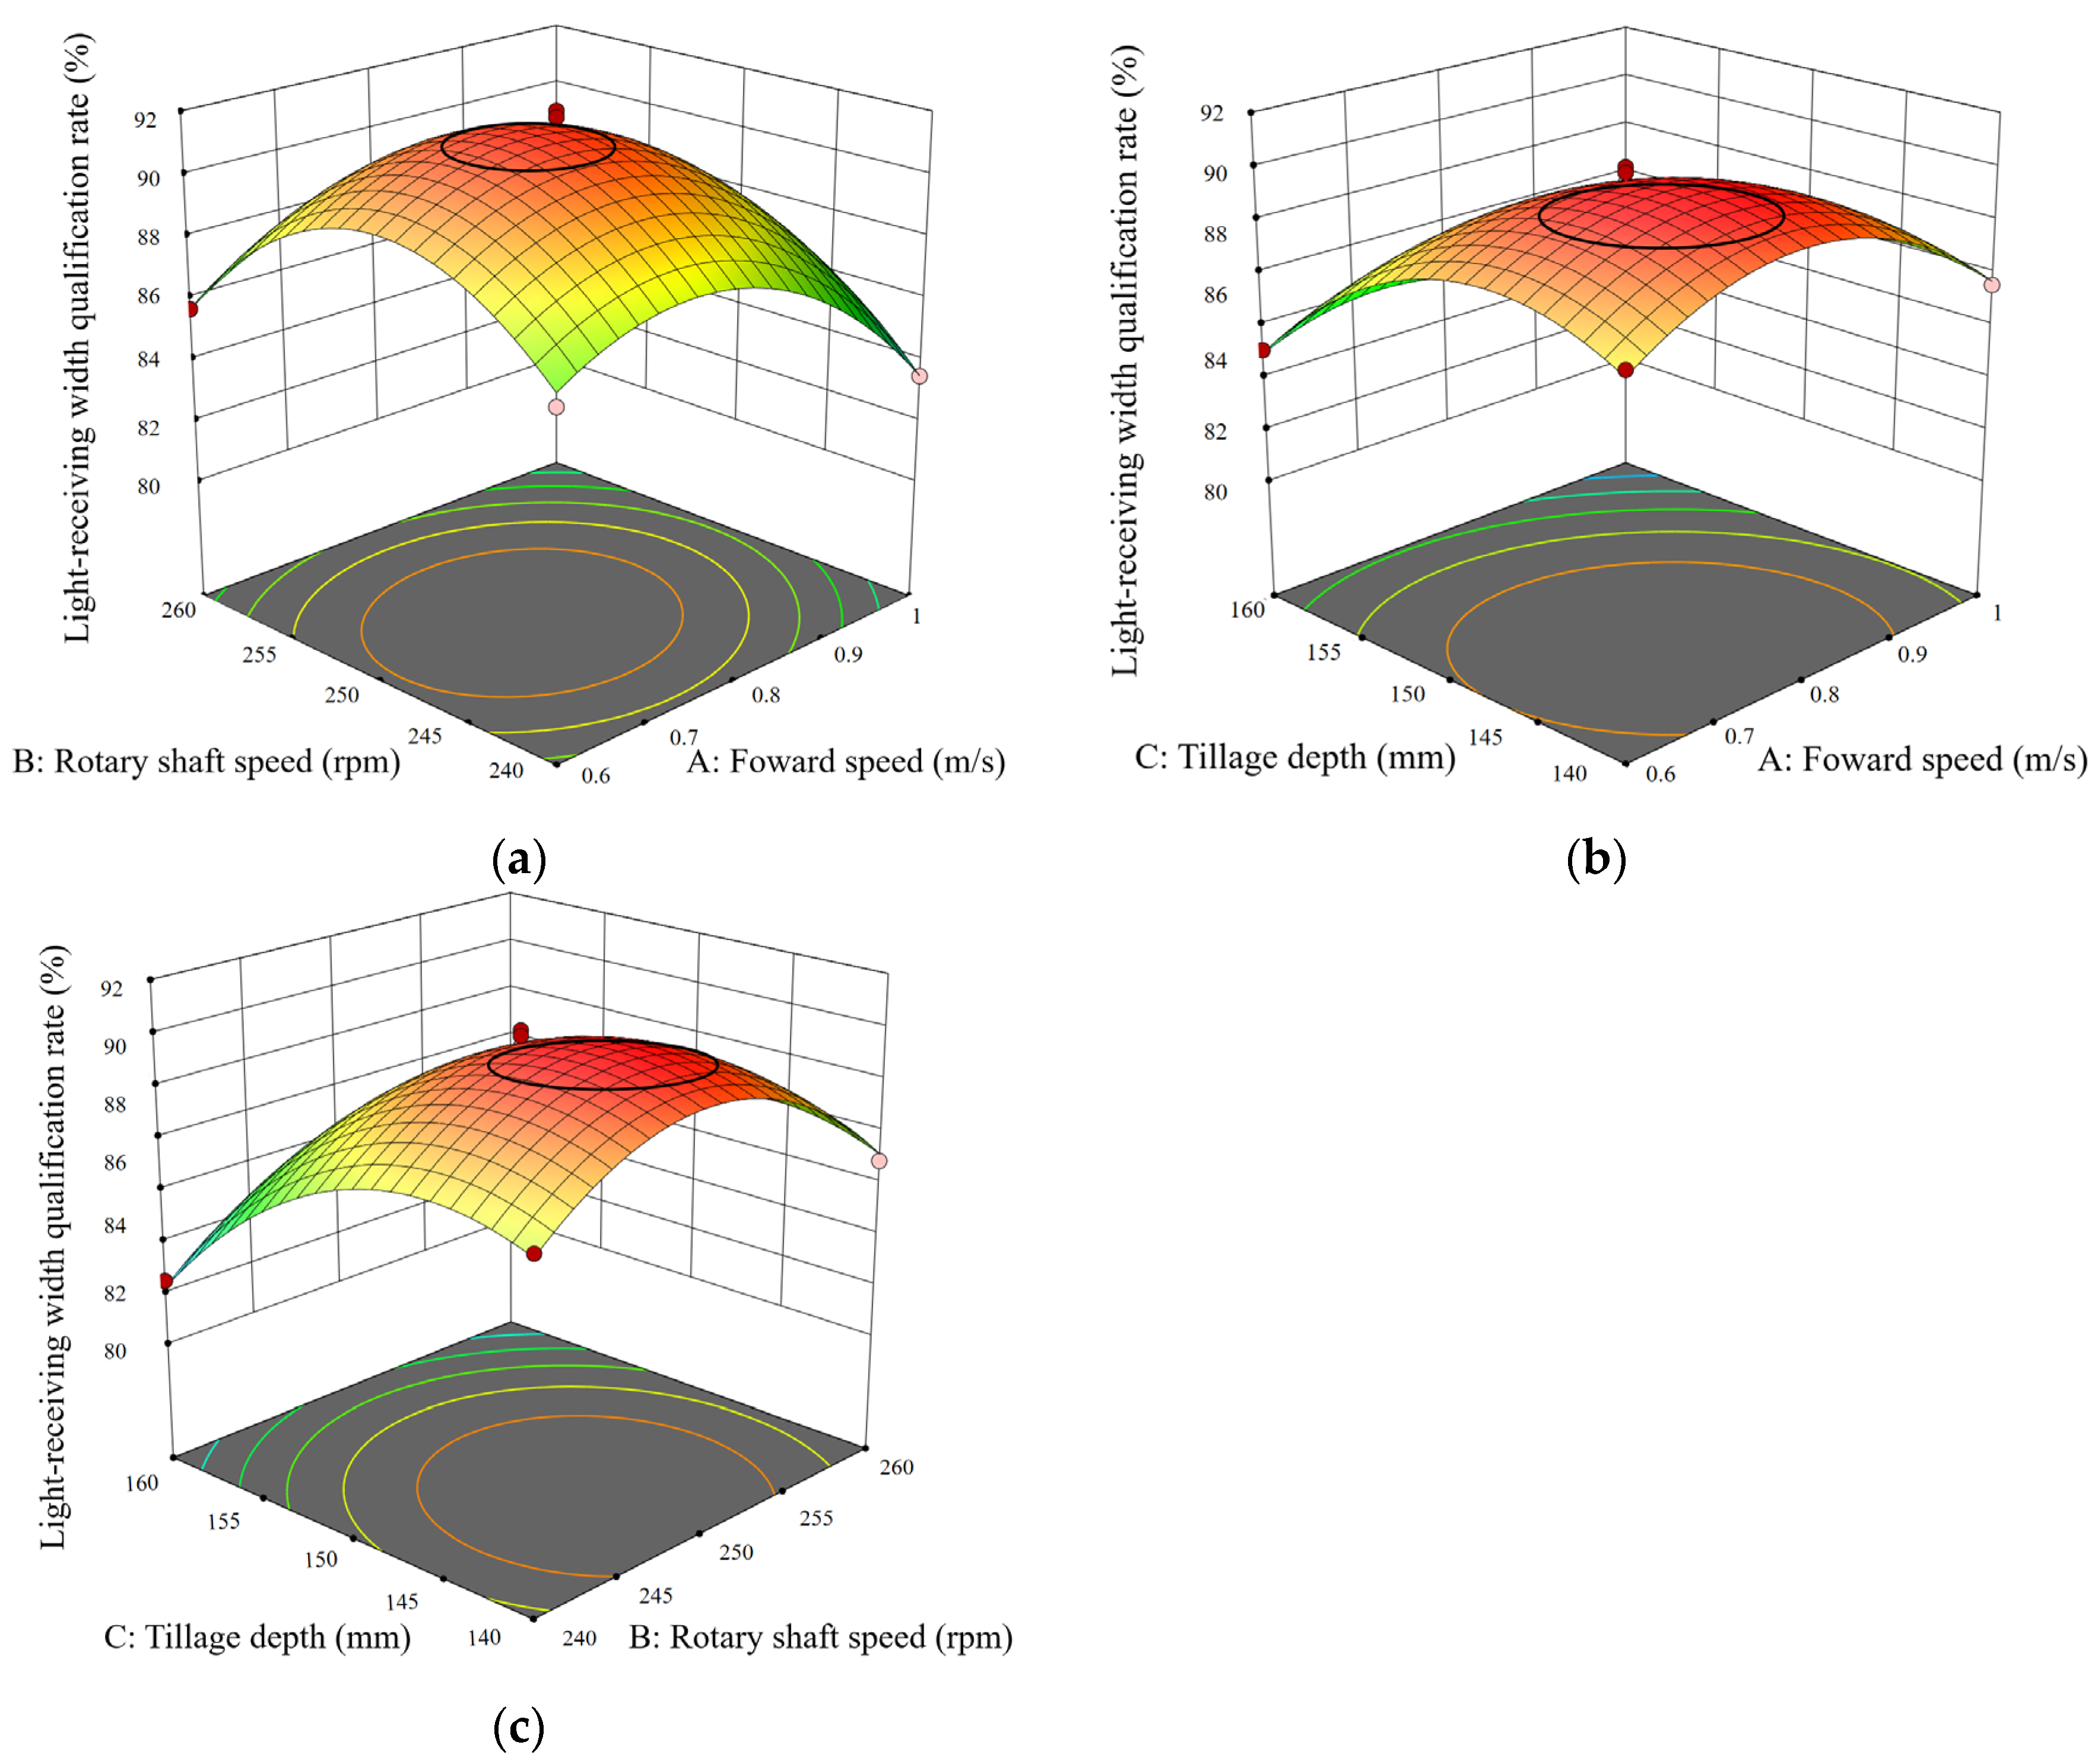
Figure 22.
The corresponding plots for the qualification rate of the light-receiving surface width. (a) A, B: interactive response surface and contour lines. (b) A, C: interactive response surface and contour lines. (c) B, C: interactive response surface and contour lines. The colors in the figures represent the ridge height qualification rate: red indicates a higher qualification rate, while green and yellow indicate lower qualification rates.
Figure 23.
Field experiment of ridge forming and mulching in a solar greenhouse.
Figure 23.
Field experiment of ridge forming and mulching in a solar greenhouse.
Table 1.
Specifications of the ridge-forming and film-mulching machine.
Table 1.
Specifications of the ridge-forming and film-mulching machine.
| Parameter | Value |
|---|
| Supporting power, kW | ≥10 |
| Large/small ridge width, mm | 700–1000 |
| Large/small ridge height, mm | 150–300 |
| Number of working rows, rows | 1 |
| Film width, mm | 1200–1500 |
| Number of rotary tiller blades, pcs | 6 |
| Number of ridging blades, pcs | 12 |
| Rotary tillage depth, mm | 180~220 |
| Operating speed/(km·h−1) | 2–3 |
Table 2.
Parameter settings for the DEM simulation.
Table 2.
Parameter settings for the DEM simulation.
| Item | Unit | Value |
|---|
| Sandy substrate length × width × height | mm3 | 2000 × 1200 × 300 |
| Forward speed | m·s−1 | 0.4–0.6 |
| Blade shaft rotational speed | rpm | 240–260 |
| Penetration depth | mm | 140–160 |
| Sandy substrate density | kg/m3 | 1405 |
| Sandy substrate Poisson’s ratio | | 0.35 |
| Sandy substrate shear modulus | Pa | |
| Steel density | kg/m3 | 7860 |
| Steel Poisson’s ratio | | 0.4 |
| Steel shear modulus | Pa | |
| Critical normal stress | KPa | 50 |
| Critical tangential stress | KPa | 30 |
Table 3.
The contact mechanics parameters for the sandy substrate particles.
Table 3.
The contact mechanics parameters for the sandy substrate particles.
| Parameter Type | Restitution Coefficient | Static Friction Coefficient | Rolling Friction Coefficient |
|---|
| Sandy substrate–sandy substrate | 0.45 | 0.7 | 0.03 |
| Sandy substrate–65Mn steel | 0.35 | 0.45 | 0.25 |
Table 4.
Particle size distribution of the sandy substrate.
Table 4.
Particle size distribution of the sandy substrate.
| Particle Grade | Particle Size/mm | Percentage/% | Cumulative Percentage/% |
|---|
| Gravel | >2 | 37 | 37 |
| Coarse sand | 0.6–2 | 34 | 71 |
| Medium sand | 0.2–0.6 | 25 | 96 |
| Fine particles | <0.2 | 4 | 100 |
Table 5.
Factor coding table.
Table 5.
Factor coding table.
| Factor | Level | Low Level | High Level | Unit |
|---|
| Forward speed | 0.8 | 0.6 | 1 | m·s−1 |
| Rotary shaft speed | 250 | 240 | 260 | rpm |
| Tillage depth | 150 | 140 | 160 | mm |
Table 6.
Experimental design and results.
Table 6.
Experimental design and results.
| Std | Run | Forward Speed (m·s−1) | Rotary Shaft Speed (rpm) | Tillage Depth (mm) | Ridge Height Qualification Rate (%) | Light-Receiving Width Qualification Rate (%) |
|---|
| 15 | 1 | 1 | 240 | 150 | 86.2 ± 0.6% | 83.5 ± 0.8% |
| 8 | 2 | 0.8 | 250 | 150 | 95.7 ± 1.0% | 92.0 ± 0.6% |
| 13 | 3 | 1 | 250 | 140 | 89.1 ± 0.9% | 87.6 ± 0.6% |
| 14 | 4 | 0.8 | 250 | 150 | 95.6 ± 0.5% | 91.3 ± 0.8% |
| 4 | 5 | 0.6 | 250 | 160 | 82.4 ± 0.6% | 85.1 ± 0.6% |
| 5 | 6 | 0.8 | 260 | 140 | 88.3 ± 0.6% | 86.9 ± 0.7% |
| 7 | 7 | 1 | 260 | 150 | 85.7 ± 0.5% | 84.2 ± 0.7% |
| 3 | 8 | 0.8 | 240 | 160 | 83.1 ± 0.9% | 82.5 ± 0.7% |
| 1 | 9 | 0.6 | 240 | 150 | 87.5 ± 0.8% | 86.8 ± 0.9% |
| 9 | 10 | 0.8 | 250 | 150 | 95.5 ± 0.4% | 91.8 ± 0.7% |
| 11 | 11 | 1 | 250 | 160 | 78.8 ± 0.5% | 80.3 ± 0.8% |
| 6 | 12 | 0.8 | 250 | 150 | 95.1 ± 1.0% | 91.4 ± 0.8% |
| 16 | 13 | 0.8 | 240 | 140 | 90.2 ± 0.5% | 88.4 ± 0.6% |
| 12 | 14 | 0.8 | 260 | 160 | 81.6 ± 1.0% | 81.9 ± 0.7% |
| 2 | 15 | 0.6 | 260 | 150 | 86.9 ± 0.6% | 85.7 ± 0.6% |
| 10 | 16 | 0.8 | 250 | 150 | 94.8 ± 0.6% | 91.1 ± 0.5% |
| 17 | 17 | 0.6 | 250 | 140 | 91.5 ± 0.7% | 89.2 ± 0.8% |
Table 7.
Analysis of variance for ridge height qualification rate (Y1).
Table 7.
Analysis of variance for ridge height qualification rate (Y1).
| Source | Ridge Height Qualification Rate (%) |
|---|
| Sum of Squares | df | Mean Square | F-Value | p-Value | Significant |
|---|
| Model | 464.14 | 9 | 51.57 | 54.01 | <0.0001 | |
| A-Forward speed | 9.03 | 1 | 9.03 | 9.46 | 0.0179 | * |
| B-Rotary shaft speed | 2.53 | 1 | 2.53 | 2.65 | 0.1475 | |
| C-Tillage depth | 137.78 | 1 | 137.78 | 144.28 | <0.0001 | ** |
| AB | 0.0025 | 1 | 0.0025 | 0.0026 | 0.9606 | |
| AC | 0.3600 | 1 | 0.3600 | 0.3770 | 0.5586 | |
| BC | 0.0400 | 1 | 0.0400 | 0.0419 | 0.8437 | |
| A2 | 87.46 | 1 | 87.46 | 91.58 | <0.0001 | ** |
| B2 | 74.54 | 1 | 74.54 | 78.06 | <0.0001 | ** |
| C2 | 119.73 | 1 | 119.73 | 125.38 | <0.0001 | ** |
| Residual | 6.68 | 7 | 0.9549 | | | |
| Lack of Fit | 6.11 | 3 | 2.04 | 14.25 | 0.0133 | |
| Pure Error | 0.5720 | 4 | 0.1430 | | | |
| Cor Total | 470.83 | 16 | | | | |
| R2 | 0.9858 |
| Adjusted R2 | 0.9875 |
Table 8.
Analysis of variance for light-receiving surface width qualification rate (Y2).
Table 8.
Analysis of variance for light-receiving surface width qualification rate (Y2).
| Source | Light-Receiving Width Qualification Rate (%) |
|---|
| Sum of Squares | df | Mean Square | F-Value | p-Value | Significant |
|---|
| Model | 225.16 | 9 | 25.02 | 138.93 | <0.0001 | |
| A-Forward speed | 15.68 | 1 | 15.68 | 87.08 | <0.0001 | ** |
| B-Rotary shaft speed | 0.7812 | 1 | 0.7812 | 4.34 | 0.0758 | |
| C-Tillage depth | 62.16 | 1 | 62.16 | 345.20 | <0.0001 | ** |
| AB | 0.8100 | 1 | 0.8100 | 4.50 | 0.0716 | |
| AC | 2.56 | 1 | 2.56 | 14.22 | 0.0070 | * |
| BC | 0.2025 | 1 | 0.2025 | 1.12 | 0.3242 | |
| A2 | 35.96 | 1 | 35.96 | 199.71 | <0.0001 | ** |
| B2 | 52.99 | 1 | 52.99 | 294.26 | <0.0001 | ** |
| C2 | 39.10 | 1 | 39.10 | 217.16 | <0.0001 | ** |
| Residual | 1.26 | 7 | 0.1801 | | | |
| Lack of Fit | 0.7125 | 3 | 0.2375 | 1.73 | 0.2979 | |
| Pure Error | 0.5480 | 4 | 0.1370 | | | |
| Cor Total | 226.42 | 16 | | | | |
| R2 | 0.9944 |
| Adjusted R2 | 0.9873 |
Table 9.
Field Test Results.
Table 9.
Field Test Results.
| Parameter | Unit | Standard | Data |
|---|
| Tillage depth | m | ≥0.08 | 0.15 |
| Tillage depth stability | % | ≥85 | 93.7 |
| Ridge height stability | % | ≥85 | 94.3 |
| Ridge top width qualification rate | % | ≥70 | 88.9 |
| Ridge spacing qualification rate | % | ≥75 | 100 |
| Yellow-sand substrate firmness | kPa | | 152.1 |
| Film edge width | mm | ≥70 | 75.2 |
| Light-receiving surface width | mm | ≥75 | 598.6 |
| Light-receiving surface damage rate | % | ≥75 | 2.1% |
