Article

Construction and Optimization of Integrated Yield Prediction Model Based on Phenotypic Characteristics of Rice Grown in Small–Scale Plantations

1
College of Agronomy and Biotechnology, Yunnan Agricultural University, Kunming 650201, China
2
The Key Laboratory for Crop Production and Smart Agriculture of Yunnan Province, Yunnan Agricultural University, Kunming 650201, China
3
College of Big Data, Yunnan Agricultural University, Kunming 650201, China
4
Engineering College, China Agricultural University, Beijing 100091, China
*
Author to whom correspondence should be addressed.
Agriculture 2025, 15(2), 181; https://doi.org/10.3390/agriculture15020181
Submission received: 5 December 2024 / Revised: 13 January 2025 / Accepted: 13 January 2025 / Published: 15 January 2025
(This article belongs to the Section Digital Agriculture)

Abstract

:
An intelligent prediction model for rice yield in small-scale cultivation areas can provide precise forecasting results for farmers, rice planting enterprises, and researchers, holding significant importance for agricultural industries and crop science research within small regions. Although machine learning can handle complex nonlinear problems to enhance prediction accuracy, further improvements in models are still needed to accurately predict rice yields in small areas facing complex planting environments, thereby enhancing model performance. This study employs four rice phenotypic traits, namely, panicle angle, panicle length, total branch length, and grain number, along with seven machine learning methods—multiple linear regression, support vector machine, MLP, random forest, GBR, XGBoost, and LightGBM—to construct a yield prediction model group. Subsequently, the top three models with the best performance in individual model predictions are integrated using voting and stacking ensemble methods to obtain the optimal integrated model. Finally, the impact of different rice phenotypic traits on the performance of the stacked ensemble model is explored. Experimental results indicate that the random forest model performs best after individual machine learning modeling, with RMSE, R2, and MAPE values of 0.2777, 0.9062, and 17.04%, respectively. After model integration, Stacking–3m demonstrates the best performance, with RMSE, R2, and MAPE values of 0.2483, 0.9250, and 6.90%, respectively. Compared to the performance after random forest modeling, the RMSE decreased by 10.58%, R2 increased by 1.88%, and MAPE decreased by 0.76%, indicating improved model performance after stacking ensemble. The Stacking–3m model, which demonstrated the best comprehensive evaluation metrics, was selected for model validation, and the validation results were satisfactory, with MAE, R2, and MAPE values of 8.3384, 0.9285, and 0.2689, respectively. The above research findings demonstrate that this integrated model possesses high practical value and fills a gap in precise yield prediction for small-scale rice cultivation in the Yunnan Plateau region.

1. Introduction

Rice is one of the most important food crops globally, playing a crucial role in national food security and people’s livelihoods [1,2]. According to statistics, the total global rice production in the 2023/2024 season is approximately 517.34 million tons, making it one of the crops with the largest planting area and highest yield worldwide. China is the world’s largest rice producer, with an annual output accounting for approximately 30% of the global total [3]. Statistics indicate that China’s rice production in the 2023/2024 season was approximately 144.62 million tons, ranking first in the world. However, with a population exceeding 1.41 billion, making China the second most populous country in the world, and an import volume of 2.63 million tons of rice and rice grains in 2023 alone, China still faces the dilemma of food shortages despite its high rice production. Therefore, predicting rice production is of great significance for global food security.
Current rice yield prediction methods primarily rely on traditional measurement techniques, crop growth models, and remote sensing technology, which are modeled and then used for prediction. Among these, traditional measurement methods involve selecting paddy fields for sampling based on equal area or average group sampling principles. After the rice matures, it undergoes threshing, drying, cleaning, and weighing, and then its moisture content is measured using a moisture meter. The final rice yield is calculated based on the proportions of indica and japonica rice at 13.5% and 14.5%, respectively [4]. This method is cumbersome, costly, time-consuming, labor-intensive, and prone to significant errors. Crop growth models surpass traditional rice yield prediction methods as they can output corresponding prediction results simply by inputting the relevant parameters. Models such as WOFOST (World Food Studies), APSIM (Agricultural Production System Simulator), and DSSAT (Decision Support System for Agrotechnology Transfer) can simulate crop development and growth [5]. However, these models heavily rely on local soil conditions, crop management practices, and extensive climate data [2], and they require significant computational costs [6]. Recently, AquaCrop, a novel crop model developed by FAO, has been widely used in production practices due to its advantages such as fewer input parameters and a simple interface. However, the model faces instability issues in simulation accuracy, and the calibration and adjustment of model parameters are demanding, limiting its application scope to specific regions and crop types [7]. Remote sensing technology has been successfully applied to crop yield prediction [8,9], such as for rice [10,11]. Various remote sensing datasets can be obtained from ground spectral reflectance, red–green–blue (RGB)/multispectral/hyperspectral images from drones, and satellite platforms. In recent years, medium–to–high resolution satellites such as MODIS, QuickBird, Landsat, and SPOT have been widely used for large-scale grain yield prediction [12,13]. However, the accuracy of grain yield prediction using satellite images is affected by time, space, and spectral resolution [14], and factors such as terrain complexity, revisiting cycle length, low spatial resolution, and farmland area size significantly impact crop yield prediction [10,15]. With the deep development of big data technology, multi-source remote sensing data, as a product of big data technology, provide a new monitoring method for crop yield estimation. LCC has been estimated through the fusion of satellite images or UAV images [16], and the performance is evaluated using independent datasets [17,18]. Additionally, the fusion of multi-source remote sensing data effectively enhances the prediction accuracy of grain yield [19,20]. To establish a grain yield prediction model, most studies directly utilize spectral and RGB image information. Although these prediction models can accurately forecast yields and are easily interpretable, they often lack mechanistic explanations. Consequently, it is challenging to utilize remote sensing information to elucidate the impact of physiological processes on grain yield and the accuracy of these prediction models [21].
The distinction between machine learning and traditional crop growth models in predicting crop yields lies in the fact that machine learning algorithms, once modeled, are capable of handling nonlinear relationships and exhibit adaptability, generalization capabilities, feature learning, and selection abilities, thereby enhancing prediction accuracy [22]. Consequently, machine learning technology, as one of the most pivotal and practical techniques in the field of smart agriculture, is widely applied across the entire agricultural value chain, boosting production efficiency [23]. In particular, with the continuous refinement of machine learning algorithms, integrating these techniques with knowledge from agriculture-related fields has led to the construction of diverse smart agriculture models yielding positive outcomes, making it one of the primary technological means for studying future agriculture [24,25]. This is due to machine learning’s proficiency in handling nonlinear relationships, adaptability, generalization capabilities, and feature learning and selection abilities, which in turn enhance prediction accuracy and flexibility [22]. Simultaneously, through training on historical data, automatically learning, and extracting relationships between features, intelligent models are constructed, mapping input features to target variables, namely crop yields [26,27]. This approach ranges from basic regression models to complex deep learning (DL) algorithms [28]. Yamparla et al. [29], based on extensive historical and environmental data, utilized various machine learning algorithms to construct a crop yield prediction model. The research findings indicated that the random forest algorithm, when applied to predict crop yields in India, achieved an accuracy rate of 95%. Paudel et al. [30] adopted an improved machine learning method to build a crop yield prediction model for the European region. Drummond et al. [31] employed multiple linear regression (SMLR), projection pursuit regression (PPR), and several types of neural networks to construct a grain yield prediction model. Experimental results demonstrated that the performance of neural network algorithms post modeling surpassed that of SMLR and PPR. Khaki and Wang [32] designed a residual neural network model to forecast yields. Mupangwa et al. [33] evaluated the performance of several machine learning (ML) models in predicting corn grain yields under conservation agriculture conditions. Numerous researchers have constructed crop yield prediction models based on machine learning methods, achieving notable success. However, these researchers primarily constructed crop yield prediction models based on historical and environmental data from a specific region. These models primarily predict crop yields in broad domains, primarily applied to yield estimation in a certain area, suitable for government departments’ crop yield forecasting, but lacking in predicting crop yields for specific planting regions. However, with the rapid advancement of smart agriculture technology, an increasing number of entrepreneurs are diving into the development of the agricultural industry. Crop planting enterprises, individual farmers, researchers, and data surveyors all require precise predictions for crops cultivated on specific plots or multiple plots. Concurrently, as smart agriculture technology continues to evolve, a singular machine learning model can no longer meet the demands of predicting crop yield based on phenotypic characteristics in complex environments. Therefore, there is an urgent need to develop a novel method for accurately predicting rice yield.
This study addresses the challenge of precise rice yield prediction in the complex environment of Yunnan’s plateau mountainous regions, characterized by numerous mountainous areas, extensive terraced fields, small paddy field areas, and low yields. Initially, the phenotypic traits of mature rice were measured using the rice phenotypic scanner TPS–BX–1 (China Zhejiang topu yunnong Technology Co., Ltd., Hangzhou, China), serving as influencing factors for constructing a machine learning model. The weight of each rice panicle was identified as the corresponding outcome of these influencing factors, establishing a rice phenotypic resource library comprising 2048 datasets. This provides data support for the construction of a precise rice yield prediction model integrating multiple intelligent algorithms. Furthermore, by combining intelligent algorithm-based precise rice yield prediction with ensemble algorithms, we conducted an in–depth study on the strengths and weaknesses of different machine learning algorithms when addressing the same problem. This effectively leverages the advantages of individual models, enhancing the performance of the ensemble model. A method for constructing an integrated model for rice yield prediction based on phenotypic data was proposed, aimed at building an integrated model for rice yield prediction in small-scale planting environments. This addresses the challenge of precise rice yield prediction for farmers, crop planting bases (enterprises), and researchers.

2. Research Region and Data Processing
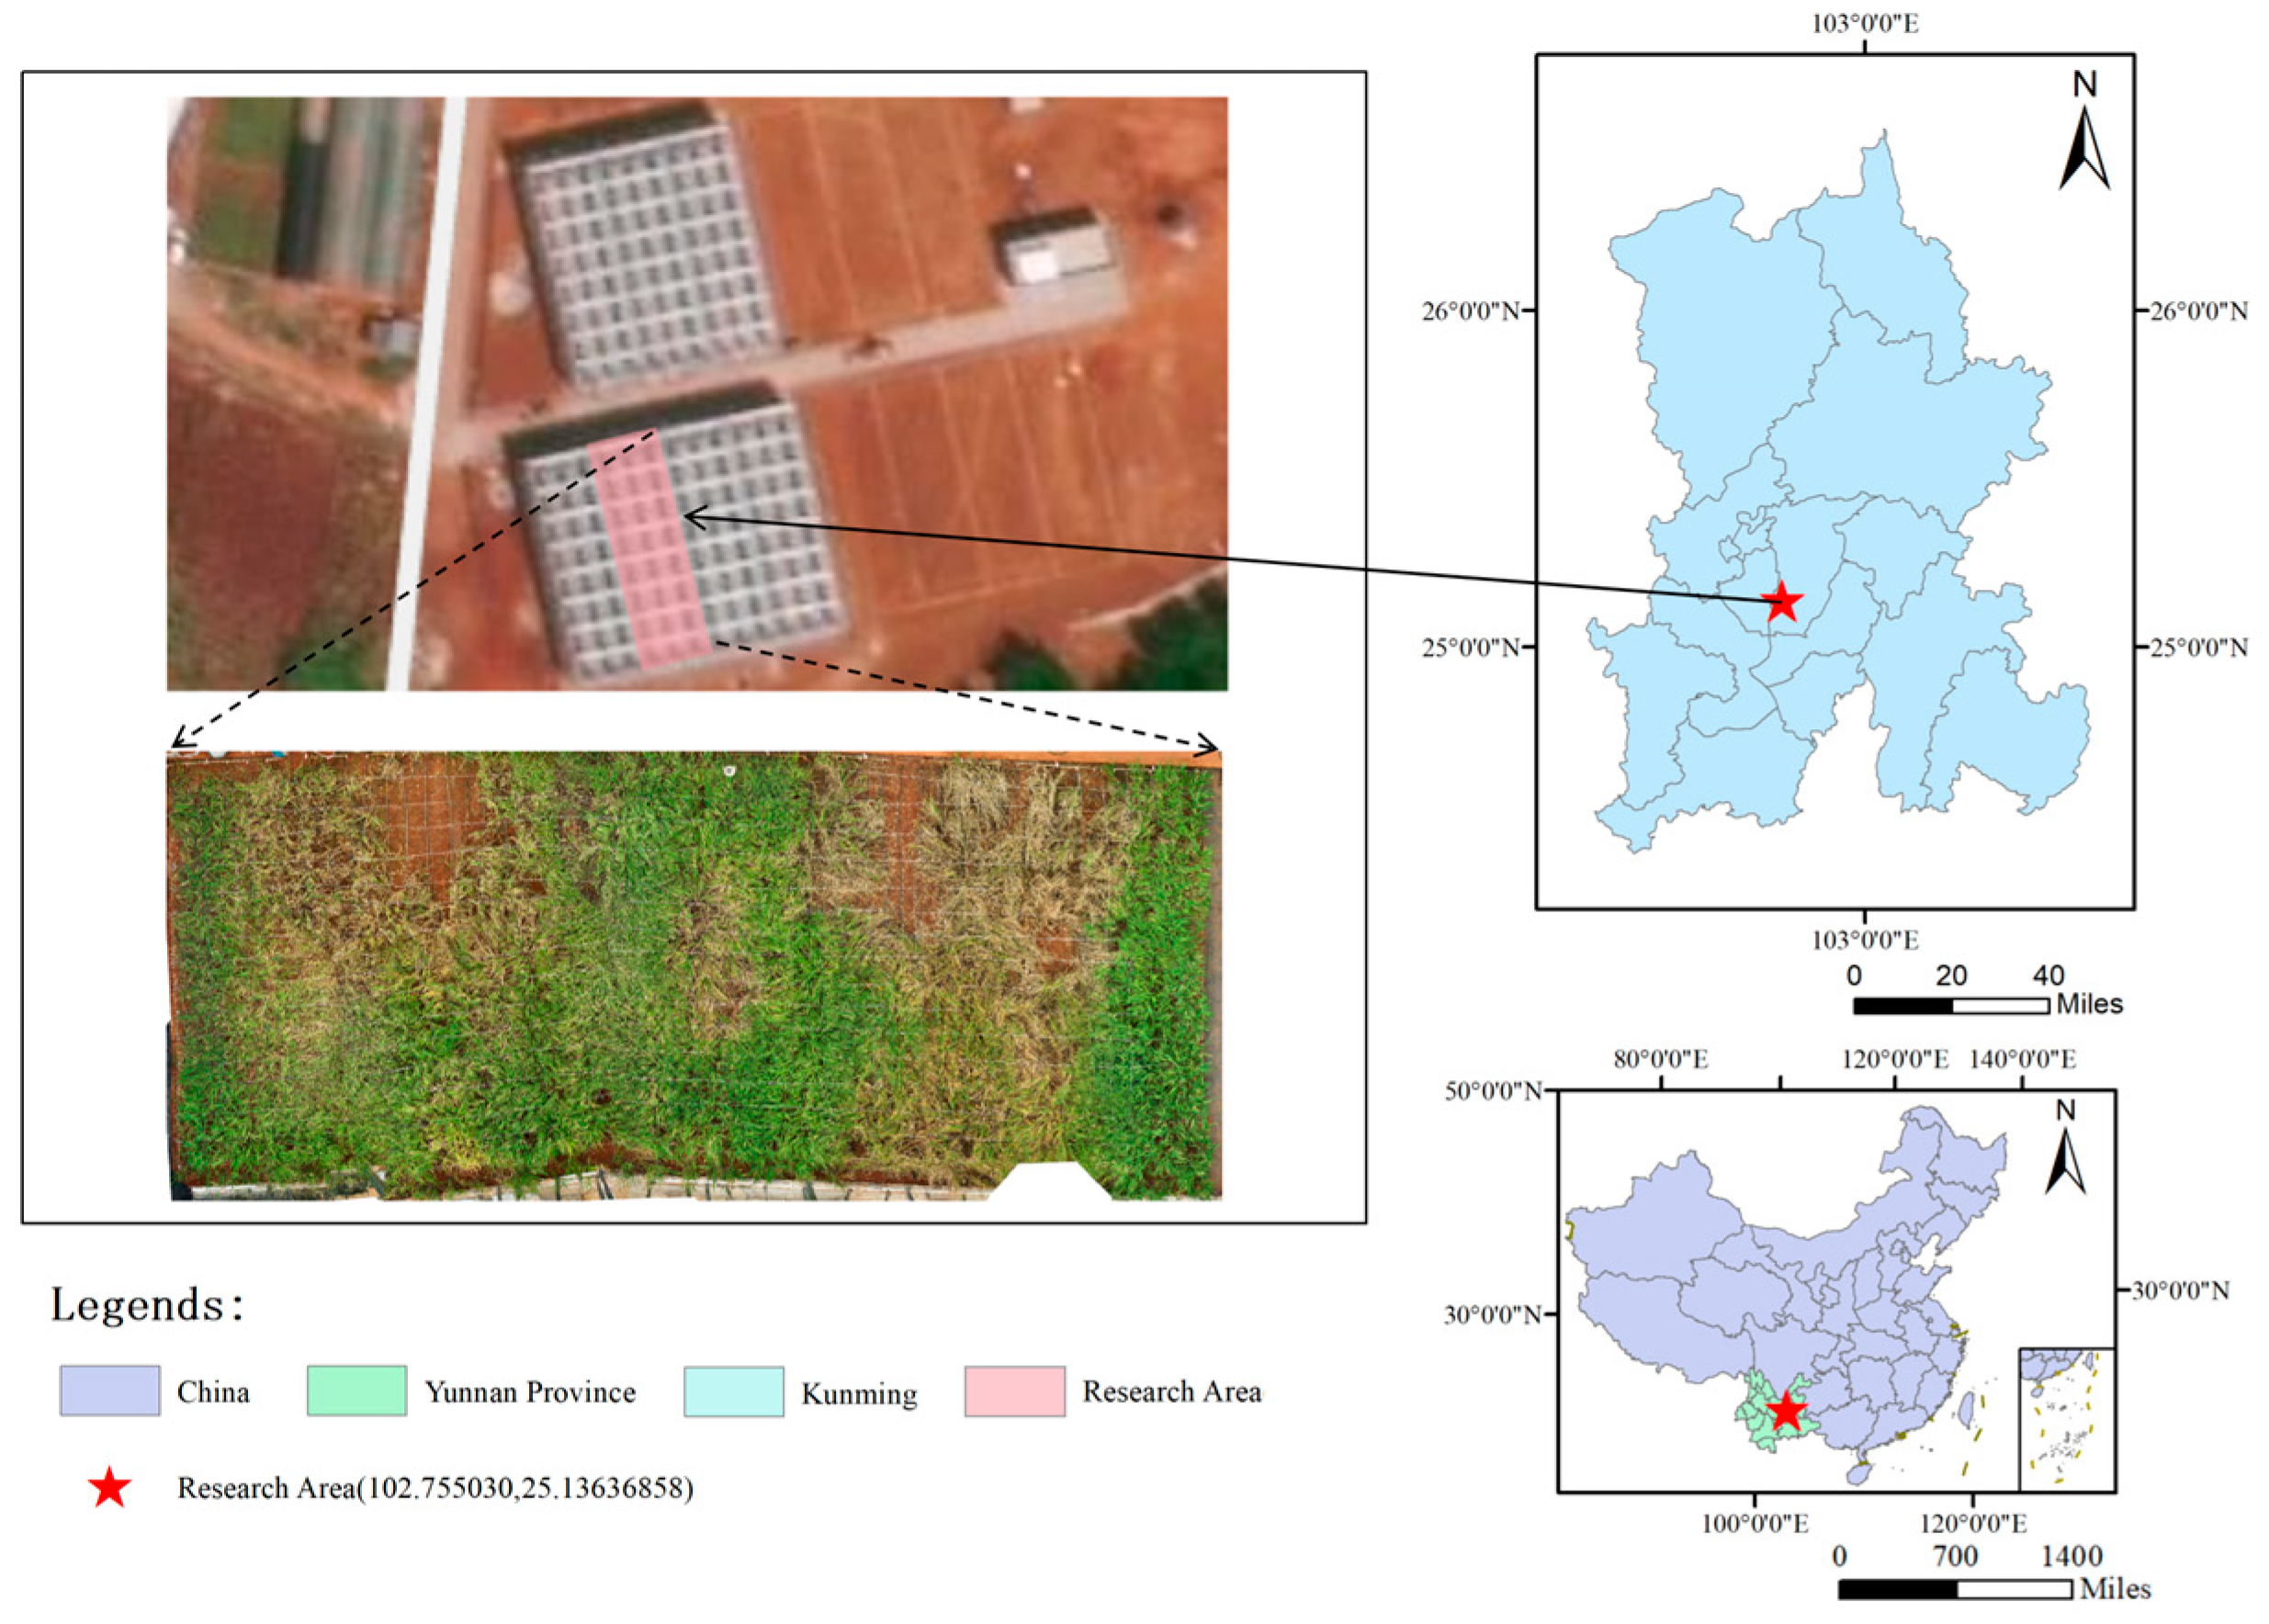
2.1. Study Area

Yunnan Agricultural University is situated in Panlong District, Kunming, Yunnan Province, China. The annual average temperature is 14.9 °C, with an extreme maximum temperature of 31.5 °C and an extreme minimum temperature of −7.8 °C. The annual average precipitation is approximately 1000.5 mm, with a monthly maximum rainfall of 208.3 mm and a daily maximum rainfall of 153.3 mm, predominantly concentrated between May and September. The annual sunshine duration is 2327.5 h, and the annual evaporation is 1856.4 mm. The maximum wind speed is 40 m/s, predominantly from the southwest. The relative humidity stands at 76%. The New Agricultural Science Comprehensive Practical Teaching Base was established and widely put into use on 1 August 2023, primarily for research in breeding, cultivation, smart agriculture, and agricultural engineering. The primary soil type in the region is red soil, which is widely distributed along the edges of plateau lake basins and in low–to–medium mountainous areas at elevations ranging from 1500 to 2500 m in northern Yunnan at latitudes between 24° and 26°. This soil type is suitable for the growth of various plants, including grain and economic crops such as rice, wheat, broad beans, corn, potatoes, rapeseed, flue-cured tobacco, vegetables, and flowers.
The 2–22 area of the Comprehensive Practical Teaching Base for New Agricultural Sciences at Yunnan Agricultural University stands as one of the foremost research and teaching bases for the Key Laboratory of Crop Production and Smart Agriculture in Yunnan Province. As depicted in Figure 1, this area serves as a rice experiment zone, primarily tasked with constructing crop growth models to facilitate intelligent field control. It collects environmental data, soil data, and phenotypic data during the crop growth process through meteorological stations and soil moisture sensors, among other IoT devices. Building upon this foundation, this study constructed multiple individual rice yield prediction models utilizing various machine learning algorithms, based on phenotypic data and corresponding yield data collected from the base’s rice cultivation. Subsequently, this study selected the three most accurate models among these individual models and employed both voting ensemble and stacking ensemble methods to develop an integrated learning model, aiming to identify the most suitable approach for rice yield prediction. This approach enables the precise prediction of rice yield in small-scale planting environments, culminating in the development of a widely applicable and demonstrable rice yield prediction model.

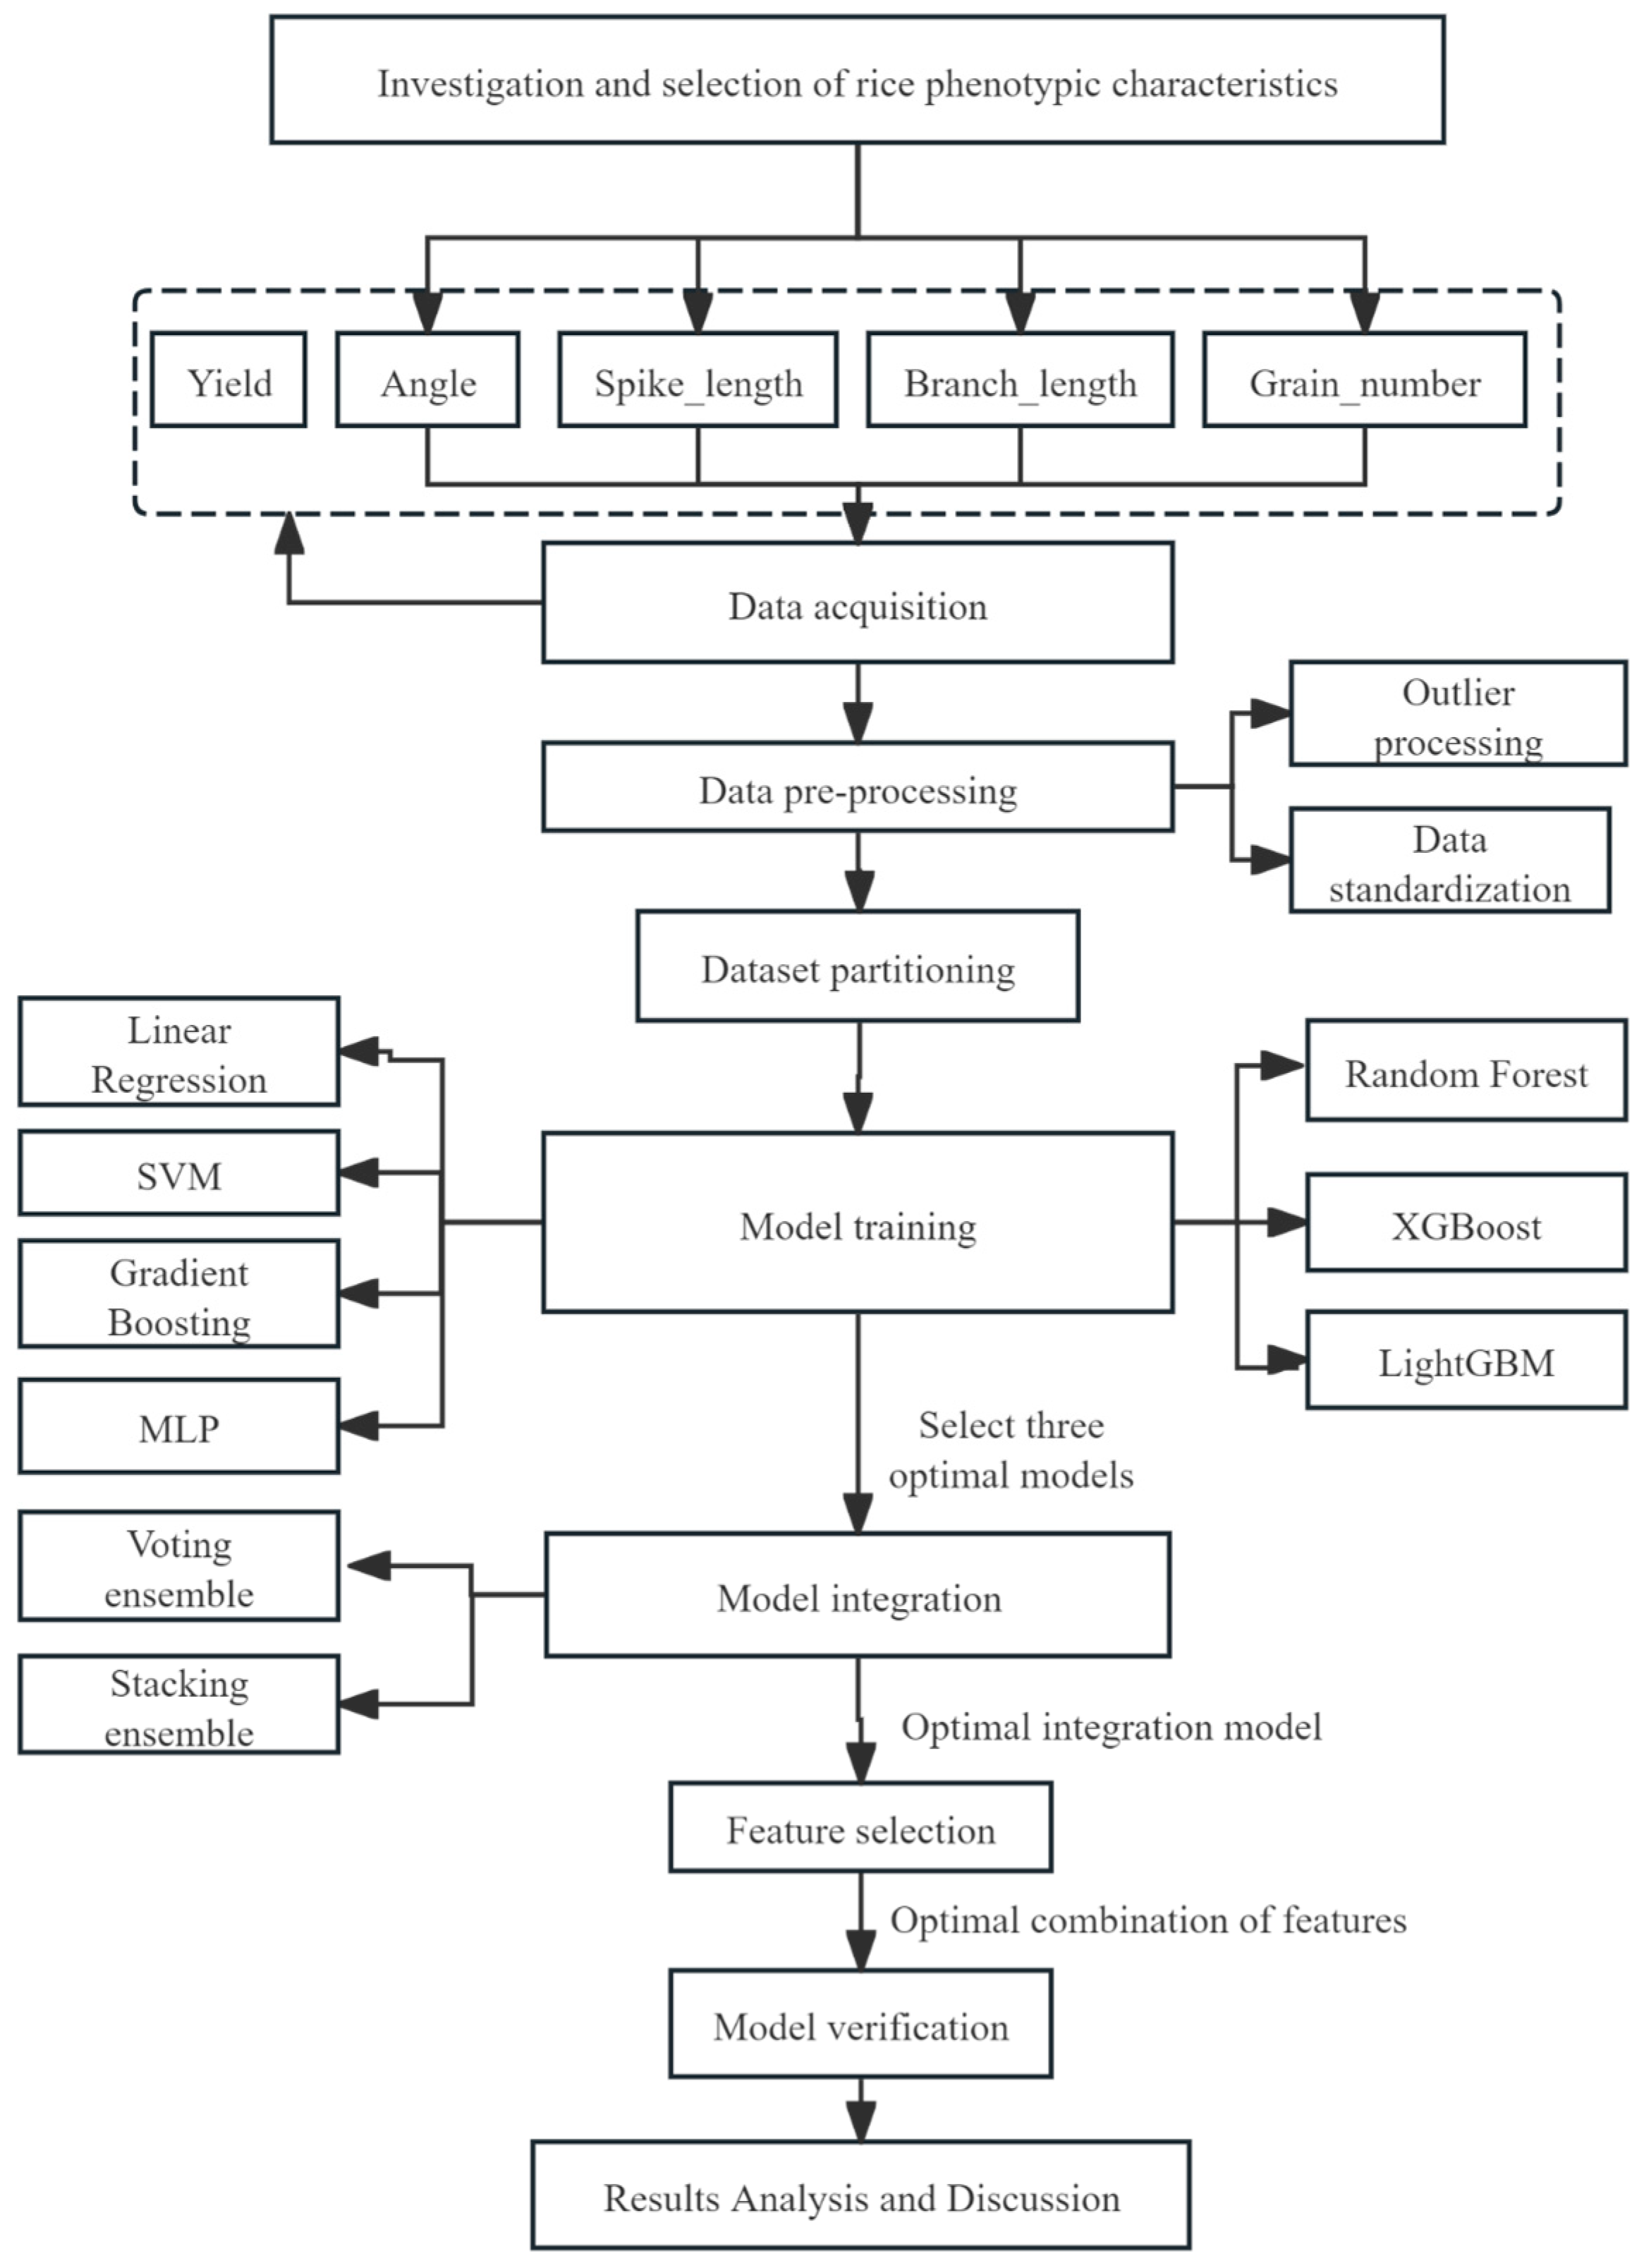
2.2. Data Collection and Processing

2.2.1. Dataset

This study was conducted on 15 April 2024 at the Comprehensive Practical Teaching Base for New Agriculture Sciences at Yunnan Agricultural University, specifically in Area 2–22—Rice Experimental Area. The rice variety Dianhe 615 was planted using a dryland sowing method, covering an area of over 160 square meters. Once the rice entered the germination stage, the experimental field was divided into five sections, each with a different irrigation rate, primarily by adjusting the drip irrigation switches to 100%, 75%, 50%, 25%, and 0% openness. As the rice matured, a white string was used to divide the experimental field into 512 smaller planting sections, each serving as an independent observation unit. On 25 September 2024, after the rice reached full maturity, the TPS–BX–1 rice phenotype detector (including the “Zhizhong” APP) was employed to measure key phenotypic traits and the weight of each rice spike. The specific details include the following.
Initially, four rice ears were randomly selected as measurement samples within each sub-region, yielding a total of 2048 datasets. The rice phenotype detector TPS–BX–1, including “Zhizhong” APP, was primarily utilized to measure the phenotypic traits of each ear, including the angle, ear length, total branch length, grain number, and grain weight. Subsequently, to validate the experimental results and predict sub-regional yields, data from 12 randomly selected sub-regions out of 512 were used as validation samples. The rice phenotype detector was employed to measure the number of ears in these sub-regions, while an electronic scale was used to determine the weight of each sub-region. The specific collection methods are illustrated in Figure 2.
We divided the task of measuring phenotypic traits of rice into five groups, each consisting of five individuals, totaling 25 individuals. Five types of phenotypic traits were measured using the rice phenotypic scanner TPS–BX–1. Taking one group as an example, we detail the data collection process as follows. Firstly, 12 small areas were randomly selected within the rice experimental area. The cross-calibration object in the rice phenotype detector TPS–BX–1 was placed directly above the planted rice. Subsequently, the “rice ear count per mu” function of the “Know–Seed” app was utilized for photo monitoring, yielding ear counts of 11, 15, 18, 28, 41, 14, 35, 42, 43, 40, 16, and 14 ears in these 12 small areas. Then, through manual counting, it was discovered that only one small area had one ear missing, with the remaining data being correct. Finally, the device was used to measure the ears in 512 small areas. After measuring the rice ear counts, four ears were randomly selected from each small area as the measurement objects, totaling 2048 rice ears. The rice angle, ear length, grain number per plant, grain weight, and ear weight were measured separately. The specific measurement method is shown in Figure 2 First, the phone was fixed on the phone holder of the angle measuring instrument, and the ear branches were fixed on the pressure plate. The “crop angle” function of the “Know–Seed” app was used to photograph and analyze each randomly selected rice ear to obtain the angle value. Four rice ears were randomly selected from each small area for measurement experiments and laid flat on the rice ear morphology measurement and photography board, and the “rice ear morphology” function of the “Know–Seed” app was used to analyze the first branch to the top of the rice ear to obtain the ear length. The primary and secondary branches of each randomly selected sample were placed in corresponding areas on the photography board, and the “rice ear whole-ear examination” function of the “Know–Seed” app was used to photograph and analyze the branch branches, recording the total length of the rice ear branches. All grains of one rice ear were laid flat on the photography background board, and the “seed counting” function of the “Know–Seed” app was used to photograph and obtain the planting grain count. After completing the data collection of 2048 rice ears, an original single-ear rice phenotype dataset was formed, as shown in Table 1, serving as the basic database for constructing an integrated model for predicting rice phenotype characteristic values and yield.

2.2.2. Data Analysis and Processing

In this experiment, we enhanced the generalization capability of the model in unstable and ambiguous environments by introducing noise following a normal distribution, simulating potential fluctuations or errors that may occur in real-world data. Specifically, we utilized the numpy’s ‘random.normal()’ method to generate a random array with the same number of rows as the original data, where each element was drawn from a normal distribution with a mean of 0 and a standard deviation of 0.5. This introduced a certain degree of random variation to the original data. This approach is commonly used in data processing and analysis, providing a realistic representation of actual data conditions. During the experimental process, we collected 2048 data points encompassing five phenotypic traits of rice, including angle, panicle length, total branch length, grain number, and grain weight, all derived from the same rice panicle. As shown in Table 2, prior to constructing the yield prediction model, we merged the first and last rows of the dataset to calculate the average value, resulting in a single data point and halving the total data volume. Subsequently, we augmented the dataset with 1024 noise data points, setting the standard deviation of the noise to 0.05. The final sample dataset comprised 2048 data points, as illustrated in Table 3.
Figure 3, showing the relationship between phenotypic characteristics and yield in rice cultivation, illustrates the relationship between four phenotypic traits of rice and yield through scatter plots. It is evident that the distribution of the relationship between rice angle and yield is relatively uniform, indicating the absence of a specific linear trend between the two variables. Conversely, the relationships between rice panicle length, branch length, and grain number traits and yield exhibit a linear distribution, suggesting a significant positive correlation between these three traits and yield. Furthermore, within the relationships between panicle length and grain number and yield, it is noticeable that due to measurement errors, data input mistakes, and other factors, there are individual outliers within the sample. Therefore, it is necessary to address these anomalies during subsequent data processing.

3. Methodology

This study primarily involves experimental design, rice cultivation, the collection of rice phenotypic data, and data analysis to establish a rice phenotypic trait database. Seven distinct machine learning algorithms were selected to construct a yield prediction model group based on rice phenotypic data. After analyzing the prediction results of each model, three models with high accuracy and inter-model differences were chosen. The voting ensemble and stacking ensemble methods were employed to integrate these models, thereby creating an integrated model for predicting rice yield based on phenotypic data. The detailed experimental design is illustrated in Figure 4:

3.1. Handling of Anomalous Data

The Interquartile Range (IQR) method is capable of identifying outliers in data by calculating the lower and upper bounds. Any data points that fall below the lower bound or exceed the upper bound are deemed outliers and can be removed or replaced. Consequently, the data for this study followed a normal distribution. With this method, data points between the lower and upper bounds were selected, and the final dataset was obtained after removing the remaining missing values.

3.2. Algorithm Selection

This study integrated machine learning algorithms to construct precise yield prediction models based on phenotypic traits of rice, utilizing multiple linear regression, support vector machines, MLP, random forests, GBR, XGBoost, and LightGBM algorithms. The specific algorithms were the followng:
  • Multiple Linear Regression (LR)
Multivariate linear regression is a statistical method used to predict the relationship between a continuous dependent variable and two or more independent variables [34]. This method is founded on several key assumptions, including linearity, independent observations, normally distributed errors, and homogeneity of variance [35]. Its basic form can be expressed as in Equation (1):
y = β 0 + β 1 x i 1 + β 2 x i 2 + + β p x i p + ϵ i
In this context, y i represents the dependent variable, while x i1, x i2, …, x n denote the independent variables. β 0, β 1, …, β n are the parameters to be estimated, and ϵ i signifies the error term [36].
2.
Support Vector Machine (SVM)
A SVM separates data by finding a hyperplane that maximizes the distance between different categories of samples and this hyperplane [37]. For linearly separable data, when the data are not linearly separable, the SVM maps the original feature space into a higher–dimensional space using a kernel function, where a suitable hyperplane may be found.
3.
Multilayer Perceptron (MLP)
An MLP is a feedforward artificial neural network model consisting of multiple layers, including an input layer, hidden layers, and an output layer. Each node transforms signals through a nonlinear activation function, with commonly uses activation functions including Sigmoid, ReLU (Rectified Linear Unit), Tanh, etc., [38]. The learning process of an MLP typically employs the backpropagation algorithm to adjust weights, calculating the difference between the output and the true label to modify the weights within the network, thereby reducing the loss [39].
4.
Random Forest (RF)
Random forest is an ensemble learning method that constructs multiple decision trees for prediction and integrates their results to obtain the final outcome. Each tree is built based on a subset of the dataset. During the construction of each tree, a subset of features is randomly selected to increase diversity among the trees. In utilizing bootstrap sampling techniques to generate different training sets, it is possible to estimate the extent of the influence of each input feature on the final prediction outcome [40].
5.
Gradient Boosting Regression (GBR)
Gradient boosting is an iterative approach, wherein a new model is created at each iteration to attempt to correct the errors of the existing model ensemble. Gradient boosting regression (GBR) progressively optimizes the model by minimizing a loss function, commonly including the mean squared error [41]. The extent of model parameter updates during each iteration is controlled, with a smaller learning rate typically necessitating more iterations but potentially leading to superior generalization performance [42]. Overfitting can be prevented by adjusting parameters such as the maximum depth and the minimum number of leaf nodes.
6.
XGBoost
XGBoost is an optimized gradient boosting framework that incorporates regularization to mitigate overfitting and exhibits enhanced computational efficiency [43]. It is capable of handling large-scale datasets and supports a variety of loss functions.
7.
LightGBM
LightGBM is a gradient boosting-based framework developed by Microsoft, characterized by its rapid speed and minimal memory footprint. LightGBM employs techniques known as GOSS (Gradient-based One–Side Sampling) and EFB (Exclusive Feature Bundling) to expedite the training process [44].

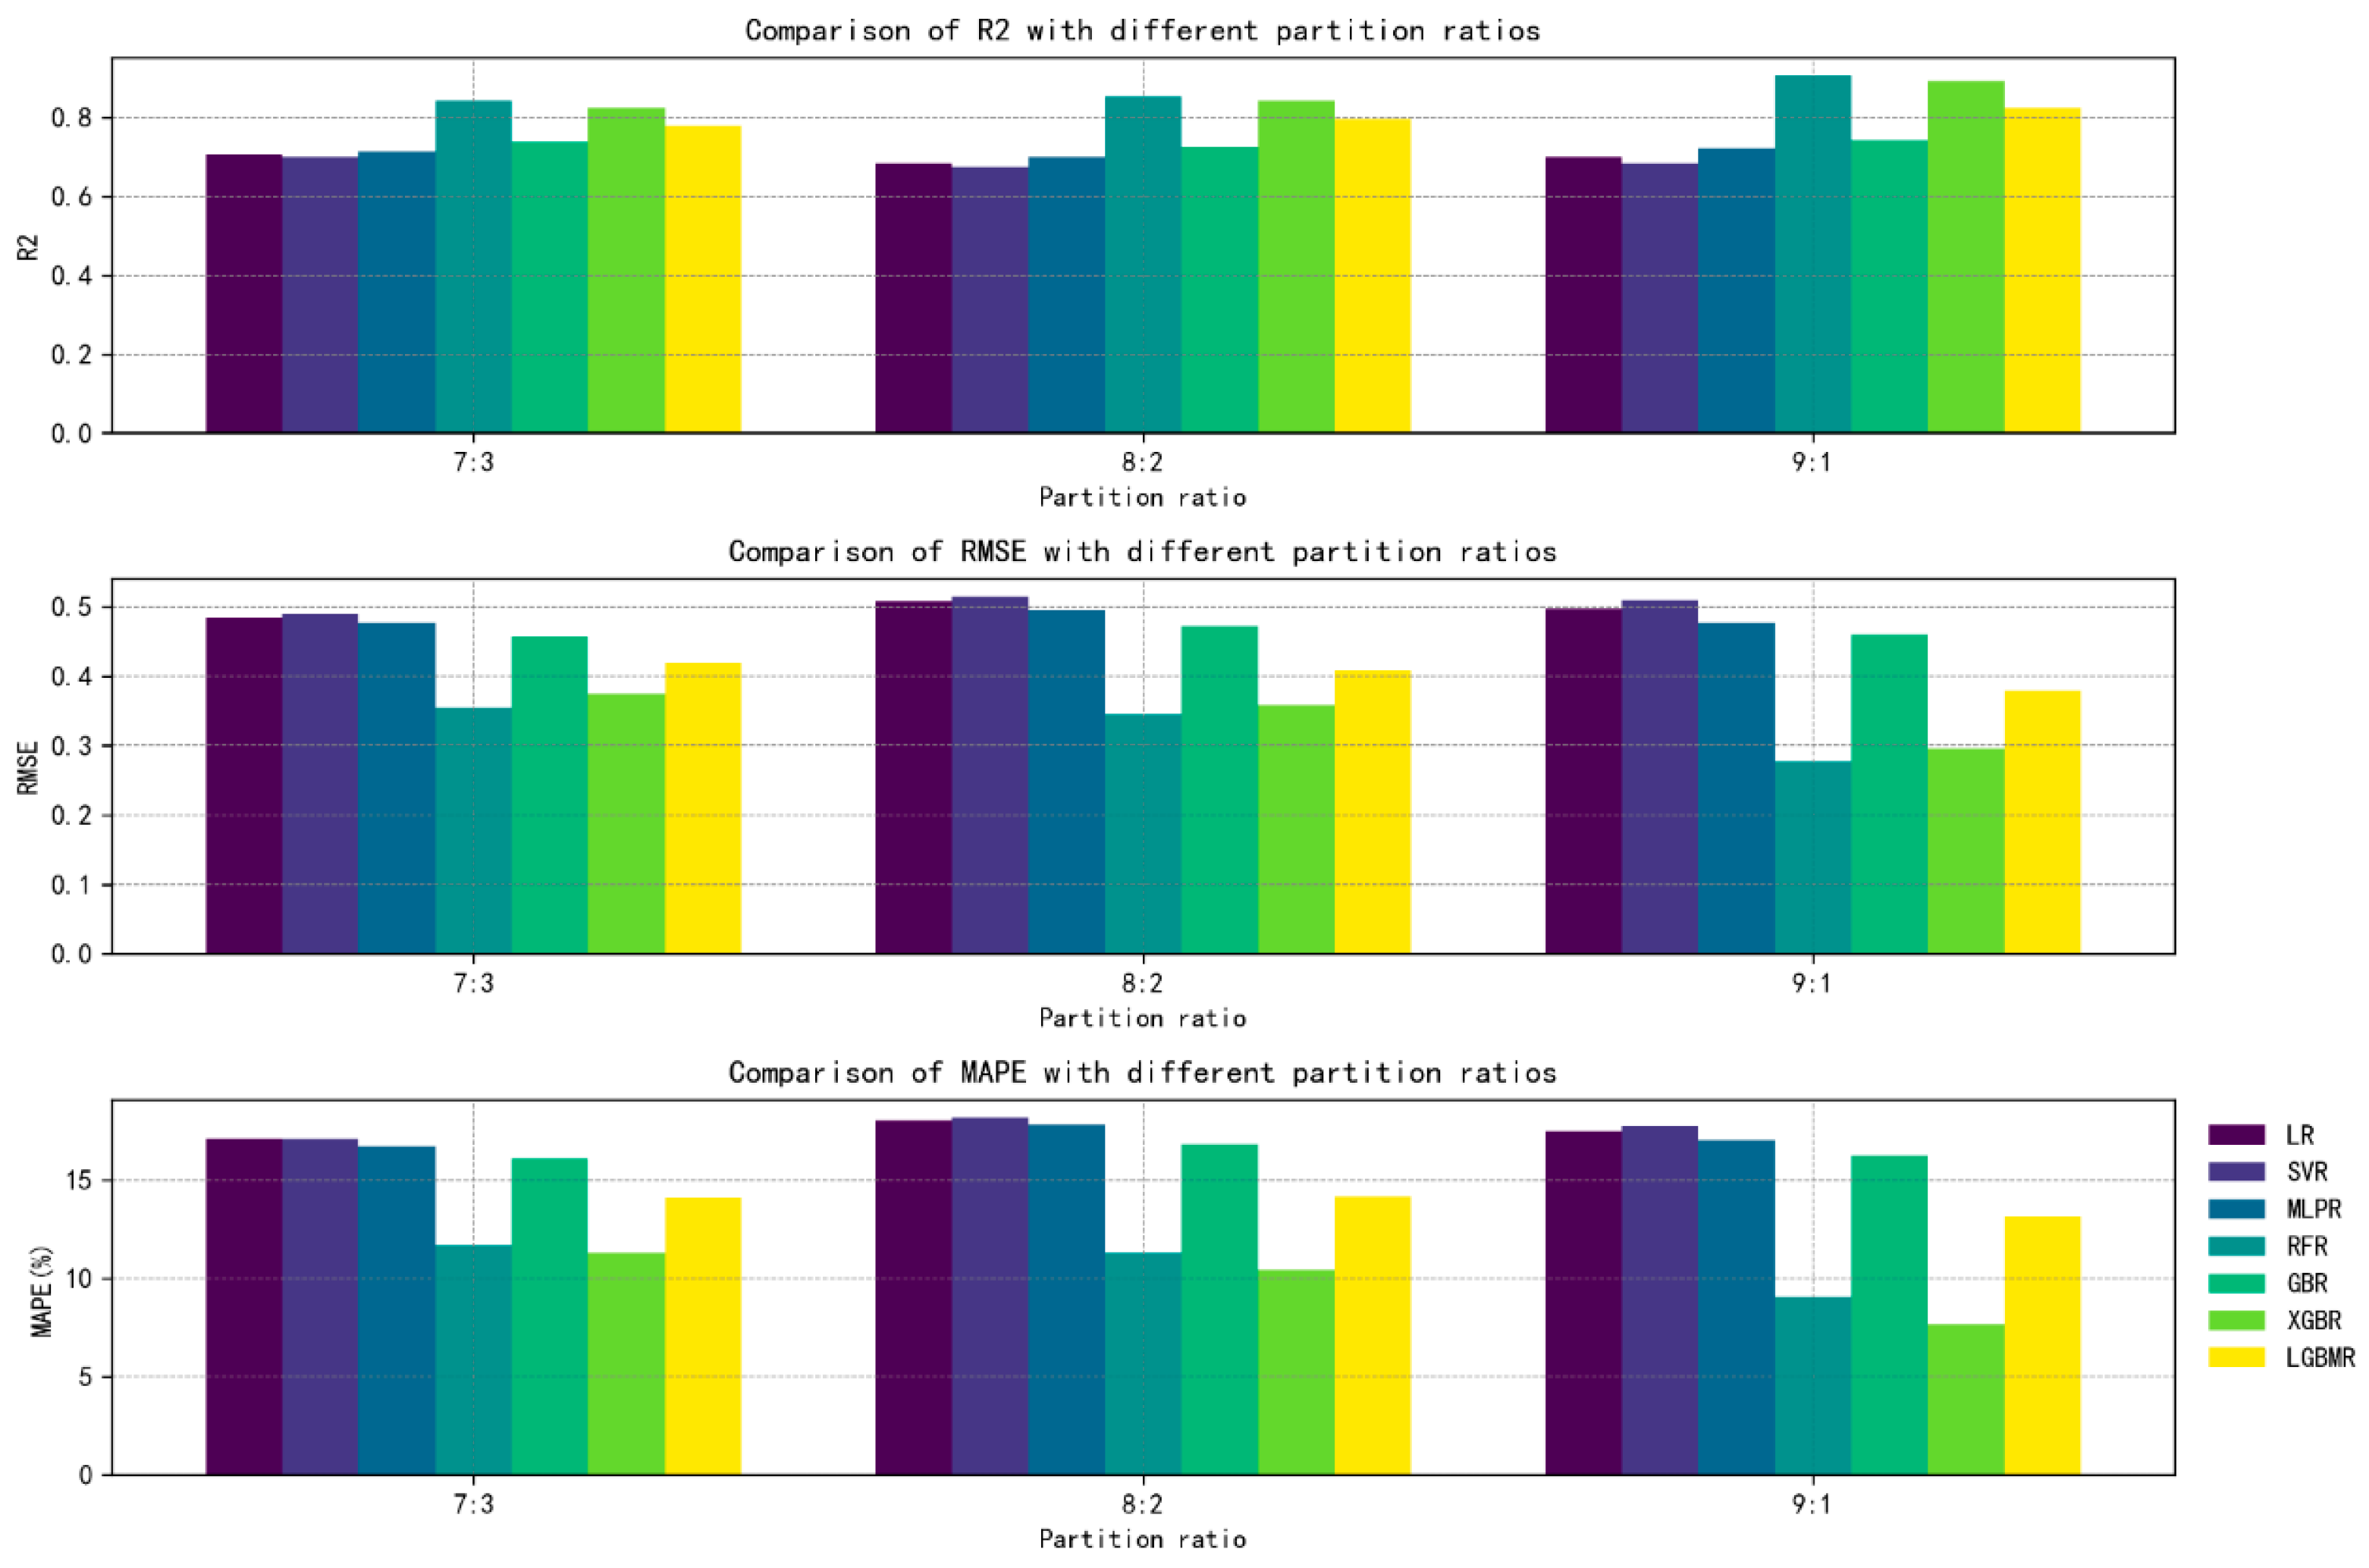
3.3. Dataset Partitioning

Prior to the adoption of machine learning modeling, we divided the training and testing datasets into three different ratios: 7:3, 8:2, and 9:1. After constructing the models, we compared the R2, RMSE, and MAPE evaluation metrics of the different models and selected the ratio corresponding to the model with the best performance as the dataset division ratio for experimental modeling. As shown in Figure 5, the 9:1 ratio demonstrated the best comprehensive performance across multiple models, including MLPR, SFR, XGBR, and LGBMR. Based on the data from this experiment, the optimal dataset division ratio for this experiment is 9:1.

3.4. Construction of a Yield Prediction Model Group for Rice Cultivation in Small Areas Based on the Integration of Multiple Machine Learning Techniques

Based on the rice phenotype dataset collected in this study, a group of yield prediction models based on rice phenotype data was constructed using various machine learning models (linear regression, support vector machine, multilayer perceptron, random forest, gradient boosting, LightGBM, XGBoost). During the collection process of rice phenotype data, issues such as human factors and instrument malfunctions may have led to missing or abnormal data. To enhance data quality and model prediction accuracy, data preprocessing was initially conducted, including deleting potential missing and duplicate rows, followed by the removal of outliers using the upper and lower truncation method. With the use of the angle (°), panicle length (cm), total branch length (cm), and total grain count (grains) as features, and yield (g) as the label, the feature set was standardized, and the data were divided into a 9:1 ratio of training and testing sets. Through utilizing Python3.9 libraries such as scikit–learn1.5, xgboost2.0.3, and lightgbm4.3.0, various machine learning regression models were constructed, and three performance evaluation metrics—root mean square error (RMSE), determination coefficient (R-Square, R2), and mean absolute percentage error (MAPE)—were employed to assess model performance.

3.5. Rice Yield Prediction Model Based on Stacking Ensemble Learning

A single machine learning model exhibits deficiencies in terms of accuracy and generalization capabilities. To address this issue, this study employed an ensemble learning approach to integrate multiple machine learning models in order to enhance the accuracy of yield prediction. When selecting base models for ensemble learning, it is necessary to achieve moderate diversity. Initially, the three models with the highest accuracy among the individual models were chosen, ensuring that there is a modest difference in accuracy while maintaining structural diversity among the models. Ensemble learning models were constructed using both voting ensemble and stacking ensemble methods to identify the most suitable ensemble approach for the rice yield prediction task. The voting ensemble method involves voting based on the outputs of the three base models to obtain the prediction results, while the stacking ensemble method selects three base models and a meta–model. The meta–model employs a linear regression algorithm to combine the outputs of the three base models to produce the prediction results. The evaluation metrics for ensemble learning methods also included the root mean square error, determination coefficient, and mean absolute percentage error.

3.6. Establishment of Evaluation Metrics

This study employed the root mean square error (RMSE), the coefficient of determination (R-Square), and the mean absolute percentage error (MAPE) as evaluation metrics for the rice yield prediction model. The characteristics of these metrics are as follows:
  • Root Mean Square Error (RMSE)
The root mean squared error (RMSE) is a metric used to assess the accuracy of predictive models on continuous data. It represents the average deviation between the predicted and actual values by calculating the root mean square of the difference between them. The formula is presented in Equation (2).
R M S E = 1 N i = 1 n y i y ^ i 2
In this context, y i denotes the true value, while y ^ i represents the predicted value.
2.
Coefficient of Determination (R-Square)
The coefficient of determination (R-Square), also known as R2, is an evaluation metric used to assess the accuracy of a linear model. Its value ranges from 0 to 1. As the value approaches 1, it indicates better model performance, whereas a value closer to 0 signifies poorer model performance. The formula for R-Square is presented in Equations (3)–(5):
S S E = i = 1 n y i y ^ i 2
S S T = i = 1 n y i y ¯ 2
R 2 = 1 SSE SST
In this context, SSE denotes the sum of squared errors, SST signifies the total sum of squares, y i represents the true value, y ^ i indicates the predicted value, and y ¯ represents the mean.
3.
Mean Absolute Percentage Error (MAPE)
The mean absolute percentage error (MAPE) quantifies the accuracy of a model’s predictions by calculating the absolute difference between the predicted and actual values, dividing this difference by the actual value, and then averaging these values. This formula provides a percentage interpretation of the model’s prediction accuracy. The formula is presented in Equation (6).
M A P E = 1 n t = 1 n y t y ^ t y t
In this context, y t denotes the true value, while y ^ t t represents the predicted value.

4. Results

The hardware configuration of this study comprises a 12th Gen Intel(R) Core(TM) i9–12900H processor and 32 GB of memory, with all experiments conducted in a CPU environment. In terms of software, PyCharm 2022.4 was utilized as the development environment, Python 3.9 was employed as the programming language, and the machine learning libraries included scikit–learn 1.5, xgboost 2.0.3, and lightgbm 4.3.0. For plotting, matplotlib 3.9.4 and seaborn 0.13.2 were utilized.

4.1. Analysis of the Results Obtained by Constructing a Rice Yield Prediction Model Using Various Machine Learning Algorithms

Seven machine learning algorithms, namely linear regression, support vector machine, multilayer perceptron, random forest, gradient boosting, LightGBM, and XGBoost, were employed to construct rice yield prediction models and subjected to comparative analysis.
To achieve optimal results for each model, we configured the hidden layer parameters of the multilayer perceptron algorithm to be (100, 50, 25), set the regularization parameter alpha to 0.01, and adopted default parameters for all other models. Additionally, we designated the random seed random_stat to be 42 to facilitate the replication of experimental results.
According to Table 4, for a single machine learning model, random forest, LightGBM, and XGBoost are capable of enhancing performance by constructing multiple base learners, achieving commendable results on the test set. Among them, the random forest model, due to its resistance to overfitting and strong generalization ability, performs better in terms of the determination coefficient and root mean square error. Conversely, XGBoost excels in the mean absolute percentage error metric. This indicates that different machine learning models possess their respective advantages, and it is challenging to evaluate the superiority among individual models when using a single model as a rice yield prediction model.

4.2. Performance Analysis of Rice Yield Prediction Model Based on Ensemble Learning in a Small Area

In order to fully utilize the advantages of different machine learning models, this study adopted two ensemble methods: voting and stacking. The three machine learning models with the highest prediction accuracy (coefficient of determination) (random forest, LightGBM, XGBoost) aim to obtain a comprehensive model with the highest prediction accuracy and the smallest error. In order to further optimize the integration effect, the experiment also compared the integration effect of selecting only the two models with the highest prediction accuracy and selecting three models, in order to evaluate the impact of different integration strategies on the final model performance. The experimental results are shown in Table 5.
In Table 5, “2m” denotes the selection of the first two models with the highest accuracy, while “3m” indicates the selection of the top three models. The three models used for ensemble, in descending order of accuracy, are random forest, XGBoost, and LightGBM. Among them, the voting method, after selecting the top two models with the highest accuracy, improved its performance in various metrics. This is due to the fact that the voting method obtains prediction results by averaging and integrating multiple models. For the stacking method, the performance is optimal when selecting three models, i.e., the RMSE, R2, and MAPE of Stacking–3m reached 0.2483, 0.9250, and 6.90%, respectively. Compared with the optimal results of evaluation metrics in a single machine learning model, the root mean square error decreased by 10.58%, the determination coefficient increased by 1.88%, and the mean absolute percentage error decreased by 0.76%. The model after stacking integration further improved upon the basis of a single model. In summary, selecting the appropriate model and ensemble method has better accuracy and applicability compared to a single model.

4.3. Comparative Analysis of Rice Yield Prediction Models Based on Ensemble Learning Versus Non–Ensemble Learning Approaches

Figure 6 illustrates the comparison between the predicted values and the actual values of the random forest model and the stacked ensemble model, which exhibit the best performance among single machine learning models, on the test set. In this figure, each point represents a sample from the test set, with the abscissa indicating the actual value of the sample and the ordinate indicating the predicted value. The black dashed line represents the scenario of perfect prediction, where the predicted values align with the actual values. Upon observing the distribution of the scatter plot, it becomes evident that, aside from a few samples with excessively high yield values, the distribution of predicted points for the stacked ensemble model is more concentrated than that of the random forest model, indicating that the former model exhibits superior performance in yield prediction.

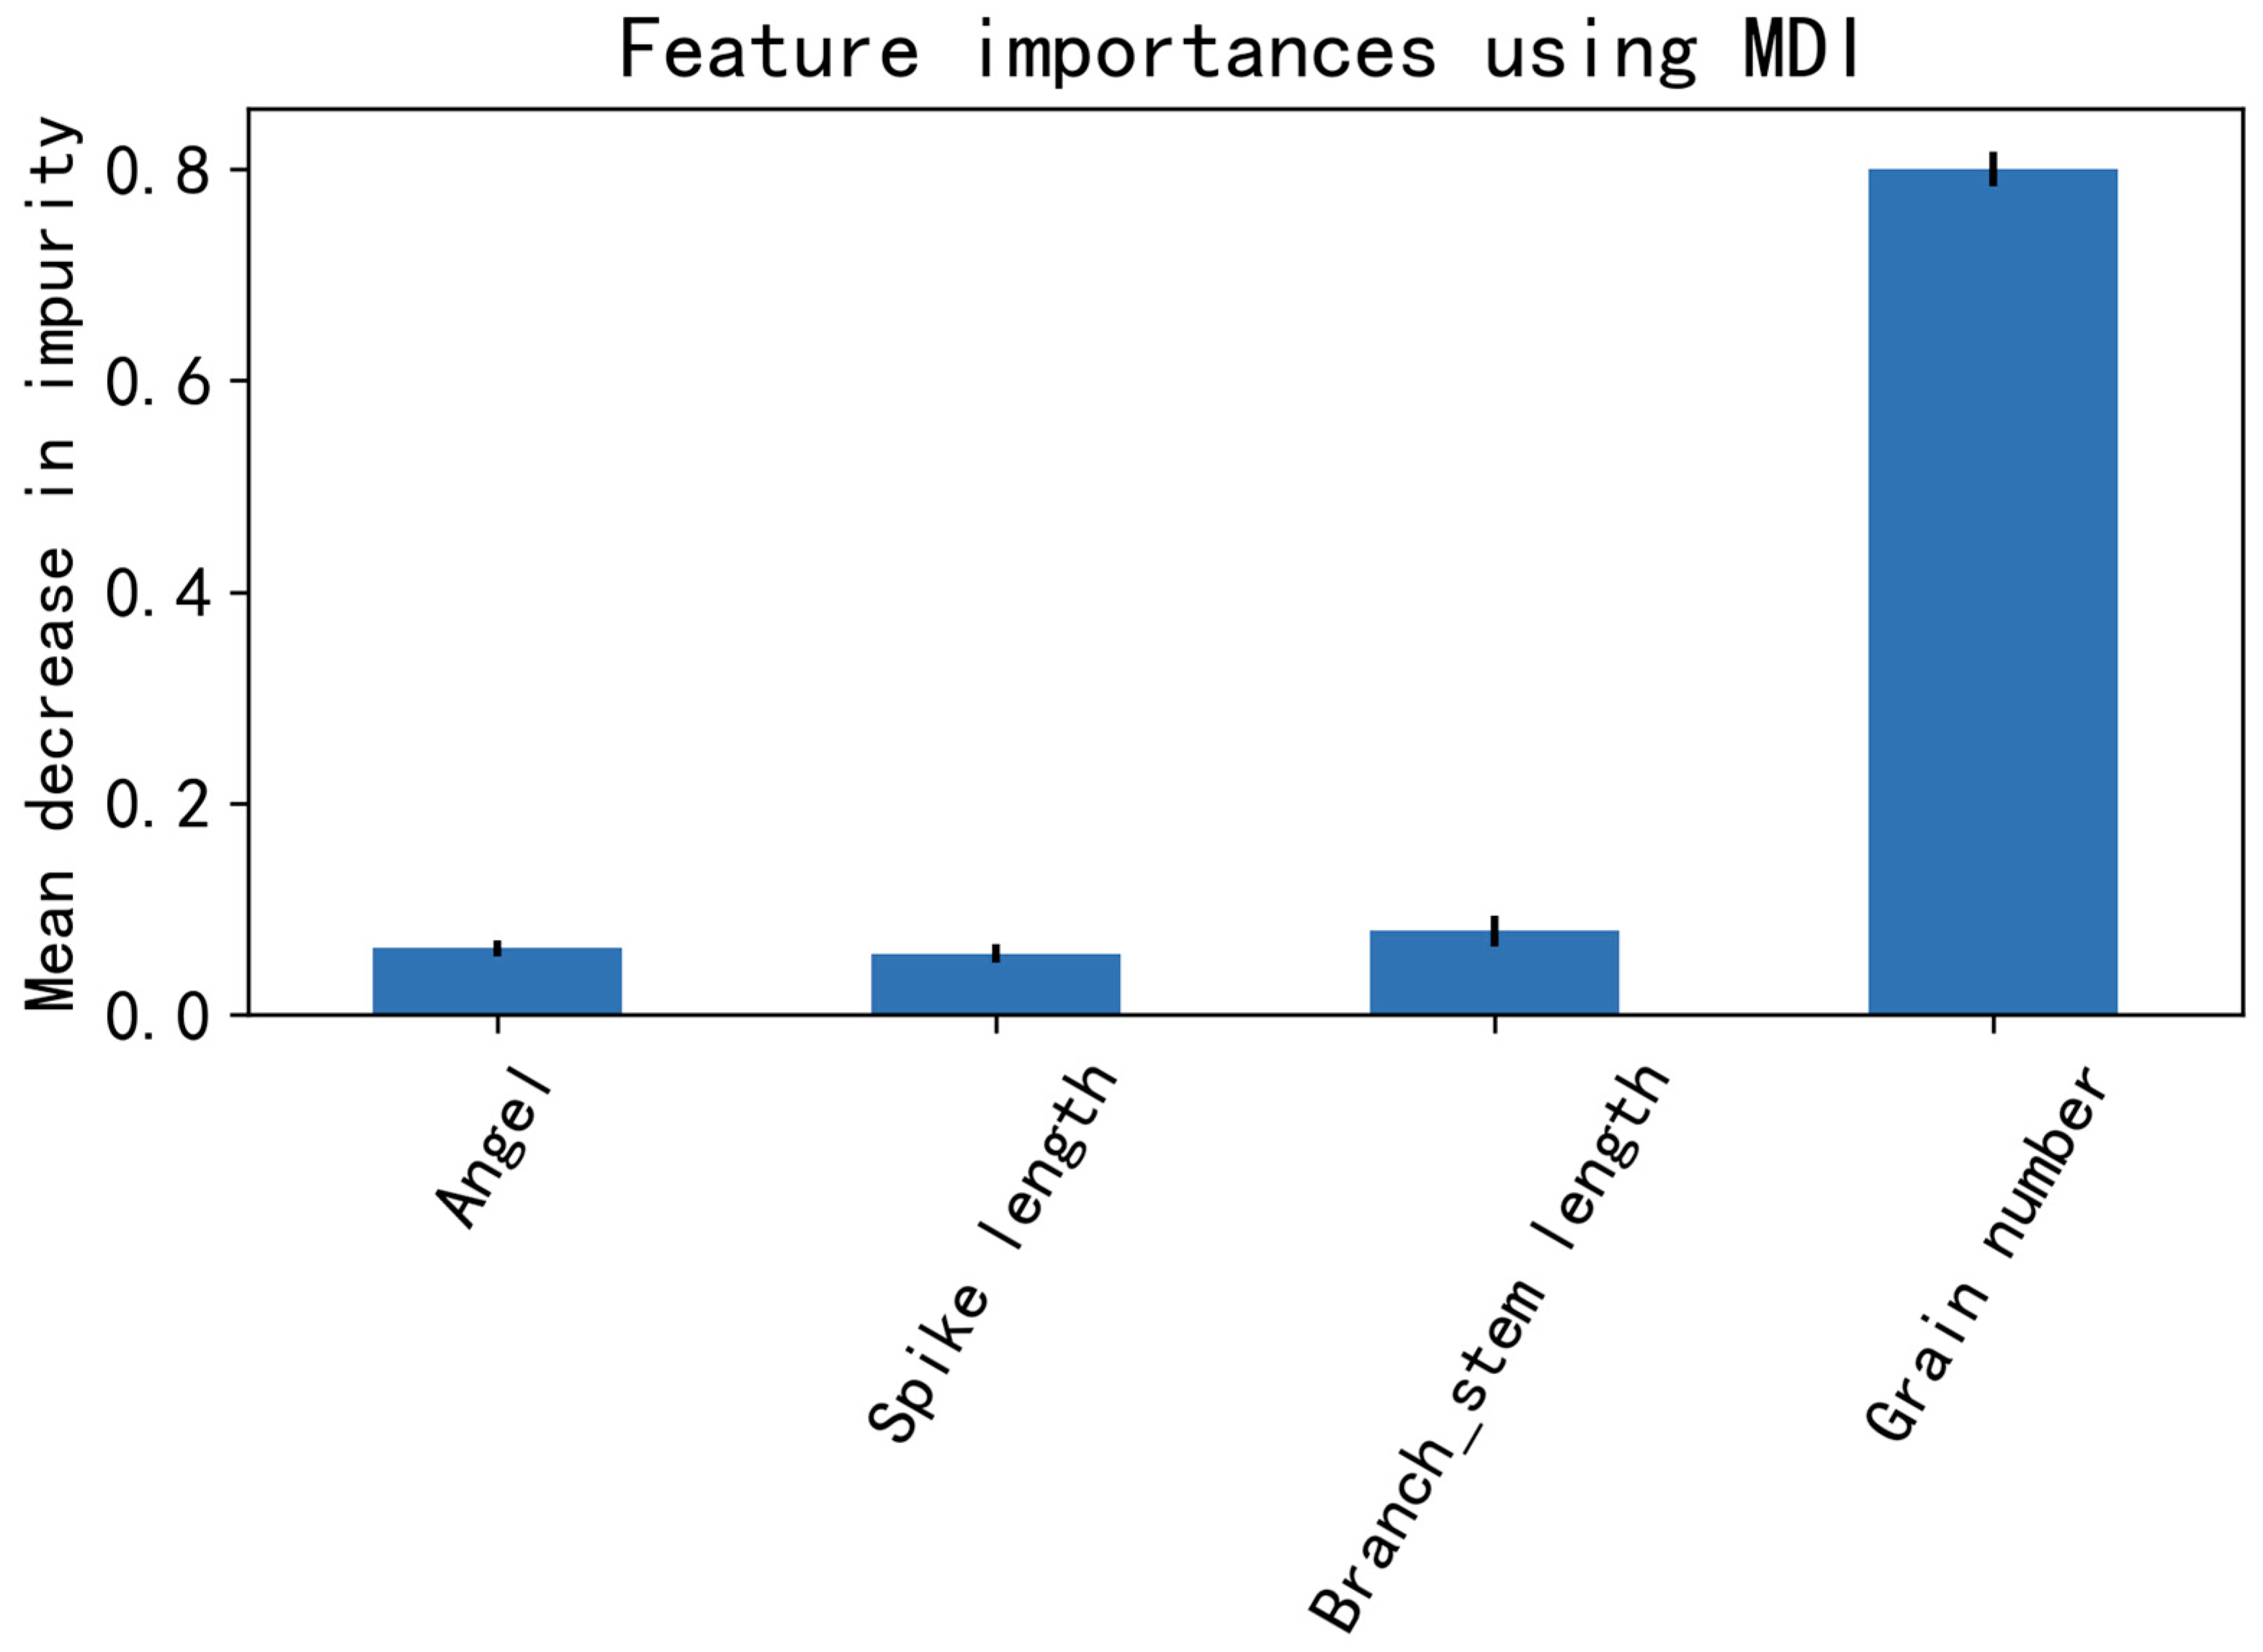
4.4. The Impact of Important Phenotypic Characteristics on the Performance of Integrated Models

To investigate the impact of different rice phenotypic traits on the performance of the stacking model, this section conducted experiments ranging from a single trait to four traits. Given that trait selection is one of the key factors affecting the performance of machine learning models, this experiment aimed to evaluate the influence of varying numbers of traits on the model’s predictive accuracy, as well as to determine whether there exists an optimal subset of traits that yields the best predictive performance for the model. The experimental results are detailed in Figure 7.
In Figure 7, the labels “0”, “1”, “2”, and “3” on the x–axis represent four influencing factors—angle, spike length, total branch length, and total grain count—which are four characteristic values affecting yield. According to the experimental results, in the stacked model from a single feature to four features, models with different feature combinations exhibit certain differences in performance. When the model includes the three features of angle (0), spike length (1), and total branch length (2), the RMSE reaches a minimum value of 0.2364; when the model includes the three features of angle (0), total branch length (2), and total grain count (3), the R2 reaches a maximum value of 0.9291, and the MAPE reaches a minimum value of 6.74%. This indicates that selecting an appropriate subset of features affects the predictive performance of the model. As the number of features increases, the performance metrics of the model do not always increase monotonically. Although the model did not exhibit the best performance when including all four features, compared to the other two three–feature models that performed optimally on certain evaluation metrics, the full–feature model exhibited better balance across various evaluation metrics. This suggests that although certain feature combinations may improve performance on specific metrics, selecting all features helps maintain a balanced performance of the model across different evaluation metrics.
Furthermore, the experimental results reveal that the feature combination encompassing the angle and total branch length exhibited superior performance across multiple performance metrics, whether used individually or in conjunction with other features. In calculating the significance of different features on yield using the random forest algorithm, as illustrated in Figure 8, it is evident that the number of grains has the greatest impact on rice yield, with a value reaching 0.8. In contrast, the angle, panicle length, and total branch length have lesser effects on rice yield, with values of 0.063, 0.058, and 0.079, respectively. The findings indicate that the interaction of the angle and total branch length features significantly influences rice yield prediction. Combining the most and least significant features may yield better prediction results.

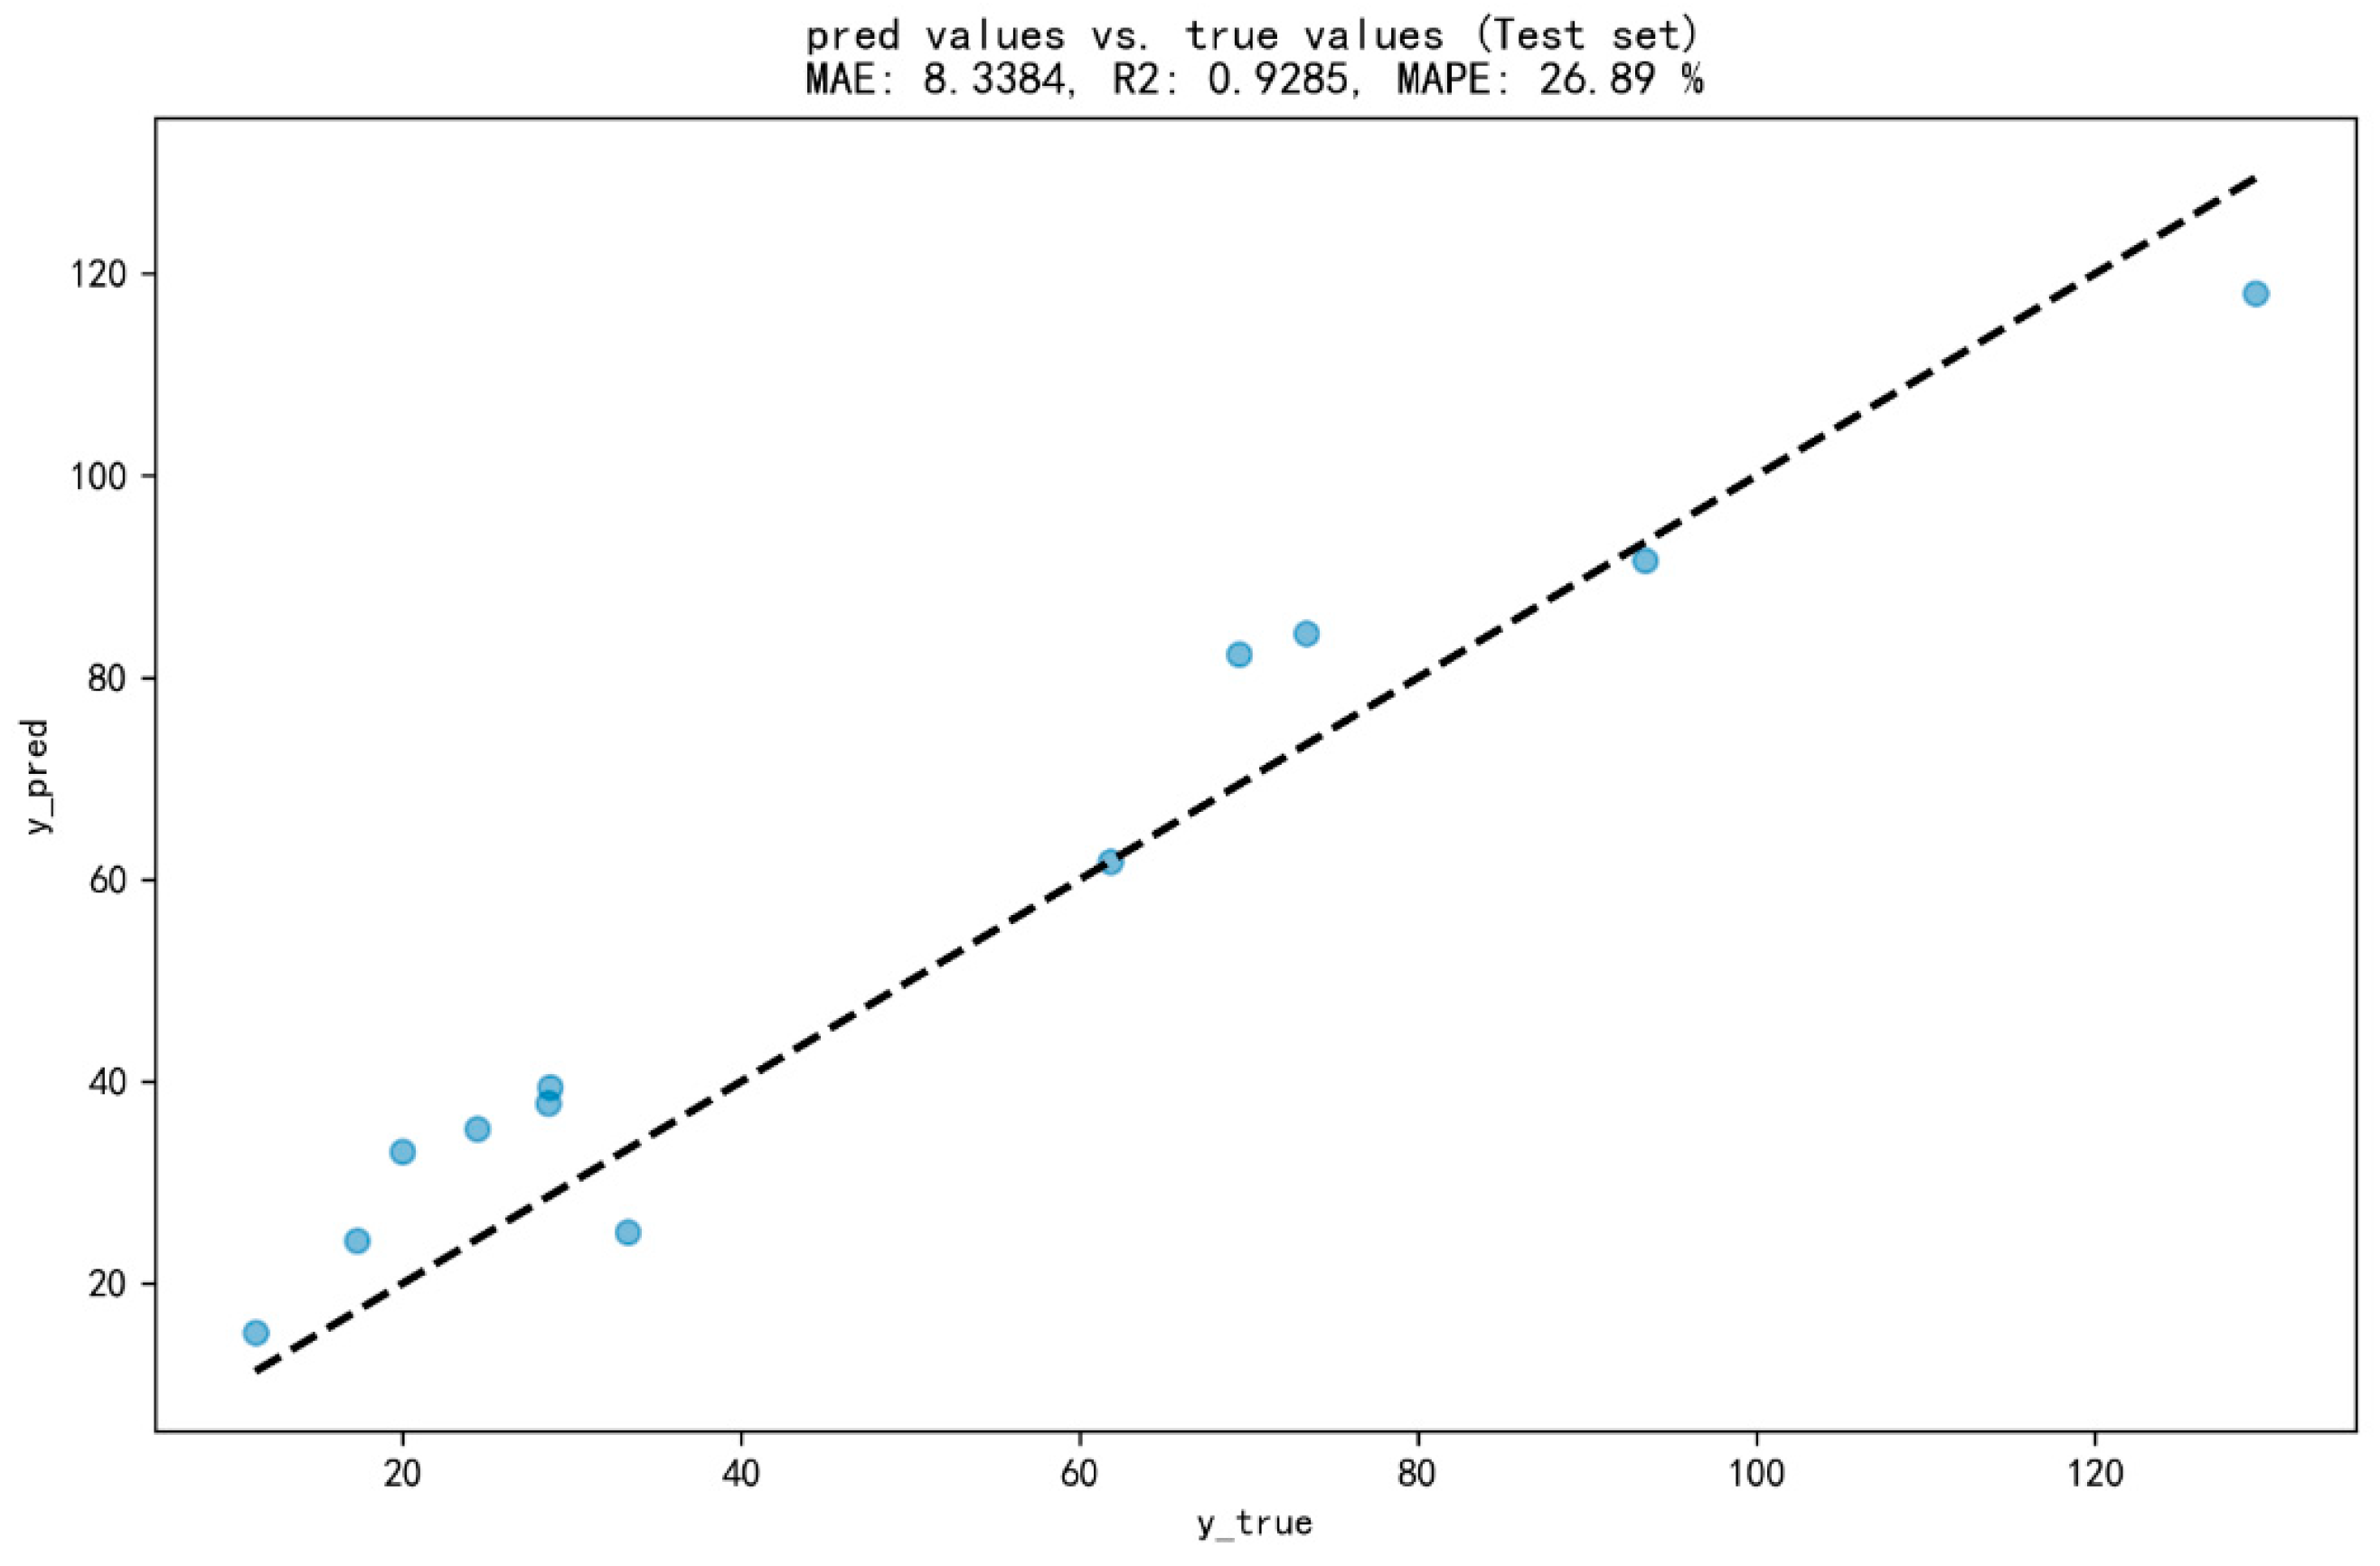
4.5. Validation of Yield Prediction Model Based on Phenotypic Characteristics of Rice Grown in Small–Scale Plantations

In the small-scale yield verification experiment, we selected the Stacking–3m model, which demonstrated the best comprehensive evaluation metrics, for validation. Initially, after exporting the Stacking–3m model, we predicted the single-spike yield values for 12 randomly selected samples. Subsequently, we calculated the yield for the small area by multiplying the predicted single-spike yield by the corresponding number of spikes. As illustrated in Figure 8, the evaluation metrics of the MAE, R2, and MAPE in the prediction were 8.3384, 0.9285, and 0.2689, respectively. Finally, we compared the predicted small-scale yields with the actual measurements of the small-scale products, as shown in Figure 9. The predicted values and the actual values were both clustered around the diagonal line of “Predicted Value = Actual Value”. This indicates that the selected Stacking–3m model can achieve satisfactory results in predicting the yields for small areas.

5. Discussion

5.1. Comparative Analysis of the Performance of Different Machine Learning Algorithms

The experimental results, as depicted in Figure 10, reveal that the performance of seven machine learning algorithms in constructing a rice yield prediction model varies significantly. Among them, the performance of the random forest, LightGBM, and XGBoost models surpasses that of the linear regression, support vector machine, multilayer perceptron (MLP), and gradient boosting models. This may primarily be attributed to the superior predictive accuracy of ensemble algorithms based on Bagging and Boosting, such as random forest, LightGBM, and XGBoost. These algorithms enhance the overall predictive performance by combining the prediction results of multiple decision trees through various methods, thereby reducing the risk of overfitting and enhancing the model’s generalization ability. Additionally, XGBoost exhibits the best performance in terms of the MAPE, possibly due to the presence of certain yield values in the dataset that occur more frequently than others. XGBoost excels at handling imbalanced datasets, enabling accurate predictions of rice yields. Among the other four algorithms used to construct rice yield prediction models, the accuracy of the MLP and gradient boosting models surpasses that of the linear regression and support vector machine models. This may be attributed to the MLP’s ability to perform a high–level abstraction and classification of the input data through multiple layers of nonlinear transformations, resulting in superior model performance compared to ordinary neural network algorithms. Gradient boosting excels at handling various types of datasets and excels at dealing with outliers and noise. However, the model computation time is relatively long and prone to overfitting. The performance of the linear regression and support vector machine models is relatively poor. This may be due to linear regression’s inability to fit nonlinear data well, and the performance of the support vector machines is significantly influenced by parameters such as the kernel function and penalty coefficient. Inappropriate parameter values may lead to decreased model performance.

5.2. Propose a Method for Constructing a Precise Prediction Model of Rice Yield Based on Various Influencing Factors

In yield prediction, it is ideal for the model to exhibit robustness and maintain predictive accuracy that is minimally influenced by a variety of factors, particularly when predicting crop yields with unknown specific varieties [45,46]. This study primarily considers phenotypic traits of rice as the primary factors affecting rice yield, circumventing the influence of different rice varieties. The specific construction approach involves utilizing the collected four phenotypic trait values as influencing factors for the integrated model of rice phenotypic trait value-based yield prediction. Through the selection of machine learning algorithms, model construction, model integration, and comparative analysis, we developed a Stacking–3m integrated model. Although the performance of this model was relatively good, it was not proven to be the optimal model throughout the experiment. This was primarily reflected in the inability to determine whether these four influencing factors were the optimal ones. Therefore, this study adopted a method of gradually reducing the number of influencing factors to adjust the different combinations among them (by labeling the four influencing factors as “0”, “1”, “2”, and “3”), forming 14 different combinations of influencing factors, including “0”, “1”, “2”, “3”, “0, 1”, “0, 2”, “0, 3”, “1, 2”, “1, 3”, “2, 3”, “0, 1, 2”, “0, 1, 3”, “0, 2, 3”, and “0, 1, 2, 3”. Using these 14 different combinations as influencing factors, we employed the Stacking–3m integrated model group and compared and analyzed the performances of these models. The implementation results show that this method can circumvent the phenomenon of model performance being affected by unreasonable combinations of influencing factors. During the experiment, it was also found that increasing the number of features does not always improve model performance, which may be due to the fact that an increase in the number of models can lead to more complex models, and some features may have a counterproductive effect on model predictions, resulting in overfitting. Therefore, selecting appropriate feature values has a significant impact on improving the predictive performance of the model. Additionally, the combination of rice phenotypic trait values, including angle and total branch length, demonstrated superior performance across multiple performance indicators. This phenomenon may be attributed to the direct correlation between these two features and rice growth conditions and yield. The size of the angle significantly affects the photosynthetic efficiency of rice, while the total branch length is closely related to the number and structure of spikes, both of which play a decisive role in the final yield of rice. Therefore, they can be considered key reference indicators for predicting rice yield.

5.3. A Low–Cost and High–Efficiency Method for Predicting Rice Yield Has Been Proposed

Recent methods for predicting rice yield primarily rely on predictive models constructed based on climatic data, multispectral data, and satellite data. Researchers such as Seungtaek Jeong [47] have integrated deep learning and remote sensing technologies to propose a rice yield prediction model, which accurately predicts rice yields in the Korean Peninsula region. Hongkui Zhou and colleagues [48] constructed a CNN–M2D model for predicting rice yields, based on multispectral remote sensing images from drones combined with machine learning and deep learning algorithms. The prediction results were as follows: RRMSE = 8.13% and R2 = 0.73. Djavan De Clercq and colleagues [49] utilized 20 years of climatic, satellite, and rice yield data from 247 rice-producing regions in India, employing 19 machine learning models to construct a rice yield prediction model for the early prediction of rice yields. Additionally, Chu and Jiong et al. [50] utilized recurrent neural networks to predict rice yields in 81 counties in southern China. Weiguo and colleagues [51] conducted yield predictions for field- and county-level rice based on synthetic aperture radar (SAR) and optical and meteorological data. These researchers primarily focused on predicting rice yields within regions above the county level. The Stacking–3m model constructed in this study serves as a rice yield prediction model capable of accurately detecting rice yields within a small area. This aligns with the literature emphasizing that machine learning modeling can enhance model performance and surpass standard crop simulation models [52,53,54,55]. Consequently, this study fills the gap in constructing yield prediction models using crop phenotypic data and crop modeling, integrating ensemble algorithms to construct the Stacking–3m model, addressing the limitations of traditional crop models with poor performance due to the need to integrate remote sensing data [56,57,58]. Simultaneously, many studies have adopted empirical model-based end-to-end learning methods to predict crop yields [59,60]. However, these empirical models often fail to capture the complex processes affecting crop yields [47]. It is necessary to independently analyze and meticulously record the key characteristics of crops during their critical growth stages. This study required only the input of phenotypic trait values for rice to accurately predict its yield. This approach eliminates traditional measurement steps such as threshing, drying, cleaning, and weighing. Furthermore, the model exhibits strong practicality; the greater the input data volume, the higher the model’s accuracy. After inputting different rice varieties, it can achieve precise predictions for yields of various rice types. Lastly, the model’s scalability is robust, enabling its application to yield predictions for different cereal crops. Consequently, the Stacking–3m model not only reduces the cost associated with traditional rice yield measurement methods but also extends its application to various cereal crops, effectively addressing the challenges of cumbersome operational procedures, high costs, lengthy timeframes, substantial workload, and significant errors inherent in traditional crop yield prediction processes.

5.4. Limitations and Future Research Directions of Integrated Yield Prediction Model Based on Rice Phenotypic Characteristics

Although the Stacking–3m ensemble model constructed in this study theoretically exhibits high predictive accuracy, there are certain challenges and costs associated with data acquisition, processing, and analysis. Additionally, the data in this study primarily originated from the Yunnan Dianhe 615 rice variety, and the validation experiments were also conducted using this variety of rice planted by us. For other regions or different rice varieties, targeted adjustments and optimizations may be necessary. Therefore, for the next step of our research, we plan to collect phenotypic trait values of rice ears in the fully mature stage from different regions, such as Chuxiong City and Jianshui County, and varieties to enhance the accuracy and practical scope of the model. Furthermore, during the model validation process, we will incorporate phenotypic data of rice ears from different regions, such as Chuxiong City, and varieties to increase the diversity and scale of validation data, thereby more accurately assessing the model’s performance.
Furthermore, the novel approach we propose involves the integration of a machine learning algorithm with rice phenotypic data to construct an intelligent model. Recent studies lend support to our perspective on the modeling approach for predicting rice yield. For instance, integrating machine learning with crop growth data enhanced the model’s performance, achieving scalability across diverse crops and environments [61,62].
The Stacking–3m model constructed in this study serves as the optimal model for an integrated model based on phenotypic characteristics of rice cultivated in small areas for yield prediction. Apart from demonstrating satisfactory performance in predicting rice yield, this model is also applicable to the yield prediction of cereal crops such as wheat and rye. Taking wheat yield prediction as an example, we explore the application of the Stacking–3m model in this field. Initially, once wheat enters the mature stage, the main phenotypic characteristics (grain length, thousand-grain weight, spikelet number, plant height, etc.) measured using the phenotypic detector TPS–BX–1 (including the “ZhiZhong” APP), along with the weight of each spike, are used as the dataset for modeling. By incorporating noise from a normal distribution, the model’s generalization ability in unstable and ambiguous environments is enhanced, simulating potential fluctuations or errors in actual data to form the test and validation sets for modeling. The aforementioned data are inputted into Stacking–3m for training, directly outputting wheat yield prediction data, thus achieving wheat yield prediction. Consequently, the Stacking–3m model can be widely applied to the yield prediction of cereal crops, providing a practical and highly applicable model for farmers and crop planting enterprises.
Owing to the capability of agricultural IoT systems to facilitate real-time monitoring, intelligent control, remote management, and the early warning of anomalies for cultivated crops, coupled with the ability to analyze and process collected data to provide precise data support for constructing intelligent predictive models, integrating the Stacking–3m model developed in this study with agricultural IoT systems can expand the model’s practicality. Initially, agricultural IoT systems are capable of collecting phenotypic data for cereal crops such as wheat and rye in real time, enabling the real-time monitoring of crop growth processes by capturing parameters like temperature, humidity, soil moisture, and light intensity. The data are then transmitted to a data center via wireless communication networks. Consequently, we can further augment the parameters of the Stacking–3m model, continuously refining its performance. Simultaneously, when constructing new crop yield prediction models, we can directly build models using datasets from the data center, accurately predicting the yields of cereal crops like wheat, rice, and rye.

6. Conclusions

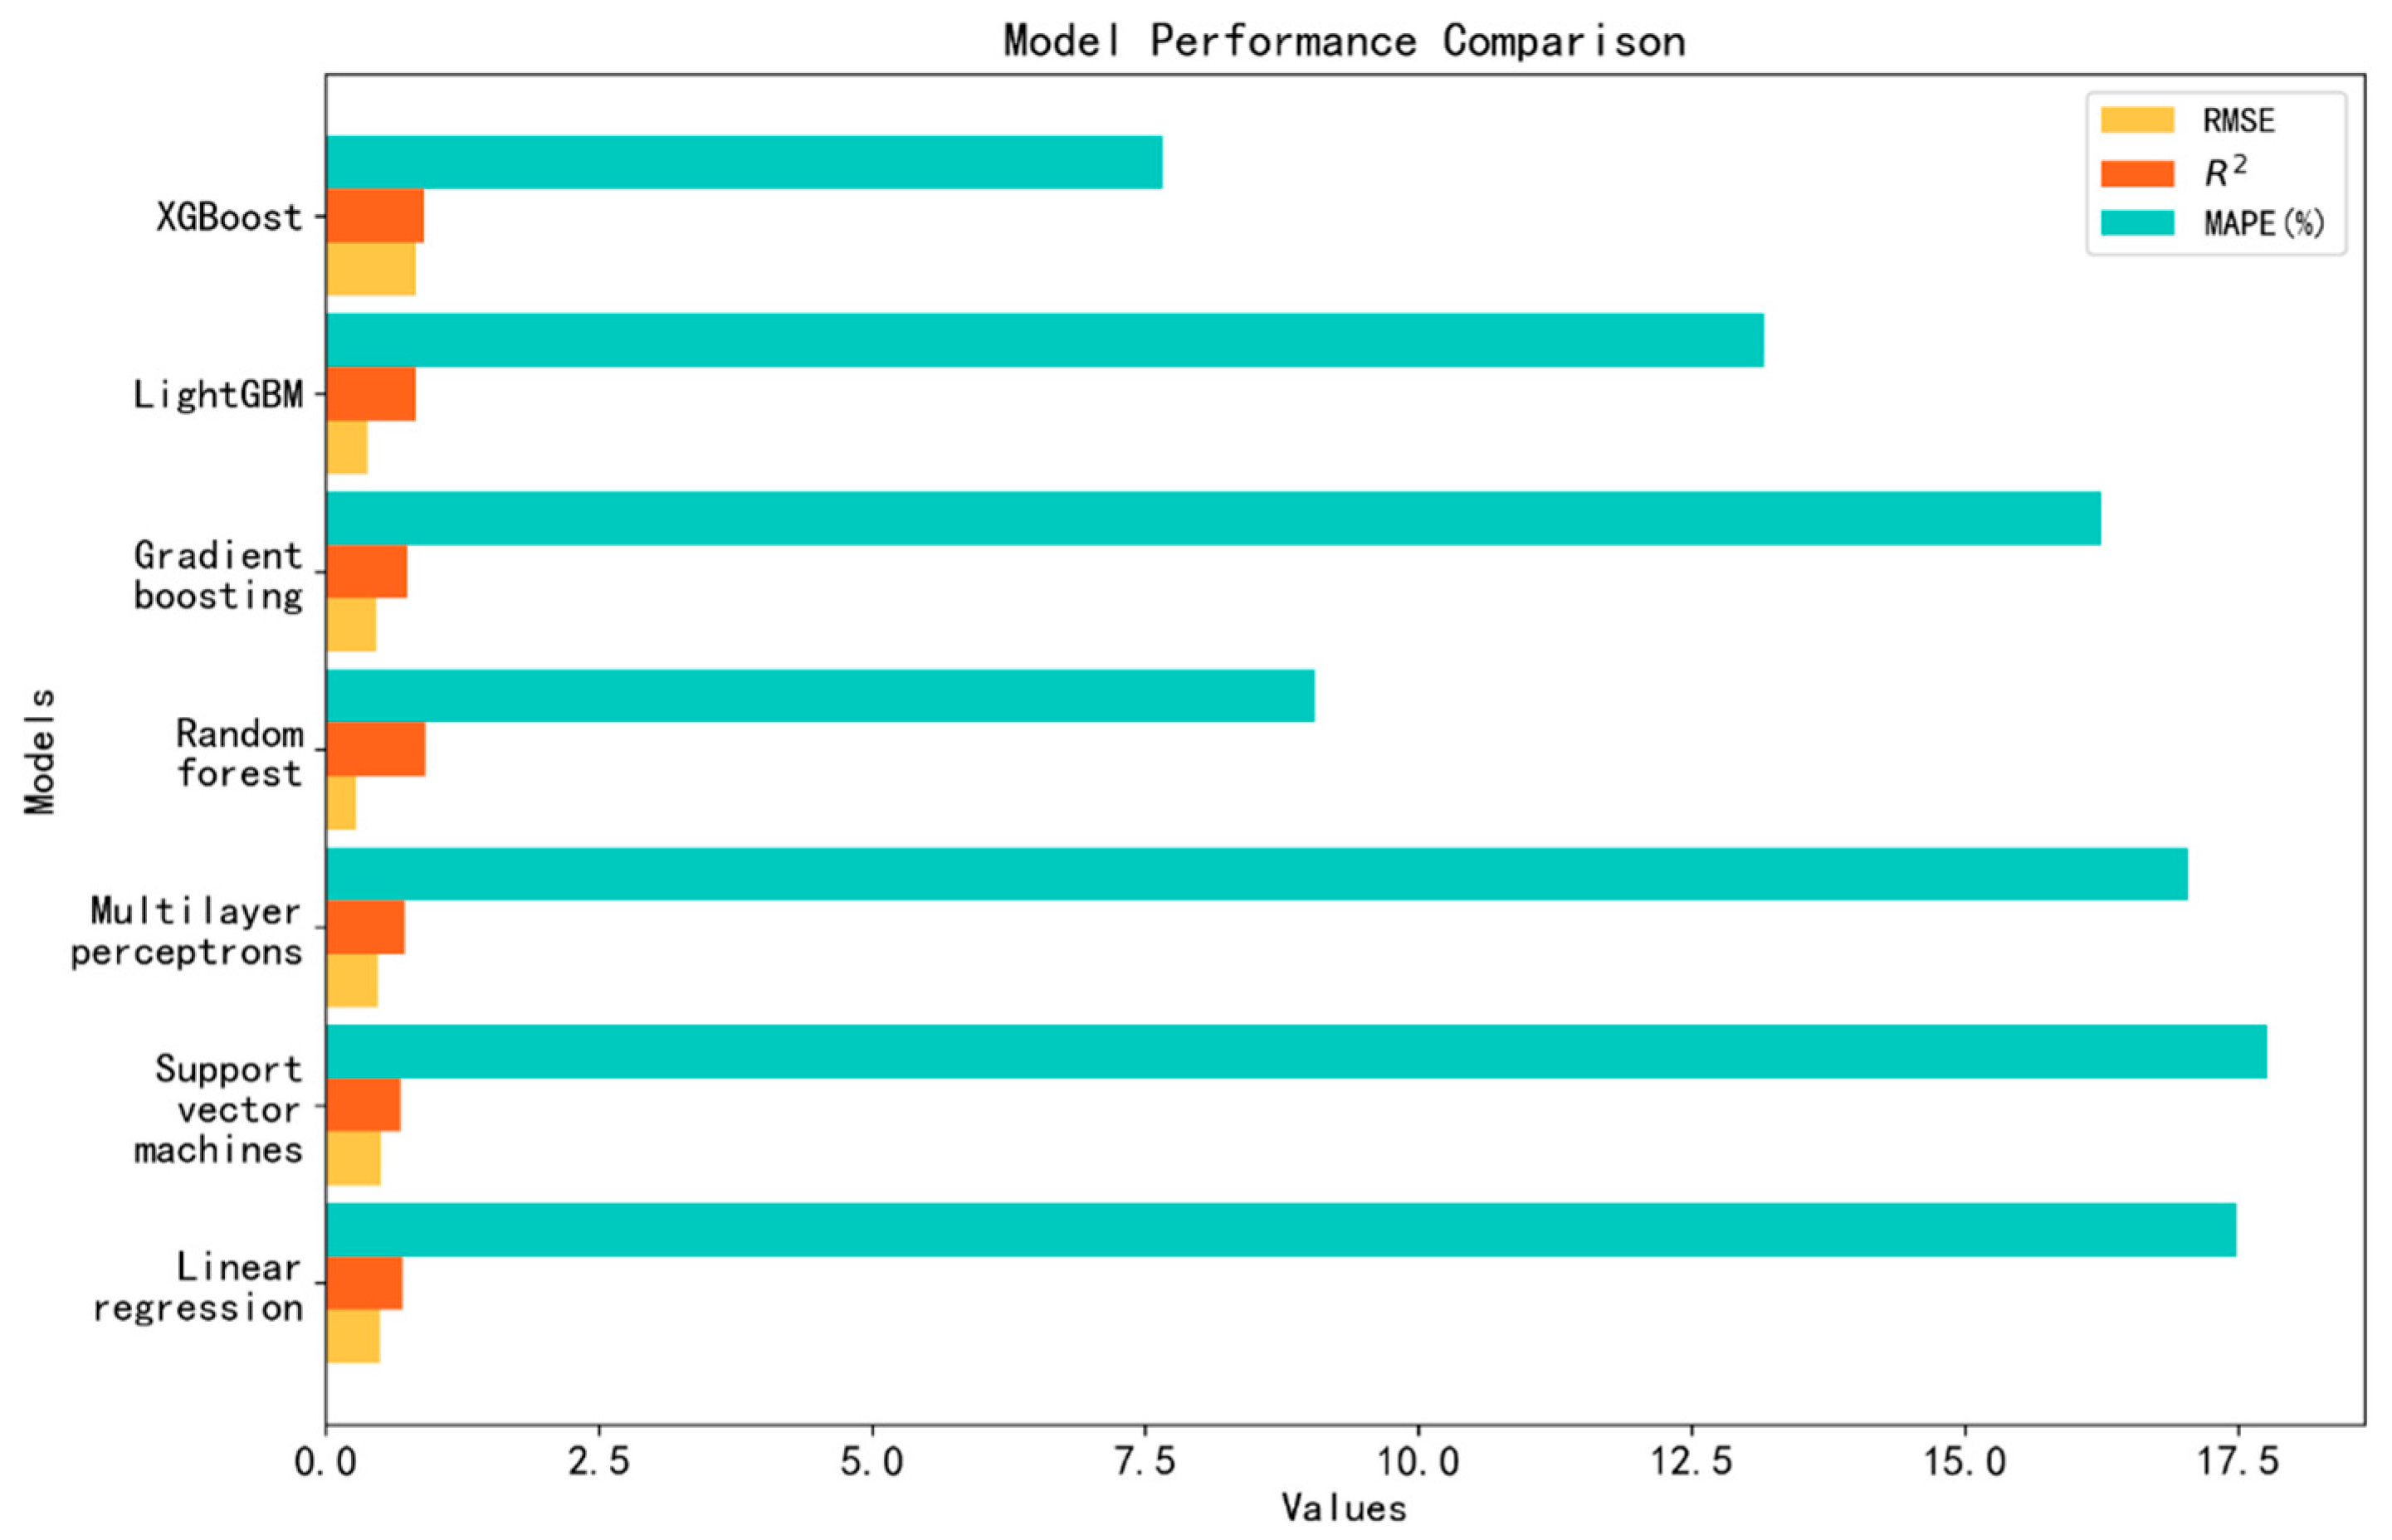
  • The performance of the Stacking–3m integrated model surpasses that of individual models. In the ensemble learning experiment, optimal results were achieved when selecting the three models with the highest determination coefficients based on the stacking method. The RMSE, R2, and MAPE of the best integrated model, Stacking–3m, reached 0.2483, 0.9250, and 6.90%, respectively. Compared to individual models, the root mean square error decreased by 10.58%, the determination coefficient increased by 1.88%, and the mean absolute percentage error decreased by 0.76%, indicating a significant improvement in model performance. This suggests that the stacking method can effectively combine the strengths of different models and further enhance predictive performance through linear regression meta–models.
  • Different influencing factors exert a significant impact on model performance. In this study, we employed a method of gradually reducing the number of influencing factors to adjust the various combinations among them, ultimately forming 14 distinct combinations. Based on these 14 different combinations, when the influencing factors were selected as “1,0,2,3”, the RMSE, R2, and MAPE reached 0.2483, 0.9250, and 6.90%, respectively, representing the optimal performance model; when the influencing factor was selected as “0”, the RMSE, R2, and MAPE were 0.8546, 0.0576, and 35.41%, respectively, indicating the worst performing model; when the influencing factors were selected as “0,2,3”, the R2 value reached 0.9291, representing the optimal value. The above experimental data led to the following conclusions: when constructing an integrated model for predicting rice yield based on phenotypic traits, selecting different influencing factors for modeling results in significant variations in model performance. Therefore, choosing appropriate influencing factors becomes one of the most critical aspects in building predictive models using machine learning.
  • A method for the precise prediction of rice yield within a small-scale planting area was developed. This study addresses the challenge of the precise prediction of rice yield within a small-scale planting area under the unique geographical conditions of the Yunnan Plateau. Initially, based on seven machine learning algorithms, multiple rice yield prediction models utilizing intelligent algorithms were constructed. The three models with the best performance were selected, and two ensemble methods, namely voting and stacking, were employed to build an integrated model group for rice yield prediction. After comparative analysis, the optimal integrated model, Stacking–3m, was determined. Subsequently, by adjusting various influencing factors, a new integrated model for rice yield prediction was constructed and compared with Stacking–3m. The resulting model, based on rice phenotypic traits within a small-scale planting area, is designated as Stacking–3m.

Author Contributions

J.S.: conceptualization, methodology, software, formal analysis, investigation, resources, data curation, writing—original draft, writing—review and editing, and supervision; P.T.: methodology, validation, investigation, formal analysis, writing—original draft, and visualization; Z.L.: methodology, software, formal analysis, and writing—review and editing; X.W.: methodology, software, validation, and visualization; H.Z.: methodology, validation, and visualization; J.C.: data curation and validation; Y.Q.: writing—review and editing, supervision, project administration, and funding acquisition. All authors have read and agreed to the published version of the manuscript.

Funding

This research was supported by the Academician (Expert) Workstation Project of the Yunnan Provincial Department of Science and Technology (Project No. 202405AF140077), the Key Laboratory of Crop Production and Intelligent Agriculture of Yunnan Province, and the Reserve Project of Young and Middle-aged Academic and Technical Leaders of Yunnan Provincial Department of Science and Technology (Project No. 202405AC350108).

Data Availability Statement

The data presented in this study are available upon request from the corresponding author.

Conflicts of Interest

The authors declare no conflicts of interest.

References

  1. Son, N.; Chen, C.; Chen, C.; Minh, V.; Trung, N. A comparative analysis of multitemporal MODIS EVI and NDVI data for large-scale rice yield estimation. Agric. For. Meteorol. 2014, 197, 52–64. [Google Scholar] [CrossRef]
  2. Wang, L.; Tian, Y.; Yao, X.; Zhu, Y.; Cao, W. Predicting grain yield and protein content in wheat by fusing multi-sensor and multi-temporal remote-sensing images. Field Crop. Res. 2014, 164, 178–188. [Google Scholar] [CrossRef]
  3. Chou, J.; Dong, W.; Xu, G.; Tu, G. New Ideas for Research on the Impact of Climate Change on China’s Food Security. Clim. Environ. Res. 2022, 27, 206–216. (In Chinese) [Google Scholar]
  4. Li, P.; Chang, T.; Chang, S.; Ouyang, X.; Qu, M.; Song, Q.; Xiao, L.; Xia, S.; Deng, Q.; Zhu, X.G. Systems model-guided rice yield improvements based on genes controlling source, sink, and flow. J. Integr. Plant Biol. 2018, 60, 1154–1180. [Google Scholar] [CrossRef] [PubMed]
  5. Cao, J.; Zhang, Z.; Tao, F.; Zhang, L.; Luo, Y.; Zhang, J.; Han, J.; Xie, J. Integrating multi-source data for rice yield prediction across China using machine learning and deep learning approaches. Agric. For. Meteorol. 2021, 297, 108275. [Google Scholar] [CrossRef]
  6. Cai, Y.; Guan, K.; Lobell, D.; Potgieter, A.B.; Wang, S.; Peng, J.; Xu, T.; Asseng, S.; Zhang, Y.; You, L. Integrating satellite and climate data to predict wheat yield in Australia using machine learning approaches. Agric. For. Meteorol. 2019, 274, 144–159. [Google Scholar] [CrossRef]
  7. Sun, S.; Zhang, L.; Chen, Z.; Sun, J. Advances in AquaCrop Model Research and Application. Sci. Agric. Sin. 2017, 50, 3286–3299. [Google Scholar]
  8. Noureldin, N.; Aboelghar, M.; Saudy, H.; Ali, A. Rice yield forecasting models using satellite imagery in Egypt. Egypt J. Remote Sens. Space Sci. 2013, 16, 125–131. [Google Scholar] [CrossRef]
  9. Peng, D.; Huang, J.; Li, C.; Liu, L.; Huang, W.; Wang, F.; Yang, X. Modelling paddy rice yield using MODIS data. Agric. For. Meteorol. 2014, 184, 107–116. [Google Scholar] [CrossRef]
  10. Wang, F.; Yi, Q.; Hu, J.; Xie, L.; Yao, X.; Xu, T.; Zheng, J. Combining spectral and textural information in UAV hyperspectral images to estimate rice grain yield. Int. J. Appl. Earth Obs. Geoinf. 2021, 102, 102397. [Google Scholar] [CrossRef]
  11. Zhou, X.; Zheng, H.; Xu, X.; He, J.; Ge, X.; Yao, X.; Cheng, T.; Zhu, Y.; Cao, W.; Tian, Y. Predicting grain yield in rice using multi-temporal vegetation indices from UAV-based multispectral and digital imagery. ISPRS J. Photogramm. Remote Sens. 2017, 130, 246–255. [Google Scholar] [CrossRef]
  12. Ji, Z.; Pan, Y.; Zhu, X.; Zhang, D.; Wang, J. A generalized model to predict large-scale crop yields integrating satellite-based vegetation index time series and phenology metrics. Ecol. Indic. 2022, 137, 108759. [Google Scholar] [CrossRef]
  13. Meng, L.; Liu, H.; Zhang, X.; Ren, C.; Ustin, S.; Qiu, Z.; Xu, M.; Guo, D. Assessment of the effectiveness of spatiotemporal fusion of multi-source satellite images for cotton yield estimation. Comput. Electron. Agric. 2019, 162, 44–52. [Google Scholar] [CrossRef]
  14. Wu, G.; De Leeuw, J.; Skidmore, A.K.; Prins, H.H.; Liu, Y. Exploring the Possibility of Estimating the Aboveground Biomass of Vallisneria spiralis L. In Using Landsat TM Image in Dahuchi, Jiangxi Province, China, Proceedings of the MIPPR 2005: Geospatial Information, Data Mining, and Applications, Wuhan, China, 2 December 2005; SPIE: Bellingham, WA, USA, 2005; pp. 800–810. [Google Scholar]
  15. Wang, Z.; Ma, Y.; Chen, P.; Yang, Y.; Fu, H.; Yang, F.; Raza, M.A.; Guo, C.; Shu, C.; Sun, Y. Estimation of rice aboveground biomass by combining canopy spectral reflectance and unmanned aerial vehicle-based red green blue imagery data. Front. Plant Sci. 2022, 13, 903643. [Google Scholar] [CrossRef] [PubMed]
  16. Hosoi, F.; Umeyama, S.; Kuo, K. Estimating 3D chlorophyll content distribution of trees using an image fusion method between 2D camera and 3D portable scanning lidar. Remote Sens. 2019, 11, 2134. [Google Scholar] [CrossRef]
  17. Su, W.; Sun, Z.; Chen, W.-h.; Zhang, X.; Yao, C.; Wu, J.; Huang, J.; Zhu, D. Joint retrieval of growing season corn canopy LAI and leaf chlorophyll content by fusing Sentinel–2 and MODIS images. Remote Sens. 2019, 11, 2409. [Google Scholar] [CrossRef]
  18. Zhang, H.; Ge, Y.; Xie, X.; Atefi, A.; Wijewardane, N.K.; Thapa, S. High throughput analysis of leaf chlorophyll content in sorghum using RGB, hyperspectral, and fluorescence imaging and sensor fusion. Plant Methods 2022, 18, 60. [Google Scholar] [CrossRef]
  19. Wan, L.; Cen, H.; Zhu, J.; Zhang, J.; Zhu, Y.; Sun, D.; Du, X.; Zhai, L.; Weng, H.; Li, Y. Grain yield prediction of rice using multi-temporal UAV-based RGB and multispectral images and model transfer—A case study of small farmlands in the South of China. Agric. For. Meteorol. 2020, 291, 108096. [Google Scholar] [CrossRef]
  20. Wang, J.; He, P.; Liu, Z.; Jing, Y.; Bi, R. Yield estimation of summer maize based on multi-source remote-sensing data. Agron. J. 2022, 114, 3389–3406. [Google Scholar] [CrossRef]
  21. Wang, Z.; Chen, J.; Zhang, J.; Fan, Y.; Cheng, Y.; Wang, B.; Wu, X.; Tan, X.; Tan, T.; Li, S. Predicting grain yield and protein content using canopy reflectance in maize grown under different water and nitrogen levels. Field Crop. Res. 2021, 260, 107988. [Google Scholar] [CrossRef]
  22. Cao, J.; Wang, H.; Li, J.; Tian, Q.; Niyogi, D. Improving the forecasting of winter wheat yields in Northern China with machine learning-dynamical hybrid subseasonal-to-seasonal ensemble prediction. Remote Sens. 2022, 14, 1707. [Google Scholar] [CrossRef]
  23. Sharma, A.; Jain, A.; Gupta, P.; Chowdary, V. Machine learning applications for precision agriculture: A comprehensive review. IEEE Access 2020, 9, 4843–4873. [Google Scholar] [CrossRef]
  24. Liakos, K.G.; Busato, P.; Moshou, D.; Pearson, S.; Bochtis, D. Machine learning in agriculture: A review. Sensors 2018, 18, 2674. [Google Scholar] [CrossRef]
  25. Zhang, S.; Zhang, C.; Park, D.S.; Yoon, S. Machine Learning and Artificial Intelligence for Smart Agriculture; Frontiers Media SA: Lausanne, Switzerland, 2023; Volume 14, p. 1166209. [Google Scholar]
  26. González Sánchez, A.; Frausto Solís, J.; Ojeda Bustamante, W. Predictive ability of machine learning methods for massive crop yield prediction. Span. J. Agric. Res. 2014, 12, 313–328. [Google Scholar] [CrossRef]
  27. Van Klompenburg, T.; Kassahun, A.; Catal, C. Crop yield prediction using machine learning: A systematic literature review. Comput. Electron. Agric. 2020, 177, 105709. [Google Scholar] [CrossRef]
  28. Chlingaryan, A.; Sukkarieh, S.; Whelan, B. Machine learning approaches for crop yield prediction and nitrogen status estimation in precision agriculture: A review. Comput. Electron. Agric. 2018, 151, 61–69. [Google Scholar] [CrossRef]
  29. Yamparla, R.; Shaik, H.S.; Guntaka, N.S.P.; Marri, P.; Nallamothu, S. Crop Yield Prediction Using Random Forest Algorithm. In Proceedings of the 2022 7th International Conference on Communication and Electronics Systems (ICCES), Coimbatore, India, 22–24 June 2022; IEEE: New York, NY, USA, 2022; pp. 1538–1543. [Google Scholar]
  30. Paudel, D.; Boogaard, H.; de Wit, A.; van der Velde, M.; Claverie, M.; Nisini, L.; Janssen, S.; Osinga, S.; Athanasiadis, I.N. Machine learning for regional crop yield forecasting in Europe. Field Crop. Res. 2022, 276, 108377. [Google Scholar] [CrossRef]
  31. Drummond, S.T.; Sudduth, K.A.; Joshi, A.; Birrell, S.J.; Kitchen, N.R. Statistical and neural methods for site-specific yield prediction. Trans. ASAE 2003, 46, 5. [Google Scholar] [CrossRef]
  32. Khaki, S.; Wang, L. Crop yield prediction using deep neural networks. Front. Plant Sci. 2019, 10, 621. [Google Scholar] [CrossRef]
  33. Mupangwa, W.; Chipindu, L.; Nyagumbo, I.; Mkuhlani, S.; Sisito, G. Evaluating machine learning algorithms for predicting maize yield under conservation agriculture in Eastern and Southern Africa. SN Appl. Sci. 2020, 2, 952. [Google Scholar] [CrossRef]
  34. Uyanık, G.K.; Güler, N. A study on multiple linear regression analysis. Procedia-Soc. Behav. Sci. 2013, 106, 234–240. [Google Scholar] [CrossRef]
  35. Tranmer, M.; Elliot, M. Multiple linear regression. Cathie Marsh Cent. Census Surv. Res. (CCSR) 2008, 5, 1–5. [Google Scholar]
  36. Jobson, J.; Jobson, J. Multiple linear regression. In Applied Multivariate Data Analysis: Regression and Experimental Design; Springer: New York, NY, USA, 1991; pp. 219–398. [Google Scholar]
  37. Suthaharan, S.; Suthaharan, S. Support vector machine. In Machine Learning Models and Algorithms for Big Data Classification: Thinking with Examples for Effective Learning; Springer: Boston, MA, USA, 2016; pp. 207–235. [Google Scholar]
  38. Popescu, M.-C.; Balas, V.E.; Perescu-Popescu, L.; Mastorakis, N. Multilayer perceptron and neural networks. WSEAS Trans. Circuits Syst. 2009, 8, 579–588. [Google Scholar]
  39. Delashmit, W.H.; Manry, M.T. Recent developments in multilayer perceptron neural networks. In Proceedings of the Seventh Annual Memphis Area Engineering and Science Conference, MAESC, Memphis, TN, USA, 11 May 2005; p. 33. [Google Scholar]
  40. Biau, G.; Scornet, E. A random forest guided tour. Test 2016, 25, 197–227. [Google Scholar] [CrossRef]
  41. Natekin, A.; Knoll, A. Gradient boosting machines, a tutorial. Front. Neurorobot. 2013, 7, 21. [Google Scholar] [CrossRef]
  42. Bentéjac, C.; Csörgő, A.; Martínez-Muñoz, G. A comparative analysis of gradient boosting algorithms. Artif. Intell. Rev. 2021, 54, 1937–1967. [Google Scholar] [CrossRef]
  43. Chen, T.; Guestrin, C. Xgboost: A Scalable Tree Boosting System. In Proceedings of the 22nd Acm Sigkdd International Conference on Knowledge Discovery and Data Mining, San Francisco, CA, USA, 13–17 August 2016; Association for Computing Machinery: New York, NY, USA, 2016; pp. 785–794. [Google Scholar]
  44. Ke, G.; Meng, Q.; Finley, T.; Wang, T.; Chen, W.; Ma, W.; Ye, Q.; Liu, T.-Y. Lightgbm: A highly efficient gradient boosting decision tree. In Proceedings of the Advances in Neural Information Processing Systems, Long Beach, CA, USA, 4 December 2017; p. 30. [Google Scholar]
  45. Maimaitijiang, M.; Sagan, V.; Sidike, P.; Hartling, S.; Esposito, F.; Fritschi, F.B. Soybean yield prediction from UAV using multimodal data fusion and deep learning. Remote Sens. Environ. 2020, 237, 111599. [Google Scholar] [CrossRef]
  46. Vasit, S.; Maitiniyazi, M.; Sourav, B.; Matthew, M.; Brown, D.R.; Paheding, S.; Fritschi, F.B. Field-scale crop yield prediction using multi-temporal WorldView–3 and PlanetScope satellite data and deep learning. ISPRS J. Photogramm. Remote Sens. 2021, 174, 265–281. [Google Scholar]
  47. Jeong, S.; Ko, J.; Ban, J.-o.; Shin, T.; Yeom, J.-m. Deep learning-enhanced remote sensing-integrated crop modeling for rice yield prediction. Ecol. Inform. 2024, 84, 102886. [Google Scholar] [CrossRef]
  48. Zhou, H.; Huang, F.; Lou, W.; Gu, Q.; Ye, Z.; Hu, H.; Zhang, X. Yield prediction through UAV-based multispectral imaging and deep learning in rice breeding trials. Agric. Syst. 2025, 223, 104214. [Google Scholar] [CrossRef]
  49. Clercq, D.D.; Mahdi, A. Feasibility of machine learning-based rice yield prediction in India at the district level using climate reanalysis and remote sensing data. Agric. Syst. 2024, 220, 104099. [Google Scholar] [CrossRef]
  50. Rußwurm, M.; Courty, N.; Emonet, R.; Lefèvre, S.; Tuia, D.; Tavenard, R. End-to-end learned early classification of time series for in-season crop type mapping. ISPRS J. Photogramm. Remote Sens. 2023, 196, 445–456. [Google Scholar] [CrossRef]
  51. Weiguo, Y.; Gaoxiang, Y.; Dong, L.; Hengbiao, Z.; Xia, Y.; Yan, Z.; Weixing, C.; Lin, Q.; Tao, C. Improved prediction of rice yield at field and county levels by synergistic use of SAR, optical and meteorological data. Agric. For. Meteorol. 2023, 342, 109729. [Google Scholar]
  52. Nishu, B.; Anshu, S. Deep Learning Based Wheat Crop Yield Prediction Model in Punjab Region of North India. Appl. Artif. Intell. 2021, 35, 1304–1328. [Google Scholar]
  53. Debaditya, G.; Nihal, G.; Siddhartha, S.; Sudip, M. Role of existing and emerging technologies in advancing climate-smart agriculture through modeling: A review. Ecol. Inform. 2022, 71, 101805. [Google Scholar]
  54. Jeong, S.; Ko, J.; Yeom, J.-M. Predicting rice yield at pixel scale through synthetic use of crop and deep learning models with satellite data in South and North Korea. Sci. Total Environ. 2022, 802, 149726. [Google Scholar] [CrossRef]
  55. Yang, S.; Li, L.; Fei, S.; Yang, M.; Tao, Z.; Meng, Y.; Xiao, Y. Wheat Yield Prediction Using Machine Learning Method Based on UAV Remote Sensing Data. Drones 2024, 8, 284. [Google Scholar] [CrossRef]
  56. Seungtaek, J.; Jonghan, K.; Taehwan, S.; Min, Y.J. Incorporation of machine learning and deep neural network approaches into a remote sensing-integrated crop model for the simulation of rice growth. Sci. Rep. 2022, 12, 9030. [Google Scholar]
  57. Joshi, A.; Pradhan, B.; Gite, S.; Chakraborty, S. Remote-sensing data and deep-learning techniques in crop mapping and yield prediction: A systematic review. Remote Sens. 2023, 15, 2014. [Google Scholar] [CrossRef]
  58. Shafi, U.; Mumtaz, R.; Anwar, Z.; Ajmal, M.M.; Khan, M.A.; Mahmood, Z.; Qamar, M.; Jhanzab, H.M. Tackling food insecurity using remote sensing and machine learning based crop yield prediction. IEEE Access 2023, 11, 108640–108657. [Google Scholar] [CrossRef]
  59. Alibabaei, K.; Gaspar, P.D.; Lima, T.M.; Campos, R.M.; Girão, I.; Monteiro, J.; Lopes, C.M. A review of the challenges of using deep learning algorithms to support decision-making in agricultural activities. Remote Sens. 2022, 14, 638. [Google Scholar] [CrossRef]
  60. Pandya, P.; Gontia, N.K. Early crop yield prediction for agricultural drought monitoring using drought indices, remote sensing, and machine learning techniques. J. Water Clim. Chang. 2023, 14, 4729–4746. [Google Scholar] [CrossRef]
  61. Sunitha, D.B.; Sandhya, N.; Shahu, C.K. Hybrid deep WaveNet–LSTM architecture for crop yield prediction. Multimed. Tools Appl. 2023, 83, 19161–19179. [Google Scholar]
  62. Alexandros, O.; Cagatay, C.; Ayalew, K. Hybrid Deep Learning-based Models for Crop Yield Prediction. Appl. Artif. Intell. 2022, 36, 2031822. [Google Scholar]
Figure 1. Study area map.
Agriculture 15 00181 g001
Figure 2. Rice phenotype detection system.
Agriculture 15 00181 g002
Figure 3. Relationship between phenotypic characteristics and yield in rice cultivation.
Agriculture 15 00181 g003
Figure 4. Roadmap for the integrated model technology for yield prediction based on rice phenotypic data.
Agriculture 15 00181 g004
Figure 5. Comparison of performance of machine learning models with different dataset partitioning ratios.
Agriculture 15 00181 g005
Figure 6. Comparison chart of results obtained with random forest and stacked ensemble models on test set.
Agriculture 15 00181 g006
Figure 7. The impact of different feature selection techniques on the prediction outcomes of rice yield.
Agriculture 15 00181 g007
Figure 8. Feature importance calculated based on random forest algorithm.
Agriculture 15 00181 g008
Figure 9. Figure of verification results for yield prediction in a small region.
Agriculture 15 00181 g009
Figure 10. Comparative analysis chart of the performances of different machine learning algorithms.
Agriculture 15 00181 g010
Table 1. Example of raw single-spike phenotype data for rice.
PlotNumberAngle (°)Spike Length (cm)Branch Stem Length (cm)Grain Number (Grain)Yield (g)
1117.324.8150.771733.8
215.619.3100.561092.4
3719.9105.061203.3
4625.5161.492014.6
25523.2150.071704
65.12192.71952
725.419.6126.451312.9
89.715.5114.731483
51220458.413.546.99420.6
2046617.863.32741.5
204710.516.349.87591
204812.711.6129.281432.9
Table 2. Example of average phenotypic data for a single original rice plot.
PlotNumberAngle (°)Spike Length (cm)Branch Stem Length (cm)Grain Number (Grain)Yield (g)
1111.47522.375129.471513.525
2211.319.825120.991362.975
5125129.414.872.365809.4
Table 3. Integration and enhancement of rice phenotypic data.
PlotNumberAngle (°)Spike Length (cm)Branch Stem Length (cm)Grain Number (Grain)Yield (g)
1116.4522.05125.671413.10
26.5022.70133.281613.95
35.0522.10121.391332.98
417.5517.55120.591402.95
2519.0019.2079.85962.00
613.2515.1572.84771.30
713.8521.25156.571993.40
811.4519.50109.781271.52
512204511.7517.35109.311333.25
20466.4319.15110.741343.17
204730.6412.9052.59641.40
204811.6013.9589.581011.95
Table 4. Comparison of rice yield prediction results based on machine learning algorithms.
ModelRMSER2MAPE (%)
LR0.49750.698917.49
SVM0.50930.684417.77
MLP0.47690.723317.04
RF0.27770.90629.05
GBR0.45990.742716.25
LightGBM0.37980.824513.16
XGBoost0.82450.89347.66
Table 5. Comparison of rice yield prediction results based on integrated learning methods.
ModelRMSER2MAPE (%)
Voting–2m0.27350.90908.12
Stacking–2m0.27050.9118.33
Voting–3m0.29950.89099.69
Stacking–3m0.24830.92506.90
Disclaimer/Publisher’s Note: The statements, opinions and data contained in all publications are solely those of the individual author(s) and contributor(s) and not of MDPI and/or the editor(s). MDPI and/or the editor(s) disclaim responsibility for any injury to people or property resulting from any ideas, methods, instructions or products referred to in the content.

