Article

Combining UAV-Based Multispectral and Thermal Images to Diagnosing Dryness Under Different Crop Areas on the Loess Plateau

1
Northwest Institute of Eco-Environment and Resources, Chinese Academy of Sciences, Donggang West Road 320, Lanzhou 730000, China
2
University of the Chinese Academy of Sciences, Yanqihu East Road 1, Beijing 100049, China
3
College of Agriculture and Forestry, Longdong University, Lanzhou Road 45, Lanzhou 745000, China
4
College of Mathematics and Information Engineering, Longdong University, Lanzhou Road 45, Lanzhou 745000, China
*
Author to whom correspondence should be addressed.
Agriculture 2025, 15(2), 126; https://doi.org/10.3390/agriculture15020126
Submission received: 22 November 2024 / Revised: 21 December 2024 / Accepted: 7 January 2025 / Published: 8 January 2025
(This article belongs to the Section Digital Agriculture)

Abstract

:
Dryness is a critical limiting factor for achieving high agricultural productivity on China’s Loess Plateau (LP). High-precision, field-scale dryness monitoring is essential for the implementation of precision agriculture. However, obtaining dryness information with adequate spatial and temporal resolution remains a significant challenge. Unmanned aerial vehicle (UAV) systems can capture high-resolution remote sensing images on demand, but the effectiveness of UAV-based dryness indices in mapping the high-resolution spatial heterogeneity of dryness across different crop areas at the agricultural field scale on the LP has yet to be fully explored. Here, we conducted UAV–ground synchronized experiments on three typical croplands in the eastern Gansu province of the Loess Plateau (LP). Multispectral and thermal infrared sensors mounted on the UAV were used to collect high-resolution multispectral and thermal images. The temperature vegetation dryness index (TVDI) and the temperature–vegetation–soil moisture dryness index (TVMDI) were calculated based on UAV imagery. A total of 14 vegetation indices (VIs) were employed to construct various VI-based TVDIs, and the optimal VI was selected. Correlation analysis and Gradient Structure Similarity (GSSIM) were applied to evaluate the suitability and spatial differences between the TVDI and TVMDI for dryness monitoring. The results indicate that TVDIs constructed using the normalized difference vegetation index (NDVI) and the visible atmospherically resistant index (VARI) were more consistent with the characteristics of crop responses to dryness stress. Furthermore, the TVDI demonstrated higher sensitivity in dryness monitoring compared with the TVMDI, making it more suitable for assessing dryness variations in rain-fed agriculture in arid regions.

1. Introduction

Dryness is a complex, multi-faceted natural phenomenon that impacts various aspects of life and poses significant economic and environmental challenges, particularly in agricultural regions [1]. It refers to the absence or shortage of soil moisture (SM) or water. Prolonged dryness, lasting from a week to several years, can result in drought. Due to global climate warming, extreme events such as heavy rains and heat waves are expected to occur more frequently and with greater intensity [2]. China is currently facing significant challenges related to dryness or drought, with an average of 20.9 million hectares affected by drought each year [3], and the area of severely dry land is projected to increase in the future. Therefore, monitoring dryness is crucial for ensuring agricultural productivity, managing drought risk, and maintaining socioeconomic stability.
The Loess Plateau (LP) is the world’s largest loess accumulation plateau and has been a vital agricultural region in China for thousands of years, currently supporting 8.5% of the country’s population [4,5]. However, the frequent occurrence of dryness and drought in the region, exacerbated by extreme climate events driven by global climate change, heightens the risk of natural disasters and poses significant threats to the ecological environment and agricultural production [6]. To mitigate these impacts and enhance agricultural production, irrigation is often employed as a solution. However, the effectiveness of this approach is limited by water shortages in the Loess Plateau (LP) region [7]. Therefore, gaining an understanding of spatially continuous dryness patterns can optimize water usage, thereby contributing to more effective precision farming and enhanced water management practices.
Remote sensing (RS) technology has significantly advanced dryness monitoring, especially through the use of optical [8], thermal [9], and microwave observations [10]. However, commonly used satellite data, with their lower spatial and temporal resolutions, are better suited for large-scale monitoring rather than detailed field-level analysis [11,12]. This limitation is particularly significant in agricultural fields where varying crop types are often found between fields. In contrast, UAV technology offers high spatial–temporal resolution data, making it an ideal tool for estimating dryness on a fine scale [13,14].
Remote sensing-based dryness monitoring methods, including dryness indices [15,16,17], machine learning [9,18], and energy balance models [19,20], have been extensively studied. Among these methods, dryness indices are derived from dryness-related variables and are valued for their clear indicators, ease of data collection, straightforward operation, and broad applicability [21,22]. The temperature vegetation dryness index (TVDI), developed based on the vegetation index and surface temperature, has been widely accepted as a dryness monitoring method due to its clear theoretical foundation and ease of implementation [23,24,25,26,27]. While soil moisture (SM) can serve as a direct indicator of dryness, ref. [1] integrated soil moisture factors, vegetation growth status, and surface temperature to develop the temperature–vegetation–soil moisture dryness index (TVMDI), enhancing the precision of agricultural dryness monitoring [1]. However, UAV-based multispectral and thermal infrared remote sensing for dryness estimation is typically applied to a single crop or a specific growth stage [28], with limited analysis of the effectiveness of dryness indices in assessing dryness across diverse crop types and growth stages.
In this study, three representative agricultural plots on the Loess Plateau (LP) were selected: an irrigated orchard and two rain-fed plots where wheat and maize are the main crops. Multispectral and thermal infrared remote sensing data, along with ground-measured soil moisture data, were collected through synchronized UAV–ground experiments to assess the dryness of plots planted with orchards, wheat, and maize, respectively. The primary objective of this research was to evaluate the effectiveness of the TVDI and the TVMDI for dryness monitoring. This evaluation involved comparing the indices’ correlation with ground-measured soil moisture, analyzing spatial variations using the Gradient Structure Similarity (GSSIM) index, and investigating the factors contributing to the observed differences. The findings provide valuable insights for the rapid and accurate monitoring and assessment of agricultural water resources on the LP.

2. Materials and Methods
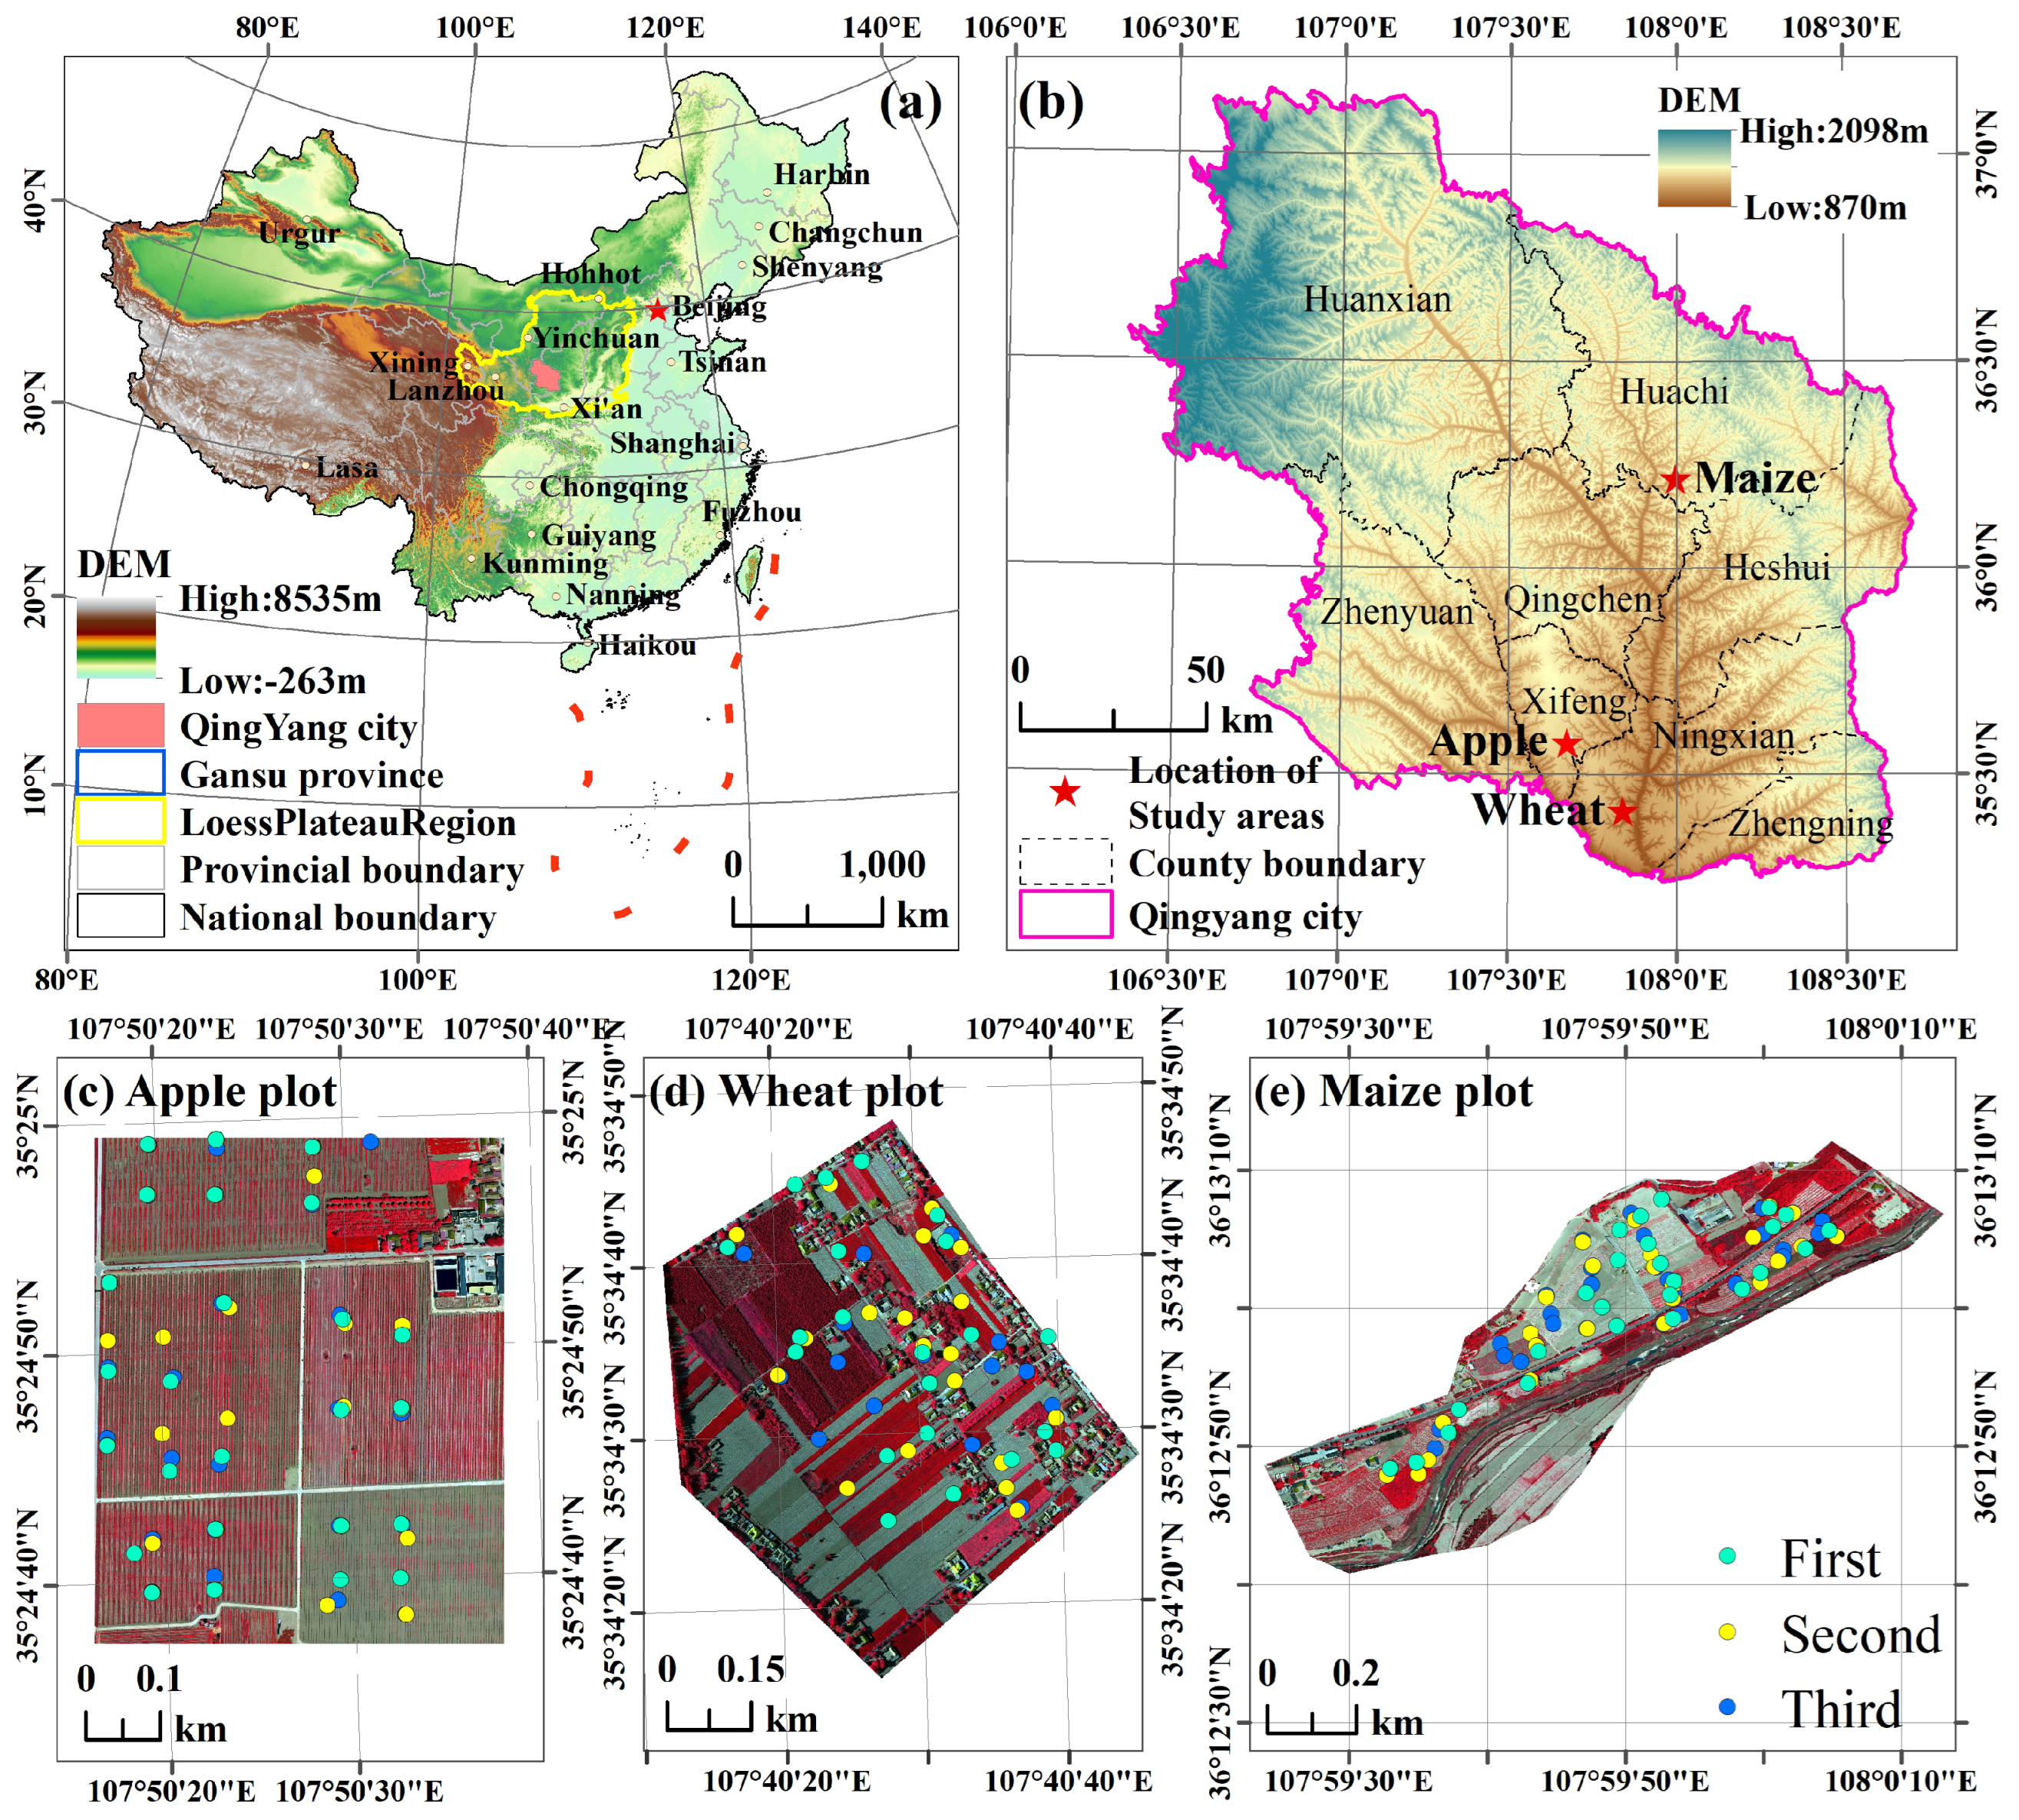
2.1. Study Areas

The LP is a typical arid and semi-arid region in China. The ecological environment of the LP is fragile and vulnerable. Most areas of the LP are characterized by severe water shortages and frequent droughts [29,30]. We carried out the study at three agricultural plots in Qingyang City, Gansu Province, located on the LP (Figure 1a). The locations of the three experiment plots are shown in Figure 1b.
The apple orchard plot is located in the loess tableland area of Ningxian County, Qingyang City (Lon: 107 ° 50 28 , Lat: 35 ° 24 48 , Elevation: 1165 m, Area: 0.54 km 2 ). The climate is sub-humid, with an average annual temperature of 9.5 °C and annual precipitation of 577.9 mm [31]. This area is one of the “water–fertilizer integrated” demonstration zones, featuring high-density dwarf apple trees with plot-wide drip irrigation systems.
The wheat plot is located in the loess tableland area of Xifeng District, Qingyang City, within the Dongzhi Tableland of the Loess Plateau (Lon: 107 ° 40 30 , Lat: 35 ° 34 37 , Elevation: 1277 m, Area: 0.62 km 2 ). The climate is sub-humid, with an average annual temperature of 9.3 °C and average annual precipitation of 554.2 mm [31]. This is a rain-fed agricultural region where winter wheat is the main crop.
The maize plot is located in the loess hilly–gully region of Huachi County, Qingyang City (Lon: 107 ° 59 49 , Lat: 36 ° 13 1 , Elevation: 1129 m, Area: 0.52 km 2 ). The climate is semi-arid, with an average annual temperature of 8.6 °C and average annual precipitation of 499.7 mm [31]. The area is also a rain-fed agricultural region where winter wheat is the main crop.
Figure 1c–e display UAV-based false-color images and the distribution of measured points across the three study plots.

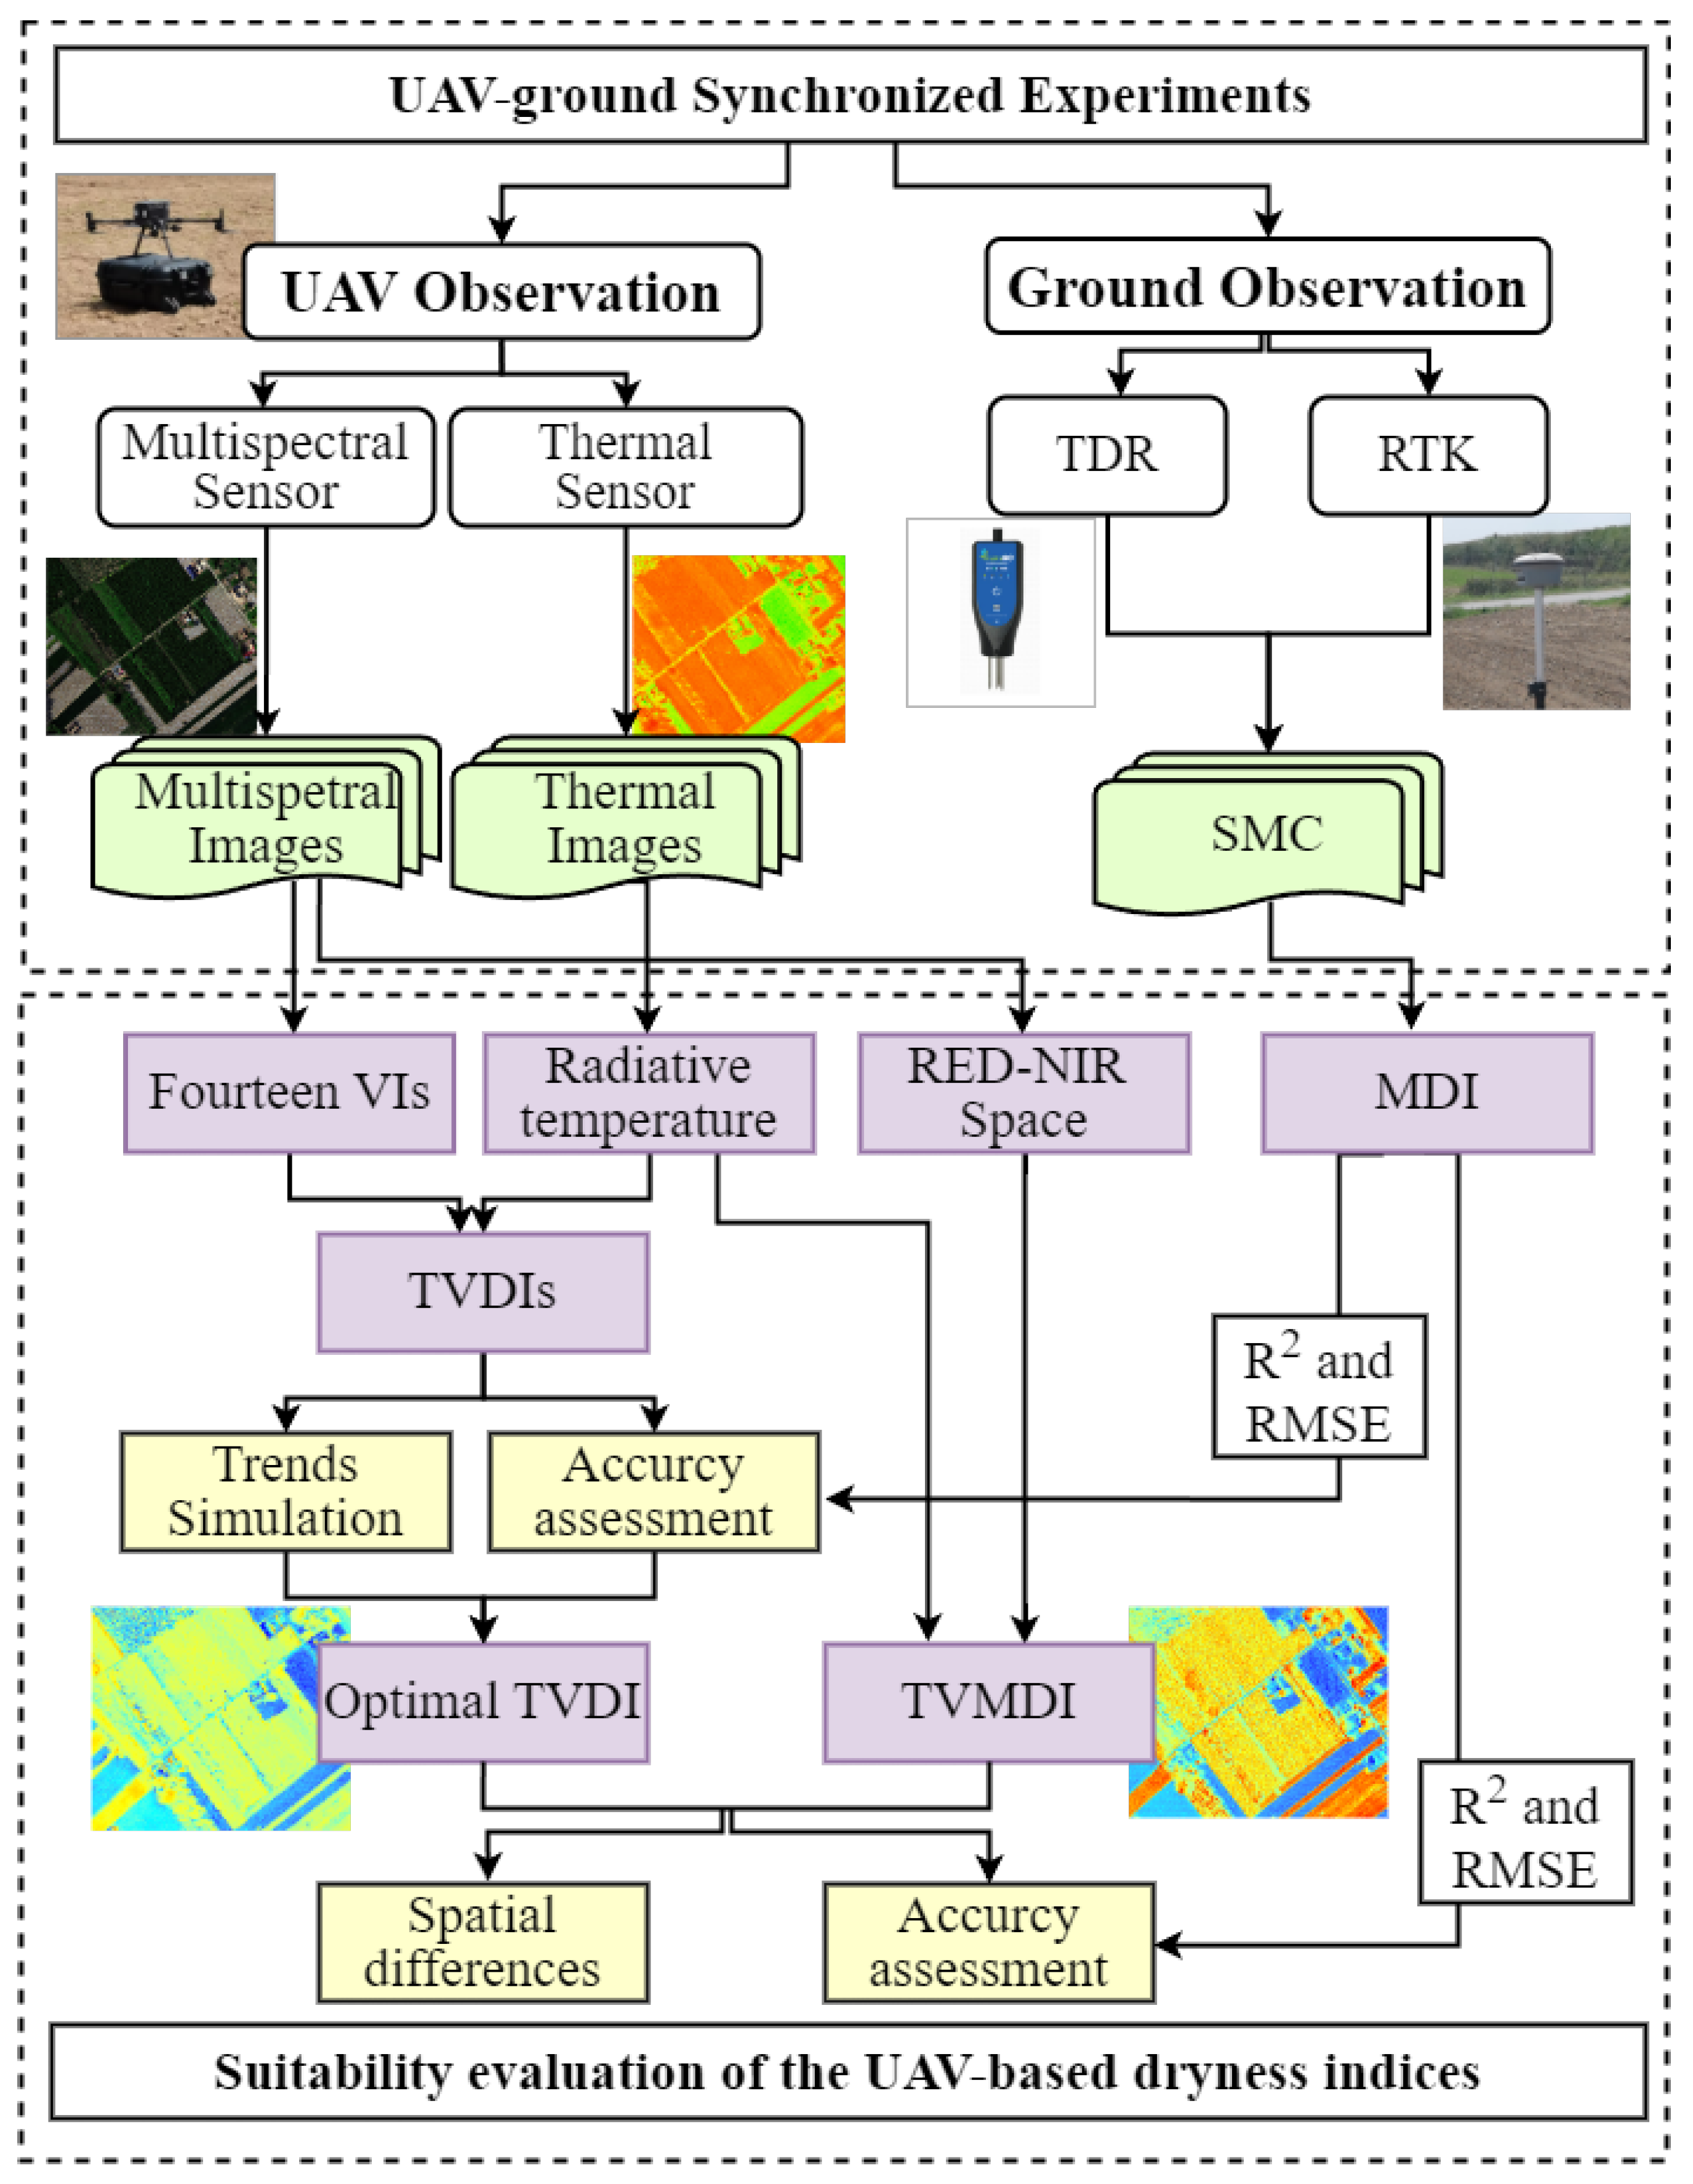
2.2. Overall Workflow

Figure 2 illustrates the workflow for evaluating UAV-based dryness indices for dryness monitoring, which is divided into two main components. The first component involves conducting synchronized UAV–ground observation experiments to acquire UAV imagery and measure soil moisture content at sample points using time domain reflectometry (TDR) equipment, as detailed in Section 2.3. The second component focuses on the analysis and comparison of the TVDI and TVMDI. After acquiring remote sensing images and volumetric soil moisture content (SMC) from the samples, fourteen VIs were computed, and, based on them, fourteen different TVDIs were also computed. Additionally, we computed the TVMDI. Subsequently, we performed accuracy assessments and trend simulations on the TVDIs to identify the optimal index. Finally, we compared the optimal TVDI with the TVMDI using GSSIM and correlation analysis.

2.3. Experiment Step and Data Acquisition

A total of three UAV–ground synchronized experiments were conducted from early May to mid-June 2022. The observation times and corresponding crop growth stages for the three experimental plots are presented in Table 1.

2.3.1. UAV Observation and Image Pre-Processing

An M300 Quad-copter UAV (Dajiang Innovation, Shenzhen, China) equipped with an MS600 PRO multispectral sensor and a Zen-muse H20 thermal sensor were used to simultaneously capture high-resolution multispectral and thermal images. The multispectral sensor has six bands: blue (450 nm), green (555 nm), red (660 nm), red-edge (717 nm), red-edge-750 (750 nm), and NIR (840 nm). The thermal sensor measures radiometric temperature in the 8–14 μ m spectral range, with an image resolution of 640 × 512 pixels and a temperature sensitivity below 50 mK.
The UAV system flew autonomously along a preset flight path at a height of 100 m above ground, achieving spatial resolutions of 7 cm for multispectral data and 9 cm for thermal data. The flight lines were designed to ensure at least 70% overlap both along the flight path and between adjacent flight lines. Each flight campaign was completed within a 2-h window around midday to minimize shading issues and maximize thermal variations.
The pre-processing of UAV remote sensing images primarily involved radiometric correction, geometric correction, image resampling, and image clipping. First, the digital number (DN) values were converted to reflectance data through radiometric correction using gain and bias values obtained from a gray calibration plate. Next, all calibrated images were resampled to a 0.1 m × 0.1 m resolution using the nearest neighbor algorithm. Subsequently, ground control points (GCPs) obtained via RTK at road intersections, right-angle bends in cultivated land, and building corners were used to geometrically rectify the UAV images acquired on 1 May 2022. Finally, using a polynomial correction model and a cubic convolution resampling algorithm, the remaining images were registered to the rectified reference image through image-to-image registration methods, ensuring a total root mean square error below one pixel (0.1 m).

2.3.2. Synchronous Observation and Measurement of Soil Moisture

Volumetric soil moisture content (SMC) was measured at sample points within the experimental area to validate the dryness index. The time between the UAV experiment and the field survey was kept to less than one day, with consistent weather conditions and no rainfall. RTK was used to obtain precise locations, and time domain reflectometry (TDR) was employed to measure the SMC of the samples. To ensure that the measured SMC was representative of the pixel-level SMC, we designed a 0.1 m × 0.1 m observation plot (matching the spatial resolution of the imagery, which is 0.1 m). Within this plot, we uniformly distributed three observation points along the diagonal and used TDR to measure the SMC at each point individually. The average value of these three measurements was then taken as the SMC for the pixel. To facilitate comparison with the TVDI and TVMDI, the measured SMC was normalized and referred to as the measured dryness index MDI. The equation is as follows:
MDI = 1 S M i S M min S M max S M min
where S M i is the measured SMC; S M min is the minimum measured SMC; and S M max is the maximum measured SMC.

2.4. Remote Sensing Drought Index Retrieval and Analysis

2.4.1. TVDI

The TVDI is a dryness indicator that leverages the relationship between a vegetation index and surface temperature to monitor dryness severity [32]. The thermal image captures relative radiative temperature differences rather than absolute land surface temperature values. Previous studies have demonstrated that absolute surface temperature is not necessary for estimating drought using the TVDI method; instead, radiative temperature can be used directly for TVDI calculations [33]. The TVDI is calculated as follows:
TVDI = T S T s   min b + a V I T s   min
where T S is the pixel radiative temperature; T s   min is the minimum T S corresponding to a particular NDVI; a is the slope of the dry edge and b is the y-intercept of the slope of the dry edge; and VI is the vegetation index; the calculation method of each VI is shown in Table 2.

2.4.2. TVMDI

The TVMDI is a dryness index that integrates soil moisture, temperature, and vegetation status [1]. The vegetation status index and soil moisture index within the TVMDI are derived from the red-NIR feature space. When land cover types are diverse in remote sensing images, the red and NIR bands can form a “triangle” feature space. Dense vegetation is positioned at the top of this space due to its low red reflectance and high near-infrared reflectance. As vegetation cover decreases, its position shifts closer to the soil line. Contour lines parallel to the soil line indicate areas with the same vegetation cover and are referred to as the perpendicular vegetation index (PVI). The line perpendicular to the PVI represents soil moisture (SM) [47]. The PVI and SM were calculated as follows:
PVI = R N i r M R R e d B 1 + M 2
SM = R N i r + 1 M R Red B 1 + 1 M 2
where R N i r and R R e d are the reflectance values of the red and NIR bands, respectively; M and B refer to the slope and the y-intercept of the soil line, respectively.
The PVI, SM, and T S were combined to construct the TVMDI. The values of these indices needed to be normalized first and then the TVMDI was calculated using the following equation:
Normalized p i = p i min ( p ) max ( p ) min ( p ) × 3 3
TVMDI = T s 2 + SM 2 + 3 3 PVI 2
where p i is the pixel value of variables; and T s , SM, and PVI are the pixel radiative temperature, soil moisture, and perpendicular vegetation index, respectively.

2.4.3. GSSIM

The spatial structural differences between the TVDI and TVMDI were quantified using the Gradient-based Structural Similarity (GSSIM) [48], which was calculated as follows:
GSSIM ( x , y ) = [ l ( x , y ) ] α [ c ( x , y ) ] β [ g ( x , y ) ] γ
l ( x , y ) = 2 μ x μ y + c 1 μ x 2 + μ y 2 + c 1
c ( x , y ) = 2 σ x σ y + c 2 σ x 2 + σ y 2 + c 2
g ( x , y ) = 2 i j G x ( i , j ) G y ( i , j ) + c 3 i Σ j G x ( i , j ) 2 + i Σ j G y ( i , j ) 2 + c 3
where [ l ( x , y ) ] α is the luminance comparison information; [ c ( x , y ) ] β is the contrast comparison information; [ g ( x , y ) ] γ is the gradient-based structure comparison information; μ x and μ y refer to the average of two images; σ x and σ y represent the standard deviation of two images; G x ( i , j ) and G y ( i , j ) are the gradient values of the pixels of two images; c 1 , c 2 , and c 3 are constants with values of 0.0001, 0.0001, and 0.0005, respectively; and α , β , and γ represent the relative importance of each character with a value of 1.
The smaller the GSSIM value is, the greater is the spatial disparity between the two images. GSSIM values can be categorized into four groups [49]: severe changes (0 < GSSIM 0.25 ), high changes (0.25 < GSSIM 0.45 ), medium changes (0.25 < GSSIM 0.65 ), and low changes (0.65 < GSSIM 1.0 ).

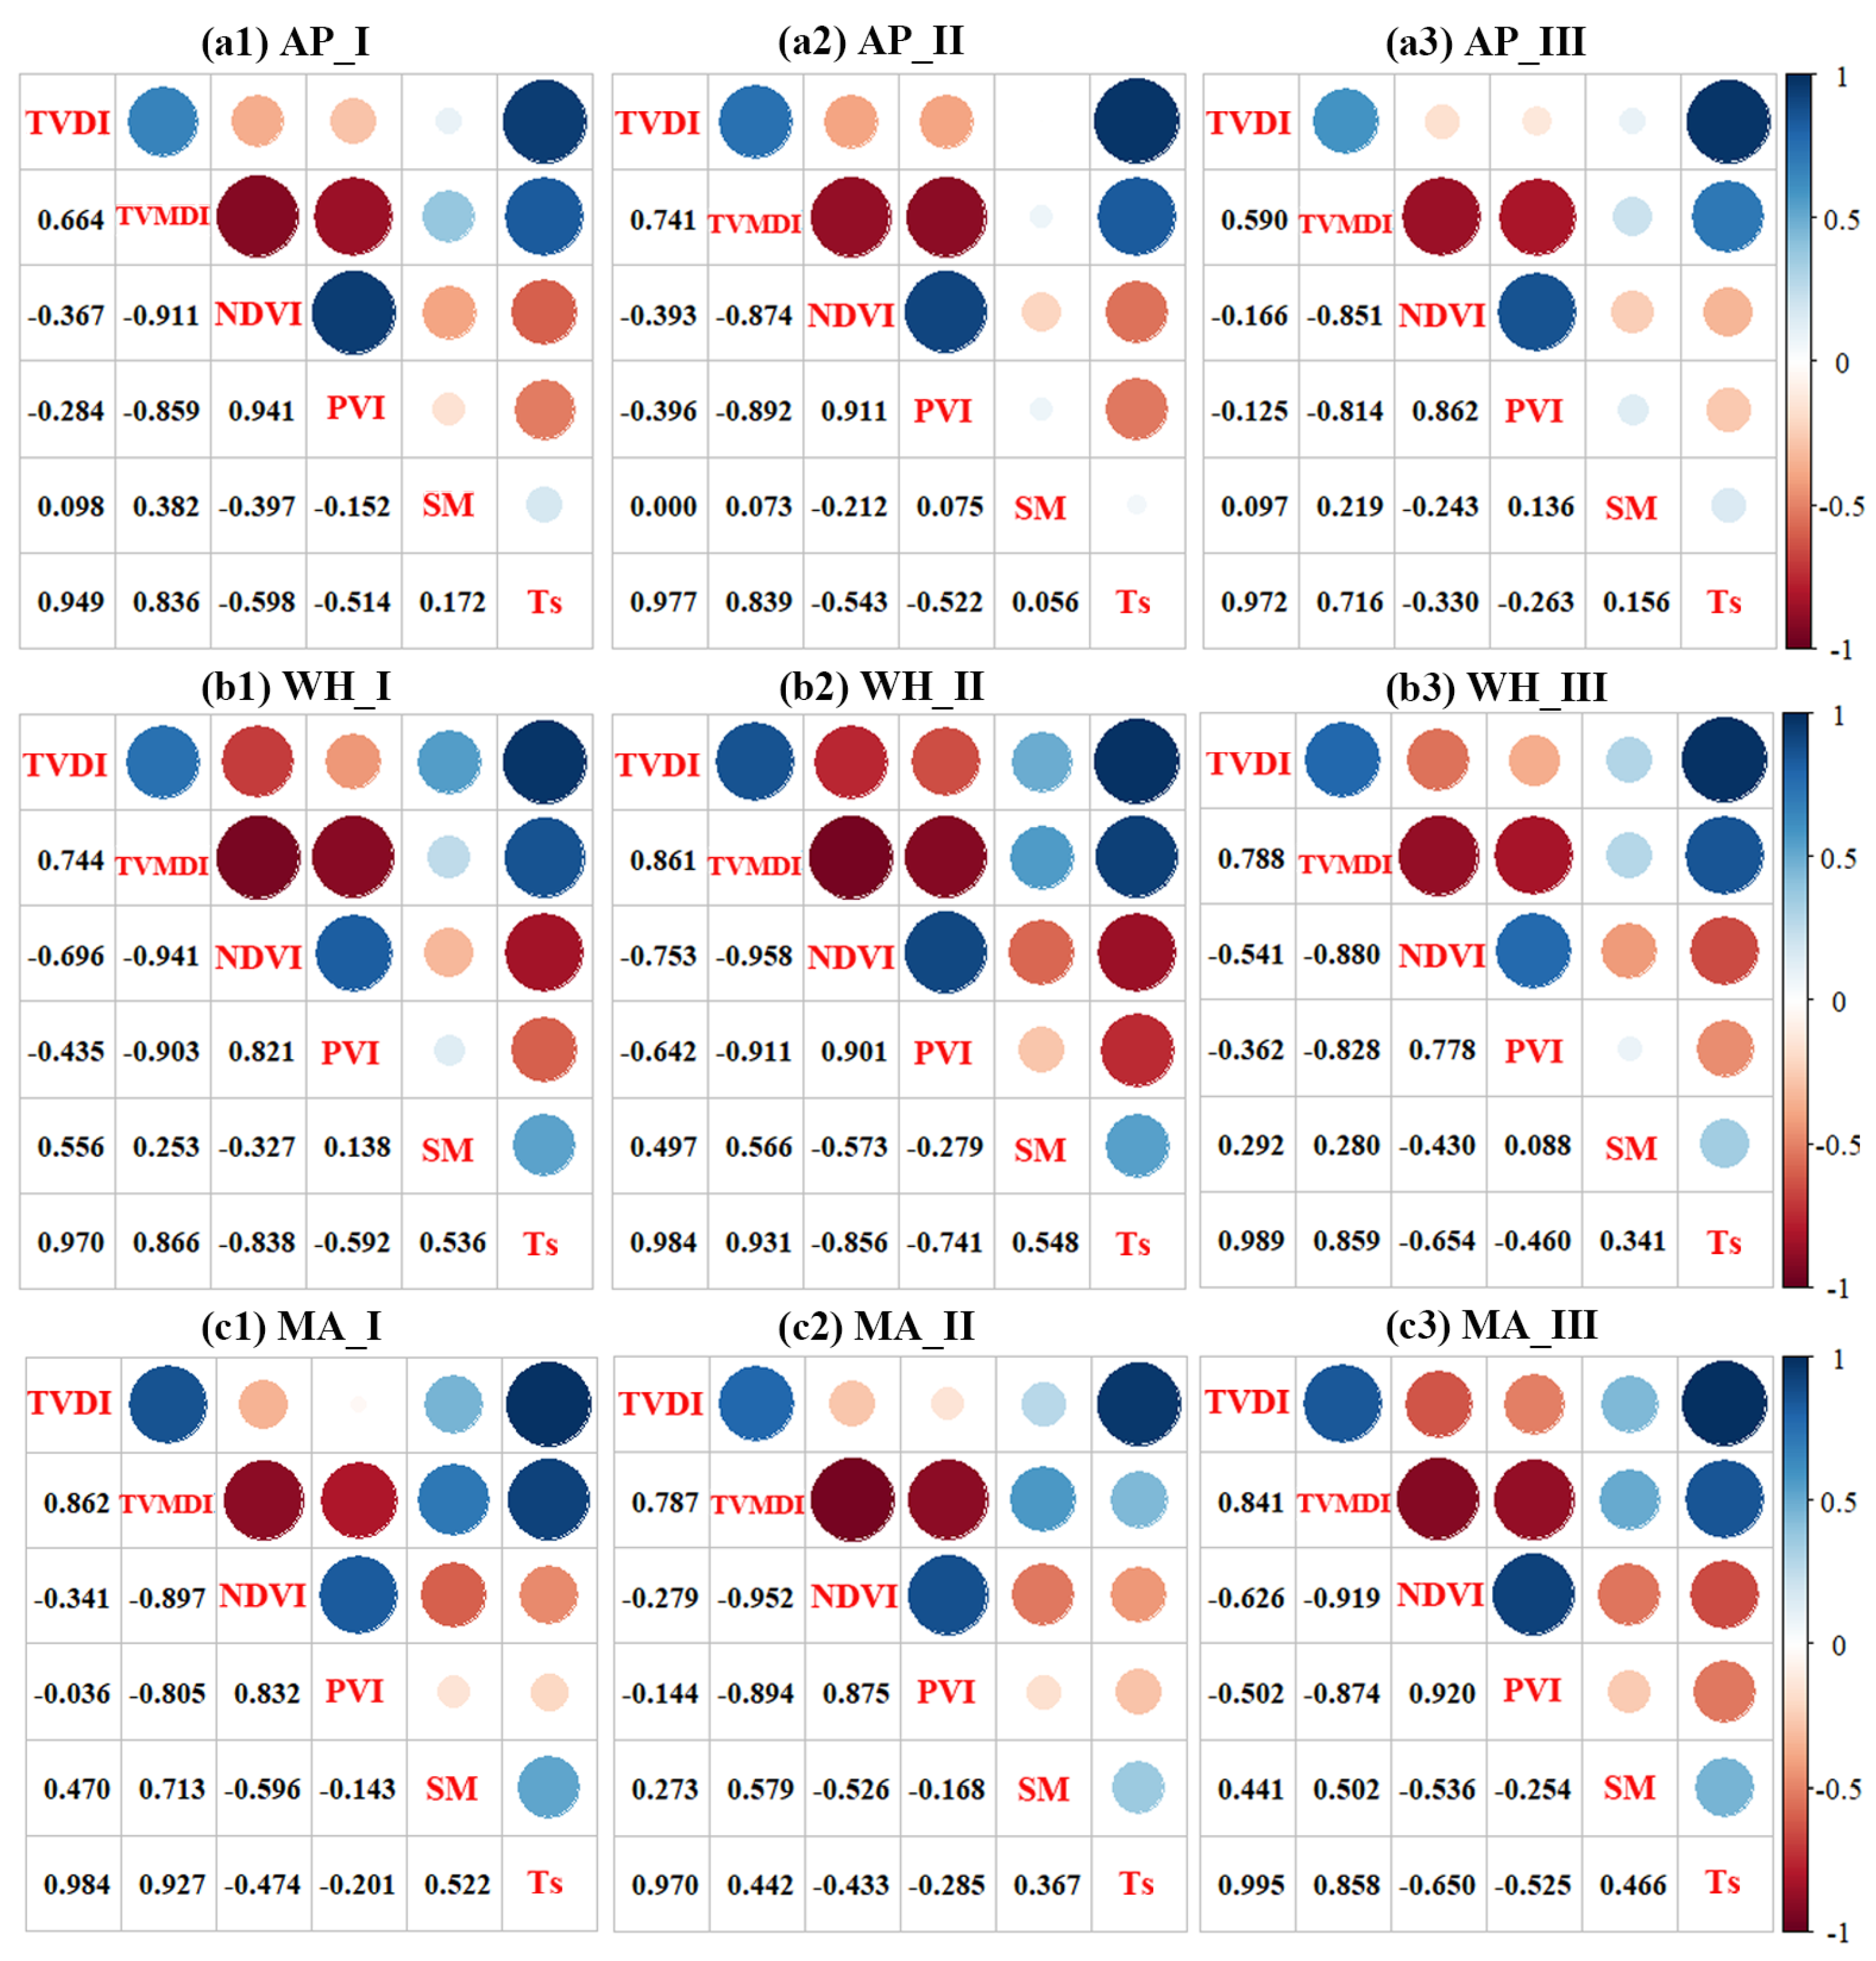
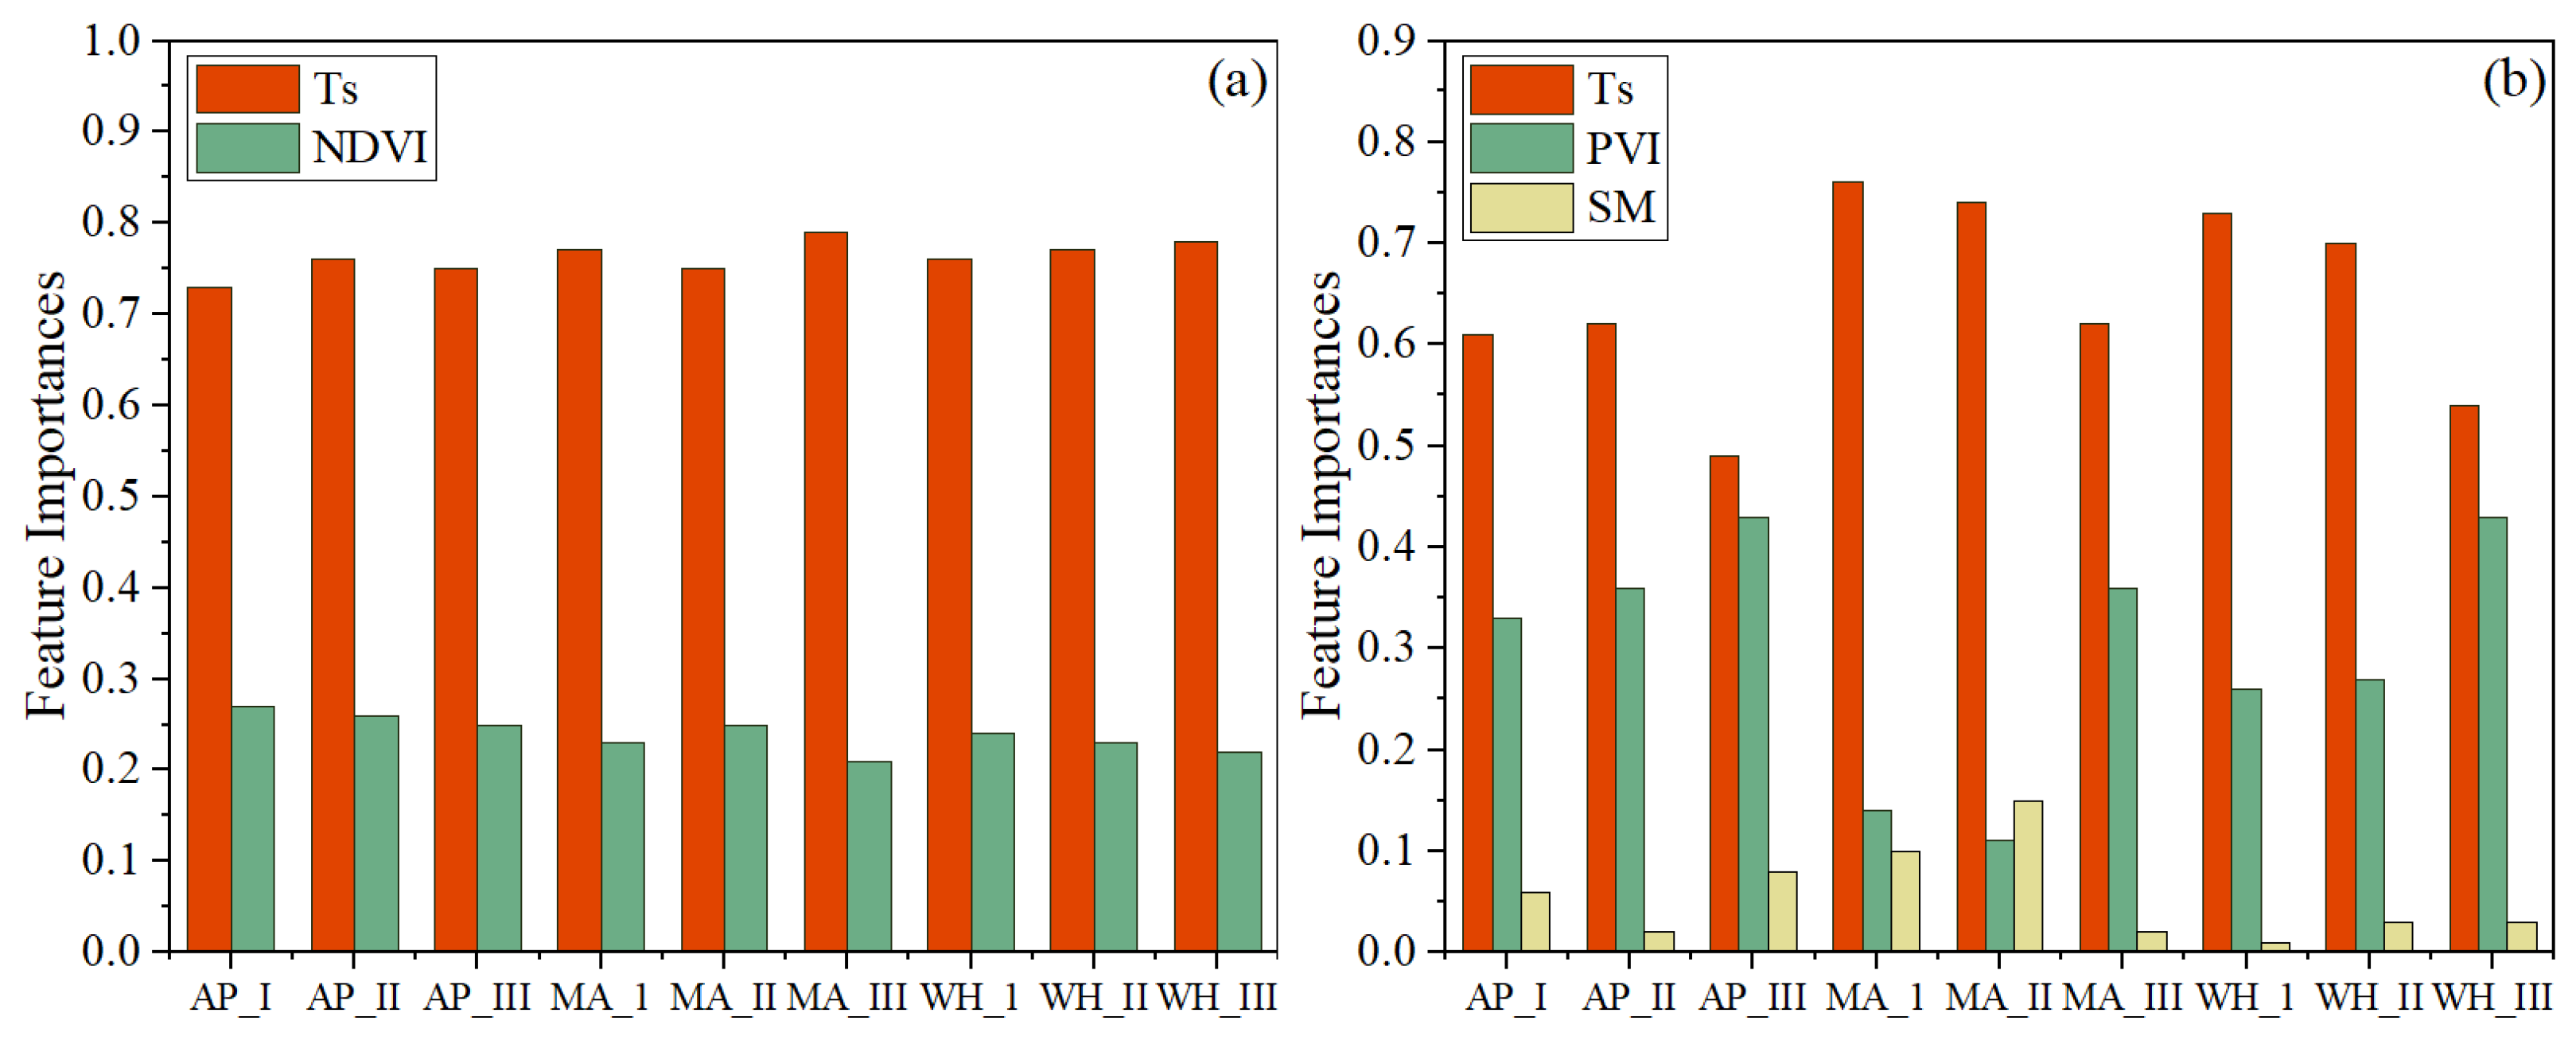
2.4.4. Impact Factor Analysis

We used the Pearson correlation coefficient to analyze the relationships between the NDVI, PVI, Ts, and PVI with the TVDI and TVMDI. Additionally, we employed the Random Forest regression model [50] to analyze the contributions of the Ts and NDVI to the TVDI, as well as the contributions of the Ts, PVI, and SM to the TVMDI.

3. Results

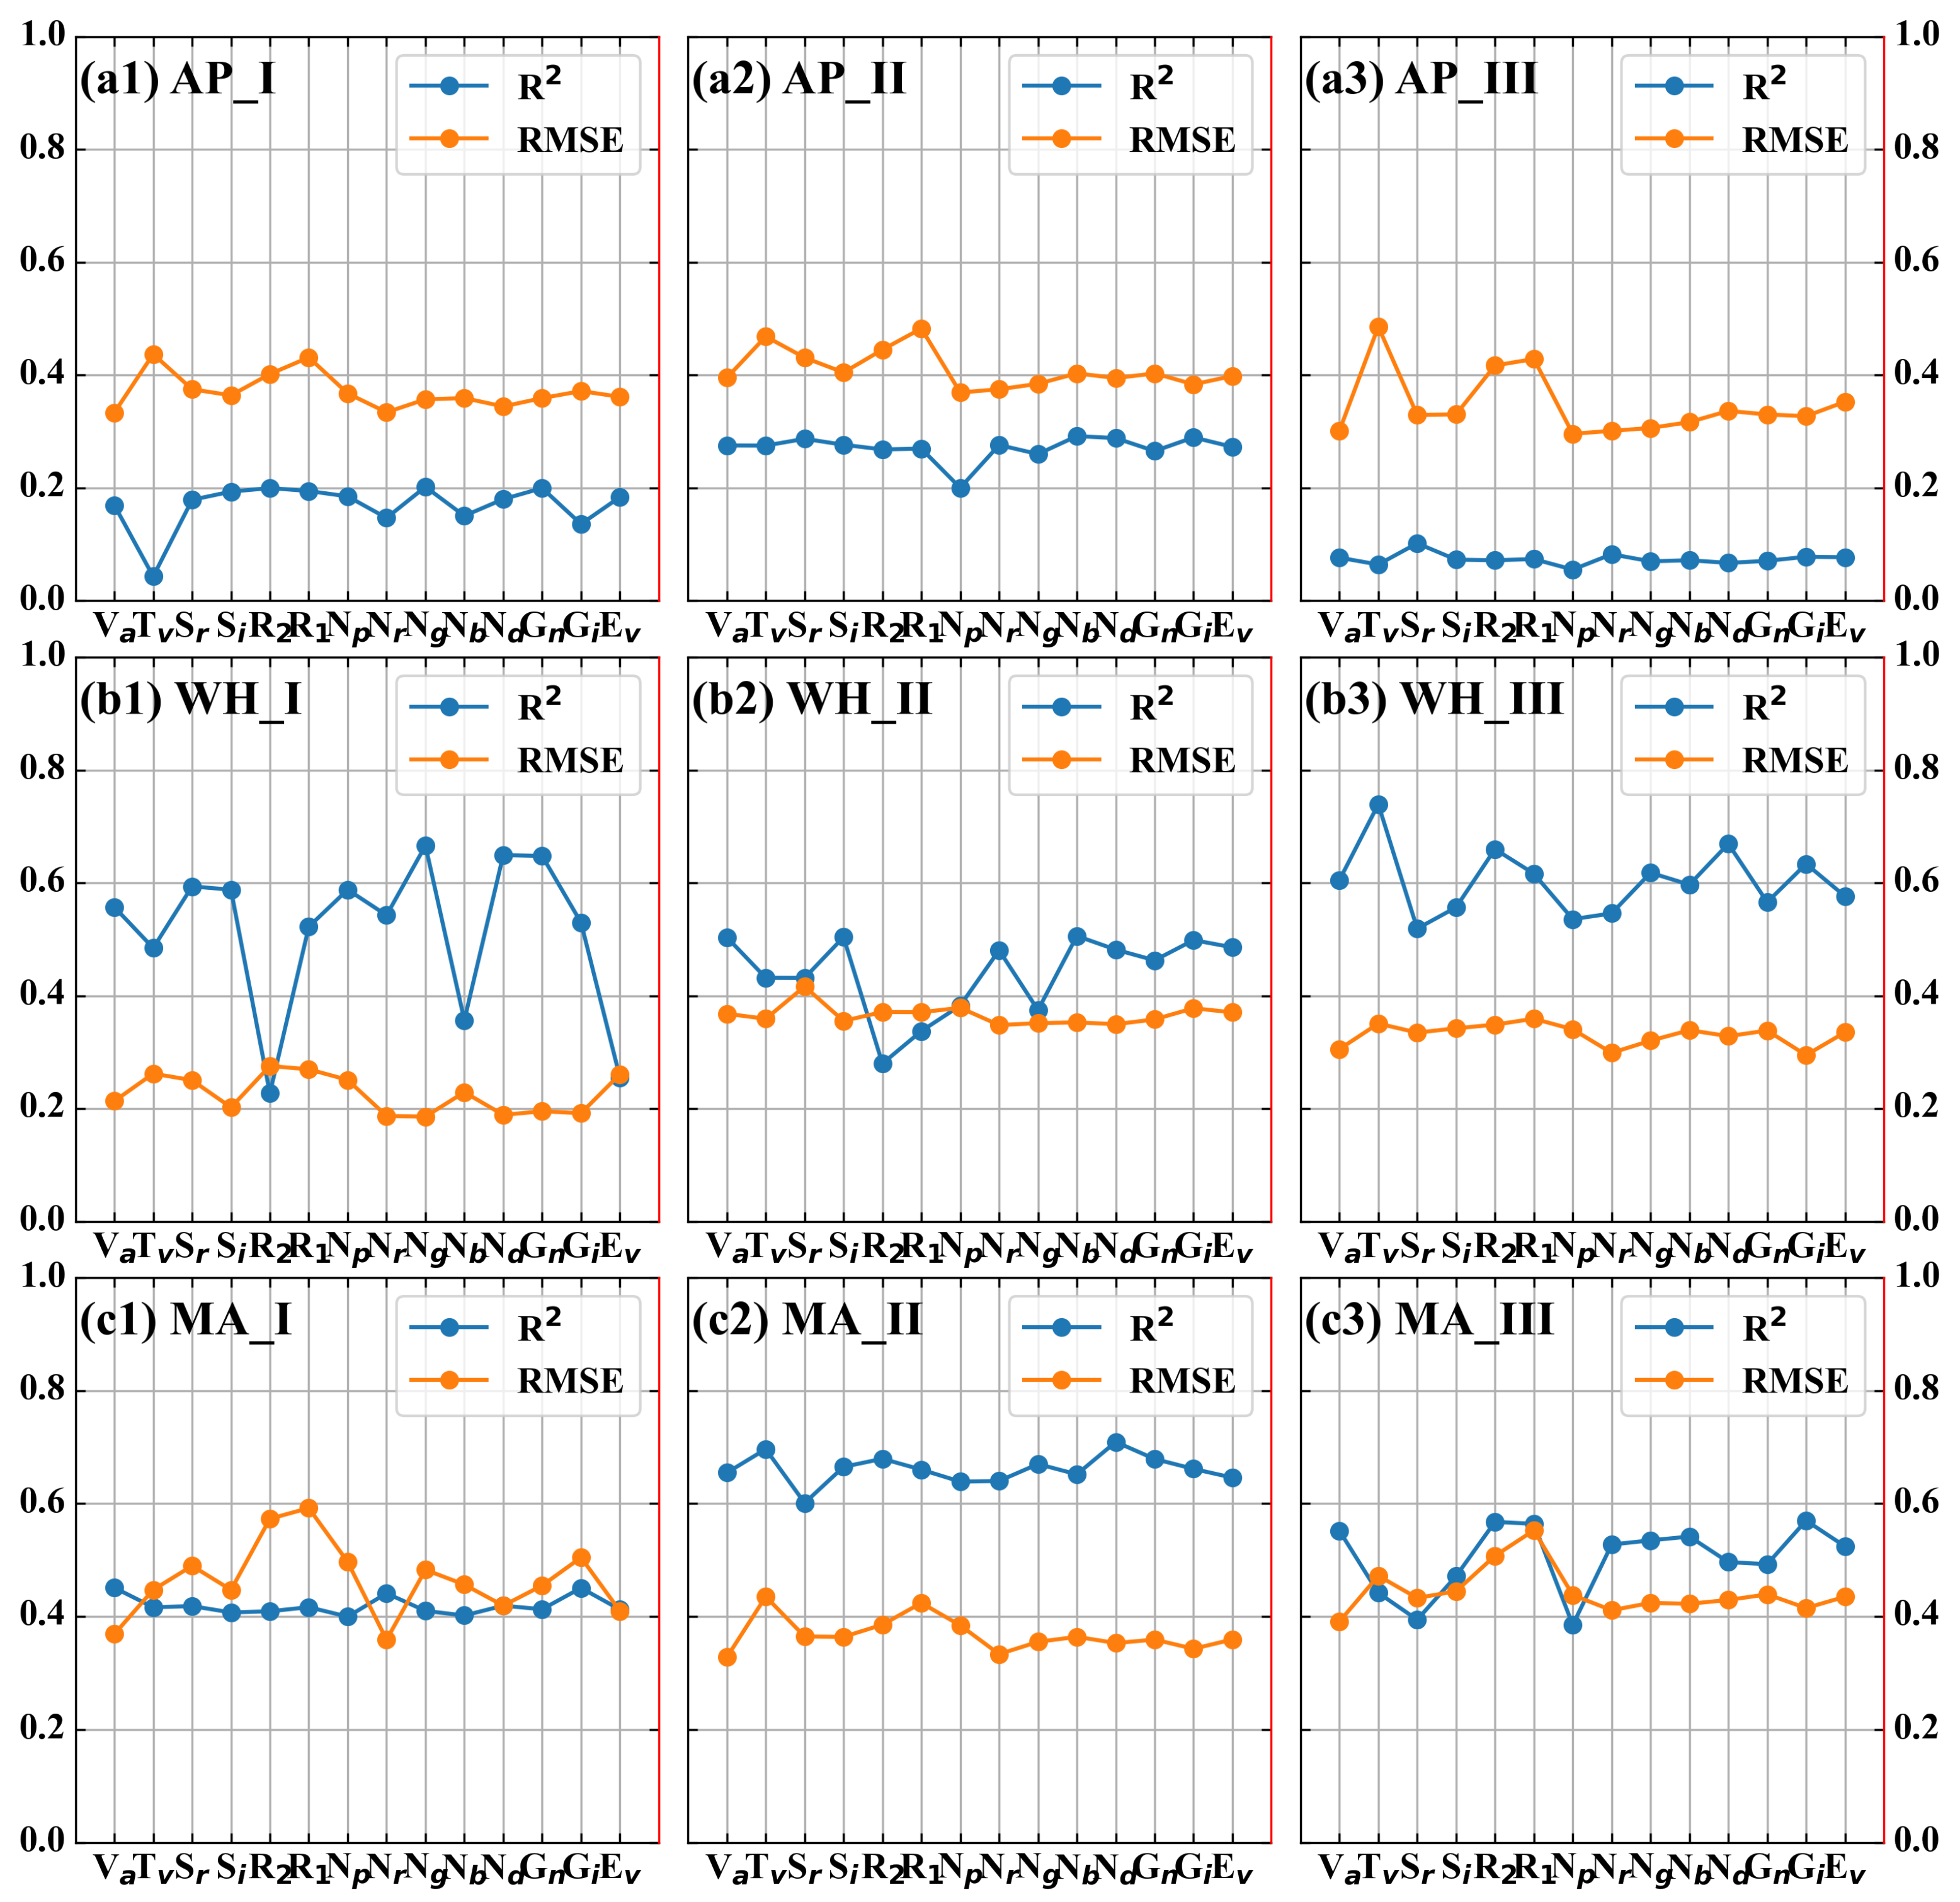
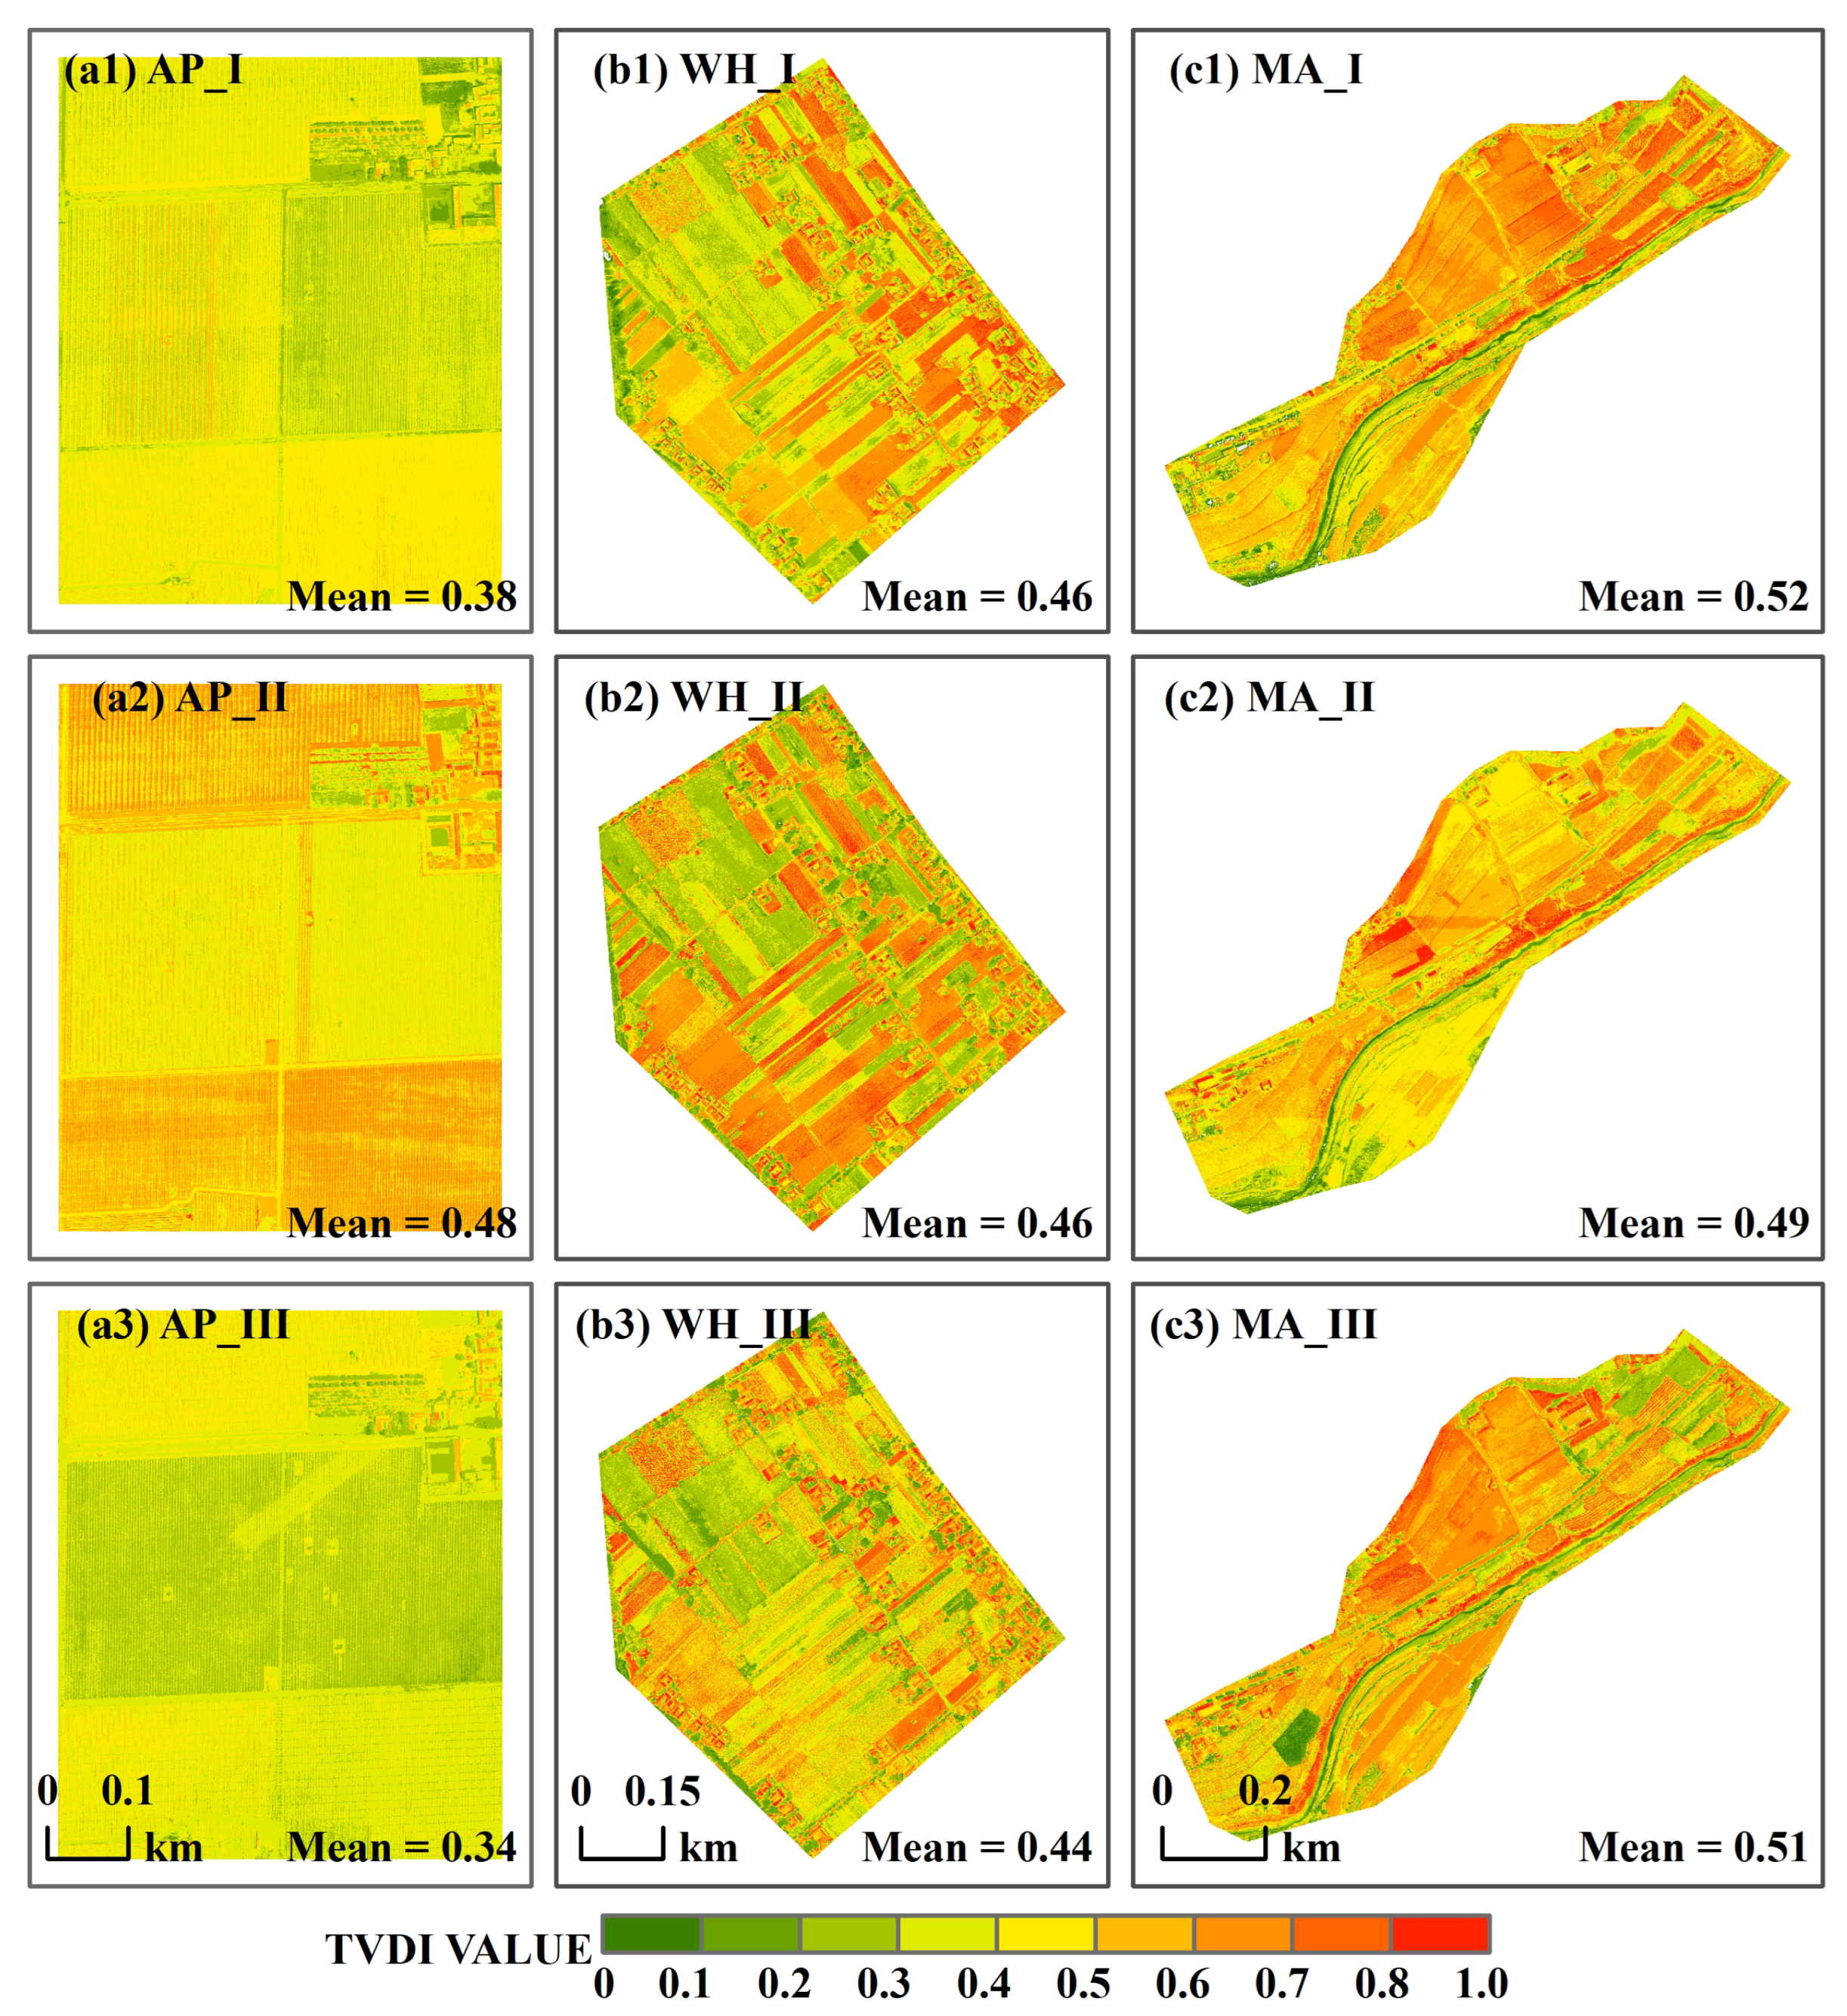
3.1. Comparison of Different VI-Based TVDIs

The TVDI was constructed based on the VARI, TVI, SRPI, SIPI, RVI2, RVI, NPCI, NGRDI, NGI, NGBDI, NDVI, GNDVI, GI, and EVI, respectively. The coefficients of determination ( R 2 ) and the root mean square error (RMSE) were used for evaluating the degree of coincidence between the measured MDI and calculated TVDI.
Figure 3 shows that the R 2 between the TVDI and MDI is lower than 0.3 in the apple orchard plot. However, for the wheat and maize plots, the average R 2 values are 0.52 and 0.53, respectively. This suggests that while the TVDI is effective for monitoring dryness in dry regions with low-standing crops, it may not be suitable for orchards. We found that the TVDI constructed using the NDVI ( R 2 = 0.60), GNDVI ( R 2 = 0.56), VARI ( R 2 = 0.56), GI ( R 2 = 0.55), and NGI ( R 2 = 0.55) has a higher R 2 , while the TVDI constructed using the NGRDI (RMSE = 0.28), NGI (RMSE = 0.29), GI (RMSE = 0.29), NDVI (RMSE = 0.29), and VARI (RMSE = 0.30) has lower RMSE values among all vegetation indices (VIs) in the wheat plot. In the maize plot, the TVDI constructed using the GI ( R 2 = 0.56), VARI ( R 2 = 0.55), RVI2 ( R 2 = 0.55), NDVI ( R 2 = 0.54), and NGI ( R 2 = 0.54) has a higher R 2 , while the TVDI constructed using the VARI (RMSE = 0.36), NGRDI (RMSE = 0.37), NDVI (RMSE = 0.40), EVI (RMSE = 0.40), and NGBDI (RMSE = 0.41) has lower RMSE values. Since lower RMSE and higher R 2 values indicate better precision in dryness estimation, it is evident that the TVDI constructed using the NDVI and VARI exhibited both lower RMSE and higher R 2 values across all VIs in this study for both maize and wheat plots. Therefore, the TVDI based on the NDVI and VARI can be regarded as effective for monitoring dryness in different dry farmland areas.

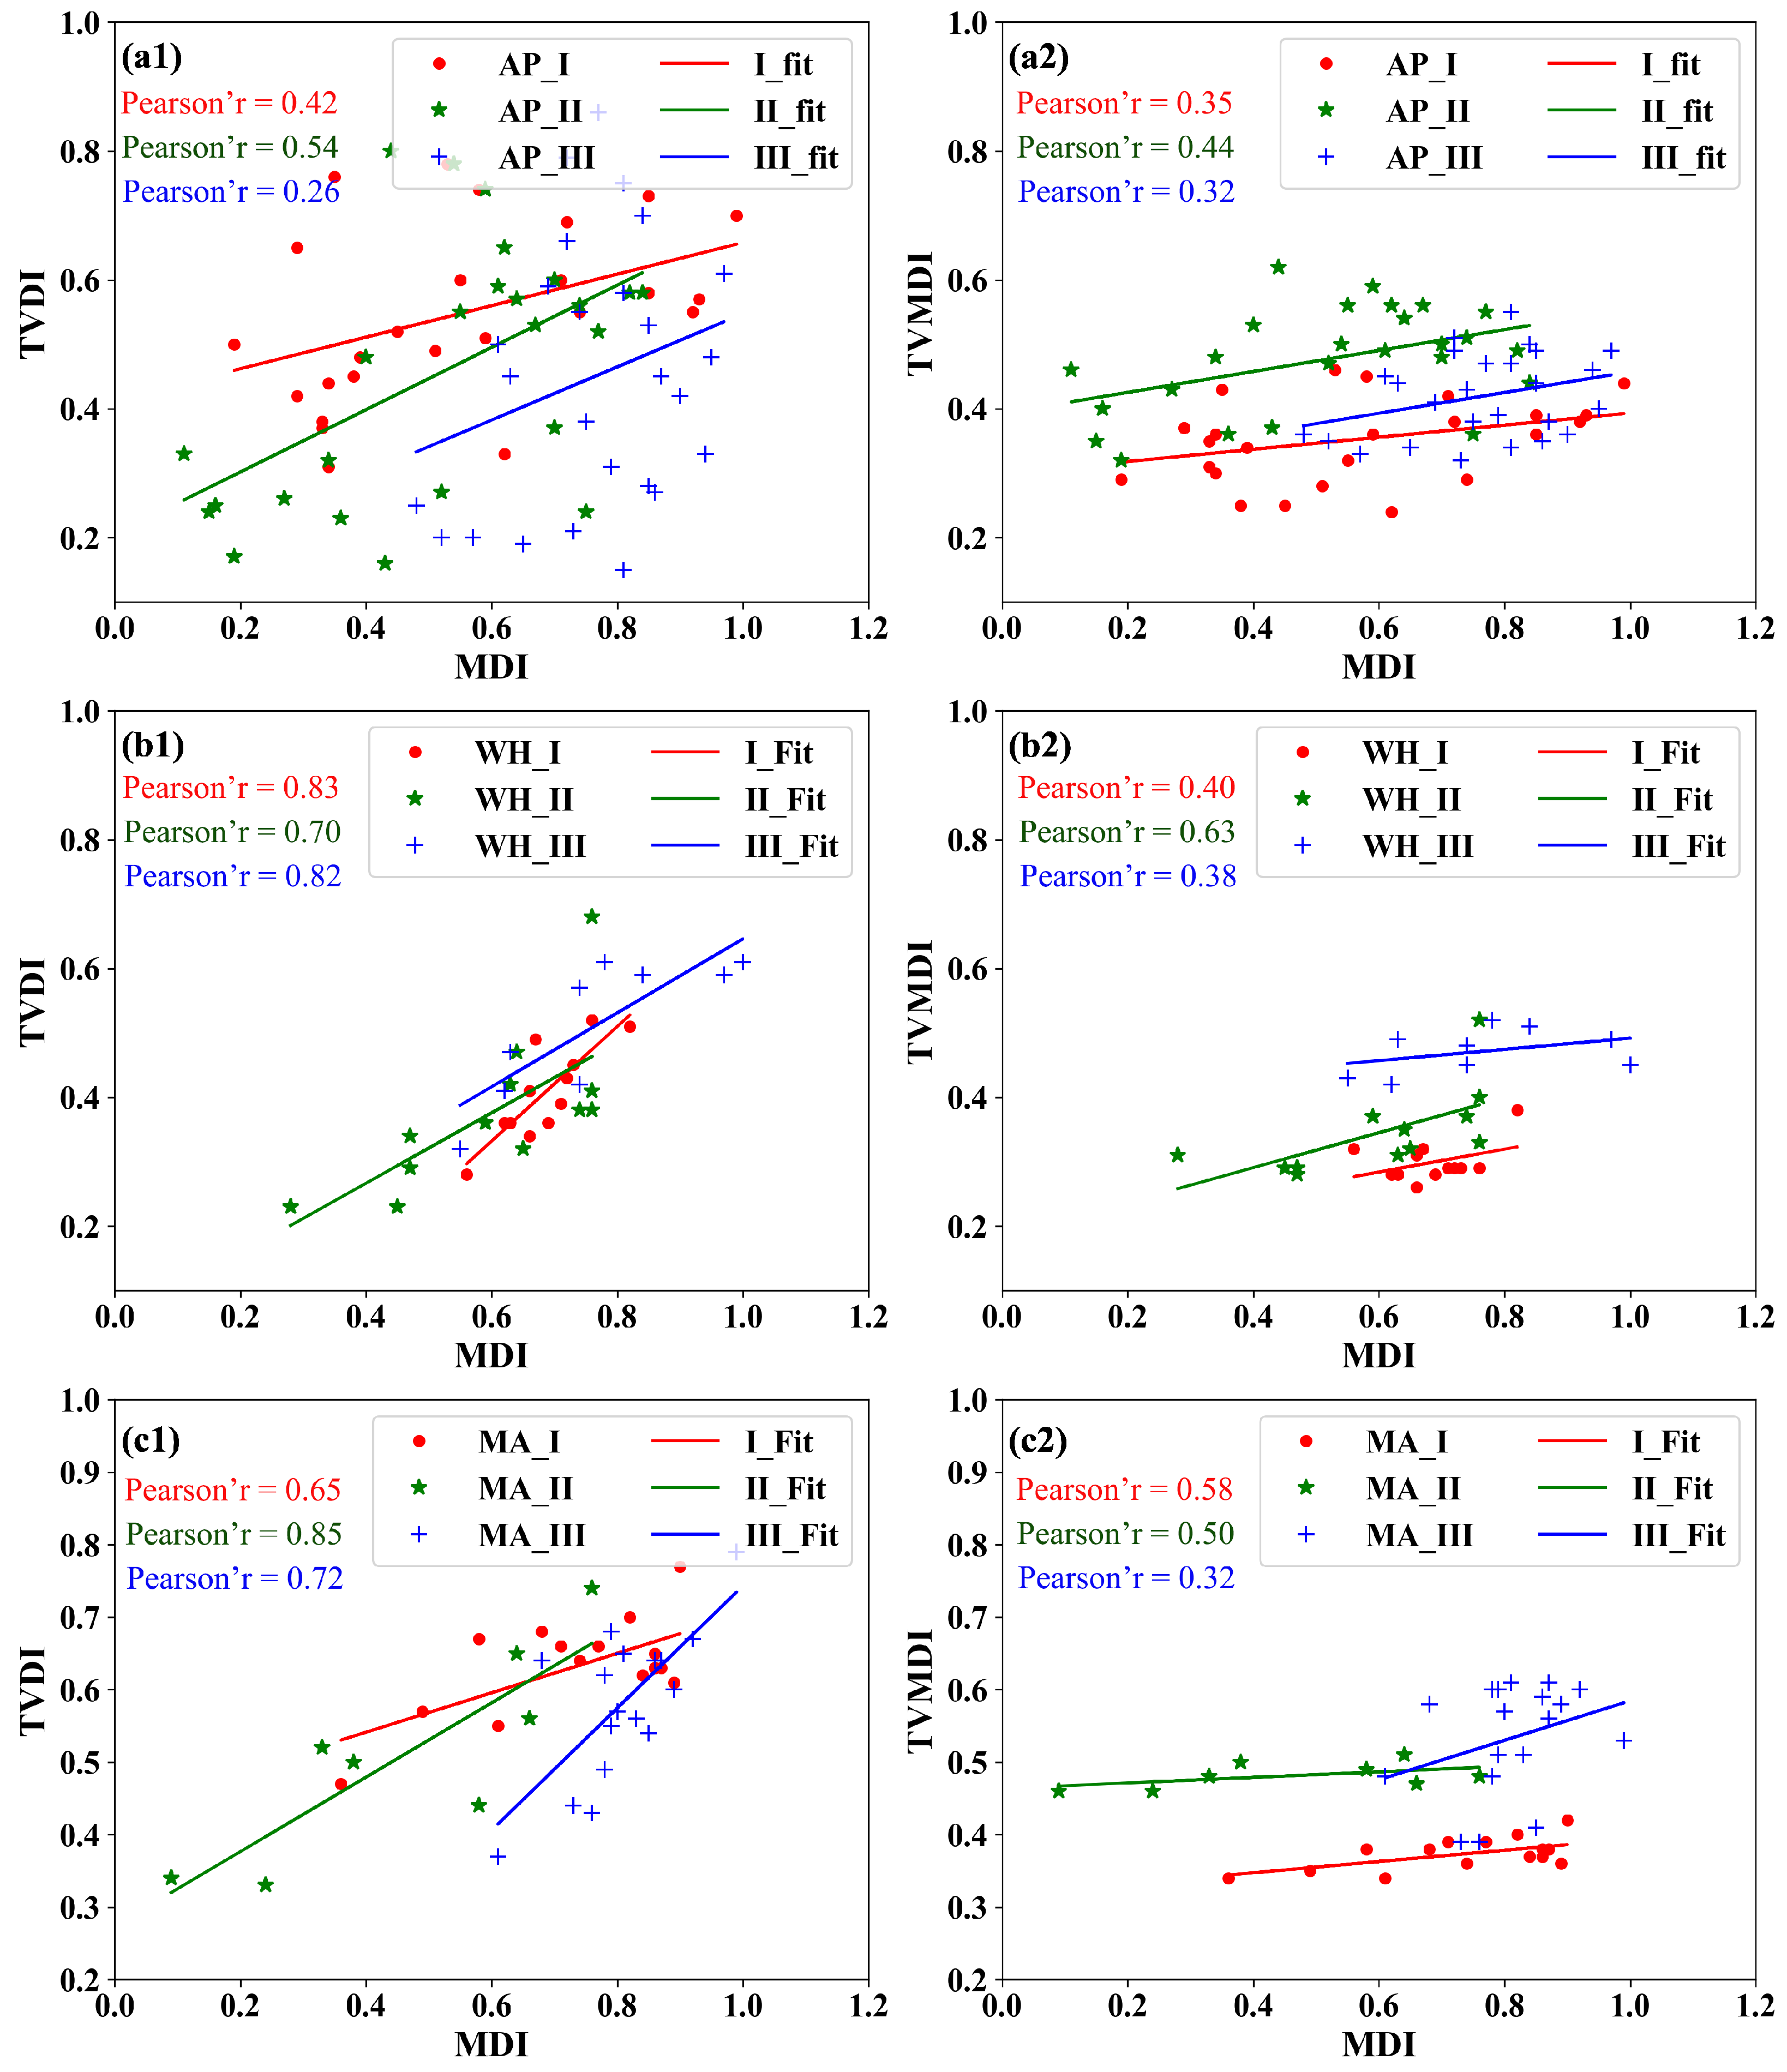
3.2. Estimation Accuracy of TVDI and TVMDI

Figure 4 and Table 3 shows that the TVDI demonstrates higher sensitivity and precision than the TVMDI in dryness monitoring. In the wheat and maize plots, when MDI values were between 0 and 1, the TVDI ranged from 0.2 to 0.9, while the TVMDI ranged from 0.2 to 0.6. The mean correlation coefficient and mean RMSE of the TVDI with the MDI were 0.64 and 0.24, respectively, compared with 0.43 and 0.31 for the TVMDI. This indicates that the TVDI has superior performance in monitoring dryness conditions.

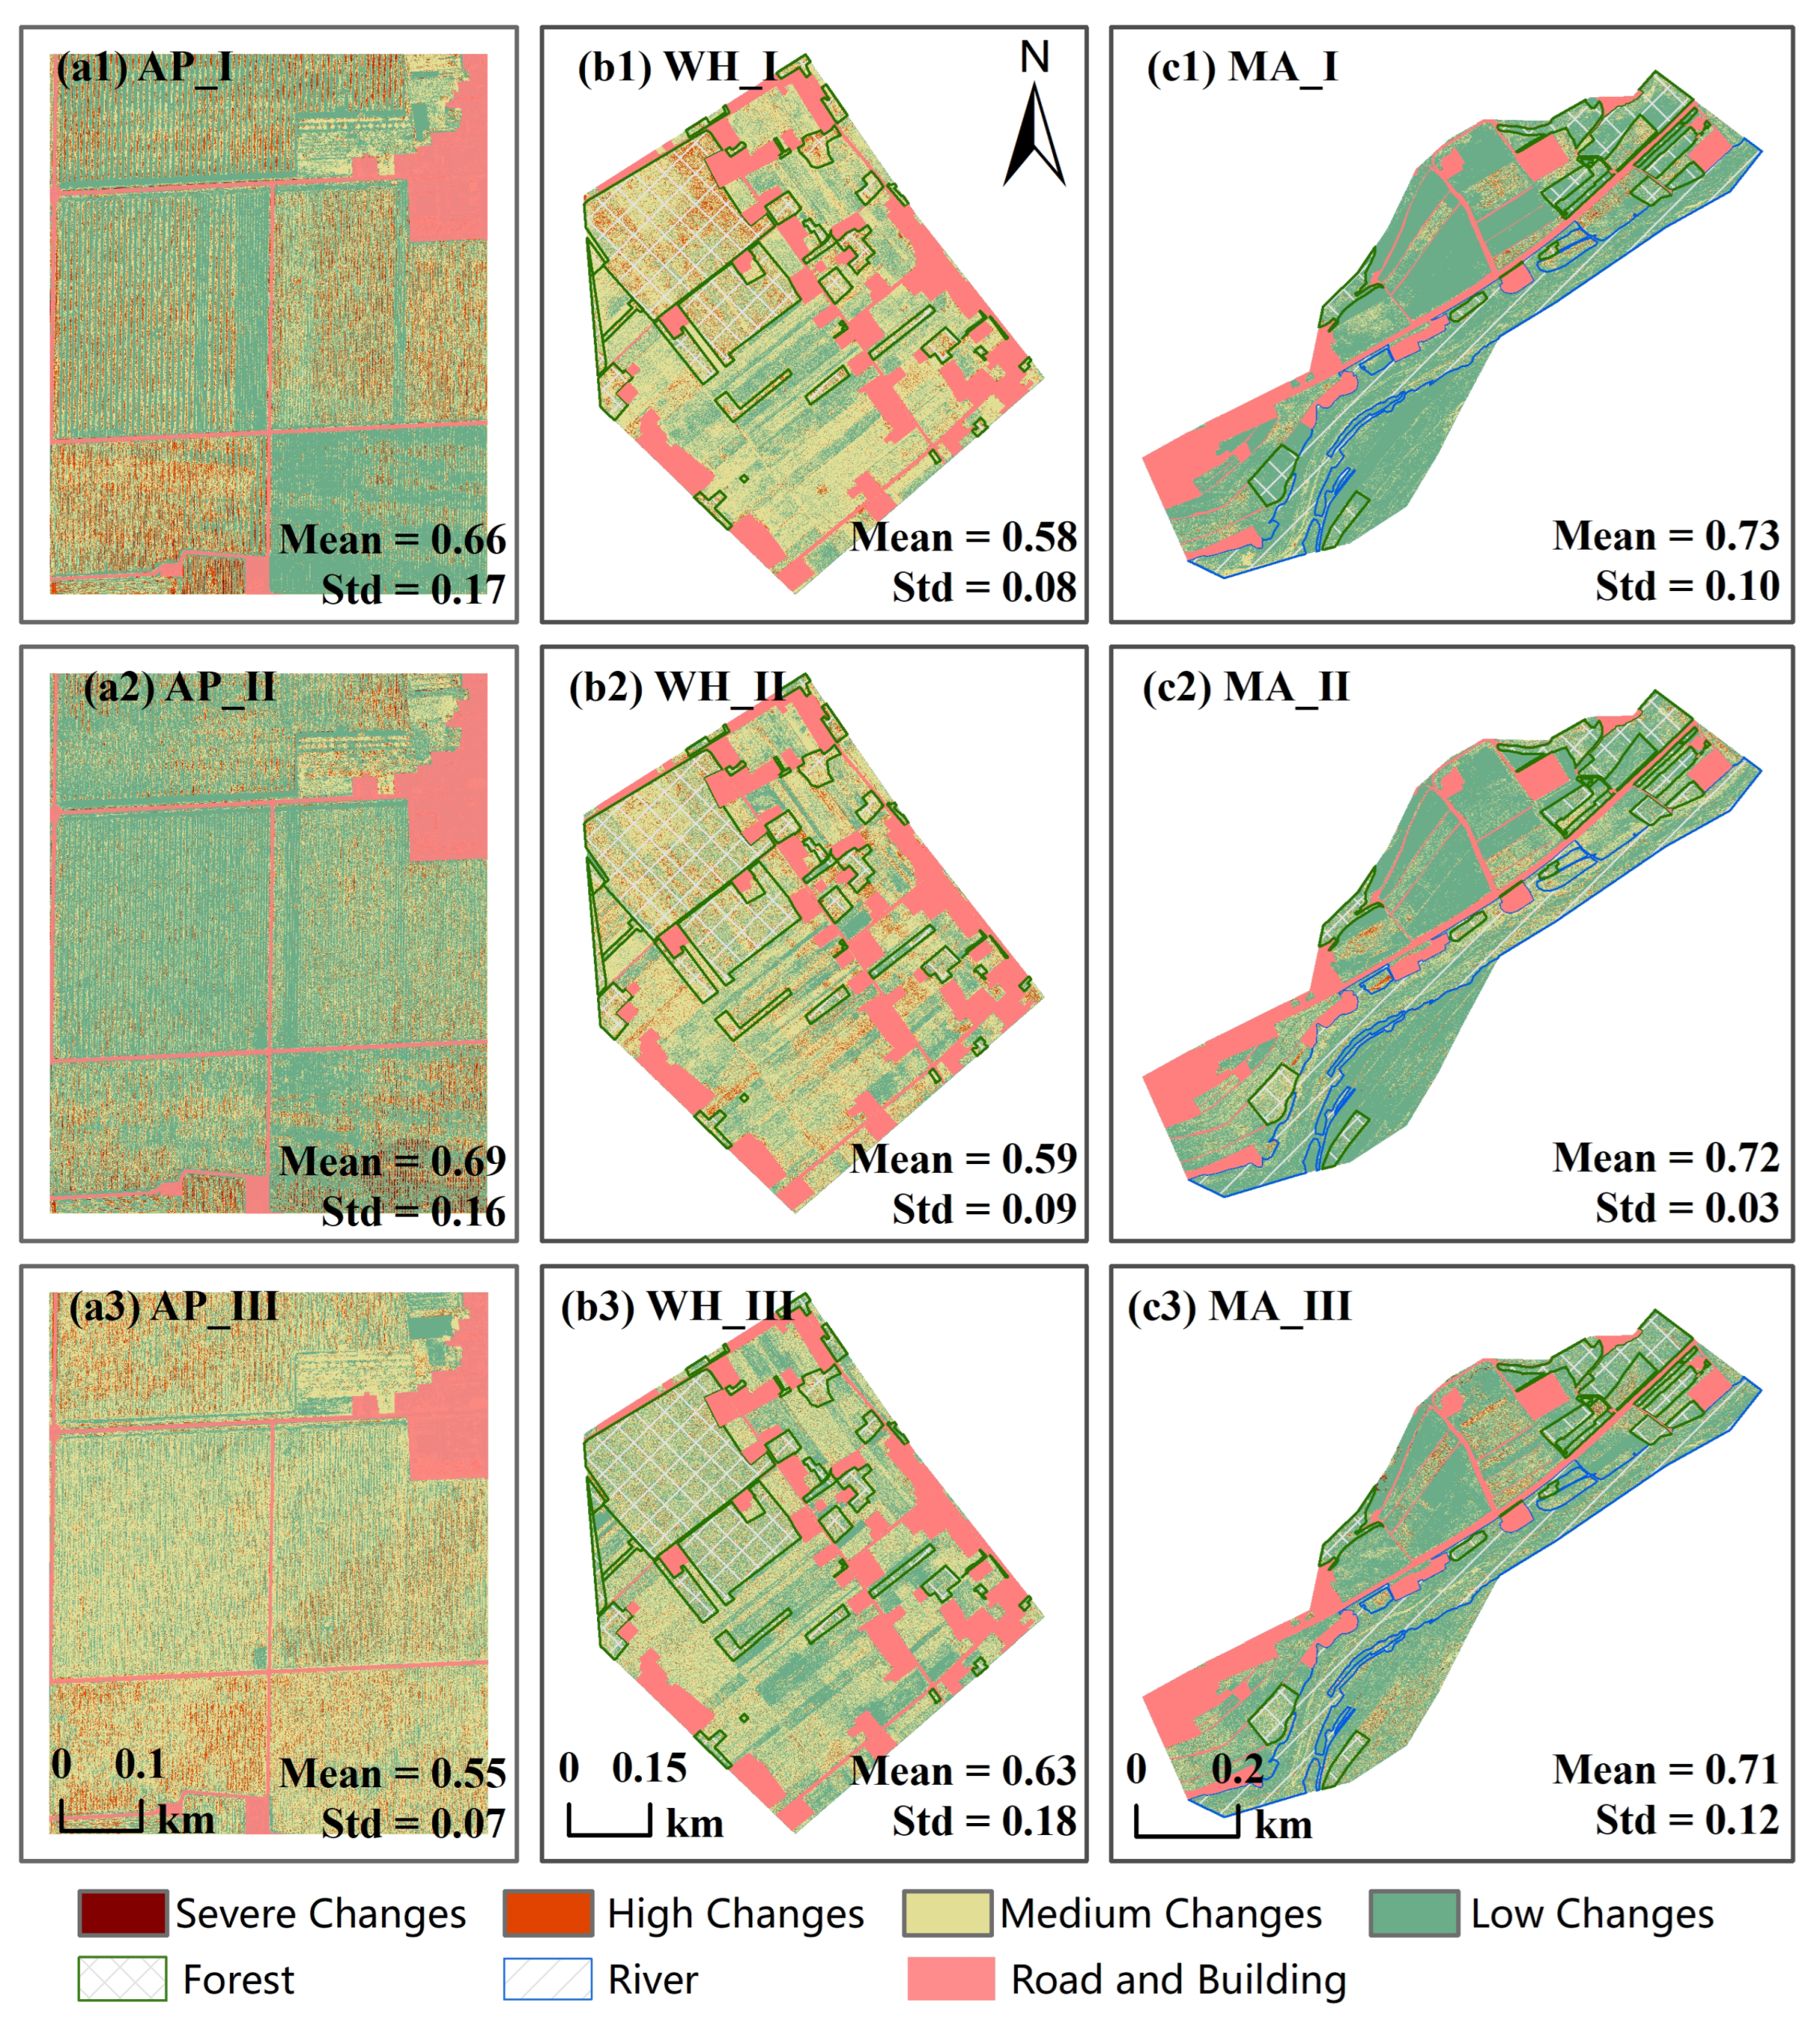
3.3. Spatial Differences Between TVDI and TVMDI Based on GSSIM

To enhance the understanding of the spatial differences between the TVDI and TVMDI based on GSSIM, woodlands, rivers, buildings, and roads were extracted from the three experimental plots. The remaining areas were cropland. Figure 5 shows that GSSIM was predominantly characterized by medium and low changes across all experiments, with these areas accounting for more than 85% of the total area. The average area percentage of GSSIM moderate changes was 45.43%, 62.71%, and 24.13%, while low changes accounted for 41.82%, 30.44%, and 72.13% during the three experiments in the apple orchard, wheat, and maize plots, respectively. This indicates that the spatial difference between the TVDI and TVMDI was smallest in the maize plot and largest in the wheat plot.
The GSSIM spatial distributions exhibited significant field variability in the wheat and maize plots. Areas with dense crop coverage (NDVI greater than 0.7), non-emergent crops, or bare soil after harvest were predominantly characterized by low changes in GSSIM. In contrast, croplands with sparse crop coverage (NDVI between 0.2 and 0.7) and plastic-mulched croplands with low or sparse coverage (NDVI less than 0.2) showed a relatively higher proportion of moderate changes in GSSIM. In the apple orchard plot, the GSSIM spatial distribution displayed a distinct stripe texture. Areas between fruit tree rows, where spacing was evident, were dominated by low changes, while the fruit tree canopy areas were dominated by moderate or greater changes.

4. Discussion

4.1. Trend Analysis of TVDI Simulated by Different VIs

In this study, fourteen commonly used vegetation indices (VIs) were selected to separately construct the TVDI with surface temperature (Ts). The results indicated that the TVDI built using the NDVI and VARI showed a higher correlation with the MDI and a lower RMSE. To further analyze the impact of different VIs on the TVDI, data from the first experiment in the wheat plot and the second experiment in the maize plot were selected to simulate the variation trend of the TVDI with VIs under different temperature conditions. The temperature range was set from 10 °C to 75 °C, reflecting the thermal radiation temperature observed in the experimental plots, which ranged from 10 °C to 60 °C.
Figure 6 shows that the trends of the TVDI simulated by the 14 VIs are generally consistent across the two selected datasets. When the VI remained constant, TVDI values increased with rising temperatures. If the crop’s growth status is similar, a lower canopy temperature indicates higher evapotranspiration and sufficient plant water. Conversely, when crops experience water stress, stomatal conductance decreases, leading to an increase in canopy temperature [51,52]. The trend of the TVDI with NDVI analyzed by this paper is consistent with the findings in [26]. The trends of the TVDI simulated based on fourteen VIs varied widely. The TVDI simulated based on the EVI, GNDVI, NDVI, VARI, EVI, SIPI, NGBDI, NGRDI, and NPCI increased with an increasing vegetation index, and the larger the vegetation index was, the greater was the rate of change in TVDI values. Due to the narrow range of values, the TVDI simulated based on the NGBDI, NGRDI, and NPCI increased rapidly with the increase of VI. The TVDIs simulated based on the GI, RVI, RVI2, SRPI, and TVI are all parallel lines with a slope close to 0, so the change in the VI has little effect on the TVDI. Therefore, the trends of the TVDI simulated based on the NDVI, GNDVI, VARI and EVI are more consistent with the characteristics of crop response to water stress. Combined with the results in Section 4.3, the NDVI and VARI can be considered as the optimal vegetation indices for constructing the TVDI, where the NDVI is a widely used index for monitoring the vegetation growth status [53,54], and the VARI can be effectively used for chlorophyll and leaf area index inversion [55,56].

4.2. Performance of TVDI in Monitoring Drought

The TVDI is better for dryness monitoring in rain-fed farmlands by validating the TVDI and TVMDI with the MDI in Section 4.2. The TVDI was first proposed by [32] and successfully applied in drought monitoring in semi-arid regions. Ref. [57] applied the TVMDI, TVDI, and TVSDI to evaluate drought in the continental United States and found that the performance of the TVDI and TVMDI to monitor drought differs in different climate zones. Ref. [58] found that the TVDI has a good ability to monitor drought in the semi-arid zone in China. Therefore, the TVDI is more suitable for agricultural dryness and drought monitoring in semi-arid climate zones. This section further analyzes the applicability of the TVDI for monitoring dryness in different plots of different growth periods.
Figure 7 shows that the spatial distribution of the TVDI is affected by multiple factors such as crop type, crop growth, growth period, and field mulching. In the apple orchard plot, lower TVDI values were mainly found in the central part of the plot planted with young apple trees, and higher TVDI values were found in the north and south region of the plot, where grafted fruit tree seedlings are planted. All three experiments in the wheat and maize plots showed that the TVDI was lower in the nursery planted with pine and willow, and the TVDI was higher in the bare soil farmland where crops had not emerged. The high temperature of bare soil leads to rapid soil moisture evaporation. As crop cover increased, leaf transpiration rate accelerated, canopy temperature decreased, and TVDI values decreased.
In the wheat and maize plots, mulched farmland made up 28.84% and 15.08% of the total plot area, respectively. Mulched farmlands were mainly planted with spring maize, which was in the sowing, seeding, and jointing periods, respectively, during the three experiments. The mean TVDI values of the mulched farmland in the wheat plot were 0.60, 0.67, and 0.48, respectively, and in the maize plot were 0.61, 0.57, and 0.54, respectively. During sowing and emergence periods, mulched and bare soil surfaces distributed alternately and had high thermal radiation in the daytime. As the thermal radiation would further increase when the farmland suffered from water stress [59], the temperature was high, but the NDVI value was low, resulting in higher dryness. When the maize went into the jointing period, the canopy temperature decreased while the NDVI increased, leading to a decrease in the TVDI. However, plastic mulch can reduce evaporation and increase soil moisture [60,61], so the TVDI is unsuitable for monitoring dryness in mulched farmland at the beginning of the crop growth.
The TVDI was constructed based on empirical coefficients calculated from remote sensing images, and, theoretically, the TVDI estimated based on different remote sensing data had poor comparability [62]. In our experiment, the mean value of the TVDI in the apple orchard plot was lower than 0.48 and the minimum was 0.34; the mean values of the TVDI in the wheat and maize plots were higher than 0.44 and 0.49. The degree of dryness in the apple, wheat, and maize plots enhanced sequentially. The mean values of the MDI for the three plots in the three experiments were 0.55, 0.68, and 0.74, respectively, and the mean values of the TVDI and MDI were significantly correlated ( R 2 = 0.77, p < 0.05), indicating that the TVDI can reflect the dryness differences among plots.

4.3. Impact Factor Between TVDI and TVMDI

We compared the spatial structural differences between the TVDI and TVMDI based on GSSIM in Section 3.3. The results indicated significant differences between the TVDI and TVMDI in un-mulched farmland with sparse crop cover (NDVI ranging from 0.2 to 0.7), mulched farmland, and apple canopy areas. We further assessed the impacts of the NDVI, Ts, PVI, and SM on the TVDI and TVMDI using correlation coefficients and the Random Forest model. As shown in Figure 8, the TVDI was highly positively correlated with Ts, with a correlation coefficient exceeding 0.95. In contrast, the TVDI was negatively correlated with the NDVI, with an absolute negative correlation coefficient below 0.75. The correlation coefficients between the TVMDI and PVI, as well as between the TVMDI and Ts, were numerically close but opposite in direction. The absolute negative correlation coefficient between the TVMDI and PVI was above 0.86, while the average positive correlation coefficient between the TVMDI and Ts was 0.81. The correlation coefficient between the TVMDI and SM ranged from 0.07 to 0.71. Figure 9a demonstrates that the importance values of the Ts and NDVI for the TVDI were similar across the three crop plots during the three observation periods. The average importance values of the Ts and NDVI for the TVDI were 0.76 and 0.24, respectively. Figure 9b shows that the importance values of the Ts, PVI, and SM for the TVMDI varied across different test areas and observation periods. The average importance values of LST (land surface temperature) for the TVMDI in the apple, wheat, and corn test areas were 0.57, 0.71, and 0.66, respectively. The average importance values of the PVI for the TVMDI were 0.37, 0.20, and 0.32, respectively. The highest importance value for SM was only 0.15. Therefore, both the correlation analysis and feature importance assessment indicate that Ts is the dominant factor influencing the TVDI. Ts is also a primary feature for the TVMDI, while the role of the PVI in the TVMDI cannot be overlooked.
We just analyzed the difference between the TVDI and TVMDI in terms of correlation. However, the TVDI and TVMDI are not simply linear related to the NDVI, Ts, and SM [51]. The physical properties of soil, topography, and climatic conditions all affect drought conditions [52,63]. In our subsequent studies, we will integrate multiple indicators from remote sensing, meteorology, hydrology, etc., and use the nonlinear fit function or physical models to improve the accuracy of dryness monitoring.

5. Conclusions

In this study, UAV remote sensing data were utilized to calculate drought indices, including the temperature vegetation drought index (TVDI) and the temperature–vegetation–soil moisture dryness index (TVMDI). The applicability and differences of these indices in monitoring drought under natural conditions were analyzed across three experimental areas. Fourteen commonly used vegetation indices were selected for calculating the TVDI, and the optimal vegetation index was identified. The results indicate that the TVDI constructed using the NDVI and VARI proved more stable and effective for dryness monitoring in complex and variable surface environments. A comparison between the TVDI and TVMDI using correlation analysis and GSSIM revealed that the TVDI exhibits higher sensitivity and accuracy in monitoring dryness than the TVMDI. While the spatial structure of the two indices was similar in areas with bare soil (NDVI less than 0.2) and dense crop cover (NDVI greater than 0.7), significant differences were observed in areas with sparse crops (NDVI between 0.2 and 0.7) and mulched fields. This disparity is primarily due to the different major influencing factors for the TVDI and TVMDI. The correlation coefficient between the TVDI and surface temperature (Ts) was above 0.95, whereas the correlation coefficients between the TVMDI and the PVI, and between the TVMDI and Ts, were -0.86 and 0.81, respectively. We evaluated the suitability of the TVDI and TVMDI for dryness monitoring from three experimental plots. Compared with a single independent experiment in an individual plot, this approach reduces errors in the results. The TVDI was constructed using a linear equation that heavily depends on remote sensing data. However, the degree of dryness can be influenced by factors such as soil structure, tillage activities, rainfall, and crop type, each of which affects dryness in a nonlinear manner. To address this, our future research will aim to integrate multiple datasets and develop nonlinear or physical models to enhance the precision of dryness monitoring. Moreover, the scale effect of UAV remote sensing data in dryness monitoring warrants further investigation.

Author Contributions

Conceptualization, J.Z. (Juan Zhang), Y.Q., Q.L. and J.Z. (Jinlong Zhang); methodology, J.Z. (Juan Zhang), Y.Q. and H.W.; software, J.Z. (Juan Zhang) and R.Y.; validation, J.Z. (Juan Zhang), Q.L. and X.L.; formal analysis, J.Z. (Juan Zhang), Y.Q. and H.W.; investigation, J.Z. (Juan Zhang), J.Z. (Jinlong Zhang), Q.L. and X.L.; resources, J.Z. (Juan Zhang) and Y.Q.; data curation, J.Z. (Juan Zhang); writing—original draft preparation, J.Z. (Juan Zhang); writing—review and editing, J.Z. (Juan Zhang), Y.Q. and H.W.; visualization, J.Z. (Juan Zhang); supervision, Y.Q.; project administration, J.Z. (Jinlong Zhang); funding acquisition, X.L. All authors have read and agreed to the published version of the manuscript.

Funding

This work was funded by Key Research and Development Program of Gansu Province (Grant No. 23YFGA0014), Provincial Industrialization Application Project of China High-Resolution Earth Observation System (CHEOS) of the State Administration of Science, Technology and Industry for National Defense of PRC (Grant No. 92-Y50G34-9001-22/23), and Project supported by the Joint Fund of the Qingyang municipal science and technology bureau (Grant No. QY-STK-2024A-050).

Institutional Review Board Statement

Not applicable.

Data Availability Statement

Data will be made available on request.

Conflicts of Interest

The authors declare no conflicts of interest.

References

  1. Amani, M.; Salehi, B.; Mahdavi, S.; Masjedi, A.; Dehnavi, S. Temperature-Vegetation-soil Moisture Dryness Index (TVMDI). Remote Sens. Environ. 2017, 197, 1–14. [Google Scholar] [CrossRef]
  2. Hao, L.; Zhang, X.; Liu, S. Risk assessment to China’s agricultural drought disaster in county unit. Nat. Hazards 2011, 61, 785–801. [Google Scholar] [CrossRef]
  3. Jin, N.; Shi, Y.; Niu, W.H.; He, L. Spatial and temporal patterns of agricultural drought in China during 1960–2020 characterized by use of the crop water deficit Abnormal Index. J. Hydrol. 2023, 627, 130454. [Google Scholar] [CrossRef]
  4. Han, Z.M.; Huang, Q.; Huang, S.Z.; Leng, G.Y.; Bai, Q.J.; Liang, H.; Wang, L.; Zhao, J.; Fang, W. Spatial-temporal dynamics of agricultural drought in the Loess Plateau under a changing environment: Characteristics and potential influencing factors. Agric. Water Manag. 2021, 244, 106540. [Google Scholar] [CrossRef]
  5. Wu, J.W.; Miao, C.Y.; Tang, X.; Duan, Q.Y.; He, X.J. A nonparametric standardized runoff index for characterizing hydrological drought on the Loess Plateau, China. Glob. Planet. Chang. 2018, 161, 53–65. [Google Scholar] [CrossRef]
  6. Wang, D.; Yue, D.X.; Zhou, Y.Y.; Huo, F.B.; Bao, Q.; Li, K. Drought Resistance of Vegetation and Its Change Characteristics before and after the Implementation of the Grain for Green Program on the Loess Plateau, China. Remote Sens. 2022, 14, 5142. [Google Scholar] [CrossRef]
  7. Zhang, G.X.; Zhang, Y.; Zhao, D.H.; Liu, S.J.; Wen, X.X.; Han, J.; Liao, Y.C. Quantifying the impacts of agricultural management practices on the water use efficiency for sustainable production in the Loess Plateau region: A meta-analysis. Field Crop. Res. 2023, 291, 108787. [Google Scholar] [CrossRef]
  8. Salunke, R.; Nobahar, M.; Alzeghoul, O.E.; Khan, S.; La Cour, I.; Amini, F. Near-Surface Soil Moisture Characterization in Mississippi’s Highway Slopes Using Machine Learning Methods and UAV-Captured Infrared and Optical Images. Remote Sens. 2023, 15, 1888. [Google Scholar] [CrossRef]
  9. Cheng, M.H.; Jiao, X.Y.; Liu, Y.D.; Shao, M.C.; Yu, X.; Bai, Y.; Wang, Z.X.; Wang, S.Y.; Tuohuti, N.; Liu, S.B.; et al. Estimation of soil moisture content under high maize canopy coverage from UAV multimodal data and machine learning. Agric. Water Manag. 2022, 264, 107530. [Google Scholar] [CrossRef]
  10. Wu, S.R.; Ren, J.Q.; Chen, Z.X.; Yang, P.; Li, H. Soil moisture estimation based on the microwave scattering mechanism during different crop phenological periods in a winter wheat-producing region. J. Hydrol. 2020, 590, 125521. [Google Scholar] [CrossRef]
  11. Sadeghi, M.; Babaeian, E.; Tuller, M.; Jones, S.B. The optical trapezoid model: A novel approach to remote sensing of soil moisture applied to Sentinel-2 and Landsat-8 observations. Remote Sens. Environ. 2017, 198, 52–68. [Google Scholar] [CrossRef]
  12. Wang, Q.; Li, J.C.; Jin, T.Y.; Chang, X.; Zhu, Y.C.; Li, Y.W.; Sun, J.J.; Li, D.W. Comparative Analysis of Landsat-8, Sentinel-2, and GF-1 Data for Retrieving Soil Moisture over Wheat Farmlands. Remote Sens. 2020, 12, 2708. [Google Scholar] [CrossRef]
  13. Fang, W.; Huang, S.Z.; Huang, Q.; Huang, G.H.; Wang, H.; Leng, G.Y.; Wang, L.; Guo, Y. Probabilistic assessment of remote sensing-based terrestrial vegetation vulnerability to drought stress of the Loess Plateau in China. Remote Sens. Environ. 2019, 232, 111290. [Google Scholar] [CrossRef]
  14. Khose, S.B.; Mailapalli, D.R. Spatial mapping of soil moisture content using very-high resolution UAV-based multispectral image analytics. Smart Agric. Technol. 2024, 8, 100467. [Google Scholar] [CrossRef]
  15. Das, S.; Christopher, J.; Roy Choudhury, M.; Apan, A.; Chapman, S.; Menzies, N.W.; Dang, Y.P. Evaluation of drought tolerance of wheat genotypes in rain-fed sodic soil environments using high-resolution UAV remote sensing techniques. Biosyst. Eng. 2022, 217, 68–82. [Google Scholar] [CrossRef]
  16. Li, J.T.; Schachtman, D.P.; Creech, C.F.; Wang, L.; Ge, Y.F.; Shi, Y.Y. Evaluation of UAV-derived multimodal remote sensing data for biomass prediction and drought tolerance assessment in bioenergy sorghum. Crop J. 2022, 10, 1363–1375. [Google Scholar] [CrossRef]
  17. D’Odorico, P.; Schönbeck, L.; Vitali, V.; Meusburger, K.; Schaub, M.; Ginzler, C.; Zweifel, R.; Velasco, V.M.E.; Gisler, J.; Gessler, A.; et al. Drone-based physiological index reveals long-term acclimation and drought stress responses in trees. Plant Cell Environ. 2021, 44, 3552–3570. [Google Scholar] [CrossRef]
  18. Zhou, J.; Zhou, J.; Ye, H.; Ali, M.L.; Nguyen, H.T.; Chen, P. Classification of soybean leaf wilting due to drought stress using UAV-based imagery. Comput. Electron. Agric. 2020, 175, 105576. [Google Scholar] [CrossRef]
  19. Song, L.; Ding, Z.; Kustas, W.P.; Xu, Y.; Zhao, G.; Liu, S.; Ma, M.; Xue, K.; Bai, Y.; Xu, Z. Applications of a thermal-based two-source energy balance model coupled to surface soil moisture. Remote Sens. Environ. 2022, 271, 112923. [Google Scholar] [CrossRef]
  20. Xu, Y.; Song, L.; Kustas, W.P.; Xue, K.; Liu, S.; Ma, M.; Xu, T.; Zhao, L. Application of the two-source energy balance model with microwave-derived soil moisture in a semi-arid agricultural region. Int. J. Appl. Earth Obs. Geoinf. 2022, 112, 102879. [Google Scholar] [CrossRef]
  21. Kimura, R. Estimation of moisture availability over the Liudaogou river basin of the Loess Plateau using new indices with surface temperature. J. Arid. Environ. 2007, 70, 237–252. [Google Scholar] [CrossRef]
  22. Koley, S.; Jeganathan, C. Estimation and evaluation of high spatial resolution surface soil moisture using multi-sensor multi-resolution approach. Geoderma 2020, 378, 114618. [Google Scholar] [CrossRef]
  23. Deng, H.; Cheng, F.; Wang, J.; Wang, C. Monitoring of drought in central Yunnan, China based on TVDI model. Pol. J. Environ. Stud. 2021, 30, 3511–3523. [Google Scholar] [CrossRef]
  24. Pang, S.F.; Wei, W.; Guo, Z.C.; Zhang, J.; Xie, B.B. Agricultural drought characteristics and its influencing factors in gansu province based on TVDI. Chin. J. Ecol. 2019, 38, 1849–1860. [Google Scholar]
  25. Fitriyah, A.; Fatikhunnada, A.; Okura, F.; Nugroho, B.D.A.; Kato, T. Analysis of the drought mitigated mechanism in terraced paddy fields using CWSI and TVDI indices and hydrological monitoring. Sustainability 2019, 11, 6897. [Google Scholar] [CrossRef]
  26. Du, L.T.; Song, N.P.; Liu, K.; Hou, J.; Hu, Y.; Zhu, Y.; Wang, X.Y.; Wang, L.; Guo, Y.G. Comparison of two simulation methods of the Temperature Vegetation Dryness Index (TVDI) for drought monitoring in semi-arid regions of China. Remote Sens. 2017, 9, 177. [Google Scholar] [CrossRef]
  27. Bai, J.J.; Yu, Y.; Di, L.P. Comparison between TVDI and CWSI for drought monitoring in the Guanzhong Plain, China. J. Integr. Agric. 2017, 16, 389–397. [Google Scholar] [CrossRef]
  28. Cheng, M.H.; Sun, C.M.; Nie, C.W.; Liu, S.B.; Yu, X.; Bai, Y.; Liu, Y.D.; Meng, L.; Jia, X.; Liu, Y.; et al. Evaluation of UAV-based drought indices for crop water conditions monitoring: A case study of summer maize. Agric. Water Manag. 2023, 287, 108442. [Google Scholar] [CrossRef]
  29. Zhang, Y.; Liu, X.H.; Jiao, W.Z.; Zhao, L.J.; Zeng, X.M.; Xing, X.Y.; Zhang, L.N.; Hong, Y.X.; Lu, Q.Q. A new multi-variable integrated framework for identifying flash drought in the Loess Plateau and Qinling Mountains regions of China. Agric. Water Manag. 2022, 265, 107544. [Google Scholar] [CrossRef]
  30. Wang, S.; An, J.; Zhao, X.; Gao, X.; Wu, P.; Huo, G.; Robinson, B.H. Age- and climate- related water use patterns of apple trees on China’s Loess Plateau. J. Hydrol. 2020, 582, 124462. [Google Scholar] [CrossRef]
  31. Zhou, Z.W.; Zhang, T.F.; Zhang, M.C.; Liu, Y.; Xue, J.X.; Zhang, J.L. Study on Analysis of the Climate Change Characteristics in Qingyang over the Past 50 Years. Gansu Agric. Sci. Technol. 2022, 53, 45–51. (In Chinese) [Google Scholar]
  32. Sandholt, I.; Rasmussen, K.; Andersen, J. A simple interpretation of the surface temperature/vegetation index space for assessment of surface moisture status. Remote Sens. Environ. 2002, 79, 213–224. [Google Scholar] [CrossRef]
  33. Wigmore, O.; Mark, B.; McKenzie, J.; Baraer, M.; Lautz, L. Sub-metre mapping of surface soil moisture in proglacial valleys of the tropical Andes using a multispectral unmanned aerial vehicle. Remote Sens. Environ. 2019, 222, 104–118. [Google Scholar] [CrossRef]
  34. Gitelson, A.A.; Kaufman, Y.J.; Stark, R.; Rundquist, D. Novel algorithms for remote estimation of vegetation fraction. Remote Sens. Environ. 2002, 80, 76–87. [Google Scholar] [CrossRef]
  35. Ranjan, R.; Chopra, U.K.; Sahoo, R.N.; Singh, A.K.; Pradhan, S. Assessment of plant nitrogen stress in wheat (Triticum aestivum L.) through hyperspectral indices. Int. J. Remote Sens. 2012, 33, 6342–6360. [Google Scholar] [CrossRef]
  36. Song, X.X.; Wu, F.; Lu, X.T.; Yang, T.L.; Ju, C.X.; Sun, C.M.; Liu, T. The Classification of Farming Progress in Rice–Wheat Rotation Fields Based on UAV RGB Images and the Regional Mean Model. Agriculture 2022, 12, 124. [Google Scholar] [CrossRef]
  37. Song, B.; Park, K. Detection of aquatic plants using multispectral UAV imagery and vegetation index. Remote Sens. 2020, 12, 387. [Google Scholar] [CrossRef]
  38. Penuelas, J.; Frederic, B.; Filella, I. Semi-Empirical Indices to Assess Carotenoids/Chlorophyll-a Ratio from Leaf Spectral Reflectance. Photosynthetica 1995, 31, 221–230. [Google Scholar]
  39. Zarco-Tejada, P.J.; Berjón, A.; López-Lozano, R.; Miller, J.R.; Martín, P.; Cachorro, V.; González, M.R.; De Frutos, A. Assessing vineyard condition with hyperspectral indices: Leaf and canopy reflectance simulation in a row-structured discontinuous canopy. Remote Sens. Environ. 2005, 99, 271–287. [Google Scholar] [CrossRef]
  40. Townshend, J.R.G.; Goff, T.E.; Tucker, C.J. Multitemporal Dimensionality of Images of Normalized Difference Vegetation Index at Continental Scales. IEEE Trans. Geosci. Remote Sens. 1985, GE-23, 888–895. [Google Scholar] [CrossRef]
  41. Wang, F.M.; Huang, J.F.; Tang, Y.L.; Wang, X.Z. New Vegetation Index and Its Application in Estimating Leaf Area Index of Rice. Rice Sci. 2007, 14, 195–203. [Google Scholar] [CrossRef]
  42. Huete, A.; Didan, K.; Miura, T.; Rodriguez, E.P.; Gao, X.; Ferreira, L.G. Overview of the radiometric and biophysical performance of the MODIS vegetation indices. Remote Sens. Environ. 2002, 83, 195–213. [Google Scholar] [CrossRef]
  43. Mishra, S.; Mishra, D.R. Normalized difference chlorophyll index: A novel model for remote estimation of chlorophyll-a concentration in turbid productive waters. Remote Sens. Environ. 2012, 117, 394–406. [Google Scholar] [CrossRef]
  44. Xue, L.H.; Cao, W.X.; Luo, W.H.; Dai, T.B.; Zhu, Y. Monitoring Leaf Nitrogen Status in Rice with Canopy Spectral Reflectance. Agron. J. 2004, 96, 135–142. [Google Scholar] [CrossRef]
  45. Liu, K.; Li, Y.Z.; Han, T.F.; Yu, X.C.; Ye, H.C.; Hu, H.W.; Hu, Z.H. Evaluation of grain yield based on digital images of rice canopy. Plant Methods 2019, 15, 28. [Google Scholar] [CrossRef]
  46. Broge, N.H.; Leblanc, E. Comparing prediction power and stability of broadband and hyperspectral vegetation indices for estimation of green leaf area index and canopy chlorophyll density. Remote Sens. Environ. 2001, 76, 156–172. [Google Scholar] [CrossRef]
  47. Amani, M.; Parsian, S.; Mirmazloumi, S.M.; Aieneh, O. Two new soil moisture indices based on the NIR-red triangle space of Landsat-8 data. Int. J. Appl. Earth Obs. Geoinf. 2016, 50, 176–186. [Google Scholar] [CrossRef]
  48. Liu, Y.; Yue, H. The Temperature Vegetation Dryness Index (TVDI) Based on Bi-Parabolic NDVI-Ts Space and Gradient-Based Structural Similarity (GSSIM) for Long-Term Drought Assessment Across Shaanxi Province, China (2000–2016). Remote Sens. 2018, 10, 959. [Google Scholar] [CrossRef]
  49. Yue, H.; Liu, Y.; Qian, J.X. Comparative assessment of drought monitoring index susceptibility using geospatial techniques. Environ. Sci. Pollut. Res. 2021, 28, 38880–38900. [Google Scholar] [CrossRef] [PubMed]
  50. Breiman, L. Random Forests. Mach. Learn. 2001, 45, 5–32. [Google Scholar] [CrossRef]
  51. Zhang, D.J.; Zhou, G.Q. Estimation of Soil Moisture from Optical and Thermal Remote Sensing: A Review. Sensors 2016, 16, 1308. [Google Scholar] [CrossRef]
  52. Bindlish, R.; Jackson, T.J.; Gasiewski, A.; Stankov, B.; Klein, M.; Cosh, M.H.; Mladenova, I.; Watts, C.; Vivoni, E.; Lakshmi, V.; et al. Aircraft based soil moisture retrievals under mixed vegetation and topographic conditions. Remote Sens. Environ. 2008, 112, 375–390. [Google Scholar] [CrossRef]
  53. Garcia-Garcia, D.; Rosa, X.R.L.; Bedoya, D.G.; Schrevens, E. Linear mixed model analysis of NDVI-based canopy coverage, extracted from sequential UAV multispectral imagery of an open field tomato irrigation experiment. Comput. Electron. Agric. 2021, 189, 106399. [Google Scholar] [CrossRef]
  54. Jiang, R.; Sanchez-Azofeifa, A.; Laakso, K.; Wang, P.; Xu, Y.; Zhou, Z.Y.; Luo, X.W.; Lan, Y.B.; Zhao, G.P.; Chen, X. UAV-based partially sampling system for rapid NDVI mapping in the evaluation of rice nitrogen use efficiency. J. Clean Prod. 2021, 289, 125705. [Google Scholar] [CrossRef]
  55. Qiao, L.; Tang, W.J.; Gao, D.H.; Zhao, R.M.; An, L.L.; Li, M.Z.; Sun, H.; Song, D. UAV-based chlorophyll content estimation by evaluating vegetation index responses under different crop coverages. Comput. Electron. Agric. 2022, 196, 106775. [Google Scholar] [CrossRef]
  56. Li, S.Y.; Yuan, F.; Ata-Ui-Karim, S.T.; Zheng, H.B.; Cheng, T.; Liu, X.J.; Tian, Y.C.; Zhu, Y.; Cao, W.X.; Cao, Q. Combining Color Indices and Textures of UAV-Based Digital Imagery for Rice LAI Estimation. Remote Sens. 2019, 11, 1763. [Google Scholar] [CrossRef]
  57. Xu, M.; Yao, N.; Hu, A.; de Goncalves, L.G.G.; Mantovani, F.A.; Horton, R.; Heng, L.; Liu, G. Evaluating a new temperature-vegetation-shortwave infrared reflectance dryness index (TVSDI) in the continental United States. J. Hydrol. 2022, 610, 127785. [Google Scholar] [CrossRef]
  58. Li, C.; Adu, B.; Wu, J.; Qin, G.; Li, H.; Han, Y. Spatial and temporal variations of drought in Sichuan Province from 2001 to 2020 based on modified temperature vegetation dryness index (TVDI). Ecol. Indic. 2022, 139, 108883. [Google Scholar] [CrossRef]
  59. Gao, Y.; Lian, X.; Ge, L. Inversion model of surface bare soil temperature and water content based on UAV thermal infrared remote sensing. Infrared Phys. Technol. 2022, 125, 104289. [Google Scholar] [CrossRef]
  60. Jia, Q.; Shi, H.; Li, R.; Miao, Q.; Feng, Y.; Wang, N.; Li, J. Evaporation of maize crop under mulch film and soil covered drip irrigation: Field assessment and modelling on West Liaohe Plain, China. Agric. Water Manag. 2021, 253, 106894. [Google Scholar] [CrossRef]
  61. Huang, G.B.; Chen, W.; Li, F.R. Rainfed Farming Systems in the Loess Plateau of China. In Rainfed Farming Systems; Copper, I., Partridge, I., Birch, C., Eds.; Springer: Dordrecht, The Netherlands, 2011; pp. 643–669. [Google Scholar]
  62. Hu, X.; Ren, H.; Tansey, K.; Zheng, Y.; Ghent, D.; Liu, X.; Yan, L. Agricultural drought monitoring using European Space Agency Sentinel 3A land surface temperature and normalized difference vegetation index imageries. Agric. For. Meteorol. 2019, 279, 107707. [Google Scholar] [CrossRef]
  63. Gu, H.B.; Lin, Z.; Guo, W.X.; Deb, S. Retrieving Surface Soil Water Content Using a Soil Texture Adjusted Vegetation Index and Unmanned Aerial System Images. Remote Sens. 2021, 13, 145. [Google Scholar] [CrossRef]
Figure 1. The location and UAV-based false color image collected on 2 May 2022, of the three farmland plots used in this study. (a) Location of Qingyang City in Gansu Province, Loess Plateau, and China, respectively; (b) location of the three experiment sites in Qingyang City; (ce) UAV-based false color images and measured points distribution on the three study plots, respectively.
Agriculture 15 00126 g001
Figure 2. The workflow for evaluating UAV-based dryness indices for dryness monitoring.
Agriculture 15 00126 g002
Figure 3. The coefficients of determination ( R 2 ) and root mean square error (RMSE) between different VI-based temperature vegetation dryness indices (TVDIs) and measured drought index (MDI). (a), (b) and (c) represent apple orchard, wheat, and maize plot, respectively. I to III represent the first, the second, and the third experiment, respectively. Notes: V a : visible atmospherically resistant index (VARI), T v : triangular vegetation index (TVI), S r : simple ratio pigment index (SRPI), S i : structure insensitive pigment index (SIPI), R 2 : ratio vegetation index 2 (RVI2), R 1 : ratio vegetation index (RVI), N p : normalized pigment chlorophyll index (NPCI), N r : normalized green–red difference index (NGRDI), N g : normalized green–red difference index (NGRDI), N b : normalized green–blue difference index (NGBDI), N d : normalized difference vegetation index (NDVI), G n : green normalized difference vegetation index (GNDVI), G i : green index (GI), E v : enhanced vegetation index (EVI).
Agriculture 15 00126 g003
Figure 4. The scatter distribution and linear fit of the temperature vegetation dryness index (TVDI) and temperature–vegetation–soil moisture dryness index (TVMDI) versus the measured dryness index (MDI). (a1), (b1), and (c1) represent the linear fits of the TVDI versus MDI from the three experiments conducted in the apple orchard, wheat, and maize plots, respectively; (a2), (b2), and (c2) represent the linear fits of the TVMDI versus MDI from the three experiments in the apple orchard, wheat, and maize plots, respectively.
Agriculture 15 00126 g004
Figure 5. Spatial distribution of GSSIM. (a), (b) and (c) represent apple orchard, wheat, and maize plot, respectively. The numbers 1 to 3 represent the first, the second, and the third experiment, respectively.
Agriculture 15 00126 g005
Figure 6. Simulation of temperature vegetation dryness indices trends under different temperature conditions. (a1a14) represent the trends of the TVDI simulated by 14 VIs based on the parameters at the wheat heading period under different temperature conditions; (b1b14) represent the trends of the TVDI simulated by 14 VIs based on the parameters at the maize emergence period under different temperature conditions.
Agriculture 15 00126 g006aAgriculture 15 00126 g006b
Figure 7. Spatial distribution of temperature vegetation dryness index (TVDI) in three experiment plots. (a), (b) and (c) represent apple orchard, wheat, and maize plot, respectively. I to III represent the first, the second, and the third experiment, respectively.
Agriculture 15 00126 g007
Figure 8. Correlation matrix between the temperature vegetation dryness index (TVDI)/temperature–vegetation–soil moisture dryness index (TVMDI) and normalized difference vegetation index (NDVI)/perpendicular vegetation index (PVI)/soil moisture (SM)/radiant temperature (Ts). (a), (b) and (c) represent apple orchard, wheat, and maize plot, respectively. I to III represent the first, the second, and the third experiment, respectively.
Agriculture 15 00126 g008
Figure 9. The feature importance calculated using the Random Forest Regression model. (a) represents the contribution of the Ts and NDVI to the TVDI; (b) represents the contribution of the Ts, PVI, and SM to the TVMDI.
Agriculture 15 00126 g009
Table 1. The time of flight campaign and the corresponding crop growth periods.
TimeMajor Crop Growth Period
2 May 2022 to 3 May 2022 (the first experiment)Wheat Heading Period, WHP
Maize Sowing Period, MAP
Apple Blooming Period, ABP
17 May 2022 to 19 May 2022 (the second experiment)Wheat Filling Period, WFP
Maize Emergence Period, MEP
Apple Fruit Setting Period, ASP
14 June 2022 to 17 June 2022 (the third experiment)Wheat Ripe Period, WRP
Maize Jointing Period, MJP
Apple Fruit Development Period, ADP
Table 2. Commonly used vegetation indices.
Vegetable IndexFormulationReference
Visible Atmospherically Resistant Index (VARI) VARI = ( G R ) / ( G + R B ) [34]
Normalized Pigment Chlorophyll Index (NPCI) NPCI = ( R B ) / ( R + B ) [35]
The Normalized Green–Blue Difference Index (NGBDI) NGBDI = ( G B ) / ( G + B ) [36]
Normalized Green–Red Difference Index (NGRDI) NGRDI = ( G R ) / ( G + R ) [37]
Simple Ratio Pigment Index (SRPI) SRPI = B / R [38]
Green Index (GI) GI = G / R [39]
Normalized Difference Vegetation Index (NDVI) NDVI = ( N I R R ) / ( N I R + R ) [40]
Structure Insensitive Pigment Index (SIPI) SIPI = ( N I R B ) / ( N I R + B ) [38]
Green Normalized Difference Vegetation Index (GNDVI) GNDVI = ( N I R G ) / ( N I R + G ) [41]
Enhanced Vegetation Index (EVI) EVI = 2.5 ( N I R R ) / ( N I R + 6 R 7.5 B + 1 ) [42]
Ratio Vegetation Index (RVI) RVI = N I R / R [43]
Ratio Vegetation Index 2 (RVI2) RVI2 = N I R / G [44]
Normalized Greenness Intensity (NGI) NGI = G / ( N I R + R + G ) [45]
Triangular Vegetation Index (TVI) TVI = 60 ( N I R G ) 100 ( R G ) [46]
Note: R, G, B, and NIR represent the reflectance of red, green, blue, and near-infrared bands in multispectral remote sensing images, respectively.
Table 3. Comparison of TVDI and TVMDI with MDI. Fit is the fitted curve, and r is the Pearson correlation coefficient (Pearson’s r). The p represents the significance level. When the p is less than 0.05, the TVDI or TVMDI is significantly correlated with the MDI. RMSE is the root mean square error.
PlotExperimentTVDI vs. MDITVMDI vs. MDI
PeriodFitPearson’s rpRMSEFitPearson’s rpRMSE
API 0.24 x + 0.41 0.420.0360.21 0.09 x + 0.30 0.350.0910.29
APII 0.48 x + 0.20 0.540.0050.21 0.16 x + 0.39 0.440.0260.2
APIII 0.41 x + 0.13 0.260.1980.38 0.16 x + 0.30 0.320.1130.36
WHI 0.89 x 0.20 0.830.0010.28 0.18 x + 0.18 0.40.2030.39
WHII 0.55 x + 0.05 0.70.0110.25 0.27 x + 0.18 0.630.0290.28
WHIII 0.57 x + 0.07 0.820.0060.27 0.09 x + 0.40 0.380.310.32
MAI 0.27 x + 0.43 0.650.0070.16 0.08 x + 0.32 0.580.0180.39
MAII 0.51 x + 0.27 0.850.0080.14 0.04 x + 0.46 0.50.2090.21
MAIII 0.84 x 0.1 0.720.0010.24 0.27 x + 0.31 0.320.2020.29
Disclaimer/Publisher’s Note: The statements, opinions and data contained in all publications are solely those of the individual author(s) and contributor(s) and not of MDPI and/or the editor(s). MDPI and/or the editor(s) disclaim responsibility for any injury to people or property resulting from any ideas, methods, instructions or products referred to in the content.

