Abstract
Unmanned aerial vehicle (UAV) imagery provides an efficient approach for monitoring cotton defoliation and boll-opening rates. Deep learning, particularly convolutional neural networks (CNNs), has been widely applied in image processing and agricultural monitoring, achieving strong performance in tasks such as disease detection, weed recognition, and yield prediction. However, existing models often suffer from heavy computational costs and slow inference speed, limiting their real-time deployment in agricultural fields. To address this challenge, we propose a lightweight cotton maturity recognition model, RTCMNet (Real-time Cotton Monitoring Network). By incorporating a multi-scale convolutional attention (MSCA) module and an efficient feature fusion strategy, RTCMNet achieves high accuracy with substantially reduced computational complexity. A UAV dataset was constructed using images collected in Xinjiang, and the proposed model was benchmarked against several state-of-the-art networks. Experimental results demonstrate that RTCMNet achieves 0.96 and 0.92 accuracy on defoliation rate and boll-opening rate classification tasks, respectively. Meanwhile, it contains only 0.35 M parameters—94% fewer than DenseNet121—and only requires an inference time of 33 ms, representing a 97% reduction compared to DenseNet121. Field tests further confirm its real-time performance and robustness on UAV platforms. Overall, RTCMNet provides an efficient and low-cost solution for UAV-based cotton maturity monitoring, supporting the advancement of precision agriculture.
1. Introduction
Cotton is a strategic economic crop and a primary raw material for the global textile industry, also serving in the production of high-value derivatives such as nitrocellulose and guncotton paper [1]. In many major cotton-growing regions, including China’s Xinjiang, large-scale mechanized harvesting has become the dominant production mode. Unlike determinate crops such as wheat or maize, cotton bolls mature unevenly over extended periods under favorable growing conditions [2,3]. To ensure harvesting efficiency and fiber quality, chemical defoliants and ripening agents are widely applied to accelerate leaf drop and boll opening [4]. The optimal timing of these treatments is critical: premature application may reduce yield, whereas delayed treatment can compromise fiber quality [5,6]. Among the key indicators guiding this decision, the defoliation rate and boll-opening rate are essential for assessing crop maturity and determining readiness for machine harvesting [7,8].
Traditional manual assessment—based on field sampling and visual estimation—is labor-intensive, time-consuming, and prone to subjective bias, making it unsuitable for large-scale, time-sensitive operations [9]. UAV (Unmanned aerial vehicle)-based imaging has emerged as a promising alternative, offering high spatial resolution, flexible data acquisition, and rapid coverage of large fields. Early research on cotton maturity assessment primarily relied on spectral features derived from satellite or UAV imagery. Vegetation indices such as NDVI, GNDVI, BARI, and BORI have been used to estimate boll-opening and defoliation rates, typically in combination with regression or machine learning models [10,11,12]. These approaches enable non-destructive monitoring across large areas and can achieve moderate accuracy—for example, NDVI- and GNDVI-based models have reported values above 0.90 under certain conditions. However, they depend heavily on handcrafted feature engineering, are sensitive to illumination and background variability, and require complex preprocessing, limiting their adaptability and applicability in field operations [13].
Deep learning has become a robust tool in plant phenotyping, enabling the automatic extraction of complex visual features from high-dimensional imagery without manual intervention. CNN-based models have been widely applied to diverse phenotyping tasks, including leaf counting, disease detection, stress classification, biomass estimation, weed detection, and yield prediction [14,15,16,17,18]. These methods have consistently outperformed traditional spectral methods by capturing the hierarchical spatial representations of plant organs and canopy structures. More recently, Transformer-based architectures have gained traction in plant phenotyping, as their self-attention mechanisms allow effective modeling of long-range dependencies and the global context [19,20,21]. Such models have been applied to fine-grained tasks such as disease severity estimation, plant part segmentation, and phenological stage recognition, demonstrating state-of-the-art accuracy. Despite these advances, most existing deep learning methods remain computationally intensive, limiting their deployment in resource-constrained agricultural environments such as UAVs, edge devices, or field robotics [22,23]. This creates a strong need for lightweight architectures that can balance predictive accuracy with efficiency, making real-time plant phenotyping feasible in large-scale precision agriculture.
Recent research has explored the use of lightweight networks, such as MobileNet [24] and ShuffleNet [25], which significantly reduce parameters and latency, thereby enabling fast inference on edge devices. For instance, CDDLite-YOLO contains only 1.8 M parameters and achieves over 200 FPS in pest detection tasks [26]. However, such efficiency often comes at the expense of accuracy in complex field environments characterized by variable lighting, irregular canopy structures, and high background clutter. Balancing recognition accuracy and real-time performance thus remains a critical challenge for UAV-based cotton maturity monitoring, motivating the design of the proposed RTCMNet.
In parallel, the cotton phenotyping community has increasingly adopted lightweight models for diverse agricultural applications. For example, Zhang et al. [27] applied a lightweight network to identify cotton buds, facilitating more efficient topping operations; Zhang et al. [28] developed the GVC model for real-time monitoring of cotton aphids; Pan et al. [26] investigated lightweight solutions for multi-pest and disease identification; and Kanade et al. [29] conducted weed detection in cotton fields. Building upon these efforts, we extend the application of lightweight networks to cotton defoliation rate and boll-opening rate monitoring, aiming to achieve both high accuracy and efficiency in real-world deployment scenarios.
To address these issues, this study proposes RTCMNet (Real-Time Cotton Monitoring Network), a lightweight deep learning architecture designed for real-time estimation of cotton defoliation and boll-opening rates from UAV-acquired RGB imagery. RTCMNet integrates multi-scale convolutional attention (MSCA) modules into a compact CNN backbone, enhancing fine-grained canopy feature extraction while minimizing computational overhead. The network is optimized for resource-constrained platforms such as agricultural UAVs and handheld devices. To support model training and evaluation, we constructed a large-scale, manually annotated dataset under real field conditions, covering the full cotton growth cycle and capturing diverse lighting, canopy, and background scenarios.
The overall workflow of this study is illustrated in Figure 1, and the main contributions of this work are as follows:
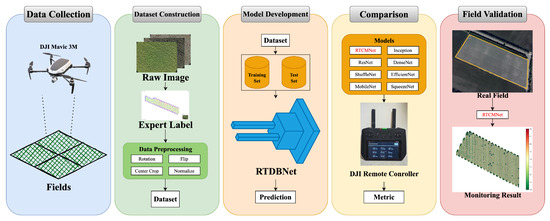
Figure 1.
Workflow of cotton defoliation and boll-opening rate recognition. Data collection: High-resolution field images were captured using a DJI Mavic 3 M UAV; Dataset construction: Raw images were annotated by agricultural experts and preprocessed to generate a dataset containing paired images and expert labels; Model development: The dataset was split into training and testing subsets, and the optimal RTCMNet architecture was trained and validated; Model comparison: Multiple deep learning models were evaluated for prediction performance on UAV imagery, with results visualized on a DJI remote controller interface; Field validation: Model predictions were compared with in-field survey results to assess real-world applicability and accuracy.
- 1.
- Dataset—Construction of a UAV-based RGB dataset for cotton defoliation and boll-opening rate assessment, spanning the complete harvest cycle and incorporating expert-verified annotations.
- 2.
- Model—Design of RTCMNet, a lightweight CNN enhanced with MSCA modules that balance recognition accuracy and computational efficiency.
- 3.
- Performance—Extensive experiments demonstrate that RTCMNet exceeds the accuracy of DenseNet121 while requiring only 0.35 M parameters and achieving an inference time of 33 ms on mobile hardware.
- 4.
- Application—Field deployment and validation confirm the model’s practical utility in generating rapid, spatially explicit maturity maps to guide precision harvesting decisions.
2. Methods
2.1. RTCMNet Architecture
Using complex algorithmic models or deep networks can significantly improve recognition performance; however, this often comes at the cost of high training and deployment overhead. Classic lightweight convolutional models, which rely solely on convolutional operations, achieve parameter reduction and faster inference but lack global contextual awareness, leading to accuracy degradation. Incorporating Vision Transformer modules can compensate for this limitation by enhancing global representation capability, yet it introduces considerable computational burden and slows inference.
To address these challenges, we propose a lightweight and efficient network architecture, RTCMNet, designed for real-time recognition of defoliation and boll-opening rates in field-grown cotton. RTCMNet integrates a multi-scale convolutional attention (MSCA) block with dual classifiers. The overall architecture consists of a feature extraction module and two task-specific classifiers. Feature extraction is driven by convolutional attention mechanisms, whose outputs are shared to support classification of both defoliation and boll-opening rates. Specifically, input images are first processed by convolutional layers for low-level feature extraction, followed by MSCA modules that effectively capture multi-scale semantic information. Inspired by SCTNet [30], the MSCA block leverages convolutional operations to reduce computational complexity while maintaining strong representational capacity. After feature extraction and fusion, two parallel classifiers generate predictions for the two tasks. The network is optimized for deployment on resource-constrained platforms such as UAVs, balancing accuracy, efficiency, and real-time capability. Compared with Transformer-based attention networks [31], RTCMNet significantly reduces parameters and inference latency while preserving deep feature extraction, making it highly suitable for real-time agricultural applications. Furthermore, the MSCA block strengthens feature learning efficiency, enabling robust adaptation to complex field environments.
The key innovation of RTCMNet lies in the design of the multi-scale convolutional attention (MSCA) module. Unlike lightweight CNNs such as MobileNetV2 and ShuffleNet, which primarily rely on depthwise-separable convolutions, MSCA explicitly models multi-scale receptive fields by combining and convolutional kernels with local softmax normalization, thereby approximating the effect of multi-head self-attention at substantially lower costs. Each MSCA block further incorporates residual connections and projections to stabilize optimization and ensure compact representation learning. To further enhance representational capacity while preserving efficiency, we introduce the MSCA block, which couples an MSCA module with a lightweight MLP based on depthwise convolutions. This design parallels the “Attention + MLP” structure of Transformers but retains the computational efficiency of convolutional operations.
2.2. Feature Extraction
The feature extraction module of RTCMNet comprises five components, as illustrated in Figure 2a. Layers 1 and 2 consist of Conv blocks (Figure 2b), while Layers 3 and 4 incorporate MSCA blocks (Figure 2d), which generate multi-scale attention features. The MSCA block integrates the multi-scale convolutional attention mechanism (Figure 2c) along with drop path and MLP modules. Initially, the input image passes through the stem, Layer 1, and Layer 2 to extract preliminary features. Subsequently, the combination of convolutional operations and MSCA enhances the model’s capability to capture semantic information and features across multiple scales. Finally, the features extracted by the backbone network are fed into subsequent classifiers to perform classification tasks of the defoliation rate and boll-opening rate.
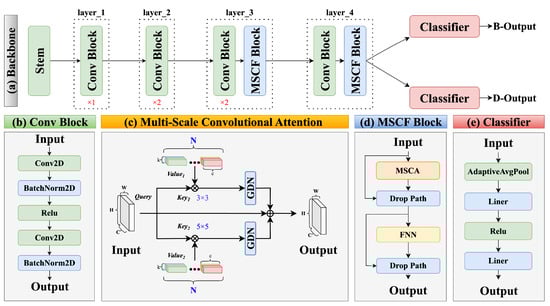
Figure 2.
Overview of the RTCMNet architecture. The network primarily consists of two components: a feature extraction module and a classifier. (a) The feature extraction module comprises five stages. The STAM stage performs fundamental feature extraction on the input image, while Layer_1 through Layer_4 progressively extract deeper features. (b) The Conv block employs 2D convolutional layers followed by batch normalization to extract features. (c) The multi-scale convolutional attention (MSCA) mechanism effectively integrates both coarse-scale and fine-grained features by applying convolutional operations with kernels of varying sizes. (d) The MSCA block combines MSCA with feed-forward networks (FNN) and drop path operations to enhance feature representation. (e) The classifier applies adaptive average pooling and fully connected layers to output the final prediction.
2.3. Multi-Scale Convolutional Attention
Due to the intrinsic differences between CNN and Transformer architectures, the feature representations they extract differ significantly. Directly aligning features between the CNN and Transformer branches renders the learning process challenging, thereby limiting achievable performance gains. To facilitate the CNN branch in learning to extract high-quality semantic information from the Transformer branch, we designed the MSCA block. The MSCA block simulates the conventional attention mechanism, enabling it to learn features from convolutional modules while simultaneously reducing computational complexity. The operation of the MSCA module closely resembles that of the classical Transformer encoder [31], as illustrated in Figure 2c. Its fundamental operation is described by the following equations:
where denotes batch normalization (BN), while x, f, and y represent the input, hidden feature, and output, respectively. Here, denotes a convolutional operation, which substitutes the positional encoding typically used in the original Transformer architecture.
The MSCA module takes the input feature map and processes it through a series of modules to enhance and extract features, as illustrated in Figure 2c. Unlike standard self-attention mechanisms that explicitly decompose the input features into three separate projections—Query (Q), Key (K), and Value (V)—and compute the pairwise similarity via dot-product operations, our proposed multi-scale convolutional attention (MSCA) replaces the explicit branches with lightweight multi-scale separable convolutional kernels. In MSCA, the local convolutional kernels implicitly encode spatial dependencies and extract the local context, while the subsequent softmax normalization across spatial dimensions simulates the effect of computing similarity weights in conventional self-attention. This design significantly reduces the computational overhead and parameter cost while still capturing rich local structural information at multiple scales, which is particularly beneficial for complex field scenes such as cotton canopy recognition. Compared to standard window-based self-attention (e.g., Swin Transformer blocks), MSCA avoids costly matrix multiplications and relative position embeddings, making it more suitable for lightweight UAV-based phenotyping tasks where both local detail preservation and real-time inference are required.
Meanwhile, real-time attention mechanisms require low latency and robust semantic extraction capabilities. We note that convolutional attention (CA) [30] is inspired by traditional attention mechanisms. Our proposed multi-scale convolutional attention (MSCA) builds upon CA. CA employs directional separable convolutions (e.g., and ) primarily to capture local dependencies along the vertical and horizontal axes. This design proves effective in scenarios where the row–column structure of the cotton canopy is relatively regular. However, when confronted with morphologically complex and irregular canopy textures, the fixed receptive field and single-scale nature of CA become limiting factors. The MSCA proposed herein introduces multi-scale separable convolutional branches (e.g., and ), enabling adaptive capture of local structural information at multiple scales. Moreover, MSCA incorporates learnable output mappings and residual connections, which facilitate deep stacking of modules and stable training—features absent in the original design. In addition, MSCA applies optimized initialization and input normalization strategies for convolutional kernels, facilitating accelerated convergence and enhanced generalization. Compared to the original convolutional attention, MSCA extracts richer local structural features in multi-scale, irregular cotton canopy scenarios while maintaining low computational complexity, making it well suited for real-time phenotypic monitoring in UAV-based applications.
Furthermore, convolution provides a more flexible approach to expanding the parameter space by computing the similarity between a set of learnable vectors and each pixel, subsequently enhancing the pixel representations based on the similarity scores and the learnable vectors. On the one hand, this transforms the similarity calculation from between individual pixels and learnable vectors to similarity computations among pixel blocks equipped with learnable kernels. On the other hand, convolutions with learnable kernels effectively preserve more local spatial information. The operation of convolutional attention can be summarized as follows:
Here, represents the input feature map, denotes batch normalization, and corresponds to a separable convolution with kernel size s. The output of each branch is locally normalized along the spatial dimension via a operation to emulate local self-attention mechanisms. The normalized outputs from multiple scale branches are summed along the channel dimension and subsequently mapped to the target output channel dimension through , implemented as a convolution. To improve feature representation consistency, MSCA incorporates residual connections, where denotes a convolution used for matching input and output dimensions (identity mapping is applied if the input and output channel numbers are equal). This module not only substantially reduces computational complexity compared to standard self-attention mechanisms but also effectively captures the spatial heterogeneity of canopy structures using multi-scale convolutional kernels, rendering it well suited for real-time low-altitude UAV canopy phenotyping tasks.
2.4. Classifier Design
A multi-class classification network is a widely used deep learning model designed for categorical prediction of input data. It outputs a probability distribution over all categories and selects the one with the highest probability as the predicted class. In this study, we employ our proposed RTCMNet as the backbone architecture, leveraging its extracted features to feed two classifiers that simultaneously produce classification results for the defoliation rate and boll-opening rate. For both tasks, identical architectures are utilized. Initially, the input image passes through the stem and multiple convolutional modules (Conv blocks) of the backbone network to extract hierarchical features from low to high levels. Subsequently, these features are further refined in the Layer3 module, which consists of convolutional layers combined with a CFBlock designed to fuse multi-scale information. Finally, based on the output of the CFBlock, the features are independently fed into two classifiers dedicated to defoliation rate and boll-opening rate classification, respectively. Each classifier comprises an average pooling layer (Avg pool), a fully connected (FC) layer, a ReLU activation function, and an output layer, ultimately producing the corresponding classification results for the defoliation rate and boll-opening rate.
3. Materials
3.1. Research Area
The experiment was conducted at the Third Branch Factory of Shuangquan, Shihezi City, Xinjiang, as illustrated in Figure 3. This region, characterized by its unique climatic and soil conditions, serves as an ideal site for investigating cotton growth and the efficacy of defoliants. The study area experiences a temperate continental climate, with low annual precipitation ranging from 125.9 to 207 mm, limited water availability, and pronounced diurnal temperature variation. These climatic factors significantly influence both the cotton growth cycle and the performance of defoliants. The cotton cultivar selected for this experiment was Xinluzao 83, which is widely cultivated locally due to its strong adaptability and high yield potential. The choice of this cultivar aimed to evaluate defoliant efficacy under practical agricultural conditions, thereby enhancing the applicability of the research findings. The defoliant applied comprised two active ingredients, thidiazuron and ethephon, administered at rates of 15 g/mu and 40 g/mu, respectively. This formulation effectively promotes defoliation while maintaining cotton yield and quality, thus facilitating subsequent mechanical harvesting. The cotton fields used were farmer-managed farmland rather than designated experimental plots. This selection more accurately simulates real-world agricultural environments, thereby increasing the practical relevance and applicability of the results.
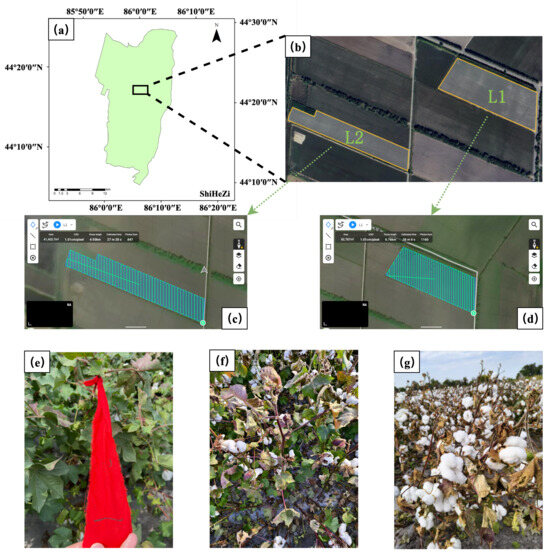
Figure 3.
Overview of the experimental area. (a) Location of the study site in Shihezi; (b) Experimental fields L1 and L2; (c) Flight path and parameters for field L2; (d) Flight path and parameters for field L1; (e) Cotton plants marked for data collection; (f) Cotton during the ripening operation; (g) Cotton at harvest maturity.
Data acquisition was conducted from 24 September to 4 October 2024, encompassing 26 collection sessions. Each session included visible spectrum data from two experimental plots, fields L1 and L2. A DJI Mavic 3E (DJI Technology Co., Ltd., Shenzhen, China) multispectral drone, specifically designed for agricultural remote sensing with high-precision multispectral imaging capabilities, was utilized for data collection. Flight paths were automatically planned using the DJI Pilot 2 software (14.1.0.45, DJI, Shenzhen, China), as detailed in Table 1, which lists the key flight parameters including ground resolution, flight altitude, image overlap, and flight speed. The study period covered key phenological stages of cotton development, providing continuous and comprehensive data to support the experiment.

Table 1.
Flight mission parameters for UAV data acquisition. The table lists the key settings used during the flights, including ground resolution, flight altitude, image overlap, and flight speed, which were chosen to ensure sufficient image quality and coverage for cotton phenotyping.
3.2. Dataset Annotation
To quantify the defoliation rate and boll-opening rate, systematic field surveys and expert annotations were conducted. To ensure data representativeness and accuracy, sampling points were evenly distributed in the experimental field at intervals of 10 m to comprehensively capture field conditions. At each sampling point, three cotton plants were selected, and the numbers of green leaves, total bolls, and opened bolls were recorded. These measurements were independently annotated and cross-validated by two experts with extensive experience in cotton cultivation and plant phenotyping, thereby enhancing annotation consistency and reliability. Based on these observations, the boll-opening rate and defoliation rate were calculated, which serve as key indicators for assessing cotton maturity and the efficacy of defoliants. The boll-opening rate was defined as the ratio of opened bolls to total bolls, while the defoliation rate was calculated from changes in the number of green leaves, as expressed in Equations (5) and (6).
Here, denotes the number of opened bolls at the time of the current survey; is the total number of bolls measured during the first survey; is the number of green leaves remaining at the time of the current survey; and is the number of leaves measured during the first survey.
3.3. Data Preprocessing
Following data collection, UAV imagery was filtered based on field survey results, and corresponding class labels were assigned. To improve annotation efficiency and accuracy, we developed an in-house UAV data parsing tool. This software extracts positional information from MRK files to match images with their geographic coordinates and assists in assigning classification labels. To enhance the model’s adaptability to complex field environments and ensure result reliability and generalization, a comprehensive preprocessing pipeline was implemented. First, due to the fixed UAV flight paths, the planting orientation of cotton in the images was consistent. To improve the model’s capability to recognize different planting orientations, the original images were randomly rotated and mirrored. Additionally, to increase robustness to object scale variations, images were randomly cropped to a fixed resolution of . Second, to reduce redundant information, imagery captured at the field edges was removed. These peripheral areas were often intercropped with other crops (e.g., corn or trees) and exhibited uneven defoliant application, leading to unrepresentative defoliation patterns. Moreover, because the color variation in field images was relatively small, only mean normalization was applied to the dataset; no standardization was performed to avoid overly uniform feature distributions. Finally, the processed images and their manual annotations were packaged into a standardized dataset. According to field survey results, defoliation rates were discretized into nine levels, and boll-opening rates were discretized into ten levels.
After the aforementioned preprocessing, the obtained dataset is shown in Figure 4, consisting of a total of 8737 images. The dataset was divided into training, validation, and test sets with a ratio of 5:1:4. A relatively large proportion was allocated to the test set to ensure a more comprehensive evaluation of the model’s generalization ability and stability under real-world conditions while still maintaining sufficient data for training. Specifically, the training set was used for model parameter learning, while the validation set was used for hyperparameter tuning and model selection, and the test set was used for independent performance evaluation to guarantee objective and reliable results. The training set is used for parameter optimization; the validation set is used for hyperparameter tuning, and the testing set is used to evaluate the final performance of the model. This partitioning strategy enhances the model’s generalization ability under complex field conditions and lays a solid foundation for subsequent experiments.
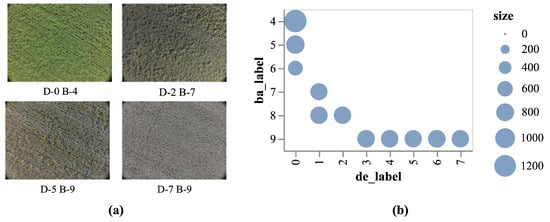
Figure 4.
The constructed dataset. (a) presents sample images from the dataset, where D denotes the defoliation rate label, and B denotes the boll-opening rate label. (b) illustrates the label distribution, where de_label and ba_label represent the defoliation and boll-opening rate labels, respectively. Label 0 corresponds to 0−10%, label 1 to 10−20%, and so forth, with label 9 corresponding to 80−90%.
4. Result
In this study, we compared the proposed RTCMNet model with several widely used deep learning architectures, including DenseNet121, MobileNetV2, ResNet-18, ShuffleNetV2, and EfficientNet. The objective of this comparison was not only to assess the classification accuracy of each model but also to examine their suitability for real-time deployment in resource-constrained environments, such as mobile devices and unmanned aerial vehicles (UAVs) used in precision agriculture. For the experiments, model training was performed on a Windows platform using PyTorch (v2.5.1), TorchVision (v0.20.1), and ONNX (v1.17.0). On-device testing was conducted on a DJI RC Pro Enterprise Remote Controller (DJI, Shenzhen, China) running Android 10.
4.1. Evaluation Metrics
To comprehensively assess the performance of each model, we adopted the following standard evaluation metrics: accuracy, precision, recall, and F1-score. Accuracy is defined as the proportion of correctly predicted samples among all samples. Precision measures the proportion of true positive predictions among all positive predictions made by the model. Recall, also referred to as sensitivity, represents the proportion of actual positive samples that are correctly identified. The F1-score, which is the harmonic mean of precision and recall, provides a balanced measure of model performance. These metrics collectively capture the model’s ability to correctly classify samples and distinguish between different classes from multiple perspectives.
where represents the number of true positives, represents the number of true negatives, represents the number of false positives, and represents the number of false negatives.
To better analyze the resource consumption of the models, additional evaluation metrics were introduced. These metrics include the number of parameters, GMacs, inference time on the PC, and inference time on mobile devices. Here, GMacs (Giga multiply-accumulate operations) denote the total number of fixed-point multiply-accumulate operations required by the model, which serves as an indicator of computational complexity. A single MAC operation consists of one multiplication followed by one addition. In convolutional neural networks (CNNs), the MACs of a standard convolutional layer can be calculated by the following formula:
where K is the kernel size; and are the numbers of input and output channels, respectively; and and denote the height and width of the output feature map. The total multiply-accumulate operations for the entire model is obtained by summing the MACs over all layers as follows:
For convenient comparison and presentation, the total MACs are typically converted to billions of operations (GMACs) as follows:
By considering these metrics, we performed a more thorough comparison to evaluate each model’s overall efficiency, practicality, and suitability for real-world mobile applications. This comprehensive evaluation takes into account not only classification accuracy but also the models’ performance and applicability in practical deployment scenarios.
4.2. Comparison Experiments
To better validate the network performance and assess its applicability in real-world intelligent monitoring of cotton defoliation and boll-opening rates, we evaluated the comprehensive performance of different models. The evaluation considered classification accuracy, the number of parameters, computational complexity (measured by GMACs), and mobile inference performance on the DJI remote controller, with the aim of measuring deployment potential on resource-constrained devices.
We first evaluated the performance of different models on the dataset. As shown in Table 2, we systematically compared the performance of several representative backbone networks on the cotton defoliation and boll-opening classification tasks. Among the classical models, DenseNet121 achieved the highest classification accuracy (0.94), F1 score (0.94), precision (0.95), and recall (0.94). This superior performance can be attributed to its densely connected architecture, which promotes feature reuse and gradient propagation, making it particularly suitable for tasks requiring high precision. ResNet18 also achieved strong results, with an accuracy of 0.89, a precision of 0.91, an F1 score of 0.88, and a recall of 0.87, indicating that its residual connections effectively mitigate the degradation problem in deep networks. InceptionV3 and ViT-S exhibited slightly lower performance (0.79 and 0.77 accuracy, respectively) but still provide reasonable baselines for large-scale applications.
Table 2.
Comparison of model performance with baseline methods using 5-fold cross-validation. Values represent the mean across folds, with standard deviations reported to indicate stability.
Regarding lightweight models, LeViT128, EfficientNet, and MobileNetV2 achieved a good balance between accuracy and efficiency. For example, EfficientNet achieved an accuracy of 0.88, an F1 score of 0.87, a precision of 0.90, and a recall of 0.89, showing that its compound scaling strategy reduces computational cost while maintaining competitive performance. ShuffleNetV2 demonstrated particularly strong results among lightweight models, achieving 0.92 accuracy and 0.93 precision with very low inference latency (10 ms), making it well-suited for real-time applications. In contrast, MobileNetV3S showed extremely poor performance (0.13 accuracy and 0.04 F1 score), suggesting that its highly simplified structure may compromise its ability to capture complex features. SqueezeNet also exhibited relatively lower performance compared with other lightweight models.
Compared with these baselines, the proposed RTCMNet achieves an accuracy of 0.93, an F1 score of 0.93, and a precision and recall of 0.93, closely matching DenseNet121’s performance while requiring significantly fewer parameters (0.35 M vs. 6.63 M) and a lower computational cost (0.10 GMACs vs. 2.63 GMACs). Unlike large-scale networks, RTCMNet emphasizes parameter efficiency and inference speed, combining local convolutional feature extraction with attention mechanisms to effectively capture fine-grained texture details in cotton canopy images while keeping computational overhead minimal. This design enables real-time deployment on resource-constrained devices such as UAVs, making RTCMNet better suited for practical field applications that demand both high accuracy and efficient on-device inference.
As illustrated in Figure 5, the proposed RTCMNet model strikes a favorable balance between high classification performance and computational efficiency. Among the full-scale models, DenseNet121 achieves the highest accuracy; however, it contains over 20 million parameters and requires an inference time of 1084 ms (as shown in Figure 5b)), making it unsuitable for UAV real-time monitoring scenarios that demand low latency. In contrast, RTCMNet utilizes only 0.35 million parameters—approximately 5% of DenseNet121’s size—while achieving comparable classification accuracy. Furthermore, in real-world testing on the DJI remote controller, RTCMNet’s inference latency is merely 32 ms, which is significantly lower than that of DenseNet121.
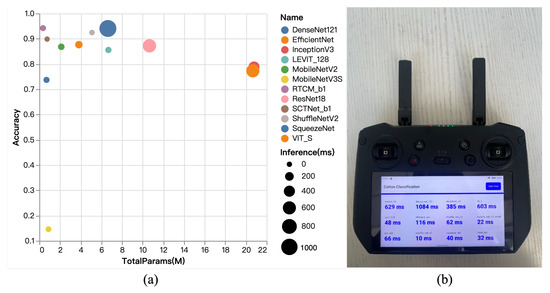
Figure 5.
Comparison of model parameter counts, performance, and inference time. (a) illustrates the relationship among model accuracy, parameter count, and inference time. (b) The results of the inference experiment on the DJI remote control platform.
Compared to MobileNetV2, RTCMNet further reduces the parameter count while maintaining a similar GMAC level. Their inference times are comparable (MobileNetV2: 62 ms; RTCMNet: 32 ms), but RTCMNet achieves higher classification accuracy through optimized lightweight convolutional and feature extraction structures, further demonstrating its efficient feature learning capability. Likewise, although MobileNetV3-Small has a parameter count close to that of RTCMNet and low inference latency, its classification accuracy is only 0.15—significantly lower than that of RTCMNet—indicating that excessive model simplification compromises feature representation, a drawback effectively mitigated by RTCMNet. ShuffleNetV2 and EfficientNet also exhibit competitive accuracy and fast inference speeds; however, their parameter counts are considerably larger than RTCMNet’s—ShuffleNetV2 roughly doubles RTCMNet’s parameters, and EfficientNet approaches 6 million. This imposes increased storage and deployment costs on resource-constrained edge devices like UAVs, limiting their flexible integration. Furthermore, as demonstrated by the real test results in Figure 5b, RTCMNet shows clear advantages in inference latency on the DJI remote controller compared to SCTNet and other lightweight networks, confirming its feasibility for low-latency, high-efficiency deployment in real agricultural environments. This advantage makes RTCMNet particularly suitable for agricultural scenarios requiring a rapid response and continuous monitoring, such as on-site recognition of the defoliation rate and boll-opening rate during critical cotton growth stages, thereby providing real-time decision support for agricultural machinery operations and field management.
In conclusion, although large-scale models like DenseNet121 excel in classification accuracy, their substantial computational overhead limits their real-time applicability. Traditional lightweight networks (e.g., MobileNetV2 and ShuffleNetV2) perform well in inference speed but often at the cost of reduced recognition accuracy. The proposed RTCMNet achieves a comprehensive balance among accuracy, parameter size, computational complexity, and edge inference latency, demonstrating significant potential for UAV-based real-time cotton phenotyping monitoring.
4.2.1. Results of Boll-Opening Rate Classification
In this study, several deep learning models were evaluated for their performance on cotton defoliation rate and boll-opening rate classification tasks. The evaluation employed common performance metrics including accuracy, precision, recall, and the f1-score, which comprehensively characterize the models’ effectiveness and reveal their respective strengths and weaknesses. The boll-opening rate classification task poses greater challenges compared to defoliation rate classification, as its primary features are derived from color and texture information that can be significantly affected by varying lighting conditions and complex backgrounds. Figure 6 presents the performance metrics of different models on the boll-opening rate test set. It can be observed that DenseNet121 achieves the highest scores across all metrics, including accuracy, precision, recall, and the F1-score. Our proposed RTCMNet model also demonstrates strong performance on all metrics, particularly excelling in precision, where it outperforms most models except for DenseNet121.
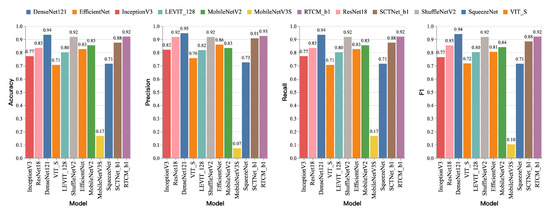
Figure 6.
The performance comparison of RTCMNet with state-of-the-art CNN- and Transformer-based architectures on the cotton maturity dataset. The bar charts report accuracy, precision, recall, and the F1-score across models. RTCMNet_b1 achieves consistently high performance across all four metrics, reaching 0.92 in accuracy, 0.93 in precision, 0.92 in recall, and 0.92 in the F1-score.
Accurate classification is critical in the cotton defoliation rate detection task because incorrect application of defoliants can degrade cotton quality. Within this task, the RTCMNet model exhibits notable advantages, especially in precision, surpassing all other models except the full-scale DenseNet121. In terms of accuracy, precision, and the F1-score, RTCMNet_b1 consistently outperforms ResNet-18, indicating a clear improvement in overall classification accuracy and balanced performance. In summary, although RTCMNet is marginally inferior to DenseNet121, it still delivers excellent comprehensive performance, especially in precision and the F1-score, making it a highly competitive option for practical deployment.
4.2.2. Defoliation Rate Classification Results
As shown in Figure 7, this experiment evaluates model performance on the cotton defoliation rate classification task. It employs the same feature extraction outputs and data preprocessing procedures as the boll-opening rate classification experiment and uses identical evaluation metrics—accuracy, precision, recall, and the F1-score. The results indicate that DenseNet121 achieves the highest performance among all tested models, with all four metrics reaching 0.95, demonstrating its strong capability in handling complex classification tasks. In comparison, ShuffleNetV2 shows a slight decrease in performance, while ResNet18 follows closely behind, achieving slightly lower scores than ShuffleNetV2 yet maintaining high classification accuracy. Among lightweight architectures, ShuffleNetV2 demonstrates competitive results, with accuracy and the F1-score comparable to ResNet-18, while requiring substantially fewer parameters than full-scale models, highlighting its advantage in balancing complexity and performance. EfficientNet and SqueezeNet perform slightly worse than ShuffleNetV2 but remain adequate for the task to some extent. In contrast, MobileNetV3Small performs poorly, achieving an accuracy of only 0.13, likely due to its overly compact architecture, where limited parameters and computational capacity hinder effective learning of task-relevant features. Similarly, MobileNetV2 underperforms expectations, with an accuracy of just 0.85, suggesting that further optimization is needed for complex field environments.
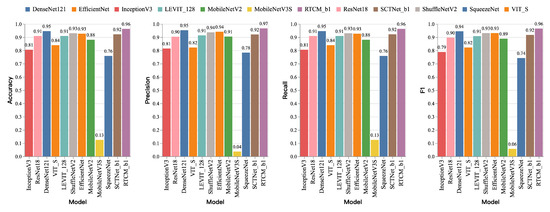
Figure 7.
A comparison of classification performance across representative CNN- and Transformer-based models on the cotton maturity dataset. The bar charts show accuracy, precision, recall, and the F1-score. RTCMNet_b1 achieves the best overall results on all four metrics (accuracy = 0.94, precision = 0.97, recall = 0.96, and F1 = 0.96), surpassing both lightweight baselines (e.g., MobileNet and ShuffleNet) and full-scale architectures (e.g., DenseNet121 and ViT).
Notably, the proposed RTCMNet model delivers outstanding performance in the defoliation rate classification task. Despite its relatively small parameter count, RTCMNet surpasses DenseNet121 in all evaluated metrics and significantly outperforms other lightweight models. This demonstrates that the proposed MSCA block effectively captures fine-grained field features, enabling RTCMNet to maintain a low computational cost while accurately modeling task-specific characteristics, thereby offering strong potential for practical deployment.
4.3. Ablation Experiment
In order to further explore the role of the multi-scale channel attention mechanism (MSCA) in model performance, we conducted detailed ablation experiments. Through the ablation experiments, we verified the effectiveness of the MSCA attention mechanism and discussed the impact of different network configurations on model performance. In the experiment, we replaced the MSCA block with the Conv-Former block [30] and adjusted the network scale to examine the impact of different network configurations on recognition accuracy, inference time, and computational complexity. Table 3 shows the experimental results under different configurations.
Table 3.
Ablation experiments. Five different network configurations and their corresponding performance metrics are listed. Each configuration is determined by three parameters: layer_nums, Attn type, and head_num. Among them, layer_nums represents the configuration of the number of network layers and modules; Attn represents the type of attention mechanism (CF or MSCA); and head_num represents the number of heads in the multi-head attention mechanism.
Specifically, when layer_nums was 1,1,1 and the CF attention mechanism was used, the model accuracy was 0.89, the inference time was 22 ms, and the computational complexity was 0.37 GMacs. As head_num increased to 16, the accuracy improved to 0.90, but the inference time significantly increased to 205 ms, and the computational complexity also greatly increased to 6.75 GMacs. In contrast, when the MSCA attention mechanism was used, the model’s performance was better. In the case of layer_nums being 1,1,1, the accuracy reached 0.91, the inference time was 29 ms, and the computational complexity was 0.7 GMacs. Further increasing layer_nums to 1,2,2 while keeping head_num as eight resulted in an accuracy improvement to 0.94, an inference time of 31 ms, and a computational complexity of 0.9 GMacs. When head_num increased to 16, the accuracy slightly dropped to 0.92, but the inference time significantly increased to 113 ms, and the computational complexity reached 4.31 GMacs. From the experimental results, it can be seen that the MSCA attention mechanism performs well in improving model accuracy, especially in smaller network scales. However, as the network scale and head_num increase, although accuracy improves, inference time and computational complexity also increase significantly. Therefore, in practical applications, it is necessary to balance the model’s accuracy, inference time, and computational resource consumption according to specific requirements and to choose an appropriate network configuration. In this study, we adopted the RTCMNet_b1 configuration to achieve a balance between inference time and performance.
5. Discussion
5.1. Interpretability Analysis
To further analyze the feature extraction capabilities of various deep neural networks for cotton defoliation rate and boll-opening rate detection, we visualized the feature distributions obtained from several backbone architectures (Figure 8). Specifically, the same input data were fed into the trained models, and the output features from their backbone networks were extracted. These high-dimensional features were then reduced to three dimensions using the t-SNE (t-distributed stochastic neighbor embedding) algorithm, enabling a visual comparison of the semantic representation abilities across different networks for cotton field imagery.
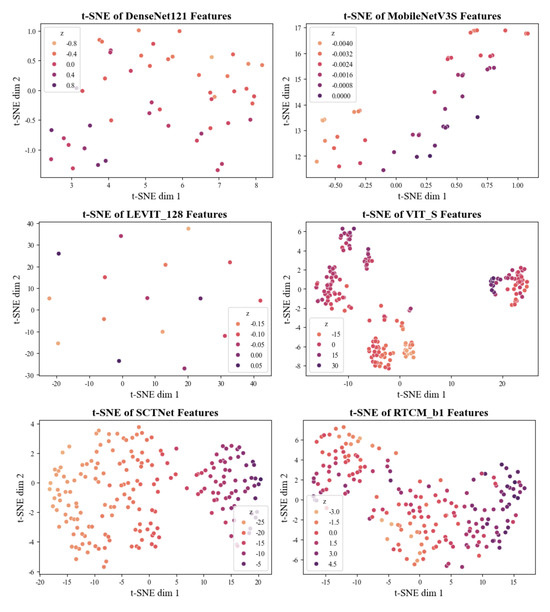
Figure 8.
t-SNE visualization of feature representations extracted by different models: DenseNet121, MobileNetV3S, LeViT_128, ViT_S, SCTNet, and RTCMNet_b1. Compared with conventional CNNs and Transformer-based networks, RTCMNet_b1 produces more compact and clearly separated clusters, indicating stronger feature discriminability and improved capability for distinguishing defoliation and boll-opening levels.
The visualization results show that, among classical convolutional networks, DenseNet121—owing to its densely connected architecture—produces compact and well-separated feature distributions, indicating strong feature extraction capability for cotton field images. In contrast, features learned by MobileNetV3S tend to form densely clustered regions in high-dimensional space, making them harder for downstream classifiers to distinguish, which may contribute to its lower classification performance. For Vision Transformer-based architectures, LEViT also produces uniformly distributed and well-separated features, whereas ViT-S fails to learn effective feature extraction parameters. These findings suggest that LEViT’s superior performance over ViT can be attributed to its stronger ability to generate discriminative feature representations.
The proposed RTCMNet demonstrates remarkable feature extraction capability, with its high-dimensional features exhibiting a more uniform distribution. This indicates that the network can more effectively learn and distinguish diverse semantic information in cotton fields, enabling efficient learning with a reduced number of parameters. Compared with SCTNet, the features extracted by RTCMNet show a more even distribution along the z-axis in the t-SNE space, highlighting the significant improvements achieved through our enhancements to the ConvAttn module. These findings provide compelling evidence of RTCMNet’s potential in cotton defoliation rate and boll-opening rate detection and offer valuable guidance for subsequent model optimization and deployment.
5.2. Field Experiment Validation
To assess the practical applicability of the model in real-world cotton production, we conducted large-scale field experiments using UAV-acquired imagery. The raw aerial images were partitioned into patches and fed into the trained RTCMNet for prediction. Patch-level results were georeferenced using their latitude and longitude and visualized to produce recognition maps. To ensure a comprehensive evaluation, datasets from different plots and multiple post-ripening time points were tested. As illustrated in Figure 9, both defoliation and boll-opening rates showed marked increases with the progression of ripening days.
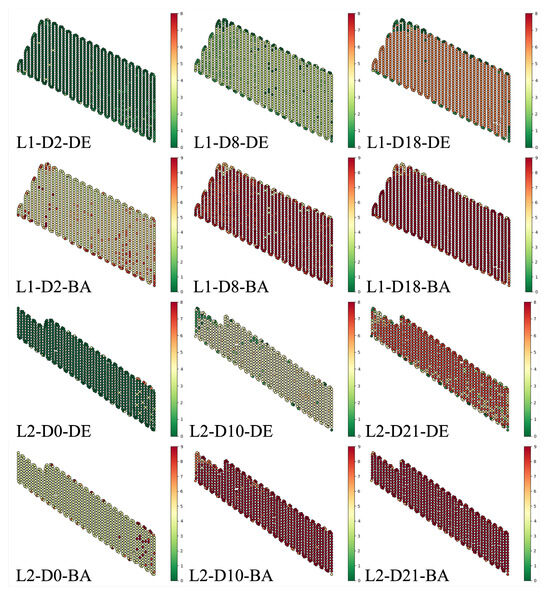
Figure 9.
Results of the large-scale field experiments. Image names consist of three parts: plot, date, and category. The plots include two experimental fields, L1 and L2; the date indicates the number of days after the ripening treatment; in the category, DE denotes the defoliation rate recognition result, and BA denotes the boll-opening rate recognition result.
In plot L1, defoliation performance along the field edges was suboptimal, particularly on day D18, when rates at the boundaries still fell below the harvesting threshold. Field inspections confirmed this observation and suggested that enhanced ventilation and light exposure along the edges promoted more vigorous plant growth, thereby dispersing the applied defoliant over a greater leaf surface area and reducing its per-leaf concentration. Additionally, a low planting density in the upper-left section of L1—caused by pressure fluctuations in the drip irrigation system—provided more growth space between plants, further influencing uniform ripening.
In plot L2, the lower boundary exhibited poor ripening performance, consistent with field survey results. Unlike L1, this section of L2 borders a row of trees, and during UAV-based ripening operations, the obstacle avoidance system maintained a safe clearance from the trees. This safety margin reduced chemical coverage in the adjacent crop rows, lowering defoliation rates. Furthermore, an unplanted area in the upper-left corner of L2 was occupied by economic trees, which similarly resulted in reduced chemical application and poorer defoliation outcomes.
The proposed UAV-based data acquisition and analysis workflow demonstrates scalability to larger fields with reasonable computational effort. In the present experiment, the effective measurement speed was limited by the UAV flight path, averaging 410 s/ha. Since the inference speed of our model exceeds the camera shutter interval, by increasing the flight speed such that the image acquisition interval matches the model’s inference time, the measurement speed could be improved to approximately 200 s/ha, highlighting the potential for further efficiency gains in large-scale applications. Overall, the RTCMNet predictions showed high agreement with field survey observations, providing strong evidence of the model’s effectiveness and operational value in practical cotton production.
5.3. Future Work
Despite promising results, several limitations remain that need to be addressed in future work. First, the dataset used for training the model was collected from a single cotton-growing region, which could limit the model’s generalizability to other regions with different environmental conditions, soil types, and agricultural practices. The variability in crop growth stages and health across diverse regions can affect the accuracy of the model. To improve generalization, future research should focus on collecting multi-regional datasets that encompass a broader range of cotton-growing conditions and environmental factors. Second, varying lighting and weather conditions continue to present challenges for robust UAV-based monitoring. Changes in lighting, such as bright sunlight or overcast skies, can result in inconsistent image quality, while different weather conditions, including rain or high winds, can negatively impact UAV flight stability and data collection. Additionally, while the proposed model is efficient, real-time applications require further optimization to ensure smooth deployment on UAV hardware with limited processing power and memory. There is a need to explore techniques such as model pruning, quantization, and edge computing to reduce the computational load and enhance the model’s efficiency for real-time monitoring applications. Future work will aim to address these limitations by expanding the dataset to cover multiple regions, experimenting with domain adaptation techniques to handle environmental variability, and optimizing the model for real-time applications on resource-constrained UAV platforms. By overcoming these challenges, the applicability and reliability of UAV-based cotton monitoring systems can be significantly enhanced.
6. Conclusions
This study presents RTCMNet (Real-Time Cotton Monitoring Network), a lightweight deep learning architecture for simultaneous estimation of the cotton defoliation rate and boll-opening rate from UAV-based RGB imagery. The model integrates multi-scale convolutional attention (MSCA) modules into a compact CNN backbone, enabling efficient fine-grained canopy feature extraction while maintaining a low computational cost.
Extensive experiments on a large, expert-annotated field dataset demonstrate that RTCMNet achieves 94% accuracy with only 0.35 M parameters and 33 ms inference time on mobile devices—matching the accuracy of full-scale DenseNet121 while significantly reducing resource requirements. Field deployment confirmed strong agreement between RTCMNet predictions and ground-truth survey results, validating its applicability for real-time, large-scale cotton maturity monitoring.
The key contributions include (i) construction of a UAV-based RGB dataset covering the complete harvest cycle; (ii) development of a lightweight, attention-enhanced CNN optimized for UAV and edge deployment; and (iii) comprehensive validation through benchmark comparisons and real-world field experiments. These findings provide a practical, scalable solution for precision agriculture, enabling rapid, spatially explicit maturity mapping to guide harvesting and defoliant application.
Future work will focus on expanding the dataset to multiple regions and cotton varieties, integrating multimodal sensing (e.g., thermal infrared and hyperspectral), and further optimizing the network for robustness under extreme illumination and environmental conditions. The proposed approach can be readily adapted to other crop phenotyping tasks, offering a generalizable framework for UAV-based agricultural monitoring.
Author Contributions
Conceptualization, M.X. and X.C.; methodology, M.X. and Y.Z. (Yan Zhao); software, M.X.; validation, M.X., Y.Z. (Yan Zhao), and X.T.; formal analysis, M.X.; investigation, M.X.; resources, Y.Z. (Yan Zhao) and X.T.; data curation, M.X.; writing—original draft preparation, M.X.; writing—review and editing, X.C., Y.Z. (Yan Zhao), and X.T.; visualization, M.X.; supervision, X.C.; project administration, X.C.; funding acquisition, X.C., H.W., H.L., and W.L.; algorithm design, Y.Z. (Yuchen Zheng); manuscript writing, Y.Z. (Yuchen Zheng). All authors have read and agreed to the published version of the manuscript.
Funding
This research was funded by the Science and Technology Department of Xinjiang Uygur Autonomous Region, grant number 2022A02010-2; the Science and Technology Bureau of Xinjiang Production and Construction Corps, grant number 2024AB029; and the Shihezi University, grant number GJHZ202404. The APC was funded by Shihezi University.
Institutional Review Board Statement
Not applicable.
Informed Consent Statement
Not applicable.
Data Availability Statement
The dataset used in the experiment can be obtained from https://github.com/slgxmh/cotton_rtcm (accessed on 25 September 2025).
Conflicts of Interest
The authors declare no conflicts of interest. The funders had no role in the design of the study; in the collection, analyses, or interpretation of data; in the writing of the manuscript; or in the decision to publish the results.
References
- Jans, Y.; von Bloh, W.; Schaphoff, S.; Müller, C. Global cotton production under climate change—Implications for yield and water consumption. Hydrol. Earth Syst. Sci. 2021, 25, 2027–2044. [Google Scholar] [CrossRef]
- Feng, L.; Chi, B.; Dong, H. Cotton cultivation technology with Chinese characteristics has driven the 70-year development of cotton production in China. J. Integr. Agric. 2022, 21, 597–609. [Google Scholar] [CrossRef]
- Gwathmey, C.O.; Bange, M.P.; Brodrick, R. Cotton crop maturity: A compendium of measures and predictors. Field Crops Res. 2016, 191, 41–53. [Google Scholar] [CrossRef]
- Wang, J.; Zhang, Z.; Zhang, N.; Liang, Y.; Gong, Z.; Wang, J.; Ditta, A.; Sang, Z.; Li, X.; Zheng, J. The correlation of machine-picked cotton defoliant in different Gossypium hirsutum Varieties. Agronomy 2023, 13, 2151. [Google Scholar] [CrossRef]
- Wu, H.; Liu, K.; Han, C. Effects of 14% Thiobenzene-Dioxalon on Defoliation Ripening, Yield and Quality of Cotton. Crops 2023, 39, 164–169. [Google Scholar]
- Bange, M.P.; Long, R.L.; Constable, G.A.; Gordon, S.G. Minimizing immature fiber and neps in upland cotton. Agron. J. 2010, 102, 781–789. [Google Scholar] [CrossRef]
- NY/T3084-2017; Code of Practice for Machine Harvested Cotton in Northwest Inland Cotton Regin. Agricultural Industry Standard of the People’s Republic of China: Beijing, China, 2017.
- GB/T45102-2024; Harvesting Technical Requirements for Machine-Harvested Cotton. All China Federation of Supply and Marketing Cooperatives: Beijing, China, 2024.
- Tan, J.; Ding, J.; Wang, Z.; Han, L.; Wang, X.; Li, Y.; Zhang, Z.; Meng, S.; Cai, W.; Hong, Y. Estimating soil salinity in mulched cotton fields using UAV-based hyperspectral remote sensing and a Seagull Optimization Algorithm-Enhanced Random Forest Model. Comput. Electron. Agric. 2024, 221, 109017. [Google Scholar] [CrossRef]
- Ma, Y.; Chen, X.; Huang, C.; Hou, T.; Lv, X.; Zhang, Z. Monitoring defoliation rate and boll-opening rate of machine-harvested cotton based on UAV RGB images. Eur. J. Agron. 2023, 151, 126976. [Google Scholar] [CrossRef]
- Ren, Y.; Meng, Y.; Huang, W.; Ye, H.; Han, Y.; Kong, W.; Zhou, X.; Cui, B.; Xing, N.; Guo, A.; et al. Novel vegetation indices for cotton boll opening status estimation using sentinel-2 data. Remote Sens. 2020, 12, 1712. [Google Scholar] [CrossRef]
- Wang, Y.; Xiao, C.; Wang, Y.; Li, K.; Yu, K.; Geng, J.; Li, Q.; Yang, J.; Zhang, J.; Zhang, M.; et al. Monitoring of cotton boll opening rate based on UAV multispectral data. Remote Sens. 2023, 16, 132. [Google Scholar] [CrossRef]
- Jia, X.; Kuo, B.C.; Crawford, M.M. Feature mining for hyperspectral image classification. Proc. IEEE 2013, 101, 676–697. [Google Scholar] [CrossRef]
- Khan, A.T.; Jensen, S.M. LEAF-Net: A unified framework for leaf extraction and analysis in multi-crop phenotyping using YOLOv11. Agriculture 2025, 15, 196. [Google Scholar] [CrossRef]
- Wang, Z.; Zhang, H.W.; Dai, Y.Q.; Cui, K.; Wang, H.; Chee, P.W.; Wang, R.F. Resource-Efficient Cotton Network: A Lightweight Deep Learning Framework for Cotton Disease and Pest Classification. Plants 2025, 14, 2082. [Google Scholar] [CrossRef] [PubMed]
- Paul, N.; Sunil, G.; Horvath, D.; Sun, X. Deep learning for plant stress detection: A comprehensive review of technologies, challenges, and future directions. Comput. Electron. Agric. 2025, 229, 109734. [Google Scholar] [CrossRef]
- Meghraoui, K.; Sebari, I.; Pilz, J.; Ait El Kadi, K.; Bensiali, S. Applied deep learning-based crop yield prediction: A systematic analysis of current developments and potential challenges. Technologies 2024, 12, 43. [Google Scholar] [CrossRef]
- Ma, R.; Zhang, Y.; Zhang, B.; Fang, L.; Huang, D.; Qi, L. Learning attention in the frequency domain for flexible real photograph denoising. IEEE Trans. Image Process. 2024, 33, 3707–3721. [Google Scholar] [CrossRef]
- Dosovitskiy, A.; Beyer, L.; Kolesnikov, A.; Weissenborn, D.; Zhai, X.; Unterthiner, T.; Dehghani, M.; Minderer, M.; Heigold, G.; Gelly, S.; et al. An image is worth 16 × 16 words: Transformers for image recognition at scale. arXiv 2020, arXiv:2010.11929. [Google Scholar]
- Graham, B.; El-Nouby, A.; Touvron, H.; Stock, P.; Joulin, A.; Jégou, H.; Douze, M. Levit: A vision transformer in convnet’s clothing for faster inference. In Proceedings of the IEEE/CVF International Conference on Computer Vision, Montreal, BC, Canada, 11–17 October 2021; pp. 12259–12269. [Google Scholar]
- Abdalla, A.; Wheeler, T.A.; Dever, J.; Lin, Z.; Arce, J.; Guo, W. Assessing fusarium oxysporum disease severity in cotton using unmanned aerial system images and a hybrid domain adaptation deep learning time series model. Biosyst. Eng. 2024, 237, 220–231. [Google Scholar] [CrossRef]
- Arun, R.A.; Umamaheswari, S. Effective multi-crop disease detection using pruned complete concatenated deep learning model. Expert Syst. Appl. 2023, 213, 118905. [Google Scholar] [CrossRef]
- Albattah, W.; Javed, A.; Nawaz, M.; Masood, M.; Albahli, S. Artificial intelligence-based drone system for multiclass plant disease detection using an improved efficient convolutional neural network. Front. Plant Sci. 2022, 13, 808380. [Google Scholar] [CrossRef]
- Sandler, M.; Howard, A.; Zhu, M.; Zhmoginov, A.; Chen, L.C. Mobilenetv2: Inverted residuals and linear bottlenecks. In Proceedings of the IEEE Conference on Computer Vision and Pattern Recognition, Salt Lake City, UT, USA, 18–23 June 2018; pp. 4510–4520. [Google Scholar]
- Ma, N.; Zhang, X.; Zheng, H.T.; Sun, J. Shufflenet v2: Practical guidelines for efficient cnn architecture design. In Proceedings of the European Conference on Computer Vision (ECCV), Munich, Germany, 8–14 September 2018; pp. 116–131. [Google Scholar]
- Pan, P.; Shao, M.; He, P.; Hu, L.; Zhao, S.; Huang, L.; Zhou, G.; Zhang, J. Lightweight cotton diseases real-time detection model for resource-constrained devices in natural environments. Front. Plant Sci. 2024, 15, 1383863. [Google Scholar] [CrossRef] [PubMed]
- Zhang, X.; Chen, L. Bud-YOLO: A Real-Time Accurate Detection Method of Cotton Top Buds in Cotton Fields. Agriculture 2024, 14, 1651. [Google Scholar] [CrossRef]
- Zhang, Z.; Yang, Y.; Xu, X.; Liu, L.; Yue, J.; Ding, R.; Lu, Y.; Liu, J.; Qiao, H. GVC-YOLO: A Lightweight Real-Time Detection Method for Cotton Aphid-Damaged Leaves Based on Edge Computing. Remote Sens. 2024, 16, 3046. [Google Scholar] [CrossRef]
- Kanade, A.K.; Potdar, M.P.; Kumar, A.; Balol, G.; Shivashankar, K. Weed detection in cotton farming by YOLOv5 and YOLOv8 object detectors. Eur. J. Agron. 2025, 168, 127617. [Google Scholar] [CrossRef]
- Xu, Z.; Wu, D.; Yu, C.; Chu, X.; Sang, N.; Gao, C. Sctnet: Single-branch cnn with transformer semantic information for real-time segmentation. In Proceedings of the AAAI Conference on Artificial Intelligence, Vancouver, BC, Canada, 20–27 February 2024; Volume 38, pp. 6378–6386. [Google Scholar]
- Vaswani, A.; Shazeer, N.; Parmar, N.; Uszkoreit, J.; Jones, L.; Gomez, A.N.; Kaiser, Ł.; Polosukhin, I. Attention is all you need. Adv. Neural Inf. Process. Syst. 2017, 30. [Google Scholar]
- Szegedy, C.; Vanhoucke, V.; Ioffe, S.; Shlens, J.; Wojna, Z. Rethinking the inception architecture for computer vision. In Proceedings of the IEEE Conference on Computer Vision and Pattern Recognition, Las Vegas, NV, USA, 27–30 June 2016; pp. 2818–2826. [Google Scholar]
- He, K.; Zhang, X.; Ren, S.; Sun, J. Deep residual learning for image recognition. In Proceedings of the IEEE Conference on Computer Vision and Pattern Recognition, Las Vegas, NV, USA, 27–30 June 2016; pp. 770–778. [Google Scholar]
- Huang, G.; Liu, Z.; Van Der Maaten, L.; Weinberger, K.Q. Densely connected convolutional networks. In Proceedings of the IEEE Conference on Computer Vision and Pattern Recognition, Honolulu, HI, USA, 21–26 July 2017; pp. 4700–4708. [Google Scholar]
- Tan, M.; Le, Q. Efficientnet: Rethinking model scaling for convolutional neural networks. In Proceedings of the International Conference on Machine Learning, Long Beach, CA, USA, 9–15 June 2019; pp. 6105–6114. [Google Scholar]
- Howard, A.; Sandler, M.; Chu, G.; Chen, L.C.; Chen, B.; Tan, M.; Wang, W.; Zhu, Y.; Pang, R.; Vasudevan, V.; et al. Searching for mobilenetv3. In Proceedings of the IEEE/CVF International Conference on Computer Vision, Seoul, Republic of Korea, 27 October–2 November 2019; pp. 1314–1324. [Google Scholar]
- Iandola, F.N.; Han, S.; Moskewicz, M.W.; Ashraf, K.; Dally, W.J.; Keutzer, K. SqueezeNet: AlexNet-level accuracy with 50× fewer parameters and< 0.5 MB model size. arXiv 2016, arXiv:1602.07360. [Google Scholar]
Disclaimer/Publisher’s Note: The statements, opinions and data contained in all publications are solely those of the individual author(s) and contributor(s) and not of MDPI and/or the editor(s). MDPI and/or the editor(s) disclaim responsibility for any injury to people or property resulting from any ideas, methods, instructions or products referred to in the content. |
© 2025 by the authors. Licensee MDPI, Basel, Switzerland. This article is an open access article distributed under the terms and conditions of the Creative Commons Attribution (CC BY) license (https://creativecommons.org/licenses/by/4.0/).