1. Introduction
The intensification of drought conditions, driven by climate change, presents a profound threat to global food and water security, as well as to economic stability, particularly in developing regions. Drought is a phenomenon that intensifies gradually and can have severe long-lasting impacts on terrestrial ecosystems and human societies. Monitoring and assessing drought are challenging due to its complex and multifaceted nature. Accordingly, there is a critical need to enhance the understanding of various aspects of drought to effectively inform and develop strategic response measures. In recent decades, distinct classification frameworks have been established for drought monitoring, including meteorological, agricultural, hydrological, and socio-economic droughts, each offering specialized insights into the occurrence, impacts, and progression of drought conditions [
1]. Among these categories, agricultural drought is a critical component for monitoring agricultural areas across both spatial and temporal dimensions. It is defined as a deficit in soil moisture—driven by meteorological drought and climatic factors—and is characterized by its direct impact on agricultural productivity and activities [
2]. In fact, prolonged insufficient precipitation, rising Land Surface Temperatures (LSTs), and low soil moisture prevent crops from receiving the water that they require for proper development. Therefore, it is crucial to consider all the previously described elements—such as vegetation density, LST, soil moisture levels, and aggregated precipitation data—to monitor drought occurrences, particularly agricultural drought.
Numerous methodologies have been developed for the classification, identification, and monitoring of drought, with a primary emphasis on drought indices as key indicators [
3,
4]. Drought is primarily monitored using two approaches: conventional methods and emerging technologies such as remote sensing [
5]. Temperature, precipitation, evapotranspiration, runoff, and soil moisture are common meteorological and hydrological variables that form the basis of conventional approaches [
6,
7]. These variables are used to generate widely adopted drought indices, including Standardized Precipitation Index (SPI) [
8], Palmer Drought Severity Index (PDSI) [
9], Standardized Precipitation Evapotranspiration Index (SPEI) [
10], Reconnaissance Drought Index (RDI) [
11] and Streamflow Drought Index (SDI) [
12], which represent some of the most extensively used traditional drought monitoring techniques.
However, conventional drought monitoring methods rely heavily on limited field measurements and increasing labor demands, making the process time-intensive [
13]. As a result, the spatial and temporal resolutions of these methods are inherently limited. In contrast, remote sensing technologies—offering time series and large-scale datasets—have emerged as vital tools for monitoring and assessing agricultural drought, especially in data-scarce regions [
14,
15,
16,
17,
18,
19,
20]. Key satellite-based platforms used in drought monitoring include Moderate Resolution Imaging Spectroradiometer (MODIS), Landsat, Sentinel-2, and Soil Moisture Active Passive (SMAP), which provide critical data on vegetation health, soil moisture, LST, and precipitation patterns [
21]. Additionally, airborne platforms (e.g., manned aircraft and Unmanned Aerial Vehicles (UAVs)) and ground-based platforms (e.g., Ground-Based Interferometric Synthetic Aperture Radar (SAR), Terrestrial Laser Scanning, and InfraRed Thermography) are employed to monitor and assess drought conditions at a local scale [
22].
Bibliometric analyses indicate that research on drought monitoring has increasingly shifted from the aforementioned traditional indices toward large-scale evaluations and remote sensing-based approaches [
23]. This transition reflects the growing need for spatially continuous and globally comparable drought assessment tools [
24]. Among satellite-based datasets, the Vegetation Health Index (VHI) [
25,
26] is widely used to monitor plant health and drought conditions through remote sensing data [
27]. It has proven effective for drought monitoring and evaluation, especially in agricultural areas. The VHI is derived from the Vegetation Condition Index (VCI) and the Temperature Condition Index (TCI). The VCI is commonly used to track vegetation condition changes, ranging from severely degraded to favorable states [
28,
29]. In contrast, the TCI detects vegetative stress caused by either high temperatures or excessive moisture levels [
30,
31]. Previous studies have shown that the satellite-based VHI is widely applied to monitor vegetation dynamics across different regions and spatial scales [
15,
32,
33,
34,
35].
In addition to drought monitoring and assessment, drought vulnerability is essential for comprehending and reducing the effects of drought on different systems. Recent research has highlighted the complexity of drought vulnerability and the need for sector-specific context-dependent interventions [
36,
37]. A dynamic and impact-driven approach that uses historical drought impact data to identify effective vulnerability variables for different systems has been offered as a solution to the shortcomings of current vulnerability assessment methodologies [
38]. This approach offers a statistically valid and more transparent evaluation of drought vulnerability, which could increase the efficacy of drought mitigation techniques. Previous studies have primarily employed fuzzy logic, multi-criteria decision making, weighting-based, and machine learning approaches, combined with various remote sensing and ground-based data, to generate drought vulnerability maps [
38,
39,
40,
41,
42,
43]. The input parameters in these studies varied widely, encompassing both meteorological datasets and remote sensing datasets. However, few studies specifically focused on agricultural drought vulnerability within clearly defined agricultural boundaries. Applying these methods across all land cover types—without isolating agricultural zones—can lead to misinterpretation of the results. Moreover, even though some studies utilized various remote sensing and meteorological datasets, none incorporated the combined use of long-term VHI, Precipitation Condition Index (PCI), Evapotranspiration Condition Index (ETCI), or Soil Moisture Condition Index (SMCI)—indices most directly relevant to agricultural drought.
Türkiye has experienced multiple severe droughts throughout its history, primarily driven by prolonged precipitation deficits. These droughts have negatively affected agricultural water management—which consumes 75% of the country’s freshwater resources—as well as overall agricultural production [
44]. Climate change projections suggest that drought conditions will intensify in the coming years, with especially severe impacts expected in arid and semi-arid regions such as Central Anatolia. These conditions are projected to reduce agricultural productivity significantly. Therefore, yield reductions may lead to increased market prices and broader socio-economic disruptions.
The Konya Closed Basin, one of Türkiye’s 25 hydrological basins, is the most groundwater-dependent region in the country. Spanning approximately 3.5 million hectares, the basin supports intensive irrigation-dependent agricultural activities. The Konya Closed Basin is situated within the semi-arid climate zone. However, since the 1980s, a significant decline in annual precipitation—combined with a gradual shift toward an arid climate—has intensified drought severity, making it a critical environmental concern in the region [
45]. Several studies have assessed meteorological, agricultural, and hydrological drought in the Konya Closed Basin using conventional methods [
45,
46,
47,
48]. However, few studies have incorporated both phenomena for drought monitoring. For instance, Caglar et al. [
49] used a MODIS-based Normalized Difference Vegetation Index (NDVI) time series (2010–2020) to assess the drought, while Gümüş and Durduran [
50] applied Landsat-based VHI images (1984–2018) to evaluate drought in the Beyşehir-Kaşaklı Sub-Basin. Similarly, Khorrami and Gündüz [
51] conducted a nationwide drought assessment using various datasets. However, none of these studies evaluated long-term drought variability in the Konya Closed Basin by integrating multiple satellite-based drought indicators specifically for agricultural zones.
Moreover, previous studies in the basin attempted to assess drought using diverse datasets. In contrast, the present study aims to assess both agricultural drought and drought vulnerability in the Konya Closed Basin. To the best of the authors’ knowledge, this is the first study to propose a Drought Vulnerability Index (DVI) and to monitor across the entire Konya Closed Basin using satellite-based time series of drought indicators. Several drought indices are capable of tracking dryness from the soil, crops, and atmospheric conditions. Remote sensing-based agricultural drought indices are ideal for long-term monitoring, including VCI, TCI, VHI, PCI, ETCI, and SMCI [
5]. Each of these indices offers unique insights into specific aspects of drought conditions. Therefore, this study proposes the use of VHI, PCI, SMCI, and ETCI for a comprehensive assessment of agricultural drought vulnerability.
3. Methodology
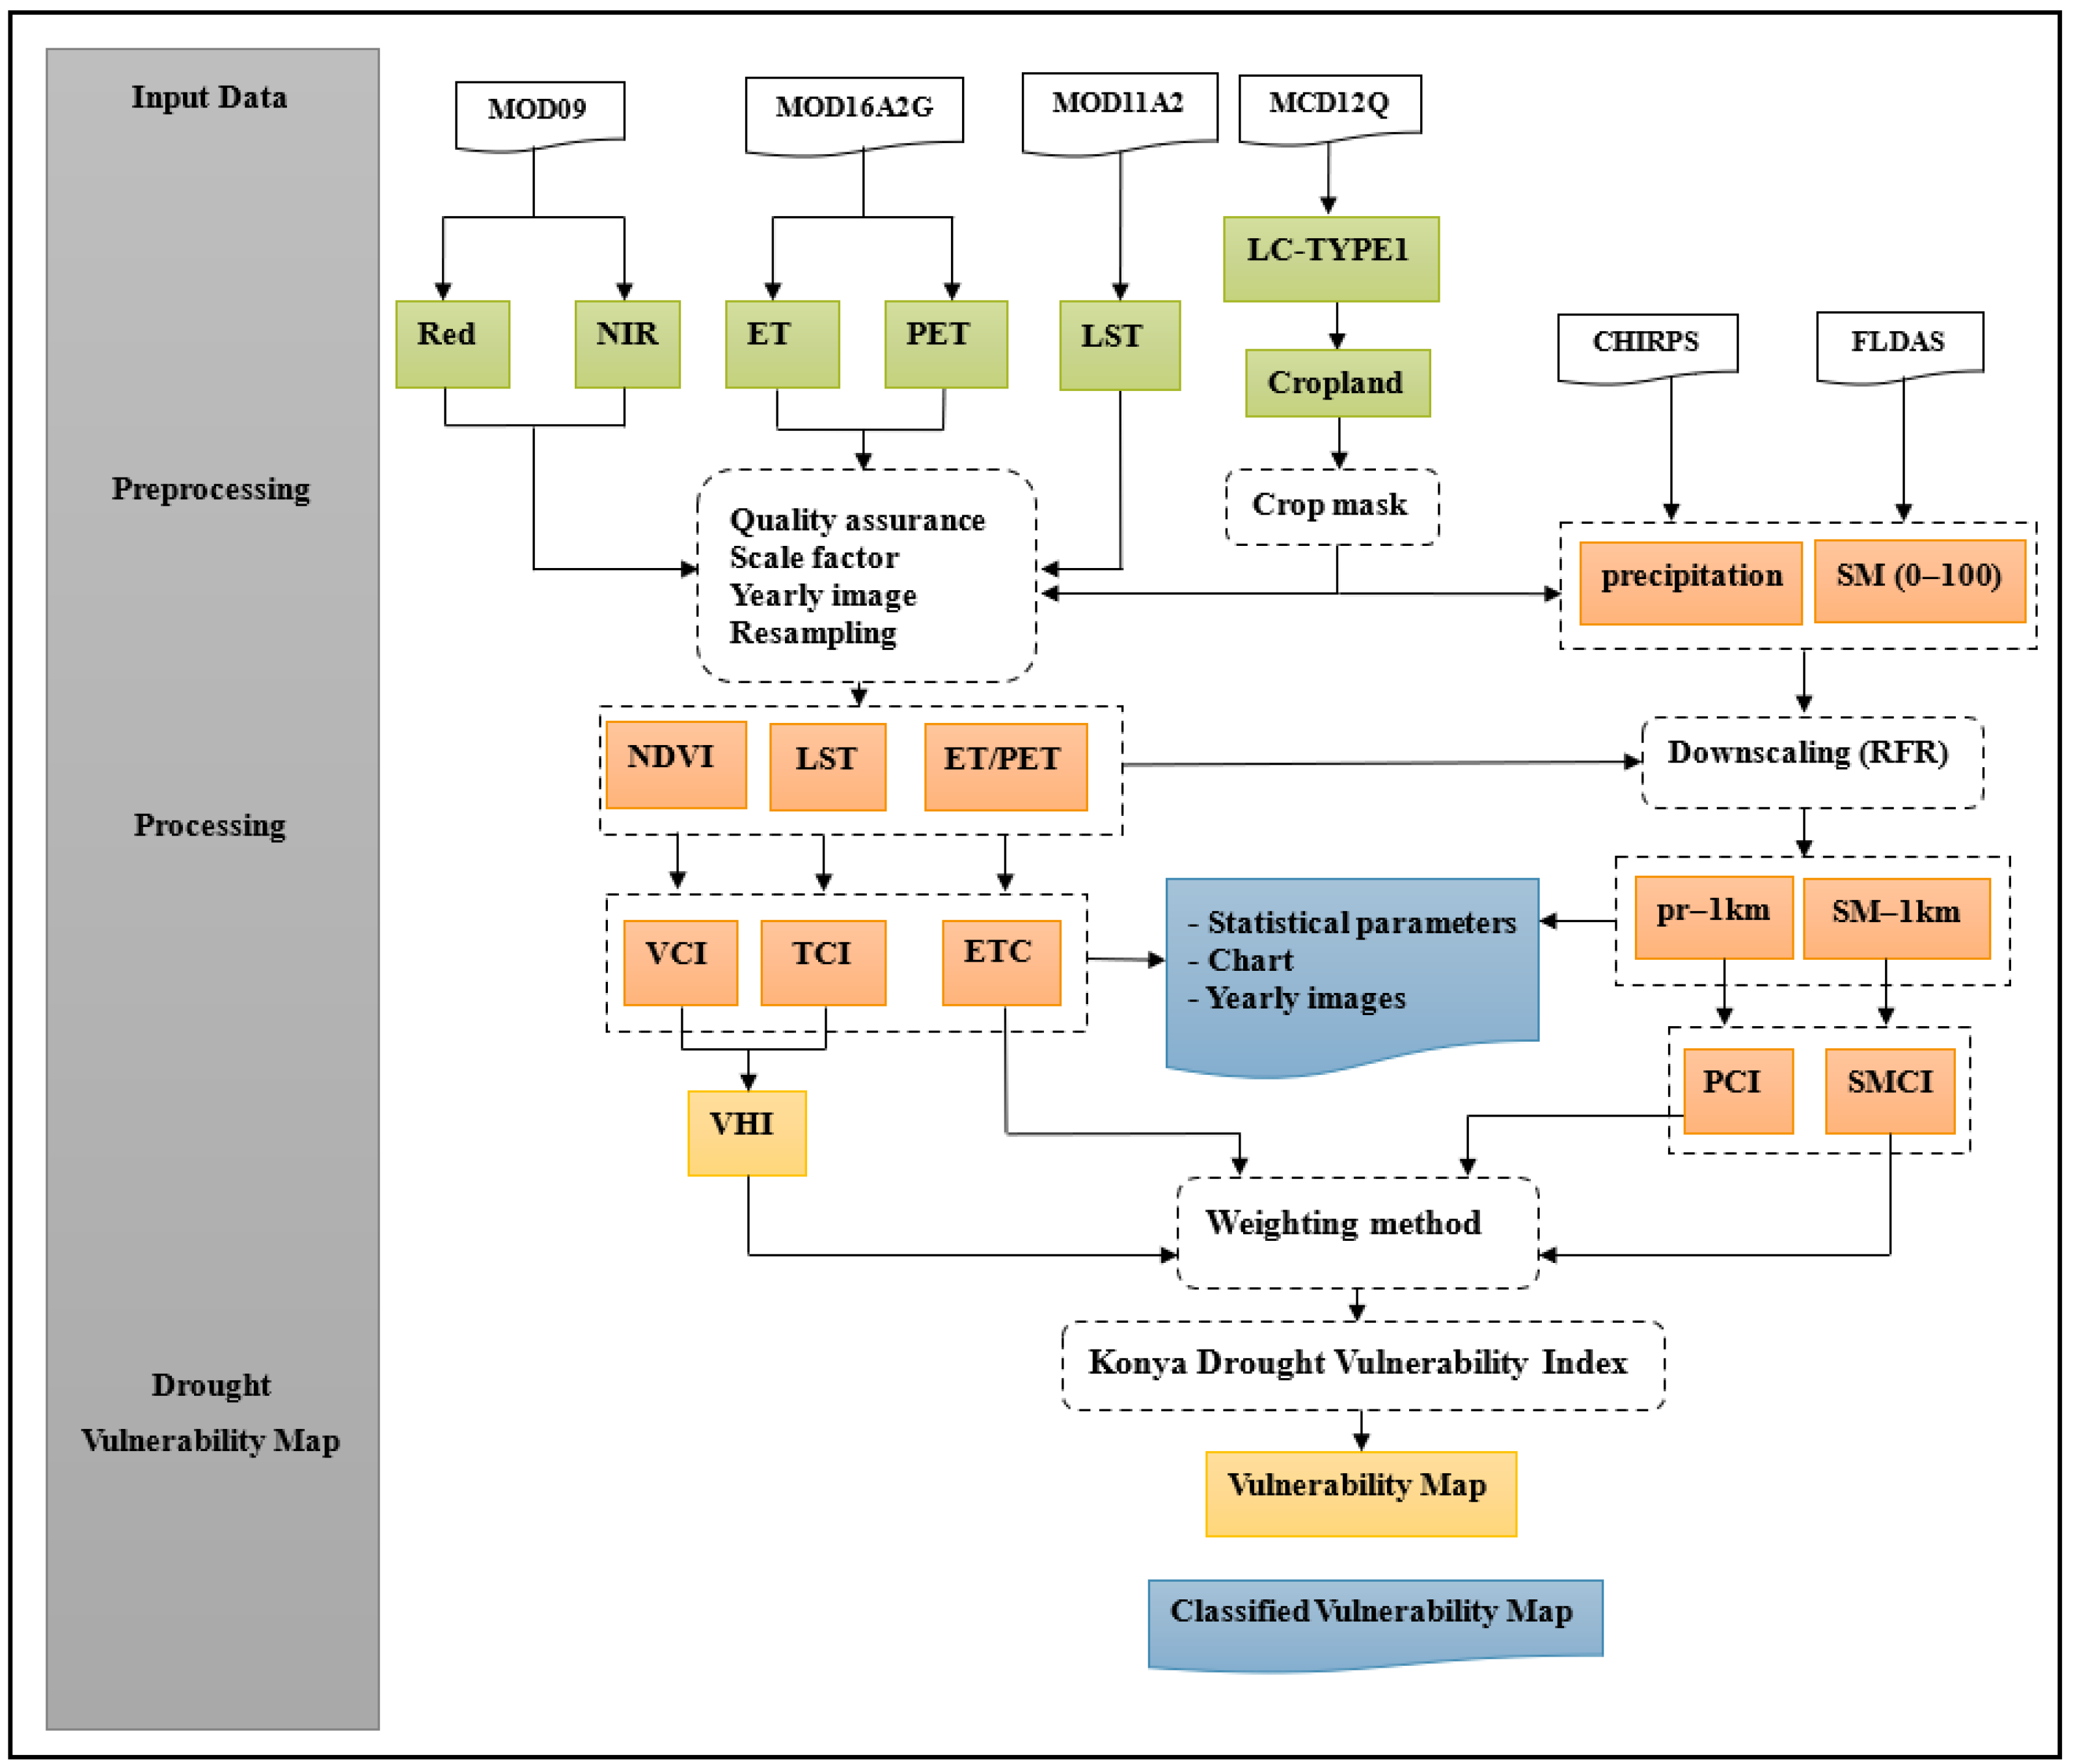
The methodology employed in this study is outlined as follows. A detailed flowchart illustrating the proposed method is presented in
Figure 3. The approach consists of three primary phases: preprocessing, processing, and drought vulnerability map generation, each designed to systematically address the study objectives.
Preprocessing represents a foundational step in ensuring the quality of the data, as it prepares and optimizes raw datasets for subsequent analytical processes. This phase includes several steps as follows:
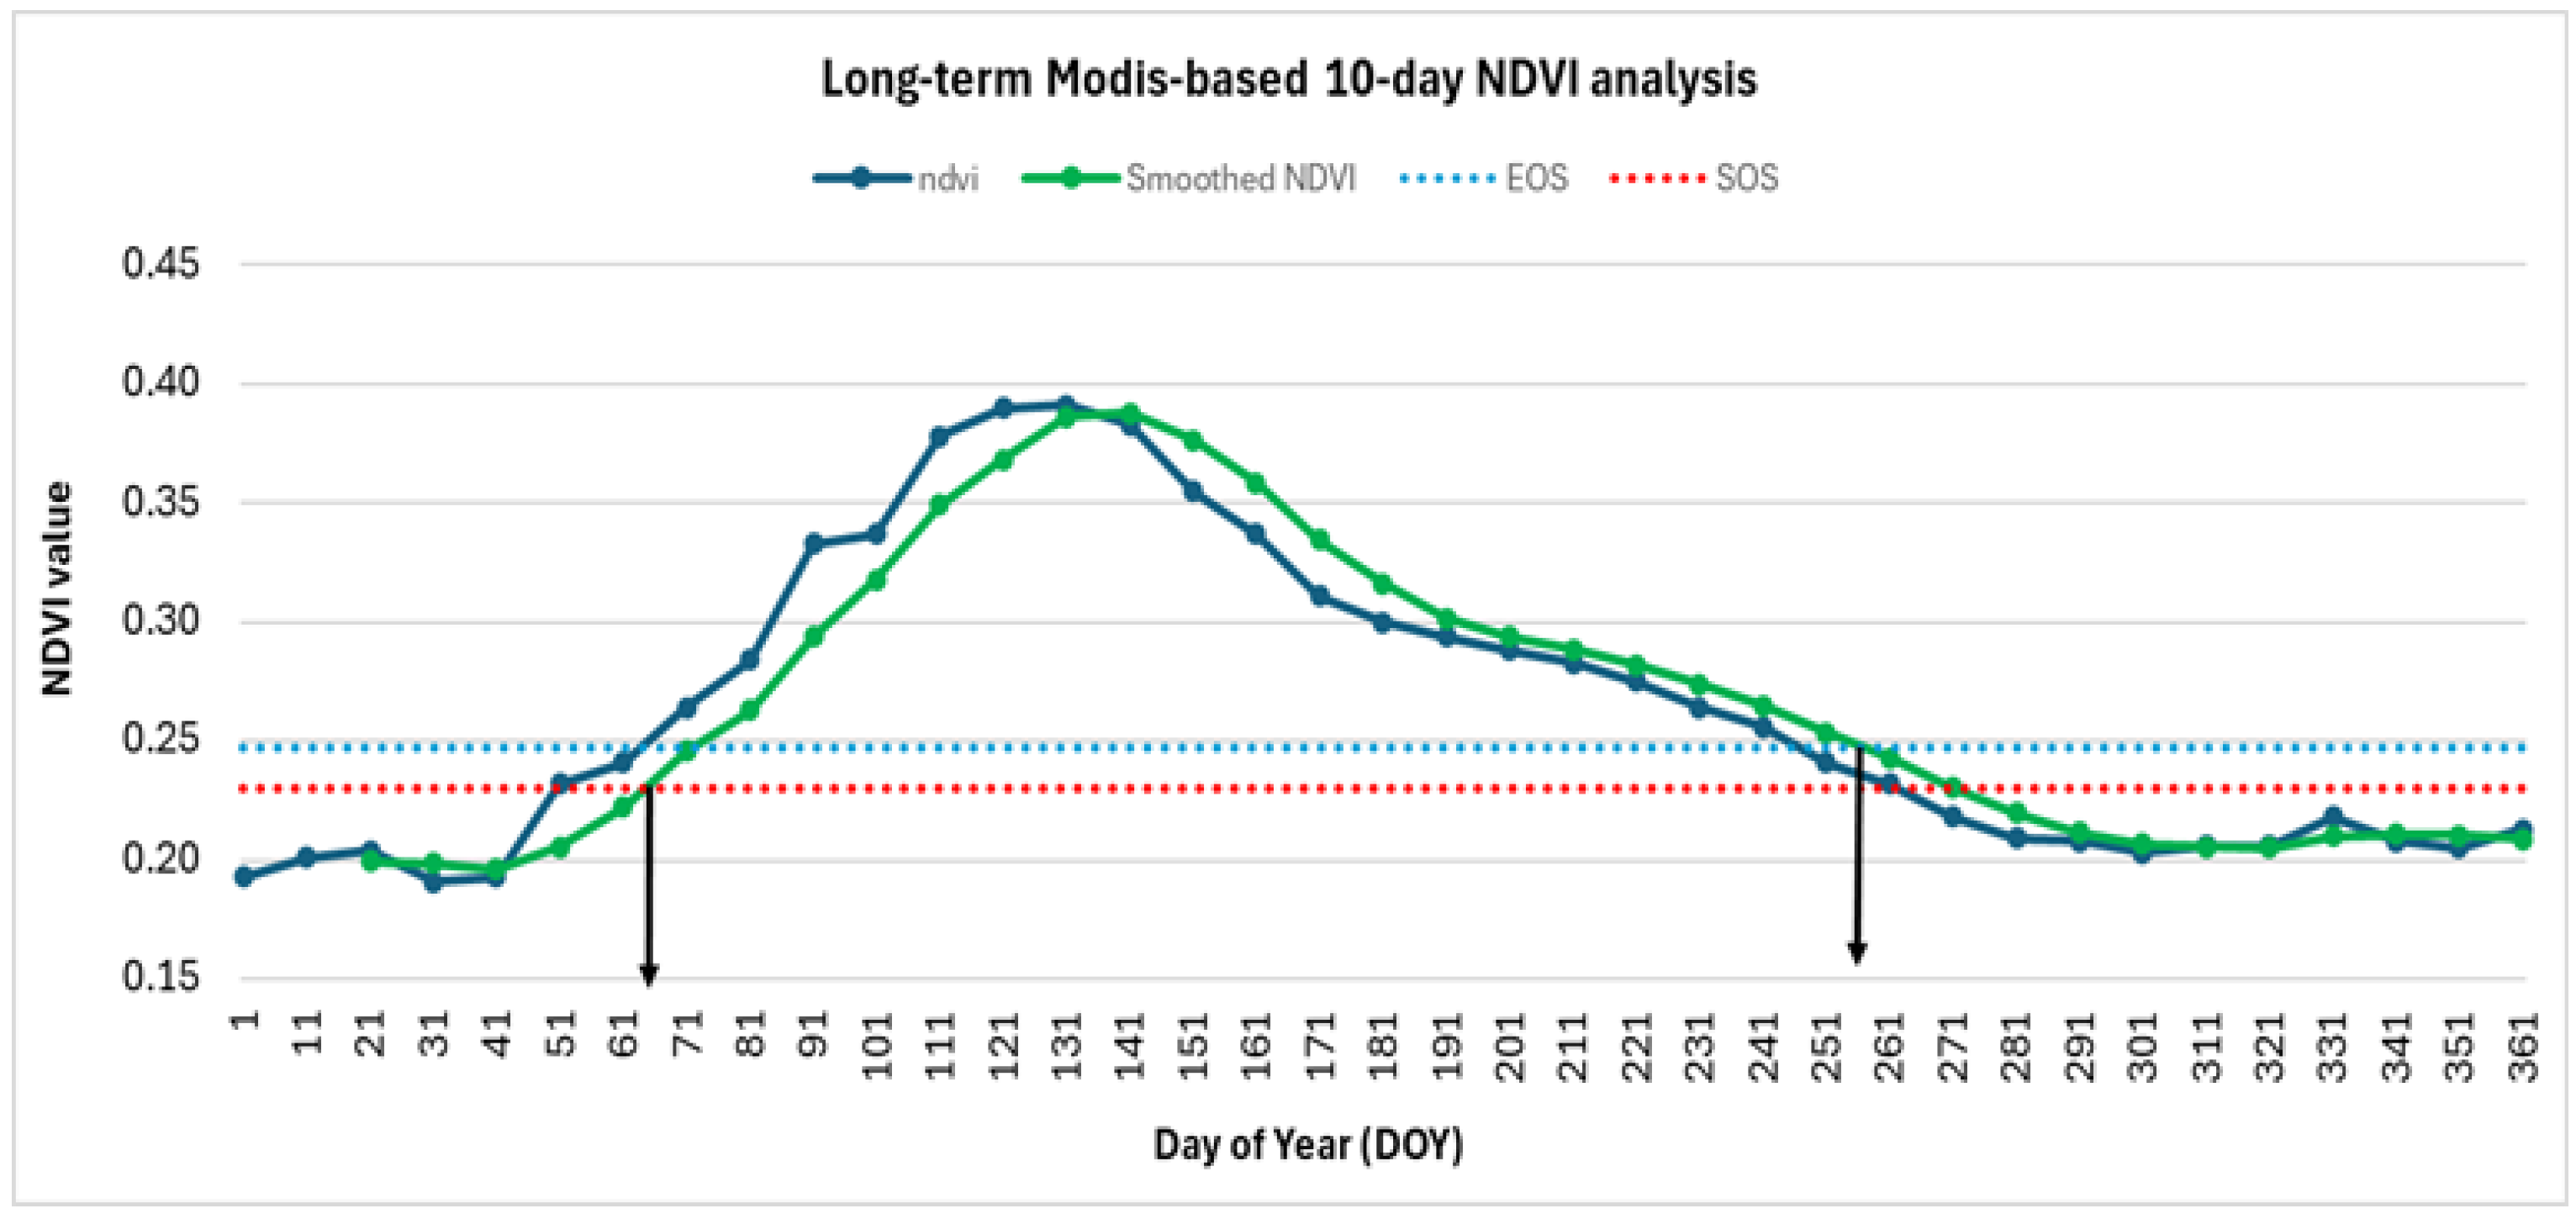
(i) Filtering all datasets by the area of interest (Konya Closed Basin boundary) and the study period 2001–2024, as well as a long-term NDVI analysis to determine the best months of year based on agricultural production. Understanding the timing of vegetation growth is essential for interpreting drought dynamics and agricultural vulnerability. To capture vegetation seasonality in the Konya Closed Basin, we conducted a phenology analysis using long-term MODIS 10-day NDVI composites spanning 2001–2024 (
Figure 4). Following the approach of [
70,
71], the NDVI time series were smoothed using a moving average filter to minimize noise and highlight seasonal trajectories. From the smoothed NDVI profile, the Start of Season (SOS) and End of Season (EOS) were extracted using a threshold-based method. The results indicate that the SOS typically occurs around Day of Year (DOY) 61, corresponding to the early greening phase in spring, while the EOS is observed near DOY 251, marking the vegetation harvesting period in late summer. These phenological markers define the effective growing season for agricultural crops in the basin. Using this temporal window, the vulnerability indices (VCI, TCI, ETCI, AODCI) and the proposed DVI were calculated with respect to the active growth period rather than the entire year.
(ii) Selecting bands relevant to agricultural drought monitoring.
(iii) Enhancing pixel quality using Quality Assurance (QA) bands in MODIS-derived SR, LST, and ET/PET products.
(iv) Applying scale factors to the MODIS bands.
(v) Resampling all MODIS products to a uniform spatial resolution of 1 km.
(vi) Masking the preprocessed image collection to focus solely on cropland areas.
(vii) Downscaling precipitation and soil moisture datasets to a 1 km resolution using the Random Forest Regression (RFR) method to ensure consistency with MODIS-based products. The parameters used for the downscaling process are presented in
Table 2.
The processing phase builds upon the preprocessed dataset, integrating advanced indices and classification methods. After preprocessing, the dataset is quality enhanced and suitable for use in the processing phase. The processing phase consists of the following steps presented in the subsections.
3.1. Calculation of Normalized Indicators
The indicator values were normalized to range between 0 and 1, as they were expressed in different units of measurement. To complete this process, we first determined how the indicator is related to drought vulnerability. Two types of functional interactions might exist, i.e., vulnerability could either increase or decrease based on the indicator value. The indicators can have a direct or inverse effect on vulnerability.
The formula presented in Equation (2) was used to normalize the indicator values that have a direct relationship with drought.
In contrast, for indicators with an inverse relationship, Equation (3) was used.
where, in both equations,
Xi is the normalized value of variable
xi, and
x(
min) and
x(
max) are the minimum and maximum values of dataset
xi, respectively.
Table 3 demonstrates the condition indices used in this research.
Table 3.
List of satellite-based drought indices (A: agricultural drought, H: hydrological drought, M: meteorological drought).
Table 3.
List of satellite-based drought indices (A: agricultural drought, H: hydrological drought, M: meteorological drought).
| Index | Acronyms | Equation | Drought Type | Key Reference |
|---|
| Vegetation Condition Index | VCI | | A | [28] |
| Temperature Condition Index | TCI | | A/M | [28] |
| Precipitation Condition Index | PCI | | H | [72] |
| Soil Moisture Condition Index | SMCI | | A | [72] |
| Evapotranspiration Condition Index | ETCI | | A | [73] |
| Vegetation Health Index | VHI | | A | [28] |
3.2. Visualization of VCI, TCI, and VHI
The annual VCI, TCI, and VHI maps were visualized based on a rule-based classification [
25,
74,
75]. Each pixel in the region of interest was categorized into one of the drought categories listed in
Table 4.
3.3. Weighting of Indicators for Drought Vulnerability Index (DVI)
VHI, PCI, ETCI, and SMCI, which are among the agricultural and climatological indicators, were considered in the generation of the DVI. The weights of the normalized indicators were calculated using a method proposed by Iyengar and Sudarshan (1982) and employed in several scientific studies [
76,
77,
78,
79], as shown in Equation (4). These weights reflect the variability of each indicator within the Konya Closed Basin over the 2001–2024 period. Therefore, they are region-specific and capture local climatic, ecological, and agricultural characteristics. While the weighting method is general and can be applied to other study areas, the exact weights are not directly transferable. In other regions, indicator variability may differ; hence, weights should be recalculated using local datasets.
where
is the normalized indicator weight,
σi is the standard deviation of the values for indicator
i, and
n is the number of selected indicators. It is important to note that the weighting technique prevents the overshadowing of other indicators by large fluctuations in one or more indicators [
7]. To obtain these coefficients, we constructed a covariance matrix from the long-term image collections of all input indices (VHI, PCI, ETCI, and SMCI) covering the full study period (2001–2024). This procedure allowed us to capture the overall variability and interrelationships among the indices across the entire temporal domain.
3.4. Calculation of Drought Vulnerability Index
After determining the weights for each contributor listed earlier, the Drought Vulnerability Index (DVI) was calculated by the following Equation (5):
where X
i represents the contributor,
is the weight of the contributor, and n is the number of drought indicators, which include VHI, ETCI, PCI, and SMCI. The computed weights represent the long-term contribution of each variable to drought variability in the Konya Closed Basin, ensuring that the DVI reflects multiple dimensions of drought rather than being influenced by short-term fluctuations.
The classified DVI map was prepared using the mean ± standard deviation method [
80,
81]. As indicated in
Table 5, the layers were divided into five classes: no vulnerability, low vulnerability, medium vulnerability, high vulnerability, and extreme vulnerability. The variables of I, μ, and std indicate the index value, mean, and standard deviation of the image, respectively.
4. Results
4.1. MODIS-Derived Indices
In this section, the results of VCI, TCI, VHI, and ETCI from 2001 to 2024 are presented.
Table 6 provides descriptive statistics for the corresponding indices. The descriptive statistics in
Table 6 reveal significant temporal variations in drought conditions across the Konya Closed Basin from 2001 to 2024. VCI showed notable fluctuations. It had the lowest mean value (0.17) in 2001 and 2008, indicating severe vegetation stress, and the highest mean (0.86) in 2015, suggesting improved conditions. Similarly, TCI reflected thermal stress, with extreme drought years like 2001 (mean TCI = 0.11) contrasting sharply with milder years, such as 2011 (mean TCI = 0.93). VHI, which integrates VCI and TCI, underscored prolonged drought periods, particularly in 2001 (mean VHI = 0.14), while 2014 (mean VHI = 0.35) marked recovery phases. ETCI further highlighted moisture deficits, with a critically low mean in 2001 (mean ETCI = 0.06), aligning with severe agricultural drought. In contrast, the highest mean occurred in 2023 (mean ETCI = 0.93).
4.1.1. Vegetation Condition Index (VCI)
The classified VCI images from 2001 to 2024 reveal distinct drought trends and spatial variations across the Konya Closed Basin (
Figure 5). Observing the temporal pattern, there was a noticeable long-term worsening trend between 2001 and 2008, with severe drought conditions gradually expanding. The worst drought year during this period was 2008, with extreme drought affecting a significant portion of the northern basin. Between 2009 and 2013, there was a partial recovery, with 2011 and 2013 standing out as significantly improved years. During this period, much of the region experienced no drought conditions. However, 2012 still exhibited moderate and severe drought, suggesting that the recovery was not immediate but fluctuated. A new drought cycle emerged between 2014 and 2021, during which severe and extreme drought conditions returned. The 2014 drought was particularly intense, marking the beginning of another dry period. Also, 2016 and 2021 were critical years, showing widespread extreme drought zones, particularly in the northern regions. The severe conditions in 2021 were among the worst of the last two decades. This suggests that after a brief recovery, drought conditions became more intense and frequent, following a cyclical pattern. More recently, between 2022 and 2024, there have been clear signs of improvement, with reduced severity in drought classifications. And 2018 –2020, 2023, and 2024 showed notable recovery, with much of the basin experiencing mild drought or no drought at all. These recent improvements provide hope, but, given historical cycles, it is essential to remain cautious and be prepared for potential future droughts.
Spatially, the northern part of the Konya Closed Basin has consistently been the most drought-prone, experiencing the worst conditions in years such as 2001, 2005, 2007, 2008, 2012, 2014, 2016, 2021, and 2022. These areas are likely more vulnerable due to their reliance on agriculture and limited groundwater reserves, making them more susceptible to water shortages during dry periods. In contrast, the western and southeastern regions have shown more resilience, often classified as mild drought or no drought, suggesting better water availability or less intensive agricultural activity. The recurrence of severe droughts every 2 to 5 years suggests a link to climate change, as semi-arid regions like the Konya Basin are experiencing longer dry periods and shorter recovery intervals.
4.1.2. Temperature Condition Index (TCI)
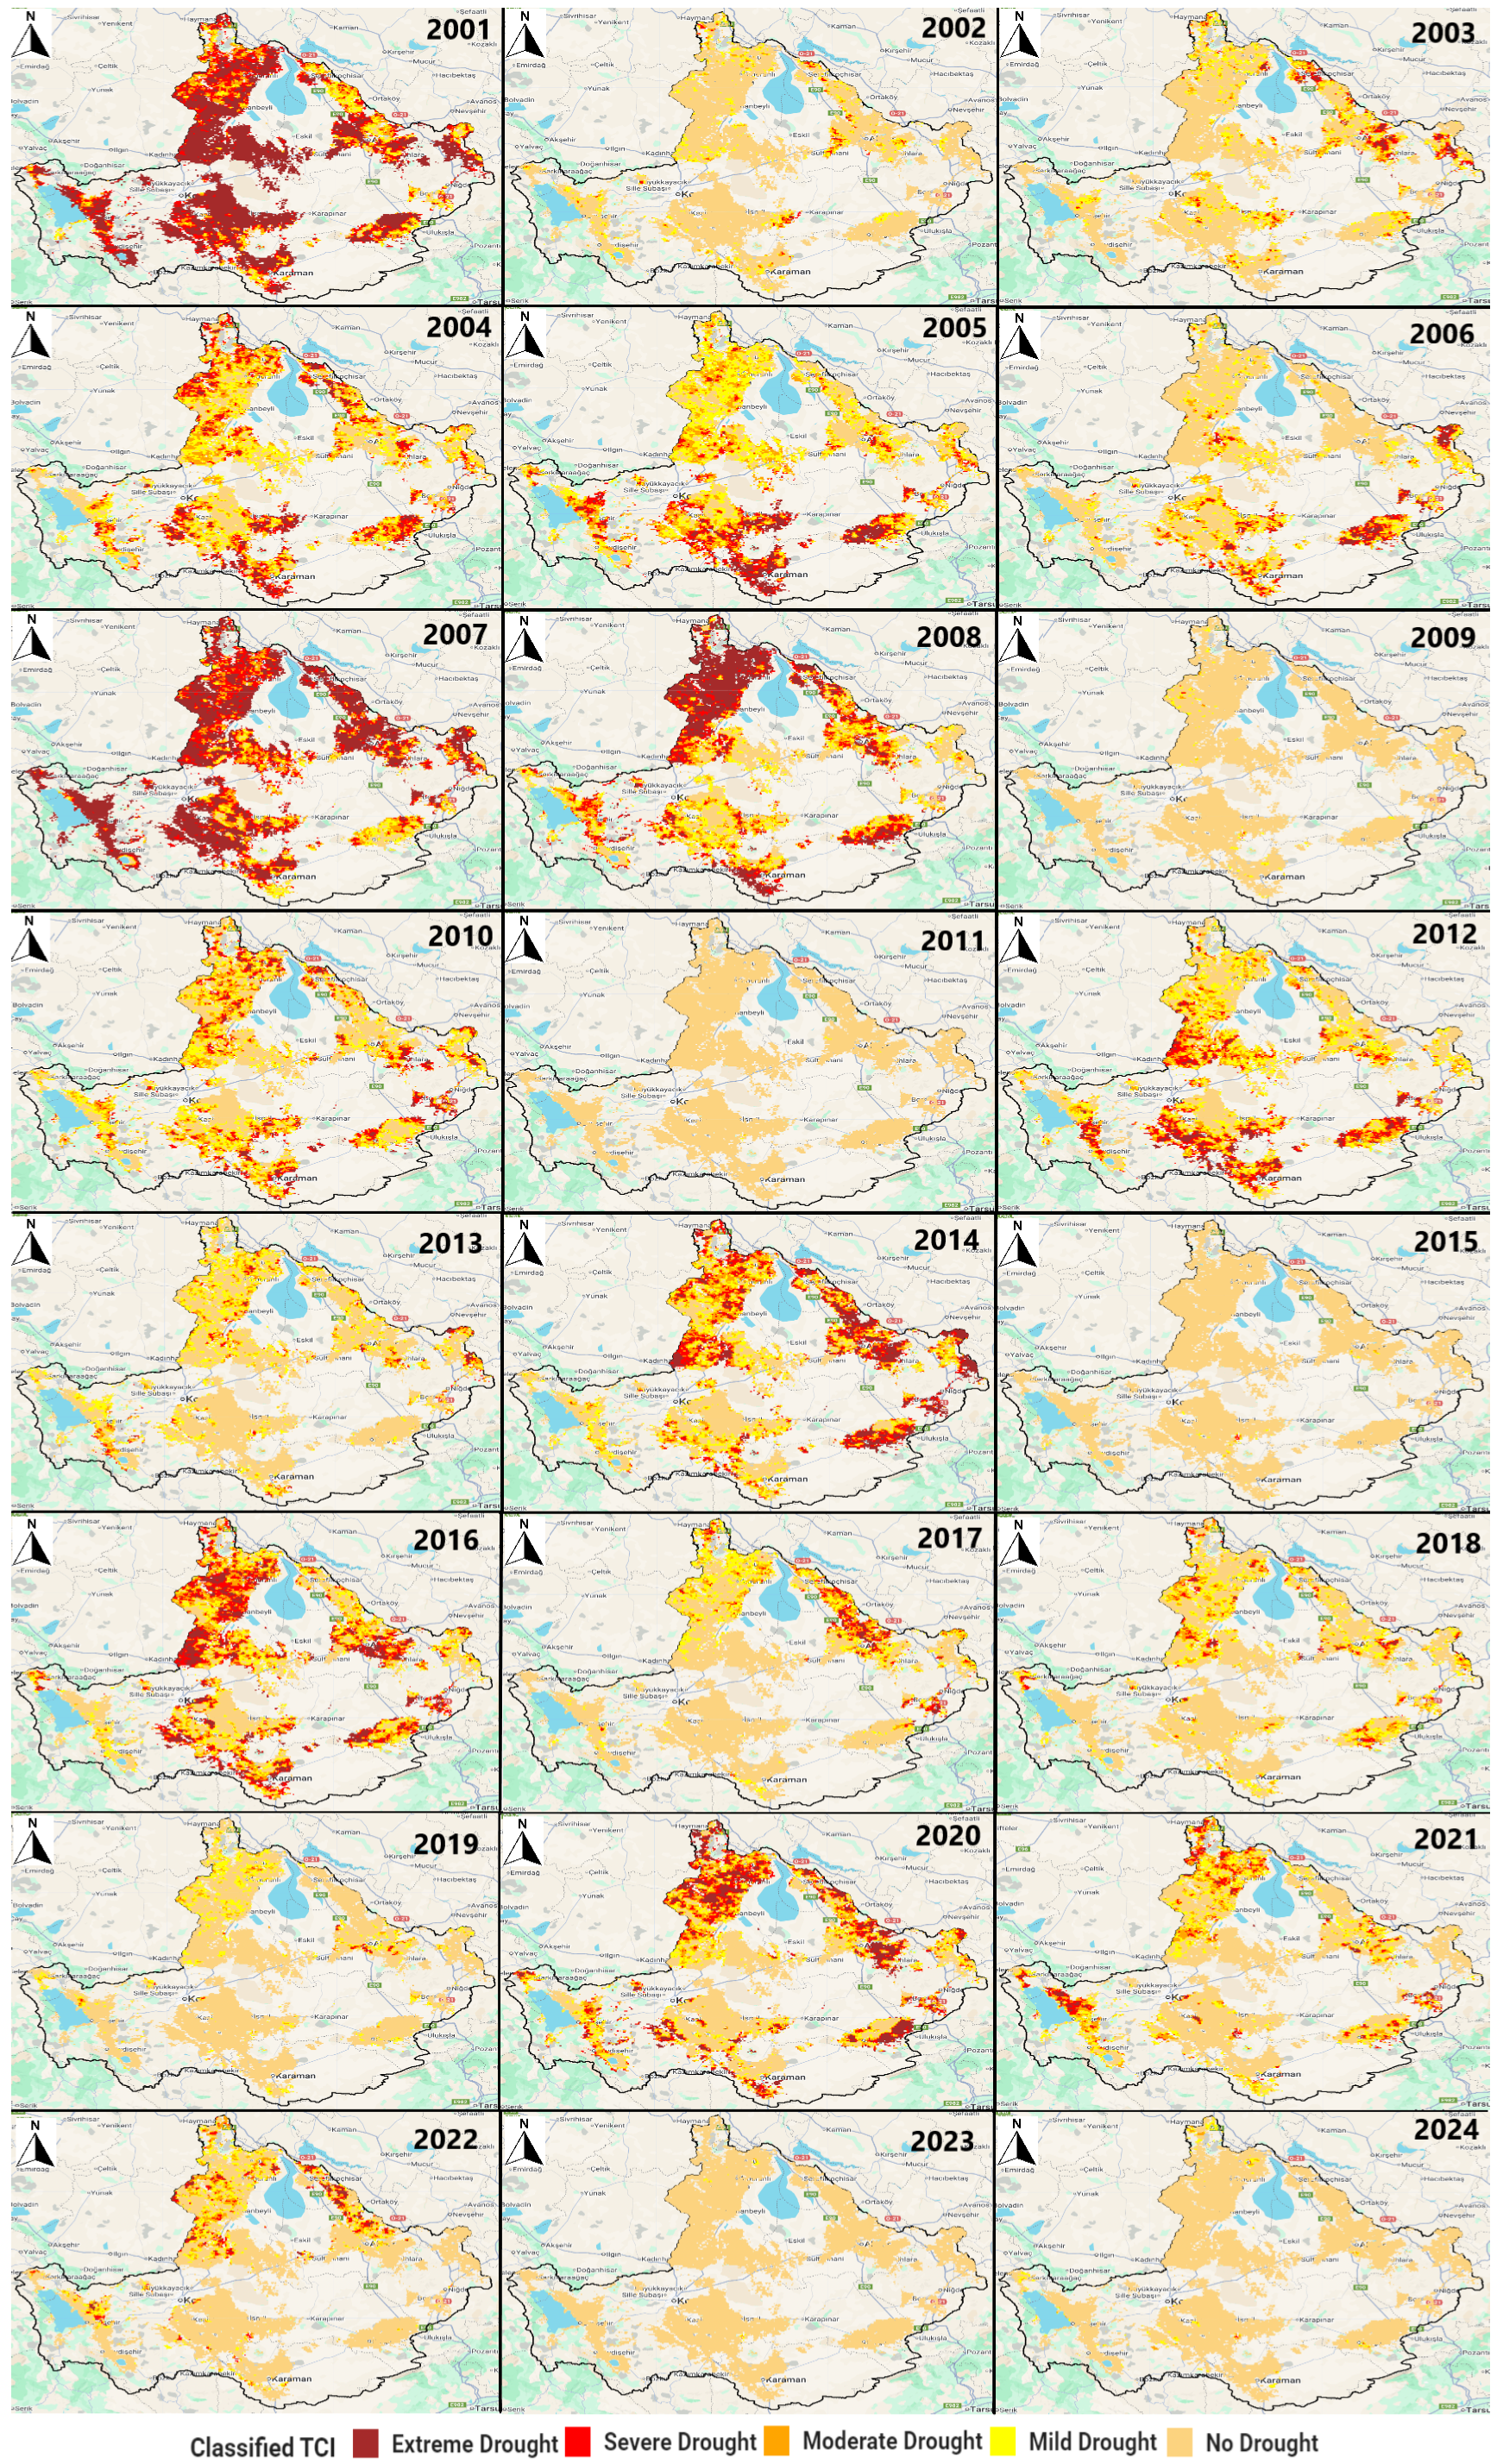
The classified TCI data from 2001 to 2024 reveal significant temporal and spatial variations in drought conditions across the Konya Closed Basin (
Figure 6). The TCI is an essential drought indicator that assesses temperature-based stress on vegetation because higher temperatures and prolonged heatwaves lead to lower TCI values, indicating severe drought conditions. By analyzing the trends across the dataset, we can identify periods of intensified heat stress, periods of recovery, and their implications for agriculture, water management, and climate resilience.
A clear warming trend can be observed between 2001 and 2008, with the worst heat-stressed years being 2001, 2007, and 2008. These years exhibited extreme and severe drought classifications, particularly in the northern and central regions of the Konya Basin. Between 2009 and 2013, the basin appears to have undergone partial recovery, with 2009, 2011, and 2013 showing significant improvement. These years show more widespread mild drought and no drought classifications, suggesting a period of lower temperatures and improved climatic conditions. From 2014 onward, another cycle of increased heat stress began, marked by particularly severe years in 2016 and 2020. During these years, extensive regions in the northern and southern basin experienced severe and extreme drought conditions. More recent years, from 2022 to 2024, indicate a shift toward less extreme conditions, with more areas classified under mild drought or no drought. However, despite this short-term improvement, past patterns suggest that another high-temperature phase could emerge within the next few years, making continued monitoring essential.
Spatially, the northern and central parts of the basin have consistently shown the most heat stress, especially in severe drought years like 2001, 2007, 2008, 2014, 2016, and 2020. In contrast, the western and southeastern parts of the basin have shown more resilience, often classified as mild drought or no drought, likely due to better water retention in soils or less intensive land use practices. However, given the cyclical nature of these temperature fluctuations, it is crucial for policymakers and researchers to implement adaptive strategies to mitigate heat stress impacts. These may include improved irrigation methods, drought-resistant crops, and efficient water management policies.
4.1.3. Vegetation Health Index (VHI)
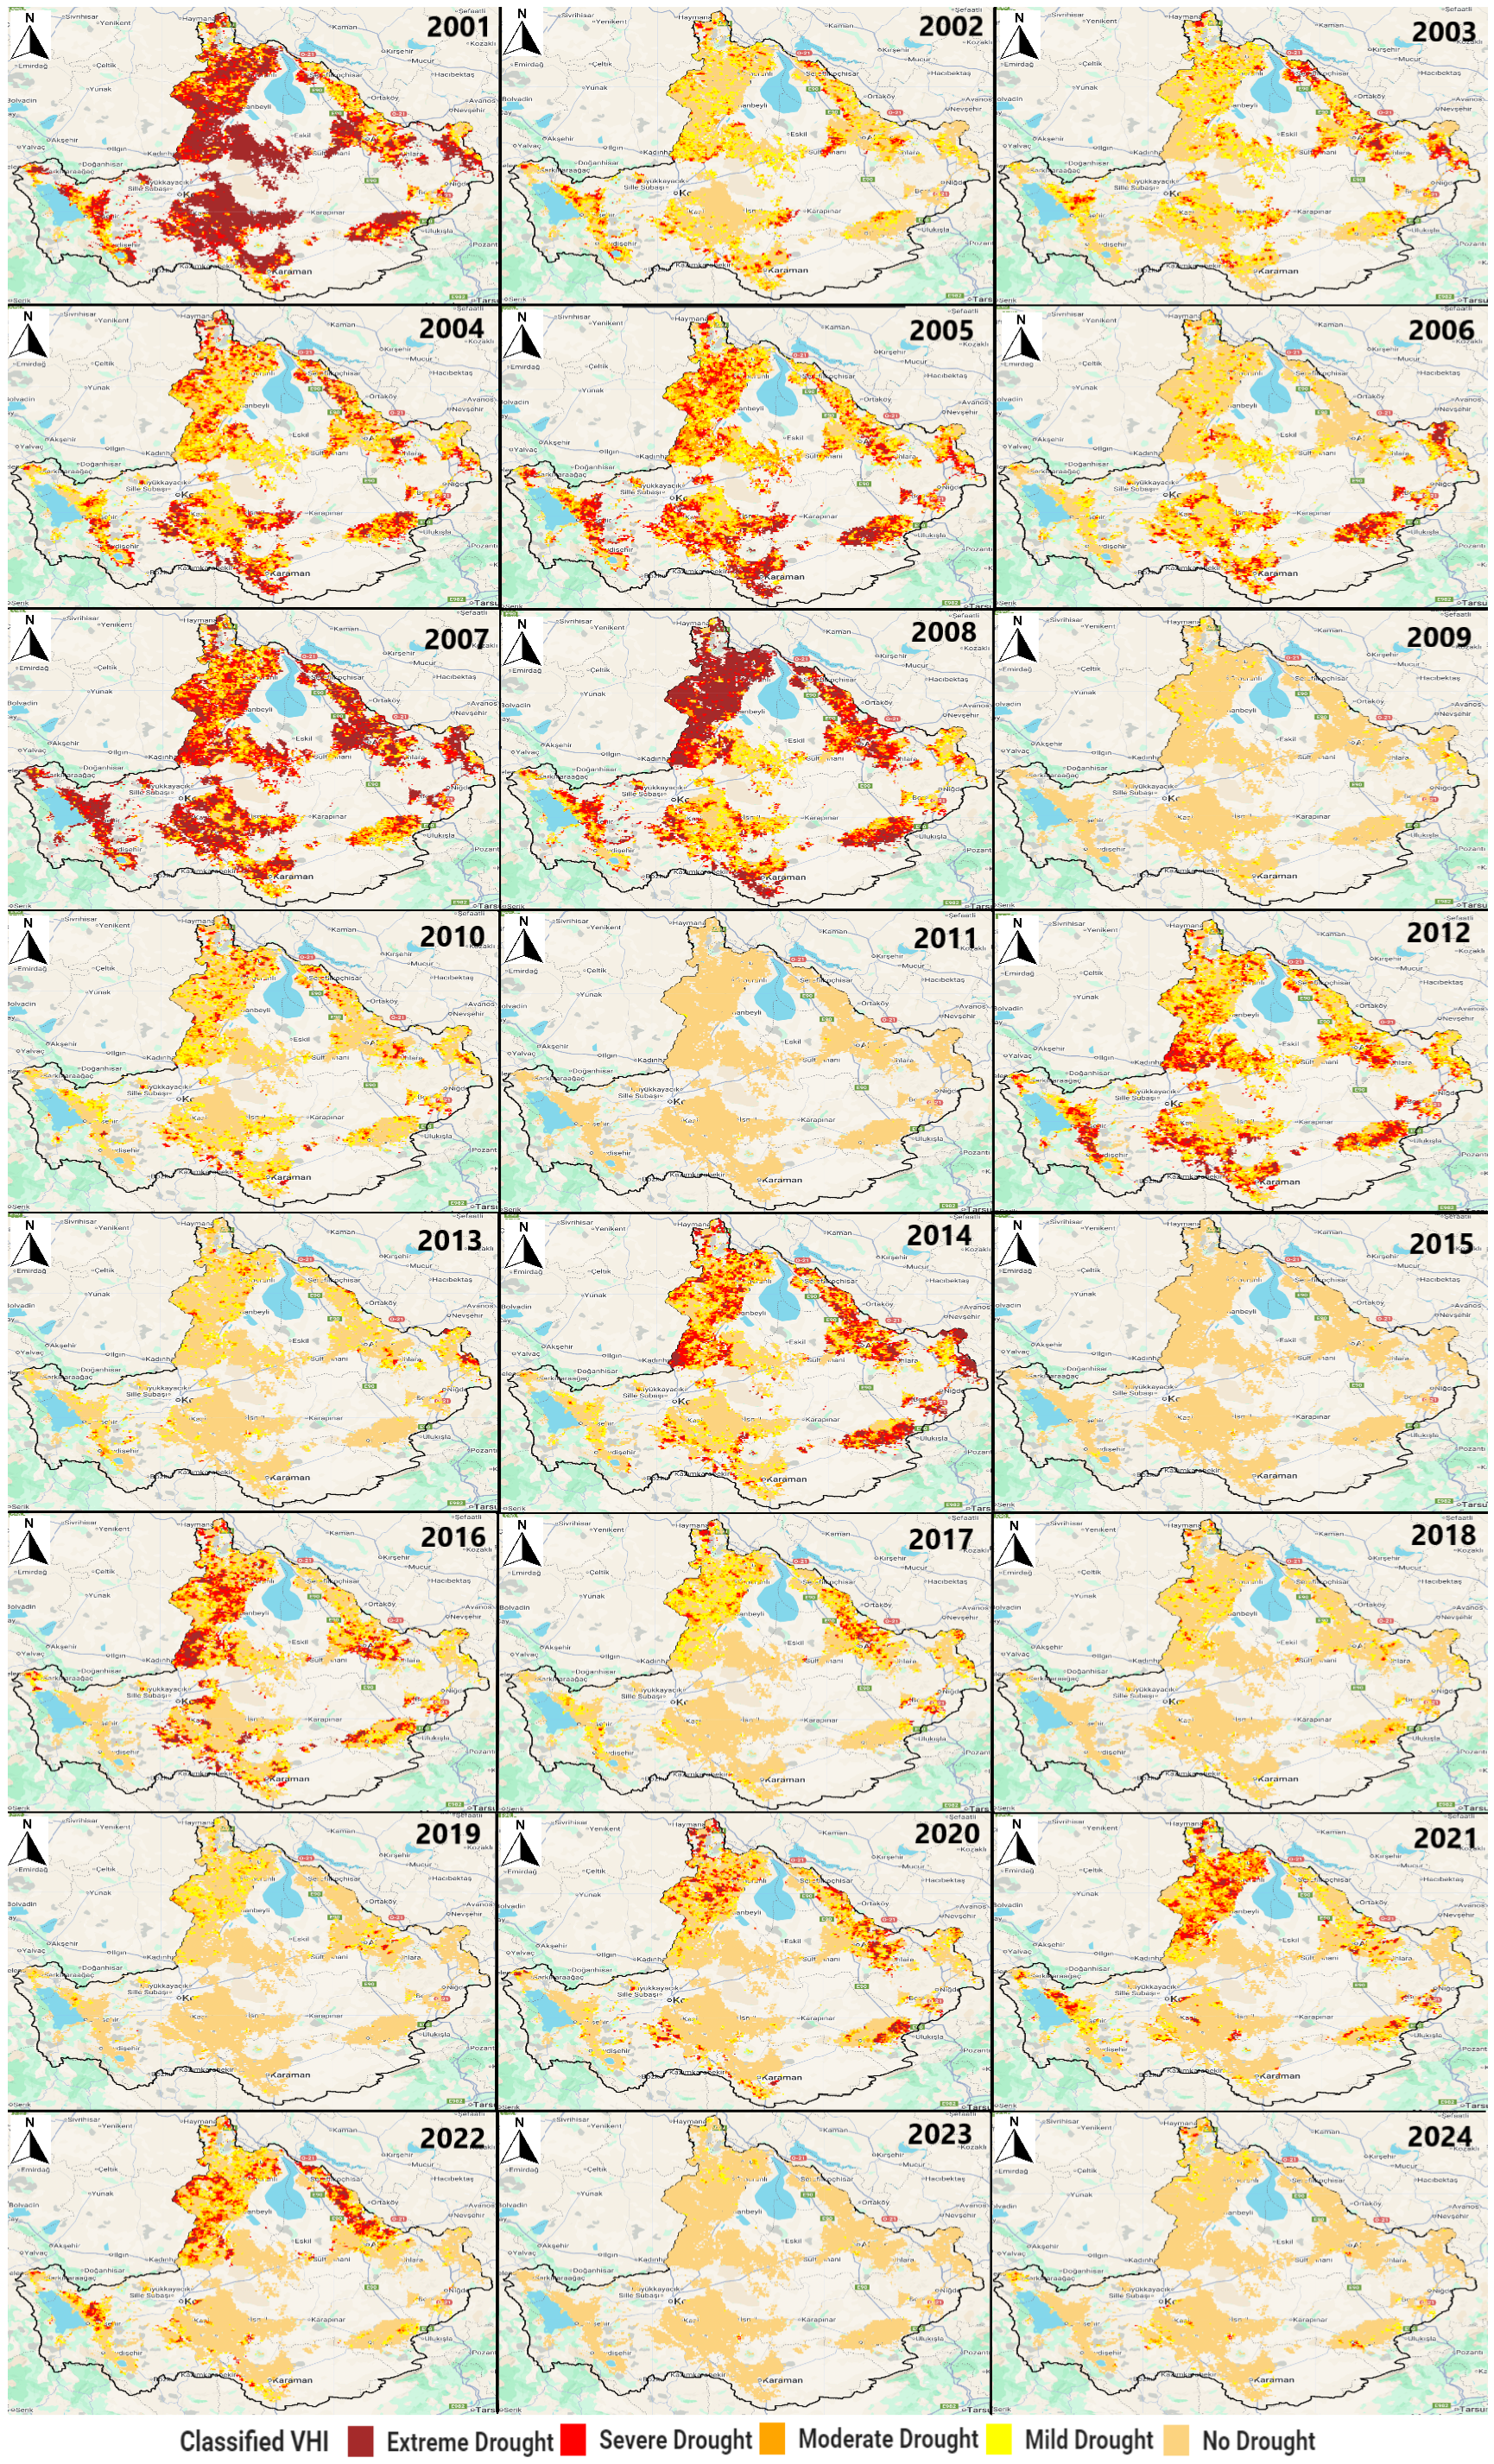
The Vegetation Health Index (VHI) results for the Konya Closed Basin from 2001 to 2024 reveal significant trends in drought conditions and vegetation stress over time (
Figure 7). The dataset identifies critical drought years—such as 2001, 2007, 2008, 2012, 2014, 2016, and 2021—during which extensive areas, particularly in the northern and central parts of the basin, experienced severe to extreme drought conditions. These years align with trends observed in both VCI and TCI, confirming that temperature and vegetation stress contributed to the severity of drought impacts. In contrast, relatively favorable conditions were observed in years such as 2009, 2011, 2013, 2015, 2019, 2023, and 2024, where large portions of the basin showed mild or no drought, indicating improved precipitation or vegetation recovery.
Spatially, drought severity remained more pronounced in the northern and central regions, while the eastern and southwestern areas generally experienced lower intensity, possibly due to better soil moisture retention or localized climatic conditions. Temporally, the data suggest a gradual intensification of drought conditions, especially after 2015, with fewer years showing widespread “no drought” classifications. This pattern reflects the escalating influence of climate change, rising temperatures, and potentially altered precipitation regimes, resulting in longer or more intense drought periods.
These findings carry significant implications for agricultural sustainability and water resource management in the region. As VHI integrates both vegetation and temperature stress, it effectively identifies areas that are especially vulnerable to short-term meteorological drought and long-term ecological degradation. The persistence of drought conditions in specific years underscores the need for proactive measures, including water conservation policies, sustainable farming practices, drought-resistant crop varieties, improved irrigation systems, and afforestation programs. Additionally, the worsening trend necessitates deeper investigation into precipitation variability, groundwater depletion, and anthropogenic land use changes that may be amplifying drought impacts.
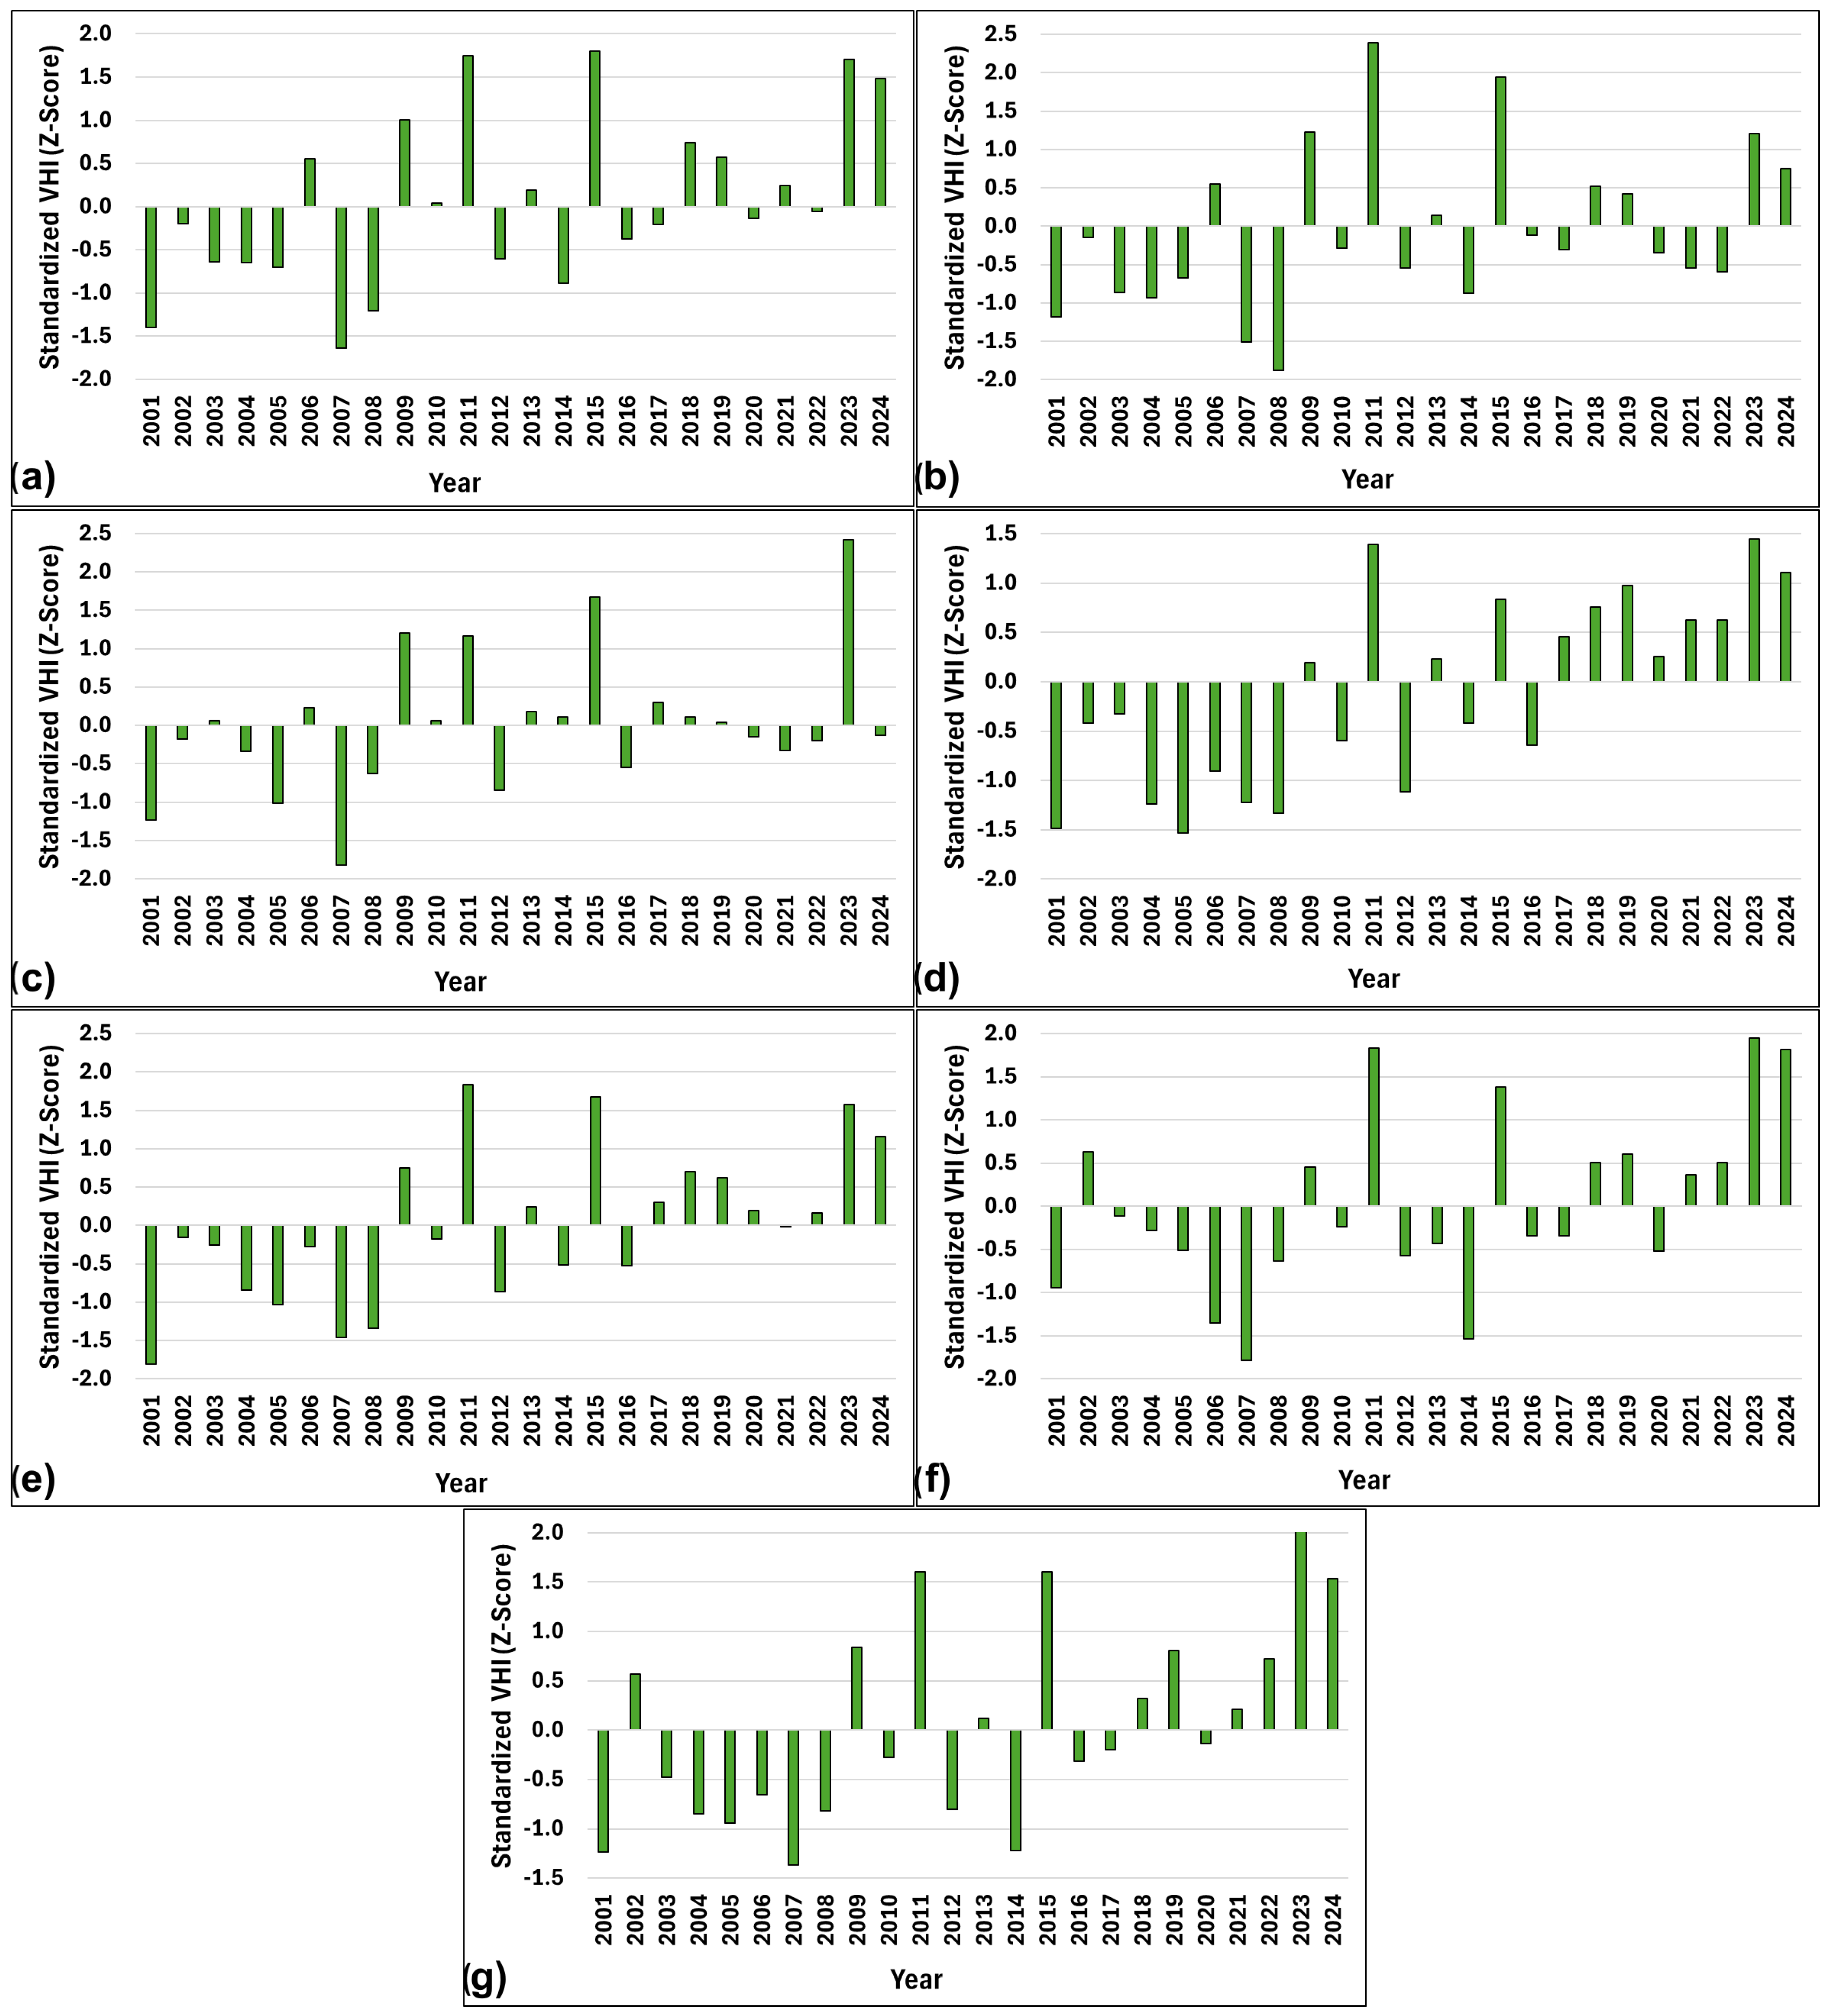
In summary, the VHI image dataset supports the patterns observed in VCI and TCI, highlighting severe drought episodes in 2001, 2007, 2008, 2012, 2014, and 2016, while also indicating intermittent periods of recovery. However, the overall trajectory points toward growing vulnerability, underscoring the urgency of climate adaptation and resource management interventions. On the other hand, z-score normalization, also called standardization, was applied to VHI images for more detailed quantitative analysis, and the standardized VHI (z-score) time series charts for each province (presented in
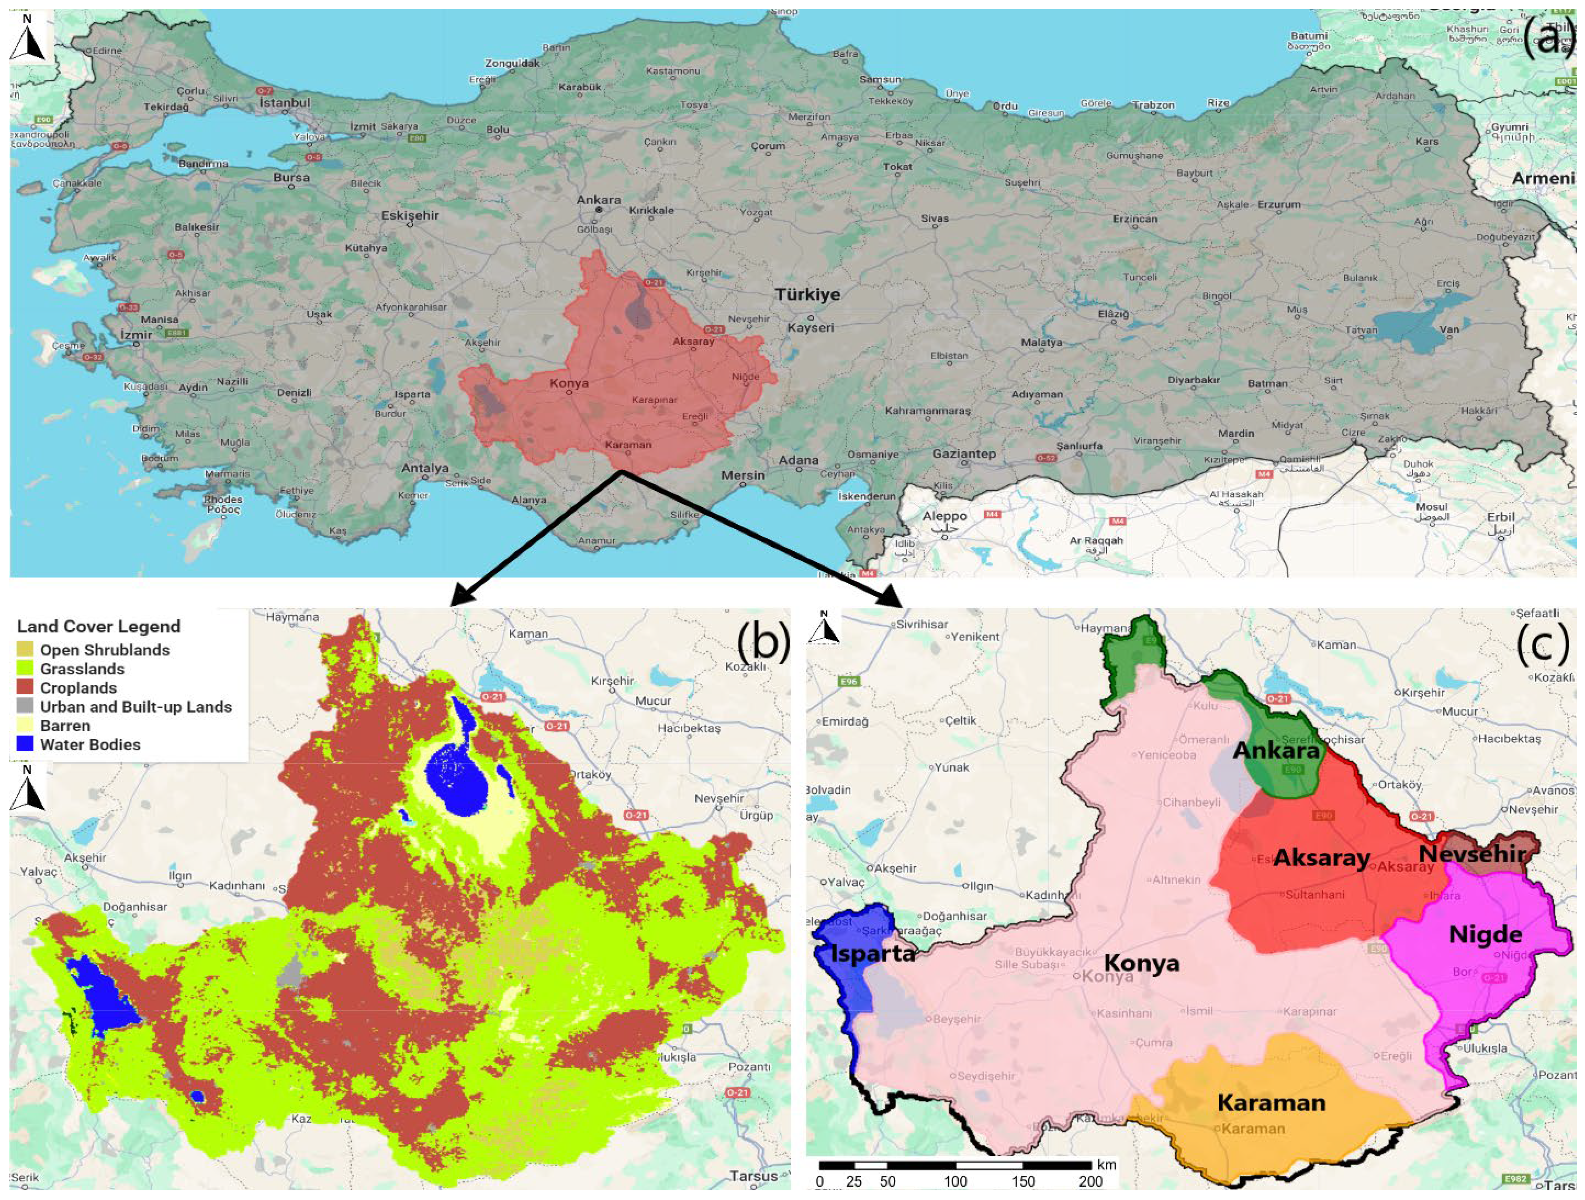
Figure 1c) located in the Konya Closed Basin are shown in
Figure 8. VHI exhibited consistent multi-year fluctuations from 2001 to 2024 that corresponded across provinces, suggesting common regional hydroclimatic factors. With amplitude variations by province, peaks frequently clustered in rainy years and troughed in dry years. While Ankara and Isparta had high peaks but relatively smooth transitions, Konya and Karaman typically displayed larger oscillations, indicating increased interannual variability. The enduring multi-year regimes suggest that year-to-year weather is modulated by decadal-scale variability.
4.1.4. Evapotranspiration Condition Index (ETCI)
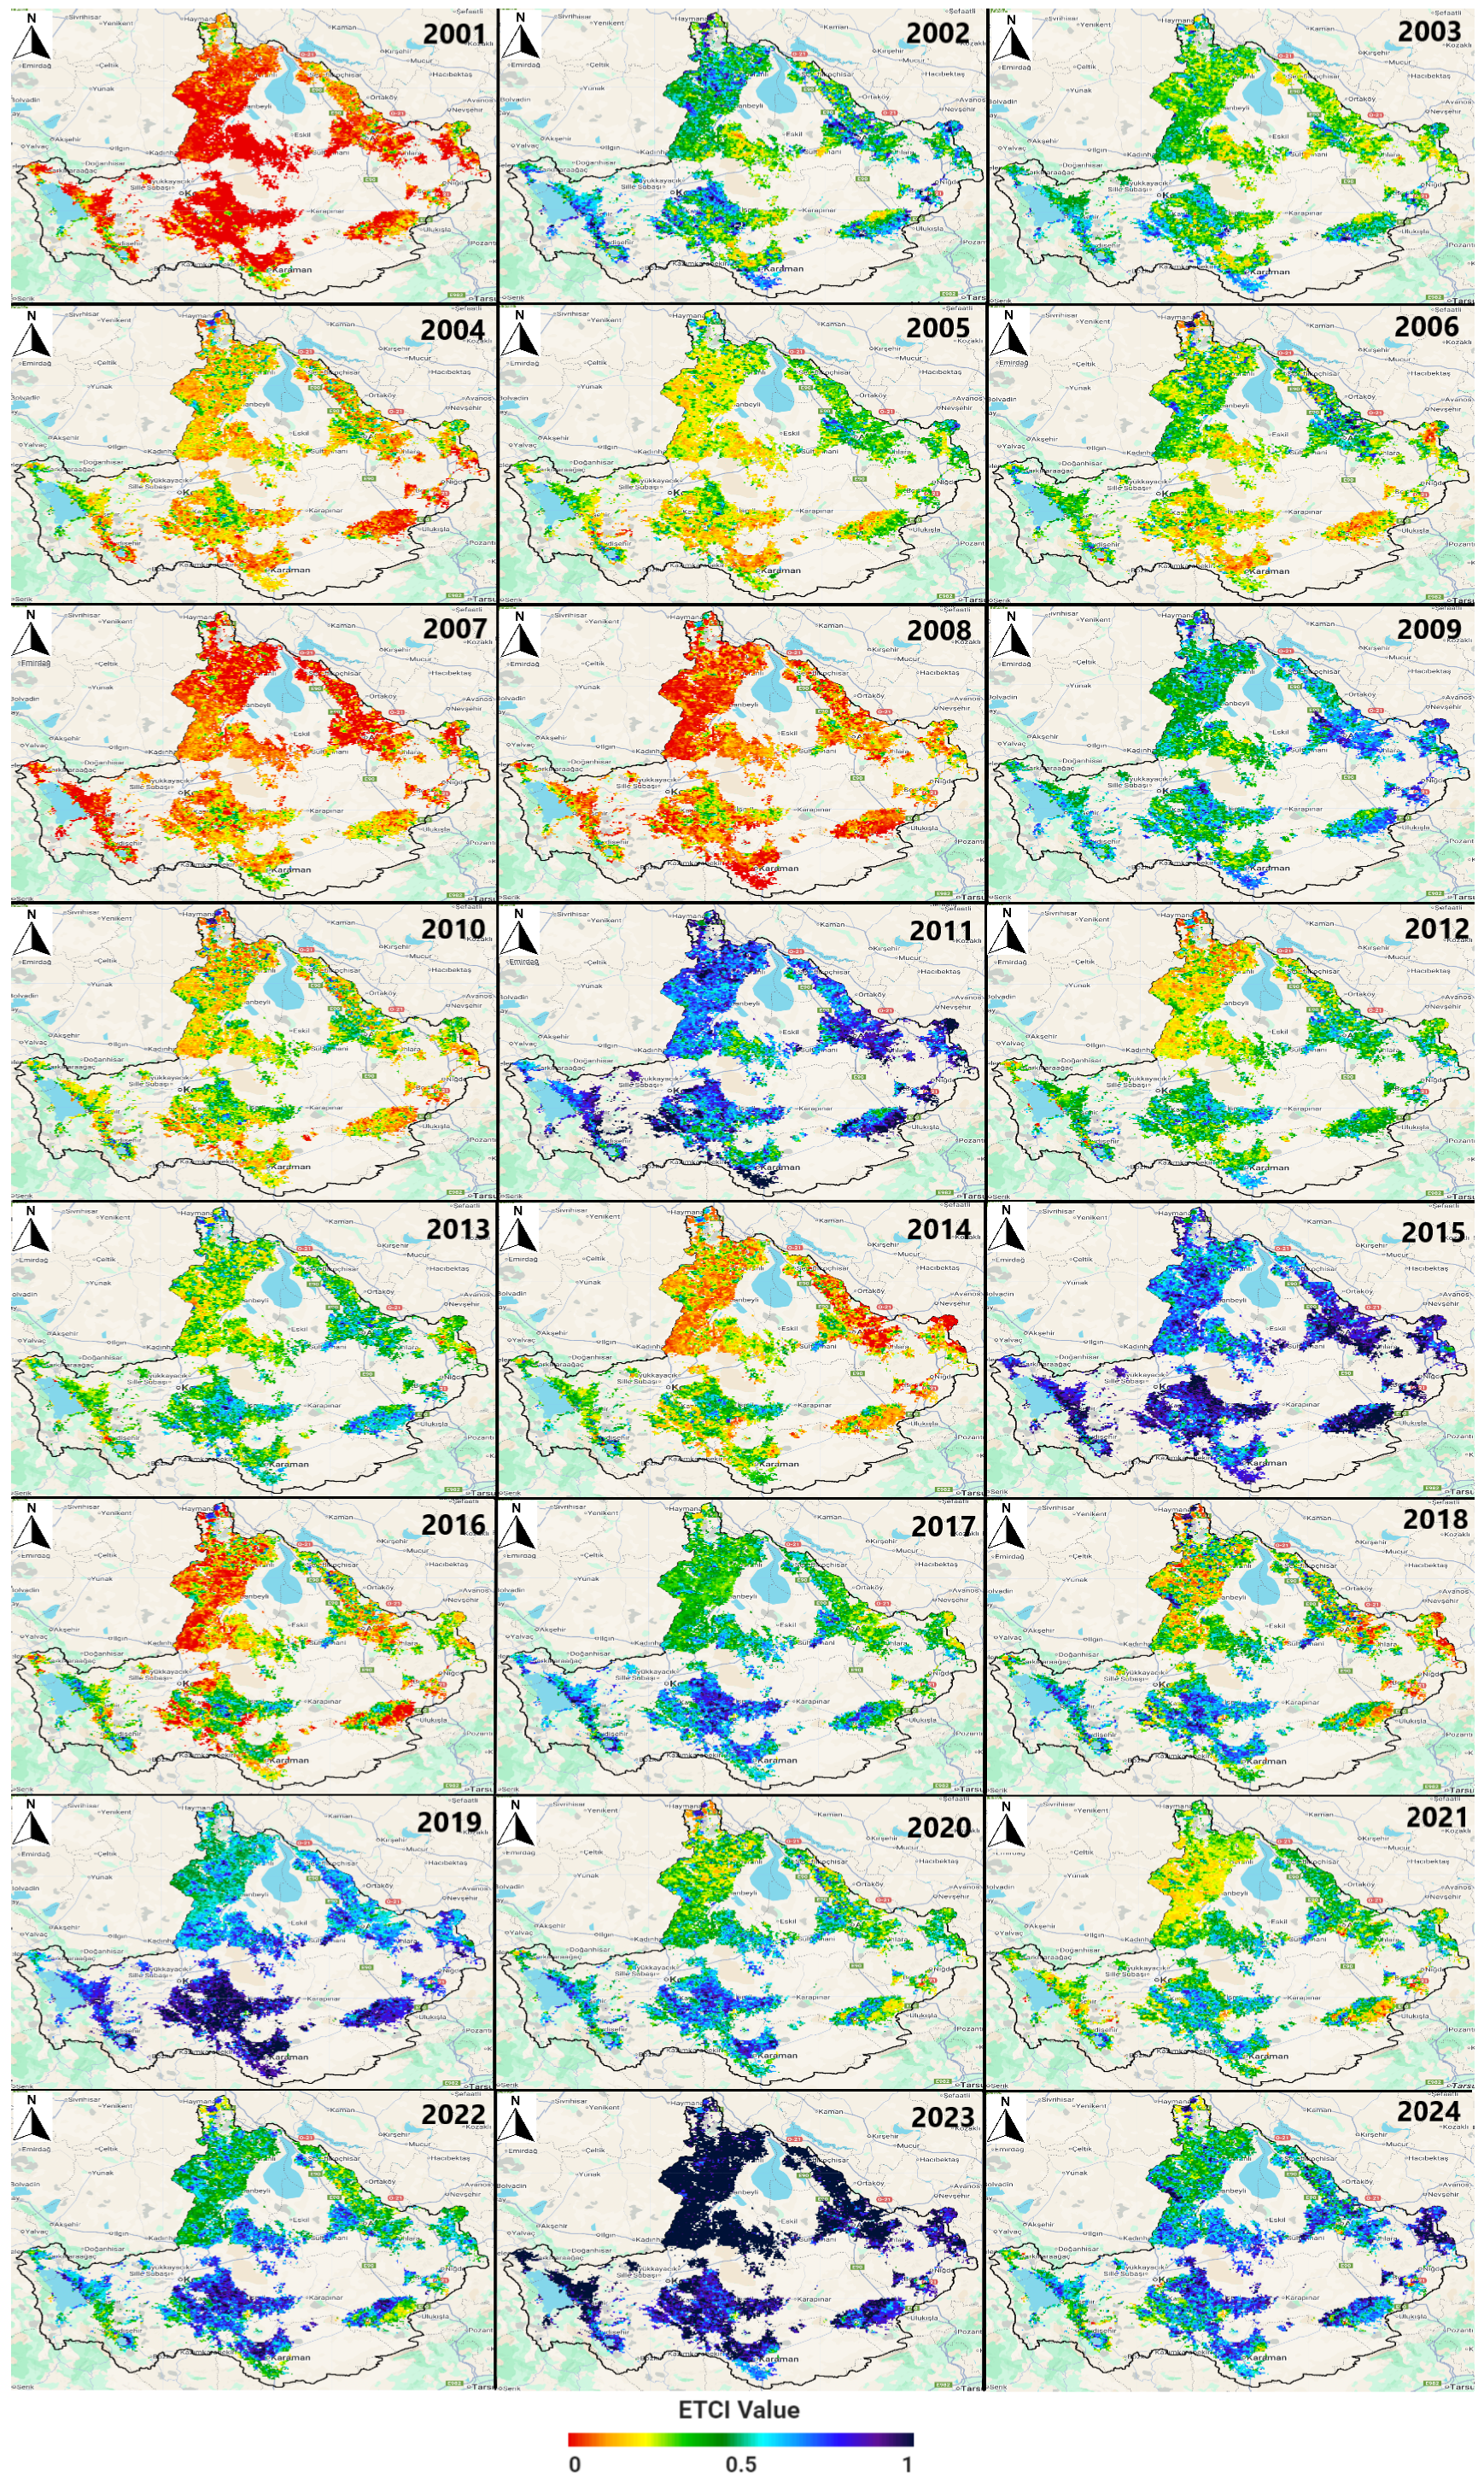
The classified ETCI images from 2001 to 2024 reveal notable spatial variations across the Konya Closed Basin (
Figure 9). Analysis of the ETCI over the 24-year period indicates distinct interannual variations in evapotranspiration conditions across the basin. Between 2001 and 2010, ETCI values were predominantly low, with critical years such as 2001, 2007, and 2008 showing extensive red and orange regions, indicative of limited evapotranspiration, severe drought, and water stress. In contrast, relatively wetter years such as 2002, 2006, and 2009 exhibited higher ETCI values, reflecting improved moisture availability and vegetation response.
In 2009, slight changes occurred; however, the dominance of blue and green tones suggests that evapotranspiration levels remained elevated. By 2010, a mix of orange and green areas began to appear, signaling a slight shift in evapotranspiration activity.
From 2011 to 2018, ETCI values exhibited notable fluctuations. Years like 2011 and 2015 showed a greater prevalence of green regions, signifying improved evapotranspiration conditions. In contrast, the years 2012, 2014, 2016, and 2018 were marked by increased orange and green zones, reflecting periods of reduced evapotranspiration activity. The spatial distribution of ETCI values during this timeframe showed considerable variability, with no clear long-term trend.
Since 2019, ETCI values have shown an upward trend in evapotranspiration conditions. In 2020 and 2021, heightened evapotranspiration activity was observed, as indicated by an expansion in green and yellow coverage compared with prior years. Notably, 2023 displayed extensive dark blue areas, representing the highest evapotranspiration levels recorded in the dataset. Although a slight decline in evapotranspiration activity was observed in 2022 and 2024, both years still reflected higher levels compared with earlier periods.
Overall, ETCI images suggest that the years 2001, 2007, 2008, 2014, 2016, and 2018 were marked by the lowest evapotranspiration levels, while 2023 recorded the highest. The post-2019 period indicated a general increase in green and blue areas, signifying intensified evapotranspiration activity across the Konya Closed Basin. Furthermore,
Figure 10 illustrates the time series charts of the standardized ETCI (z-score) in Aksaray (a), Ankara(b), Isparta (c), Karaman (d), Konya (e), Nevsehir (f), and Nigde (g) provinces. In wet years with vigorous canopies, ETCI often rose along with VHI, as abundant water enables plants to transpire more and cool the surface. In hot and dry years, ETCI could decouple from PCI and SMCI in revealing ways; even if precipitation briefly improved (lifting PCI), ETCI may remain suppressed if heat stress and depleted soil moisture limited plant transpiration, particularly across extensive croplands with shallow rooting or already stressed rangelands. This decoupling was frequently most visible in Konya and Karaman, where higher evaporative demand and agricultural exposure heightened sensitivity. Isparta and Ankara sometimes exhibited more moderate ETCI variability, a signature of local microclimates, elevation gradients, and mixed land covers that can buffer extreme atmospheric demand.
4.2. CHIRPS-Based Precipitation Condition Index (PCI)
The classified PCI images from 2001 to 2024 reveal significant spatial variations across the Konya Closed Basin (
Figure 11). Analysis of the PCI for the Konya Closed Basin during this period highlighted considerable spatial and temporal variability in precipitation distribution. The years 2001, 2003, 2004, 2006, 2007, and 2012 were marked by the lowest PCI values, with red areas dominating much of the basin. These years indicated minimal precipitation relative to the long-term average, reflecting prolonged periods of deficient PCI conditions.
In contrast, years such as 2002, 2005, 2008, 2009, 2010, 2012, 2013, 2020, 2021, 2022, and 2024 displayed a combination of red and yellow regions, suggesting intermediate PCI values. Although low PCI conditions persisted across substantial portions of the basin, some areas demonstrated relatively improved precipitation compared with the driest years. Notably, 2024 fell into this intermediate category, with widespread low PCI values but also some improvement relative to years with the most extreme drought conditions.
The years 2002, 2011, 2014, 2015, 2018, and 2023 were associated with higher PCI values, characterized by widespread green and yellow areas across the basin. Notably, 2023 featured the most extensive green areas, representing the highest PCI values recorded during the study period. Additionally, 2015 demonstrated a significant rise in PCI, indicating enhanced precipitation conditions across large parts of the basin.
The spatial distribution of PCI values over time highlighted fluctuating precipitation patterns within the Konya Closed Basin. Some years consistently showed low PCI values, whereas others reflected a more balanced and favorable distribution of precipitation. These temporal fluctuations in PCI underscore varying precipitation inputs and their broader influence on regional climatic trends.
Apart from the image analysis, the time series charts of the standardized PCI (z-score) for the provinces that include Aksaray (a), Ankara (b), Isparta (c), Karaman (d), Konya (e), Nevsehir (f), and Nigde (g) are shown in
Figure 12. The seven provinces typically exhibited synchronized PCI peaks and troughs, especially in years when strong regional signals predominated, since precipitation variability was frequently coherent throughout Central Anatolia. The amplitude, however, may vary because of their hydroclimate and land use context. Konya, Karaman, and Aksaray sometimes exhibited greater apparent PCI variability, making the effects of anomalies more noticeable in the landscape and agricultural systems. Even while they were still sensitive, Ankara and Isparta could show somewhat muted volatility in comparison with their neighbors.
4.3. FLDAS-Extracted Soil Moisture Condition Index (SMCI)
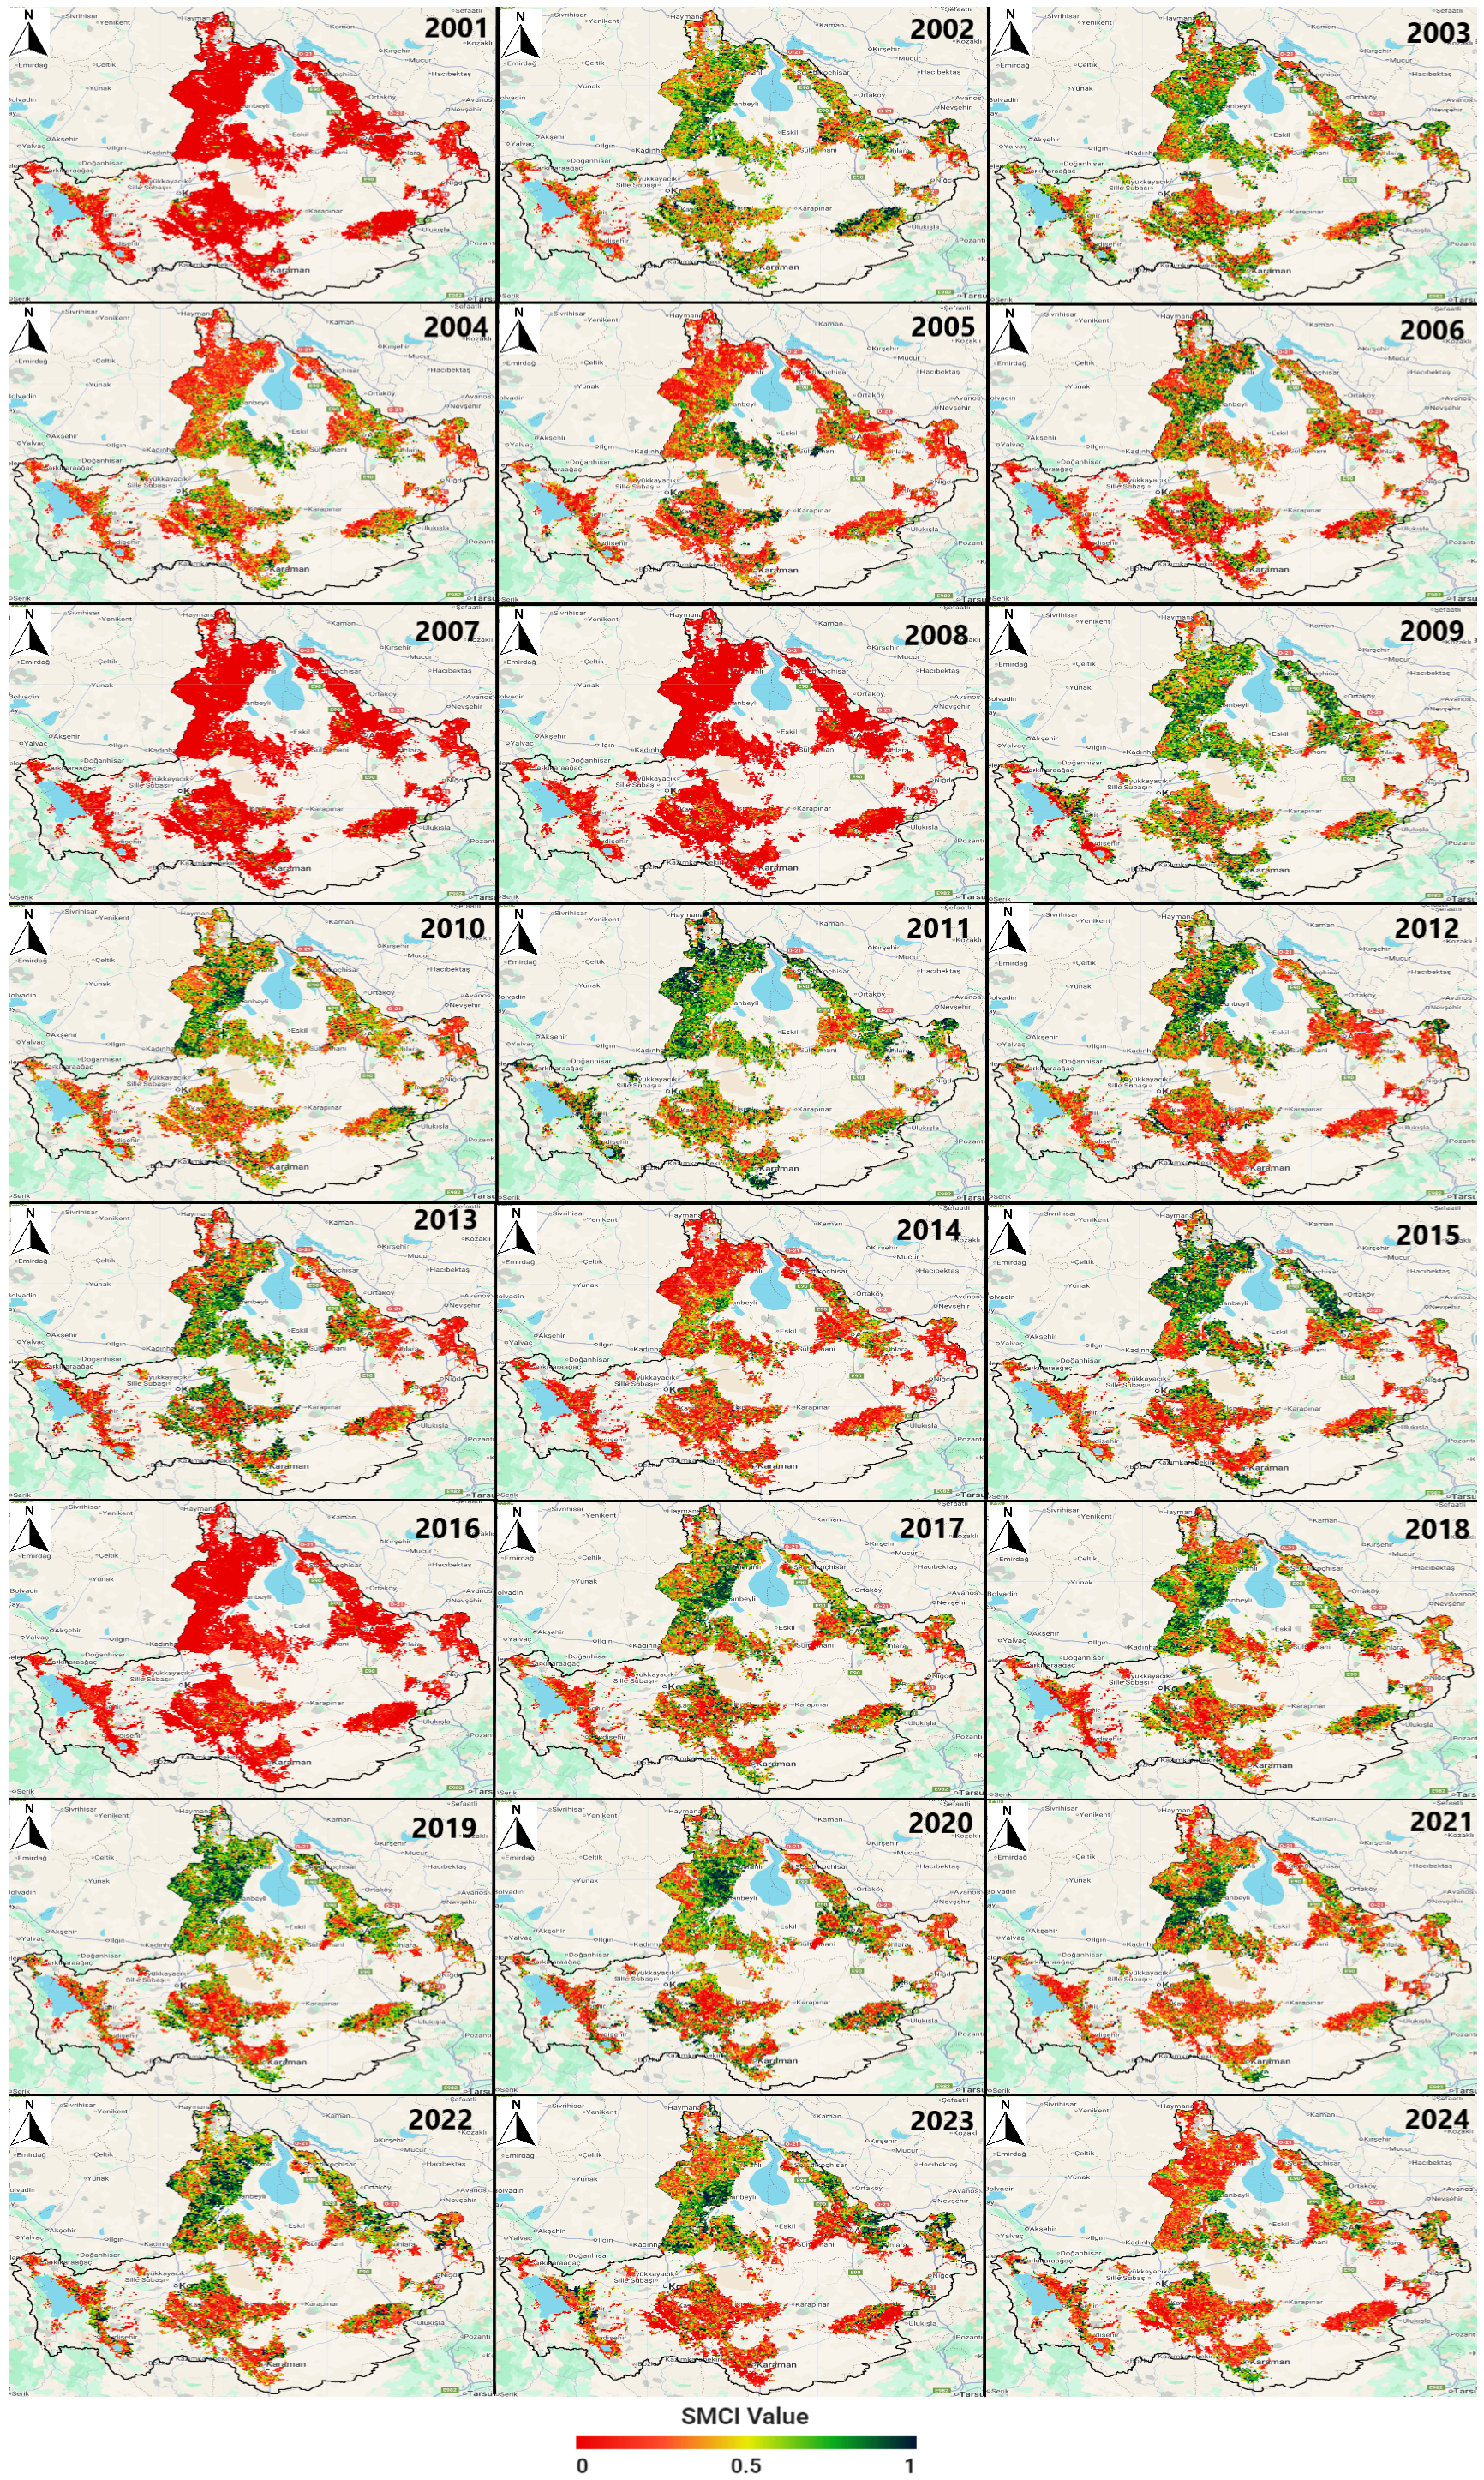
The classified SMCI images from 2001 to 2024 reveal notable spatial variations across the Konya Closed Basin (
Figure 13). An analysis of SMCI trends in the Konya Closed Basin during this period showed significant temporal and spatial variability in the reserves of water available for agricultural plants in the root zone. The classified imagery indicates that some years were dominated by widespread dry conditions, while others showed relatively higher moisture availability in localized regions. These findings highlight the dynamic nature of soil moisture variability across the study period, emphasizing the need for targeted water management strategies to mitigate its impacts.
Years such as 2001, 2007, 2008, and 2016 exhibited widespread red zones in the Konya Closed Basin, indicating severe dryness across large portions of the region. Of these, 2008 and 2016 were particularly notable for their extensive dry conditions, marked by consistently low SMCI values in minimal areas with moderate or high soil moisture. In contrast, years such as 2002, 2003, 2006, 2009, 2011, and 2019 showed more green regions, indicating higher SMCI values. However, these green areas were not widespread but appeared as localized patches within specific sub-regions of the basin. Furthermore, the spatial distribution of these green patches varied significantly from year to year, reflecting the basin’s dynamic soil moisture regime.
Spatially, SMCI values show that the southern portion of the Konya Closed Basin consistently experienced more extensive dryness than the northern region. In most years, red zones, indicating severe dryness were more concentrated in the south, while the north exhibited greater variability, including occasional years with improved soil moisture. Furthermore, classification results for recent years, particularly 2023 and 2024, show a mix of dry and moderately moist conditions. Although these years did not reach the extreme dryness levels of 2001, 2008, and 2016, large areas of the basin still fell within low to moderate SMCI ranges. This phenomenon underscores persistent challenges related to soil moisture variability and its implications for regional water resource management.
The observed trends in soil moisture conditions clearly reflect temporal variability, with recurring dry years interspersed by brief periods of relatively higher moisture availability. Classification results reveal that SMCI distribution was spatially uneven; some areas consistently experienced dryness, while others occasionally showed improved soil moisture levels. Continuous monitoring of soil moisture conditions is essential to effectively track and understand these dynamics. Such ongoing assessments enable a comprehensive understanding of long-term soil moisture availability and support the formulation of effective water management strategies across the basin.
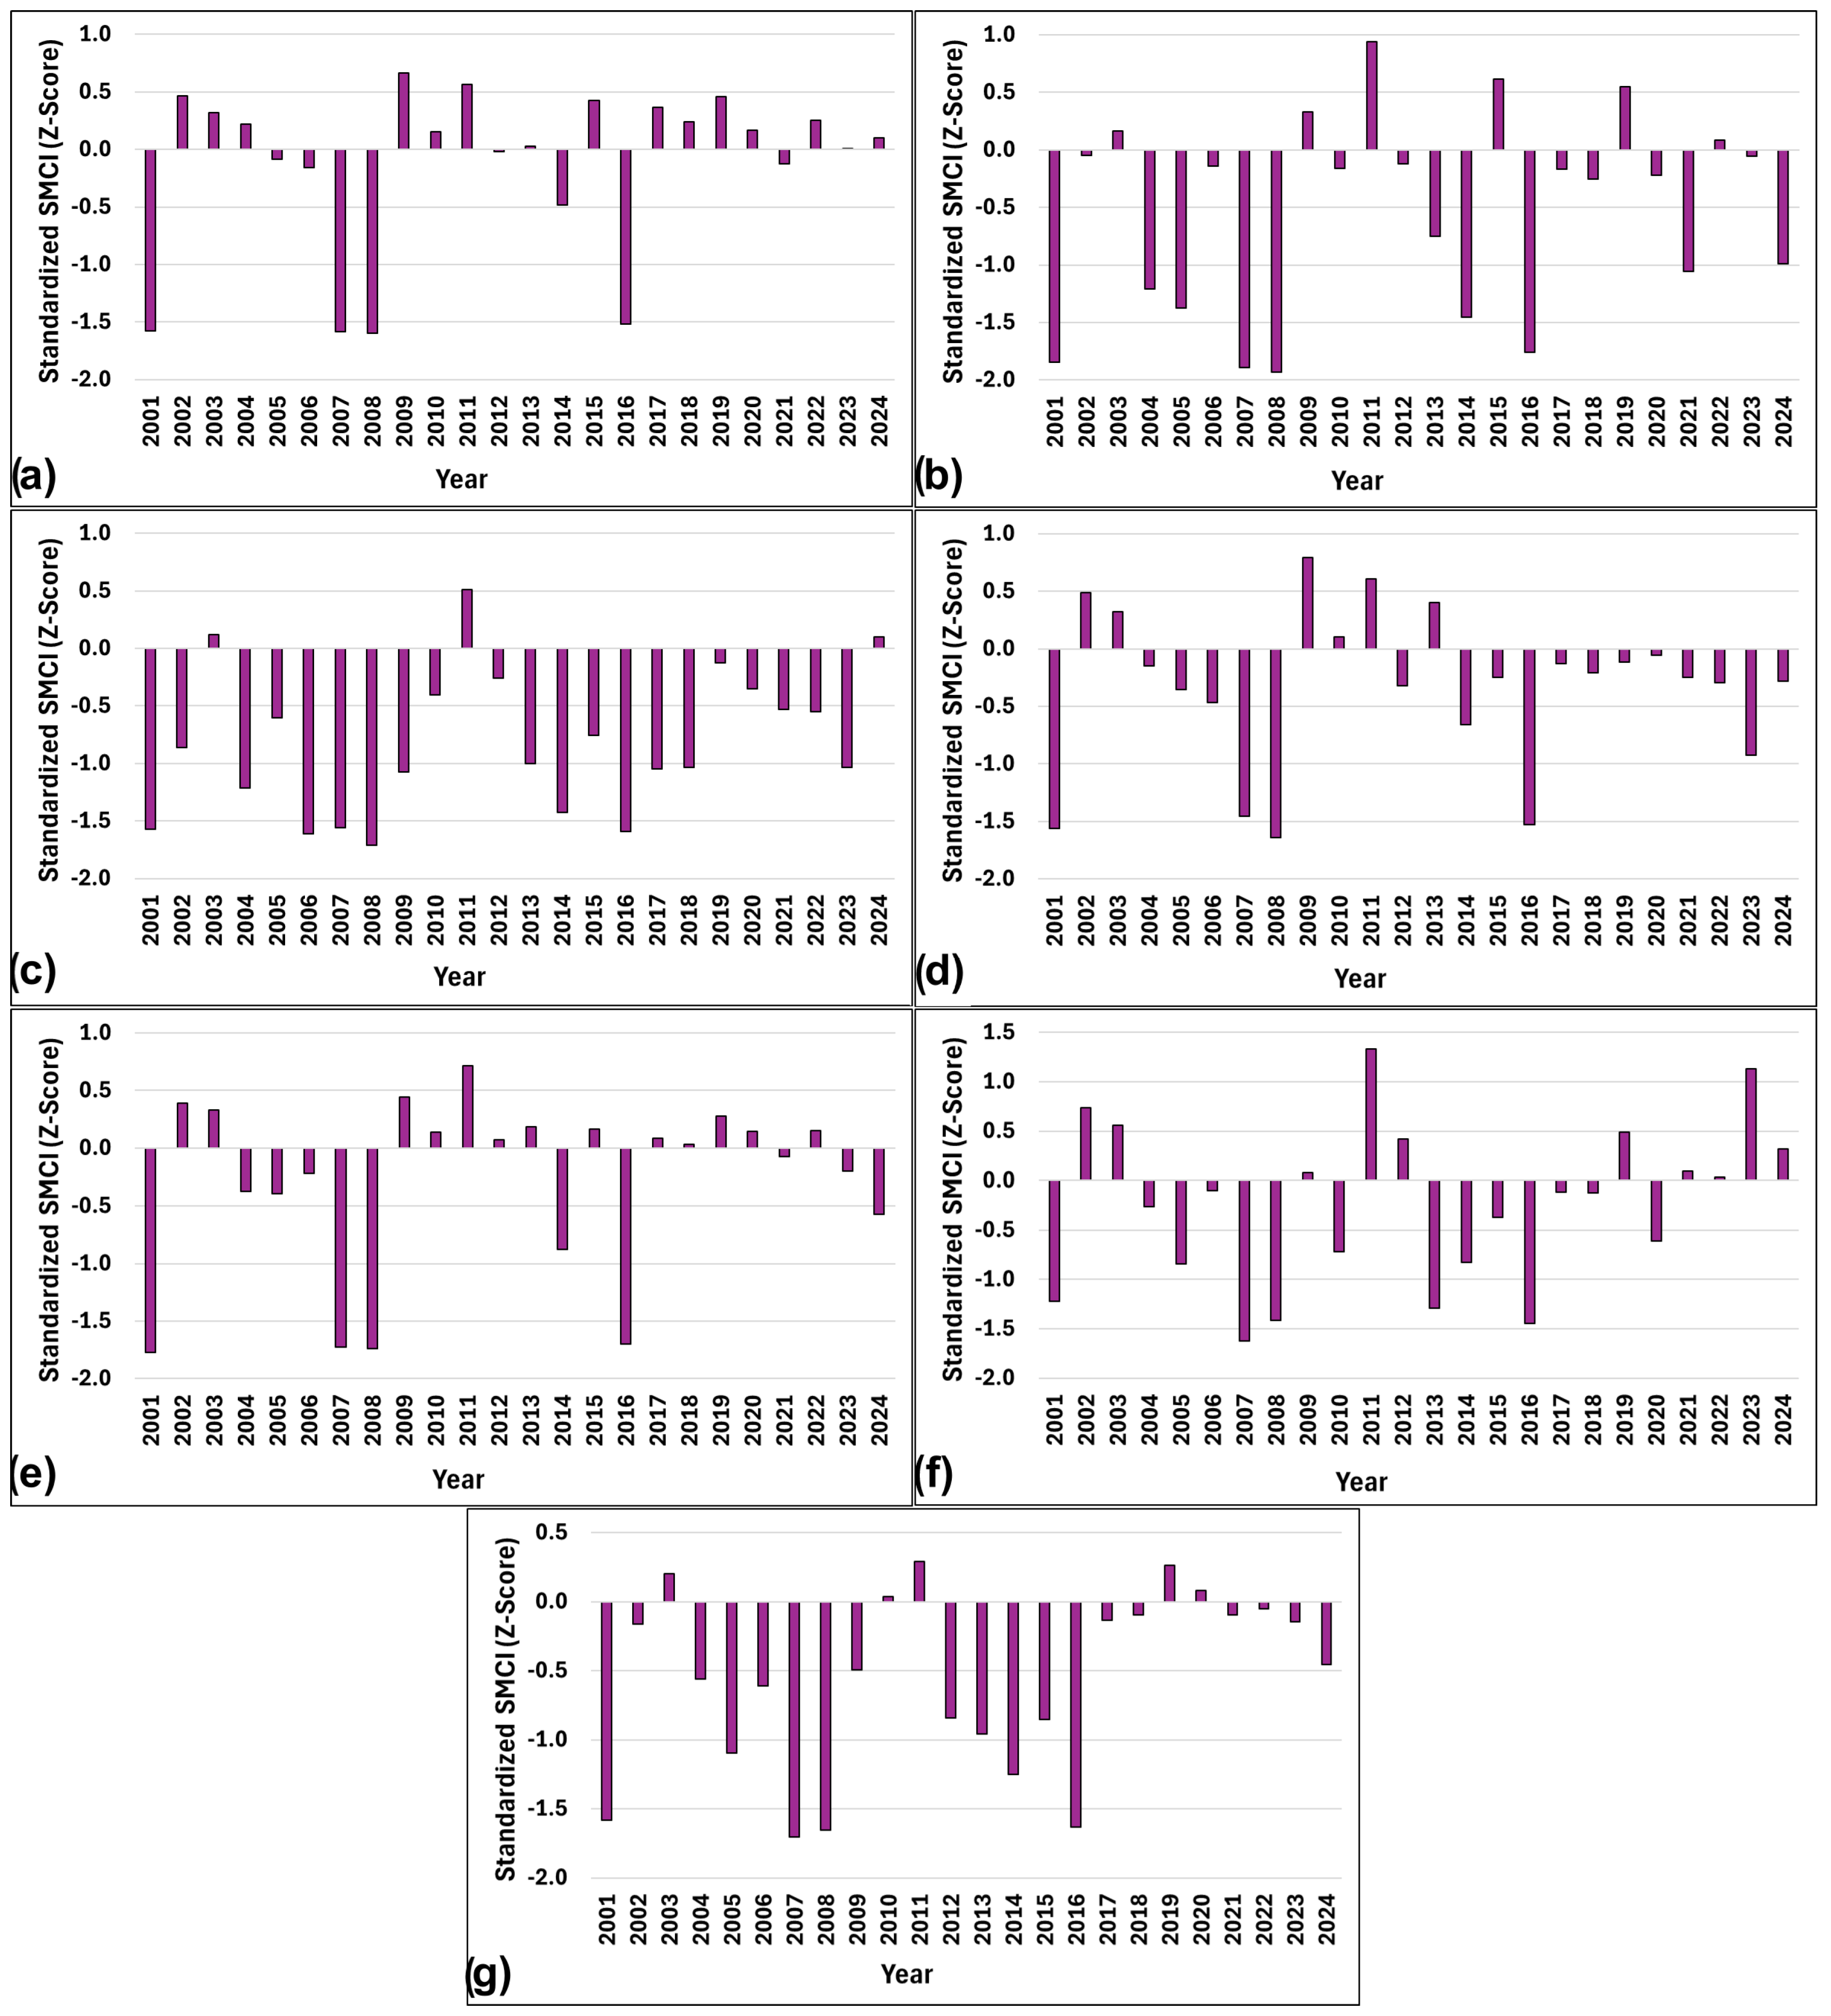
In addition to the SMCI image analysis,
Figure 14 displays the standardized SMCI (z-score) time series charts for the provinces: Aksaray (a), Ankara (b), Isparta (c), Karaman (d), Konya (e), Nevsehir (f), and Nigde (g). When region-wide anomalies occurred in Central Anatolia, the SMCI had a tendency to commove strongly across provinces, showing steep troughs during dry years and vigorous rebounds when precipitation returned or evapotranspiration demand decreased. The flatter topography and bigger cultivated area of Konya might intensify SMCI variations, causing deficits to persist when cumulative rainfall was unable to replenish profiles. On the contrary, Aksaray and Karaman frequently exhibited similar patterns, with prolonged dry spells resulting in persistently low SMCI and rapid, if occasionally partial, recoveries in succeeding rainy years. The milder fluctuations in Ankara and Isparta could indicate more varied land cover and microclimatic factors that aid in moisture retention or lessen evaporative stress.
4.4. Descriptive Statistics for PCI and SMCI
Table 7 presents the descriptive statistics of PCI and SMCI across the Konya Closed Basin from 2001 to 2024. The PCI exhibited considerable interannual variability, with extreme drought conditions observed in 2004 and 2007 (mean PCI = 0.06 for both years), and relatively wetter periods in 2011 (0.79) and 2023 (0.92). Notably, SMCI values reflected more persistent moisture stress, with severe deficits recorded in 2001 (0.05), 2007 (0.05), 2008 (0.04), and 2016 (0.06). The southern part of the basin consistently exhibited lower SMCI values than the northern regions, indicating significant spatial heterogeneity in drought vulnerability. Temporal discrepancies between PCI peaks and SMCI responses—such as the high PCI in 2023 (0.92) coupled with only moderate SMCI (0.40)—may indicate limitations in the soil–plant–atmosphere water balance, possibly related to factors such as reduced infiltration, increased evapotranspiration, or other processes that warrant further investigation.
4.5. Konya Drought Vulnerability Index (DVI)
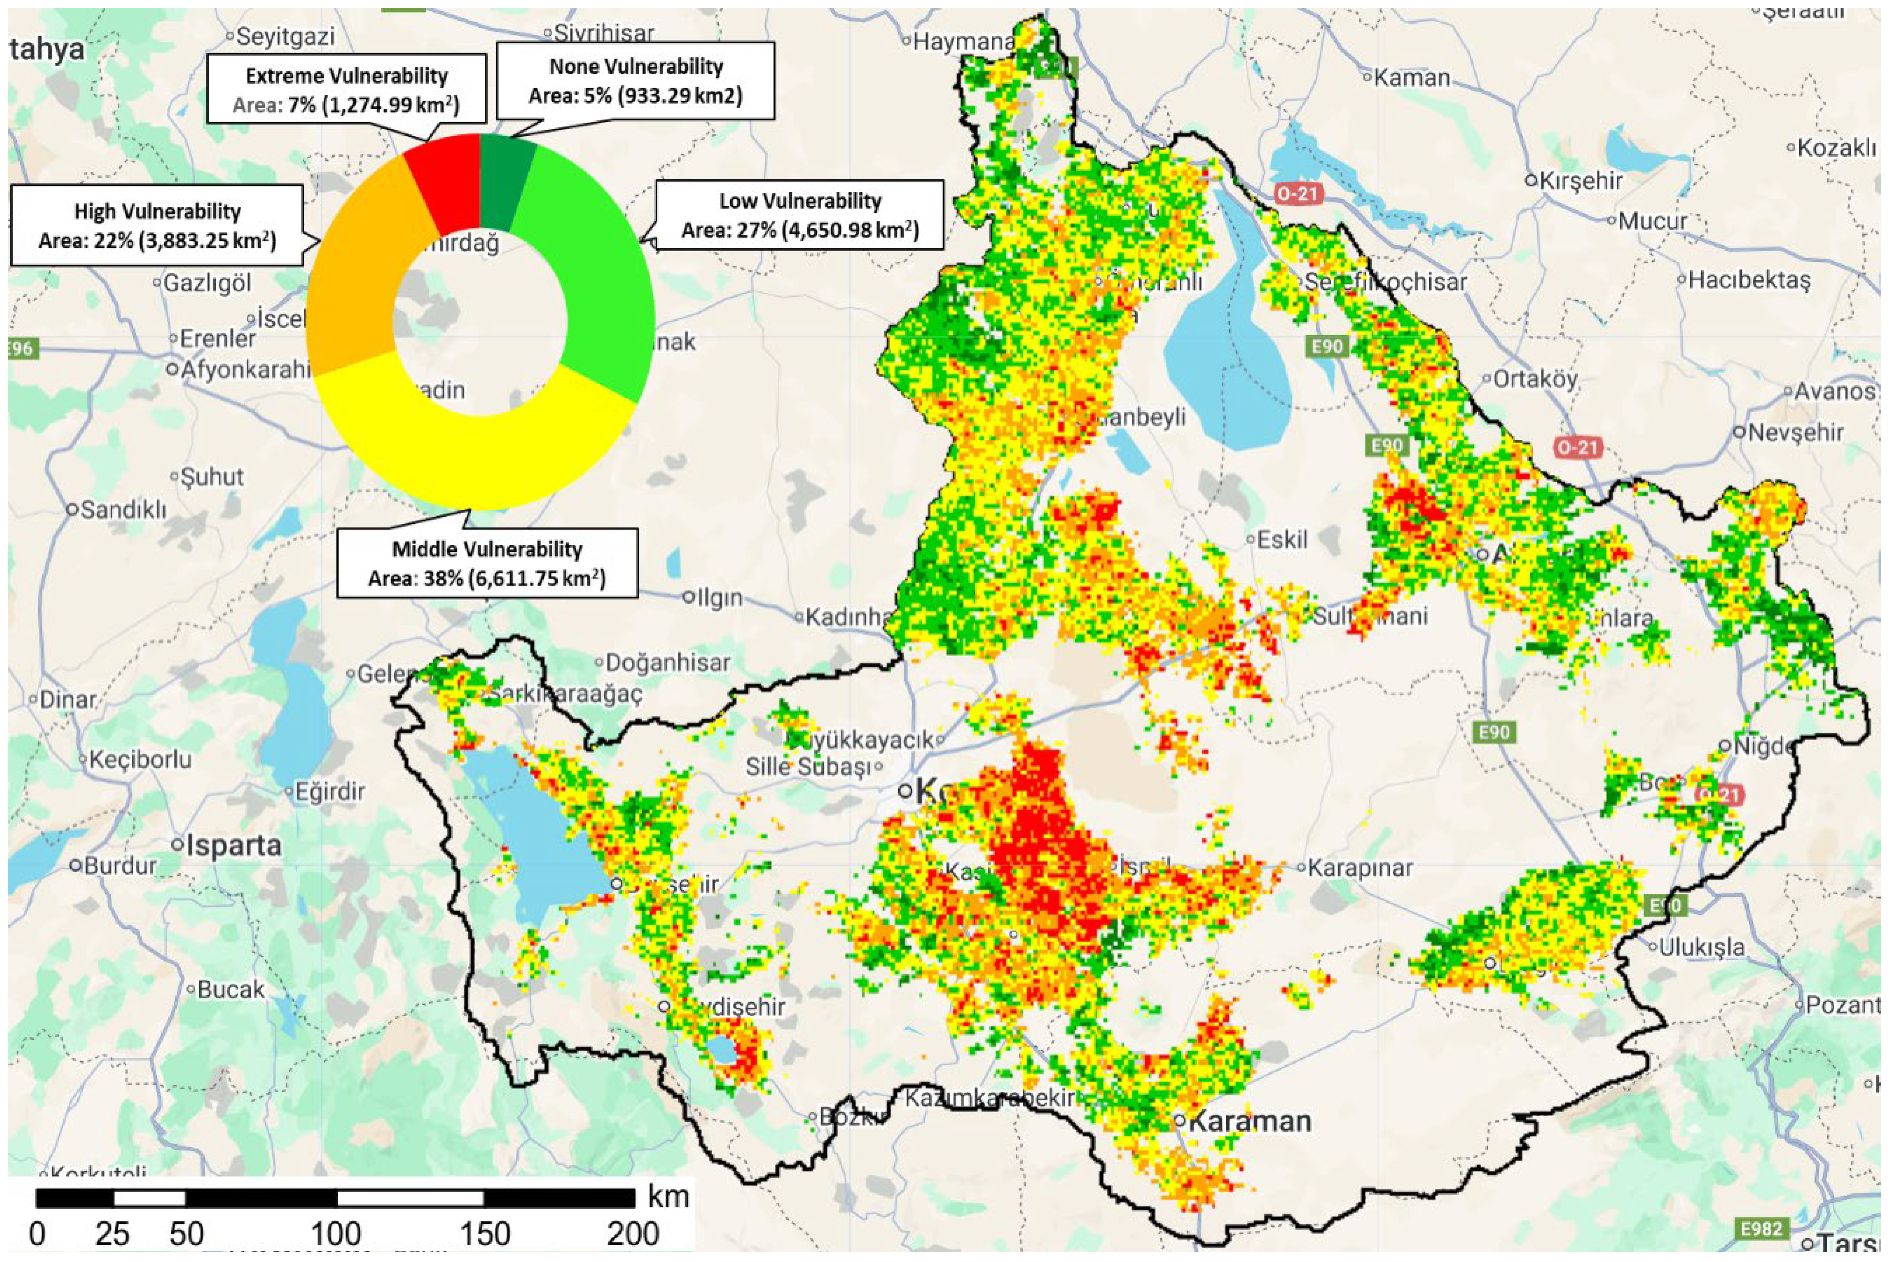
The Drought Vulnerability Index (DVI) classification for the Konya Closed Basin offers a comprehensive spatial assessment of drought susceptibility by integrating multiple drought indicators, including VHI, ETCI, SMCI, and PCI. The weights for each indicator were calculated as 0.27 (VHI), 0.25 (ETCI), 0.26 (PCI), and 0.22 (SMCI), and the DVI for agricultural areas of Konya Closed Basin was generated using Equation (6). The classified DVI map delineates five distinct vulnerability levels based on
Table 5: no vulnerability, low vulnerability, moderate vulnerability, high vulnerability, and extreme vulnerability (
Figure 15).
The results indicate that extreme and high drought vulnerability was concentrated in the southern, eastern, and southwestern parts of the basin, particularly around the Seydişehir, Beyşehir, and Karaman regions. The central and southeastern parts of the basin, including Karapınar and Niğde, also showed isolated patches of high vulnerability. In contrast, the northern and northeastern regions were predominantly classified as having low to moderate vulnerability. The spatial distribution of vulnerability closely aligns with the long-term drought trends, as areas experiencing persistent extreme drought conditions over multiple years are now classified as highly vulnerable in the DVI. This correlation underscores the cumulative impact of climate stressors on vegetation and water resources, particularly in regions where both drought frequency and intensity have intensified over time.
The area distribution of drought vulnerability classes in the Konya Closed Basin, illustrated in the pie chart (
Figure 15), showed that moderate vulnerability predominated, covering approximately 38% of the total area (~7000 km
2). This suggests that, although these regions are not under immediate critical risk, they remain susceptible to drought-related impacts. Low vulnerability zones represented roughly 27% (~5000 km
2), mostly located in the northern and northeastern parts of the basin, where drought effects were comparatively milder but still present. In contrast, high and extreme vulnerability classes accounted for approximately 22% (~4000 km
2) and 7% (~1500 km
2) of the basin, respectively, and were mainly concentrated in the southern, eastern, and southwestern parts, particularly near Seydişehir, Beyşehir, and Karaman. The minimal extent of the no-vulnerability class —only 4% (~1000 km
2)—underscores the pervasive impact of drought throughout the basin.
5. Discussion
This study presents a comprehensive assessment of agricultural drought vulnerability in the Konya Closed Basin through a novel Drought Vulnerability Index (DVI) that integrates multiple satellite-derived indices, including VHI, SMCI, PCI, and ETCI. The methodological approach relied on several key assumptions, such as focusing exclusively on agricultural lands and consistently applying annual cropland masks to maintain temporal comparability. These choices ensured that the analysis specifically targeted drought impacts in agricultural zones, avoiding confounding effects from broader ecosystem changes. A further methodological component involved downscaling coarse resolution datasets to enhance spatial granularity. FLDAS-derived soil moisture (originally 11 km resolution) and CHIRPS-based precipitation data (6 km resolution) were both downscaled to 1 km by the RFR method, aligning with other remote sensing products used in the study. While this step was essential for improving the spatial representation of drought, it may also introduce uncertainties that could affect the accuracy of localized assessments. Incorporating higher-resolution datasets or refining downscaling algorithms in future studies could further mitigate these uncertainties.
A comparative analysis of VCI, TCI, VHI, ETCI, PCI, and SMCI revealed both convergent and divergent patterns in drought characterization across the Konya Closed Basin. VCI and TCI showed strong temporal alignment during extreme drought years (e.g., 2001, 2007, 2008), where low VCI values (mean = 0.33–0.35) coincided with high thermal stress (TCI < 0.4), confirming that vegetation health deteriorates under combined moisture deficits and high temperatures [
28]. However, during recovery periods (e.g., 2011, 2015), VCI rebounded more rapidly (mean = 0.48–0.51) than TCI, suggesting that vegetation responds quickly to precipitation pulses, while land surface temperature anomalies persist due to soil moisture memory [
29]. VHI, integrating both VCI and TCI, effectively captured these combined stresses, with its lowest values (0.34–0.36) aligning with documented crop failures in drought years [
32].
Although a few studies have examined long-term station-based drought over the entire Konya Closed Basin, they do not specifically focus on agricultural regions [
45,
48,
82]. Therefore, they are not fully sufficient to validate our results. The agricultural drought vulnerability map developed in this study (
Figure 15) highlights regions across the Konya Closed Basin with varying levels of drought risk, from extreme to none. High and extreme vulnerability areas, particularly concentrated in the central and southern parts of the basin, correspond closely with zones identified as water-stressed and highly sensitive to drought in the Konya Basin Drought Management Plan published by the Ministry of Agriculture and Forestry [
83]. Low and medium vulnerability areas generally align with regions where irrigation infrastructure is more developed and water resources are relatively stable. This spatial agreement between our remote sensing-based assessment and the ministry’s report supports the reliability of the vulnerability map. Moreover, the high-risk areas identified in our study can guide the prioritization of water-saving irrigation strategies and drought mitigation measures recommended in the management plan.
DVI revealed distinct vulnerability patterns, with approximately 7% of the basin classified as extremely vulnerable —especially in southern agricultural zones such as Seydişehir, Konya, and Karaman. These zones experienced persistent vegetation stress and soil moisture deficits, exacerbated by rising temperatures and declining precipitation. Our findings align with Gümüş & Durduran [
50], who conducted a Landsat-based analysis in the Beyşehir sub-basin, but contrast with Kartal & Nones [
45], who attributed drought risk predominantly to groundwater depletion. This discrepancy underscores the importance of integrating multiple drivers in vulnerability assessments, as single-index approaches may overlook compounding effects. The DVI’s weighted design (VHI: 0.27, ETCI: 0.25, SMCI: 0.22, PCI: 0.26) addresses this gap by balancing biophysical and climatic factors, building on recent advances in composite drought indices [
5] and improving spatial granularity via downscaling.
Extreme vulnerability in southern Konya can be attributed to several synergistic factors. Calcareous soils with low water-holding capacity [
84] exacerbate drought-related moisture deficits, as confirmed by FLDAS-derived SMCI values (mean = 0.09–0.12 in drought years). Climate trends —such as declining precipitation and warming temperatures [
85]—amplify evapotranspiration, as evidenced by ETCI trends. These mechanisms help explain the observed PCI-SMCI disconnects (e.g., high PCI but low SMCI in 2023) likely reflecting groundwater overuse—a critical factor absent in previous remote sensing studies [
51].
The practical applicability of the DVI results for the Konya region lies in their potential use as a decision support tool for agricultural production and water management. By identifying areas with high and extreme drought vulnerability, the DVI map can guide local authorities and farmers in prioritizing irrigation planning, allocating limited water resources more efficiently, and selecting drought-resilient crop varieties. For example, zones repeatedly classified as highly vulnerable could be targeted for early warning, adaptive irrigation scheduling, or even land use diversification to reduce risk. At the basin scale, the DVI provides agricultural policymakers with spatially explicit evidence to inform sustainable groundwater extraction policies and climate-resilient agricultural strategies. While not a substitute for field-level monitoring, the index offers a cost-effective complement to scarce ground observations and can help stakeholders anticipate and mitigate production losses during drought years.
Despite its advancements, DVI has key limitations that warrant acknowledgment. MODIS’s spatial resolution (500 m–1 km) may fail to detect smallholder farms (<1 ha), potentially underestimating vulnerability in fragmented agricultural plots [
86]. A key methodological choice was to use 2005 cropland area data—the year with the smallest agricultural land extent in MODIS-derived LULC data—to provide a conservative estimate of permanent agricultural zones. This conservative approach aimed to focus on regions consistently dedicated to agriculture, thereby reducing misclassification risks due to land use change over time. However, this may exclude areas cultivated in other years but not in 2005, introducing a potential underestimation of exposure. Additionally, critical anthropogenic drivers—such as groundwater extraction and irrigation [
87]—were not explicitly incorporated into the model. Future research could fill these gaps by integrating higher-resolution datasets, ground-based well monitoring, and InSAR-derived subsidence data.
Soil type is another important factor influencing drought vulnerability, since texture, structure, and fertility strongly affect water-holding capacity and crop resilience. However, in this study, we were not able to incorporate soil information because consistent and up-to-date soil maps covering the entire Konya Closed Basin were not available to the authors. As a result, our DVI reflects climatic and vegetation conditions without explicitly accounting for soil-related variability. Future studies should integrate high-resolution soil data once available, since combining soil characteristics with remote sensing indices would provide a more comprehensive understanding of drought impacts on agricultural production and soil fertility.
Another limitation of this study is the reliance on moderate-resolution satellite products, which may not fully capture the fine-scale heterogeneity of croplands in the Konya Basin. This introduces potential uncertainty when fragmented fields, irrigation channels, or smallholder parcels fall within a single coarse pixel. Although downscaling methods were applied to improve spatial detail, residual scale mismatches remained. On the other hand, the lack of extensive in situ measurements across the Konya Basin is the other limitation of this study. Thus, a systematic comparison of remote sensing-based indices with traditional drought indicators derived from ground-based meteorological stations was not performed. Although a limited number of ground stations were available within the study area, their distribution was sparse and not primarily concentrated in agricultural zones. This restricted network cannot adequately represent the spatial heterogeneity of the entire basin, especially in regions where climatic and soil conditions vary strongly over short distances. Consequently, our ability to validate satellite-derived indicators and the DVI was constrained. Future studies would benefit from integrating denser ground observation networks and higher-resolution data (Sentinel 1–2, UAV) to improve validation and reduce these uncertainties.
Although this study primarily relied on moderate-resolution satellite datasets, the proposed DVI framework can also be adapted for highly fragmented agricultural plots where coarse pixels cannot capture field-scale variability. In such cases, UAV observations with multispectral or thermal sensors can provide very-high-resolution information on vegetation condition, canopy temperature, or soil moisture proxies at the parcel level. These UAV-derived indicators can serve two main purposes: (i) validation and bias correction of satellite-based indices in smallholder fields, and (ii) direct computation of parcel-scale DVI values when UAV coverage is sufficient. Integrating UAV data with satellite indices would thus allow the approach to be extended to heterogeneous agricultural landscapes.
6. Conclusions
This study developed a novel Drought Vulnerability Index (DVI) by integrating multiple satellite-derived indicators —VHI, ETCI, SMCI, and PCI—to assess agricultural drought vulnerability in Türkiye’s Konya Closed Basin from 2001 to 2024. DVI effectively identified major drought years (2001, 2007, 2008, 2014, 2016, and 2020) and revealed distinct spatial patterns, with approximately 15% of the basin classified as extremely vulnerable—particularly in southern agricultural zones such as Seydişehir and Karaman. These regions experienced persistent vegetation stress and soil moisture deficits, exacerbated by increasing temperatures and decreasing precipitation trends. The weighted structure of the index enabled a more nuanced assessment, overcoming the limitations of single indicator approaches and providing a practical tool for targeted drought mitigation efforts.
While DVI represents an advancement in drought monitoring, this study acknowledges several limitations. Reliance on MODIS data (500 m to 1 km resolution) may have obscured finer-scale variability, while the static use of 2005 cropland masks potentially overlooked dynamic land use changes over time. Additionally, human interventions such as groundwater extraction—critical in this heavily irrigated basin—were not explicitly incorporated into the analysis. These limitations point to opportunities for enhancing the framework using higher-resolution datasets (e.g., Sentinel-2) and ground-based hydrological measurements. Future research could leverage machine learning techniques to dynamically assign indicator weights or incorporate socio-economic data for a more holistic vulnerability assessment.
The spatial outputs of DVI offer actionable insights for policymakers and farmers. By pinpointing high-risk zones, the index supports informed decision making on water allocation, drought-resistant crop planning, and improvements to irrigation infrastructure. The methodology is scalable and transferable to other semi-arid regions experiencing similar climate pressures. As droughts become more frequent under climate change, tools like the DVI will be essential for enhancing agricultural resilience, safeguarding food security, and optimizing scarce water resources.
This research underscores the effectiveness of integrating multi-source remote sensing data for comprehensive drought assessment as reflected by the DVI’s quantitative classification of the Konya Closed Basin, with 38% of the area moderately vulnerable, 22% highly vulnerable, and 7% extremely vulnerable. By linking meteorological and agricultural indicators, the DVI framework provides a robust and replicable model for assessing vulnerability in other prone regions.
