Article

Energy Simulation-Driven Life-Cycle Costing of Gobi Solar Greenhouses: Stakeholder-Focused Analysis for Tomato Production

College of Horticulture, Gansu Agricultural University, Lanzhou 730070, China
*
Author to whom correspondence should be addressed.
Agriculture 2025, 15(19), 2053; https://doi.org/10.3390/agriculture15192053
Submission received: 19 August 2025 / Revised: 10 September 2025 / Accepted: 29 September 2025 / Published: 30 September 2025
(This article belongs to the Section Agricultural Economics, Policies and Rural Management)

Abstract

Sustainable agricultural production systems are a global consensus. Their life-cycle economic feasibility is essential for long-term sustainable goals. This study integrates life-cycle costing with building energy simulation to assess the cost performance of conventional and innovative greenhouse tomato production systems in China’s Hexi Corridor, using dynamic thermal load modeling to overcome empirical-data limitations in traditional life-cycle costing. Under the facility-lease farming model, construction companies incur life-cycle costs of CNY 10.53·m−2·yr−1 for the conventional concrete-walled Gobi solar greenhouse and CNY 10.45·m−2·yr−1 for the innovative flexible insulation-walled Gobi solar greenhouses. However, farmer greenhouse contractors achieve 10.5% lower life-cycle costs for tomato cultivation in the conventional structure (CNY 2.87·kg−1·yr−1) than in the innovative one (CNY 3.21·kg−1·yr−1) due to 52.6% heating energy savings from the integrated active solar thermal systems. Furthermore, life-cycle cash flow analysis confirms construction companies incur non-viable returns, while farmers achieve substantial profits, with 52.5% higher cumulative profits obtained in the conventional greenhouse than the innovative greenhouse. This profit allocation imbalance threatens sustainability. Our pioneering stakeholder-perspective assessment provides evidence-based strategies for government, investors, and farmers to optimize resource allocation and promote sustainable Gobi agriculture.

1. Introduction

Greenhouse agriculture, characterized by controlled environments, year-round production, and intensive cultivation, has emerged as a crucial strategy to address the challenges posed by climate change, resource scarcity, and growing food demands, while promoting sustainable development [1,2]. However, conventional greenhouses require substantial energy consumption and incur high operational costs to maintain optimal growing conditions for crop throughout the year. In cold regions, heating alone accounts for over 70% of total greenhouse energy consumption [3,4]. These constraints limit the widespread adoption of conventional greenhouses in developing countries, particularly in rural areas.
To address these energy challenges, the Chinese solar greenhouses (CSGs) are recognized as an energy-efficient agriculture facility that reduces dependence on external energy purchases and promotes long-term agricultural sustainability. Unlike conventional greenhouses, CGSs passively utilize renewable solar energy through greenhouse effects combined with periodic heat storage/release cycles of thermal mass envelopes, creating proper growth environments without additional heating [5,6]. By 2024, the total coverage of CGSs in China exceeded 800,000 hectares, enabling unheated overwintering production of fruit vegetables at 43.5° N latitude [7]. This achievement establishes a pioneering paradigm for global agricultural sustainability and the low-carbon transition.
However, the expansion of the traditional CGS has intensified land-use conflicts between staple food crops and cash crops. To resolve this problem, agricultural researchers have devoted themselves to developing CGS agriculture in China’s Gobi deserts [8,9]. The Hexi Corridor, located in northwestern China’s Gansu Province, represents one of the most desertified regions worldwide, with the Gobi Desert exceeding 35% of its total area and arable land accounting for less than 6% [10]. However, this region features abundant solar energy resources, receiving >6.1 GJ·m−2 annual radiation and >3000 h annual sunshine duration, which underpins its priority for CGS development. Over the past decade, researchers have integrated the locally available materials (Gobi pebble soils) and solid substrate cultivation systems to develop CGS structures for the non-arable Gobi Deserts [11,12]. This innovation has established the Gobi solar greenhouse (GSG) technological framework. By 2023, the GSGs covered over 265,000 hectares, supplying vegetables and fruits for local consumption and nationwide distribution [13].
The Hexi Corridor experiences prolonged and severe winters, with a mean daily minimum temperature of −7.8 °C and extreme lows below −20 °C. Currently, the GSG designs typically employ thermal massive walls (3–4 m thick on average) for cold resistance, yet the efficiency of passive solar utilization remains fundamentally constrained [14]. As wall thickness increases beyond a certain level, the returns in thermal performance diminish, resulting in imbalanced heat distribution between day and night within the greenhouse system, causing crops to suffer chilling or freezing injuries [15]. Consequently, supplemental heating becomes essential for secure overwintering production but inevitably imposes additional energy inputs and economic burdens.
Recently, agricultural engineers have developed an innovation CSG structures featuring two key advances: (1) substitution of thermal massive walls with lightweight flexible composite materials exhibiting high air tightness and thermal insulation, and (2) integration of active solar thermal systems in which water or air serves as the heat-transfer medium, circulating with the help of electric power for periodic storage and release of solar heat [16,17]. Considerable early studies have proven the superior solar utilization efficiency of these active solar thermal systems over passive thermal mass walls [18,19]. Attar and Farhat demonstrated that a buried-pipe solar water heating system using flat-plate collectors could meet 51.8% of heating demands in Tunisian plastic-film greenhouses [20]. In Beijing, Lu et al. employed a wall-mounted solar water heating system with a flexible film-based solar liquid collector to improve the thermal environment in brick-walled greenhouses, raising the average indoor temperature by 3.7 °C [21]. In another study, Zhao et al. applied an active solar heating soil heat storage system in a GSG of the Hexi Corridor [22]. This system, combining wall-mounted flat-plate collectors with underground dissipation pipes, increased the effective accumulated temperature by 40%. These studies collectively verify that active solar thermal systems significantly reduce the CSGs’ heating requirements, thereby lowering production costs and enhancing economic viability for growers. Consequently, this innovative CSG design, integrating a lightweight envelope with active solar energy utilization, holds substantial potential for wider application in the Hexi Corridor.
However, reduced production costs do not guarantee favorable cost-effectiveness, which is the key indicator determining the sustainability of investment projects [23]. In fact, technological innovations often require higher initial investments, which may compromise overall economic sustainability from a life-cycle perspective [24]. Life-cycle costing offers a valuable methodology for predicting and assessing the long-term cost performance of constructed assets [25,26]. Unlike traditional assessment approaches focusing solely on initial investments and short-term returns, life-cycle costing quantifies all cost components throughout an asset’s entire design lifespan. Its outcomes enable cost–benefit comparison among alternatives, decision-making, and data-driven continuous improvements across the project’s life cycle. The application of life-cycle costing has become widespread in the field of agriculture (e.g., irrigation [27], greenhouse heating [28], crop production [29,30]). Nevertheless, this method is highly dependent on empirical data, with most life-cycle costing studies for greenhouse agriculture adopting actual energy consumption during specific periods. This dependency limits its effectiveness for evaluating designs at the planning stage, hindering objective comparisons among conceptual alternatives and optimal decision-making.
This empirical-data dependency can be resolved using the Building Energy Simulation (BES) tools, which model dynamic energy demands for maintaining crop thermal comfort under diverse climatic conditions and temporal variations [31,32]. To assess the sustainability potential of the GSGs in China’s Hexi Corridor, this study integrates the life-cycle costing framework with BES to: (1) quantify and compare the life-cycle cost (LCC) between the conventional concrete-walled GSG and innovative flexible insulation-walled GSG tomato production systems; (2) identify the main cost drivers within each system; and (3) evaluate their long-term economic feasibility through life-cycle cash flow analysis from dual stakeholder perspectives—construction companies (infrastructure owners) and farmer contractors (operators)—under the prevailing facility-lease farming model.
Tomatoes were selected as the model crop due to their dominance in the region. By 2024, the greenhouse tomato cultivation area in Jiuquan City, a key city in the Hexi Corridor, had reached 52,333 hectares, accounting for >33% of the total greenhouse cultivation area, and generated CNY 500 million in output value. This establishes greenhouse tomato production as a regional pillar industry [33]. The research has two main innovations. Methodologically, it overcomes empirical-data limitations by using the BES tool for scenario-based energy cost estimation. Practically, its stakeholder-specific findings yield actionable insight, thereby providing evidence-based recommendations for governments, investors, and agricultural practitioners to optimize resource allocation and enhance sustainable Gobi agriculture.

2. Materials and Methods

2.1. Description of Target Systems

2.1.1. Structures of Gobi Solar Greenhouses

The studied GSGs comprised a conventional concrete-walled GSG (CW-GSG) and an innovative flexible insulation-walled GSG (FIW-GSG) in the Hexi Corridor (Figure 1). Both structures shared an identical south–north orientation to maximize solar energy capture and comprised four basic components: (1) foundation structure, (2) steel framework, (3) opaque thermal envelope (wall and north roof), and (4) daylighting envelope (south roof), with the latter covered with an insulating blanket during cold periods, particularly winter nights. Auxiliary facilities could be equipped depending on greenhouse’s functional requirements. Unified design parameters included a 10 m span, 80 m length, 4.9 m ridge height, and 800-m2 usable area, supplemented by structural dimensions of 10.7 m south roof arc length, 4.2 m north roof slope length, and 3.3 m north wall height. The south roof of both greenhouses utilized a highly transparent polyolefin film (light transmittance = 0.9). Material divergences in thermal envelope construction, however, led to significant design variations.
The CW-GSG featured a concrete-layered wall above a strip foundation (Figure 1a,b). This wall comprised two distinct layers: (1) an inner load-bearing layer of reinforced concrete with a thickness of 0.6 m and (2) an outer insulation layer of compacted Gobi pebble soils, forming a trapezoidal cross-section (3.3 m height, 1.2 m top width, 5.6 m base width). The north roof consisted of 0.15 m thick rock wool-core steel sandwich panels supported by a steel frame. During winter operation, heat dissipation occurred through the greenhouse envelope. The concrete-layered wall functioned as a thermal mass component, acting as a passive thermal regenerator that periodically stored and released solar energy to offset greenhouse heat loss, while the lightweight north roof primarily reduced conductive heat loss.
The FIW-GSG employed a flexible insulation envelope, which integrated the walls and north roof into a unified assembly, supported by steel framework and mounted above column pile foundations (Figure 1c,d). The envelope consisted of 0.09 m thick three-layer coiled composites: a foamed rubber core sandwiched between two anti-aging high-density polyethylene films. Adjacent composites were joined via hot-melt welding to ensure airtightness. The low-density (52 kg·m−3) composite exhibited ultralow thermal conductivity (0.031 W·m−1·K−1), making the envelope incapable of heat storage [17]. To mitigate low-temperature pressure, two active solar thermal systems were installed to supplement heat during winter operation:
(1)
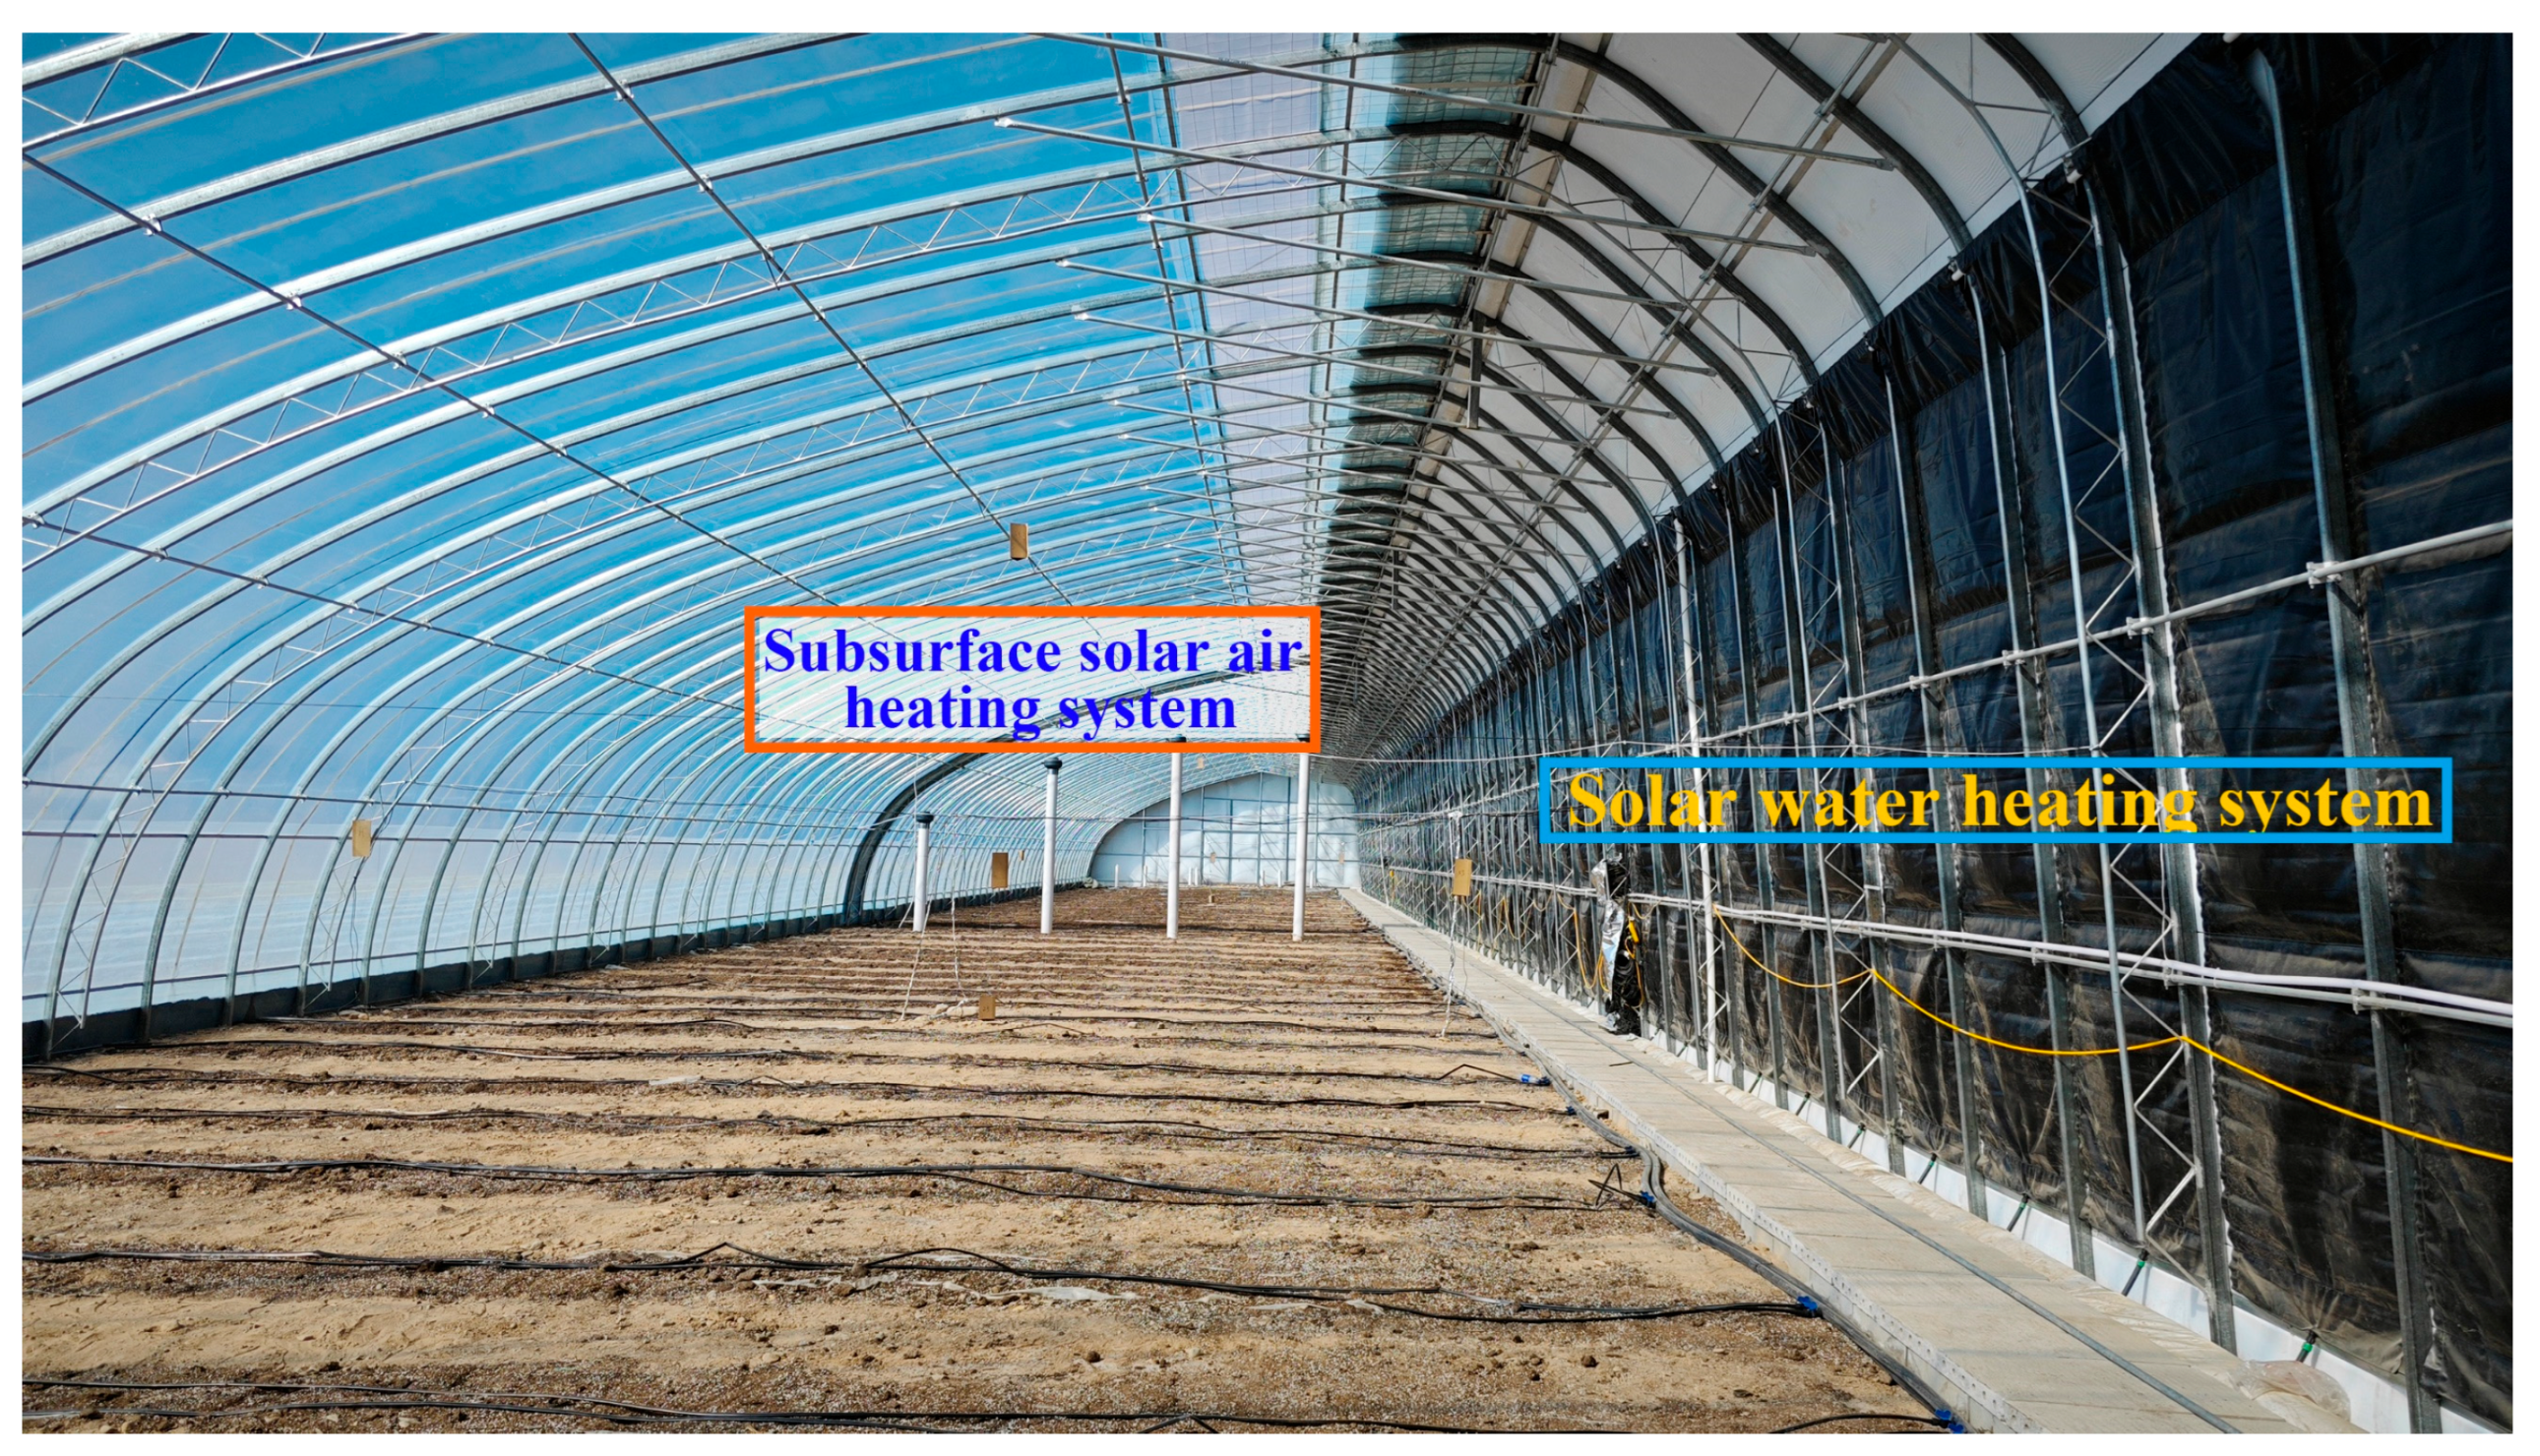
A solar water heating system featured 80 wall-mounted collectors installed on the internal surface of the north wall and a 28.8-m3 insulated storage tank embedded beneath the walkway running parallel to this wall (Figure 2). This system used flexible film-based solar liquid collectors, each (3.0 m length and 0.95 m width), consisting of two layers of black polyethylene film separated by a 3 mm water flow gap and reinforced with a non-woven fabric interlayer. This system absorbed solar heat during the daytime and released it at through continuous water circulation, driven by two water pumps operating in parallel with a combined flow rate of 26 m3·h−1.
(2)
A subsurface solar air heating system comprised two PVC heat exchanger arrays. Each array serviced 400 m2 and consisted of eight 40 m-long pipes (Ø160 mm), buried 0.6 m below the greenhouse ground surface at uniform intervals. Arrays converged at central manifolds connecting four Ø200 mm intake ducts, each terminating with an axial fan (1150 m3·h−1 capacity) (Figure 2). On the eastern and western ends, each array was connected to eight Ø160 mm exhaust ducts, forming a closed-loop circulation system for the indoor air that enhanced the ground thermal storage capacity. Driven by the axial fans, air circulated continuously between the greenhouse interior and the underground pipes, transferring excess heat to the soil for storage during daytime and retrieving stored heat to warm the greenhouse at nighttime.

2.1.2. Tomato Production

Both the GSG types utilized solid substrate cultivation systems to enable tomato production on the Gobi lands. Planting troughs (9.0 m length × 0.4 m width × 0.3 m depth) were arrayed parallel to the east–west orientation with 0.7 m spacing, each filled with growth substrates and mulched to reduce evaporation. Each greenhouse contained 2400 plants in total. Environmental management included: (1) integrated drip fertigation, (2) scheduled pesticide applications, (3) daily ventilation, and (4) seasonal thermal regulation. During the cold period (November–April), a proper thermal environment was maintained using movable insulation blankets supplemented by diesel-fired air heaters; conversely, hot-period temperature control relied solely on ventilation via roof vents.
This controlled GSG environment enabled two semi-annual tomato cropping cycles: an overwintering crop (November–March, 5 months) and a late-season crop (April–September, 6 months), both of which cultivated the tomato variety ‘Jintao’. This variety exhibited uniform fruit morphology, moderate firmness, a favorable flavor profile, and enhanced disease resistance, deriving significant market preference. Harvests began in mid-January and June, yielding 12.5 kg·m−2 per cycle [34]. The corresponding wholesale prices averaged CNY 5.77·kg−1 and CNY 3.74·kg−1 in 2024, reflecting seasonal premiums [35].

2.1.3. GSG Operational Model

In the Hexi Corridor, GSGs operated under a facility-lease farming model [36]. The framework comprised three core components: (1) Local governments provided targeted fiscal subsidies to construction companies; (2) subsidized companies implemented the life-cycle management of GSG infrastructure, covering initial construction and end-of-life disposal; (3) farmers as independent greenhouse contractors, leased these GSG from construction companies at a preferential annual rent (CNY 5000·yr−1 per 800-m2 GSG) to conduct vegetable production. These framer greenhouse contractors maintained operational autonomy, self-financing all inputs (auxiliary equipment, materials, energy, and labor), performing greenhouse structure maintenance, and managing crop sales while retaining full accountability for profits and losses. This operational model achieved decoupling of greenhouse ownership from agricultural production, thereby significantly lowering farmers’ capital barriers while optimizing specialized resource allocation.

2.2. Heating Demand Simulation

This study employed a pre-validated GSG thermal-load prediction model to simulate the dynamic heating requirements during overwintering tomato cultivation (1 November 2023–31 March 2024) in the GSGs in Jiuquan City [37]. Simulations quantified hourly energy demand to maintain an indoor temperature of 25 °C during the daytime and 15 °C at nighttime, which represents a standard design temperature range for tomato cultivation [38]. Simulations were implemented based on hourly meteorological data from Jiuquan City. Figure 3 presents the outdoor air temperature and solar radiation during the study period, with the air temperature measured using a temperature data logger EL-USB-1-PRO (LASCAR Electronics Inc., Whiteparish, UK) and solar radiation derived from a previously established and validated solar greenhouse light environment model (MPE < 10.3% and R2 = 0.9756) [39]. The meteorological data indicated a daily mean temperature of −2.5 °C, a mean daily minimum temperature of −8.1 °C, and a daytime average solar radiation of 487.52 W·m−2, with an extreme low temperature of −23 °C occurring on 5 February 2024.
The adopted GSG thermal-load prediction model partitioned a solar greenhouse system into five modules: wall, north roof, south roof, ground, and interior air. Under changed outdoor environment conditions with maintained indoor temperature (25 °C daytime/15 °C nighttime), the net heat gain of greenhouse space through these modules constituted the GSG thermal load (TH, kJ·h−1), which could be expressed as
T H = Q w + Q g + Q n r + Q s r + Q a ,
where Qw, Qg, Qnr, Qsr represent heat transfer via wall, ground, north roof, and south roof, respectively, and Qa denotes the space heat gain from air exchange between indoor and outdoor. The ground heat transfer was calculated using the transfer matrix method, with 50% solar radiation reduction at the ground surface to account for tomato canopy shading [38]. The space heat gains through north roof and south roof were obtained using the steady-state solution, due to negligible thermal mass in these modules.
Critically, the fundamental distinction between the CW-GSG and FIW-GSG lay in wall design. The CW-GSG incorporated a concrete-layered wall with an asymmetrical trapezoidal cross-section and an average thickness of 3.4 m (Figure 1). This wall acted as a passive thermal regenerator in winter, keeping the indoor temperature within the proper range. Therefore, its dynamic heat transfer was modeled using a two-dimensional frequency-domain finite element method to quantify the periodic heat storage-release dynamics within the wall and determine the greenhouse space heat gain through the wall [37].
The FIW-GSG employed a flexible insulation wall characterized by low mass and minimal thermal capacity. Its dynamic heat transfer could be estimated using the steady-state method. Given that this wall has a negligible heat storage capacity, two active solar thermal systems were integrated to mitigate low temperature pressure during winter operation. Consequently, calculating the thermal load of the FIW-GSG required incorporating dynamic heat contributions from both active solar thermal systems into Equation (1). The hourly heat contribution from the solar water heating system (Qsys_water, kJ·h−1) can be obtained using the following iterative programming [21,40]:
Q s y s _ w a t e r t = 3.6 h o u t t T c _ s u r t T i n t A ,
T c _ s u r t = η c S c _ s u r t + h o u t t T i n t + h i n T c _ i n t + T c _ o u t t / 2 h i n + h o u t t ,
T c _ i n t = n c c w m c ˙ T c _ o u t t + c w M T T c _ i n t 1 / 2 n c c w m c ˙ + c w M T / 2 ,
T c _ o u t t = c w m c ˙ T c _ i n t 1 + c w M c T c _ o u t t 1 / 2 c w m c ˙ + c w M c / 2 ,
A = n c L c W c ,
where 3.6 is the unit conversion factor between W·s−1 and kJ·h−1; T c _ s u r t , T i n t , T c _ i n t , and T c _ o u t t represent the collector surface temperature, indoor air temperature, collector inlet water temperature, and collector outlet water temperature at time t, respectively; Sc_sur and ηc denote the solar radiation flux incident on the collector and its collection efficiency; m c ˙ , Mc, and MT are the water mass flow rate, total water mass per collector, and total water mass in the insulated storage tank, respectively; cw is the specific heat capacity of water; A is the total collector area, with nc, Lc, and Wc signifying the number, length, and width of collectors, respectively. The internal (hin) and external (hout) convective heat transfer coefficients of the water-circulating collector are time-varying and depend on flow state and ambient conditions, calculated as follows:
h o u t t = 7.93 T c _ s u r t 1 T i n t T i n t + 273.15 1 / 3 + ε σ T c _ s u r t 1 + 273.15 4 T E 4 T c _ s u r t 1 T i n t ,
h i n = 0.664 R e P r 1 / 3 λ w / L c ,
where ε denotes the emissivity of the collector surface; σ is the Stefan-Boltzmann constant; TE represents the average internal surface temperature of the greenhouse envelope; λw and Pr are the heat conductivity and Prandtl number of waters, respectively; Re indicates the Reynolds number of water flow within the collector, determined by water physical properties, flow velocity, and collector characteristic dimensions.
Next, the hourly heat contribution from the subsurface solar air heating system (Qsys_air, kJ·h−1) was calculated by [41]:
Q s y s _ a i r = 7.2 n p c a m p ˙ T p _ o u t T p _ i n ,
T p _ o u t = T s T s T p _ i n e U L p 2 c a m p ˙ ,
U = 1 / R p + R a + R s ,
where 7.2 is the product of the heat exchange array’s quantity and the unit conversion factor between W·s−1 and kJ·h−1; Tp_out and Tp_in denote the inlet and outlet air temperature of the subsurface heat exchange pipe, respectively, with the latter equal to the indoor air temperature; Ts is the soil temperature surrounding the heat exchange pipes; np represents the number of pipes in an array and Lp is the length of each pipe; ca is the specific heat capacity of air. The overall heat transfer coefficient (U) was derived from the reciprocal of the sum of the thermal resistances of pipe wall (Rp), internal airflow (Ra), and soil media (Rs):
R p = ln D / 2 D / 2 δ / 2 π λ p ,
R a = 1 2 π D / 2 δ · N u λ a / D δ ,
R s = ln D / 2 δ + 86,400 λ s / π c s ρ s D / 2 / 2 π λ s ,
where λp and λa denote the heat conductivity of the pipe wall and air, respectively; λs, cs, and ρs represent the heat conductivity, specific heat capacity, and volume weight of the soil media, respectively; D and δ correspond to the external diameter and wall thickness of the heat exchange pipes, respectively; and Nu is the Nusselt number of the internal airflow. The constant input parameters for the simulation of heating requirements are listed in Table 1. The dynamic solar radiation data were calculated using the CSG light environment model (MPE < 10.3% and R2 = 0.9756) developed by Zhang et al. [39].
Once the dynamic heating requirements during the GSG overwintering tomato cultivation were obtained, the diesel consumption (MD, kg) for running diesel-fired air heaters could be computed as follows:
M D = 1 d T H d / q η h ,
where THd represents the GSG daily heating load during heating demand period, d denotes the date sequence, q is the heat value of diesel (42,700 kJ·kg−1), and ηh is the work efficiency of a diesel-fired air heater (0.82) [43].

2.3. Life-Cycle Costing

LCC analyses of the GSG tomato production systems were carried out in accordance with the ISO 15686 standards, as detailed below [44].

2.3.1. Goal and Scope Definition

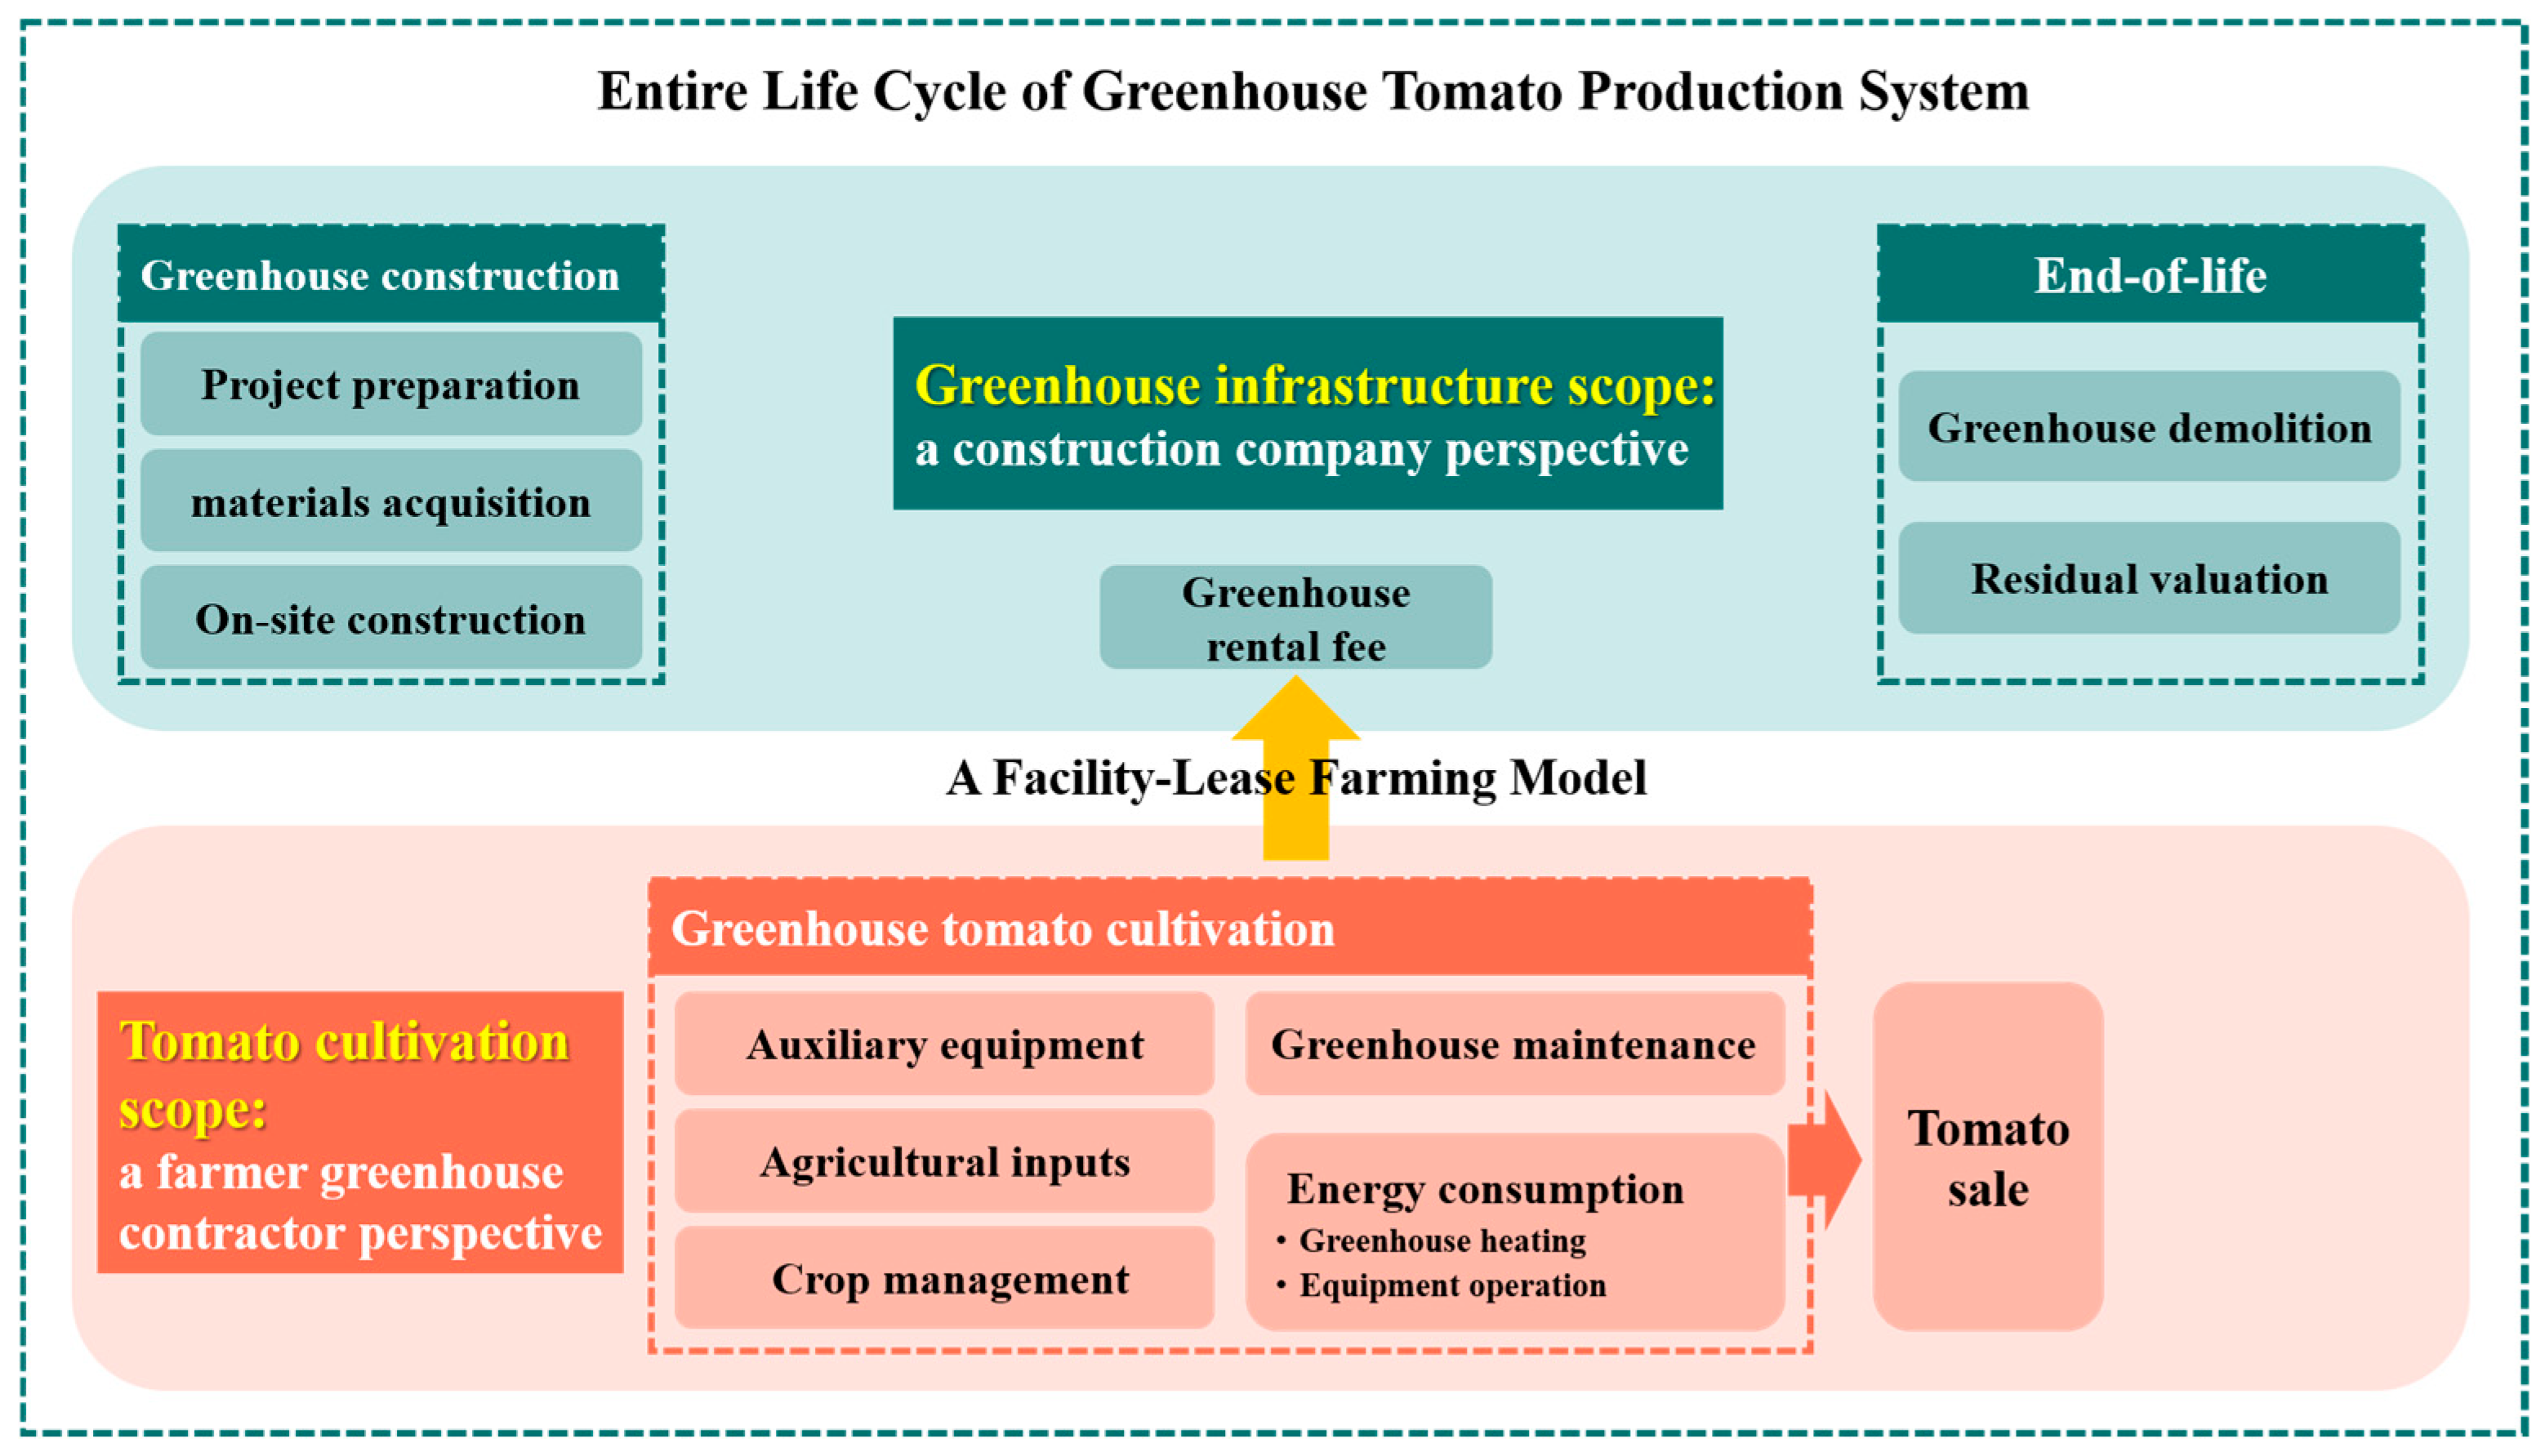
The aim of this study was to quantify all costs and incomes throughout the life-cycle of the CW-GSG and FIW-GSG tomato production systems, identify their main cost drivers and assess their cost performance. Under the facility-lease farming model, the analysis adopted two distinct actor-centric scopes: the greenhouse infrastructure scope focused on by the construction companies and the tomato cultivation scope concerned by the farmer greenhouse contractors. System boundaries were defined accordingly, with Figure 4 illustrating their integration across the life cycle.
The greenhouse infrastructure scope was assessed using a cradle-to-grave approach to quantify all associated cost. This scope encompassed building materials acquisition (procurement and transportation), greenhouse structure construction, and end-of-life disposal (demolition and recycling). The functional unit of the assessment was defined as 1 m2 of the GSG infrastructure for a 1-year operation period, considering the design lifespan of 30 years for both the CW-GSG and FIW-GSG.
The tomato cultivation scope used a cradle-to-farm gate framework, covering auxiliary equipment, agricultural inputs, crop management, greenhouse structure maintenance, and energy consumption. Waste management was excluded, as most crop residues were discarded locally or used for livestock. The functional unit was 1 kg of tomatoes produced per year in Jiuquan City, encompassing two semi-annual tomato cropping cycles.

2.3.2. Life-Cycle Inventory

Using 2024 as the base year, this section detailed the methodology for collecting, calculating, and monetizing resource consumption data across the two analysis scopes of each GSG tomato production system.
A.
The greenhouse infrastructure scope
The resource consumption and cost data of the greenhouse infrastructure were drawn from the GSG design detailing and regional construction quota database [45]. In cases of data gaps, supplementary sources such as suppliers and online shops were consulted. The data collection followed the greenhouse construction workflow across four stages: (1) material procurement, (2) transportation, (3) on-site construction works, and (4) end-of-life disposal. During material procurement, material quantities were calculated from the GSG architectural drawings. Transportation requirements were derived from the distance between the procurement site and the construction location. For the on-site construction works stage, labor and machinery inputs were quantified using regional construction norms, with energy consumption incorporated within their pricing. Regarding end-of-life disposal, civil works (e.g., concrete foundations and walls) were assigned a 100% residual value, as they could be retained for new greenhouse construction [46]; recyclable metals accounted for the dismantling cost, transportation cost, and residual value. Detailed information of each item was provided in Appendix A (Table A1 and Table A2).
B.
The tomato cultivation scope
The life-cycle inventory for the GSG tomato cultivation included all inputs classified in (1) auxiliary equipment, (2) agricultural inputs, (3) crop management, (4) greenhouse structure maintenance, and (5) energy consumption. Auxiliary equipment included blanket-rolling machines, film-rolling devices, integrated fertigation systems, and heating devices; agricultural inputs comprised insulating blankets, plastic films, growth substrates, seedlings, fertilizers, pesticides, water, and sundry materials; crop management covered labor for transplantation, plant regulation, and harvesting. The relevant resource consumption data were derived from greenhouse tomato cultivation regulations, supplemented by field surveys of local growers [47]. Market suppliers provided all price data. Notably, transportation costs were incorporated for all materials except blanket-rolling machines and insulating blankets. Decadal rust-proofing of steel frameworks constituted the main maintenance effort, costing via regional construction norms [45]. Energy consumption covered diesel for heating and electricity for auxiliary devices, with consumption data sourced from grower records and calculation (Equation (15)), while prices were government-published.
Given that most input items had service lives shorter than the GSG’s 30-year design lifespan, we computed cumulative consumption requirements to achieve the full GSG lifespan. For the FIW-GSG, the flexible insulation and active solar thermal systems, though initially installed by the construction company, required twice replacement within the cultivation scope. Thus, farmers covered all related replacement costs. Detailed information of each item was provided in Appendix A (Table A3 and Table A4).

2.3.3. Life-Cycle Cost Calculation

A.
The greenhouse infrastructure scope
In the project preparation phase, construction companies focused on three economic cost categories: (1) construction costs, (2) initial investment, and (3) LCC. The construction costs monetized resource consumption for physical infrastructure realization, covering material procurement, transportation, and on-site construction works expenses, as detailed in Section 2.3.2. The initial investment encompassed both construction costs and non-construction expenditures, including site safety and environmental management costs, statutory fees, and loan interest. The site safety and environmental management costs were dedicated to worksite safety and environmental compliance, while statutory fees were non-negotiable government charges, with the charging standards specified in Table 2 [48]. Loan interest accrued at 3.6% annually over a 10-year term, reflecting China’s 2024 Loan Prime Rate benchmark.
Regarding LCC, its analysis should integrate the initial investment with the end-of-life disposal costs. With 2024 designated as the base year, the costs occurred in the future (FC) can be estimated using escalation rates:
F C = C 1 + f e i ,
where C is the cost in the base year, i is the number of years between the base year and the occurrence of the cost. For materials, labor, and machinery, the escalation rates fe adopt the values of 2.1%, 4.6%, and 2.6%, respectively, sourced from the China Statistical Yearbook 2024 [49].
Subsequently, the time value of money was incorporated. Using net present value (NPV) methodology, future cash flows were discounted to the base year to reflect their diminished value. By mathematical convention, costs were treated as positive cash flows, while incomes were recorded as negative offsets. Equation (17) was employed to convert a stream of future costs and incomes to a net present value, thereby quantifying the LCC for the greenhouse infrastructure scope:
N P V = i = 1 P C i I i 1 + f d i ,
where Ii is the income in the i-th year and P is the period of analysis. fd is the annual discount rate, which adopt 6% for agricultural projects in China [50].
B.
The tomato cultivation scope
For the tomato cultivation LCC assessment, beyond the costs associated with input items, the farmer greenhouse contractors annually pay the greenhouse rental fee to construction companies. Throughout the tomato cultivation phase, the abovementioned costs were repeated at different intervals. The relevant future costs were estimated using Equation (16), applying a 3.1% escalation rate to rental fees based on historical trends on agricultural inflation [49]. Subsequently, the LCC for tomato cultivation scope was calculated by discounting the annual cash flows to the base year using Equation (17).

2.3.4. Cost Performance Assessment

This section comprehensively evaluated the long-term economic performance of the GSG tomato production systems by synthesizing all costs and incomes in the entire life cycle. Within the greenhouse infrastructure scope, the initial investment funding was primarily secured through bank loans, with the government disbursing construction subsidies (26.5% of initial investment) and operational subsidies (CNY 37.5·m−2) upon greenhouse infrastructure completion [51,52]; concurrently, greenhouse rent payments constituted income for the construction company. Within the scope of tomato cultivation, annual tomato sales generate income for farmers. Future variations in these income streams were estimated using Equation (16). Subsequently, all income flows were incorporated into annual cash flows, with government subsidies and greenhouse rent payments increasing the construction company’s cash flows, and crop sales enhancing the farmers’ cash flows. Finally, the total NPV for each analysis scope was calculated using Equation (17), which employed the sign convention defined in Section 2.3.3 (i.e., costs were positive and incomes as negative cash flows). Consequently, under this convention, a negative NPV result indicated a cost-effective outcome, while a positive NPV indicates a net loss.

2.4. Statistical and Sensitivity Analysis

The input parameters for the life-cycle costing were based on primary data obtained through detailed the GSG design detailing and local government publications, supplemented by secondary data from regional suppliers and growers. Where variation was observed, a three-point estimate was used to define the baseline value for modeling.
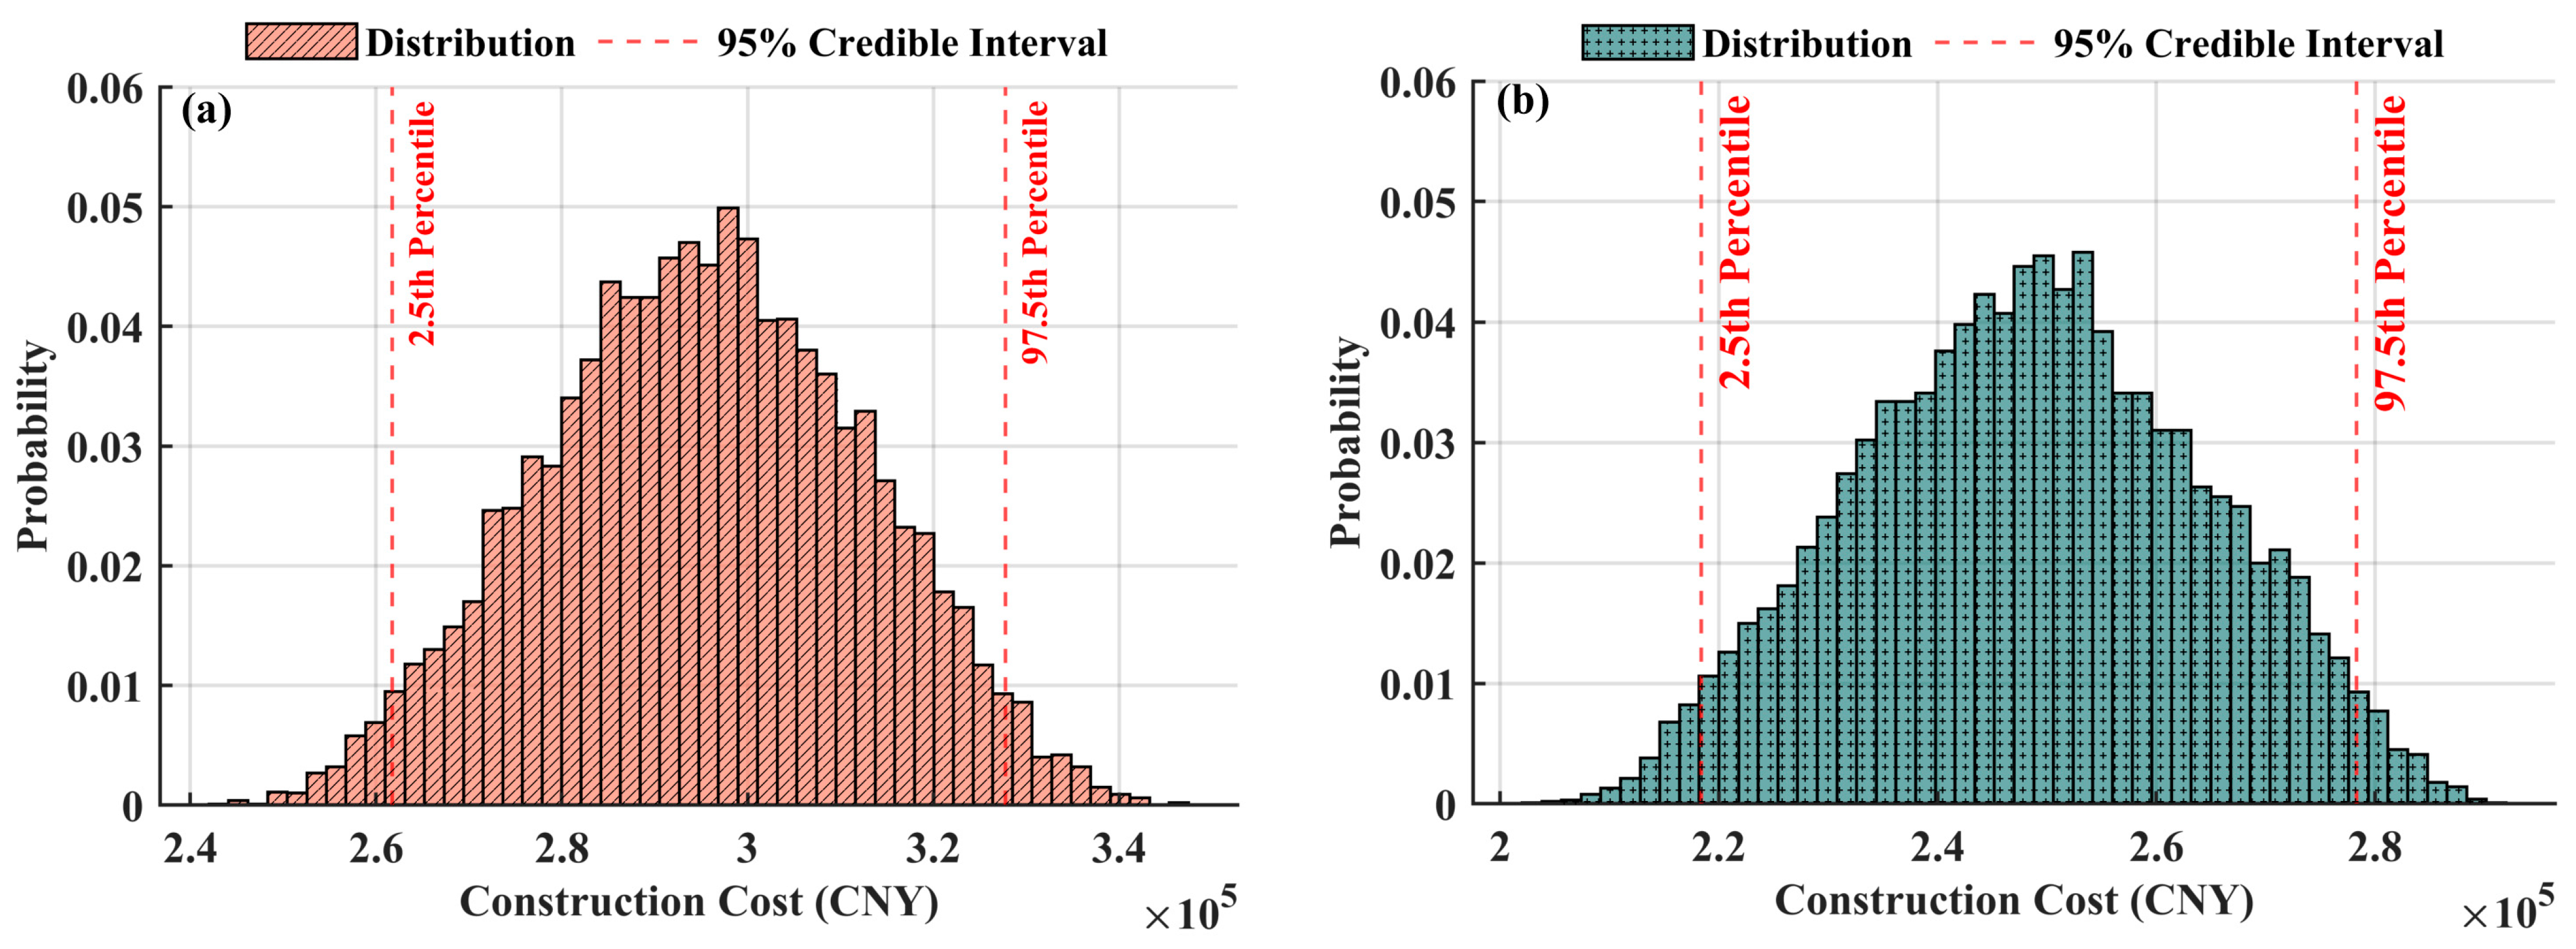
To address the inherent uncertainties from policy and market fluctuations, a probabilistic sensitivity analysis was performed using Monte Carlo simulation with 10,000 iterations. Key cost drivers (construction materials, labor, and machinery) were assigned triangular distributions with a ±20% variation around baseline value to reflect potential volatility.
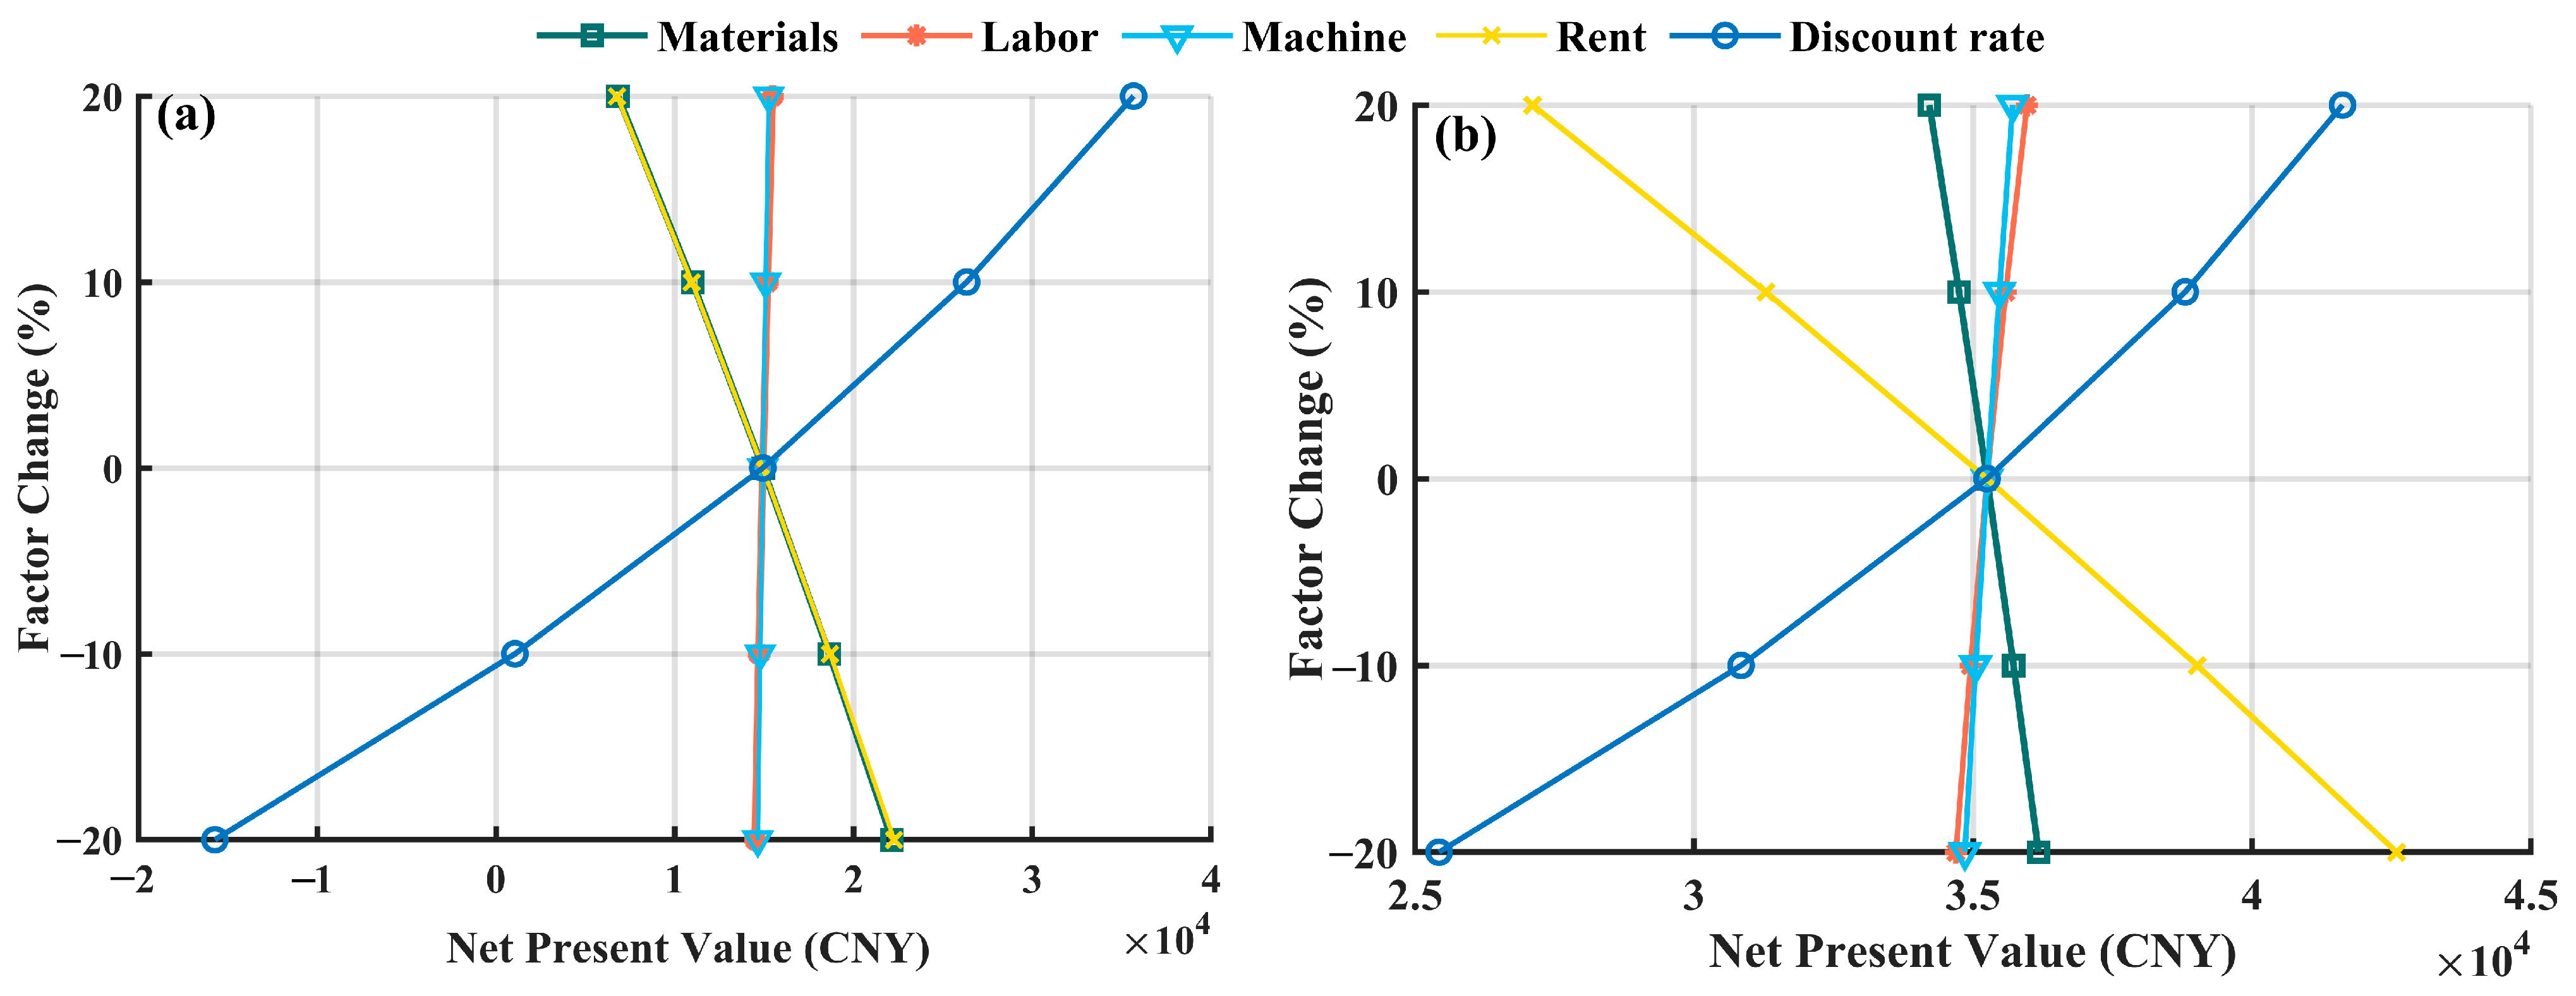
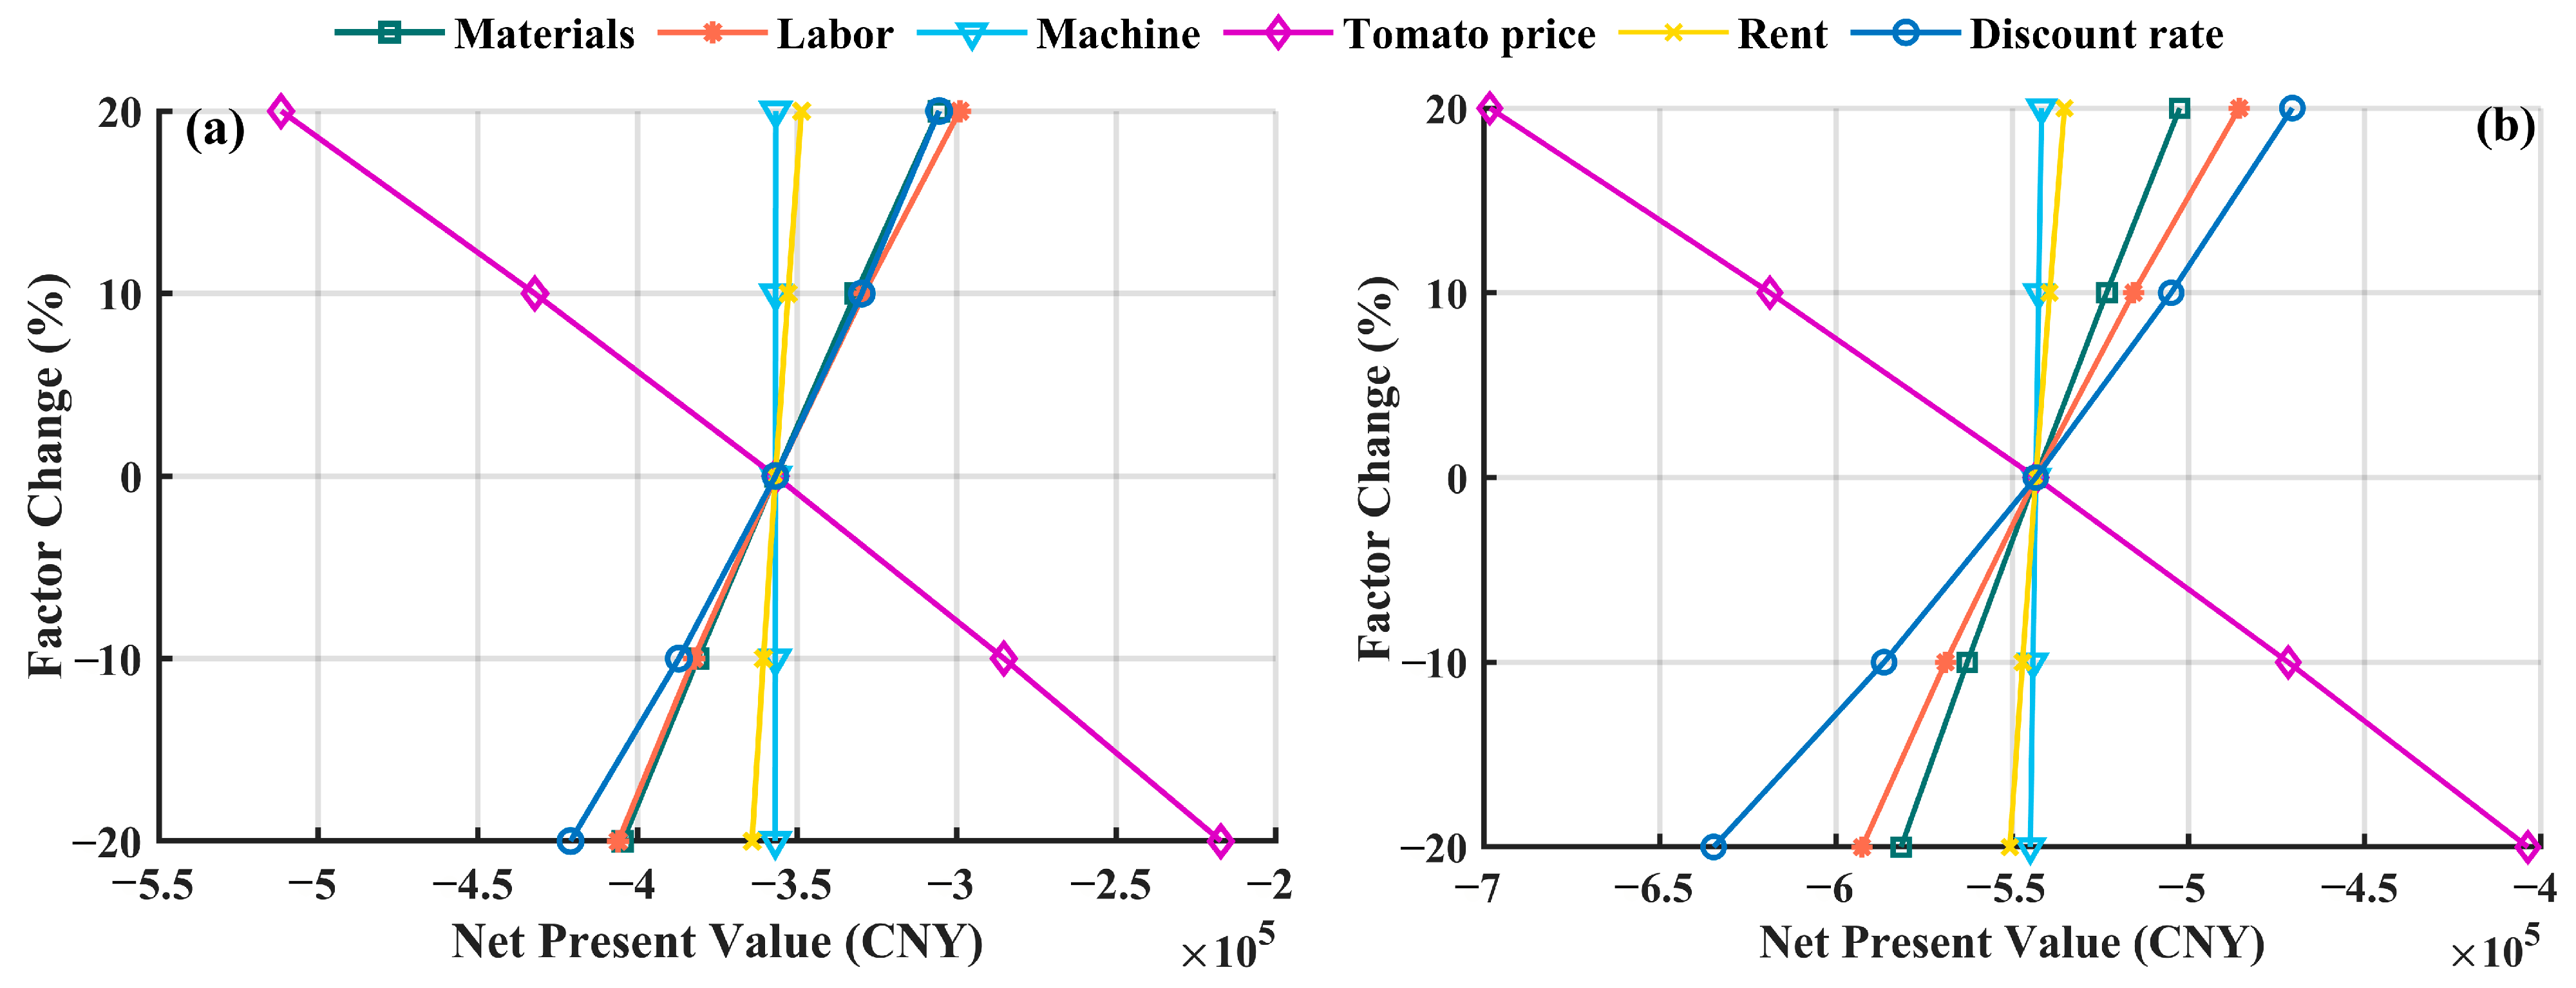
Additionally, a deterministic sensitivity analysis was conducted to evaluate the influence of key economic factors on the NPVs of the GSG tomato production systems. The analysis examined the annual discount rate and price escalation rates of materials, labor, machinery, greenhouse rent, and market tomatoes, with each factor varied independently by ±20% from its baseline value.

3. Results

3.1. GSG Heating Demand for Overwintering Cultivation

The dynamic heating demands during overwintering tomato cultivation (1 November 2023 to 30 April 2024) for the CW-GSG and FIW-GSG in Jiuquan City have been computed using the GSG thermal-load prediction model. Figure 5 illustrates heating demand variability throughout the overwintering cycle. Significant monthly fluctuations were observed, with peak demands occurring in February (72.78 MJ·m−2 for the CW-GSG and 40.93 MJ·m−2 for the FIW-GSG), coinciding with the coldest month featuring an extreme low temperature of −23 °C (Figure 3). These increased heating loads resulted from substantial energy inputs required to maintain the target indoor temperature of 25 °C daytime and 15 °C nighttime against the severe outdoor environment.
Throughout the overwintering cultivation period, the cumulative heating demand of the CW-GSG reached 195,570 MJ, exceeding the FIW-GSG’s 92,654 MJ by 2.1-fold. This differential stemmed from the active solar thermal systems integrated in the FIW-GSG, which demonstrated superior solar energy utilization efficiency compared to the passive thermal mass wall in the CW-GSG. Consequently, the higher heating demand of the GW-GSG implied increased energy consumption and operational cost for tomato cultivation.

3.2. LCC of Greenhouse Infrastructure

3.2.1. Construction Costs and Initial Investment of the GSGs

Construction companies evaluated three cost categories: construction cost, initial investment, and LCC, with the first two determining project feasibility. As shown in Table 3, construction costs covered materials, transport, and on-site works, while the initial investment included non-construction expenditures. The CW-GSG incurred CNY 295,090 in construction cost and CNY 386,953 in initial investment, whereas the FIW-GSG showed reductions of 15.8% and 17.8% (CNY 248,448 and CNY 318,122, respectively) relative to the CW-GSG.
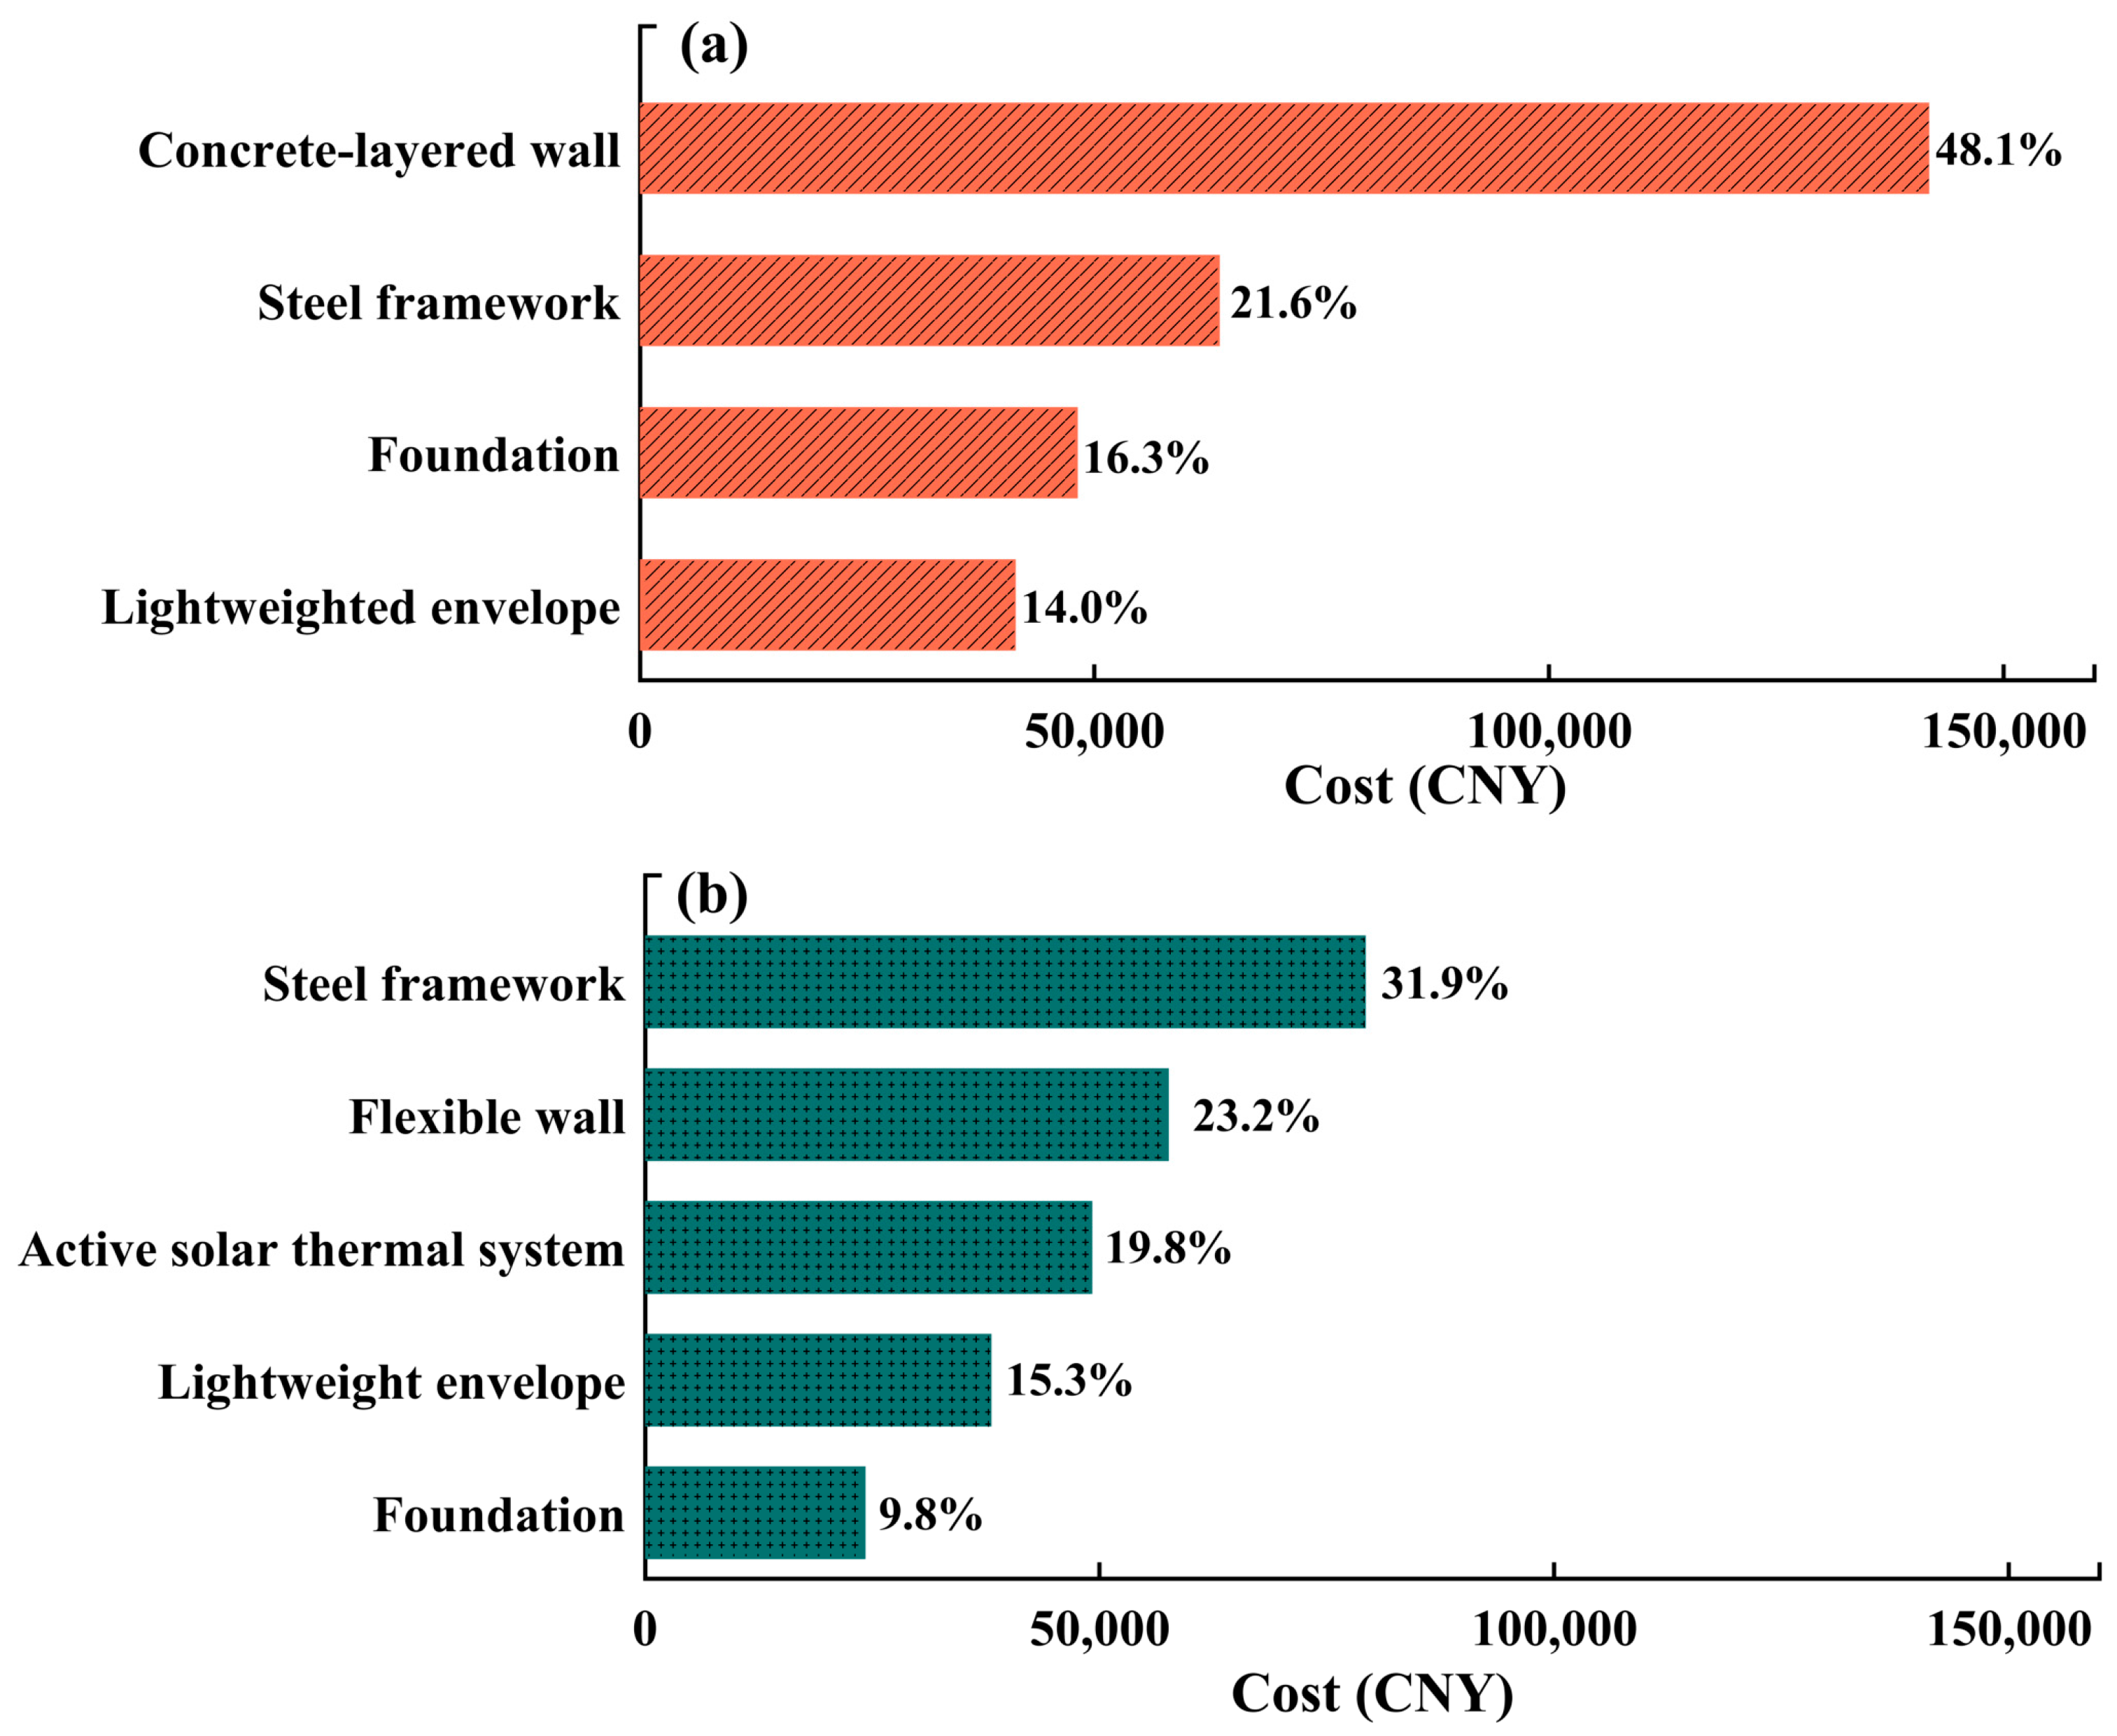
To identify the main cost drivers, the data presented in Table 3 were reorganized by structural components (Figure 6). In the CW-GSG, walls dominated costs (48.1%), followed by steel frameworks (21.6%), foundations (16.3%), and thermal envelopes (14.0%). The FIW-GSG prioritized steel frameworks (31.9%), walls (23.2%), solar thermal systems (19.8%), insulation envelopes (15.3%), and foundations (9.8%). Key reductions were observed in the flexible insulation wall (59.4% lower than the CW-GSG’s concrete-layered wall) and column pile foundation (49.6% lower than the CW-GSG’s strip foundation), explaining the lower costs of FIW-GSG despite the addition of its supplementary active solar thermal systems.

3.2.2. Life-Cycle Cost of the GSGs

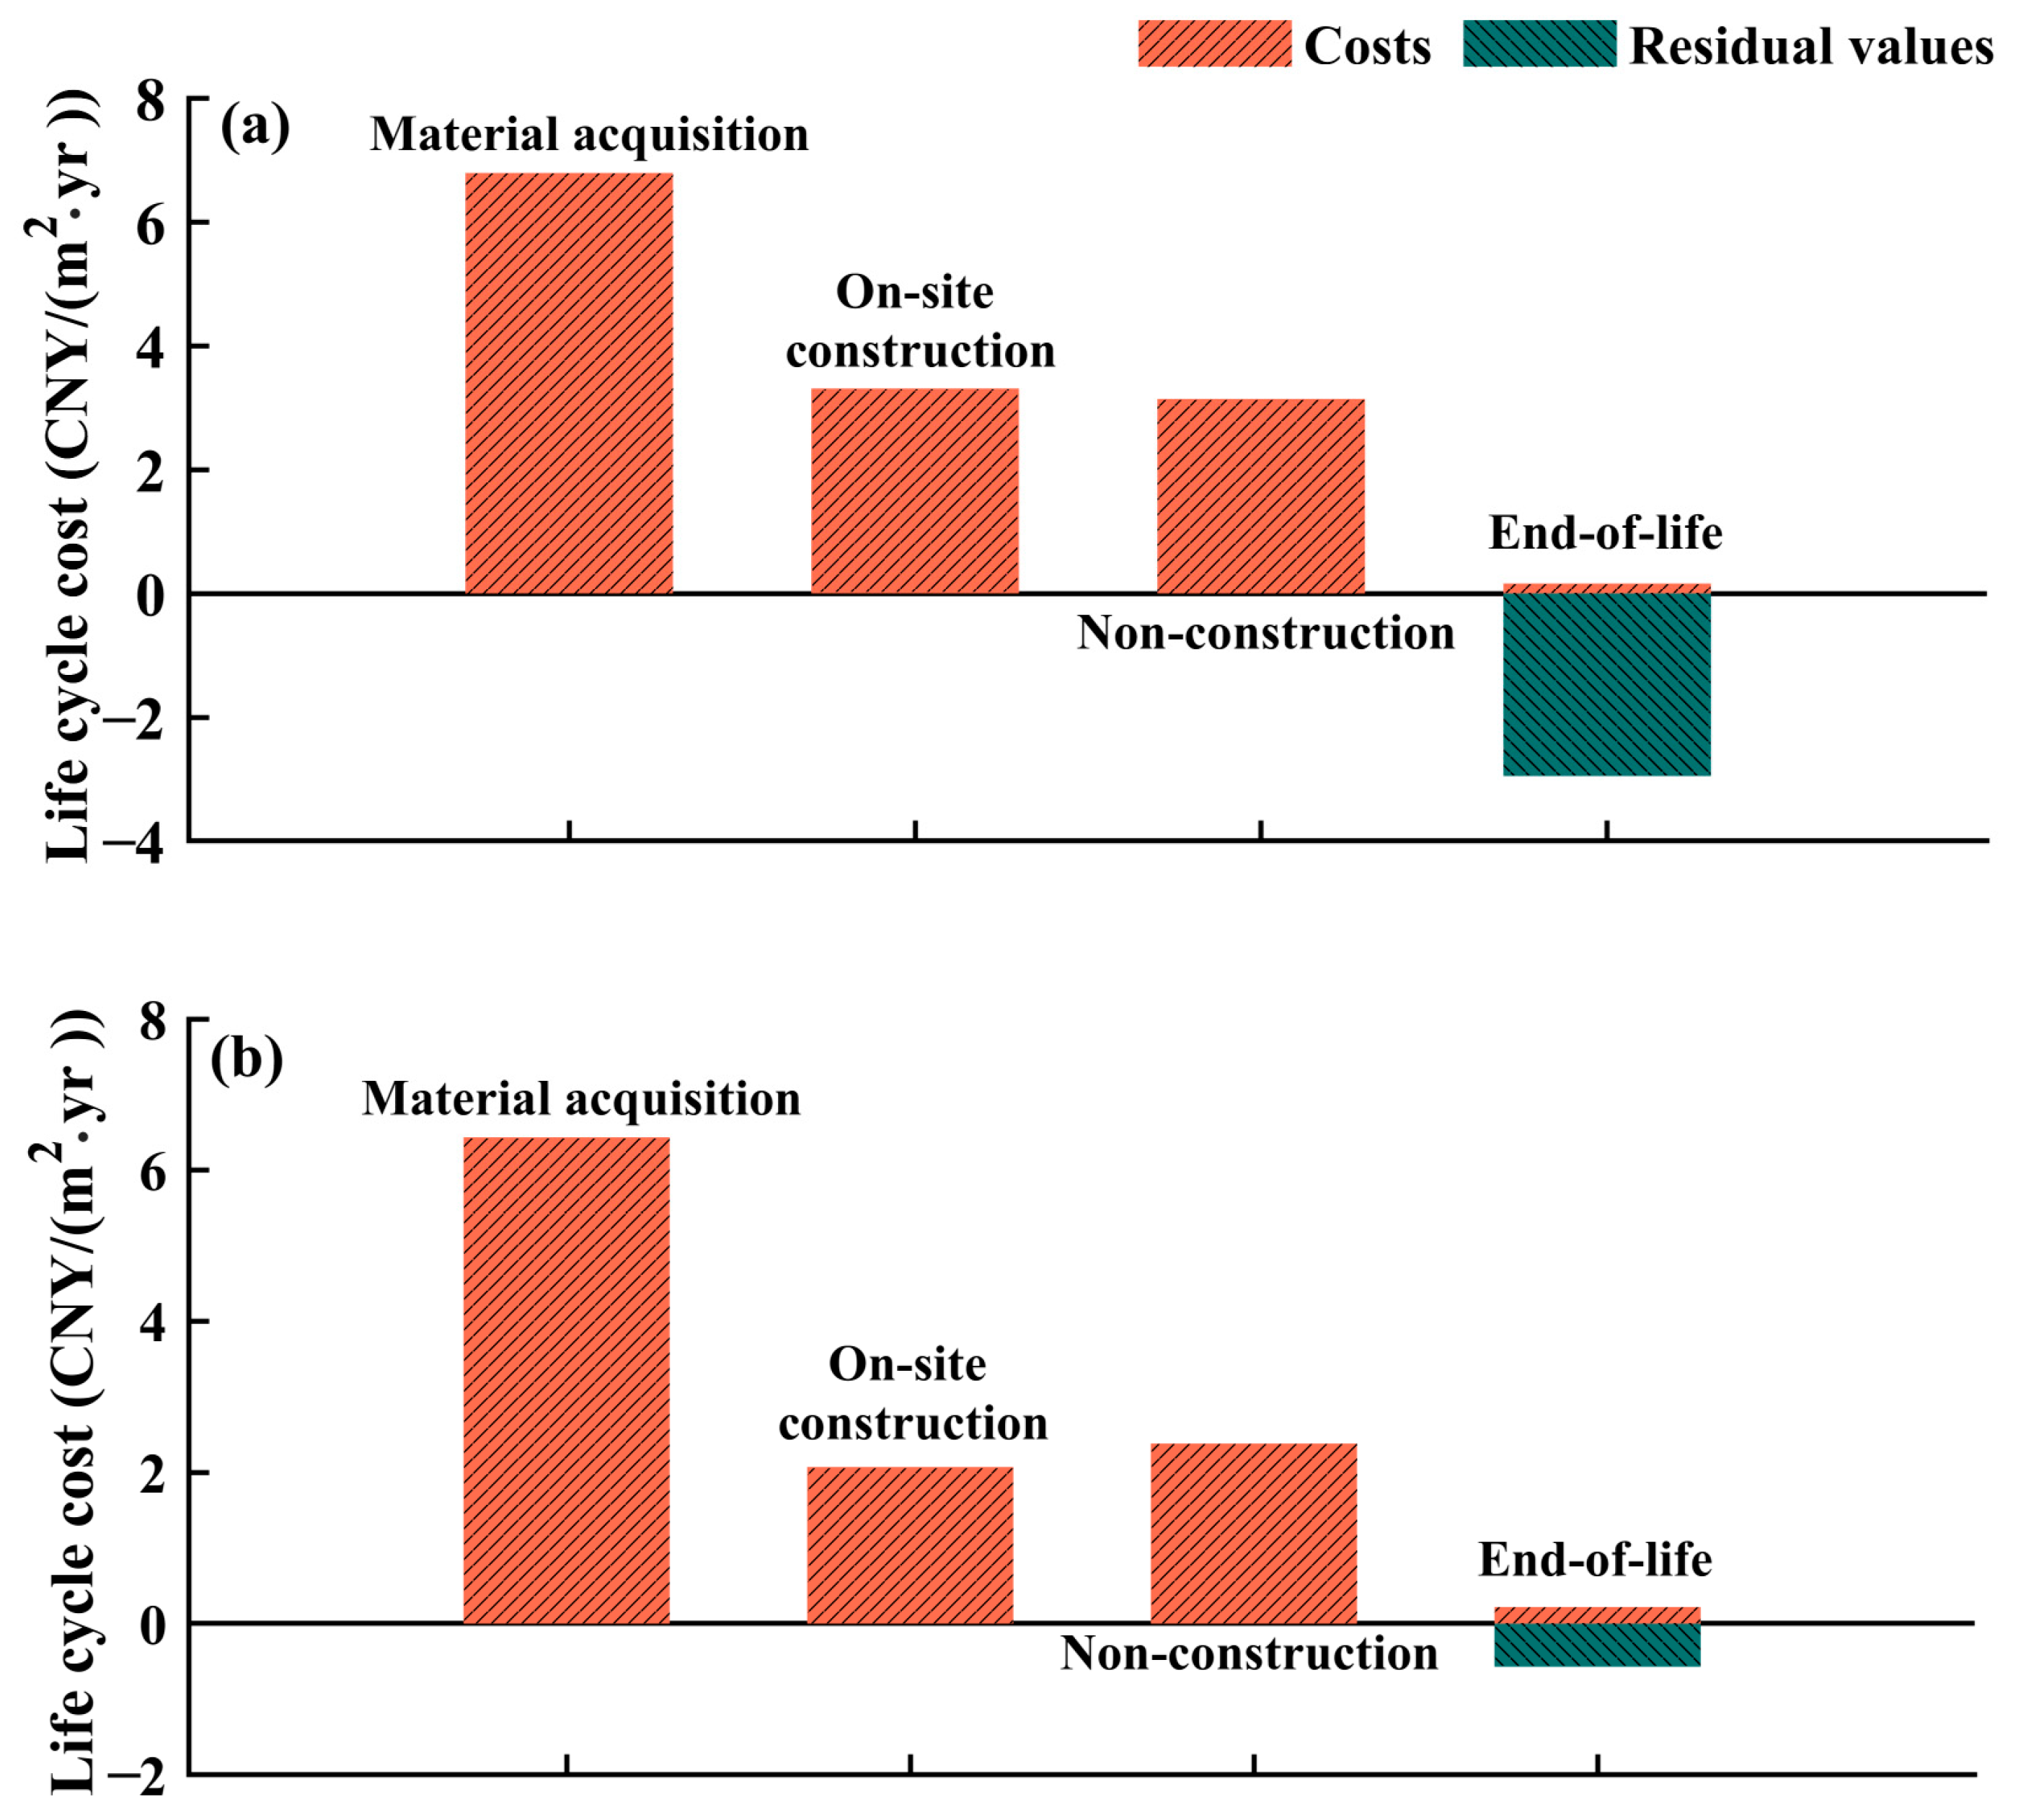
LCC served as a key sustainability indicator for greenhouse construction projects. Within the scope of greenhouse infrastructure, the LCC calculation incorporated both initial investment and end-of-life costs. The LCC distributions are presented in Figure 7, with the residual values reflected as negative contributions. In the CW-GSG and FIW-GSG systems, material acquisition costs (including procurement and transportation) dominated gross LCC at 51% and 58%, respectively; on-site construction costs accounted for 25% and 19%; non-construction costs represented 23% and 21%; and end-of-life expenditures involved in dismantlement and transportation constituted 1% and 2%. These costs were substantially offset by residual values, which contributed 22% and 5% to the gross LCC reductions for the CW-GSG and FIW-GSG, respectively.
The calculation results indicated that the net LCC for the greenhouse infrastructure scope in the CW-GSG and FIW-GSG systems were CNY 10.45·m−2·yr−1 and CNY 10.53·m−2·yr−1, respectively. Contrary to the construction cost and initial investment, the FIW-GSG exhibited a 0.77% higher net LCC than the CW-GSG. This resulted from the CW-GSG’s larger residual value contribution: its reinforced concrete foundations and walls (50-year service life) remained reusable for new construction after decommissioning [46]. Conversely, the flexible insulation wall (10-year service life) of the FIW-GSG yielded negligible residual value, despite its lower initial investment.

3.3. LCC of Greenhouse Tomato Cultivation

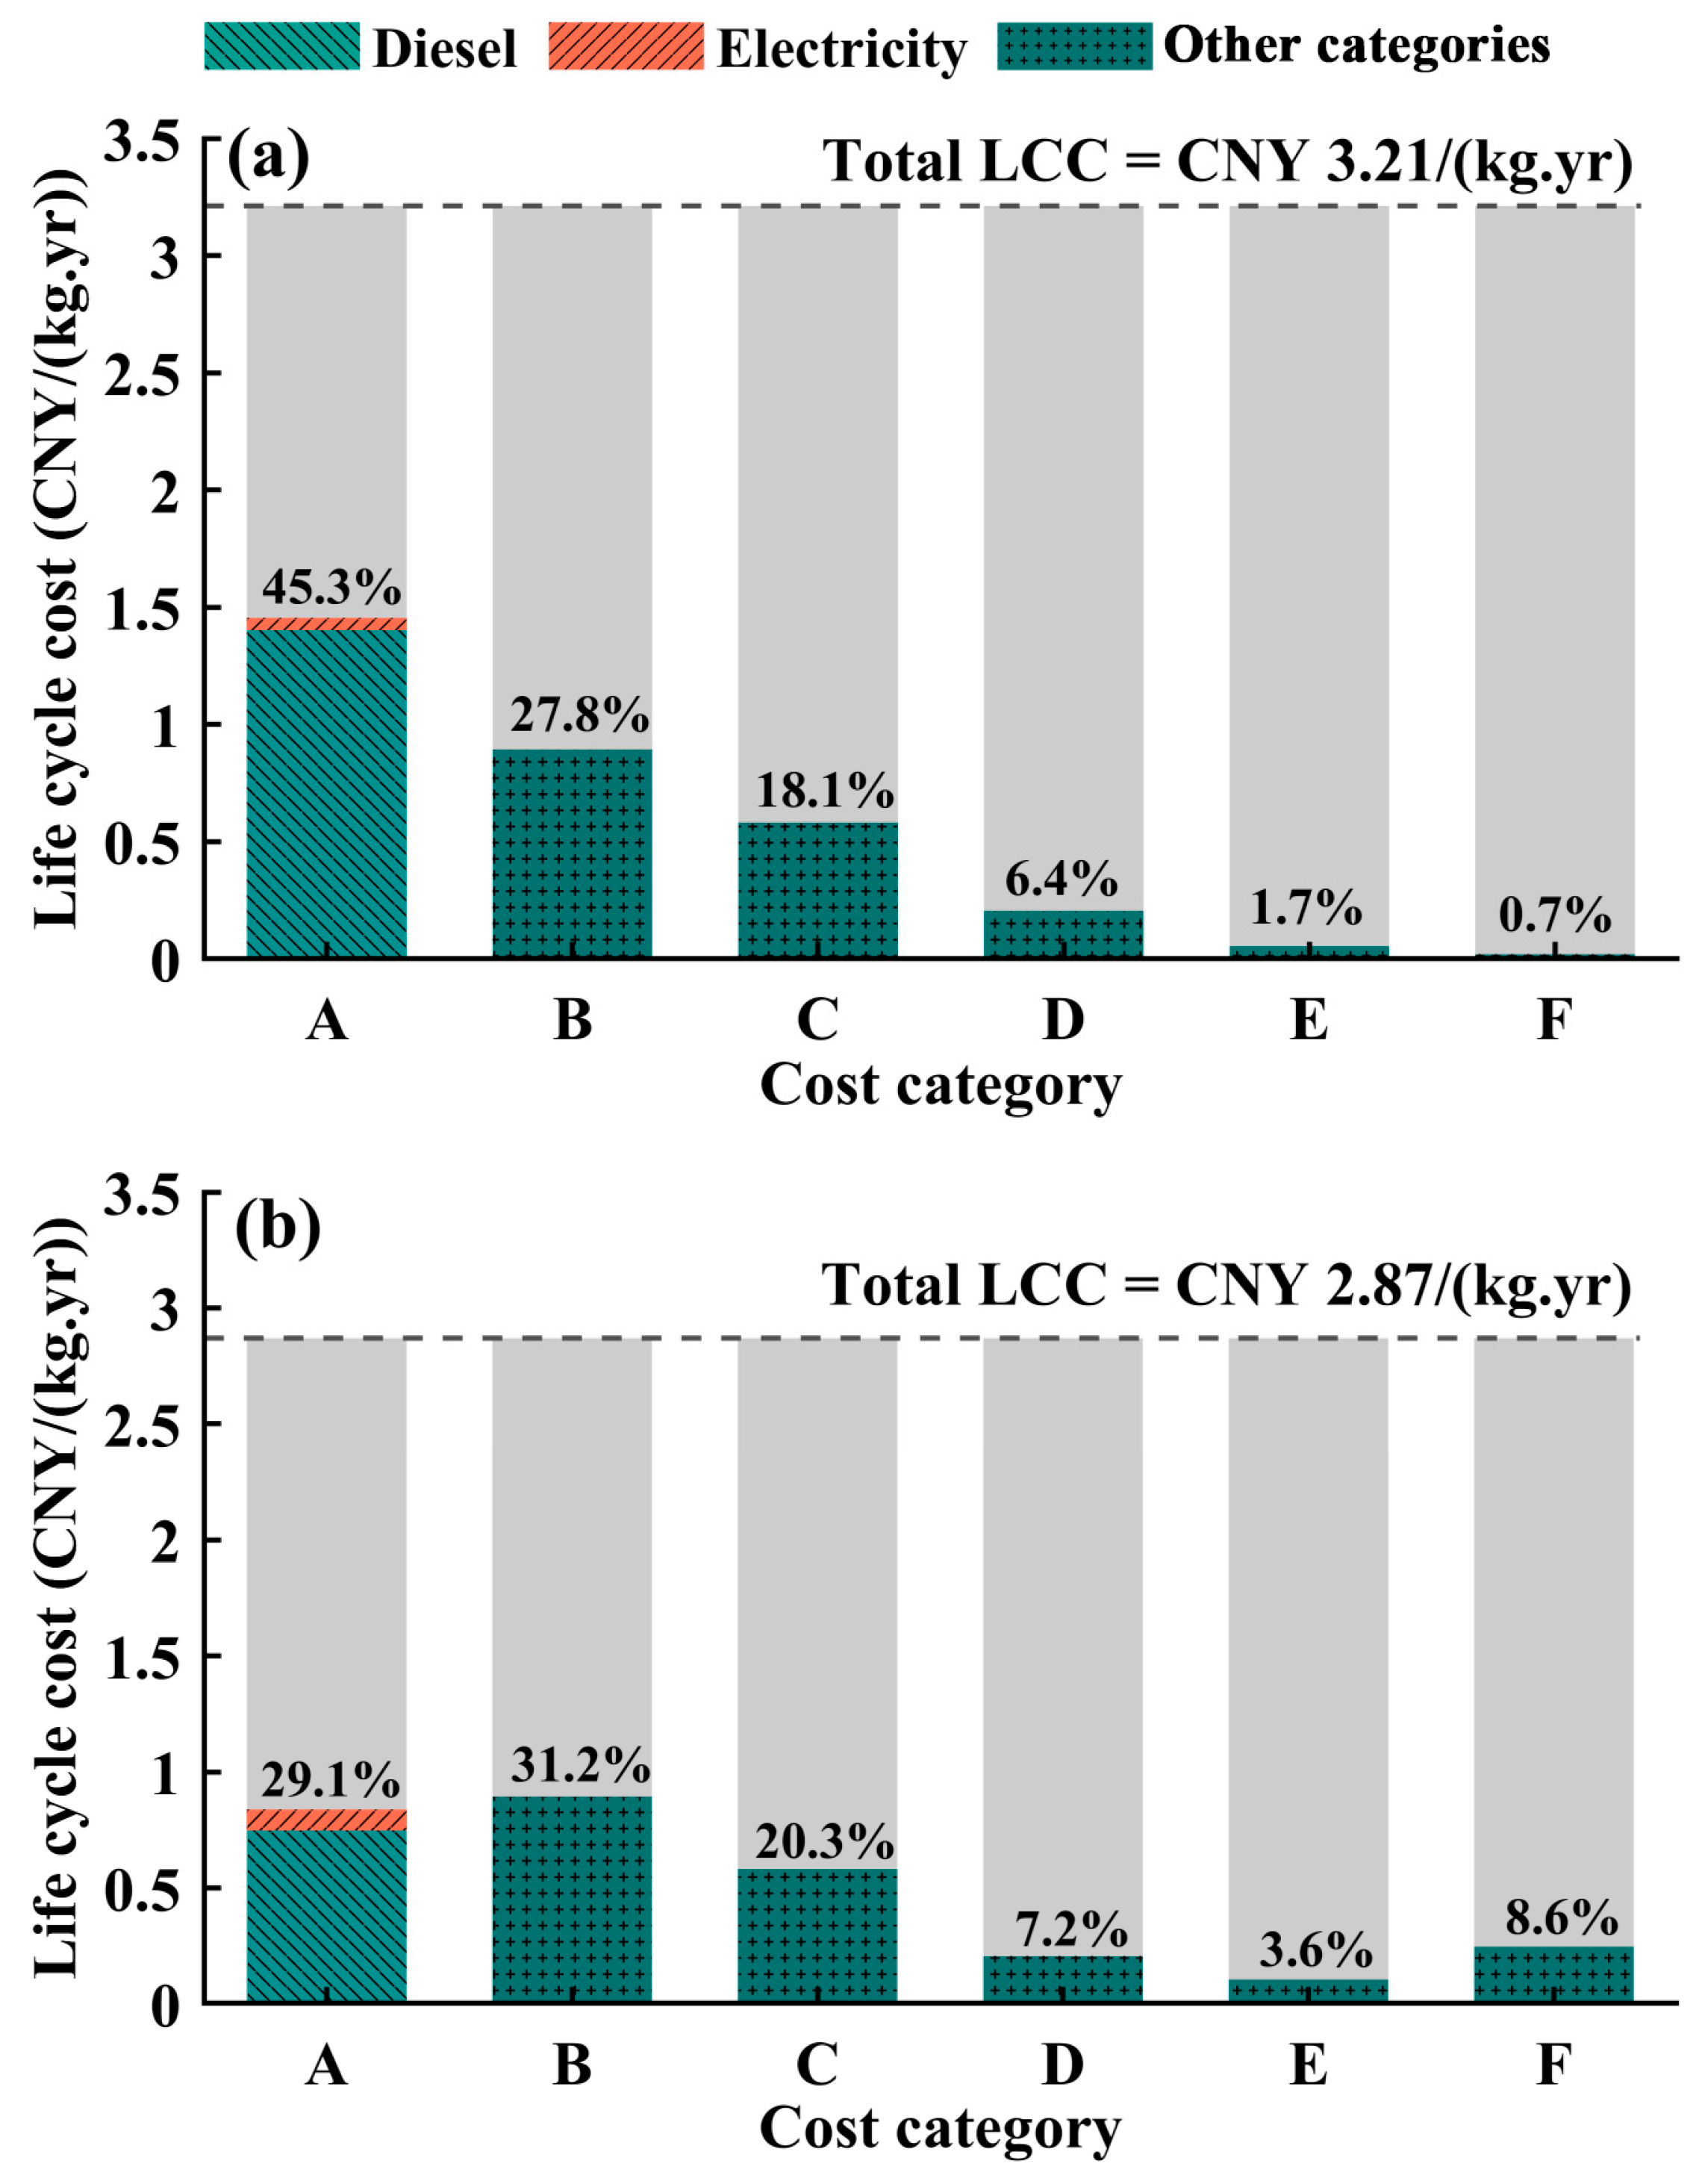
The LCC for tomato cultivation in both the CW-GSG and FIW-GSG systems was depicted in Figure 8, with cost category contributions explicitly quantified. In the CW-GSG, energy costs dominated LCC (45.3%), with the winter heating diesel exceeding 96% of this category. Crop management and agricultural inputs represented secondary and tertiary contributions at 27.8% and 18.1%, respectively; the former covered direct and indirect cultivation materials, while the latter denoted labor expenditures. Greenhouse rental fees accounted for 6.4%, followed by auxiliary equipment (1.7%) and greenhouse structural maintenance (0.7%). However, tomato cultivation in the FIW-GSG presented a distinct cost distribution, with crop management costs dominating at 31.2%, followed by energy consumption (29.1%), agricultural inputs (20.3%), structural maintenance (8.6%), rental fees (7.2%), and auxiliary equipment (3.6%). Notably, winter heating diesel accounted for 89.5% of the energy costs.
The LCC difference for tomato cultivation between the two GSG systems manifested primarily in energy consumption and structural maintenance. Compared to the CW-GSG, the FIW-GSG reduced energy expenses for tomato cultivation by 42.6%, with diesel expenditures falling 46.7% due to integrated active solar thermal systems that efficiently used solar radiation for winter heating, although electricity consumption increased by 65.0%. Structural maintenance costs rose 11.2-fold due to decadal envelope replacements, and auxiliary equipment costs elevated by 94.3% from component renewals for the active solar thermal systems. Ultimately, the tomato cultivation LCC reached CNY 3.21·kg−1·yr−1 in the CW-GSG and CNY 2.87·kg−1·yr−1 in the FIW-GSG. Despite the increased equipment and maintenance costs in the FIW-GSG, energy savings fully offset these increments, yielding a 10.6% LCC reduction and indicating enhanced sustainability.

3.4. Cost Performance Assessment Results

3.4.1. Assessment from a Construction Company Perspective

Cost performance assessment necessitates incorporating income streams. For construction companies, greenhouse infrastructure income came from government subsidies upon completion and annual greenhouse rent payments. Table 4 details the annual cash flows and discounted values across the design lifespans of the CW-GSG and FIW-GSG’s infrastructures. The annual costs during the bank repayment period were derived from the GSG’s initial investment. In the terminal year, the infrastructure residual values fully covered the decommissioning costs. The cumulative NPVs reached CNY 14,907.8 and CNY 35,233.7 for the CW-GSG and FIW-GSG systems, respectively. As defined by our sign convention (costs as positive values, incomes as negative values), these positive values indicated that construction companies could not obtain profits from the greenhouse infrastructure under the current operations, particularly for the FIW-GSG, which incurred 1.36-fold higher losses than the CW-GSG, due to a low residual value. Such financial outcomes may deter construction companies from engaging in GSG projects, thereby undermining local agricultural sustainability objectives. Consequently, operational model optimizations are needed to improve profitability.

3.4.2. Assessment from a Farmer Greenhouse Contractor Perspective

Tomato sales provided the income for farmer contractors. Annual cash flows and discounted values across the GSGs’ design lifespans are presented in Table 5. Annual costs included materials, transportation, labor, and rent, with annual price escalation rates of 2.1%, 2.6%, 4.6%, and 3.1%, respectively. Tomato yield averaged 20,000 kg annually, with seasonal pricing at CNY 5.77·kg−1 (winter–spring) and CNY 3.74·kg−1 (summer–autumn), and a 3.1% annual price escalation applied [34,35]. The cumulative NPVs reached CNY −355,615.4 and CNY −542,289.2 in the CW-GSG and FIW-GSG systems, respectively. As defined by our sign convention, these negative values demonstrated that both tomato cultivation systems achieved profitability, with tomato cultivation in the FIW-GSG generating 52.5% higher cumulative profits than that in the CW-GSG, due to lower heating energy demand. Over 90% of operational years were profitable (negative NPV), indicating economic stability. Losses (positive NPV) occurred only in Years 1, 11, and 21, coinciding with the initial investments and major maintenance activities. Therefore, targeted subsidies are recommended during those years of loss to ensure the GSG tomato production continuity.

3.4.3. Comprehensive Assessment

The whole-system cost performance was further assessed and compared through integrating all costs and incomes across both analysis scopes, in which the greenhouse rental fees transferred between construction companies and farmers were eliminated. The consolidated cumulative net present values were determined as CNY −340,707.5 and CNY −507,055.4 for the CW-GSG and FIW-GSG tomato production systems, respectively. Profitability was demonstrated by both systems, with a 48.8% enhancement in profitability achieved by the FIW-GSG relative to the CW-GSG.

3.5. Sensitivity Analysis

We examined the impact of economic fluctuations on the GSG construction costs and on the NPV of the GSG tomato production systems over their full life cycle. The results of the Monte Carlo simulation confirmed the robustness of our deterministic findings. The 95% credible interval for the construction cost of the CW-GSG was [CNY 261,747.2, CNY 327,756.2], while that for the FIW-GSG was [CNY 218,423.03, CNY 278,546.63] (Figure 9). Across all 10,000 Monte Carlo iterations, concrete-layered wall cost and steel framework cost remained the primary cost drivers for the CW-GSG and FIW-GSG, respectively.
Figure 10 presents the sensitivity of the greenhouse infrastructure NPV to variations in key economic factors. The analysis revealed that the NPV for both greenhouse types was predominantly sensitive to financial parameters rather than direct production costs. The annual discount rate emerged as the most influential factor, followed by greenhouse rental income. An increase in the discount rate significantly increased the NPV and reduced profitability, indicating that the long-term asset’s vulnerability to financial risk was heightened. Conversely, greenhouse rent demonstrated a strong negative correlation with NPV, reflecting its role as the core income stream.
Figure 11 illustrates the sensitivity of the GSG tomato cultivation NPV to economic factor fluctuations. The results indicated that, among all factors evaluated, changes in tomato market prices had the most pronounced impact on the NPV, establishing it as the primary economic driver for the GSG tomato cultivation. Furthermore, tomato cultivation in the FIW-GSG consistently demonstrated higher profitability across scenarios, highlighting the critical value of technological innovation in enhancing economic performance.

4. Discussion

4.1. Comparison of Greenhouse Heating Demands

This study employed a BES tool to simulate the dynamic heating demands during overwintering tomato cultivation in the CW-GSG and FIW-GSG located in Jiuquan City within the Hexi Corridor. The results presented in Section 3.1 indicated that the CW-GSG’s cumulative heating demand reached 195,570 MJ (equivalent to 244.46 MJ·m−2), substantially lower than the conventional Venlo-type greenhouses in Italy (971.98 MJ·m−2) [53] and South Korea (908.82 MJ·m−2) [31]. These significant gaps stemmed not only from the different climatic conditions, with the mean daily minimum temperature during the heating periods measured −8.1 °C in Jiuquan City, 1.1 °C in Chungcheongnam-do, South Korea, and 7.8 °C in Crotone, Italy, but were primarily attributable to the concrete-layered wall of the CW-GSG. This thermal mass wall employed a spatial-temporal energy transfer strategy, which absorbed and stored solar heat during the daytime and released it during cold periods to offset greenhouse heat losses [5,6]. Furthermore, the Gobi Desert regions in the Hexi Corridor feature abundant solar energy resources, with annual cumulative solar radiation exceeding 6.1 GJ·m−2 and a sunshine duration of >3000 h, aligning perfectly with the operational requirements of the GSGs [8]. Consequently, these factors enable the CW-GSG to leverage natural resources for creating a suitable growth environment for crops while enhancing agricultural productivity in the Hexi Corridor regions with limited arable land.
The FIW-GSG system demonstrated a 52.6% reduction in the cumulative heating demand (92,654 MJ, equivalent to 115.82 MJ·m−2) relative to the CW-GSG during overwintering tomato cultivation. Although employing lightweight flexible composites in its envelope, the FIW-GSG’s integrated active solar thermal systems exhibited superior heat storage/release performance compared to the passive thermal mass wall in the CW-GSG. Critically, without these active systems, the theoretical heating demand of the FIW-GSG would reach 237,350 MJ, indicating that the active solar thermal systems supplied 60% of the total thermal requirement. These findings were consistent with existing literature. In a brick-walled greenhouse in Beijing, an auxiliary solar water heating system increased the indoor night air temperature by 3.7 °C [21]. In a GSG in Jiuquan, an active solar heating soil heat storage system combining solar flat plate collectors and horizontal buried pipes increased the effective accumulated temperature by 40% [22]. Both our results and prior research confirm that the implementation of active solar thermal systems considerably enhances solar utilization efficiency, improves thermal environments, and reduces heating demands in the Chinese solar greenhouses.

4.2. Main Cost Drivers

This study quantitatively estimated the LCC of greenhouse infrastructure and tomato production for the two GSGs in the Hexi Corridor, identifying main cost drivers for both systems. Within the greenhouse infrastructure scope, material acquisition costs dominated the total LCC, exceeding 50% in both the CW-GSG and FIW-GSG. This aligned with Madhusudanan et al. [54] and Sanyé-Mengual et al. [29], who reported materials as the primary component of construction cost when operation phase was excluded.
For the greenhouse tomato cultivation, three main cost drivers were responsible for 90% of the total LCC for tomato cultivation in the CW-GSG: Energy (45.3%), crop management (27.8%), and agricultural inputs (18.1%). In the FIW-GSG, four main drivers emerged: crop management (31.2%), energy (29.1%), agricultural inputs (20.3%), and structural maintenance (8.6%), collectively comprising 89.2% of its total LCC. Energy costs primarily stemmed from diesel heating during overwintering, quantified at CNY 1.46·kg−1·yr−1 in the GW-SGS and CNY 0.84·kg−1·yr−1 in the FIW-GSG, representing 96% and 89.5% of the total energy cost, respectively. Crop management specifically denoted labor expenditures for cultivation activities. These findings partially concurred with Paksoy et al.’s report from Turkey, where heating costs exceeded 60% of the total greenhouse production costs [3]. However, the lower proportional heating costs in the CW-GSG (45.3%) and FIW-GSG (29.1%) reflected the effectiveness of the thermal mass wall and active solar thermal systems in reducing dependency on external energy purchases. Notably, Ahamed et al. identified labor as the primary cost driver in Canadian greenhouse tomato production at 31.6%, with energy secondary at 27.4% [32]. This cost category distribution closely mirrored our results in the FIW-GSG. However, their greenhouse system exhibited substantially higher annual heating requirements (1486 MJ·m−2) compared to the FIW-GSG’s 115.82 MJ·m−2. This indicated significantly higher labor inputs per unit greenhouse tomato output in the Canadian context. This discrepancy primarily arose from operational differences: farmers in the Hexi Corridor self-managed all activities except critical agronomic operations, thereby rendering associated labor costs beyond our analysis scope.

4.3. Suggestions Related to the GSG Operational Model

This study assessed the long-term cost performance of the GSG tomato production systems from both the construction company’s and the farmer greenhouse contractors’ perspectives. The results indicated that, under the current facility-lease farming model, the construction company cannot generate profit from leasing the greenhouse infrastructure, even with government subsidies provided for construction. In contrast, farmers achieved sufficient profitability, with cumulative profits for tomato production in the FIW-GSG being 52.5% higher than in the CW-GSG, due to lower heating costs in the FIW-GSG. However, this uneven profit distribution discourages the construction companies and deters their participation in future GSG projects, thereby hindering the achievement of local agricultural sustainability goals. Therefore, we recommend optimizing the GSG operation model by increasing the annual greenhouse rental fee to balance profit distribution.
Figure 12 illustrates the profit allocation between the construction company and the farmer contractors over the entire life cycle of the GSGs under varying annual rental fees. For the CW-GSG and FIW-GSG, the construction company can achieve a break-even point when the annual rent is increased to CNY 5722 and CNY 6707, respectively. An equal profit distribution between the parties can be achieved when the annual rent is set at CNY 13,975 for the CW-GSG and CNY 18,985 for the FIW-GSG. However, excessively high rents may cause farmers to face significant financial pressure during the initial production phase. Therefore, it is recommended that the government introduce relevant subsidy measures. It is also advised to optimize the greenhouse structural design to improve efficiency and reduce construction costs.

5. Conclusions

This study quantitatively assessed the life-cycle cost performance for the conventional CW-GSG and innovative FIW-GSG tomato production systems in China’s Hexi Corridor, integrating the BES tool and NPV method within the life-cycle costing framework. Assessments were stratified by stakeholder under the prevailing facility-lease farming model. From the construction company’s perspective, the greenhouse infrastructure LCC was marginally lower in the CW-GSG (CNY 10.45·m−2·yr−1) than in the FIW-GSG (CNY 10.53·m−2·yr−1), due to the higher residual value of concrete-layered wall. For farmer greenhouse contractors, the tomato cultivation LCC was reduced by 10.6 in the FIW-GSG (CNY 2.87·kg−1·yr−1) compared to the CW-GSG (CNY 3.21·kg−1·yr−1), resulting from a 52.6% decrease in heating energy demand during overwintering cultivation. Under the facility-lease farming model, construction companies incurred non-viable returns over the entire life cycle of both the GSG systems, while farmers achieved substantial profits. The tomato cultivation in the FIW-GSG generated 52.5% higher cumulative profits than in the CW-GSG, attributable to significant heating energy conservation.
The results demonstrated the feasibility of utilizing FIW-GSGs for tomato cultivation in the Hexi Corridor, with the reduced heating demand and enhanced cost performance validating the economic advantages driven by technological innovations. Furthermore, the imbalanced profit distribution under the current GSG operational model was revealed. We recommend optimizing the GSG operation mechanism to balance stakeholder benefits and advance sustainable Gobi agriculture. It is worth notice that this study primarily focused on the economic feasibility and stakeholder benefits of the GSG tomato production systems, but did not incorporate environmental aspects. Future studies should adopt a fully coupled BES model to integrate dynamic environmental interactions, therefore exploring the life-cycle environmental footprint of different GSG production systems and developing strategies to reduce resource consumption and environmental burdens.

Author Contributions

Conceptualization, J.X.; methodology, X.Z. and J.X.; software, X.Z.; validation, X.Z. and N.M.; formal analysis, X.Z. and J.Z.; investigation, X.Z.; resources, J.X.; data curation, N.M. and Y.C.; writing—original draft preparation, X.Z.; writing—review and editing, J.Z. and J.L.; visualization, N.M. and Y.C.; funding acquisition, X.Z. and J.X. All authors have read and agreed to the published version of the manuscript.

Funding

This research was funded by the National Natural Science Foundation of China (grant number 32402660) and the Research Start-up Funds of Gansu Agricultural University (grant number GAU-KYQD-2020-9).

Institutional Review Board Statement

Not applicable.

Data Availability Statement

The original contributions presented in this study are included in the article. Further inquiries can be directed to the corresponding author.

Conflicts of Interest

The authors declare no conflicts of interest.

Abbreviations

The following abbreviations are used in this manuscript:
ATotal solar energy collector area (m2)
caSpecific heat capacity of air (kJ·kg−1·K−1)
cwSpecific heat capacity of water (kJ·kg−1·K−1)
csSpecific heat capacity of soil (kJ·kg−1·K−1)
CCost in the base year (CNY)
DExternal diameter of pipe (m)
dDate sequence
FCCosts occurred in the future (CNY)
feEscalation rate
fdAnnual discount rate
hinConvective heat transfer coefficient internal the solar energy collector (W·m−2·K−1)
houtConvective heat transfer coefficient external the solar energy collector (W·m−2·K−1)
iNumber of years
IIncomes (CNY)
LcCollector length (m)
LpPipe length (m)
m c ˙ Water mass flow rate (kg·s−1)
McTotal water mass per collector (kg)
MDDiesel consumption (kg)
MTTotal water mass in insulated storage tank (kg)
ncNumber of collectors
npPipe quantity
NPVNet present value (CNY)
NuNusselt number of airflows
PPeriod of analysis (year)
PrPrandtl number of waters
QaSpace heat gain from air exchange between indoor and outdoor (kJ·h−1)
QgHeat transfer via ground (kJ·h−1)
QnrHeat transfer via north roof (kJ·h−1)
QsrHeat transfer via south roof (kJ·h−1)
QwHeat transfer via wall (kJ·h−1)
Qsys_airHeat contribution from subsurface solar air heating system (kJ·h−1)
Qsys_waterHeat contribution from solar water heating system (kJ·h−1)
RaThermal resistance of airflow (K·m−2·W −1)
RpThermal resistance of pipe wall (K·m−2·W −1)
RsThermal resistance of soil media (K·m−2·W −1)
ReReynolds number of water flow
Sc_surSolar radiation flux incident (W·m−2)
tTime
THThermal load of Gobi solar greenhouse (kJ·h−1)
THdDaily heating load (kJ·day−1)
T i n t Indoor air temperature (°C)
T c _ i n t Collector inlet water temperature (°C)
T c _ o u t t Collector outlet water temperature (°C)
T c _ s u r t Collector surface temperature (°C)
TEAverage surface temperature of the greenhouse envelope (°C)
Tp_outInlet air temperature of subsurface heat-exchange pipe (°C)
Tp_inOutlet air temperature of subsurface heat-exchange pipe (°C)
TsSoil temperature (°C)
UOverall heat transfer coefficient (K·m−2·W −1)
δWall thickness of pipe (m)
εEmissivity of the collector surface
ηcSolar radiation collection efficiency
ηhWork efficiency of a diesel-fired air heater
λaHeat conductivity of air (W·m−2·K−1)
λpHeat conductivity of pipe wall (W·m−2·K−1)
λsHeat conductivity of soil media (W·m−2·K−1)
λwHeat conductivity of water (W·m−2·K−1)
ρsVolume weight of soil (kg·m−3)
CW-GSGConcrete-walled Gobi solar greenhouse
FIW-GSGFlexible insulation-walled Gobi solar greenhouse
LCCLife-cycle cost

Appendix A

Table A1. Life-cycle cost inventory of the greenhouse infrastructure of a conventional concrete-walled Gobi solar greenhouse in Jiuquan City in 2024.
Life-Cycle StagesCost ItemsUnitQuantityCost (CNY)
Material procurement Concrete C25m3229.978,057.1
Steelt11.156,714.0
Rock wool-core steel sandwichm2273.024,608.2
Aluminum alloykg441.811,044.2
Bamboo plywoodm2145.56426.7
PVCkg294.02890.0
Woodm31.12119.8
Cement mortarm35.31129.3
Minor Materials--2822.0
Total 185,811.3
TransportationConcrete transit-mixer truck 12 m3hour27.15241.5
Truck 2 t4.0193.8
Truck 6 t36.14270.0
Truck 8 t15.92950.0
Total--12,654.4
On-site construction worksLaborhour5545.673,719.4
Electric winch485.312,037.4
Crawler-mounted excavator31.85194.5
AC welder138.01903.0
Concrete pump12.11124.7
Truck 6 t18.31123.0
Truck crane9.2898.4
Crawler-mounted dozer4.0472.8
Minor cost--151.2
Total--96,624.4
End-of-lifeLaborhour191.02756.2
Plasma cutter47.61493.6
Truck crane21.42049.8
Truck 8 t9.61785.6
Recycled steelt5.7−10,731.42
Recycled aluminum alloykg419.7−7134.6
In situ retained concrete components --−189,967.0
Total--−199,747.8
Table A2. Life-cycle cost inventory of the greenhouse infrastructure of an innovative flexible insulation-walled Gobi solar greenhouse in Jiuquan City in 2024.
Life-Cycle StagesCost ItemsUnitQuantityCost (CNY)
Material procurement Flexible coiled compositem266467,728.0
Steelt9.0850,581.2
Aluminum alloykg146.33658.2
Concrete C25m37.682998.2
Concrete C30m33.721339.1
Extruded polystyrene boardm34.01339.7
Waterproof geotextilem2264.0924.0
Woodm30.43825.4
Solar water heating system-120,841.0
Subsurface solar air heating system-111,413.9
Minor Materials--1689.7
Total 163,338.4
TransportationConcrete transit-mixer truck 4 m3hour4.0471.7
Truck 2 t8.0387.5
Truck 10 t22.83916.3
Box truck 9.6 m72.017,000.0
Flatbed semi-trailer 9.6 m13.02766.0
Total--24,541.5
On-site construction worksLaborhour3152.841,911.6
Electric winch485.312,037.4
Crawler-mounted excavator20.63376.3
AC welder170.22300.3
Pile driver3.9454.0
Crawler-mounted dozer2.6307.7
Truck 6 t2.9180.6
Total--60,567.9
End-of-lifeLaborhour251.83634.7
Plasma cutter62.71969.6
Truck crane28.22703.1
Truck 8 t15.02794.7
Recycled steelt7.49−14,151.66
Recycled aluminum alloykg139.0−2363.2
In situ retained concrete components --−24,253.8
Total--−27,303.4
Table A3. Life-cycle cost inventory of the tomato cultivation in a conventional concrete-walled Gobi solar greenhouse in Jiuquan City throughout the entire life cycle (30 years).
Cost CategoriesCost ItemsUnitService Life (Years)Total QuantityUnit Price in 2024 (CNY)Net Present Value of Total Cost (CNY)
Auxiliary equipmentBlanket-rolling machinery
Motor-1031500.02789.8
Steel component-3013563.73563.7
Truck 6 ttimes--330.0330.0
film-rolling device
Electric-drive device-56735.02903.7
Hand-drive device-5659.5235.1
Integrated fertigation system
Water storage tank (Steel)-3011400.01400.0
Centrifugal filter-103540.01004.3
Water pump-103756.01406.1
Fertilizer canister-518150.01642.8
Drip pilem5762.011.455308.0
Drip tapem56072.00.15554.9
Tee-junction-5690.01.50629.7
Solenoid valve-512.0160.001168.2
Heating device
Diesel-fired air heater-3022240.04480.0
Total----27,416.3
Agricultural inputsInsulating blanketm2102880.820.041,480.0
Cladding filmkg21380.021.418,397.0
Mulching filmkg1432.012.01585.6
Growth substratem312400.030.044,045.0
Seedling-0.5144,000.00.5044,045.0
Fertilizerkg-13,200.07.5060,929.0
Pesticidetimes-30090.016,517.0
Irrigation waterm3-37,500.01.5034,410.0
Clamping rail m28730.03.5019,042.0
Wire meshm25960.08.505372.8
Inset netm223285.02.004094.4
Tension ropem56000.00.20592.6
Box truck 6.4 mtimes--9002012.3
Total 292,522.7
Crop managementLaborday-1800.0150.0449,430.0
Total----449,430.0
Greenhouse structure maintenanceAntirust paintkg10165.118.51767.7
White spiritkg-17.38.079.6
Fire-proof paintkg1096.5426.71494.6
Boiled oilkg-8.915.981.8
Abrasive papersheet-327.60.7132.8
Laborhour-563.514.46680.5
Total ---10,237.0
Energy consumptionElectricitykWh-99,196.80.4426,633.0
Dieselkg-167,564.46.88705,230.0
Total ---731,863.0
Table A4. Life-cycle cost inventory of the tomato cultivation in an innovative flexible insulation-walled Gobi solar greenhouse in Jiuquan City throughout the entire life cycle (30 years).
Cost CategoriesCost ItemsUnitService Life (Years)Total QuantityUnit Price in 2024 (CNY)Net Present Value of Total Cost (CNY)
Auxiliary equipmentBlanket-rolling machinery
Motor-1031500.02789.8
Steel component-3013563.73563.7
Truck 6 ttimes--330.0330.0
film-rolling device
Electric-drive device-56735.02903.7
Hand-drive device-5659.5235.1
Integrated fertigation system
Water storage tank (Steel)-3011400.01400.0
Centrifugal filter-103540.01004.3
Water pump-103756.01406.1
Fertilizer canister-518150.01642.8
Drip pilem5762.011.455308.0
Drip tapem56072.00.15554.9
Tee-junction-56901.50629.7
Solenoid valve-512160.001168.2
Heating device
Diesel-fired air heater-3022240.04480.0
Solar water heating system
Controller-1023000.03479.6
Water pump-1041512.01753.7
Collector-101608000.09279.0
Rubber insulation boardm31027.64134.04794.9
High-density polyethylenem210240.0336.0389.7
High-Tenacity PVC Tarpaulinm2103282296.02663.1
Clamping rail-10320.0560.0649.5
PPR pipe Ø50 mmm1014.0144.1167.1
PPR pipe Ø32 mmm10160.0709.8823.3
PE pipe Ø20 mmm1080.0149.1173.0
Laborhour-17.814.41689.8
Total----53,279.0
Agricultural inputsInsulating blanketm2102880.820.041,480.0
Cladding filmkg21380.021.418,397.0
Mulching filmkg1432.012.01585.6
Growth substratem312400.030.044,045.0
Seedling-0.5144,000.00.5044,045.0
Fertilizerkg-13,200.07.5060,929.0
Pesticidetimes-30090.016,517.0
Irrigation waterm3-37,500.01.5034,410.0
Clamping rail systemm28730.03.5019,042.0
Wire meshm25960.08.505372.8
Inset netm223285.02.004094.4
Tension ropem56000.00.20592.6
Box truck 6.4 mtimes--9002012.3
Total 292,522.7
Crop managementLaborday-1800.0150.0449,430.0
Total----449,430.0
Greenhouse structure maintenanceAntirust paintkg10204.518.52190.0
White spiritkg-21.48.098.6
Fire-proof paintkg10119.626.71851.6
Boiled oilkg-11.015.9101.3
Abrasive papersheet-406.30.7164.7
Flexible coiled compositem2101328.0102.078,556.0
Extruded polystyrene boardm210240.02.8389.7
Waterproof geotextilem210528.03.51071.7
Axial fan-108518.02403.3
Laborhour-699.714.416,590.3
Box truck 9.6 mhour-144.017,000.021,011.0
Total ---124,428.3
Energy consumptionElectricitykWh-145,471.70.4443,945.0
Dieselkg-79,386.06.88375,920.0
Total ---419,865.0

References

  1. Katzin, D.; Marcelis, L.F.M.; van Henten, E.J.; van Mourik, S. Heating greenhouses by light: A novel concept for intensive greenhouse production. Biosyst. Eng. 2023, 230, 242–276. [Google Scholar] [CrossRef]
  2. Trépanier, M.-P.; Gosselin, L.; Jørgensen, B.N. Best combinations of energy-efficiency measures in greenhouses considering energy consumption, yield, and costs: Comparison between two cold climate cities. Appl. Energy 2025, 382, 125163. [Google Scholar] [CrossRef]
  3. Paksoy, M.; Türkmen, Ö.; Direk, M. Importance of geothermal water using for greenhouse heating in Turkey. Selcuk J. Agric. Food Sci. 2010, 24, 50–53. [Google Scholar]
  4. Rezaei, F.; Burg, V.; Solgi, H.; Hellweg, S.; Roshandel, R. Spatiotemporal assessment of the cumulative exergy demand of agricultural greenhouse production with industrial symbiosis. Ecol. Indic. 2024, 169, 112904. [Google Scholar] [CrossRef]
  5. Ahamed, M.S.; Guo, H.; Tanino, K. Modeling heating demands in a Chinese-style solar greenhouse using the transient building energy simulation model TRNSYS. J. Build. Eng. 2020, 29, 101114. [Google Scholar] [CrossRef]
  6. Tian, J.; Li, K.; Lin, T.; Li, Y.; He, M.; Li, T.; Liu, X. Wall structural optimization and thermal performance analysis of sunken solar greenhouse. Appl. Therm. Eng. 2025, 279, 127528. [Google Scholar] [CrossRef]
  7. Boost Facility-Based Crop Cultivation to Ensure Stable and Diverse Food Supply. Available online: https://jhs.moa.gov.cn/gzdt/202412/t20241212_6467889.htm (accessed on 1 March 2025).
  8. Xie, J.; Yu, J.; Chen, B.; Feng, Z.; Lyu, J.; Hu, L.; Gan, Y.; Siddique, K.H.M. Gobi agriculture: An innovative farming system that increases energy and water use efficiencies. A review. Agron. Sustain. Dev. 2018, 38, 62. [Google Scholar] [CrossRef]
  9. Xie, J.; Yu, J.; Chen, B.; Feng, Z.; Li, J.; Zhao, C.; Lyu, J.; Hu, L.; Gan, Y.; Siddique, K.H.M. Chapter One—Facility Cultivation Systems “设施农业”: A Chinese Model for the Planet. Adv. Agron. 2017, 145, 1–42. [Google Scholar] [CrossRef]
  10. Zhang, Z.; Dong, Z.; Li, J.; Qian, G.; Jiang, C. Implications of surface properties for dust emission from gravel deserts (gobis) in the Hexi Corridor. Geoderma 2016, 268, 69–77. [Google Scholar] [CrossRef]
  11. Yin, X.; Zhang, G.; Zhao, W.; Cui, H.; Yang, M.; Jiang, H. Construction technology of stone-built wall-digging type solar greenhouses under non-cultivated land in Northwest China. China Veg. 2013, 11, 50–52. [Google Scholar]
  12. Chai, Z.; Cui, H.; Zhang, G. Construction technology of solar greenhouses with flange walls in the Gobi Desert of the Hexi Corridor. Shanghai Veg. 2019, 3, 70–71. [Google Scholar]
  13. Guo, Z.; Wang, L.; Wang, J. Research on rural revitalization planning based on the integrated development of “production, life, and ecology”: A case of dongdong town in Suzhou District, Jiuquan. Urban. Archit. 2022, 19, 04–07. [Google Scholar] [CrossRef]
  14. Zhang, X.; Lv, J.; Dawuda, M.M.; Xie, J.; Yu, J.; Gan, Y.; Zhang, J.; Tang, Z.; Li, J. Innovative passive heat-storage walls improve thermal performance and energy efficiency in Chinese solar greenhouses for non-arable lands. Sol. Energy 2019, 190, 561–575. [Google Scholar] [CrossRef]
  15. Li, H.; Mi, X.; Shi, J.; Zhang, Y.; Zhang, G. The model and effects of renovating old greenhouses for facility vegetables in the Jiuquan Gobi Desert. China Veg. 2024, 9, 142–146. [Google Scholar] [CrossRef]
  16. Wang, C.; Fang, H.; Zhang, Y.; Sang, S.; Cao, K. Energy consumption analysis of simply soft insulated wall-assembled Chinese solar greenhouse. Trans. CSAE 2023, 39, 190–197. [Google Scholar] [CrossRef]
  17. Zhou, C.; Gao, H.; Li, Y.; Zhang, B.; Li, X. An assembled solar greenhouse with active thermal storage/release system and samless self-waterproofing rubber-plastic insulation enclosure. Appl. Eng. Technol. 2022, 42, 36–45. [Google Scholar] [CrossRef]
  18. Avezova, N.R.; Samiev, K.A.; Khaetov, A.R.; Nazarov, I.M.; Ergashev, Z.Z.; Samiev, M.O.; Suleimanov, S.I. Modeling of the unsteady temperature conditions of solar greenhouses with a short-term water heat accumulator and its experimental testing. Appl. Sol. Energy 2010, 46, 4–7. [Google Scholar] [CrossRef]
  19. Kumar Agrawal, K.; Yadav, T.; Misra, R.; Das Agrawal, G. Effect of soil moisture contents on thermal performance of earth-air-pipe heat exchanger for winter heating in arid climate: In situ measurement. Geothermics 2019, 77, 12–23. [Google Scholar] [CrossRef]
  20. Attar, I.; Farhat, A. Efficiency evaluation of a solar water heating system applied to the greenhouse climate. Sol. Energy 2015, 119, 212–224. [Google Scholar] [CrossRef]
  21. Lu, W.; Zhang, Y.; Fang, H.; Ke, X.; Yang, Q. Modelling and experimental verification of the thermal performance of an active solar heat storage-release system in a Chinese solar greenhouse. Biosyst. Eng. 2017, 160, 12–24. [Google Scholar] [CrossRef]
  22. Zhao, J.; Chen, F.; Wang, Y.; Wang, K.; Zhai, X.; Zhang, D. Experimental study on effect of an active solar heating soil heat storage system on the thermal environment in Gobi solar greenhouses. Energy Build. 2024, 325, 115055. [Google Scholar] [CrossRef]
  23. Poderytė, I.; Banaitienė, N.; Banaitis, A. Life Cycle Sustainability Assessment of Buildings: A Scientometric Analysis. Buildings 2025, 15, 381. [Google Scholar] [CrossRef]
  24. Shadram, F.; Bhattacharjee, S.; Lidelöw, S.; Mukkavaara, J.; Olofsson, T. Exploring the trade-off in life cycle energy of building retrofit through optimization. Appl. Energy 2020, 269, 115083. [Google Scholar] [CrossRef]
  25. Moschetti, R.; Brattebø, H. Combining Life Cycle Environmental and Economic Assessments in Building Energy Renovation Projects. Energies 2017, 10, 1851. [Google Scholar] [CrossRef]
  26. Carvalho, J.P.; Villaschi, F.S.; Bragança, L. Assessing Life Cycle Environmental and Economic Impacts of Building Construction Solutions with BIM. Sustainability 2021, 13, 8914. [Google Scholar] [CrossRef]
  27. Ökmen, Ö. Comparison of Design Alternatives Based on Lifecycle Costing: Case of an Irrigation Project in Turkey. J. Manag. Eng. 2015, 31, 05014028. [Google Scholar] [CrossRef]
  28. McKenney, D.W.; Yemshanov, D.; Fraleigh, S.; Allen, D.; Preto, F. An economic assessment of the use of short-rotation coppice woody biomass to heat greenhouses in southern Canada. Biomass Bioenergy 2011, 35, 374–384. [Google Scholar] [CrossRef]
  29. Sanyé-Mengual, E.; Oliver-Solà, J.; Montero, J.I.; Rieradevall, J. An environmental and economic life cycle assessment of rooftop greenhouse (RTG) implementation in Barcelona, Spain. Assessing new forms of urban agriculture from the greenhouse structure to the final product level. Int. J. Life Cycle Assess. 2015, 20, 350–366. [Google Scholar] [CrossRef]
  30. Peña, A.; Rovira-Val, M.R.; Mendoza, J.M.F. Life cycle cost analysis of tomato production in innovative urban agriculture systems. J. Clean. Prod. 2022, 367, 133037. [Google Scholar] [CrossRef]
  31. Decano-Valentin, C.; Lee, I.-B.; Yeo, U.-H.; Lee, S.-Y.; Kim, J.-G.; Park, S.-J.; Choi, Y.-B.; Cho, J.-H.; Jeong, H.-H. Integrated Building Energy Simulation–Life Cycle Assessment (BES–LCA) Approach for Environmental Assessment of Agricultural Building: A Review and Application to Greenhouse Heating Systems. Agronomy 2021, 11, 1230. [Google Scholar] [CrossRef]
  32. Ahamed, M.S.; Guo, H.; Taylor, L.; Tanino, K. Heating demand and economic feasibility analysis for year-round vegetable production in Canadian Prairies greenhouses. Inf. Process. Agric. 2019, 6, 81–90. [Google Scholar] [CrossRef]
  33. Jiuquan City Has Intensified Policy Support to Promote the High-Quality Development of the Tomato Industry. Available online: https://nync.jiuquan.gov.cn/nyncj/c107001/202410/e76f0426b1bb458c98da39910fced3d3.shtml (accessed on 12 December 2024).
  34. Suzhou: “Greenhouse Economy” Turns the Vegetable Basket into a Money Bag. Available online: https://baijiahao.baidu.com/s?id=1839629586413571812&wfr=spider&for=pc (accessed on 1 June 2025).
  35. National Agricultural Products Wholesale Market Price Information System. Available online: https://pfsc.agri.cn/#/marketQuotation (accessed on 1 May 2025).
  36. Qin, J.; Wang, W. Research on the interest linkage model between agricultural leading enterprises and famers in Jiuquan Gobi. Manag. Agric. Sci. Technol. 2025, 44, 85–88. [Google Scholar] [CrossRef]
  37. Zhang, X.; Xie, J.; Zhang, J.; Li, J.; Ma, N.; Mao, E. Simplified heat-transfer calculation for the trapezoidal cross-section wall in Gobi solar greenhouses and greenhouse thermal-load prediction. Biosyst. Eng. 2023, 234, 46–65. [Google Scholar] [CrossRef]
  38. Huang, L.; Deng, L.; Li, A.; Gao, R.; Zhang, L.; Lei, W. A novel approach for solar greenhouse air temperature and heating load prediction based on Laplace transform. J. Build. Eng. 2021, 44, 102682. [Google Scholar] [CrossRef]
  39. Zhang, X.; Lv, J.; Xie, J.; Yu, J.; Zhang, J.; Tang, C.; Li, J.; He, Z.; Wang, C. Solar Radiation Allocation and Spatial Distribution in Chinese Solar Greenhouses: Model Development and Application. Energies 2020, 13, 1108. [Google Scholar] [CrossRef]
  40. Mao, E.; Zhang, X.; Xie, J.; Ma, N.; Chang, Y.; Hu, S. Simulation of thermal processes and optimization of parameters for active heat storage and discharge system in solar greenhouse. Acta Agric. Zhejiangensis 2024, 36, 671–680. [Google Scholar]
  41. Fine, J.P.; Nguyen, H.V.; Friedman, J.; Leong, W.H.; Dworkin, S.B. A simplified ground thermal response model for analyzing solar-assisted ground source heat pump systems. Energy Convers. Manag. 2018, 165, 276–290. [Google Scholar] [CrossRef]
  42. Incropera, F.P. Fundamentals of Heat and Mass Transfer; John Wiley & Sons, Inc.: Hoboken, NJ, USA, 2006. [Google Scholar]
  43. Khiraiya, K.; Ramana, P.V.; Panchal, H.; Sadasivuni, K.K.; Doranehgard, M.H.; Khalid, M. Diesel-fired boiler performance and emissions measurements using a combination of diesel and palm biodiesel. Case Stud. Therm. Eng. 2021, 27, 101324. [Google Scholar] [CrossRef]
  44. ISO 15686-5; Buildings and CONSTRUCTED Assets—Service Life Planning Part 5: Life-Cycle Costing. International Organization for Standardization: Geneva, Switzerland, 2017. Available online: https://www.iso.org/standard/61148.html (accessed on 12 August 2024).
  45. DBJD25-67-2019; Gansu Province Construction and Decoration Engineering Budget Quota & Regional Base Price. Deparment of Housing and Urban-Rural Development of Gansu Province: Lanzhou, China, 2020. Available online: https://zjt.gansu.gov.cn/zjt/c108348/202105/b60ac9af9a2a42a698e3d151818fc0ec.shtml (accessed on 1 August 2023).
  46. Xu, D.; Fei, S.; Wang, Z.; Zhu, J.; Ma, Y. Optimum design of Chinese solar greenhouses for maximum energy availability. Energy 2024, 304, 131980. [Google Scholar] [CrossRef]
  47. DB61/T 1422-2021; Technical Regulations for Overwintering Tomato Cultivation in Solar Greenhouses. Shaanxi Administration for Market Regulation: Xi’an, China, 2021. Available online: https://std.samr.gov.cn/db/search/stdDBDetailed?id=D7B6451FCF28919DE05397BE0A0A6273 (accessed on 23 January 2023).
  48. Pricing Rules for Construction Projects in Gansu Province. Department of Housing and Urban-Rural Development of Gansu Province: Lanzhou, China. 2022. Available online: https://zjt.gansu.gov.cn/zjt/c108286/202209/2116822.shtml (accessed on 2 August 2023).
  49. National Bureau of Statistics of China. China Statistical Yearbook 2024; China Statistics Press: Beijing, China, 2024. Available online: https://www.stats.gov.cn/sj/ndsj/2024/indexch.htm (accessed on 12 May 2025).
  50. National Development and Reform Commission. Economic Evaluation Methods and Parameters for Construction Projects; China Planning Press: Beijing, China, 2006.
  51. Interim Measures for Investment Promotion and Industrial Development Support and Reward in Su Zhuo District. Available online: https://mp.weixin.qq.com/s?__biz=MzA4NTUzNjU3NA==&mid=2651307008&idx=3&sn=cef757dd576c2fdf06b090339b16ce0a&chksm=84256651b352ef479697f9013a99c4c078f012075194694cd22beab78c808d0462843365efc6&scene=27 (accessed on 12 July 2024).
  52. The Implementation Plan for the 2023 Modern Facility Agriculture Construction Subsidy Project and Loan Interest Subsidy in Jiuquan City. Available online: https://www.jiuquan.gov.cn/jiuquan/c111547/202310/1d85a03131b246b0ac9b5eff2843a5c6.shtml (accessed on 12 July 2024).
  53. Baglivo, C.; Mazzeo, D.; Panico, S.; Bonuso, S.; Matera, N.; Congedo, P.M.; Oliveti, G. Complete greenhouse dynamic simulation tool to assess the crop thermal well-being and energy needs. Appl. Therm. Eng. 2020, 179, 115698. [Google Scholar] [CrossRef]
  54. Madhusudanan, S.; Amirtham, L.R. Optimization of Construction Cost Using Industrial Wastes in Alternative Building Material for Walls. Key Eng. Mater. 2016, 692, 1–8. [Google Scholar] [CrossRef]
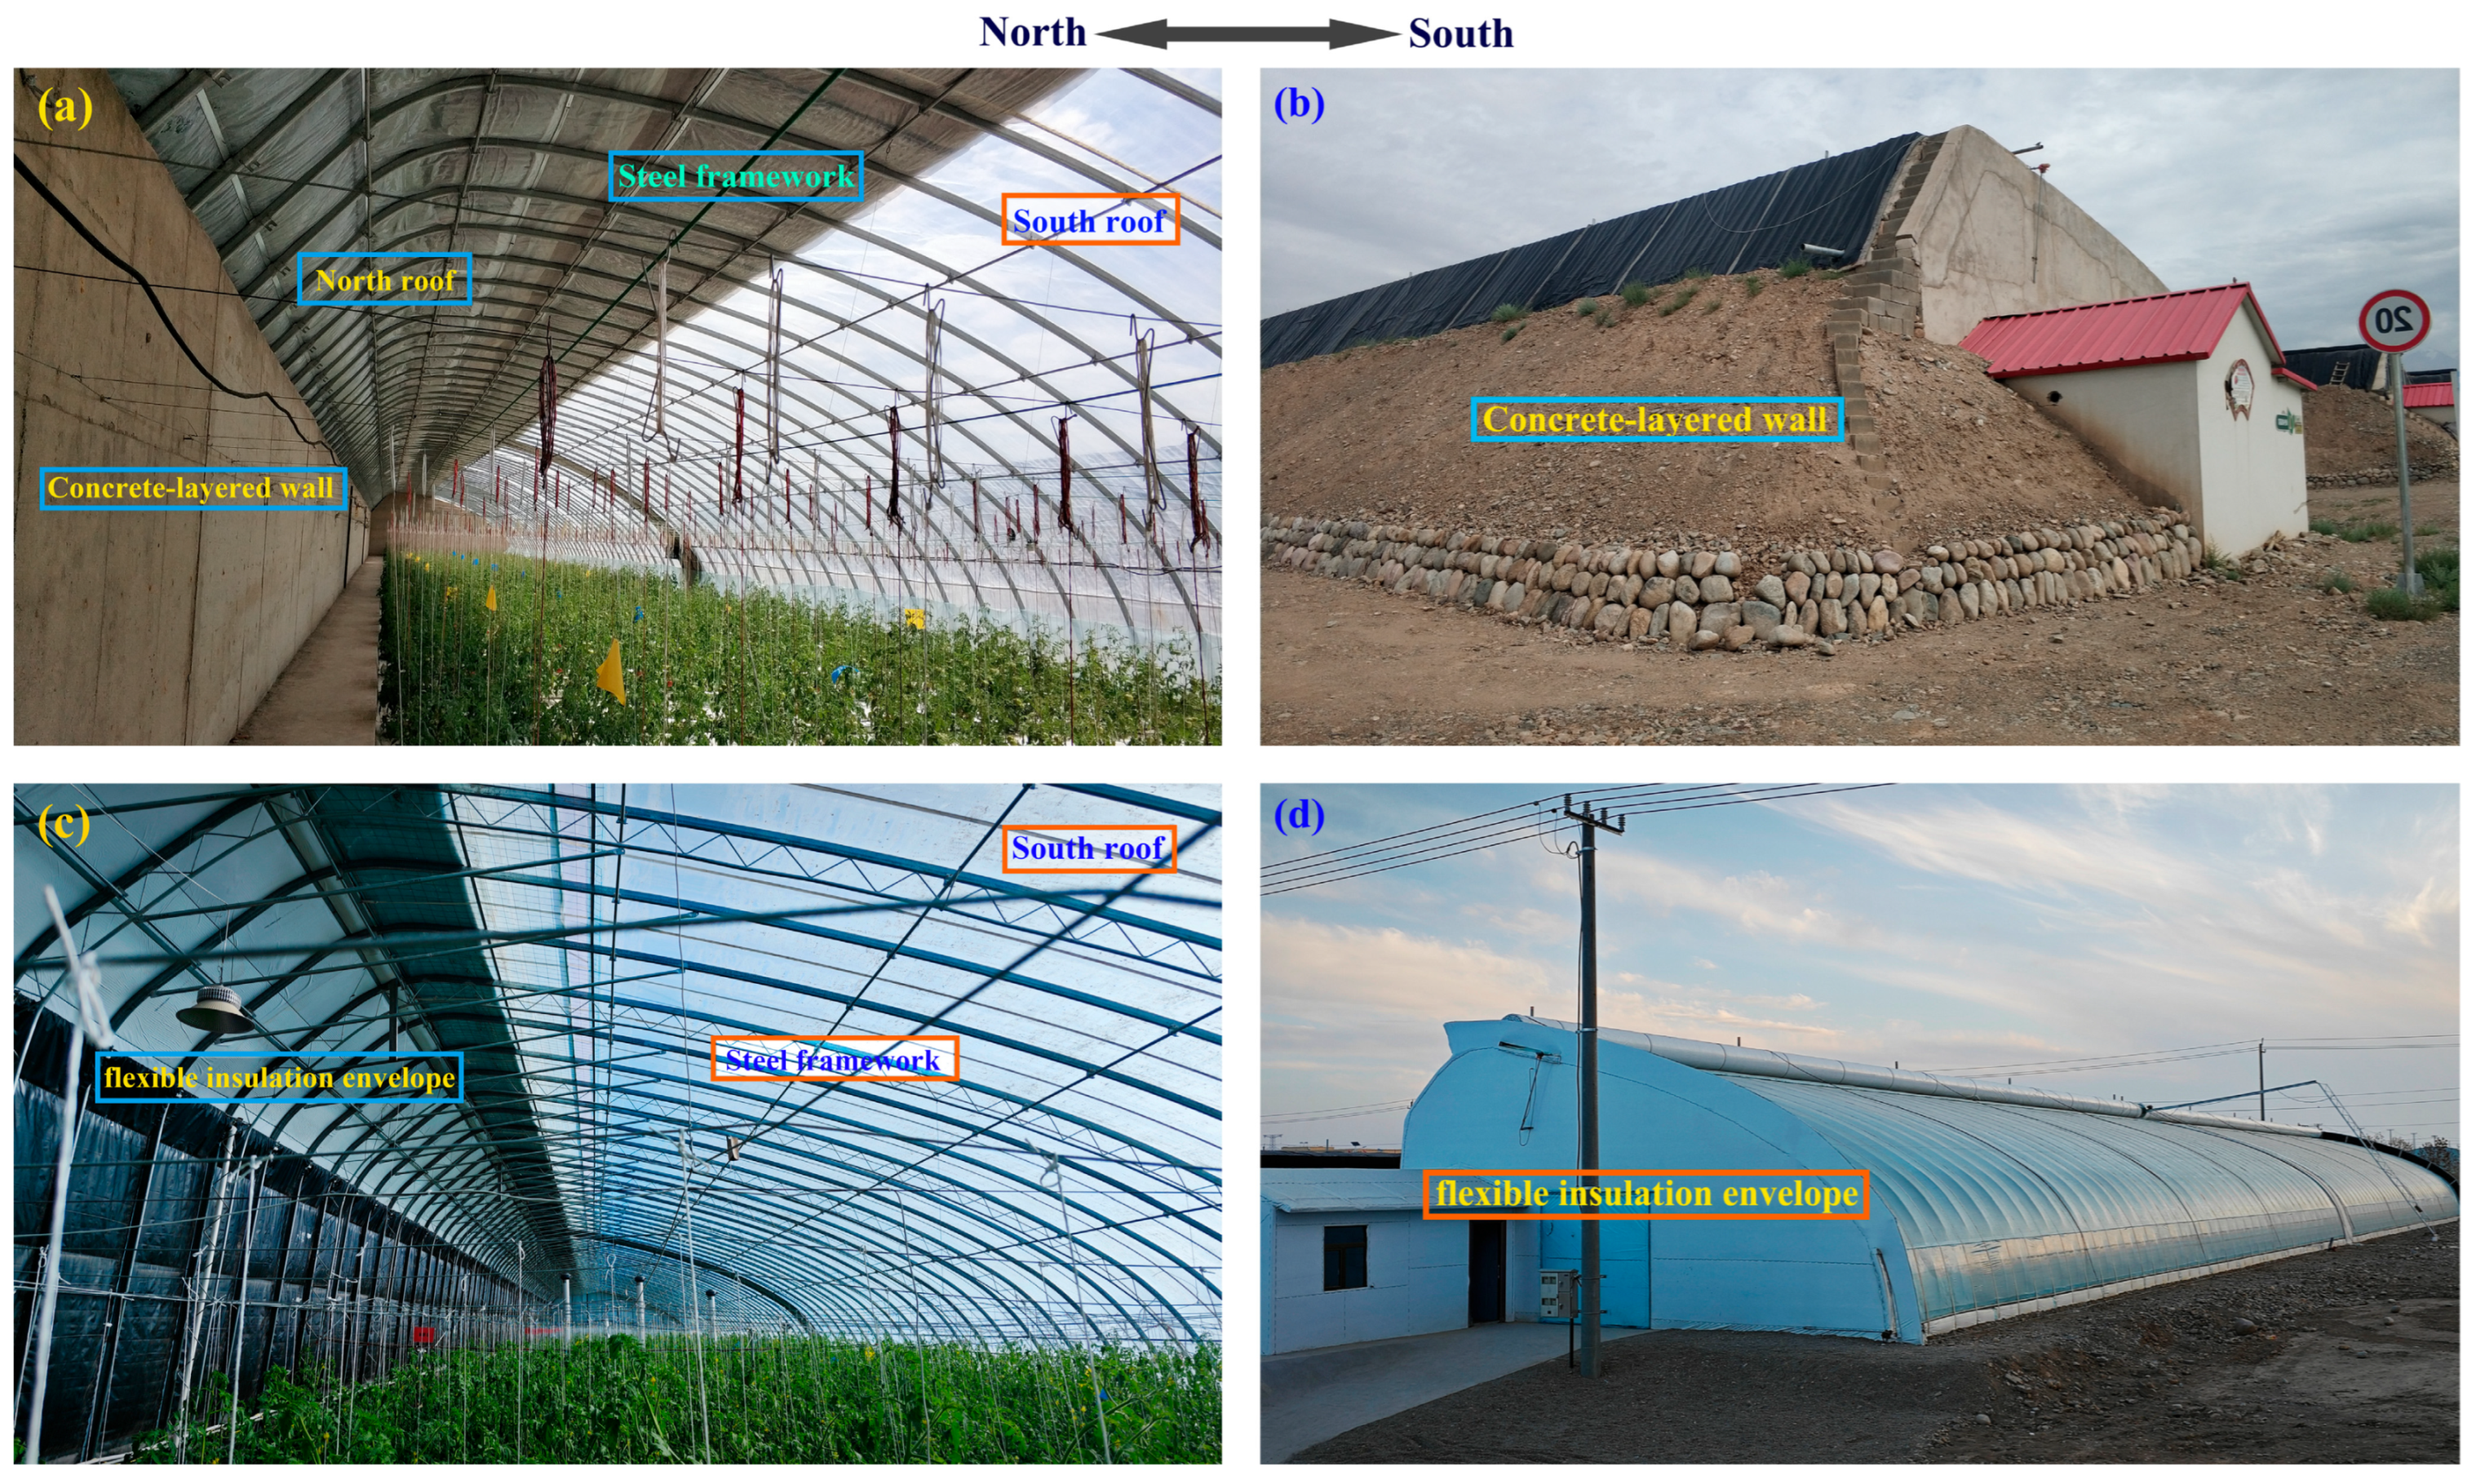
Figure 1. Internal and external views of the Gobi solar greenhouses (GSGs) in the Hexi Corridor: (a,b) a conventional concrete-walled GSG; (c,d) an innovative flexible insulation-walled GSG.
Agriculture 15 02053 g001
Figure 2. Active solar thermal systems inside the flexible insulation-walled Gobi solar greenhouse.
Agriculture 15 02053 g002
Figure 3. Hourly outdoor air temperature and solar radiation reaching an outside horizontal surface in the cold season in the Hexi Corridor.
Agriculture 15 02053 g003
Figure 4. Analysis scopes and life-cycle stages of the greenhouse tomato production systems.
Agriculture 15 02053 g004
Figure 5. Monthly cumulative heating demands for overwintering tomato cultivation in the concrete-walled Gobi solar greenhouse (CW-GSG) and flexible insulation-walled Gobi solar greenhouse (FIW-GSG) in the Hexi Corridor.
Agriculture 15 02053 g005
Figure 6. Structural component contributions to greenhouse construction cost: (a) the concrete-walled Gobi solar greenhouse; (b) the flexible insulation-walled Gobi solar greenhouse.
Agriculture 15 02053 g006
Figure 7. Stage contributions to the life-cycle cost of the greenhouse infrastructure: (a) the concrete-walled Gobi solar greenhouse; (b) the flexible insulation-walled Gobi solar greenhouse.
Agriculture 15 02053 g007
Figure 8. Cost category contributions to the life-cycle cost for tomato cultivation in the (a) the concrete-walled Gobi solar greenhouse and (b) the flexible insulation-walled Gobi solar greenhouse: A, energy; B, crop management; C, agricultural inputs; D, rental fees; E, auxiliary equipment; F, structural maintenance.
Agriculture 15 02053 g008
Figure 9. Probability distribution of total construction cost: (a) the concrete-walled Gobi solar greenhouse; (b) the flexible insulation-walled Gobi solar greenhouse.
Agriculture 15 02053 g009
Figure 10. Sensitivity of greenhouse Infrastructure NPV to key economic factors: (a) the concrete-walled Gobi solar greenhouse; (b) the flexible insulation-walled Gobi solar greenhouse.
Agriculture 15 02053 g010
Figure 11. Sensitivity of greenhouse tomato cultivation NPV to key economic factors: (a) the concrete-walled Gobi solar greenhouse; (b) the flexible insulation-walled Gobi solar greenhouse.
Agriculture 15 02053 g011
Figure 12. Profit allocation: construction company vs. farmer contractor under variable rentals: (a) the concrete-walled Gobi solar greenhouse; (b) the flexible insulation-walled Gobi solar greenhouse.
Agriculture 15 02053 g012
Table 1. Constant input values for simulation of dynamic heat contribution from the active solar thermal systems in the innovative flexible insulation-walled Gobi solar greenhouse [37,42].
ParametersValueParametersValue
A solar water heating systemcw4.184 kJ·kg−1·K−1Pr4.62
Hc0.95 mRe204,480
Lc3.0 mε0.90
m c ˙ 0.09 kg·s−1ηc0.65
Mc5.68 kgλw0.628 W·m−2·K−1
MT28,714 kgσ5.67 × 10⁻⁸ W·m−2·K−4
nc80
A subsurface solar air heating systemca1.007 kJ·kg−1·K−1δ0.003 m
cs1.544 kJ·kg−1·K−1λa0.026 W·m−2·K−1
D0.16 mλp0.20 W·m−2·K−1
Lp40.0 mλs0.48 W·m−2·K−1
np8ρs2095 kg·m−3
Nu99.07
Table 2. Charging standards of the non-construction cost.
Site Safety and Environmental Management CostStatutory Fee
Site Safety CostSite Civilization CostEnvironmental Protection Measures Cost
Charging baseLabor cost + Machinery costLabor cost
Rate7.5%1.05%0.65%22%
Table 3. Stage contribution to construction costs and initial investment of the Gobi solar greenhouse infrastructures.
Greenhouse TypeStage Cost (CNY)
Material ProcurementTransportationOn-Site Construction WorkConstruction CostNon-Construction CostInitial Investment
1234 = 1 + 2 + 356 = 4 + 5
CW-GSG185,811.312,654.496,624.4295,09091,862.7386,953
FIW-GSG163,338.424,541.560,567.9248,44869,673.8318,122
Table 4. Annual cash flow and net present value for the greenhouse infrastructures across the design lifespans of the Gobi solar greenhouses (CNY).
Greenhouse TypesYears (i)Annual CostsAnnual IncomesAnnual Cash FlowNet Present Value (NPV)
124 = 2 + 35 = 4/(1 + 0.06)i
Concrete-walled Gobi solar greenhouse038,695.0−132,542.5−93,847.5−93,847.5
138,695.0−5000.033,695.033,695.0
238,695.0−5155.033,540.031,641.5
338,695.0−5314.833,380.229,708.3
438,695.0−5479.633,215.427,888.3
538,695.0−5649.433,045.626,175.2
638,695.0−5824.632,870.424,562.7
738,695.0−6005.132,689.923,045.1
838,695.0−6191.332,503.721,616.8
938,695.0−6383.232,311.820,272.8
10-−6581.1−6581.1−3895.3
29-−11,754.7−11,754.7−2299.6
3021,304.6−396,381.8−375,077.3−69,223.0
Total408,254.6−758,573.6−350,319.014,907.8
Flexible insulation-walled Gobi solar greenhouse031,812.0−114,302.2−82,490.2−82,490.2
131,812.0−5000.026,812.026,812.0
231,812.0−5155.026,657.025,148.1
331,812.0−5314.826,497.223,582.4
431,812.0−5479.626,332.422,109.2
531,812.0−5649.426,162.620,723.2
631,812.0−5824.625,987.419,419.3
731,812.0−6005.125,806.918,192.8
831,812.0−6191.325,620.717,039.2
931,812.0−6383.225,428.815,954.3
10-−6581.1−6581.1−3895.3
29-−11,754.7−11,754.7−2299.6
3029,010.6−86,604.9−57,594.3−10,629.4
Total347,130.7−430,556.3−83,425.735,233.7
Note: According to the sign convention used in this analysis, a negative NPV indicates profits, while a positive NPV indicates losses.
Table 5. Annual cash flow and net present value for the greenhouse infrastructures across the design lifespans of the Gobi solar greenhouses (CNY).
Greenhouse TypesYears (i)Annual CostsAnnual IncomesAnnual Cash FlowNet Present Value (NPV)
124 = 2 + 35 = 4/(1 + 0.06)i−1
Concrete-walled Gobi solar greenhouse1114,228.2−95,100.019,128.219,128.2
275,915.7−98,048.1−22,132.4−20,879.6
382,667.4−101,087.6−18,420.2−16,393.9
480,224.4−104,221.3−23,996.9−20,148.3
587,311.3−107,452.2−20,140.9−15,953.5
29174,469.0−223,575.0−49,105.9−9606.6
30171,739.8−230,505.8−58,766.0−10,845.7
Total3,689,959.2−4,598,434.0−908,474.8−355,615.3
Flexible insulation-walled Gobi solar greenhouse1118,688.8−95,100.023,588.823,588.8
255,959.7−98,048.1−42,088.4−39,706.0
362,292.5−101,087.6−38,795.1−34,527.5
459,421.5−104,221.3−44,799.8−37,614.8
566,071.7−107,452.2−41,380.5−32,777.2
29139,493.6−223,575.0−84,081.4−16,448.9
30136,029.5−230,505.8−94,476.3−17,436.2
Total3,259,306.0−4,598,434.0−1,339,128.0−542,289.2
Note: According to the sign convention used in this analysis, a negative NPV indicates profits, while a positive NPV indicates losses.
Disclaimer/Publisher’s Note: The statements, opinions and data contained in all publications are solely those of the individual author(s) and contributor(s) and not of MDPI and/or the editor(s). MDPI and/or the editor(s) disclaim responsibility for any injury to people or property resulting from any ideas, methods, instructions or products referred to in the content.