Article

Evaluation of Energy and Water Use Efficiencies and Economic Feasibility for a Solar-Powered FCTB Cooling System in Greenhouse Farming

by
Ohood Al-Ghadani
,
Talal Al-Shukaili
*,
Hemanatha P. Jayasuriya
,
Pankaj B. Pathare
and
Ahmed Al-Busaidi
Department of Soils, Water and Agricultural Engineering, Sultan Qaboos University, Muscat 123, Oman
*
Author to whom correspondence should be addressed.
Agriculture 2025, 15(19), 2044; https://doi.org/10.3390/agriculture15192044
Submission received: 2 September 2025 / Revised: 23 September 2025 / Accepted: 26 September 2025 / Published: 29 September 2025
(This article belongs to the Section Agricultural Water Management)

Abstract

In arid countries like Oman, fan–pad cooling systems are commonly used in greenhouse cultivation. However, in such harsh environmental conditions, a fan–pad cooling system can be inefficient, result in high water and energy consumption, and may cause plant and soil pathogens issues. To address these challenges, this study evaluated the technical performance of a greenhouse designed with the new concept of an on-grid, solar-powered, and fan-chiller tube bank (FCTB) cooling system, focusing on water use efficiency (WUE) and energy use efficiency (EUE) following pot-grown okra. In addition, greenhouse gas (GHG) emissions and financial aspects were evaluated through cost–benefit and cash flow analyses. This research was conducted with a Quonset side-walled single-span greenhouse equipped with a solar-powered FCTB cooling system and automatic scheduled irrigation system. Water and electricity consumption was recorded, and surplus energy supplied to the electricity grid was estimated. The greenhouse efficiencies were evaluated by computing the EUE, total WUE, cooling water use efficiency (CWUE), and irrigation water use efficiency (IWUE). The solar-powered FCTB greenhouse enhanced EUE, achieving a value of 1.16 and a positive net energy of 163.87 MJ·m−2. The WUE, CWUE, and IWUE were 0.91 kg·m−3, 1.63 kg·m−3, and 2.07 kg·m−3, respectively. The economic assessment showed that okra cultivation with a solar-powered FCTB cooling system was economically unfeasible, as indicated by a benefit–cost ratio of 0.88. However, cucumber (IRR 46%, NPV 2.13 × 10⁴ USD) and cherry tomatoes (IRR 38%, NPV 1.98 × 10⁴ USD) demonstrated economic feasibility as supported by positive net present value (NPV) and the internal rate of return (IRR) values. Furthermore, incorporating solar energy with the FCTB cooling system enhanced the greenhouse’s sustainability, efficiencies, and profitability. This study recommends further research with this system for Oman’s seasonal effect with high-value crops and optimizing the size of the solar panel system to see how the energy and other efficiency components will vary.

1. Introduction

A greenhouse is a mechanism for adjusting and controlling climatic conditions within a confined area so plants can be grown in inhospitable climates [1]. Greenhouses are a viable option for year-round agriculture, especially in areas with hazardous climates, limited resources, and arable lands, aiming for high productivity [2]. Moreover, they improve productivity, shorten transportation distance, minimize consumption of water and land resources, and decrease the need for pesticides [3]. The advantages of greenhouses are significant; however, it is critical to maintain the greenhouse’s environmental conditions to improve plant development and increase fruit yield and quality [2,3].
To achieve these benefits, effective climate control strategies are essential to maintaining optimal conditions inside the greenhouse. Climate control inside greenhouses refers to regulating environmental parameters to meet crop growth requirements, enhance crop quality and yield, and save energy and water. These parameters include air temperature, relative humidity, CO2 concentration, and solar radiation [4]. Many systems can be used to regulate the environmental conditions within greenhouses, including heating, cooling, ventilation and fogging, lighting and shading, fertigation, and CO2 injection systems [4,5]. Still, controlling the environmental parameters of greenhouses in hot and arid regions like the Middle East, North Africa (MENA), and the Gulf Cooperation Countries (GCCs) is challenging because of the high temperatures and solar radiation. Therefore, using an effective cooling system is necessary to maintain the ideal growing conditions for plant development [4].
Greenhouses utilize a variety of cooling technologies, like evaporative systems and ventilation, to regulate temperature and relative humidity [4]. Evaporative cooling is one of the most effective methods for creating an ideal greenhouse environment for hot dry climates [6]. This cooling system turns sensible heat into latent heat by evaporating water directly into the greenhouse via a mist or fog system, sprinklers, or evaporative cooling pads [4,6]. Fan–pad cooling systems are the most commonly used in hot and dry areas [4]. This cooling system is influenced by the solar load and how dry the ambient air is outside. Therefore, its efficiency declines in the summer, which causes a shortage of vegetable harvests and increases prices [7]. Moreover, its energy and water consumption is high [4]. Tabook S. M. [8] reported that fan–pad cooling systems utilized up to 75.0% of the total greenhouse water demand and almost 99.5% of total electricity. Under dry environmental conditions, fan–pad evaporative cooling systems accounted for over 58.0% of total water use and nearly 98.0% of total energy usage in greenhouses [9].
To address these challenges, a newly designed cooling system that integrates renewable energy has been developed. The solar-powered FCTB cooling system is a new and innovative cooling system. It was designed and installed at the agricultural experimental station at Sultan Qaboos University, attached to the Agricultural Engineering Program at the College of Agricultural and Marine Sciences (CAMS). This cooling system works by circulating air via a tube that is cooled by chilled water where the heat exchange occurs to optimize greenhouse-related environmental conditions. Using this system with renewable energy may help to overcome high electricity consumption. In addition, it reduces the water consumption used for cooling the greenhouse environment. However, no research has been published to investigate the efficiency of this system.
Evaluation of the FCTB cooling system in term of water use efficiency (WUE) and energy use efficiency (EUE) is essential for understanding the potential of this cooling system. Water use efficiency (WUE) and energy use efficiency (EUE) are critical in evaluating agricultural systems, particularly greenhouse cropping, for which water and energy have a large impact on total performance [10]. WUE is a widely acknowledged efficiency word in agricultural science that expresses the number of marketable agricultural products (kg) grown in proportion to the amount of water (m3) used to produce them [11]. EUE is defined as the ratio of energy inputs to food energy output, demonstrating the efficiency of utilizing all the factors that could impact the overall productivity of a greenhouse, including the significant amounts of commercial and non-commercial energy consumed [10].
Numerous studies have evaluated greenhouse cropping systems using EUE and WUE across various crop and water management systems to meet the increasing competition for water resources and assure sustainable agricultural practices [11,12]. Tabook and Al-Ismaili [10] assessed the WUE and EUE in different greenhouses in Oman equipped with fan–pad cooling systems, reporting WUE values ranging from 38.6 kg·m−3 to 49.2 kg·m−3. These variations of WUE were thought to be caused by differences in irrigation water usage. At the same time, EUE ranged from 0.15 to 0.34 across different greenhouses. Al-Manthria et al. [7] conducted a study in Oman to compare two greenhouses equipped with different cooling systems. They found that the WUE of the greenhouse with air conditioning (WUE = 100.32 kg·m−3 in winter, 41.83 kg·m−3 in summer) outperformed the one with an evaporative cooling system (WUE = 96.52 kg·m−3 in winter, 30.61 kg·m−3 in summer) because of increased water use for cooling and irrigation with the evaporative cooling system. However, the evaporative-cooled greenhouse (EUE = 0.10 in winter, 0.05 in summer) was better than the air conditioner-cooled greenhouse (EUE = 0.08 in winter, 0.03 in summer) in terms of EUE. With a particular focus on cucumber production, Al-Mezeini et al. [12] showed inefficiencies in energy usage, with an EUE of 0.08. An investigation conducted in Arizona by Sabeh et al. [13] showed that the WUE of greenhouses was 11 kg·m−3, whereas irrigation was 30 kg·m−3 and pad-and-fan cooling was 16 kg·m−3. These findings indicate that enhancing WUE becomes more important as water scarcity increases, particularly in areas with limited water resources. In addition, these results underscore the need to integrate solar energy to improve the efficiency and sustainability of greenhouse production [12,14].
In addition to technical efficiencies (WUE, EUE), factoring in greenhouse gas (GHG) emissions is another necessary and useful tool for assessing the performance of greenhouses and sustainability [15]. The total GHG emissions of greenhouse cultivation has been estimated in different studies, with reported values of 4280.849 kg CO2eq·ha−1 for tomato, 82,724 kg CO2eq·ha−1 for cucumber, 5.09 kg CO2 eq·m−2 for zucchini, and 875.41 kg CO2eq·ha−1 for okra [15,16,17,18]. In addition to all the assessment tools used for greenhouse cultivation, a financial feasibility study is critical for determining the profitability of new technologies, particularly for greenhouse agriculture. In order to perform this analysis, profitability and cash flow budgets must be evaluated. These budgets assess the costs, returns, and cash flows related to the agricultural production system over its production cycle and a certain time period [7].
Considering the challenges inherent in conventional cooling systems, the need for a comprehensive assessment of greenhouse systems, and the limited research on evaluating greenhouses equipped with cooling in terms of EUE, WUE, GHG emissions, and financial feasibility, this study aimed to use these factors to examine the performance of a greenhouse developed with a novel on-grid solar-powered FCTB cooling system under okra cultivation. Notably, this is the first study to evaluate a solar-powered greenhouse with an FCTB.

2. Materials and Methods

2.1. Experimental Setup

2.1.1. Greenhouse Location and Specifications

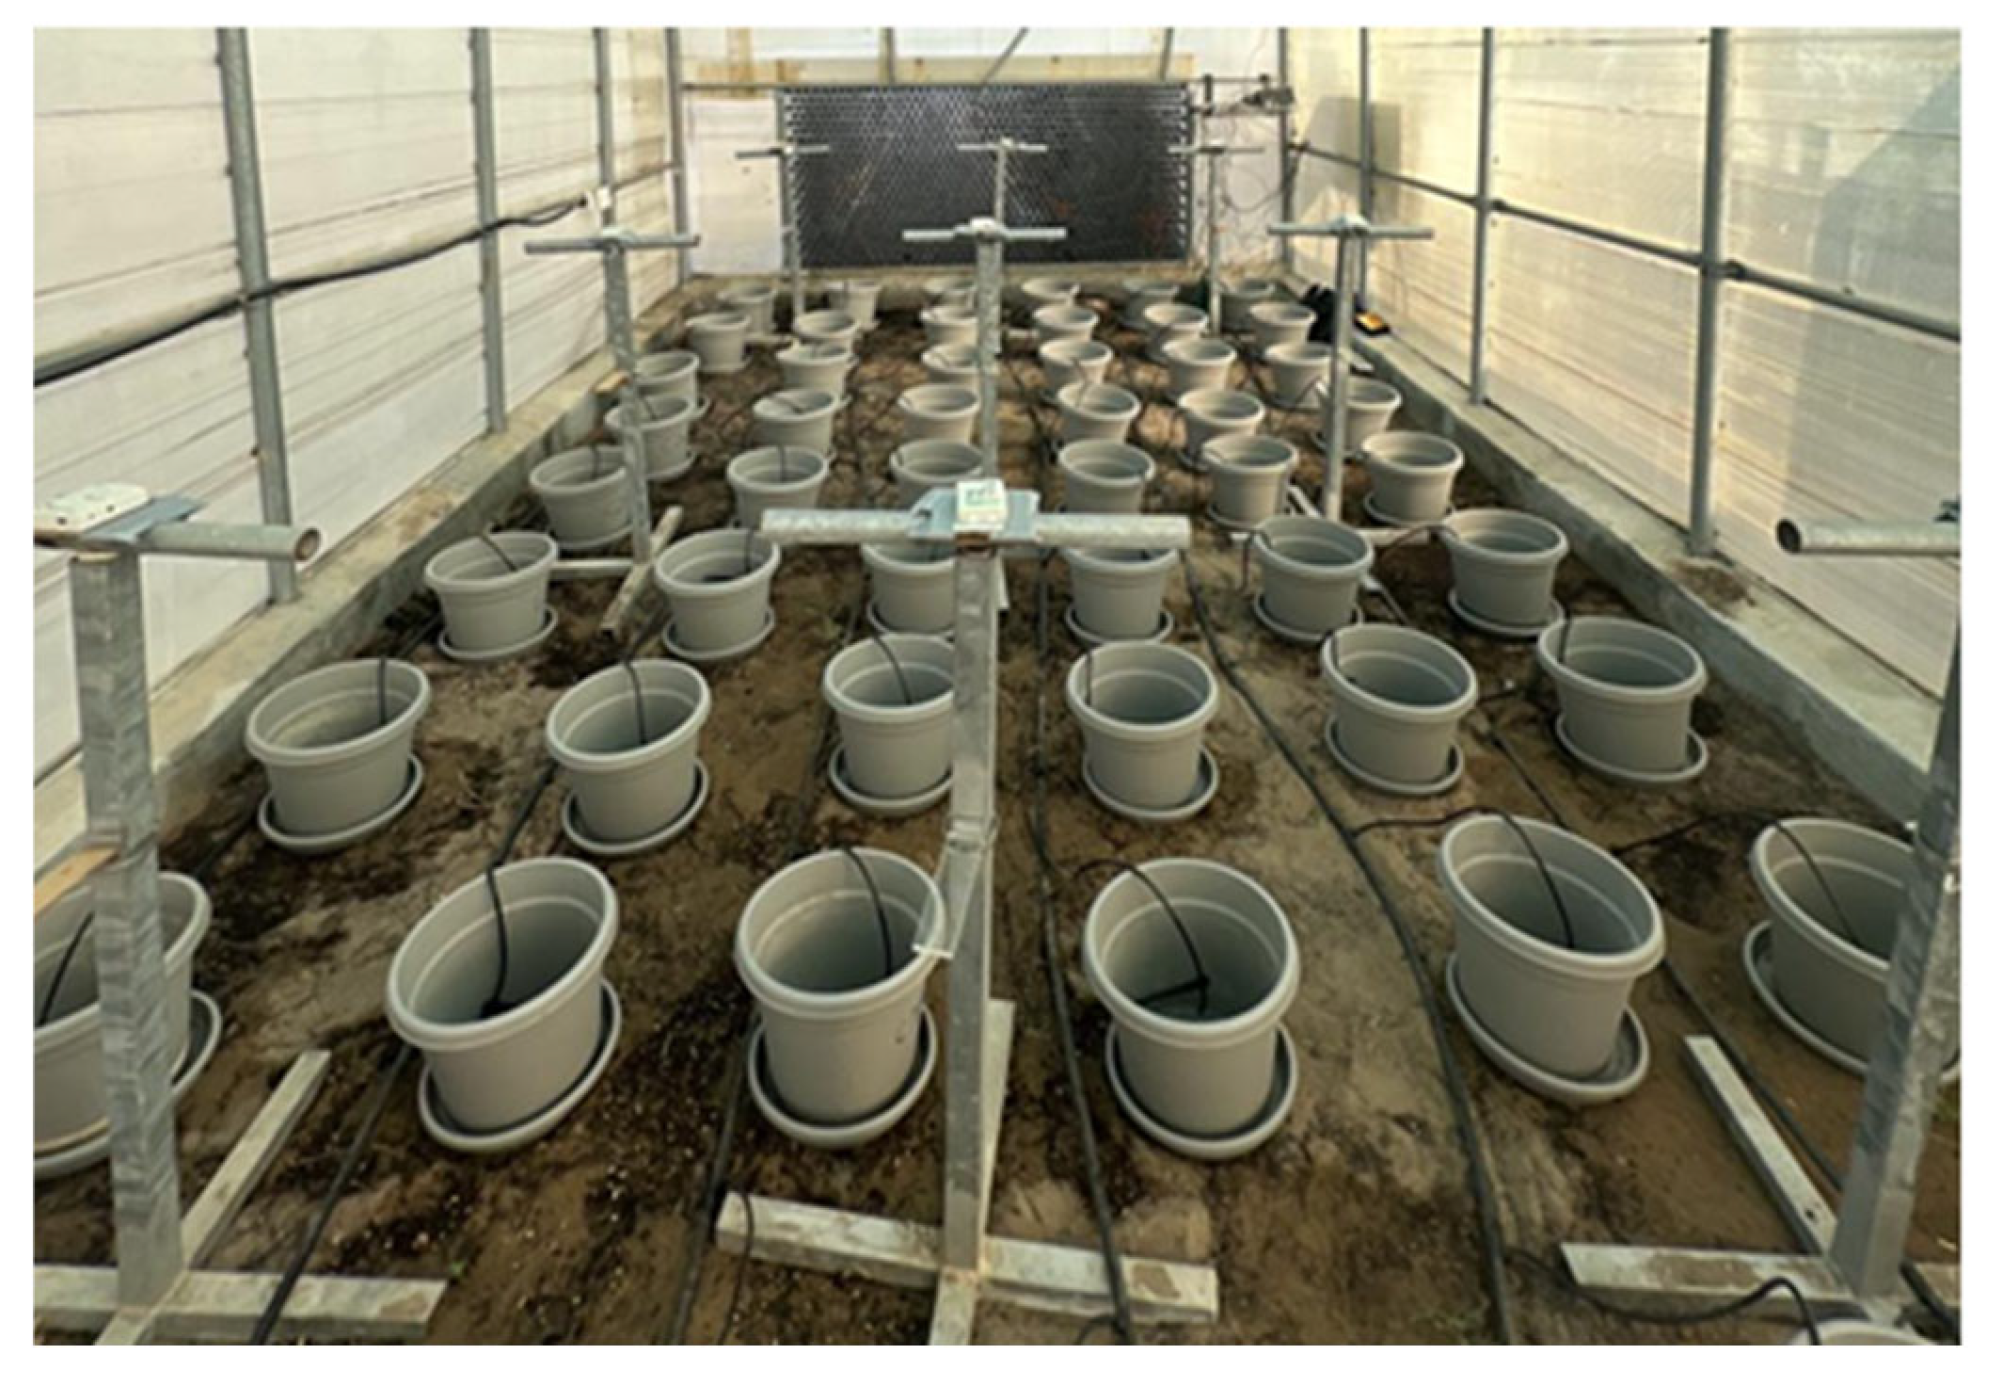
This study was conducted at the Agricultural Experimental Station at Sultan Qaboos University in Oman from 20 September 2023 to 15 February 2024. It is located at a latitude of 23.5988° N and a longitude of 58.1625° E. A Quonset single-span greenhouse, which is commonly used in Oman [19], was built with dimensions of 6 m × 3 m × 2.5 m (length × width × height), a north–south system orientation, and a solar-powered FCTB cooling system (Figure 1a). For plant growth, the pot cultivation method was followed; the dimension of the cultivation area was 3.6 m × 2.25 m (length × width). The total area of the greenhouse was 18 m2. Figure 1b illustrates the greenhouse layout.

2.1.2. Greenhouse Cooling System

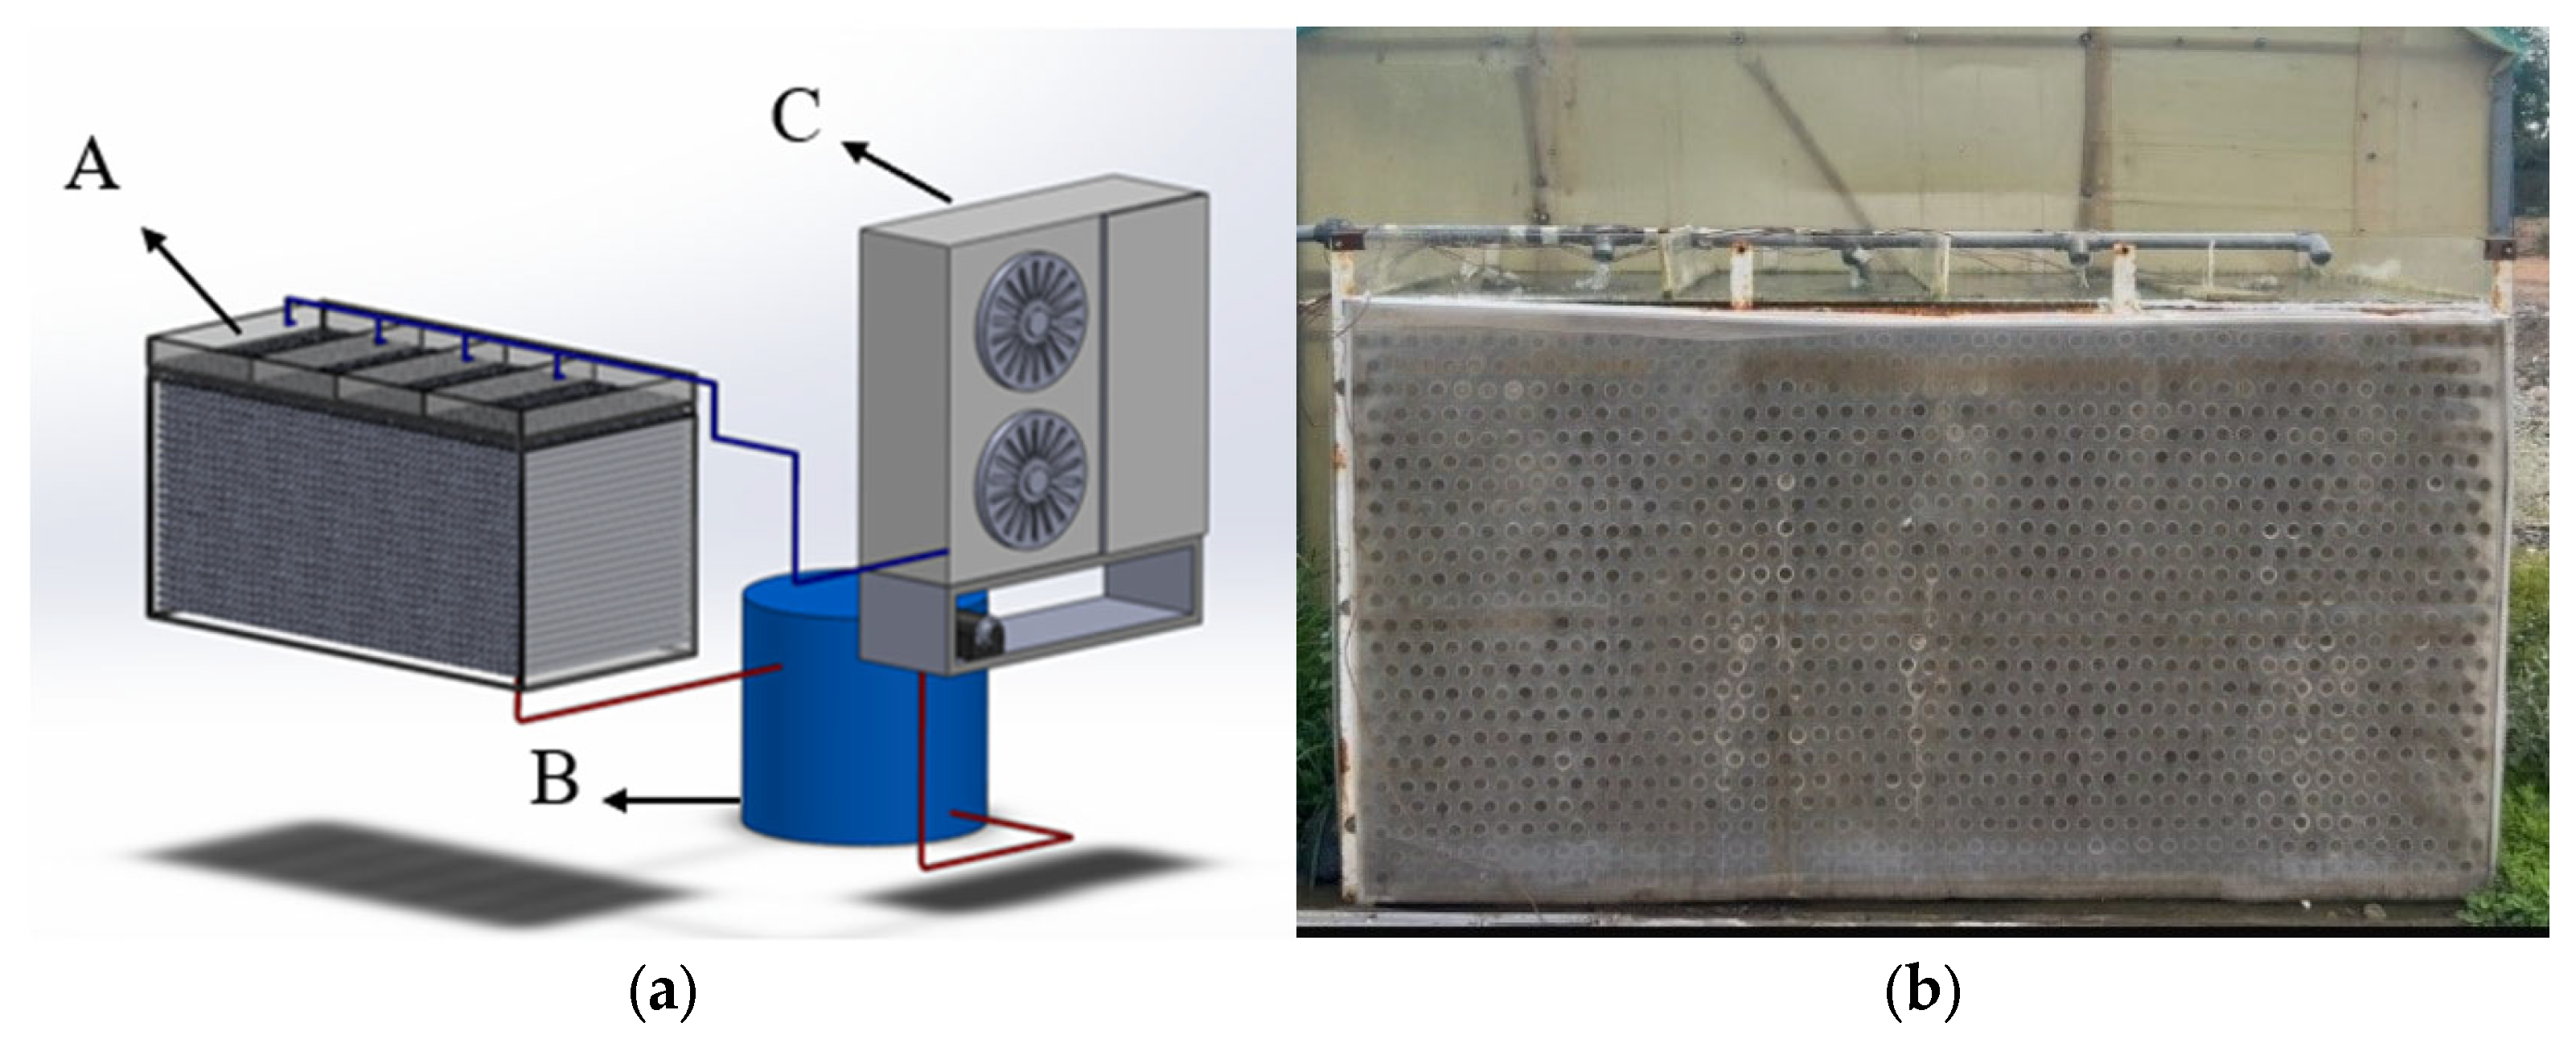
A solar-powered FCTB cooling system was used. This cooling system is powered by a solar energy system consisting of 18 panels, with a total power of 4500 watts, which supplies all the required energy for the greenhouse. In addition, the FCTB cooling system includes an exhaust fan, a water chiller with a power consumption of 3.32 kW and a cooling capacity of 32,000 Btu/h (9.38 kW), and a water pump with a power consumption of 0.37 kW (0.5 hp). This cooling system is also equipped with a 600-gallon (2271.25 L) underground water tank and a tube bank heat exchanger consisting of 1116 PVC tubes (Figure 2). The FCTB cooling system uses a temperature controller (T15-WD Multifan Thermostat, Vostermans Ventilation, Venlo, The Netherlands) inside the greenhouse to activate the exhaust fan and chiller system once the greenhouse temperature surpasses 25 °C to maintain the optimum temperature for okra growth; the optimum temperature range for okra cultivation is 20 °C to 30 °C, as reported by Benchasri [20]. This cooling system uses a water chiller, which directly cools water onto a PVC tube bank. This cold water reduces the temperature of the incoming hot air entering the greenhouse. Figure 3 shows the flow chart of the operations of the FCTB. When the temperature exceeds the set optimal temperature, the exhaust fan activates and the pump circulates the water from the tank to the chiller to cool it and then sprays it onto the PVC tube bank. As a result, the incoming hot air entering the tube inlet will be cooled. The cooled air exits from the outlet of the tubes inside the greenhouse to optimize the greenhouse temperature.

2.1.3. Sensors Arrangement and Distribution

A total of nine HOBO data loggers (U12-012, Onset Computer Corporation, Bourne, MA, USA) and HOBO sensors (H08-0040-02, Onset Computer Corporation, Bourne, MA, USA) were used to record the temperature and relative humidity inside the greenhouse. HOBO sensors were labeled from 1–9. HOBOs 1–3 were positioned close to the tube bank, while those numbered 4–6 were situated in the middle of the greenhouse, and those numbered 7–9 were placed near the exhaust fan. The arrangements of HOBO sensors inside the greenhouse are shown in Figure 4. The recorded data of temperature and relative humidity were retrieved weekly from HOBO (U12-012) and HOBO (H08-0040-02) using HOBOware 3.7.25 and BoxCar Pro 4.3.

2.1.4. Greenhouse Plant Cultivation

Okra (Hybrid Lady Finger Okra F1) was first grown in trays in the nursery for two weeks at temperatures ranging from 18 to 25 °C. The planting soil was prepared by mixing one-third of potting soil with two-thirds sand. Then, 6.5 kg of the mixture was put in selected pots. Then, 54 pots were placed inside the greenhouse (6 columns with 9 pots × 9 rows with 6 pots) with a spacing of 45 cm between pots, as recommended by Morwal and Patel [21] for a high okra yield.

2.2. Estimation of Energy Use Efficiency (EUE)

EUE was assessed using the ratio between energy input and energy output. The energy inputs included seeds, fertilizer, labor, electricity, irrigation, and cooling water. The recent energy coefficients from the literature were used to convert the physical quantity of inputs into energy values. The input energy equivalent is known as the energy needed for manufacturing and delivery from primary production, which ends with the consumer. Labor energy refers to the physical efforts needed for each agricultural practice, while the equivalent energy of fertilizer comprises the energy required for production [22]. The electrical energy consumption (EC) of the cooling system, which consists of the exhaust fan, pump, and chiller, was determined by multiplying the total wattage consumption of the cooling system by the working duration in hours when the temperature inside the greenhouse exceeded the set temperature of 25 °C. Similarly, the irrigation pump’s electrical energy consumption was calculated by considering the working hours during the cultivation period. The following equations were used to calculate the EC:
E C e x h a u s t   f a n = P e x h a u s t   f a n × t
E C c h i l l e r = P c h i l l e r × t
E C c o o l i n g   p u m p = P c o o l i n g   p u m p × t
E C i r r i g a t i o n   p u m p = P i r r i g a t i o n   p u m p × t
where P indicates the power (kW) and t represents the working hour (h).
Conversely, outputs comprised the biomass crop yield from the primary product (okra) and by-products (leaves, vines, and straw) [23], including energy received by solar panels. The total electrical energy received (SE, kWh) by the solar energy system was calculated as shown in Equation (5):
S E = η × A × S R × t × N
where η is the solar efficiency of 20%; SR is the solar radiation received per unit area (kW·m−2) measured using a pyranometer sensor; t is the total number of daily sunlight hours (h); A is the solar panel area (m2); and N is the number of solar panels.
Table 1 illustrates both inputs and outputs used in a solar-powered FCTB-cooled greenhouse under okra cultivation and their energy-corresponding coefficients.
The EUE, energy productivity (EP, kg/MJ), and net energy (NE, MJ·m−2) needs were calculated based on the energy equivalents using the following Equations (6)–(8) [16]:
E U E = E n e r g y   o u t p u t E n e r g y   i n p u t
E P = Y E n e r g y   i n p u t
N E = E n e r g y   o u t p u t E n e r g y   i n p u t
where energy output is all energy equivalent to all output from the okra yield and solar energy received (MJ·m−2); energy input is all energy equivalent to all inputs used in the production (MJ·m−2); and Y is the okra yield and solar energy received in kg.

2.3. Estimation of Water Use Efficiency (WUE)

For water use efficiency (WUE, kg·m−3), irrigation water use efficiency (IWUE, kg·m−3), and cooling water use efficiency (CWUE, kg·m−3), the following Equations (9)–(11) were used [10]:
W U E = Y I W + C W
I W U E = Y I W
C W U E = Y C W
where Y is the okra yield in kg; IW is the amount of water used for irrigation (m3); and CW is the amount of water used for the cooling system (m3).
Irrigation water consumption was determined by calculating the amount of water applied to each plant throughout the cultivation period. The water consumption for the solar-powered FCTB cooling system was determined to be equal to the initial volume of water used to fill the tank (2271.25 L); this is because the cooling system was designed to recycle the water.

2.4. Greenhouse Gas (GHG) Emissions Estimation

For GHG estimation, the corresponding CO2 coefficients for agricultural inputs were used to calculate the total GHG emissions, as indicated in Table 2. The amount of CO2 production was computed by multiplying each agriculture input datum (human labor, electricity, irrigation and cooling water, fertilizers, and seeds) by its equivalent emission coefficient. It was assumed that the CO2 coefficient for irrigation was the same as for cooling, as both processes require similar energy for water supply and distribution. Similarly, the CO2 coefficient for okra seeds was assumed to be equal to the CO2 coefficient for water, (1 kg seed = 1 L water), following a similar approach conducted by Houshyar et al. [24], due to the lack of information related to okra seed production.

2.5. Financial Analysis

The total cost of the solar-powered greenhouse with an FCTB was calculated using the total fixed cost and total variable costs on an annual basis. The fixed cost included the greenhouse structure, cooling system, solar energy system, irrigation system, sensors, and all accessories. Variable costs included labor, seeds, fertilizer, electricity, and water consumption. The revenue from okra cultivation and the revenue from selling the surplus electricity generated by the solar energy system to the grid were also calculated. The following Equations (12)–(17) were used for calculating the gross value of production (GVP, USD/m2); total cost (TC, USD/m2); gross return (GR, USD/m2); net return (NR, USD/m2); benefit–cost ratio (B/C), and financial productivity (FP, USD/kg) [7,27]:
G V P = Y × P
T C = F C + V C
G R = G V P V C
N R = G V P T C
B / C = G V P T C
F P = Y T C
where Y is the yield per unit area (kg/m2); P is the sale price (USD/kg); FC indicates the fixed cost (USD/m2); and VC is the variable cost (USD/m2).
Following the same method used by Al-Manthria et al. [7], the discounted cash flow analysis was used to estimate the internal rate of return (IRR) and net annual cash flow, which is the difference between the investment’s total cash outflow and inflow. The net cash inflow encompasses all revenue, while the net cash outflow includes both fixed and variable costs. A lifespan of 20 years was entered in the calculation. However, depreciation, tax deductions, and land expenses were not considered. In Oman, there is no tax on agricultural investment. The average interest rate on agricultural loans from commercial banks, 6.0%, was used.
The net present value (NPV) was calculated using Equation (18), while IRR was determined using Excel function IRR (x = expected cash flow). Furthermore, the annualization factor (AF) and annualized rate (AR, %), which indicate a rate of return over a specific, given period of the year, were calculated using the following Equations (18)–(20) [7,28].
N P V = t = 0 n N C F t ( 1 + R ) t
A F = R 1 ( 1 + R ) l i f e
A R = A F × c o s t
where n indicates the number of periods, N C F t is the net cash flow at time t, R represents the interest rate (%); life indicates the lifespan of the greenhouse; and cost is the initial investment cost (USD).

2.6. Data Collection and Analysis

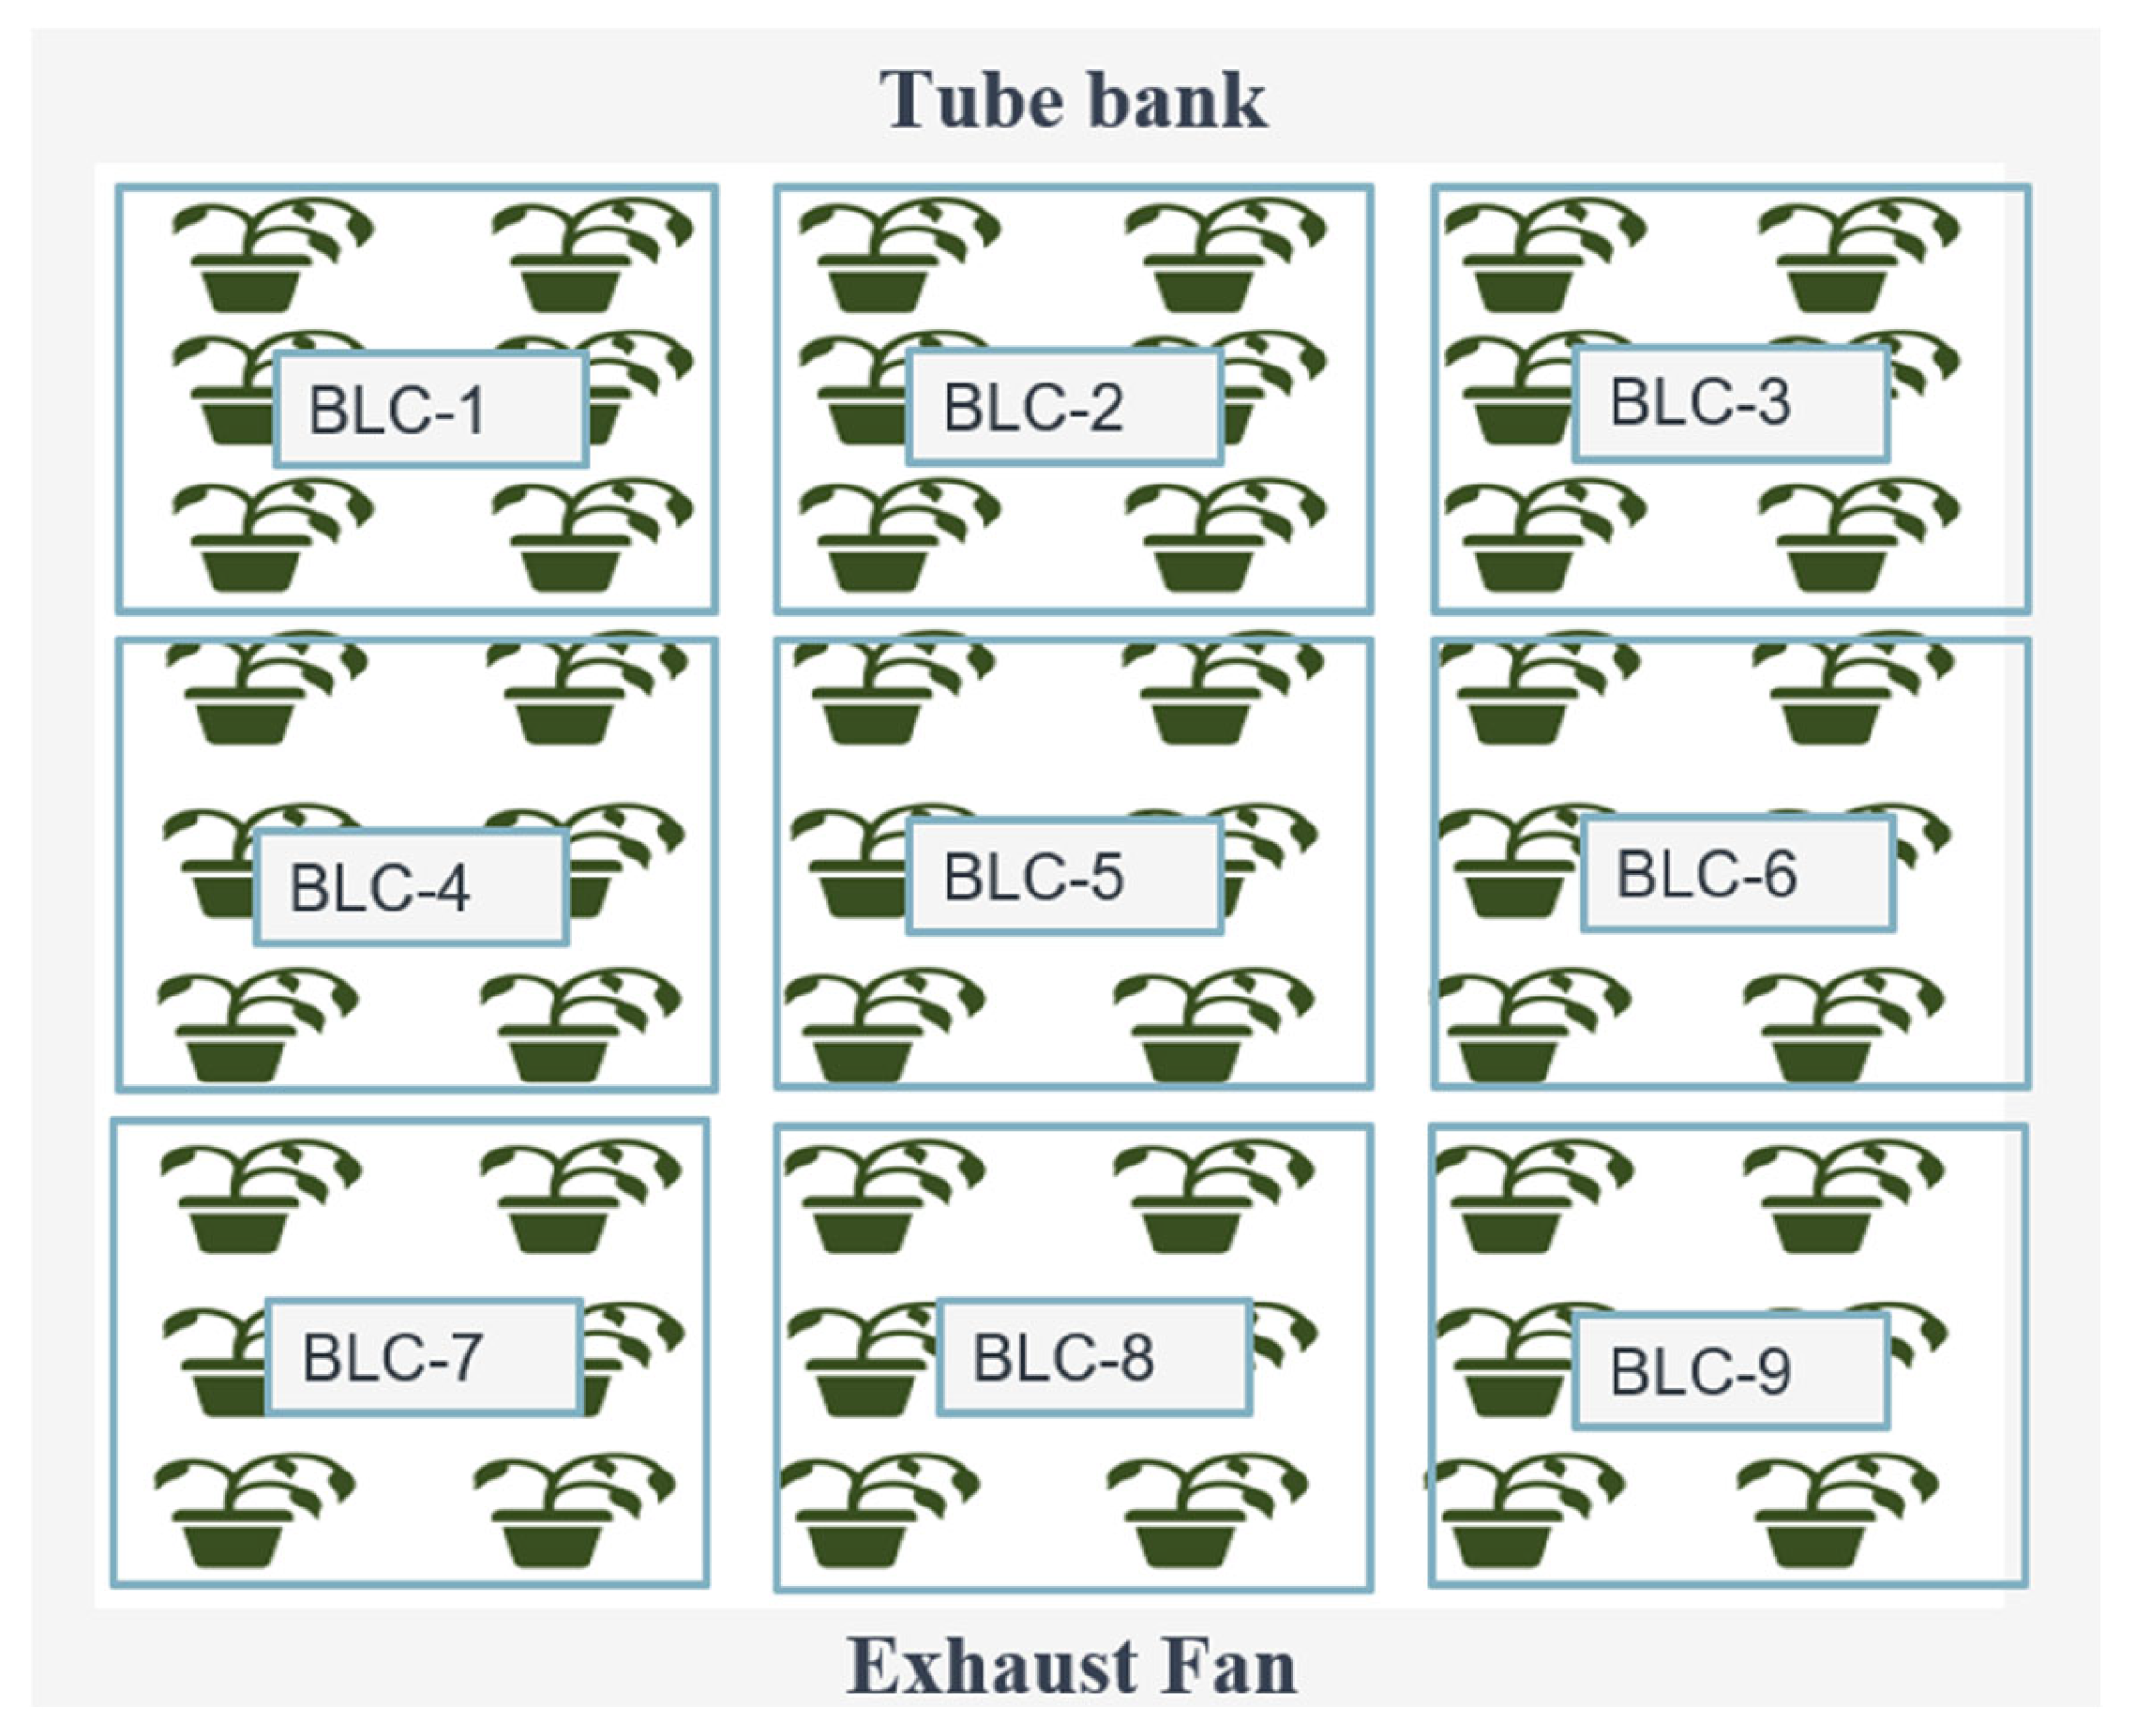
The okra yield and biomass were analyzed in block bases (BLCs); the okra plants in the greenhouse were divided into nine blocks, with six plants in each block, as shown in Figure 5. RStudio software (Posit, Boston, MA, USA; Version 2024.04.0) was used to examine the effect of variation of the okra fruit yield and dry biomass within different locations inside the greenhouse. The statistical analysis, using one-way analysis of variance (ANOVA), was conducted to determine the significant differences among the blocks with a 5% significance level, where p-values < 0.05. Tukey’s honestly significant difference (HSD) test was used as a post hoc analysis after a significant ANOVA result to identify group differences. Origin Pro software (OriginLab Corporation, Northampton, MA, USA; 2024b) was used to draw contour maps to illustrate the spatial distribution of the average temperature and relative humidity inside the greenhouse over the plantation period. Microsoft Excel (Microsoft Office Learning Edition, Version 2019) was used for data organization, graphical representation, and numerical calculations.

3. Results and Discussion

3.1. Energy Input and Output Distribution

3.1.1. Energy Inputs

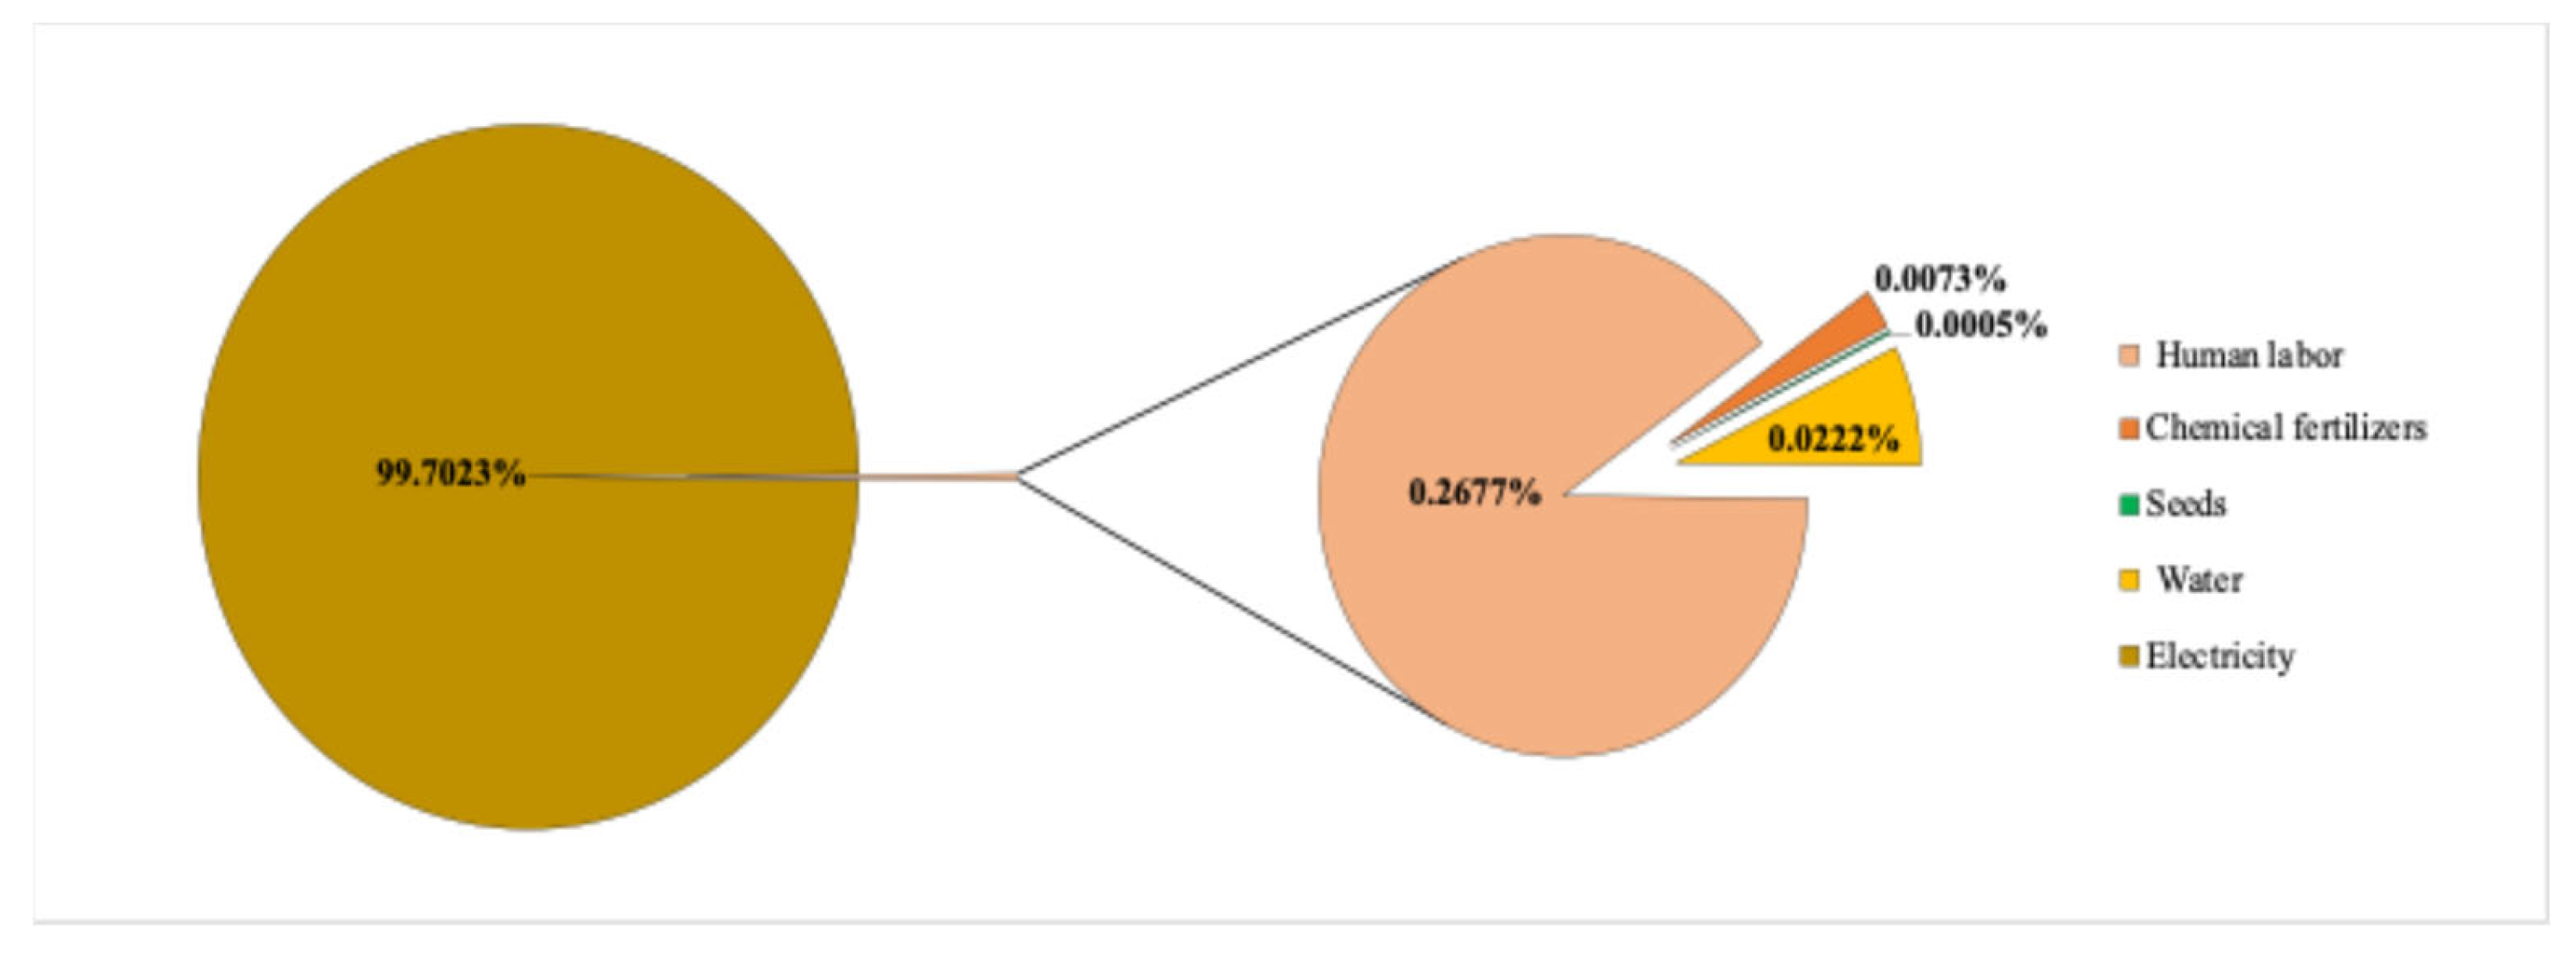
Figure 6 illustrates the distribution of energy input of the solar-powered FCTB-cooled greenhouse. Electricity accounted for 99.70% of total energy inputs, followed by human labor, water consumption, fertilizers, and seeds. Similarly, Tabook and Al-Ismaili [10] discovered that electricity constituted a high percentage of the energy inputs in evaporative-cooled greenhouses, with ranges of 73–90%, and Al-Mezeini et al. [12] found that the electricity consumption of an EV-cooled greenhouse constituted 88% of total energy inputs. The reason for this is the high electricity consumption of the cooling systems. The FCTB cooling system consumed 98.86% of the total electricity use (99.70%). This value was lower compared with the electricity consumption of the fan–pad cooling system (99.5%) as reported by Tabook [8]. Human labor constituted 0.27% of the total energy input consumption, attributed to such tasks as preparing the greenhouse, planting, harvesting, and frequent monitoring. Water and fertilizers accounted for 0.02% and 0.01% of total energy input, respectively; these were low due to the greenhouse conditions, using drip irrigation and following pot cultivation, which prevent water and fertilizer loss. Drip irrigation delivers water directly to the plant root zone, ensuring sufficient moisture and reducing water loss through evaporation [29].

3.1.2. Energy Output

  • Okra yield and biomass
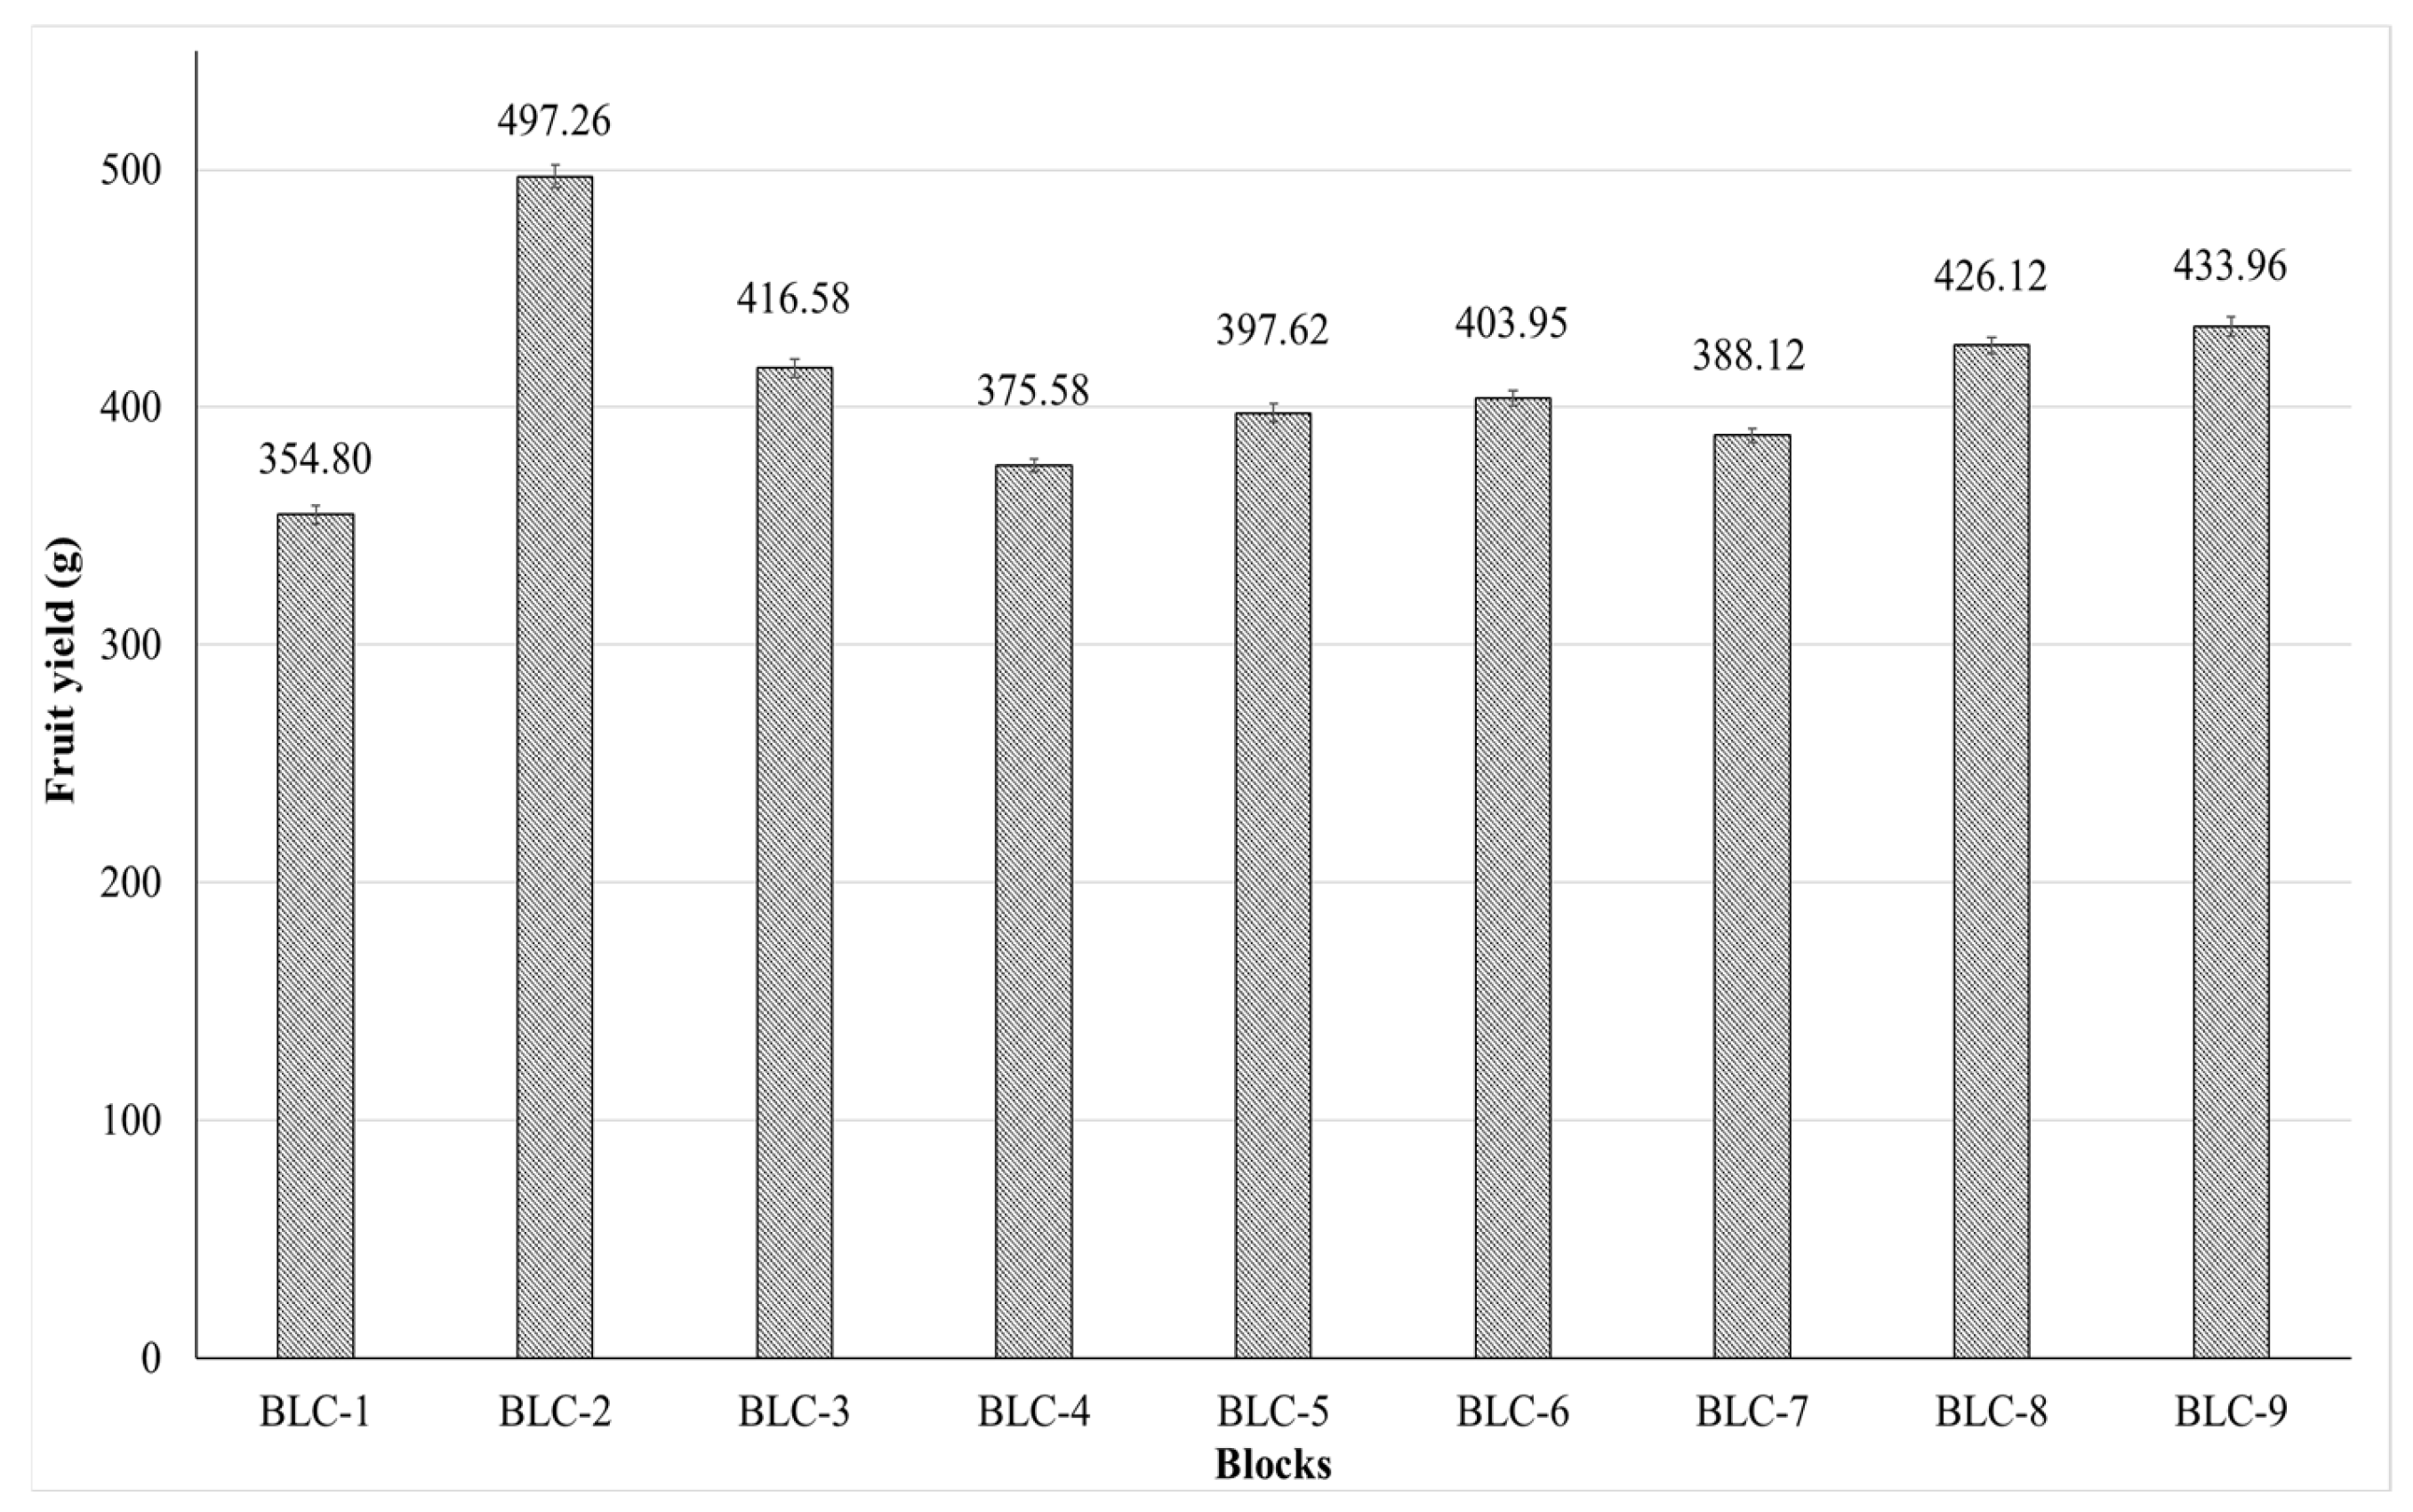
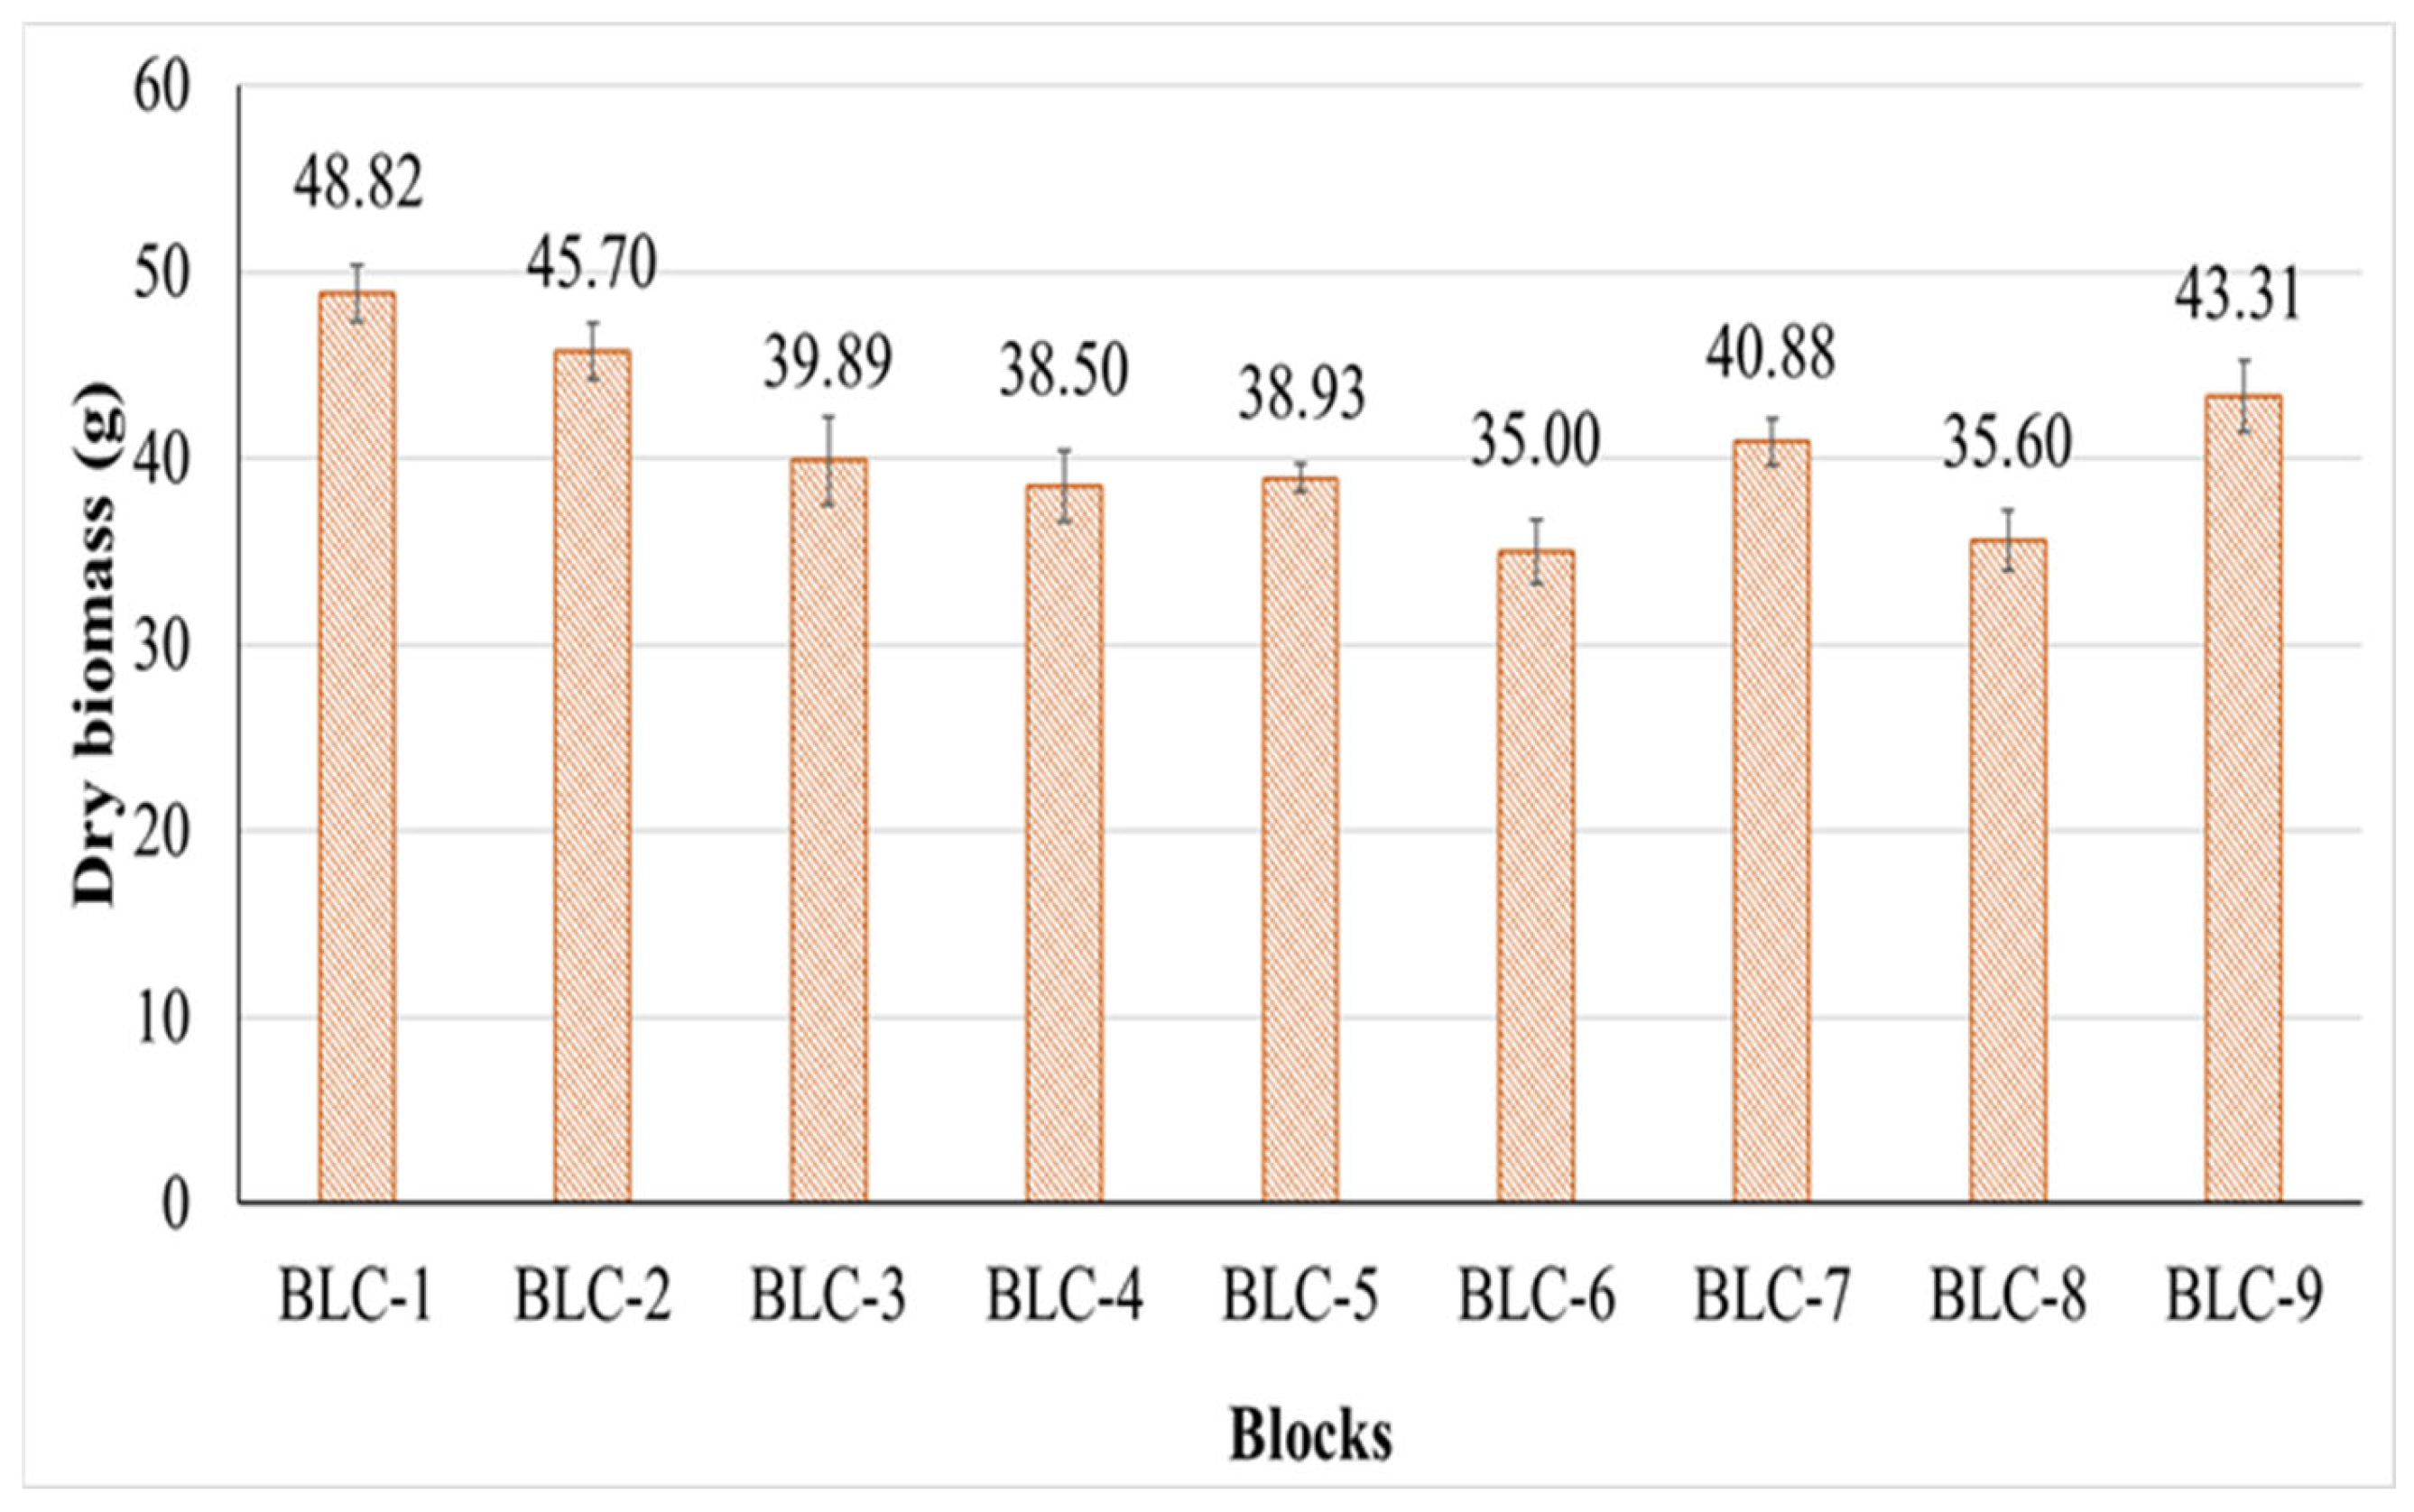
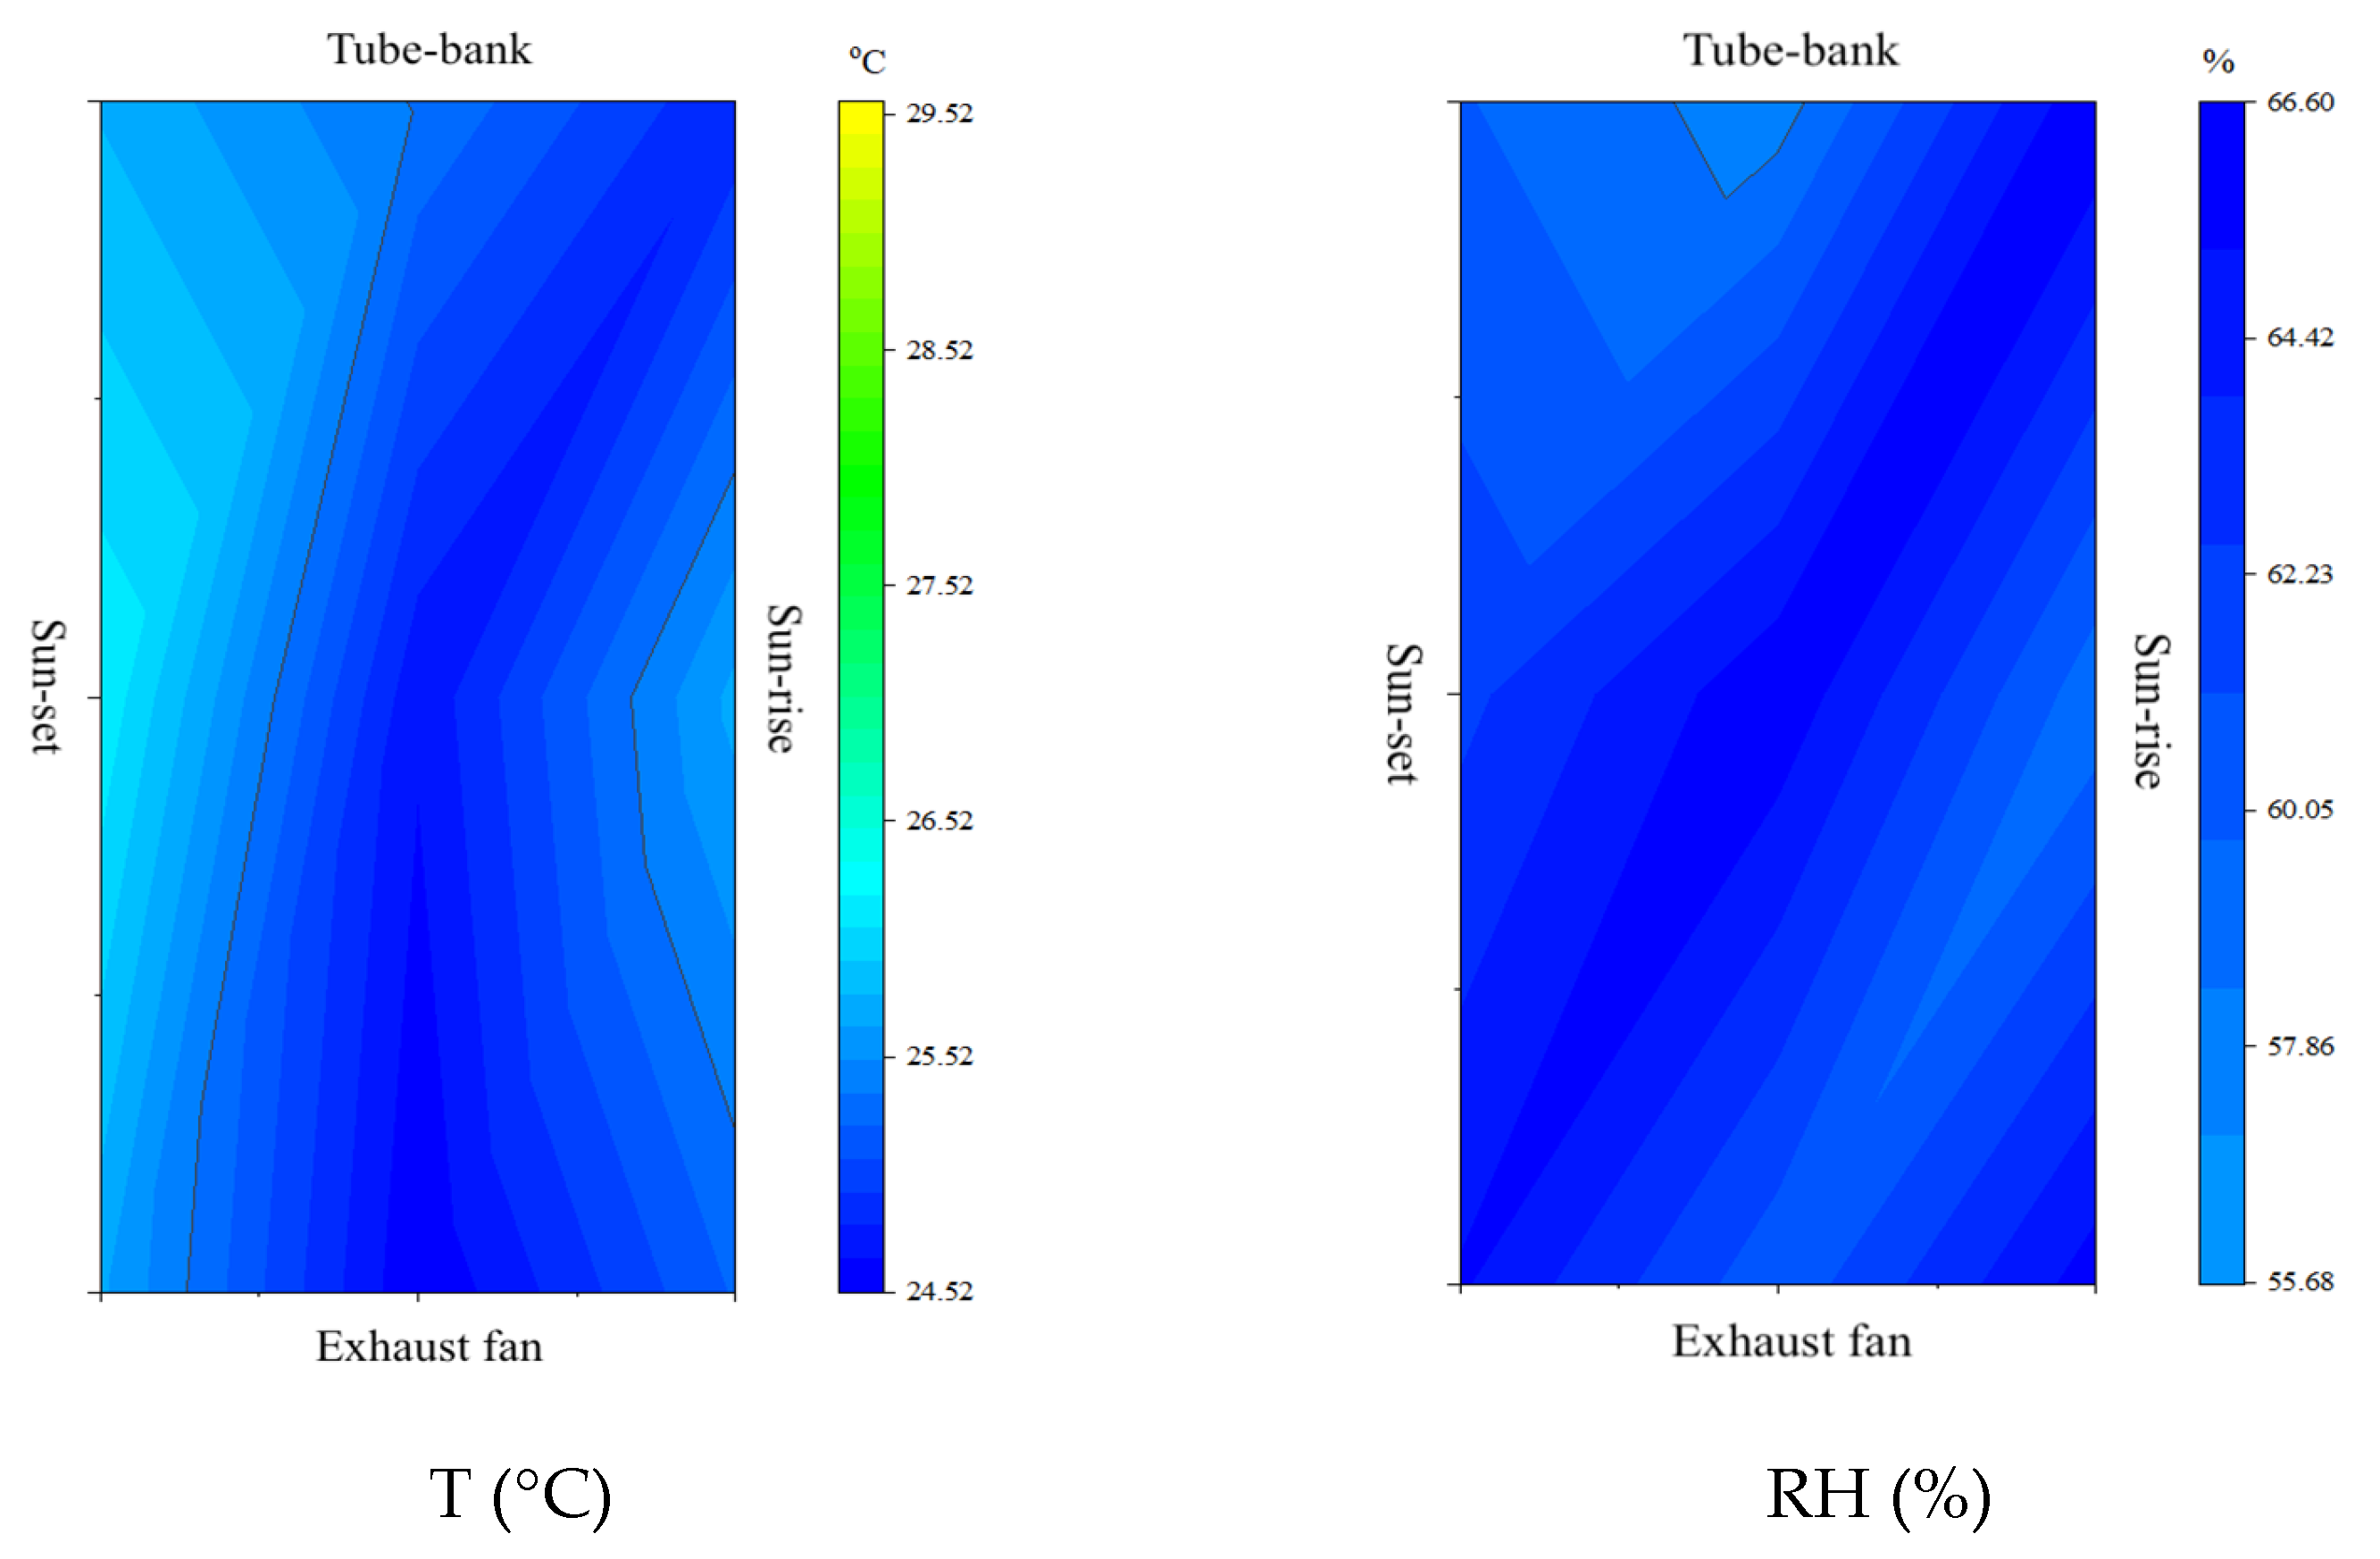
The yield and dry biomass of okra plants were analyzed in blocks to study the effect of variation of environmental conditions within the greenhouse. Among block analysis, BLC-2 showed the highest fruit yield (497.26 g), followed by BLC-9 (433.96 g) and BLC-8 (426.12 g). However, no significant difference was found within greenhouse blocks, as shown in Figure 7. Similarly, no significant difference was observed in the total dry biomass within greenhouse blocks (Figure 8), with BLC-1 showing the highest total dry biomass (48.82 g), followed by BLC-2 (45.70 g). The uniformity distribution of yield and total biomass is attributed to the favorable and controlled climate conditions inside greenhouses with optimum temperature and relative humidity [30,31,32]. The average temperature inside the greenhouse was 24.5 to 26.2 °C, which was within the optimum range recommended for okra cultivation, as confirmed by Benchasri [20]. In addition, the average relative humidity of the greenhouse ranged from 57.7% to 66.4%, which was consistent with the values recommended for plants inside the greenhouse (50–80%), as reported by Prasad et al. [33]. The presence of uniform temperature and relative humidity (Figure 9) inside the greenhouse contributed to the lack of a significant difference in the okra fruit yield and total dry biomass among the blocks, with a total fruit yield of 3683.99 g and total dry biomass of 300.08 g. The total fruit yield of this study (3683.99 g, average: 68.22 g per plant) was lower compared with the 163.17 g per plant illustrated by a study conducted using pot cultivation under greenhouse conditions [30], and 81.32 g per plant reported by a study using mulched soil and calcium fertilizers under a plastic greenhouse [34], suggesting that the lower yield may be attributed to the difference in soil fertilization and agronomic practices followed in these studies. Furthermore, the lower yield and biomass in this study could be due to the use of pots, which constrain plant growth. This was explained by Poorter et al. [35] and Oagile et al. [36], who reported that pot size limits plant growth and biomass. Specifically, a smaller pot size reduces plant growth through the restriction of important resources such as nutrients, growing medium, and space for root expansion.
Overall, the total fruit yield and biomass accounted for 0.03% and 0.01% of the total energy outputs, respectively.
b.
Solar energy received
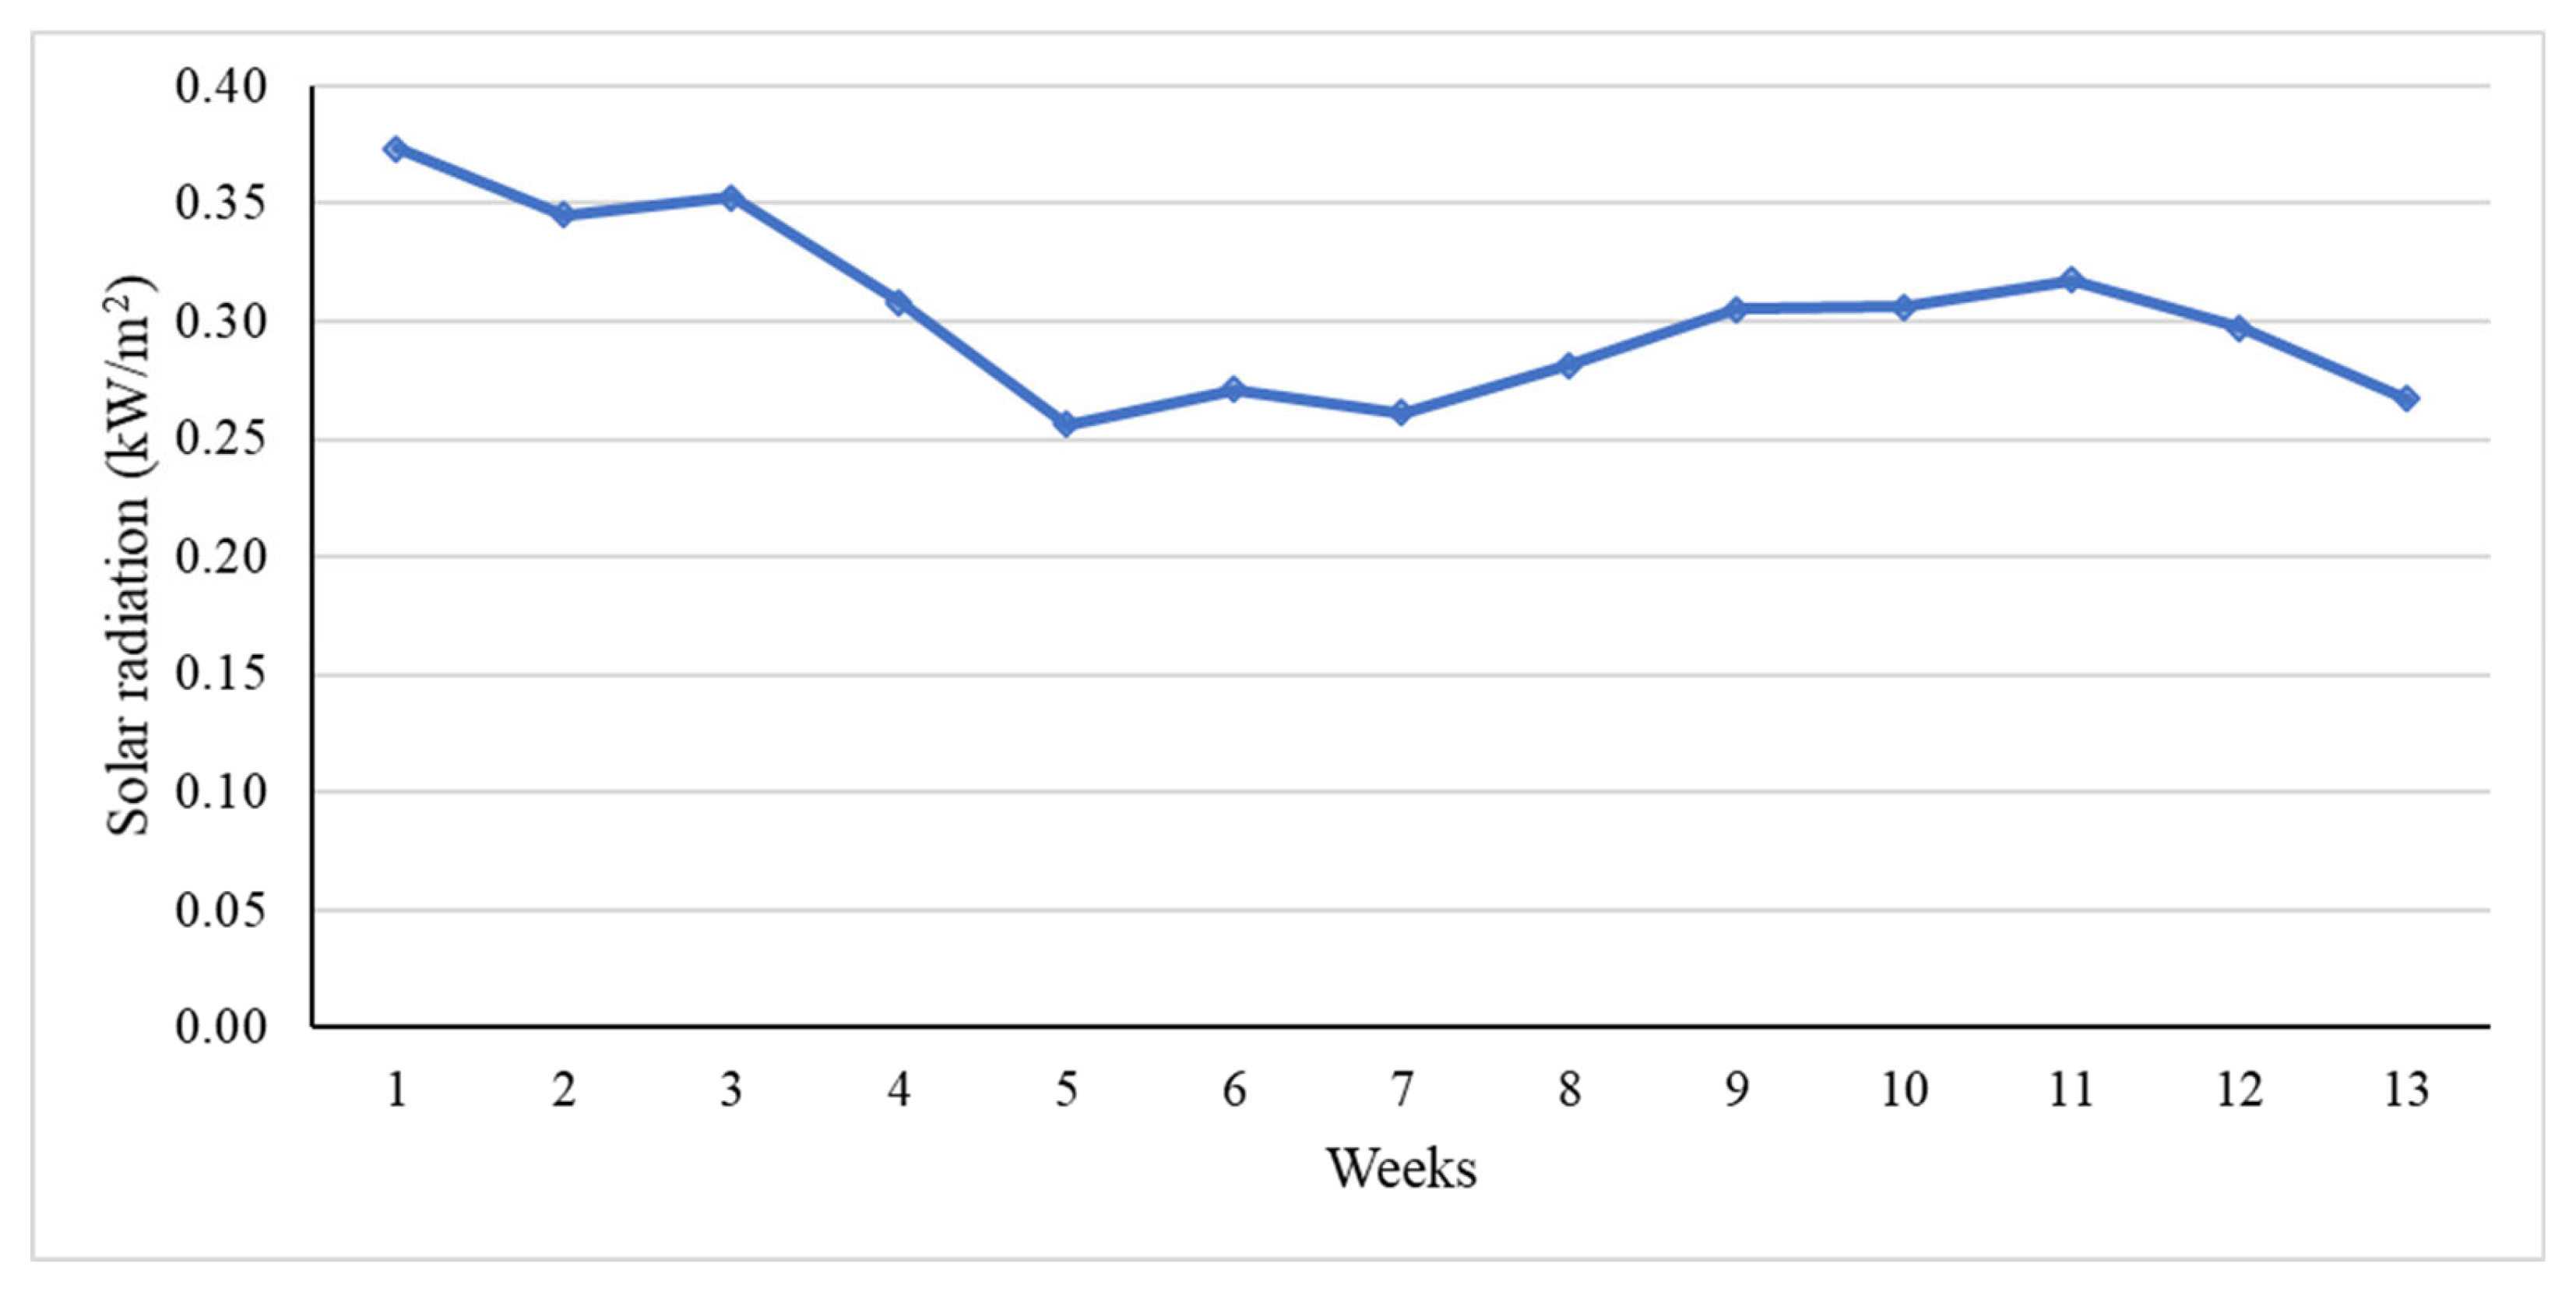
The weekly solar radiation was collected from 5 November 2023 to 15 February 2024, to determine the total solar energy received during the cultivation period. Figure 10 shows that solar radiation gradually decreased from weeks 1 to 5, followed by a slight increase until week 11. The highest solar radiation was received in week 1, which achieved 0.37 kW/m2, while the lowest solar radiation was received in week 5 (0.26 kW/m2). The fluctuation of solar radiation observed during the experiment period was caused by weather conditions such as wind speed, cloud cover, and seasonal variation. These findings align with the study conducted by Sansa and Bellaaj [37], who reported that fluctuation is a normal characteristic of solar radiation because it depends on different weather conditions, which significantly impact its components. The total solar energy received over the whole cultivation period was computed from solar radiation data. The total energy received was 1811.76 kWh, which accounted for the highest percentage of 99.95% of total energy output.

3.2. Energy Use Efficiency (EUE)

Table 3 illustrates the energy equivalents of various inputs and outputs used for okra cultivation in a solar-powered FCTB-cooled greenhouse. Table 4 shows how the FCTB-cooled greenhouse performed in terms of energy. The energy indices of EUE, EP, and NE were calculated with the utilization of solar energy to power the greenhouse. The greenhouse yield outputs from fruit yield (okra fruits) and dry biomass (leaves, strew, and okra vines) were included. In addition to the okra yield, the electricity from solar panels was considered as another output of the solar-powered greenhouse, which demonstrated a total output of 1201.35 MJ/m2. This was higher than the total input of 1037.48 MJ/m2 due to the significant contribution of solar energy received, constituting 99.95% of the total output. The solar-powered FCTB greenhouse indicated a higher EUE (1.16). An increase in EUE indicates an enhancement in energy efficiency [10]. Additionally, the EUE of the solar-powered FCTB-cooled greenhouse was greater than 1, indicating an energy gain [16]. This result was significantly higher compared with the reported values of the EUEs of EV-cooled greenhouses (0.1), AC-cooled greenhouses with lettuce production [7], and EV-cooled greenhouses with cucumber production [12]. However, the EUE of this study was slightly lower compared with the reported values for tomato and pepper (1.462), tomato, pepper, and cucumber (1.198), and pepper and eggplant (1.269) under greenhouse conditions [38]. In addition, the EUE found in this study was lower compared with the EUE of different crops grown in open fields, such as okra (2.85), tomato (7.58), canola (6.8), paddy (3.8), soybean (4.8), barley (4.4), wheat (4.0), and corn silage (2.7) [16,22]. This was explained by Mohammadi et al. [22], who reported that EUE significantly increased as farm size increased, which led to increased crop productivity while reducing the overall energy input for production units. In addition, solar-powered greenhouses showed a positive net energy (163.87 MJ·m−2), indicating an energy surplus. Our study revealed a significantly higher net energy compared with Sarkar et al. [16], who reported that the net energy for okra cultivation in open fields was 16,323.79 MJ·ha−1 (equivalent to 1.63 MJ·m−2). This indicates that using renewable energy enhances the EUE of the FCTB greenhouse. Furthermore, the surplus not only supports the greenhouse but can also provide additional energy to be used in other places. This enhances sustainability and cost-effectiveness. Okra’s energy productivity was low at 2.00 × 10⁻⁴ kg·MJ−1; this value was significantly lower than energy productivity for okra (0.56 kg·MJ−1) grown in open fields, as found by Sarkar et al. [16]. Also, it was lower compared with the other crops growing under greenhouse conditions such as tomato (1.06), chili in high land (0.61), chili in medium land (0.56), lettuce (0.33), and cucumber (0.70) [17,39]. This can be attributed to the lower yield of okra, which is limited by pot cultivation. Therefore, raising crop yield and reducing energy consumption can improve the energy performance of the FCTB-cooled greenhouse, as recommended by Taki et al. [17].

3.3. Greenhouse Gas Estimation

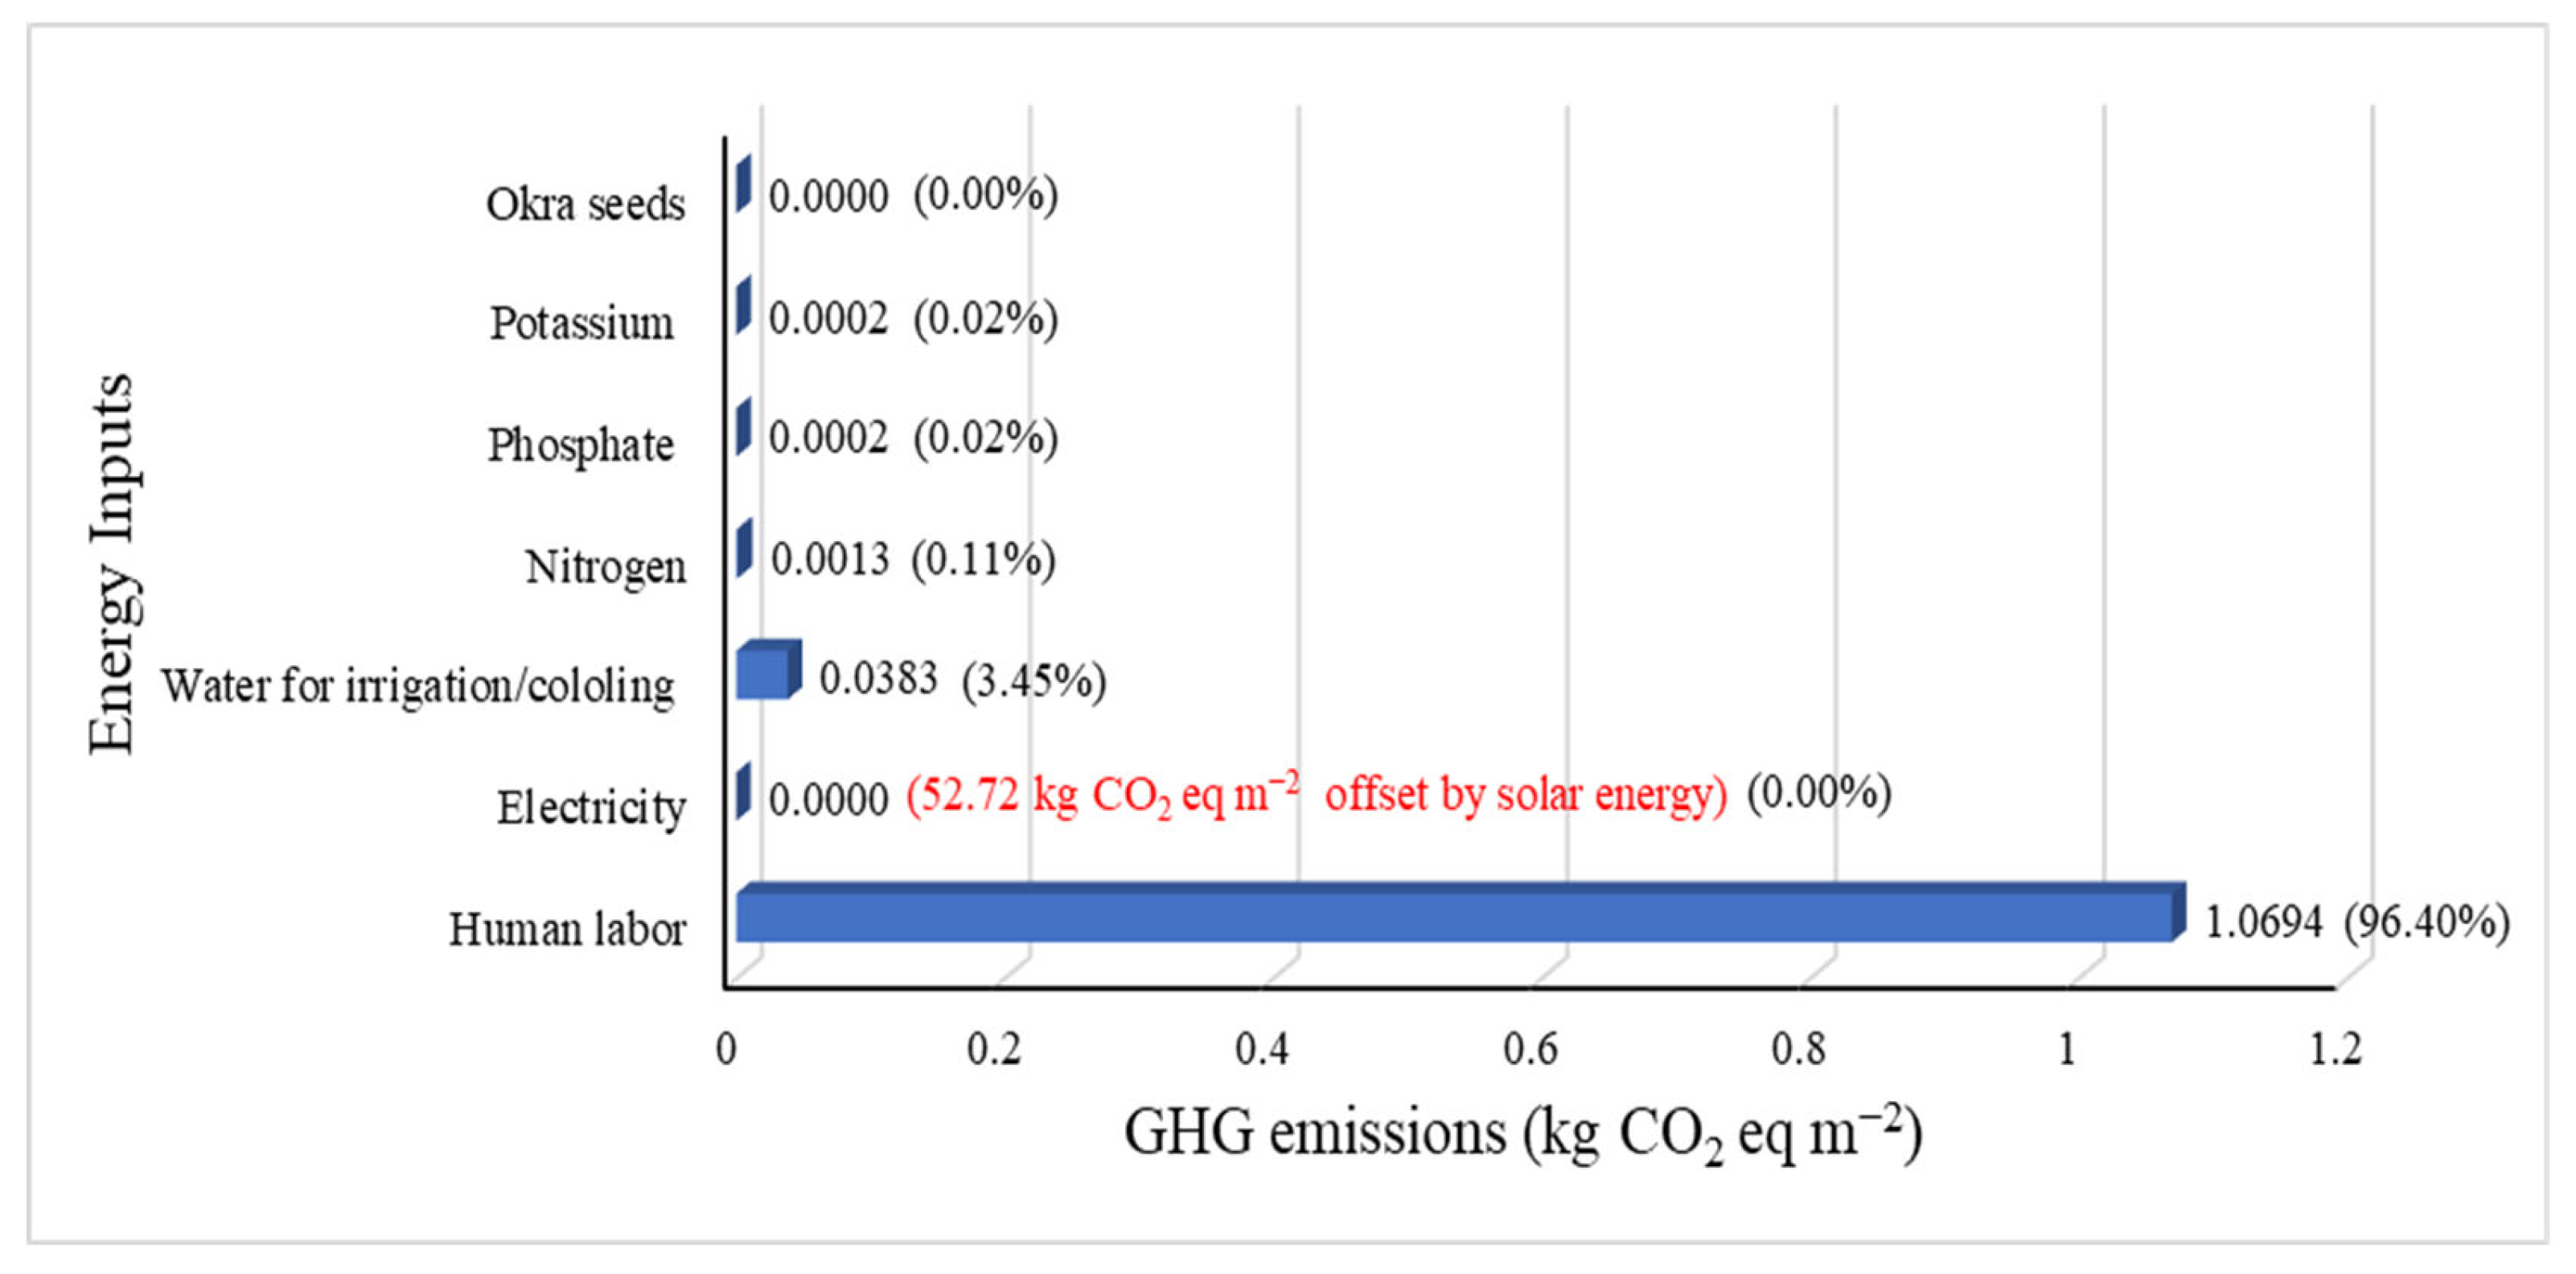
The GHG for all inputs used in the growing of okra under a solar-powered FCTB- cooled greenhouse was estimated at 1.11 kg CO2eq·m−2. Human labor was the main contributor, with 96.40% of the total GHG emissions, followed by water used for irrigation and cooling systems (3.45%) (Figure 11). The emissions from fertilizers and seeds were negligible due to their minimal contribution to the total GHG emissions. The electricity consumption contribution was zero due to the offset from the on-grid solar-powered system; the results indicate that this system contributed to a reduction of 52.72 kg CO2eq·m−2 of the total GHG emissions of the greenhouse (Table 5). Furthermore, the system generated surplus solar energy that was exported to the grid and used for other on-farm electric operations. Our findings differ from findings reported by Sarkar et al. [16] on okra GHG emissions under open field conditions, which demonstrated that the total GHG emissions were 875.41 kg CO2eq·ha−1 (equivalent to 0.0875 kg CO2eq·m−2), with electricity contributing 3.11% of the total. Although studies on GHG emissions of okra cultivation are limited, there are several that have been conducted to estimate GHG emissions on other crops. For instance, a study of GHG emissions of tomatoes under greenhouse conditions found that the total GHG emissions were 4280.849 kg CO2eq·ha−1 (equivalent to 0.4281 kg CO2eq·m−2), with diesel fuel constituting the highest share of emissions [17]. In contrast, the GHG emissions of this study (1.11 kg CO2eq·m−2) were lower compared with a study conducted by Pishgar-Komleh & Heidari [15], who demonstrated that the total GHG emissions achieved 82,724 kg CO2eq·ha−1 (8.2724 kg CO2eq·m−2) for greenhouse cucumber production. Another study on hydroponic zucchini production in a greenhouse reported that electricity accounted for the highest GHG emission (44%) due to the hydroponic system, and the GHG emissions were higher (3.87 to 5.09 kg CO2eq·m−2) than in our study [18]. Additionally, Ntinas et al. [40] reported that a tomato greenhouse equipped with a conventional heating system showed total GHG emissions of 58.7 kg CO2eq·m−2, with natural gas and electricity consumption as the largest contributors, which were mainly used for the heating system and operating irrigation systems. This finding was significantly higher compared with the total GHG emissions of the FCTB-cooled greenhouse reported by this study.

3.4. Water Use Efficiency (WUE)

Table 6 displays a solar-powered FCTB cooling system’s total WUE, IWUE, and CWUE. The yield of 3.69 kg indicates the amount of fruit production in one cultivation cycle. These efficiencies were calculated for okra based on the experiment’s yield. The WUE, IWUE, and CWUE of okra were 0.91, 2.07, and 1.63 (kg·m−3), respectively. These findings were significantly lower compared with the WUE and IWUE of the fan–pad evaporative-cooled greenhouse (WUE: 96.52 kg·m−3) and air conditioner-cooled greenhouse with lettuce (WUE: 100.32 kg·m−3) and cucumber cultivation (WUE: 38.6 to 49.2 kg·m−3, IWUE: 323 to 673.4 kg·m−3) [7,10]. This was due to the low okra yield generated during the cultivation period. Almasraf and Hommadi [41] reported that okra cultivation under a greenhouse using drip irrigation achieved a WUE ranging from 0.98 to 2.43 kg·m−3, which was higher than the WUE found in this study (0.91 kg·m−3). However, IWUE in this study (2.07 kg·m−3) was significantly higher than the reported value of drip-irrigated okra under greenhouse conditions, which ranged from 0.037 to 0.049 kg·m−3, as demonstrated by Ayas [42]. Furthermore, the CWUE of the solar-powered FCTB cooling system (1.63 kg·m−3) was significantly lower than that of the fan–pad cooling system (16 kg·m−3), as found by Sabeh et al. [13]. The water consumption of the fan–pad cooling system ranged from 9 to 20 m3, which was higher than the solar-powered FCTB cooling system (2.27 m3) [10]. Considering a similar okra yield and fan–pad cooling water consumption (9 to 20 m3), the fan–pad cooling system showed lower CWUE (0.41 to 0.198 kg·m−3) compared with the FCTB cooling system. Despite the lower water consumption of a solar-powered FCTB cooling system, the low yield of okra contributed to the reduced WUE efficiencies.

3.5. Financial Feasibility Analysis

3.5.1. Cost–Benefit and Investment Analysis

Financial analysis estimated three cultivation cycles of okra production, each lasting 60 days. The average okra price for each cultivation period was determined based on data from the National Center for Statistical Information, Oman. The annualized investment cost for each component was calculated using a 6% interest rate. Table 7 illustrates the initial capital and annualized investment cost of a solar-powered FCTB for okra greenhouse cultivation. For an 18 m2 greenhouse, the total yield of okra was 24.91 kg, while the total energy received was 5435.29 kWh. To clarify, the yield was estimated to increase in the second and third cycles, considering vertical farming rather than pot cultivation. There were two revenues to consider: okra yield and solar energy received. The total revenue from solar panel energy contributed the highest percentage at 82.84% of the total gross value of production. However, the revenue from okra fruits contributed 17.16% of the total gross value of production. This can be explained by the lower yield of okra achieved in this greenhouse system. The variable cost was higher than the fixed cost, which consistent with results found by Al-Manthria et al. [7] and Sepat et al. [27]. The gross return and net return of okra were USD 54.17 and USD −44.16, respectively. Financial productivity increased from 0.07 kg/USD when considering okra revenue alone to 0.39 kg/USD with revenues from both okra and solar energy received. The solar-powered FCTB-cooled greenhouse with okra production showed an 0.88 benefit–cost ratio, which means that, for every cent charged, a revenue of 0.88 was generated during the operational period. This value was less than 1, indicating that okra growth is not economically justified with a solar-powered FCTB-cooled greenhouse, which was also reported by Tupkanloo [43]. The okra greenhouse benefit–cost ratio showed a lower value compared with reported values in the literature for okra (1.17), tomatoes (1.43), chili in medium land (1.47), chili in high land (1.90), and lettuce (1.07) under greenhouse cultivation [16,39]. Even with a standard-sized 9 × 30 m greenhouse, the cost–benefit ratio of the solar-powered FCTB-cooled greenhouse under okra cultivation was lower (0.65), due to the limitation of okra and pot cultivations, compared with the overall cost of investment. These findings were explained by Sarkar et al. [16], who reported that the lower cost–benefit ratio of okra cultivation in the greenhouse was mainly due to the high production costs and low productivity of okra.
Similarly, financial analysis of the solar-powered FCTB-cooled greenhouse was estimated considering different crops (okra, cucumber, and cherry tomatoes) with three cultivation cycles. The yield (kg/plant) of each crop as reported in the literature is shown in Table 8. As indicated in Table 9, cucumber performed well in terms of total gross value (USD 2920.46), followed by cherry tomatoes (USD 1087.07), okra (from the literature) (USD 331.45), and okra (from the actual experiment) (USD 328.06). The numbers for cucumber and cherry tomatoes were higher because they produced a higher yield. Cucumber and cherry tomato yields accounted for 90.69% and 75.00% of the revenue, respectively. In addition, cucumber showed the highest net return (USD 2526.03), followed by cherry tomatoes (USD 716.03), which indicates higher profitability. Both okra varieties (USD −44.16, −40.77) exhibited a negative net return, indicating a financial deficit. The financial productivity from yield revenue alone and both revenues illustrate that cucumber exhibited the highest financial productivity, while okra showed the lowest. In addition, the results indicate the role of solar energy in improving financial productivity. The cost–benefit ratio of cucumber was the highest (7.40), followed by cherry tomatoes (2.93). The cost–benefit ratio with cucumber and cherry tomatoes was greater than 1, which indicates that they are economically viable in solar-powered FCTB-cooled greenhouses. The financial productivity and cost–benefit ratio of cucumber and cherry tomatoes were higher than lettuce production in AC-cooled (B/C: 2.98, FP: 0.63) and EV-cooled greenhouses (B/C: 4.28, FP: 0.92), while both okras showed lower values in solar-powered FCTB-cooled greenhouses compared with lettuce production in AC- and EV-cooled greenhouses [7]. In addition, the cost–benefit ratio of cucumber (7.40) was higher than the reported values for cucumber under greenhouse (1.43) and polyhouse (1.41) conditions [44,45]. The higher cost–benefit ratio and financial productivity of cucumber and cherry tomatoes compared with okra were due to the increase in yield, as illustrated by Al-Manthria et al. [7]. Farmers should consider cucumber or cherry tomato production in a solar-powered FCTB over okra to maximize the greenhouse’s financial productivity and profitability, according to the above comparison.

3.5.2. Cash Flow Analysis

Cash flow models were developed for the solar-powered FCTB-cooled greenhouse with okra cultivation and simulated for cucumber and cherry tomatoes in order to determine the internal rate of return (IRR). In addition, the present value of cash flow was measured to determine the net present value (NPV). The net cash flow for this greenhouse cultivated with okra, cherry tomatoes, and cucumber in the first year was negative because of the greenhouse’s high initial investment cost. From the second year on, the cash flow for all crops was positive. The net cash flow of cucumber and cherry tomatoes continuously showed positive results, but, in the twentieth year, it became negative because of the maintenance cost of the greenhouse and its systems. However, due to maintenance costs, the net cash flow of okra showed negative values every five years. The net present value (NPV) of a solar-powered FCTB-cooled greenhouse is highly positive for cucumber (USD 2.13 × 10⁴) and cherry tomatoes (USD 1.98 × 10⁴), with an IRR of 46% and 38% for cucumber and cherry tomatoes, respectively. This means that the investment in the greenhouse with cucumber and cherry tomatoes is expected to produce a profit over its lifetime. In contrast, the okra showed a highly negative net present value, indicating no IRR. Similarly, Al-Abdulkader [48] demonstrated that growing okra under greenhouse conditions in Saudi Arabia resulted in great cash flow losses, with an IRR for okra of less than zero due to high operating costs. However, the findings of this study were lower compared with the IRR of AC-cooled greenhouses (IRR: 63.4%), EV-cooled greenhouses (IRR: 129.3%) with lettuce cultivation, and EV-cooled greenhouses with cucumber cultivation (IRR: 47.0%) in Oman [7,8]. Additionally, the IRR values of this study contrasted with the results from previous studies on cucumber cultivation under greenhouse conditions, which reported IRRs of 48.11% [49] and 74% [50]. This can be due to lower investment costs and higher yield production compared with the solar-powered FCTB-cooled greenhouse with okra, cucumber, and cherry tomatoes [7]. In contrast, the IRR of cucumber and cherry tomato in this study was higher compared with the greenhouse under cucumber (IRR: 36%) and tomato cultivation (IRR: 24 to 28%) [43,48]. These findings indicate that a solar-powered FCTB-cooled greenhouse is more profitable with cucumber and cherry tomatoes than okra.

4. Conclusions

This study demonstrated that the solar-powered FCTB-cooled greenhouse enhanced sustainability by achieving an EUE of 1.16 and a positive net energy of 163.87 MJ·m−2. The incorporation of renewable energy contributed to a reduction of 52.72 kg CO2eq·m−2, achieving total GHG emissions of 1.11 kg CO2eq·m−2. Over the 105-day growing season, water consumption for cooling and irrigation remained low, with efficiencies of 0.91 kg·m−3, 2.07 kg·m−3, and 1.63 kg·m−3 for WUE, IWUE, and CWUE, respectively, which were restricted by the low yields of okra. Despite this limitation, the results indicate that the FCTB cooling system is an efficient and sustainable alternative to conventional cooling systems.
Financial analysis revealed that financial productivity improved with both revenues from crop production and solar energy received, making cucumber and cherry tomatoes economically feasible. However, growing okra was not economically feasible with the solar-powered FCTB-cooled greenhouse, as the benefit–cost ratio was less than 1 (0.88). Furthermore, the cash flow analysis demonstrated that the solar-powered FCTB-cooled greenhouse was profitable with cucumber (IRR 46%, NPV 2.13 × 10⁴ USD) and cherry tomatoes (IRR 38%, NPV 1.98 × 10⁴ USD), whereas okra cultivation yielded negative NPV and no IRR, demonstrating its economic infeasibility with this greenhouse. This study demonstrated that the solar-powered FCTB is water and energy efficient compared with the fan–pad cooling system. In addition, greenhouses using the solar-powered FCTB system are an economically viable option for farmers. However, the comparisons between the FCTB cooling system and the fan–pad cooling system relied on the literature values rather than direct experimental data. Further studies should be conducted to examine these two cooling systems under like conditions. Also, this study recommends further research with this system for Oman’s seasonal effect with high-value crops, while using vertical farming to maximize the productivity. In addition, this study recommends replacing the PVC tubes that constitute the tube bank with highly thermally conductive tubes made of such materials as copper, stainless steel, or aluminum to improve the efficiency of the FCTB cooling system. Lastly, the solar panel system consisted of 18 solar panels with a total power of 4500 watts. For farmers, this can be optimized according to their needs and budget. Overall, the adoption of solar-powered FCTB-cooled greenhouse enhances sustainable agriculture and rural socio-economic development.

Author Contributions

Conceptualization, T.A.-S. and H.P.J.; methodology, T.A.-S., H.P.J., O.A.-G., P.B.P. and A.A.-B.; software, O.A.-G.; validation, T.A.-S. and H.P.J.; formal analysis, O.A.-G.; investigation, O.A.-G. and A.A.-B.; resources, T.A.-S.; data curation, O.A.-G.; writing—original draft preparation, O.A.-G.; writing—review and editing, T.A.-S., H.P.J. and P.B.P.; visualization, O.A.-G.; supervision, T.A.-S. and H.P.J.; project administration, T.A.-S. and H.P.J.; funding acquisition, T.A.-S. All authors have read and agreed to the published version of the manuscript.

Funding

This research received no external funding.

Data Availability Statement

The raw data supporting the conclusions of this article will be made available by the authors on request.

Acknowledgments

The authors would like to acknowledge Mohammed Al-Belushi and Hamed Al-Busaidi from the Department of Soils, Water, and Agricultural Engineering for their technical assistance with the sensors and irrigation system installation; Abdallah Akintola from the Department of Natural Resource Economics for reviewing the financial analysis of this paper; and Khalif Al-Hinai, Ahmed Almalki, and Munther Al-Hinai from the Agricultural Experimental Station for their contribution to the experimental configuration of the greenhouse.

Conflicts of Interest

The authors declare no conflicts of interest.

Abbreviations

The following abbreviations are used in this manuscript:
TTemperature
RHRelative humidity
EVEvaporative cooling system
ACAir conditioner cooling system
EUEEnergy use efficiency
WUEWater use efficiency
FCTBFan-chiller tube bank
GHGGreenhouse gas
GVPGross value of production
IRRInternal rate of return
NPVNet present value
IWUEIrrigation water use efficiency
CWUECooling water use efficiency

References

  1. Dalai, S.; Tripathy, B.; Mohanta, S.; Sahu, B. Green-houses: Types and Structural Components. In Protected Cultivation and Smart Agriculture; New Delhi Publishers: New Delhi, India, 2020. [Google Scholar]
  2. Shamshiri, R.R.; Jones, J.W.; Thorp, K.R.; Ahmad, D.; Man, H.C.; Taheri, S. Review of optimum temperature, humidity, and vapour pressure deficit for microclimate evaluation and control in greenhouse cultivation of tomato: A review. Int. Agrophys. 2018, 32, 287–302. [Google Scholar]
  3. Iddio, E.; Wang, L.; Thomas, Y.; McMorrow, G.; Denzer, A. Energy efficient operation and modeling for greenhouses: A literature review. Renew. Sustain. Energy Rev. 2020, 117, 109480. [Google Scholar] [CrossRef]
  4. Soussi, M.; Chaibi, M.T.; Buchholz, M.; Saghrouni, Z. Comprehensive Review on Climate Control and Cooling Systems in Greenhouses under Hot and Arid Conditions. Agronomy 2022, 12, 626. [Google Scholar] [CrossRef]
  5. Singh, M.C.; Singh, J.P.; Pandey, S.K.; Mahay, D.; Shrivastva, V. Factors Affecting the Performance of Greenhouse Cucumber Cultivation-A Review. Int. J. Curr. Microbiol. Appl. Sci. 2017, 6, 2304–2323. [Google Scholar] [CrossRef]
  6. Ghoulem, M.; El Moueddeb, K.; Nehdi, E.; Boukhanouf, R.; Kaiser Calautit, J. Greenhouse design and cooling technologies for sustainable food cultivation in hot climates: Review of current practice and future status. Biosyst. Eng. 2019, 183, 121–150. [Google Scholar] [CrossRef]
  7. Al-Manthria, I.; Al-Ismailia, A.M.; Kotagamab, H.; Khanc, M.; Jeewanthad, L.H.J. Water, land, and energy use efficiencies and financial evaluation of air conditioner cooled greenhouses based on field experiments. J. Arid Land 2021, 13, 375–387. [Google Scholar] [CrossRef]
  8. Tabook, S.M. Evaluating the Performance of Greenhouse Cucumber Production in Barka. Master’s Thesis, Sultan Qaboos University, Muscat, Oman, 2017. [Google Scholar]
  9. Fadel, M.A.; Almekhmary, M.; Mousa, M. Water and Energy Use Efficiencies of Organic Tomatoes Production in a Typical Greenhouse under UAE Weather Conditions. Acta Hortic. 2014, 1054, 81–88. [Google Scholar] [CrossRef]
  10. Tabook, S.M.; Al-Ismaili, A.M. Evaluation of greenhouse cropping systems in Oman. Natl. Acad. Agric. Sci. 2016, 34, 715–720. [Google Scholar]
  11. Fan, Y.; Wang, C.; Nan, Z. Comparative evaluation of crop water use efficiency, economic analysis and net household profit simulation in arid Northwest China. Agric. Water Manag. 2014, 146, 335–345. [Google Scholar] [CrossRef]
  12. Al-Mezeini, N.K.; Al-Ismaili, A.M.; Tabook, S.M. Evaluation of energy use efficiency for greenhouse cucumber production in Barka, Oman. J. Agric. Mar. Sci. (JAMS) 2019, 24, 24–29. [Google Scholar]
  13. Sabeh, N.C.; Giacomelli, G.A.; Kubota, C. Water use in a greenhouse in a semi-arid climate. Am. Soc. Agric. Biol. Eng. 2011, 54, 1069–1077. [Google Scholar]
  14. Çakir, R.; Kanburoglu-Çebi, U.; Altintas, S.; Ozdemir, A. Irrigation scheduling and water use efficiency of cucumber grown as a spring-summer cycle crop in solar greenhouse. Agric. Water Manag. 2017, 180, 78–87. [Google Scholar] [CrossRef]
  15. Pishgar-Komleh, S.H.; Omid, M.; Heidari, M.D. On the study of energy use and GHG (greenhouse gas) emissions in greenhouse cucumber production in Yazd province. Energy 2013, 59, 63–71. [Google Scholar] [CrossRef]
  16. Sarkar, B.; Das, B.; Sundaram, P.K.; Mali, S.S.; Anurag, A.P.; Upadhyaya, A.; Chandra, N.; Bhatt, B.P.; Kumar, A. Energy input–output analysis and greenhouse gas emission in okra and tomato production in Chotanagpur plateau region of India. Environ. Dev. Sustain. 2023, 11, 12945–12964. [Google Scholar] [CrossRef]
  17. Taki, M.; Abdi, R.; Akbarpour, M.; Mobtaker, H.G. Energy inputs–yield relationship and sensitivity analysis for tomato greenhouse production in Iran. Agric. Eng. Int. CIGR J. 2013, 15, 59–67. [Google Scholar]
  18. Baptista, F.J.; Silva, L.L.; Murcho, D. Energy consumption and greenhouse gas emissions of zucchini (Cucurbita pepo L.) cultivated in hydroponic greenhouses in the western region of Portugal. In ISHS Acta Horticulturae 1227, Proceedings of the International Symposium on New Technologies for Environment Control, Energy-Saving and Crop Production in Greenhouse and Plant Factory—GreenSys 2017, Beijing, China, 20–24 August 2017; ISHS: Leuven, Belgium, 2018; pp. 181–188. [Google Scholar]
  19. Jayasuriya, H.; Al-Ismaili, A.; Al-Shukaili, T. Farming Systems in Oman and Mechanization Potentials. Agric. Mech. Asia Afr. Lat. Am. 2017, 48, 66–74. [Google Scholar]
  20. Benchasri, S. Okra (Abelmoschus esculentus (L.) Moench) as a valuable vegetable of the world. Ratar. Povrt. 2012, 49, 105–112. [Google Scholar]
  21. Morwal, B.R.; Patel, M.C. Growth and Yield of Okra (Abelmoschus esculentus L) as Affected by Date of Sowing and Spacing under north Gujarat Condition. J. Krishi Vigyan 2017, 6, 93. [Google Scholar] [CrossRef]
  22. Mohammadi, A.; Rafiee, S.; Jafari, A.; Keyhani, A.; Mousavi-Avval, S.H.; Nonhebel, S. Energy use efficiency and greenhouse gas emissions of farming systems in north Iran. Renew. Sustain. Energy Rev. 2014, 30, 724–733. [Google Scholar] [CrossRef]
  23. Hedau, N.K.; Tuti, M.D.; Stanley, J.; Mina, B.L.; Agrawal, P.K.; Bisht, J.K.; Bhatt, J.C. Energy-use efficiency and economic analysis of vegetable cropping sequences under greenhouse condition. Energy Effic. 2014, 7, 507–515. [Google Scholar]
  24. Houshyar, E.; Dalgaard, T.; Tarazkar, M.H.; Jørgensen, U. Energy input for tomato production what economy says, and what is good for the environment. J. Clean. Prod. 2015, 89, 99–109. [Google Scholar] [CrossRef]
  25. Baran, M.F.; Eren, O.; Gökdoğan, O.; Oğuz, H.I. Determination of Energy Efficiency and Greenhouse Gas (GHG) Emissions in Organic Almond Production in Turkey. Erwerbs-Obstbau 2020, 62, 341–346. [Google Scholar] [CrossRef]
  26. Nabavi-Pelesaraei, A.; Abdi, R.; Rafiee, S.; Mobtaker, H.G. Optimization of energy required and greenhouse gas emissions analysis for orange producers using data envelopment analysis approach. J. Clean. Prod. 2014, 65, 311–317. [Google Scholar] [CrossRef]
  27. Sepat, N.K.; Sepat, S.R.; Sepat, S.; Kumar, A. IPA-Under Creative Commons license 3.0 Energy use efficiency and cost analysis of tomato under greenhouse and open field production system at Nubra valley of Jammu and Kashmir. Int. J. Environ. Sci. 2013, 3, 1233–1241. [Google Scholar]
  28. Gaspars-Wieloch, H. Project net present value estimation under uncertainty. Cent. Eur. J. Oper. Res. 2019, 27, 179–197. [Google Scholar] [CrossRef]
  29. Bwire, D.; Watanabe, F.; Suzuki, S.; Suzuki, K. Improving Irrigation Water Use Efficiency and Maximizing Vegetable Yields with Drip Irrigation and Poly-Mulching: A Climate-Smart Approach. Water 2024, 16, 3458. [Google Scholar] [CrossRef]
  30. Harun -Or-Rashid, M.; Rahman, K.M.; Sultana, F.; Hossain, M.M.; Gazi, A.R. Greenhouse climate on production potentialities of Okra. J. Agrofor. Environ. 2018, 79–82. [Google Scholar]
  31. Kakade, S.R.V.; Gupta, S.N.; Patil, B.C.; Karne, S. Study of Biometric Parameters of Okra in Different Shade Net House. Int. J. Curr. Microbiol. Appl. Sci. 2018, 7, 43–53. [Google Scholar] [CrossRef]
  32. Chacha, J.M.; Thirumalai, M.; Mathias, N.M.; Idawa, O.K.; Chilwea, J.P.; Kilamba, C.J.; Hussy, B.D.; Rajendran, K.; Ishaq, H. Greenhouse and open-field Tomato farming. A comparison through yield and growth parameters investigated in Dar es Salaam. Innov. Agric. 2023, 6, e32876. [Google Scholar] [CrossRef]
  33. Prasad, R.P.; Gill, R.; Gupta, V.; Rao, R.K.; Bordoloi, P.; Ahmed, M. Recent Advances in Agricultural Science and Technology for Sustainable India. 2022. Available online: https://www.researchgate.net/publication/358021517 (accessed on 25 September 2025).
  34. Alhamrani, K.S.L.; Abdullah, A.A.; Taain, D.A. Effect of planting dates, soil mulching and foliar spraying calcium on the quantitative yield characteristics of okra plant grown in plastic greenhouse. Basrah J. Agric. Sci. 2019, 32, 171–182. [Google Scholar] [CrossRef]
  35. Poorter, H.; Bühler, J.; Van Dusschoten, D.; Climent, J.; Postma, J.A. Pot size matters: A meta-analysis of the effects of rooting volume on plant growth. Funct. Plant Biol. 2012, 39, 839–850. [Google Scholar] [CrossRef]
  36. Oagile, O.; Gabolemogwe, P.; Matsuane, C.; Mathowa, T. Effect of container size on the growth and development of tomato seedlings. Int. J. Curr. Microbiol. Appl. Sci. 2016, 5, 890–896. [Google Scholar] [CrossRef]
  37. Sansa, I.; Mrabet Bellaaj, N. Forecasting and Modelling of Solar Radiation for Photovoltaic (PV) Systems. In Solar Radiation—Measurement, Modeling and Forecasting Techniques for Photovoltaic Solar Energy Applications; IntechOpen: London, UK; Vienna, Austria, 2021. [Google Scholar]
  38. Elhag, M.; Boteva, S. Conceptual assessment of energy input-output analysis and data envelopment analysis of greenhouse crops in Crete Island, Greece. Environ. Sci. Pollut. Res. 2019, 26, 35377–35386. [Google Scholar] [CrossRef] [PubMed]
  39. Kuswardhani, N.; Soni, P.; Shivakoti, G.P. Comparative energy input-output and financial analyses of greenhouse and open field vegetables production in West Java, Indonesia. Energy 2013, 53, 83–92. [Google Scholar] [CrossRef]
  40. Ntinas, G.K.; Neumair, M.; Tsadilas, C.D.; Meyer, J. Carbon footprint and cumulative energy demand of greenhouse and open-field tomato cultivation systems under Southern and Central European climatic conditions. J. Clean Prod. 2017, 142, 3617–3626. [Google Scholar] [CrossRef]
  41. Almasraf, S.A.; Hommadi, A.H. Improving Water Use Efficiency and Water Productivity for Okra Crop by using Subsurface Water Retention Technology. J. Eng. 2018, 24, 64–74. [Google Scholar] [CrossRef]
  42. Ayas, S. Response of Okra (Abelmoschus Esculentus l. Yalova Akköy-41) to Different Irrigation and Fertigation Levels. Turk. J. Agric. Food Sci. Technol. 2020, 8, 2225–2235. [Google Scholar] [CrossRef]
  43. Tupkanloo, Z.N. Economic analysis of greenhouse cultivation of tomatoes and cucumber vegetables in Neyshabur, Iran. J. Pure Appl. Microbiol. 2015, 9, 613–616. [Google Scholar]
  44. Malikk, K. Economic Viability of Cucumber Cultivation in Greenhouses. Int. J. Bus. Manag. Res. 2017, 5, 1–3. [Google Scholar]
  45. Malik, K.; Kumar, V. Economic viability of cucumber cultivation under polyhouses in Haryana. Ann. Agri Bio Res. 2020, 25, 299–301. [Google Scholar]
  46. Al-Mfargy, O.K.A.; Al-Juwari, M.S.M. Estimation of Hybrid Vigor for Flowering and Yield Cherry Tomato Hybrids. IOP Conf. Ser. Earth Environ. Sci. 2023, 1158, 042066. [Google Scholar] [CrossRef]
  47. Badgery-Parker, J.; James, L.; Jarvis, J.; Parks, S. Commercial Greenhouse Cucumber Production; NSW Agriculture: Sydney, Australia, 2019. [Google Scholar]
  48. Al-Abdulkader, A.M. Financial Analysis of Greenhouse Vegetable Specialized Projects in Saudi Arabia. Acta Hortic. 2006, 710, 527–534. [Google Scholar] [CrossRef]
  49. Diab, Y.A.A.; Mousa, A.A.; Abbas, H.S. Greenhouse-grown Cucumber as an Alternative to Field Production and its Economic Feasibility in Aswan Governorate, Egypt. Assiut J. Agric. Sci. 2016, 47, 122–135. [Google Scholar]
  50. Sokar, M.A.M. ‫Economic study Cucumber Crop production in greenhouses in new lands. Egypt. J. Agric. Econ. 2024, 9, 3. [Google Scholar]
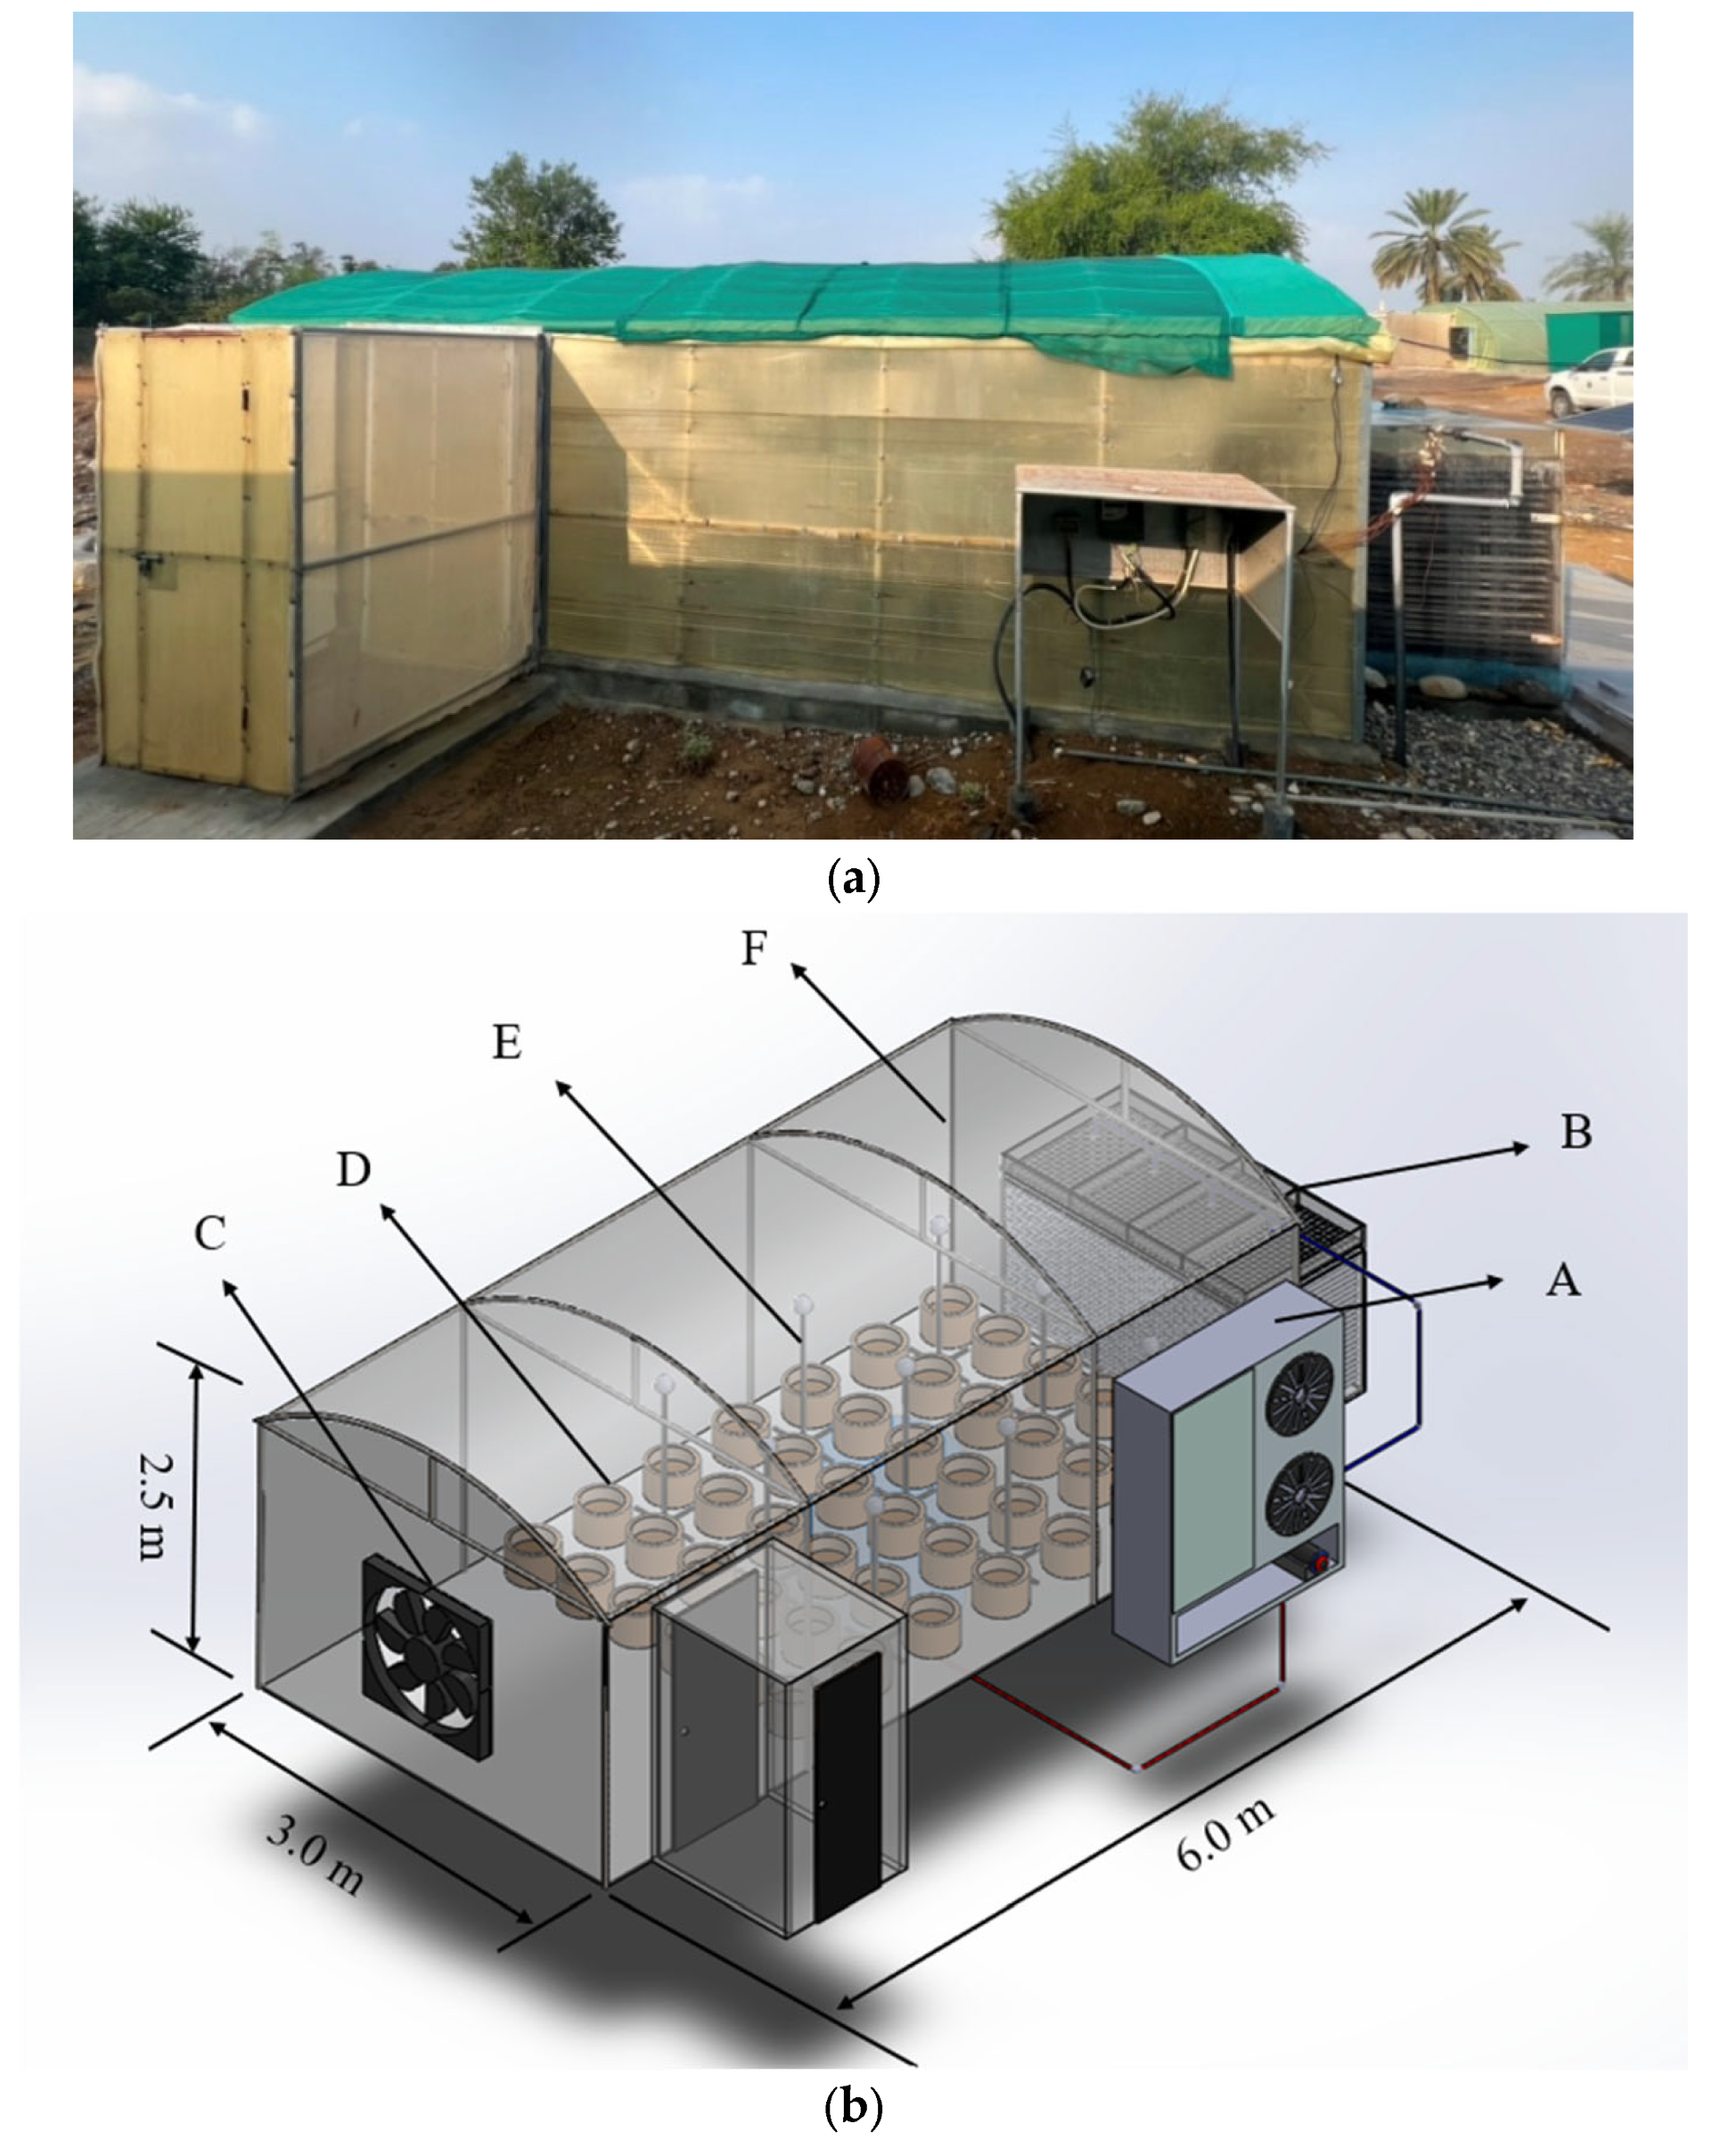
Figure 1. (a) Greenhouse at the agricultural experimental station; (b) greenhouse layout (A: chiller; B: tube bank; C: exhaust fan; D: pot cultivation; E: temperature, relative humidity, and light intensity sensor; F: polycarbonate sheet).
Agriculture 15 02044 g001
Figure 2. (a) Drawing of a chiller and tube bank cooling system (A: tube bank heat exchanger, B: underground tank, C: water chiller); (b) tube bank heat exchanger covered with plastic mesh.
Agriculture 15 02044 g002
Figure 3. Flowchart of the operation of the FCTB.
Agriculture 15 02044 g003
Figure 4. Arrangement of HOBO data logger sensors inside the greenhouse.
Agriculture 15 02044 g004
Figure 5. Grouping of okra plants inside the greenhouse into blocks relative to the tube bank and the exhaust fan locations.
Agriculture 15 02044 g005
Figure 6. Distribution of energy input used for a solar-powered FCTB-cooled greenhouse.
Agriculture 15 02044 g006
Figure 7. Comparison of okra yield among blocks within the greenhouse.
Agriculture 15 02044 g007
Figure 8. Comparison of okra total dry biomass among blocks within greenhouse.
Agriculture 15 02044 g008
Figure 9. Spatial distribution of the average seasonal temperature and relative humidity inside the greenhouse.
Agriculture 15 02044 g009
Figure 10. Weekly averages of solar radiation energy during the cultivation period.
Agriculture 15 02044 g010
Figure 11. GHG emissions of solar-powered FCTB-cooled greenhouse.
Agriculture 15 02044 g011
Table 1. The energy equivalent for inputs and outputs utilized in agricultural production [16].
InputsUnitEquivalent Energy (MJ·unit−1)
1. Human labor
(a) Adult menh1.96
(b) Womenh1.57
2. ElectricitykWh11.93
3. Water for irrigation/cooling m31.02
4. Chemical fertilizers
(a) Nitrogenkg60.6
(b) Phosphate (P2O5)kg11.1
(c) Potassium (K2O)kg6.7
5. Okra seedskg25.6
Output
Crop yield (okra)kg1.9
Leaves, vines, and straw from the vegetableskg10
Table 2. Greenhouse gas emission coefficients utilized in agricultural production.
InputsUnitGHG Coefficient (kg CO2eq·unit−1)References
1. Human laborh0.7[25]
2. ElectricitykWh0.608[26]
3. Water for irrigation m30.17[25]
4. Chemical fertilizers
(a) Nitrogenkg1.3[26]
(b) Phosphate (P2O5)kg0.2[26]
(c) Potassium (K2O)kg0.2[26]
5. Okra seedskg0.17[24]
Table 3. Energy input and output for the 18 m2 solar-powered greenhouse.
Energy SourceUnitsQuantity per Unit Area (unit m−2)Equivalent Energy (MJ·unit−1)Total Energy Equivalents (MJ·m−2)
Inputs
1. Human labor
(a) Menh0.971.961.91
(b) Womenh0.561.570.87
2. ElectricitykWh86.7111.931034.39
3. Water for irrigation/coolingm30.231.020.23
4. Chemical fertilizers
(a) Nitrogenkg1.00 × 10−360.65.86 × 10−2
(b) Phosphate (P2O5)kg1.00 × 10−311.11.07 × 10−2
(c) Potassium (K2O)kg1.00 × 10−36.76.50 × 10−3
5. Okra seedskg2.00 × 10−425.64.70 × 10−3
Total input (MJ/m2) 1037.48
Output
Crop yield (okra)kg0.211.900.39
Leaves, vines, and straw from vegetableskg0.0210.000.17
Solar energy receivedkWh100.6511.931200.79
Total output (MJ/m2) 1201.35
Table 4. Energy performance of a solar-powered FCTB cooling system.
Performance IndexSolar Powered GH
Energy use efficiency1.16
Energy productivity (kg·MJ−1)2.00 × 10⁻⁴
Net energy (MJ·m−2)163.87
Table 5. On-grid solar energy and greenhouse offset potential.
UnitsQuantity per Unit
Area (unit·m−2)
GHG Coefficient
(kg CO2 eq·unit−1)
GHG Emissions
(kg CO2eq·m−2)
Solar energy exported to the gridkWh100.65
GHG offset for GH electricity usekWh86.710.6152.72
Surplus solar energy (offsets emissions elsewhere)kWh13.940.618.48
Table 6. Water use efficiency of solar-powered FCTB-cooled greenhouse under okra cultivation.
CropIrrigation Water (m3)Cooling Water (m3)WUE (kg·m−3)IWUE (kg·m−3)CWUE (kg·m−3)
Okra1.792.270.912.071.63
Table 7. Initial capital and annualized investments of solar-powered FCTB-cooled greenhouse with okra cultivation.
ItemLifetimeInitial Investment Cost (USD)Annualized
Investment Cost (USD)
Greenhouse frame201664.0024.18
Covering material (polycarbonate)10540.4612.24
Cooling system101560.0035.33
Irrigation accessories526.001.03
Water tank20208.003.02
Irrigation pump539.001.54
Pots115.602.76
Solar energy system201212.8217.62
Battery-powered controller515.600.62
Thermocouples552.002.06
RH, T, LI sensors101344.5630.45
Total 5281.4898.33
Table 8. Yield of the okra, cherry tomatoes, and cucumber per plant.
CropsYield (kg/Plant)Yield (kg)Reference
Okra *0.068413.694-
Okra0.1638.802[30]
Cherry tomatoes4.66252.64[46]
Cucumber15.00810.00[47]
* Okra yield from the actual experiment.
Table 9. Financial analysis * of solar-powered FCTB cooling system for okra **, okra, cucumber, and cherry tomato greenhouse cultivation.
Cost and Return ComponentsOkra **OkraCucumberCherry
Tomatoes
Total yield (kg)24.9126.412430.00754.92
Price 1 (USD/kg)2.262.261.091.08
Revenue 1 (USD)56.3059.692648.70815.31
Solar energy received (kWh)5435.295435.295435.295435.29
Price 2 (USD/kWh)0.050.050.050.05
Revenue 2 (USD)271.76271.76271.76271.76
Total gross value of production (USD) 328.06331.452920.461087.07
Total variable cost (USD)273.89273.89296.1272.71
Total fixed cost (USD)98.3398.3398.3398.33
Total cost of production (USD) 372.22372.22394.43371.04
Gross return (USD)54.1757.562624.36814.36
Net return (USD)−44.16−40.772526.03716.03
Benefit to cost ratio 0.880.897.402.93
Financial productivity (yield income alone) (USD/kg) 0.070.076.162.03
Financial productivity (for both income) (USD/kg) 0.390.396.792.71
* All calculations were performed for an 18 m2 greenhouse. ** Okra yield from the actual experiment.
Disclaimer/Publisher’s Note: The statements, opinions and data contained in all publications are solely those of the individual author(s) and contributor(s) and not of MDPI and/or the editor(s). MDPI and/or the editor(s) disclaim responsibility for any injury to people or property resulting from any ideas, methods, instructions or products referred to in the content.