Article

LiteFocus-YOLO: An Efficient Network for Identifying Dense Tassels in Field Environments

1
College of Information Technology, Jilin Agricultural University, Changchun 130118, China
2
College of Electronic Science and Engineering, Jilin University, Changchun 130012, China
3
School of Life Science, Changchun Normal University, Changchun 130032, China
4
Jilin Province Agricultural Internet of Things Technology Collaborative Innovation Center, Changchun 130118, China
5
Jilin Province Intelligent Environmental Engineering Research Center, Changchun 130118, China
6
College of Engineering and Technology, Jilin Agricultural University, Changchun 130118, China
*
Authors to whom correspondence should be addressed.
Agriculture 2025, 15(19), 2036; https://doi.org/10.3390/agriculture15192036
Submission received: 7 September 2025 / Revised: 25 September 2025 / Accepted: 26 September 2025 / Published: 28 September 2025
(This article belongs to the Special Issue Plant Diagnosis and Monitoring for Agricultural Production)

Abstract

High-efficiency and precise detection of crop ears in the field is a core component of intelligent agricultural yield estimation. However, challenges such as overlapping ears caused by dense planting, complex background interference, and blurred boundaries of small targets severely limit the accuracy and practicality of existing detection models. This paper introduces LiteFocus-YOLO(LF-YOLO), an efficient small-object detection model. By synergistically enhancing feature expression through cross-scale texture optimization and attention mechanisms, it achieves high-precision identification of maize tassels and wheat ears. The model innovatively incorporates the following: The Lightweight Target-Aware Attention Module (LTAM) strengthens high-frequency feature expression for small targets while reducing background interference, enhancing robustness in densely occluded scenes. The Cross-Feature Fusion Module (CFFM) addresses semantic detail loss through deep-shallow feature fusion modulation, optimizing small target localization accuracy. The experiment validated performance on the drone-based maize tassel dataset. Results show that LF-YOLO achieved an mAP50 of 97.9%, with mAP50 scores of 94.6% and 95.7% on the publicly available maize tassel and wheat ear datasets, respectively. It achieves generalization across different crops while maintaining high accuracy and recall. Compared to current mainstream object detection models, LF-YOLO delivers higher precision at lower computational cost, providing efficient technical support for dense small object detection tasks in agricultural fields.

1. Introduction

Maize and wheat, as global staple food and feed crops, increasingly highlight the importance of stable high yields. As the direct bearer of yield formation, the number and distribution of ears reflect their ultimate productivity. Crop densification technology is widely adopted for its yield-enhancing potential, yet it simultaneously leads to a surge in ear density for maize and wheat, where intertwined stems and leaves create detection blind spots. Traditional manual field inspections relying on visual counting are not only time-consuming and labor-intensive but also suffer from high rates of missed counts due to dense plant coverage. In recent years, with advancements in drone technology and deep learning, field target detection and counting using drone platforms have gradually gained traction in the agricultural sector.
Currently, deep learning-based object detection algorithms are primarily categorized into one-stage and two-stage detection. Two-stage detection algorithms first generate candidate regions, followed by classification and bounding box regression on these regions. Widely adopted algorithms include Faster R-CNN [1] and Mask R-CNN [2]. Liu et al. [3] significantly improved multi-source maize ear detection accuracy by modifying the Faster R-CNN framework. They adopted a ResNet backbone network and adaptively adjusted anchor box sizes based on ear pixel distribution. Geng et al. [4] proposed an enhanced Mask-RCNN model. By optimizing anchor box proportions via K-means clustering, compressing residual unit group convolutional parameters, and adding a CBAM module at the ResNet tail end, they substantially improved the identification efficiency of harvested ear losses in complex farmland backgrounds. Although two-stage object detection models exhibit high detection accuracy, their structural characteristics—including slow inference speed, high resource consumption, and limited generalization to multi-scale crop features—make them ill-suited for dynamic agricultural monitoring requirements.
Stage-one object detection algorithms can directly output object categories and locations from input images without first extracting candidate regions. Through an end-to-end single-pass prediction mechanism, they enhance inference speed while maintaining high accuracy. Li et al. [5] proposed an improved YOLOv5 algorithm. By adding subsampling layers to expand the receptive field, it enhances small object detection capabilities. The introduction of the CBAM attention mechanism strengthens feature extraction and mitigates gradient vanishing issues, effectively addressing false positives and false negatives caused by overlapping occlusions in fields. Ban et al. [6] proposed a lightweight, improved YOLOv8n model. It enhances small object detection by removing redundant P5 feature layers and reduces parameter size by replacing standard Conv layers with Depthwise convolutions. This addresses challenges like dense ear occlusions, background interference, and size variations in wheat fields. Qiu et al. [7] proposed a lightweight millet ear detection model based on YOLOv5: introducing GhostNet for parameter compression, embedding Coordinate Attention (CA) to enhance occluded target recognition, and utilizing EIOU loss to optimize localization accuracy, providing efficient technical support for intelligent yield estimation in dense millet fields. Chen et al. [8] proposed the RESAM-YOLOv8n model, which incorporates residual spatial attention and large-input image training to address overlapping target recognition, small-scale feature extraction, and strong light interference. Based on a self-built full-maturity-cycle time-series dataset (FMTS), the model significantly enhances detection performance. Wang et al. [9] optimized the RetinaNet model for maize ear detection in complex fields: reconstructing the feature pyramid structure and embedding an attention mechanism improved spikelet recognition. Although deep learning object detection models have been widely applied in agricultural monitoring, current research still faces challenges such as missed detections of small objects and difficulty distinguishing targets under complex background occlusions. Moreover, most existing studies focus on model optimization for single crops, lacking generalization capabilities for other crops with similar features. Therefore, we propose an improved efficient YOLO model focused on small targets—LiteFocus-YOLO (LF-YOLO). By synergistically enhancing feature expression through cross-scale texture optimization and lightweight attention mechanisms, the model achieves high-precision identification of crop ears in complex occlusion environments.
The contributions of this paper are as follows:
Proposes the adaptive gated feature fusion module Detail Extraction-C2f (DE-C2f), which synergistically optimizes texture information flow through multi-scale deep separation convolutional groups and dual-path feature enhancement mechanisms. While cascading expands the receptive fields of shallow features, it suppresses background noise interference during cross-scale fusion, significantly enhancing boundary recognition capabilities for small objects.
Introduces the lightweight target-aware attention module (LTAM), constructed through a channel–spatial dual-branch attention compression architecture and a bottleneck-style feature enhancement pathway. This enhances high-frequency feature representation for small targets while mitigating gradient dispersion effects in complex backgrounds, enabling robust perception in densely occluded scenes.
A Cross-Feature Fusion Module (CFFM) is introduced. Based on dynamic up-sampling alignment technology and a multi-domain attention coordination mechanism, it reconstructs feature interaction pathways. Through multi-dimensional weight modulation of shallow and deep-layer features, it addresses the loss of spatial details in semantic information during fusion, thereby optimizing small target localization accuracy.

2. Materials and Methods

2.1. Research Area

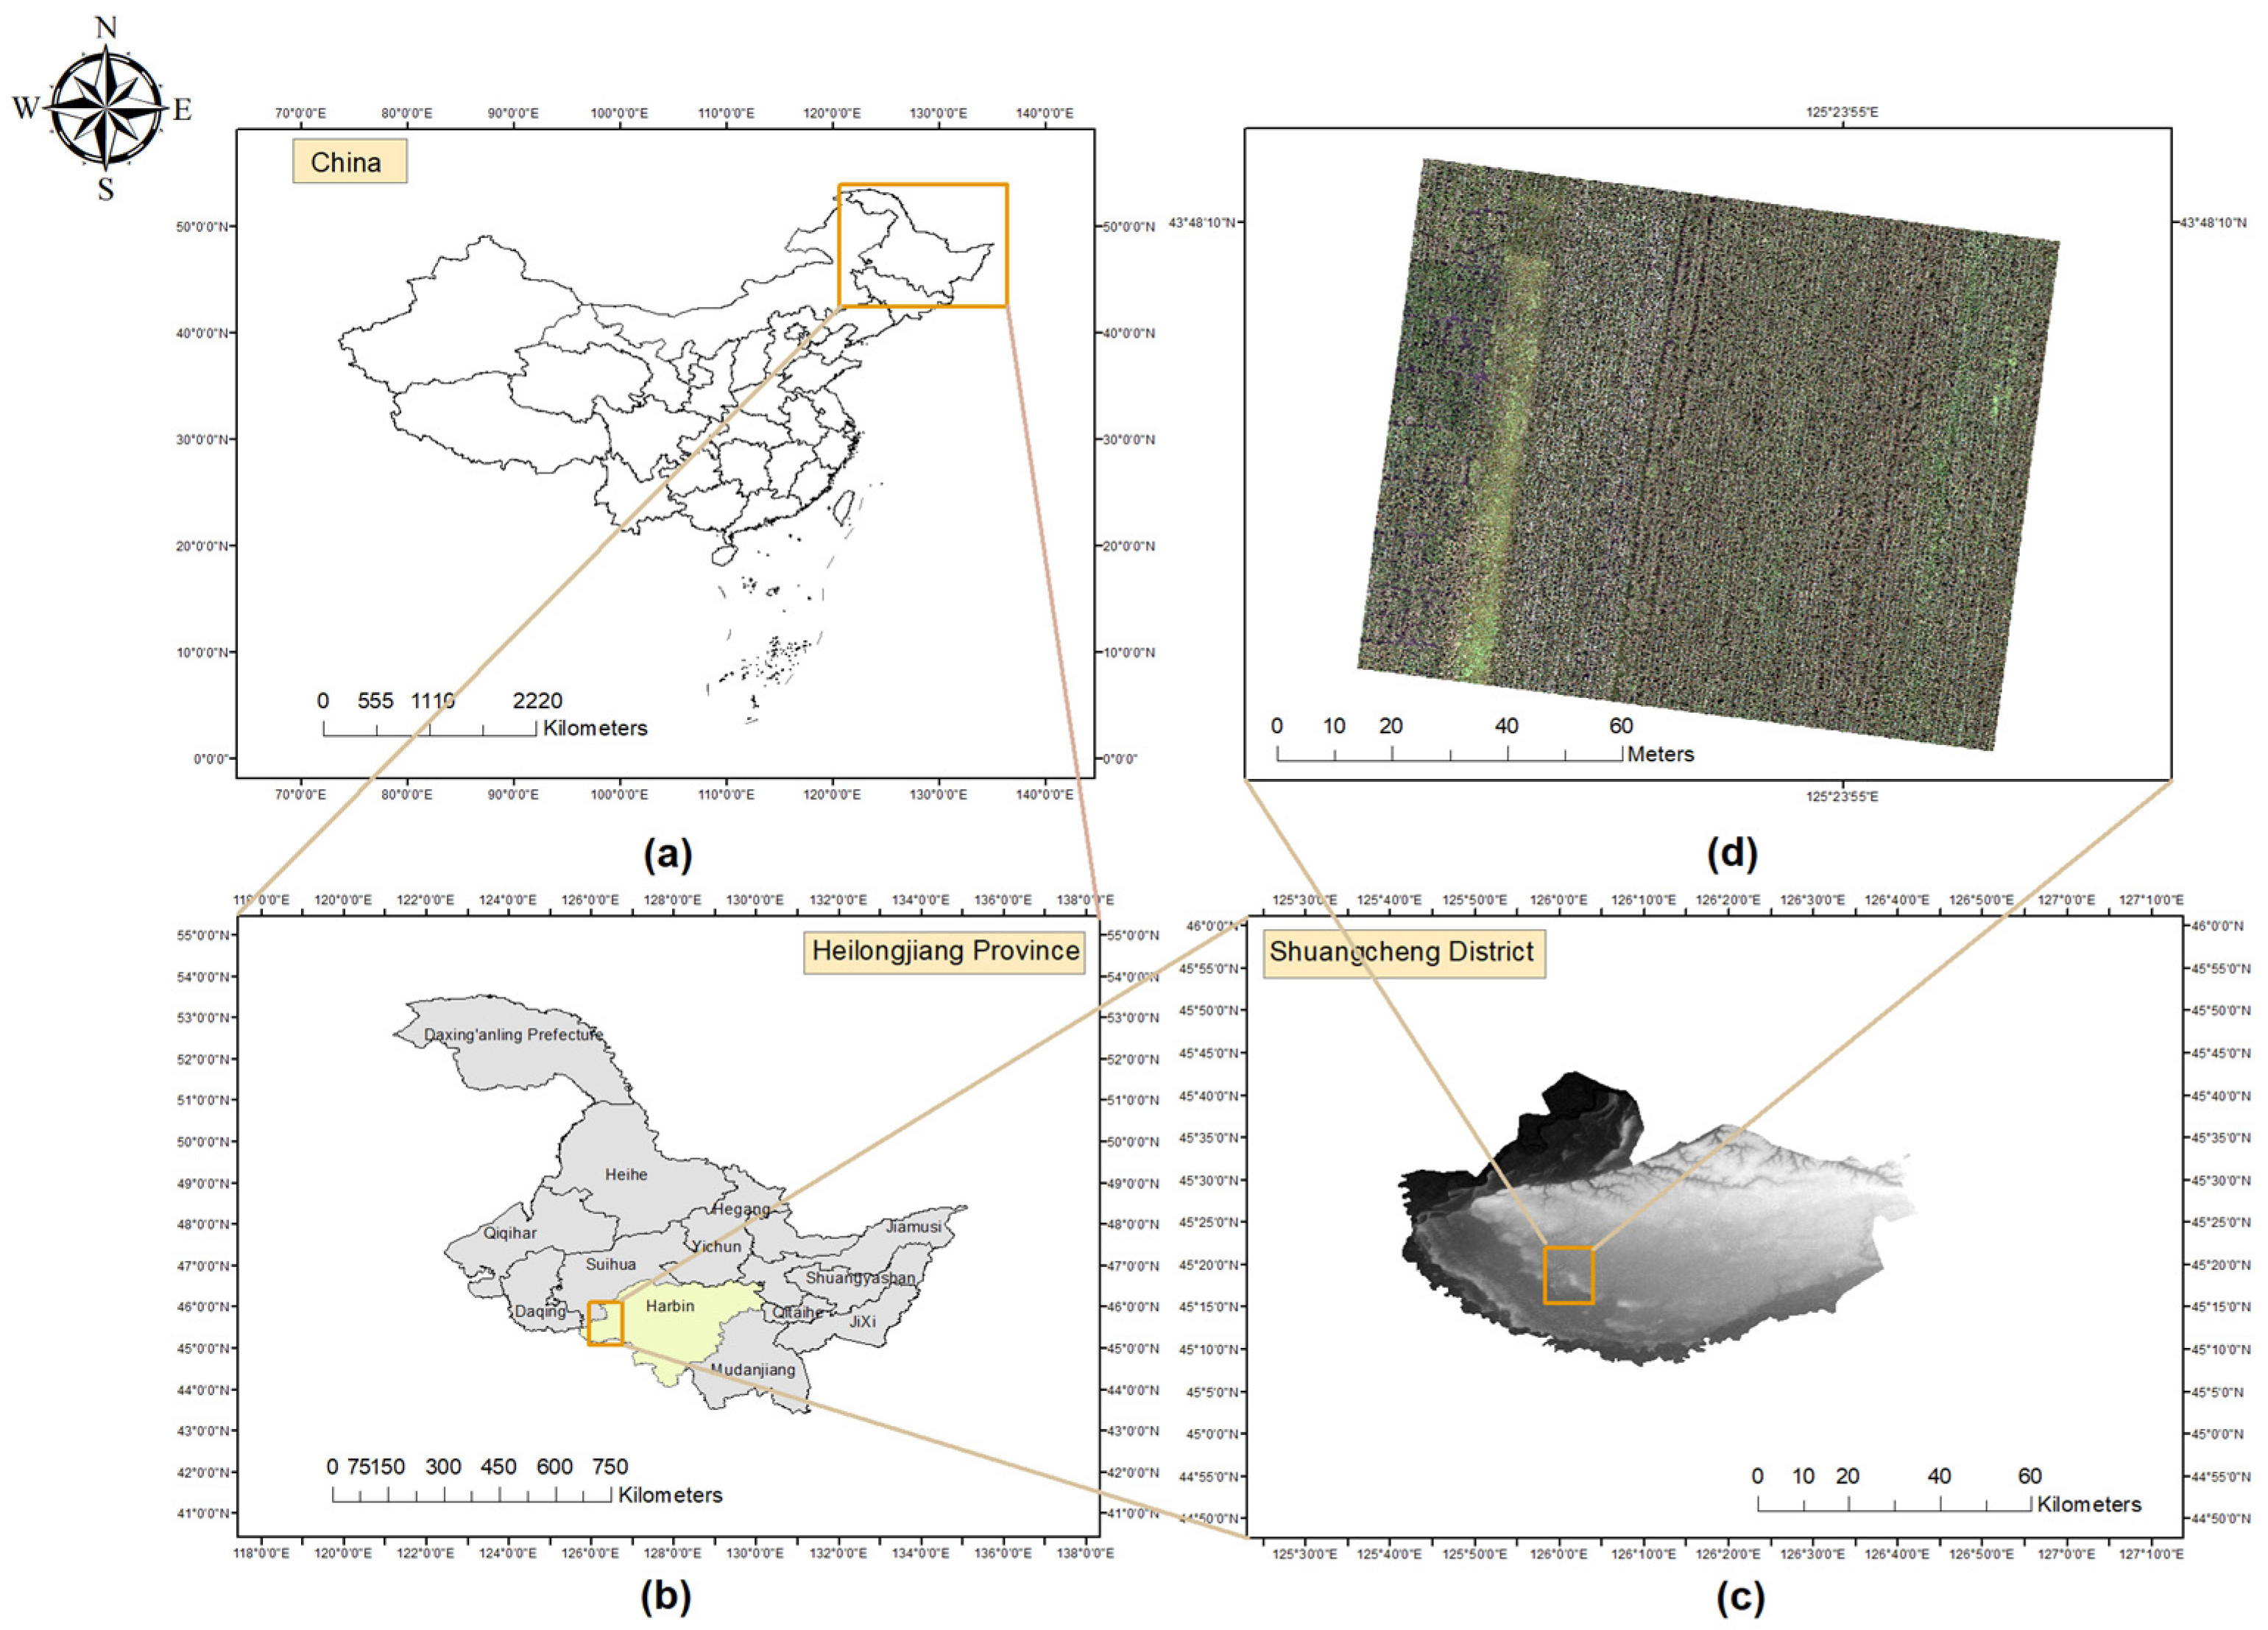
The drone-captured Maize tassel dataset (UAVMaize) used in this study was collected from the Haosong Agricultural Base in Xixin Village, Shuangcheng District, Harbin City, Heilongjiang Province, China. For this experiment, a 7-mu plot planted with Maize was selected as the sampling area. Within this area, six distinct Maize varieties cultivated for breeding purposes were grown. The overview map of the study area is shown in Figure 1.

2.2. Data Collection

The experimental data collection period was from 30 July 2025 to 15 August 2025. During this period, the Maize plants were in the tasseling stage, with mature tassels visible at the top of the plants, making them suitable for research purposes.
Data acquisition was conducted using a DJI Phantom 4 drone. The flight altitude was set at 8 m, with a ground resolution of 0.5 cm/px, a flight speed of 5 m/s, and a forward and lateral overlap rate of 75%. A total of 1125 sampling points were captured during the flight. The camera maintained a vertical orientation relative to the ground throughout the shoot to ensure consistent perspective across all images. To minimize shadowing effects from solar elevation angles during imaging, data collection was uniformly scheduled between 10:00 AM and 3:00 PM. The drone flight parameters are detailed in Table 1

2.3. Data Preprocessing

After completing image acquisition for the dataset, data preprocessing was conducted. First, data cleaning and filtering ensured that images contained the target objects. Subsequently, LabelImg 1.8.6 software was used to annotate Maize tassels in the images.
Considering the variability of real-world lighting and weather conditions, we first partitioned the dataset after annotation. This yielded a training set comprising 1458 images, a validation set containing 729 images, and a test set consisting of 243 images.
These included random rotation, random flipping, random brightness/saturation transformations, and random Gaussian noise addition. The final UAVMaize dataset for drone-based Maize tassel detection comprises 3402 training images, 729 validation images, and 243 test images. A schematic of the augmented UAVMaize dataset is shown in Figure 2.

2.4. Methods

2.4.1. LiteFocus-YOLO

The YOLO series models, as high-performance single-stage object detectors, have demonstrated strong versatility in the field of object detection. However, when applied to specific, fine-grained target detection in agricultural settings, they still face challenges such as insufficient extraction of key features, inefficient fusion of multi-scale features, and inadequate robustness under complex background interference. These issues directly impact the model’s accuracy and practicality in agricultural applications. To address these challenges, we propose an improved efficient YOLO model focused on small targets—LiteFocus-YOLO (LF-YOLO). The specific architecture of the LF-YOLO model is illustrated in Figure 3.
The backbone network of LF-YOLO employs Detail Extraction-C2f to replace the standard C2f structure. Through a cascaded design of multi-scale feature extractors and small target enhancers, it preserves details while amplifying response intensity for minute objects. A Lightweight Targeted Attention Module (LTAM) is embedded at the junction between the backbone and neck networks. Combining spatial and channel dual-branch attention with feature-enhanced residual structures, it suppresses interference from complex farmland backgrounds. The neck network adjusts channel counts via convolutional blocks to unify feature space dimensions, eliminating cross-layer channel discrepancies and reducing computational load. It replaces traditional concatenation with a Cross Feature Fusion Module (CFFM), aligning deep semantic and shallow detail features through Dynamic Up-sampling. A lightweight hybrid attention mechanism enables adaptive weighted fusion of multi-scale features, resolving small-object feature submersion issues.

2.4.2. Detail Extraction-C2f

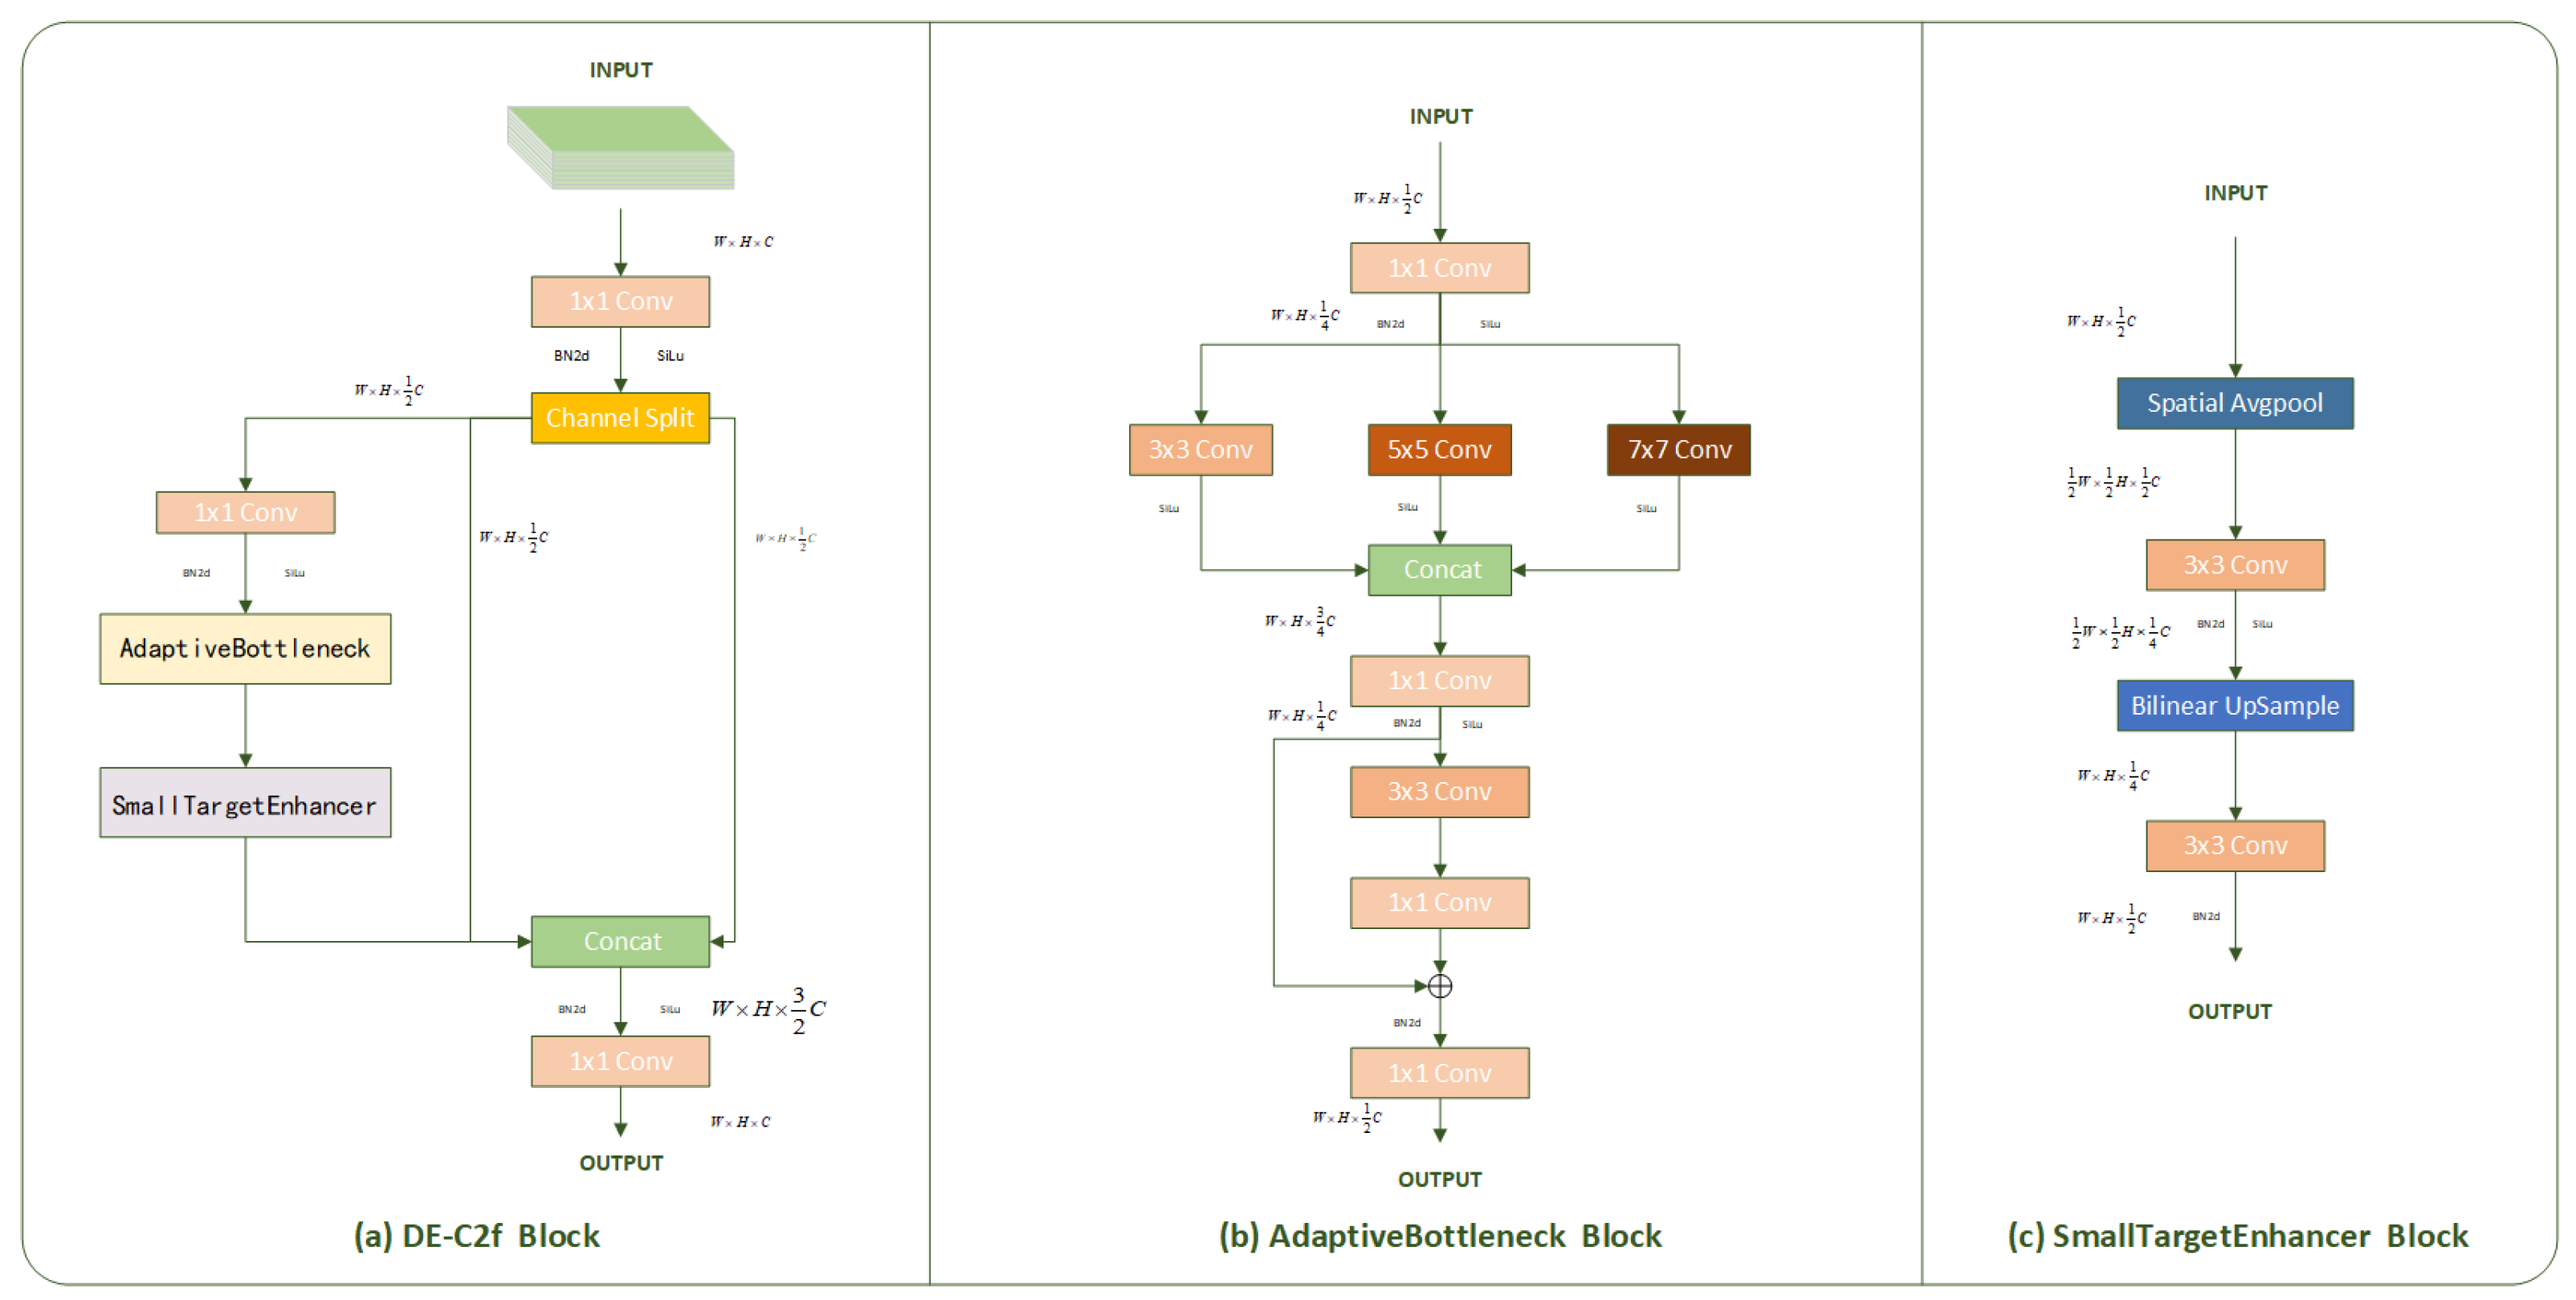
To address the limitations of the C2f module in standard YOLO models regarding feature extraction capabilities for multi-scale objects (especially small targets) and the need for improved feature fusion efficiency, this study proposes a robust adaptive gated feature fusion module —Detail Extraction-C2f, (DE-C2f). The specific architecture of DE-C2f is illustrated in Figure 4a.
The DE-C2f module first adjusts the number of input feature channels via a 1 × 1 convolution, uniformly splitting them into a feature retention branch X 0 and a main processing branch X 1 . The main branch comprises adaptive bottleneck units and small object enhancement units. The specific structure of the adaptive bottleneck unit is shown in Figure 4 [b], featuring a built-in multi-scale feature extractor with kernel sizes {3, 5, 7} to capture spatial information across different receptive fields. The 3 × 3, 5 × 5, and 7 × 7 convolutional kernels provide receptive fields spanning local details, intermediate structures, and global context. This enables efficient capture of multi-scale object features within a single layer, significantly enhancing the model’s adaptability to scale variance. This combination of kernel sizes strikes a favorable balance between computational complexity and feature expressiveness, avoiding parameter redundancy from overly large kernels while facilitating practical deployment. Cross-scale features are captured through three distinct deep separable convolutions at different scales. After concatenation, spatial textures are extracted using a combination of deep convolutions and pointwise convolutions, enabling cross-channel feature recombination. The specific operation is as follows:
  S   i =   S i L U ( W k i × k i B N W 1 × 1 X 1 , k i { 3,5 , 7 }
F f u s e d = W 1 × 1 ( C o n c a t ( S 1 , S 2 , S 3 ) )
F b o t = F f u s e d + B N ( W 1 × 1 ( B N W 3 × 3 F f u s e d ) )
k i denotes the size of the multiscale convolution kernel;   S   i represents the output of the multiscale feature extractor; F f u s e d indicates the scale fusion output; W 1 × 1 corresponds to the 1 × 1 convolution kernel; W 3 × 3 refers to the 3 × 3 convolution kernel; F b o t signifies the output of the adaptive bottleneck unit.
The specific structure of the Small Target Enhancer Block is shown in Figure 4c. First, the feature map is downsampled to half its original size in the spatial dimension. Then, bilinear interpolation is applied to restore the dimensions, forming a scale-invariant feature enhancement path. The specific operations are as follows:
F e n   =   ( W 3 × 3 ( U p b i ( W 3 × 3 ( A v g P o o l F b o t ) ) ) )
AvgPool performs spatial dimension average pooling downsampling; U p b i performs bilinear interpolation upsampling; F e n represents the output feature of the Small Target Enhancer.
Finally, cross-stage feature fusion is performed by merging the feature retention branch X 0 with the main processing branch X 1 . This design enhances small-object feature recognition capabilities while fully preserving background information distribution, effectively balancing feature enhancement intensity and optimizing gradient propagation paths.

2.4.3. Lightweight Targeted Attention Module

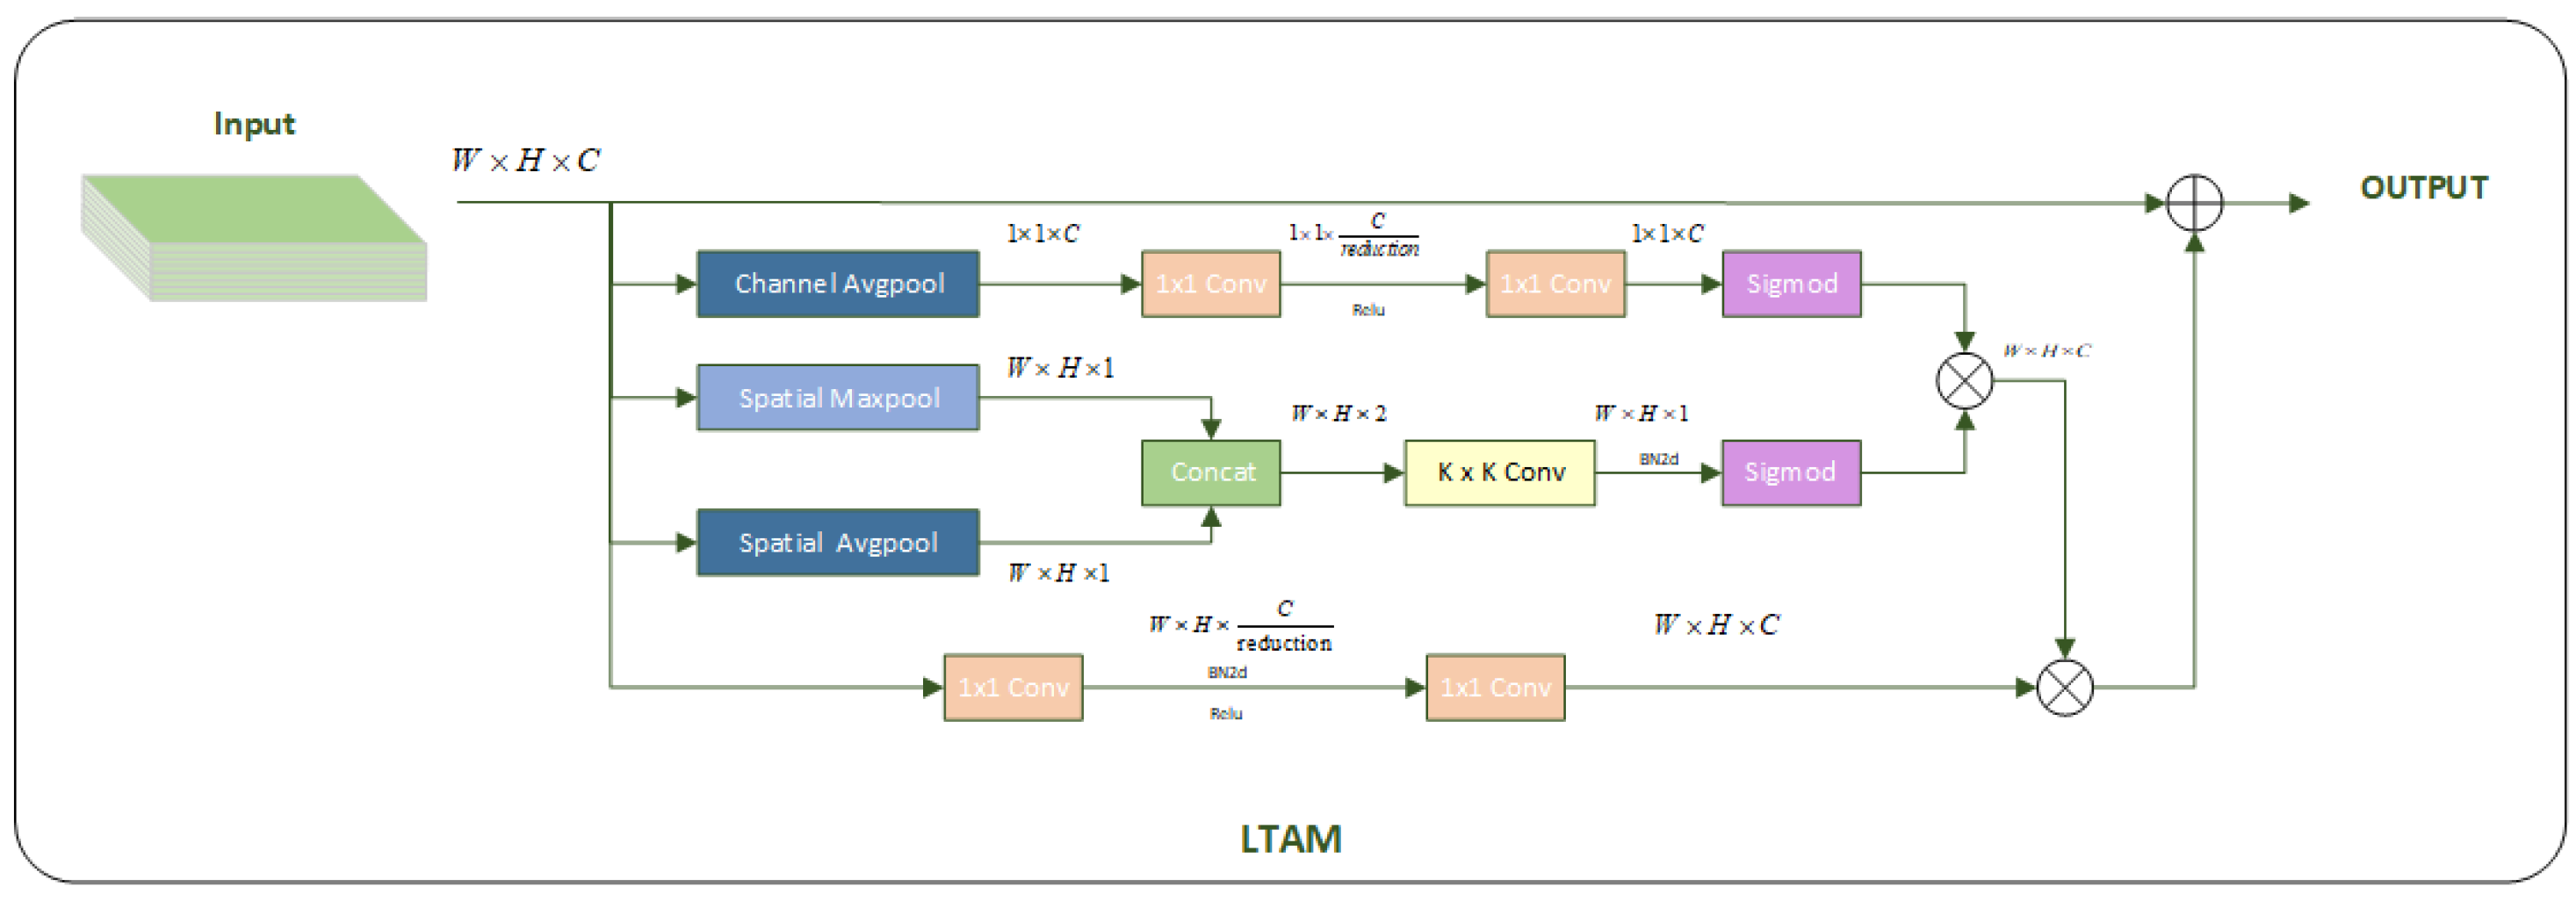
To address the issues of insufficient feature representation and excessive background noise in dense small object detection, which can easily drown out features, this paper proposes the Lightweight Targeted Attention Module (LTAM). The module structure is illustrated in Figure 5.
LTAM comprises three core components: the channel attention branch, the spatial attention branch, and the feature enhancement branch. The channel attention branch employs a channel compression mechanism to reduce computational complexity, compressing channels to C/r using a reduction ratio r (default 8), and finally restoring the original channel count to generate channel attention weights. Using a higher reduction ratio (e.g., 8 or 16) during the channel compression phase significantly reduces the number of parameters and FLOPs in the fully connected layers constituting the channel attention mechanism. However, excessively high ratios (e.g., r = 32) may over-compress channel information, leading to critical feature loss—particularly detrimental for small object detection. Conversely, using too low a ratio (e.g., r = 2) limits compression effectiveness and fails to achieve adequate lightweighting. Therefore, after experimentation, we selected r = 8 as the optimal reduction ratio. This effectively lowers computational complexity without compromising the discriminative capability of the attention mechanism. The specific implementation of the channel branch is as follows:
  Z c = G A P ( X )
W c = σ ( W 2 δ W 1 Z c )
where X represents the input features, X R ( C × H × W ) , C denotes the number of channels, and H × W indicates the spatial dimensions; W 1 R ( C r × C ) and W 2 R ( C × C r ) are the weights for the 1 × 1 convolution, with r being the channel compression ratio; δ is the ReLU activation function; σ is the Sigmoid function; W c denotes the output channel weights.
The spatial attention branch employs a lightweight design to prevent dimensionality explosion. It extracts high-frequency and low-frequency features from the input feature map via max pooling and average pooling along the channel dimension, respectively, followed by channel concatenation. This feature undergoes spatial information fusion through a 7 × 7 convolution kernel, generating a spatial attention map via batch normalization and the Sigmoid function to effectively capture boundary features of small objects. The spatial attention branch is implemented as follows:
M m a x = M a x c h a n n e l X
M a v g = A v g c h a n n e l X
F s p a t i t a l = M m a x   M a v g
W s = σ ( B N ( W s 1 F s p a t i t a l ) )
M m a x denotes max pooling, which extracts the maximum value across all channels, while M a v g represents average pooling, which calculates the average value across all channels; F s p a t i t a l denotes the spatially concatenated features after pooling, where F s p a t i t a l R ( 2 × H × W ) ; W s 1 represents the spatial attention weight matrix generated by convolving the convolutional kernel, where W s 1 R ( 1 × H × W ) ; Ws denotes the spatial branch weights after activation function mapping.
For small object detection, this method incorporates a dedicated feature enhancement branch employing a bottleneck structure to boost the representation of fine-grained details. Specifically, two 1 × 1 convolutional layers are used, with batch normalization and ReLU activation functions interposed to reduce the number of channels to 1/r (default r = 8) of the original channels. The original channel dimension is then restored. This design effectively suppresses noise interference in the original features, significantly enhancing the discrimination capability for small objects.
The outputs from the three branches are fused through an adaptive weighting mechanism. First, the channel attention and spatial attention outputs undergo element-wise multiplication, then modulated with the output from the feature enhancement branch. Finally, the enhanced features are fused with the original input features via residual connections. This approach strengthens the feature representation of small objects while preserving background information integrity. Simultaneously, the residual structure ensures training stability and convergence efficiency.

2.4.4. Cross Feature Fusion Module

To address the issues of semantic information loss and spatial detail degradation during feature fusion in the YOLO neck network, this study proposes a lightweight cross-feature fusion module (CFFM). This module replaces traditional concatenation operations with a synergistic mechanism combining dynamic upsampling branches and multi-domain attention. The specific structure of the module is shown in Figure 6.
The CFFM consists of a deep semantic attention branch and a shallow feature enhancement branch. The deep branch first employs the DyUpsample [10] module for spatial feature alignment. This module dynamically adjusts interpolation weights using content-aware offsets to achieve high-resolution restoration while reducing computational overhead. Subsequent channel and spatial attention enhancements follow: the channel component efficiently captures channel dependencies through feature reshaping and 1D convolutions; the spatial component fuses average and max-pooled features while generating spatial weights via grouped convolutions. This ultimately achieves enhanced fusion of multi-scale features. The specific steps are as follows:
F d = D y S a m p l e ( X )
A s = σ ( W 1 × 1 W g = 2 3 × 3 A v g c h a n n e l F d M a x c h a n n e l F d
A c = σ ( W 1 × 1 ( R e L U ( B N ( W 1 × 1 ( G A P F d ) ) ) ) )
A f u s i o n = A s A c
Among these, DySample denotes the dynamic upsampling module operation; F d represents the deep features from upsampling, where F d R ( 2 W × 2 H × C ) ; W g = 2 3 × 3 denotes the 3 × 3 convolution weights with group size 2; GAP signifies global average pooling; W 1 × 1 denotes the convolution weights with kernel size 1.
The shallow feature enhancement branch adopts a dual-path collaborative architecture: the primary path extracts cross-channel spatial features through deep separable convolutions to enhance edge detail capture; the auxiliary path introduces a dynamic grouping compression-stimulation mechanism that adaptively adjusts the number of groups based on the input channel count. By modeling inter-channel dependencies through one-dimensional convolutions within groups, it generates channel attention weights. The dual-path outputs undergo adaptive fusion through residual connections and feature multiplication, enhancing the model’s sensitivity to channel information. The specific implementation of this process is as follows:
B M = B N ( G E L U ( W 3 × 3 ( X )   ) )
B A = σ ( W 1 × 1 ( R e L U ( W g 1 × 1 ( G A P ( B M ) ) ) ) )
B M represents the main path output; W g 1 × 1 performs a grouped 1D convolution, where the number of groups g = min(4, C/r), and r is the channel reduction parameter.
After completing computations for both branches, they are multiplied together. Finally, residual processing is applied by adding the result to features obtained from deep-layer upsampling. This preserves the original deep semantic information while incorporating attention-enhanced features, ensuring stable propagation of feature gradients.

2.5. Evaluation Indicators

To evaluate the effectiveness of the LF-Yolo model proposed in this study for detecting densely packed objects in agricultural fields, we employed five widely used performance metrics in the object detection domain: Precision, Recall, Mean Average Precision (mAP), FLOPS, and Parameters.
Precision measures the reliability of a model’s positive predictions, specifically the proportion of correctly predicted positive instances among all bounding boxes predicted as positive. The formula is as follows:
P r e c i s i o n = T P T P + F P
TP (True Positives) represents the number of correctly predicted positive bounding boxes, while FP (False Positives) denotes the number of bounding boxes incorrectly predicted as positive.
Recall measures a model’s ability to detect true positives, i.e., the proportion of all actual targets that are successfully detected. The specific formula is as follows:
R e c a l l = T P T P + F N
False Negatives (FN) represent the number of actual targets that were not detected by the model. In object detection algorithms like YOLO, FN typically refers to genuine target boxes whose intersection-over-union (IoU) with any predicted bounding box falls below a specified threshold. A higher recall value indicates that the model has a lower false negative rate, effectively identifying the vast majority of objects in an image.
mAP serves as the core metric for comprehensively evaluating model performance in the field of object detection. It holistically assesses a model’s precision performance across different recall levels. Its calculation is based on the average precision (AP) of each category, ultimately derived by averaging across all categories. The specific formula is as follows:
m A P = 1 N i = 1 N A P i
N denotes the total number of classes, and A P i represents the average precision of the i-th class. AP is calculated as the area under the Precision-Recall curve for that class. This curve is plotted using multiple sets of (Precision, Recall) data points generated by adjusting the classification confidence threshold. A higher mAP value indicates superior overall detection performance of the model, achieving high recall while maintaining high precision.
FLOPs serve as a core metric for evaluating the computational complexity and algorithmic efficiency of deep learning models. It represents the total number of floating-point operations (such as addition and multiplication) required for the model to complete a single forward inference pass.
Parameters refer to the total sum of all learnable parameters in a model, serving as a core metric for measuring model complexity. Its value is typically expressed in millions (M), calculated as the sum of parameters across all layers.

3. Results and Analysis

3.1. Experimental Details

This study employs the Pytorch deep learning framework with input images sized 640 × 640 pixels. The initial learning rate is set to 0.01, utilizing stochastic gradient descent (SGD) with a momentum factor of 0.937, a weight decay coefficient of 0.0005, a batch size of 32, and 16 workers. Specific experimental settings are detailed in Table 2.

3.2. Experimental Results

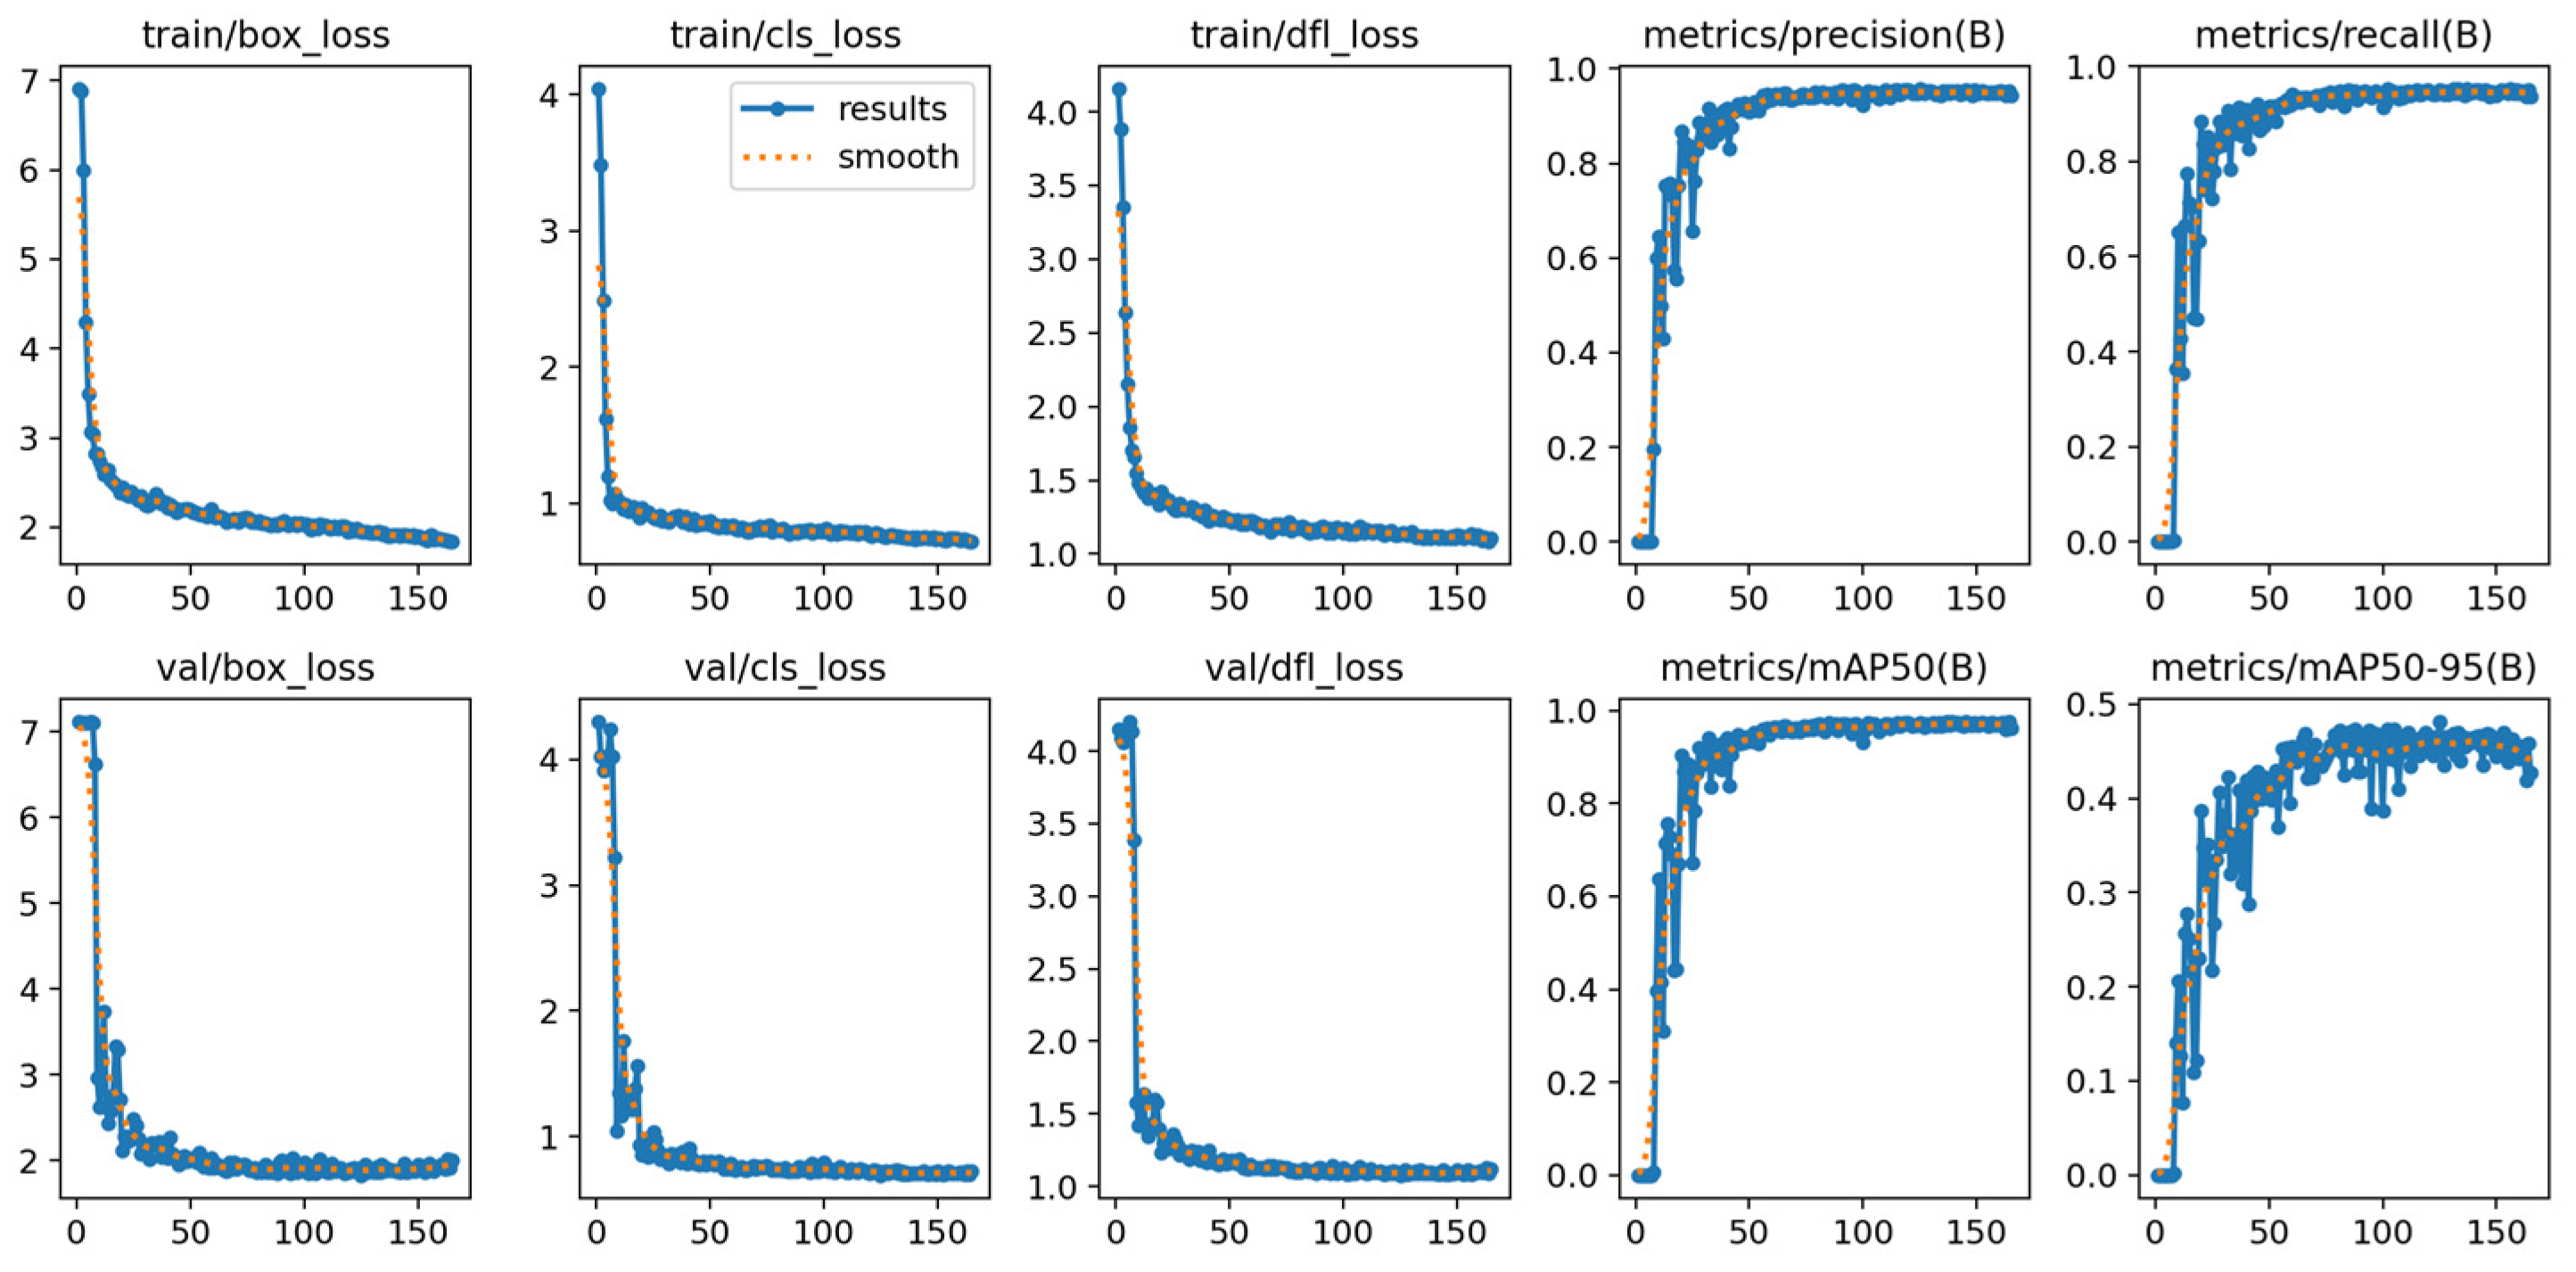
Figure 7 shows the loss function curve and the changes in accuracy, recall rate, and mAP metrics during the training process of the LF-Yolo model. As shown in the figure, the loss function value gradually decreases and converges toward stability with increasing training iterations. Meanwhile, the accuracy, recall, and mAP metrics exhibit an overall upward trend, demonstrating that the LF-Yolo model has effectively learned the required features.
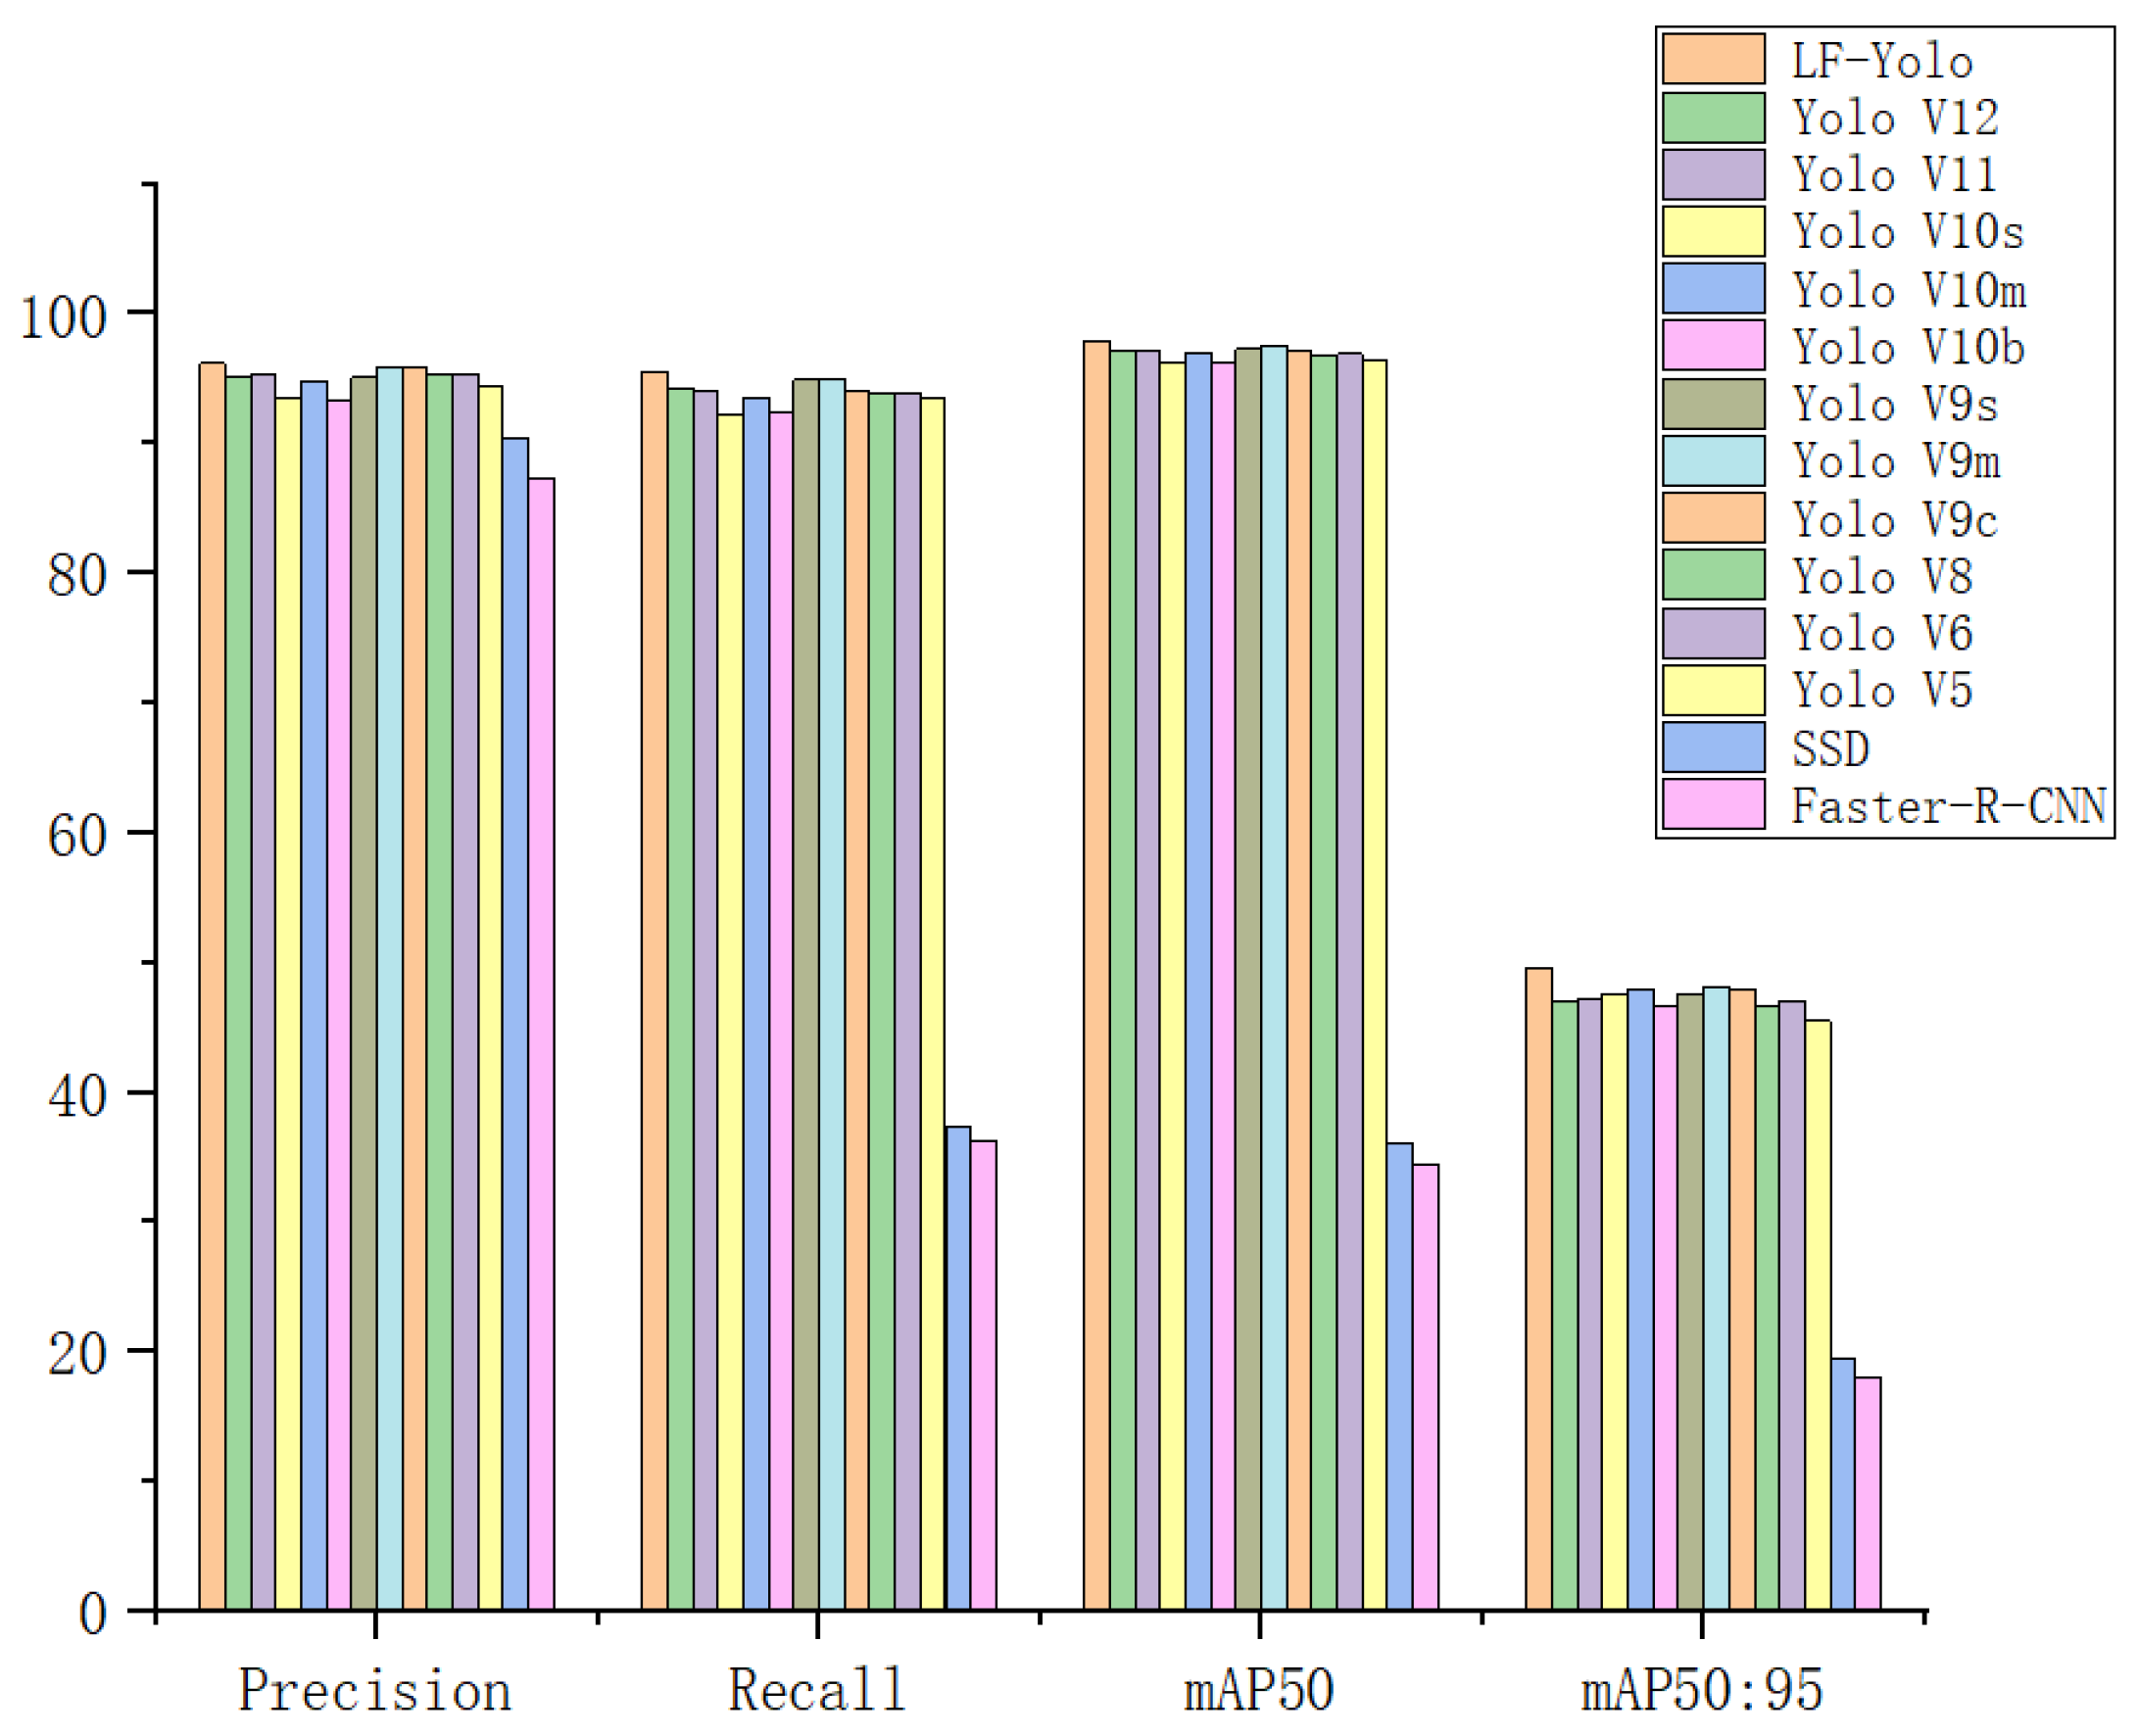
To validate the effectiveness of our designed model in the field of dense object detection in agricultural settings, this experiment selected multiple representative and widely used one-stage and two-stage models from the current object detection domain. These models were compared on the UAVMaize dataset to evaluate our model’s performance. The results of the comparative experiments are shown in Table 3. The comparison results in the table demonstrate that LF-Yolo achieves stable improvements across key metrics compared to the other models used as benchmarks. Compared to the widely used YoloV8[11] model in the object detection field, on the UAVMaize dataset, LF-Yolo achieves a 0.9% improvement in Precision, a 1.6% improvement in Recall, and increases of 1.1% and 2.9% in mAP50 and mAP50-95, respectively. The proposed LF-Yolo achieves superior detection accuracy at the cost of a slight increase in computational load and parameter count. When compared to larger models like YOLOv9c [12], YOLOv9m, and YOLOv10b [13], which exhibit significant increases in parameters and computational requirements, LF-Yolo still demonstrates superior overall performance efficiency. Using fewer parameters, LF-Yolo achieves higher precision.
Comprehensive comparisons across all experimental models demonstrate that the proposed LF-Yolo achieves highly competitive performance, outperforming widely used object detection models in all metrics while maintaining relatively low computational complexity. This strikes a balance between accuracy and efficiency. The comparison results are summarized in histograms shown in Figure 8 and Figure 9.
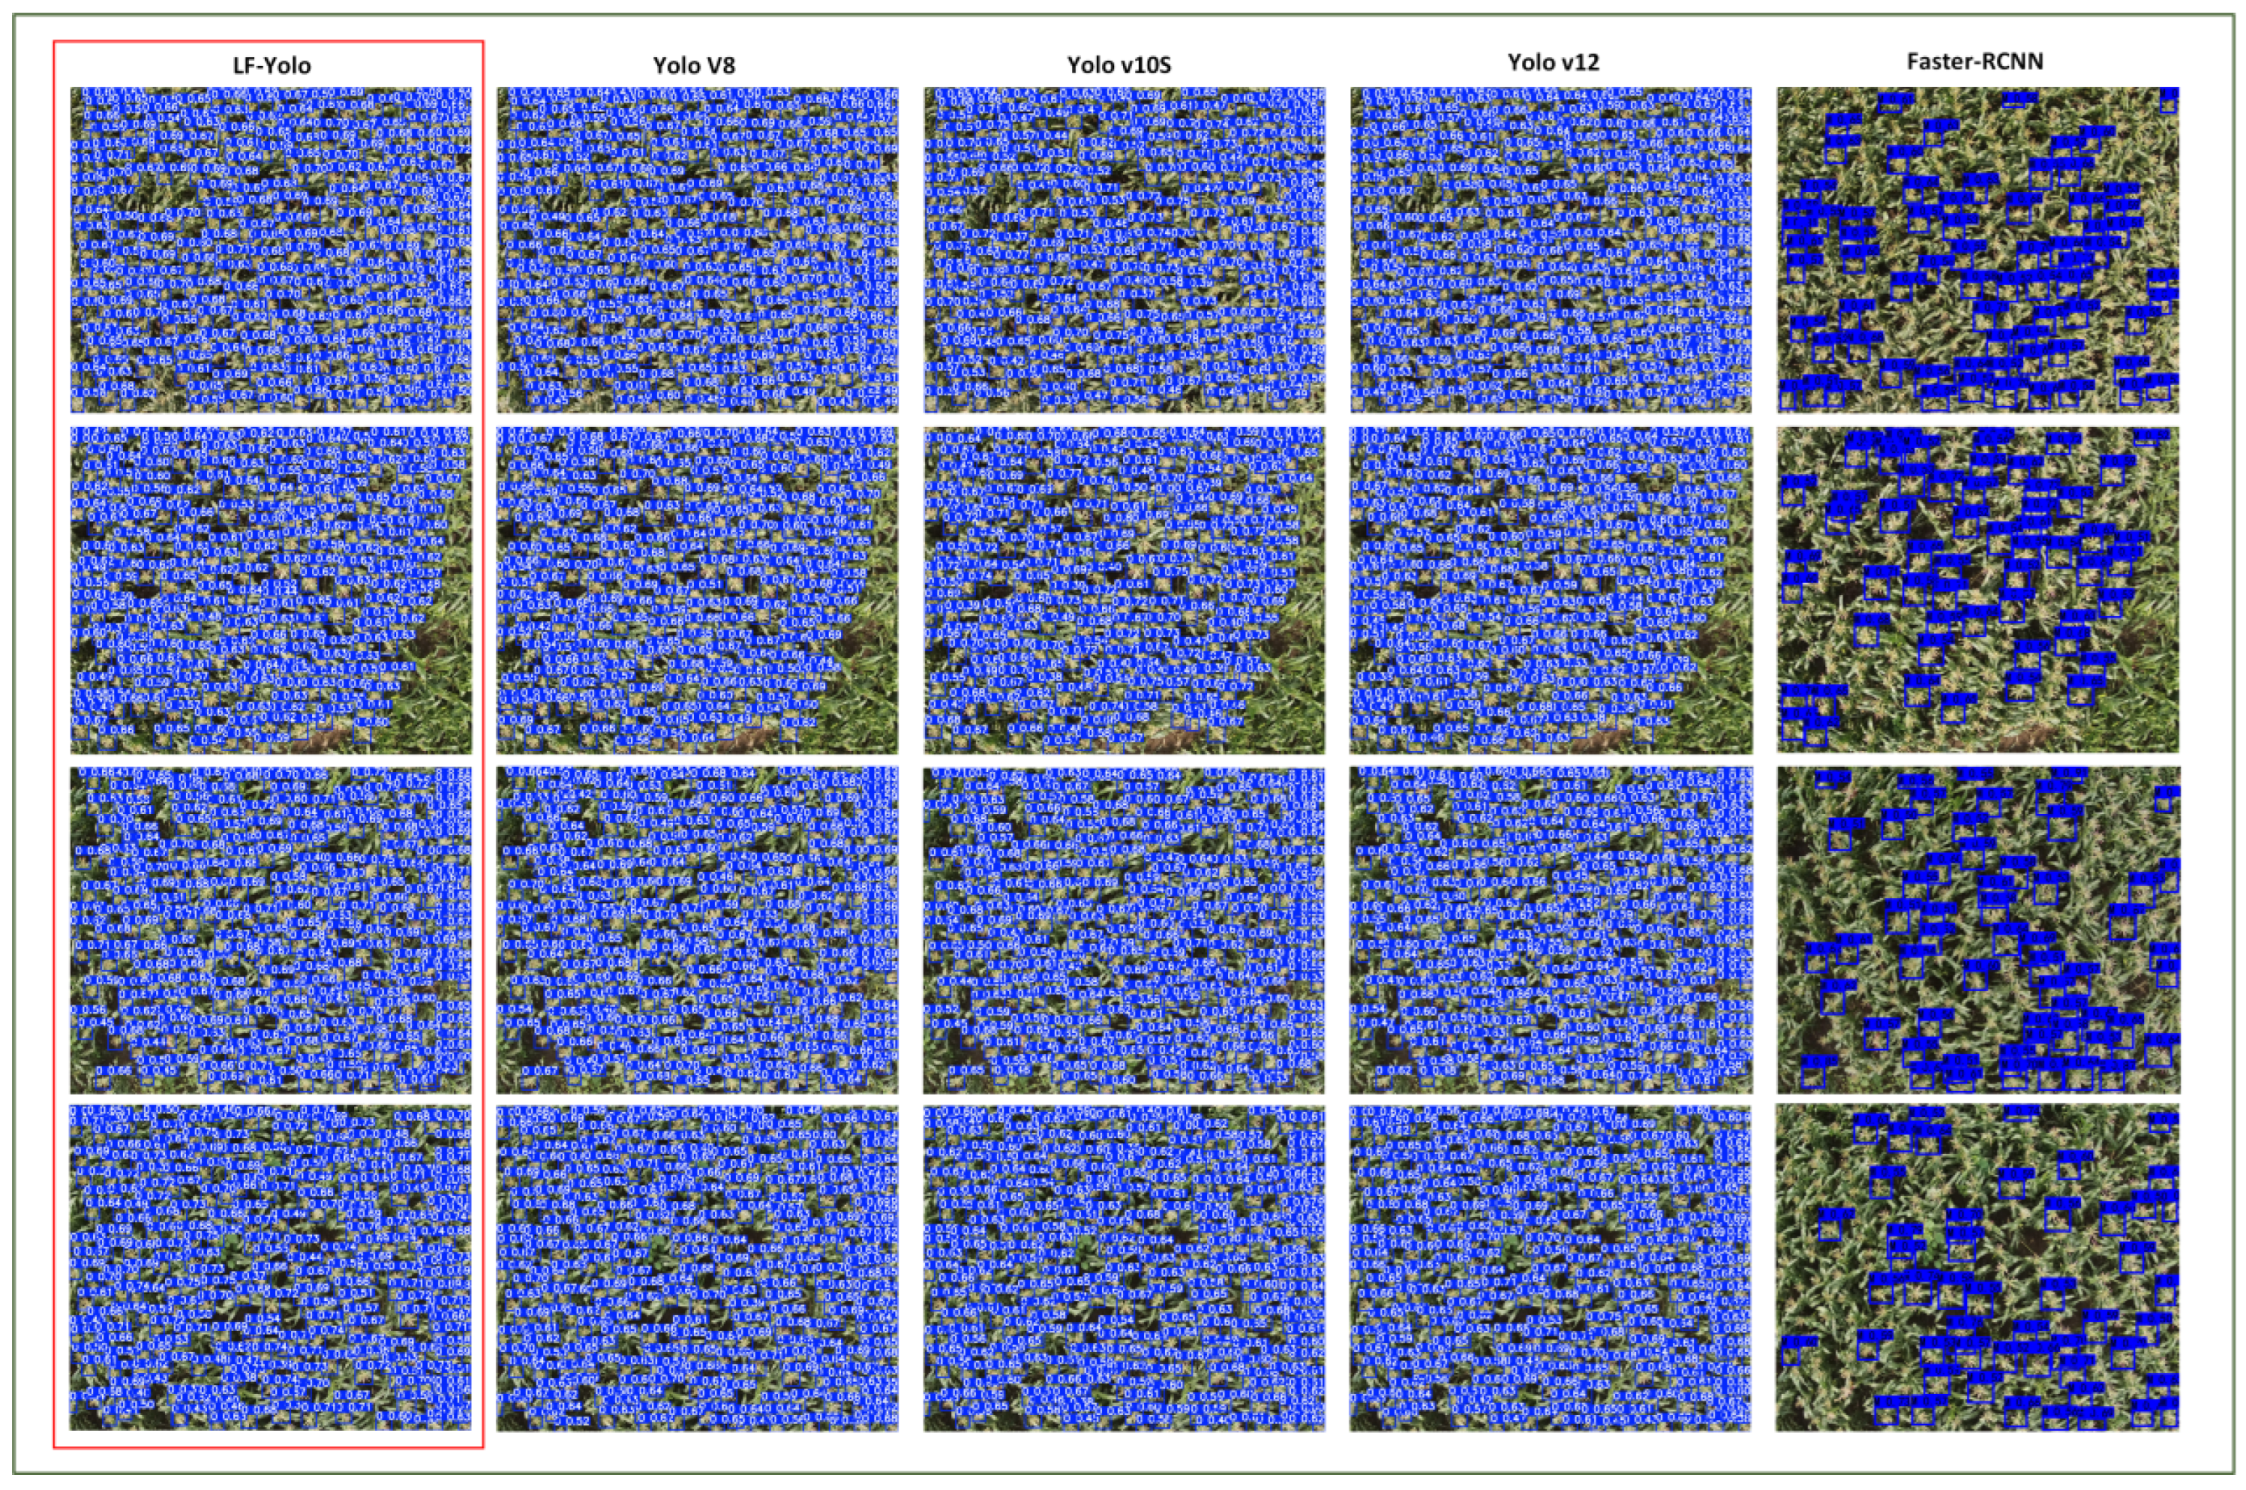
As shown in Figure 10, this figure visualizes the prediction results from comparative experiments conducted on the UAVMaize dataset. For comparison models, we selected YoloV8, YoloV10s, YoloV12, and the two-stage classical object detection model Faster-R-CNN to contrast with the LF-Yolo model proposed in this paper. As shown in the figure, compared to other models, LF-Yolo achieves higher detection accuracy with fewer missed targets. Both YoloV8 and YoloV10s exhibit missed detections and false positives, such as detecting two ears as one. Although the Faster-R-CNN model demonstrates high detection accuracy, it also suffers from a high rate of missed detections, failing to identify numerous targets. Consequently, it is unsuitable for dense detection scenarios in field environments.

3.3. Generalization Experiment

To investigate the generalization capability and effectiveness of the proposed LF-Yolo model on other crops and scenarios, we selected the publicly available wheat ear dataset and Maize tassel dataset for generalization experiments.
Wheat ear data originates from field trials conducted in Belgium’s Hesbaye region in 2020 [18], covering cultivation data for two winter wheat varieties under multi-gradient nitrogen fertilizer and fungicide treatments. Images were captured using paired industrial RGB cameras (The RGB cameras were GO-5000C-USB (JAI A/S, Copenhagen, Denmark), equipped with a CMOS sensor of 2560 × 2048 pixels and a LM16HC objective (Kowa GmbH, Düsseldorf, Germany) with adaptive exposure to prevent saturation. The dataset comprises 701 images collected across seven stages from heading to maturity, each featuring high-quality wheat ear boundary annotations.
The Maize tassel dataset comprises portions of the Maize Tasseling Detection Dataset (MTDC) [19] and the Multi-Region Maize Tassel Dataset (MrMT) [20]. The MTDC was reconstructed based on the publicly available MTC [21] dataset. The original MTC resource contains 361 time-series images collected from experimental fields across four distinct regions in China between 2010 and 2015. These images cover critical growth stages from tasseling to flowering and include high-resolution field imagery (typical resolution 3648 × 2736 to 4272 × 2848) of six major cultivated maize varieties. These images were captured at a height of 4–5 m using cameras mounted at a 60° tilt angle, effectively capturing planting scenarios of varying densities. The original MTC dataset’s point annotation method, which only marked tassel locations without target-scale information, had significant limitations. Therefore, the original dataset was upgraded using a center-point strict alignment strategy to convert tassel annotations into pixel-level bounding boxes. These annotations were provided in a unified VOC format, offering dual-dimensional supervision of both location and scale. The combined dataset is what we call the FusionMaize Dataset.
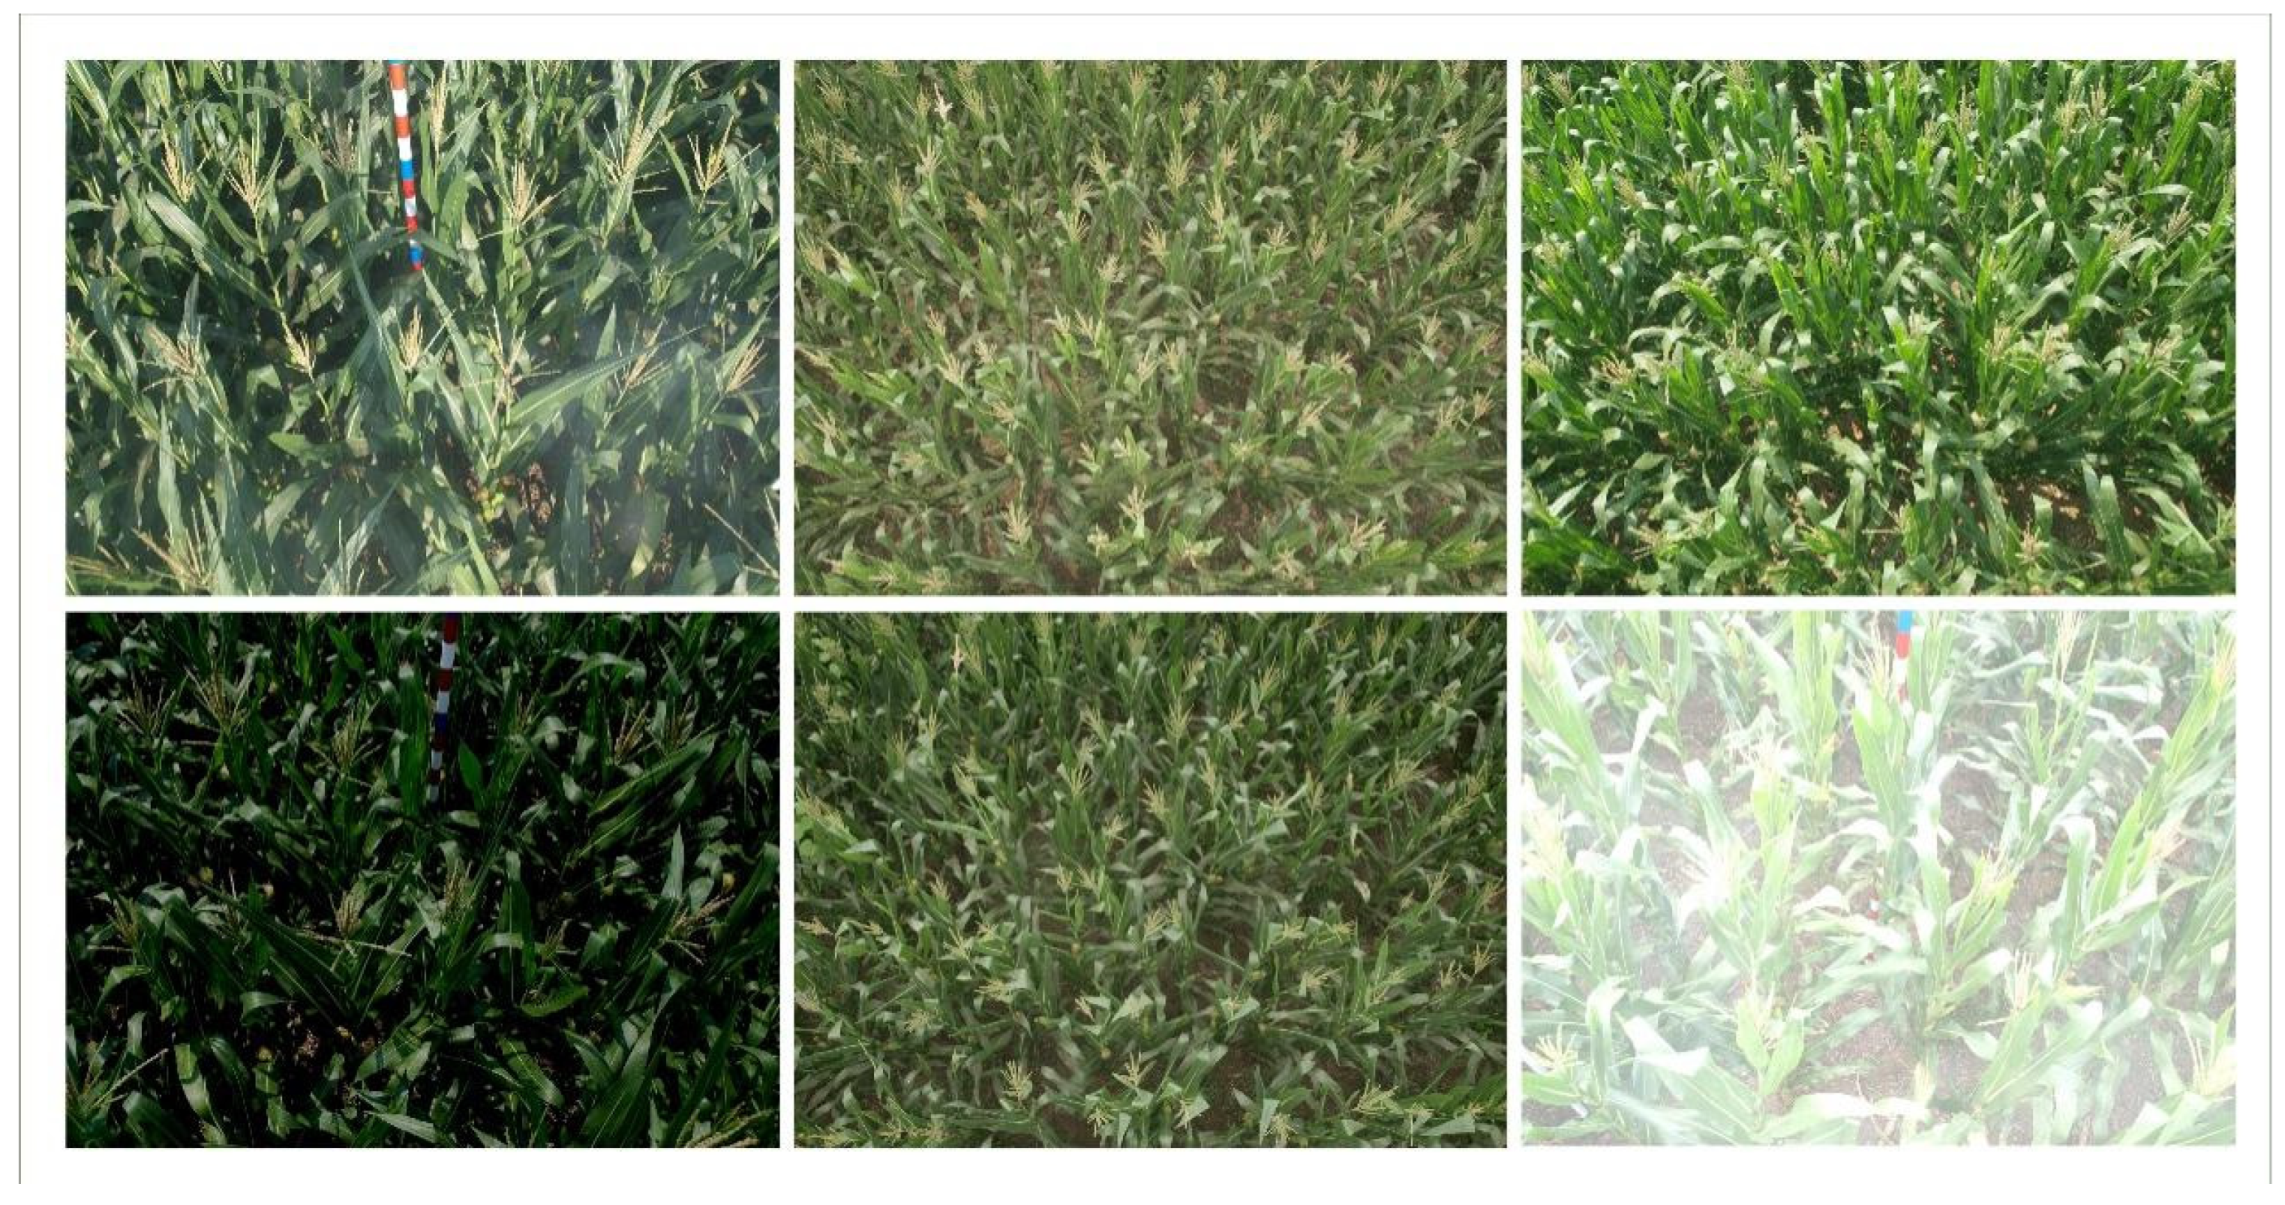
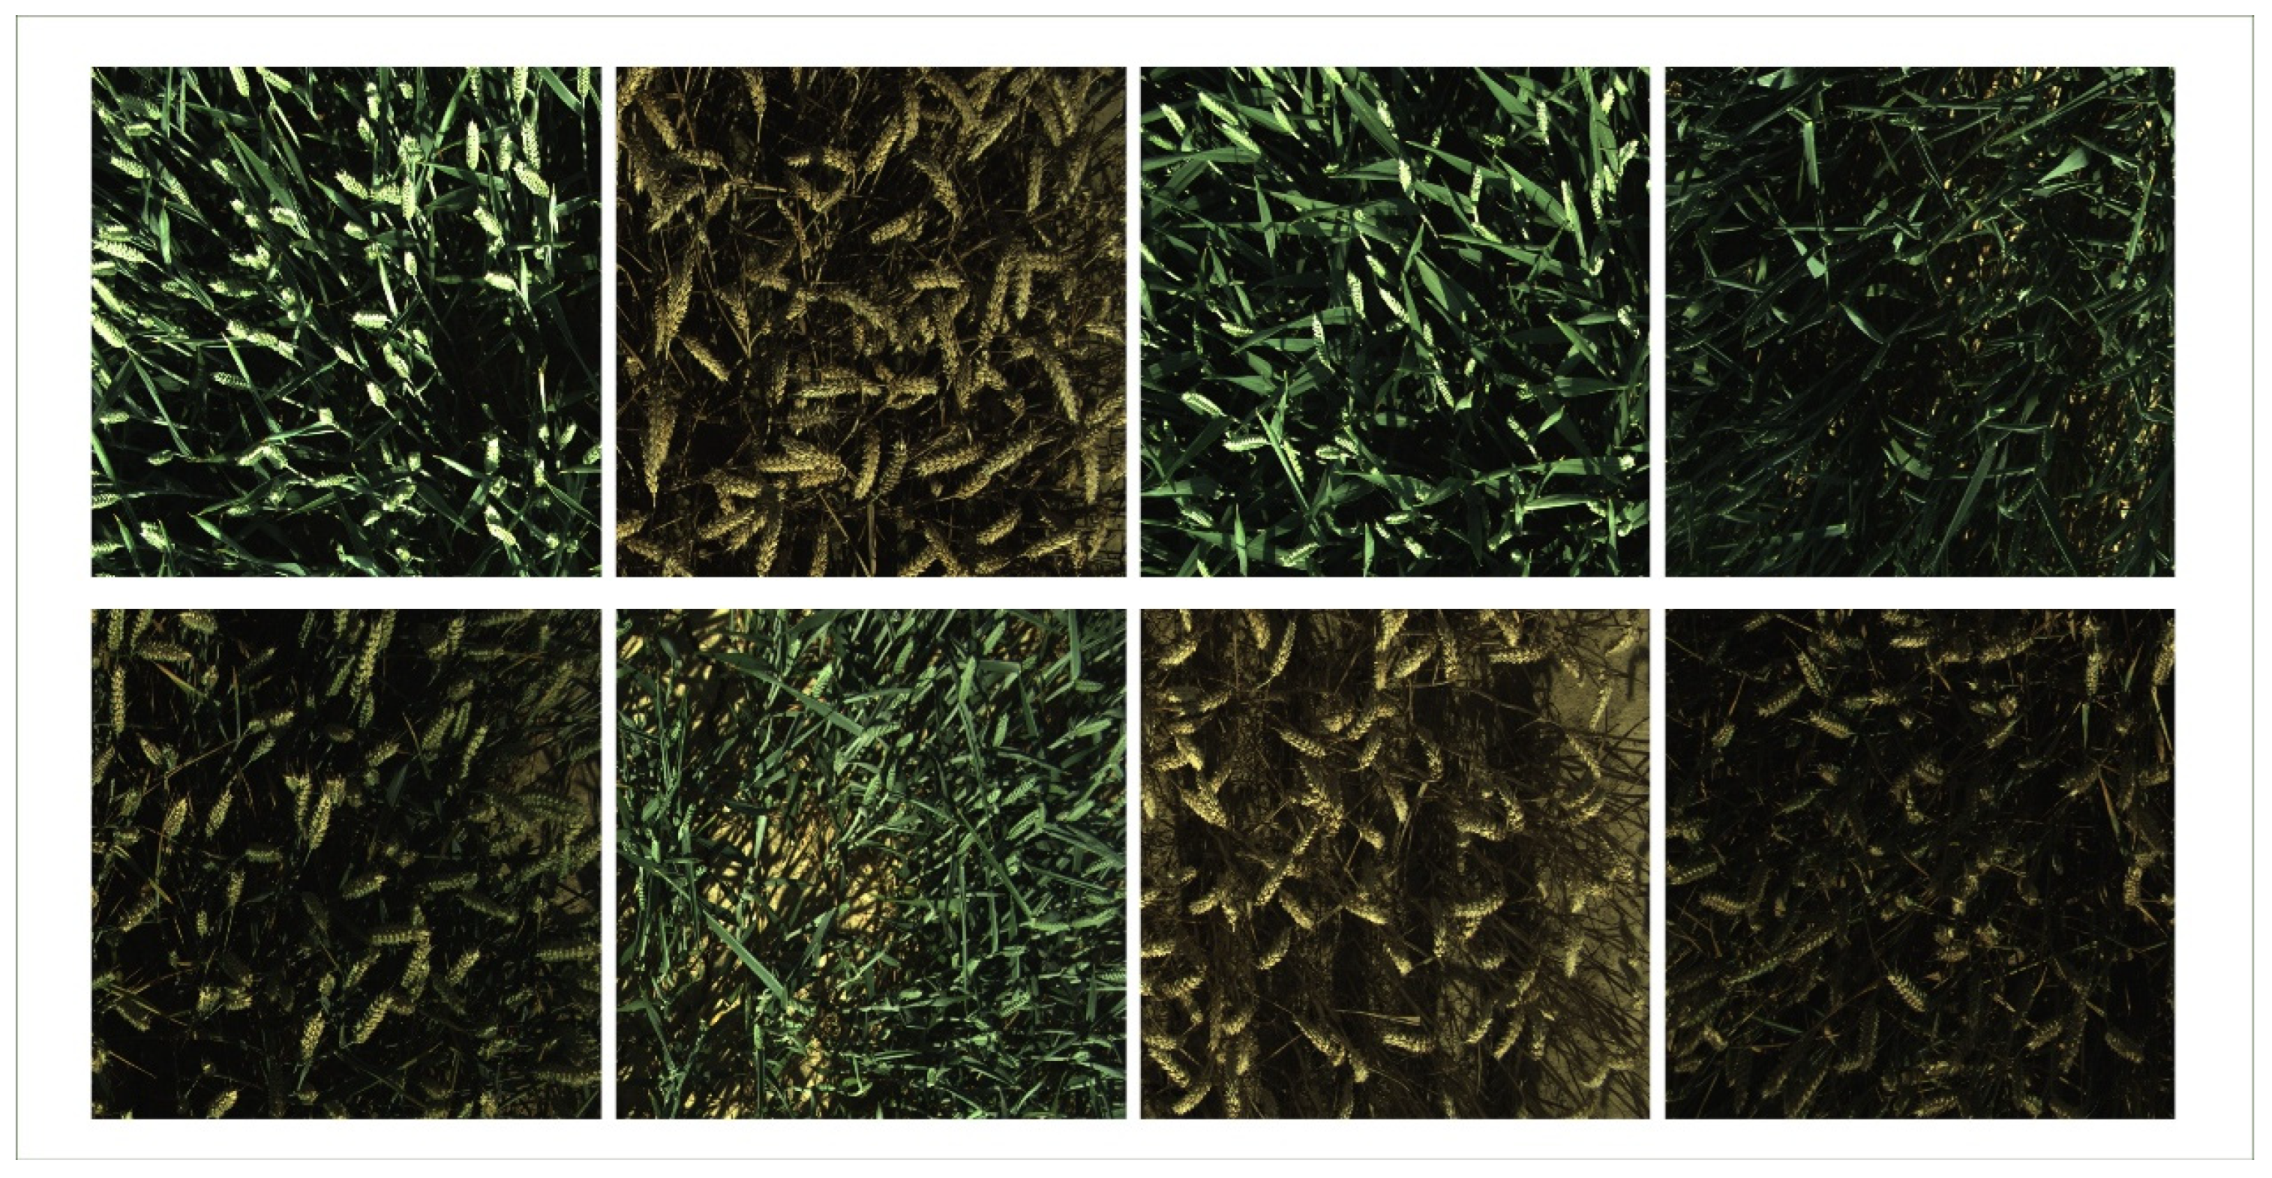
The original images and labels from both datasets were divided into training, validation, and test sets at a ratio of 6:3:1. Subsequently, data augmentation operations were applied to the training set, including random flipping, random mirroring, random brightness/saturation transformations, and random Gaussian noise addition. The final datasets comprised the wheat ear dataset with 1676 training images, 211 validation images, and 71 test images, and the Maize tassel dataset with 1580 training images, 239 validation images, and 80 test images. A schematic of the FusionMaize dataset is shown in Figure 11, while a schematic of the Wheat Ear dataset is shown in Figure 12.
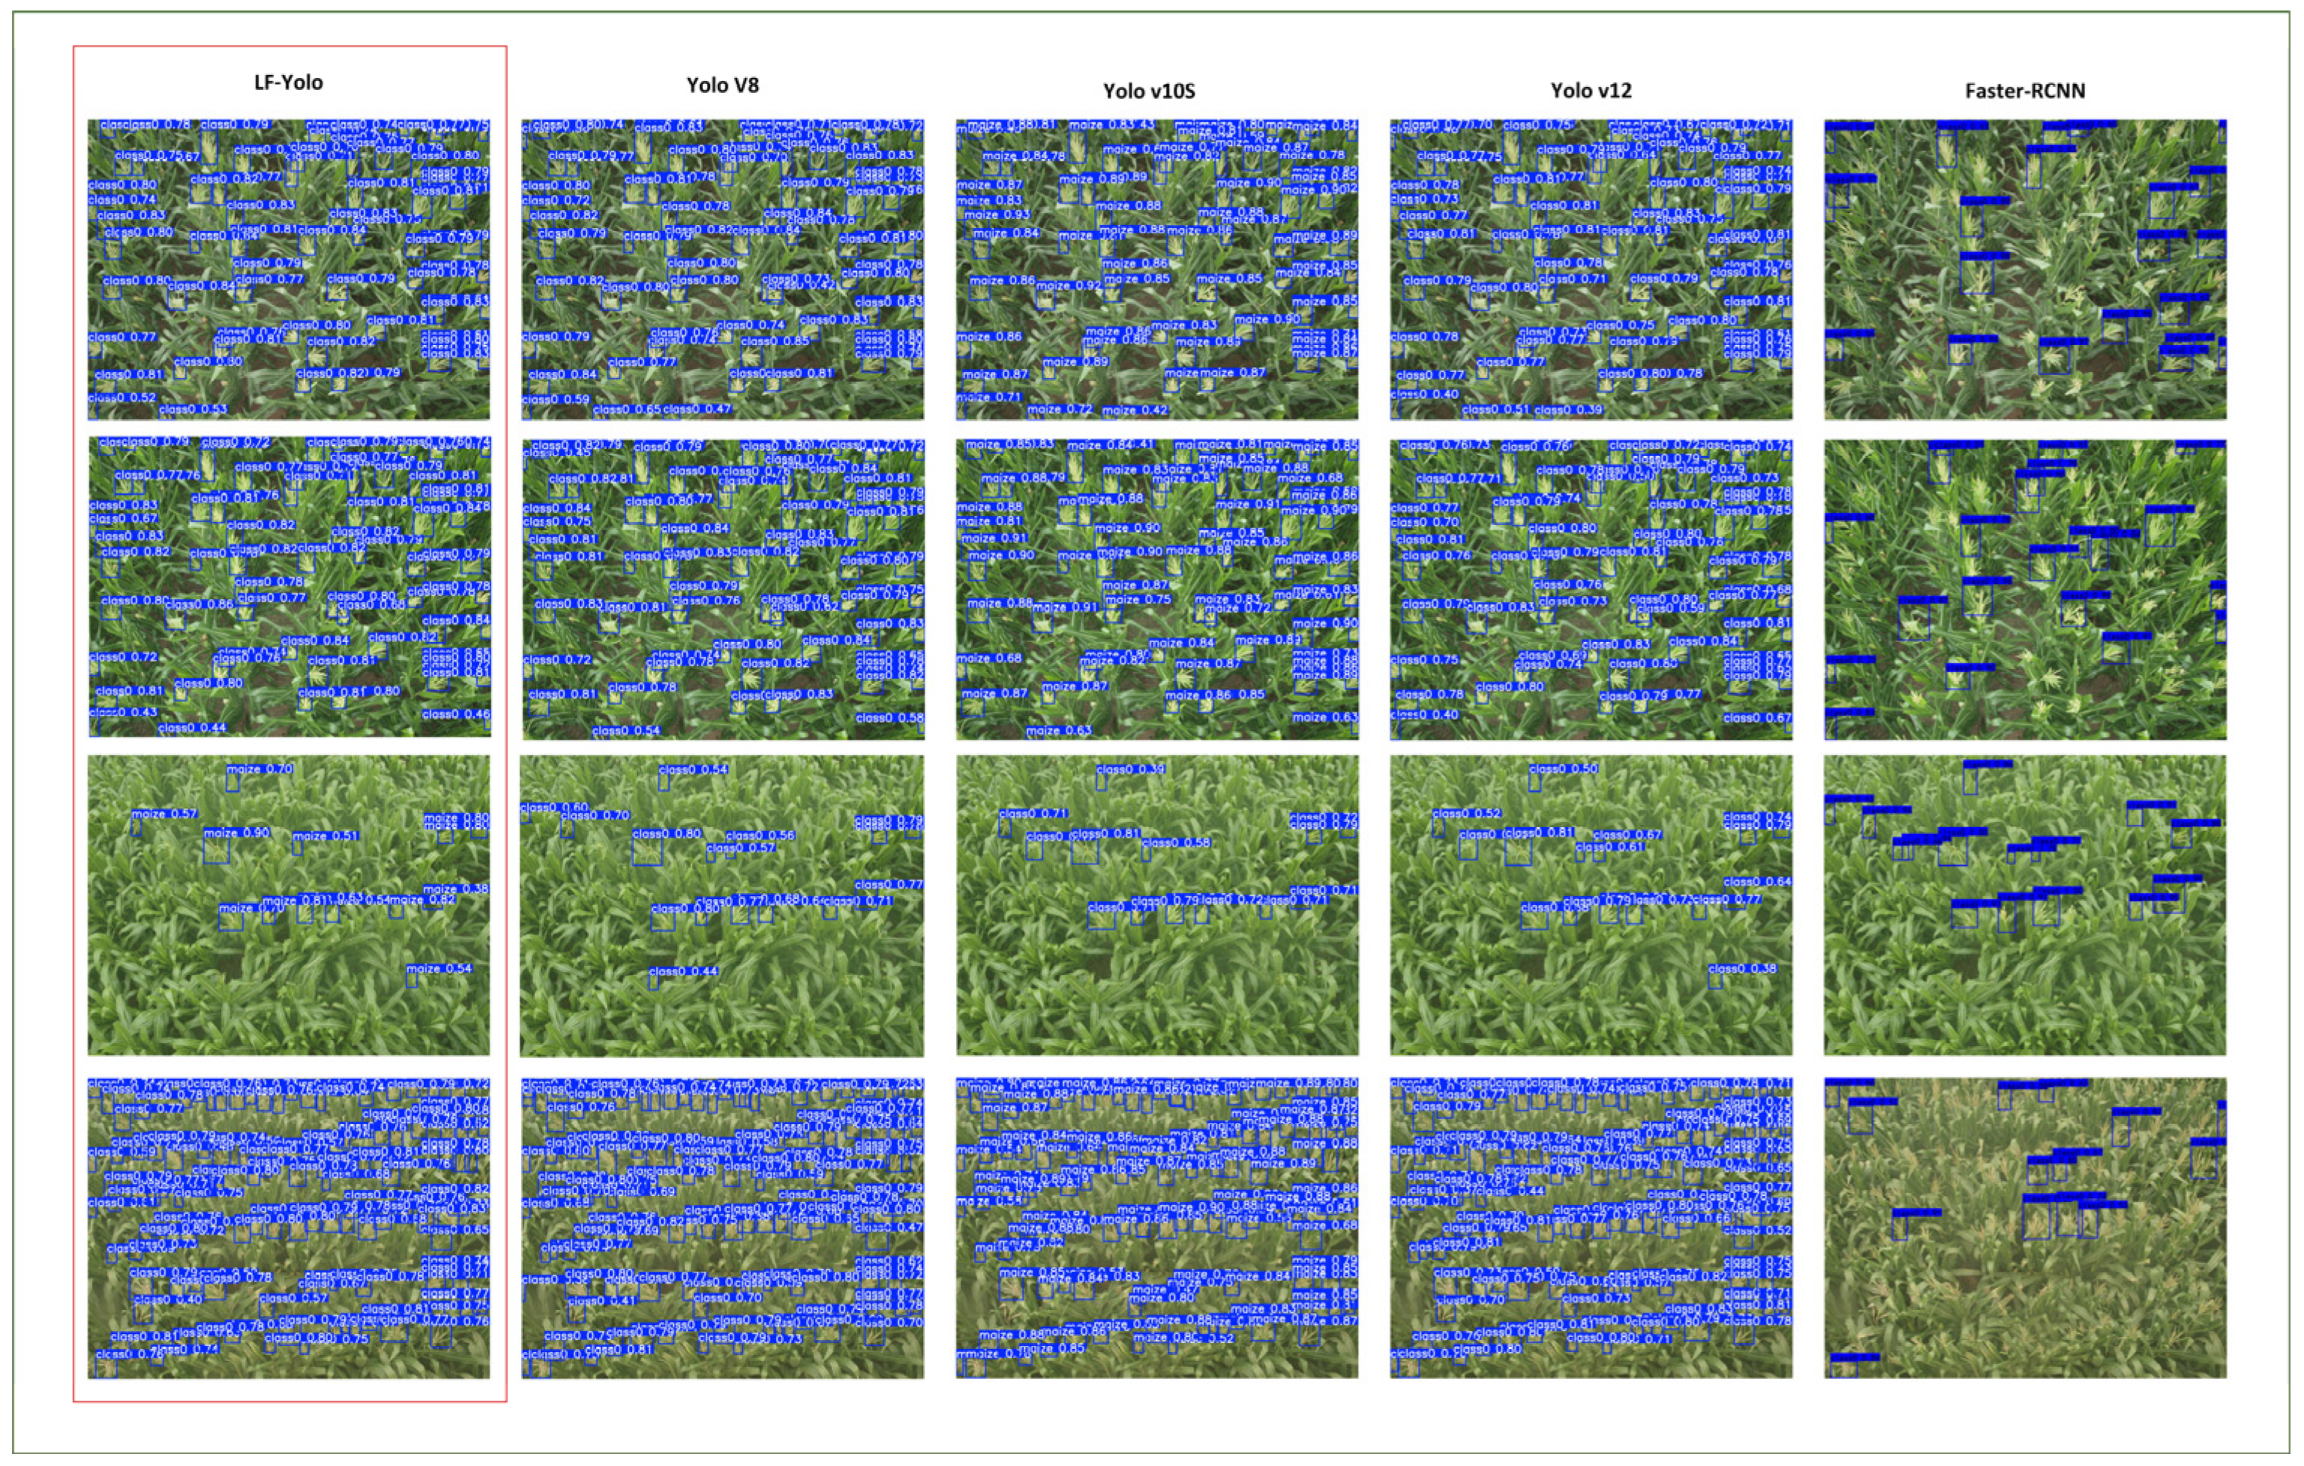
The experimental parameters for the generalization experiments remained consistent with previous studies. Results on the maize tassel dataset are presented in Table 4, while those on the wheat ear dataset are shown in Table 5. Visualizations of the detection results are illustrated in Figure 13 and Figure 14. The results demonstrate that the proposed LF-Yolo model outperforms other comparison models in both accuracy and recall for dense target detection in field scenarios. Analysis of the visualizations reveals that LF-Yolo exhibits robust performance across both sparse and dense target scenarios, highlighting its generalization capability and applicability in the field of target detection within agricultural settings.

3.4. Ablation Experiment

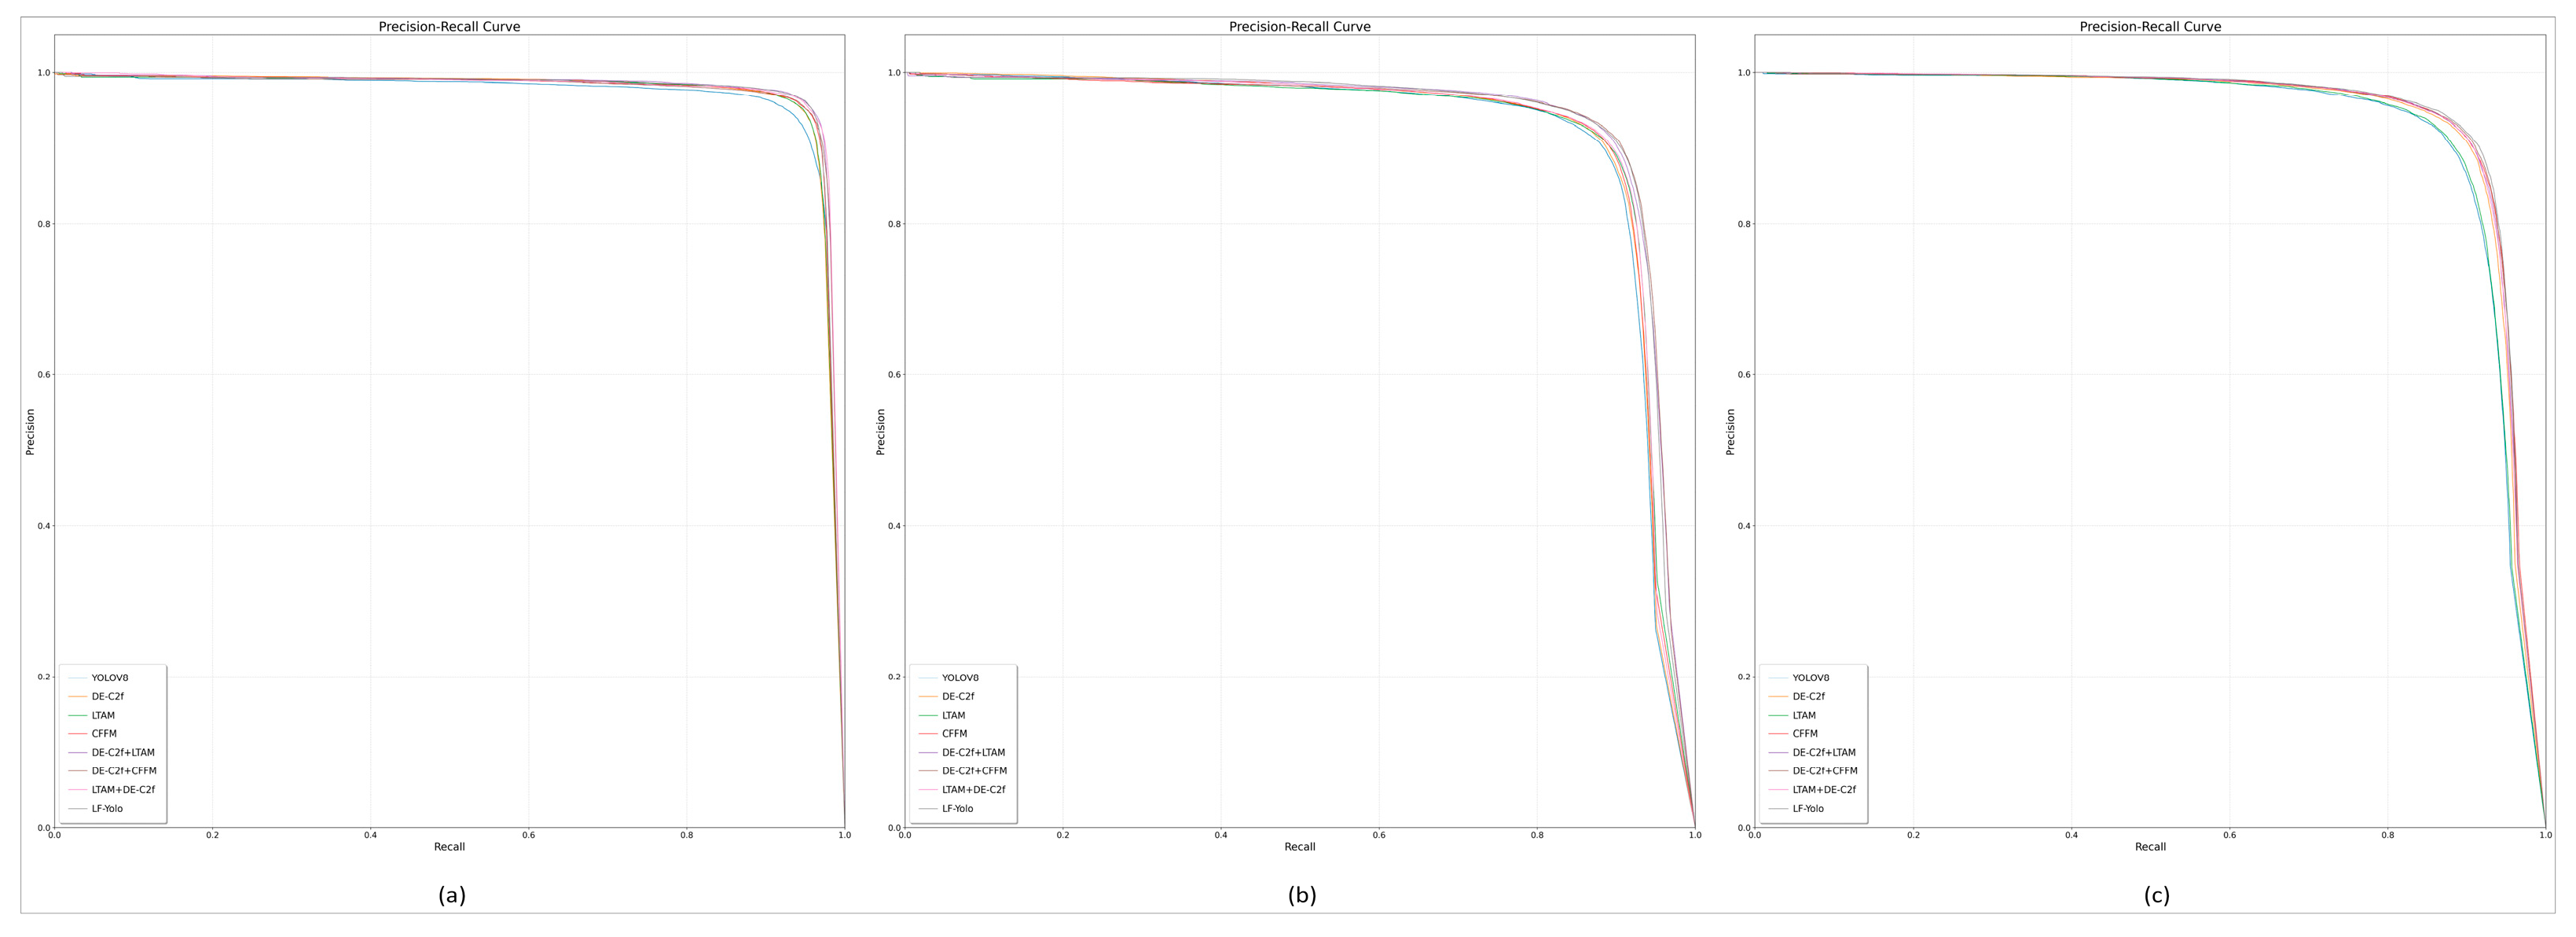
This study employs a systematic controlled ablation experiment methodology to validate the effectiveness of the proposed DE-C2f, LTAM, and CFFMs in dense object detection tasks in agricultural fields. Using the standard Yolo V8 model as the baseline network, each enhancement module is sequentially introduced via controlled variable methods. All experiments are conducted under identical hyperparameter settings and evaluated across three datasets to comprehensively assess the modules’ generalization capabilities and synergistic effects. Table 6 presents ablation results on the UAVMaize dataset, Table 7 shows results on the FusionMaize dataset, and Table 8 displays results on the Wheat Ear dataset. Figure 15, Figure 16 and Figure 17 illustrate the PR curves, mAP50 curves, and loss curves from the ablation experiments.
On the UAVMaize dataset, the DE-C2f module (Experiment 2) achieved a recall of 94.4%, an mAP50 of 97.1%, and an mAP50:95 of 47.4%, representing improvements of 0.5% and 0.7%, respectively, demonstrating its enhanced feature extraction capability. The LTAM (Experiment 3) significantly improved overall performance, achieving precision, recall, mAP50, and mAP50:95 of 95.5%, 95.1%, 97.2%, and 48.2%, respectively—representing increases of 0.2%, 1.2%, 0.4%, and 1.5% over YoloV8; The CFFM (Experiment 4) delivered balanced performance, achieving 94.2% recall, 96.9% mAP50, and 47.4% mAP50:95. Among the module combination experiments, the tri-module ensemble (Experiment 8) achieved the best performance, attaining 97.9% mAP50 and 49.6% mAP50:95.
On the FusionMaize Dataset, the DE-C2f module (Experiment 2) maintained high precision alongside recall rates, achieving mAP50 and mAP50:95 of 88.4%, 92.6%, and 52.8%, respectively—representing improvements of 0.5%, 0.3%, and 0.9% over the baseline model. The LTAM (Experiment 3) achieved the highest recall (88.6%), surpassing the baseline model by 0.7%. It attained 92.5% mAP50 and 52.9% mAP50:95, representing improvements of 0.2% and 1.0%, respectively; The CFFM (Experiment 4) demonstrated the strongest overall improvement, with mAP50:95 significantly increasing to 54.2%. It achieved 91.7% precision, 89.1% recall, and 54.2% mAP50:95. The direct combination of DE-C2f and LTAM (Experiment 5) exhibited performance degradation, indicating the need for improved inter-module coordination mechanisms. The three-module integration (Experiment 8) achieved optimal results across all metrics, with mAP50:95 rising to 55.6%.
On the Wheat Ear Dataset, all modules demonstrated significant performance improvements. The DE-C2f module (Experiment 2) achieved precision and recall rates of 92.3% and 88.3%, respectively, along with mAP50 and mAP50:95 values of 94.3% and 58.4%. Compared to the YoloV8 model, it achieved a 1.0% improvement in both precision and mAP50, while also achieving a 1.0% improvement in recall and mAP50:95. 94.3% and 58.4%, respectively. Compared to the YoloV8 model, it achieved a 1.0% improvement in precision and mAP50, along with 1.4% and 2.0% gains in recall and mAP50:95, respectively. The LTAM (Experiment 3) achieved precision and recall of 92.1% and 86.7%, respectively, with mAP50 and mAP50:95 at 93.4% and 57.2%. The CFFM (Experiment 4) achieved the best recall and mAP50 at 89.4% and 94.7%, respectively, improving by 2.5% and 1.5% over the baseline model. It achieved 92.4% precision and 58.9% mAP50:95, representing improvements of 1.1% and 2.4%. The three-module integration (Experiment 8) delivered the most comprehensive optimal performance, achieving 93.1% precision, 90.3% recall, 95.7% mAP50, and 59.7% mAP50:95.
The curve plots demonstrate that introducing the DE-C2f module, LTAM, and CFFM module, respectively, across three datasets achieves higher precision and recall rates. This trend shows a significant improvement in the medium-to-high recall range, with the curve shifting closer to the upper-right corner compared to the baseline model. This indicates robust performance within the medium-to-high recall range. The mAP curve corroborates this finding: each module individually improves performance, while the combined three modules exhibit minimal fluctuation and the smoothest curve. Finally, the loss curve demonstrates that integrating all three modules accelerates convergence, markedly improving boundary regression accuracy. This confirms our module design achieves performance optimization by accelerating convergence and reducing training time.
Experimental results demonstrate that the proposed modules effectively enhance detection performance across various datasets. The DE-C2f module constructs adaptive receptive fields using multi-scale convolutional kernels (3 × 3, 5 × 5, 7 × 7), covering different-sized receptive fields with varying kernel dimensions to effectively address the issue of large target scale variations in agricultural scenarios. Its small object enhancement path enhances scale invariance through downsampling–upsampling operations, significantly improving small object detection capabilities across all three datasets. The LTAM employs a triple attention mechanism working in concert: channel attention compresses and optimizes channel weights, spatial attention enhances boundary features via 7 × 7 convolutions, and the feature enhancement branch strengthens detail representation through a bottleneck structure. This lightweight design maintains parameter efficiency while significantly improving target-background discrimination, demonstrating strong adaptability in complex agricultural environments. The CFFM employs a dynamic upsampling mechanism to prevent detail loss, with multi-domain attention fusion capturing long-range dependencies in the channel domain and optimizing weight allocation in the spatial domain. The dual-path collaborative design preserves fine details while enhancing channel representation capabilities, achieving effective fusion of multi-scale features across all three datasets. The three modules collectively achieve synergistic effects. The DE-C2f module expands the receptive field, enhancing small object recognition capabilities; LTAM amplifies high-frequency features of small objects while suppressing background noise; and the CFFM excels particularly in multi-scale feature fusion. The combined use of these three modules leverages synergistic effects, with improved cross-task stability demonstrating the model’s strong generalization capabilities.
To validate the effectiveness of our improvements, we replaced the LTAM attention module in our LF-Yolo model with the widely adopted CBAM attention and SE attention modules. The specific experimental results are shown in Experiments 9 and 10 of Table 6, Table 7, and Table 8. On the UAVMaize, FusionMaize, and Wheat Ear datasets, the accuracy achieved after replacing with the CBAM attention mechanism was 94.9%, 91.3%, and 92.1%, respectively, representing reductions of 1.3%, 1.2%, and 1.0% compared to LF-Yolo. The mAP50 metrics were 96.5%, 93.1%, and 94.9%, respectively, representing decreases of 1.4%, 1.5%, and 0.8% compared to LF-Yolo. When replaced with the SE attention mechanism, the accuracy values were 95.3%, 91.2%, and 92.4%, respectively, decreasing by 0.9%, 1.3%, and 0.7% compared to LF-Yolo; mAP50 metrics were 96.8%, 92.6%, and 94.6%, representing decreases of 1.1%, 2.0%, and 0.8% compared to LF-Yolo. It is evident that the SE module, as a classic channel attention mechanism, primarily captures inter-channel relationships through global average pooling. However, its lack of spatial attention weight distribution hinders effective processing of irregularly distributed small objects in agricultural images. Although the CBAM module combines channel and spatial attention, its serial structure exhibits limitations in complex agricultural scenarios: First, the fully connected layer used for channel attention introduces a large number of parameters. Second, the simple max pooling and average pooling operations employed for spatial attention concatenation struggle to effectively capture fine-grained features of small objects. Consequently, replacing the original LTAM with CBAM and SE modules reduces the model’s feature extraction capability.

3.5. Heatmap Visualization Analysis

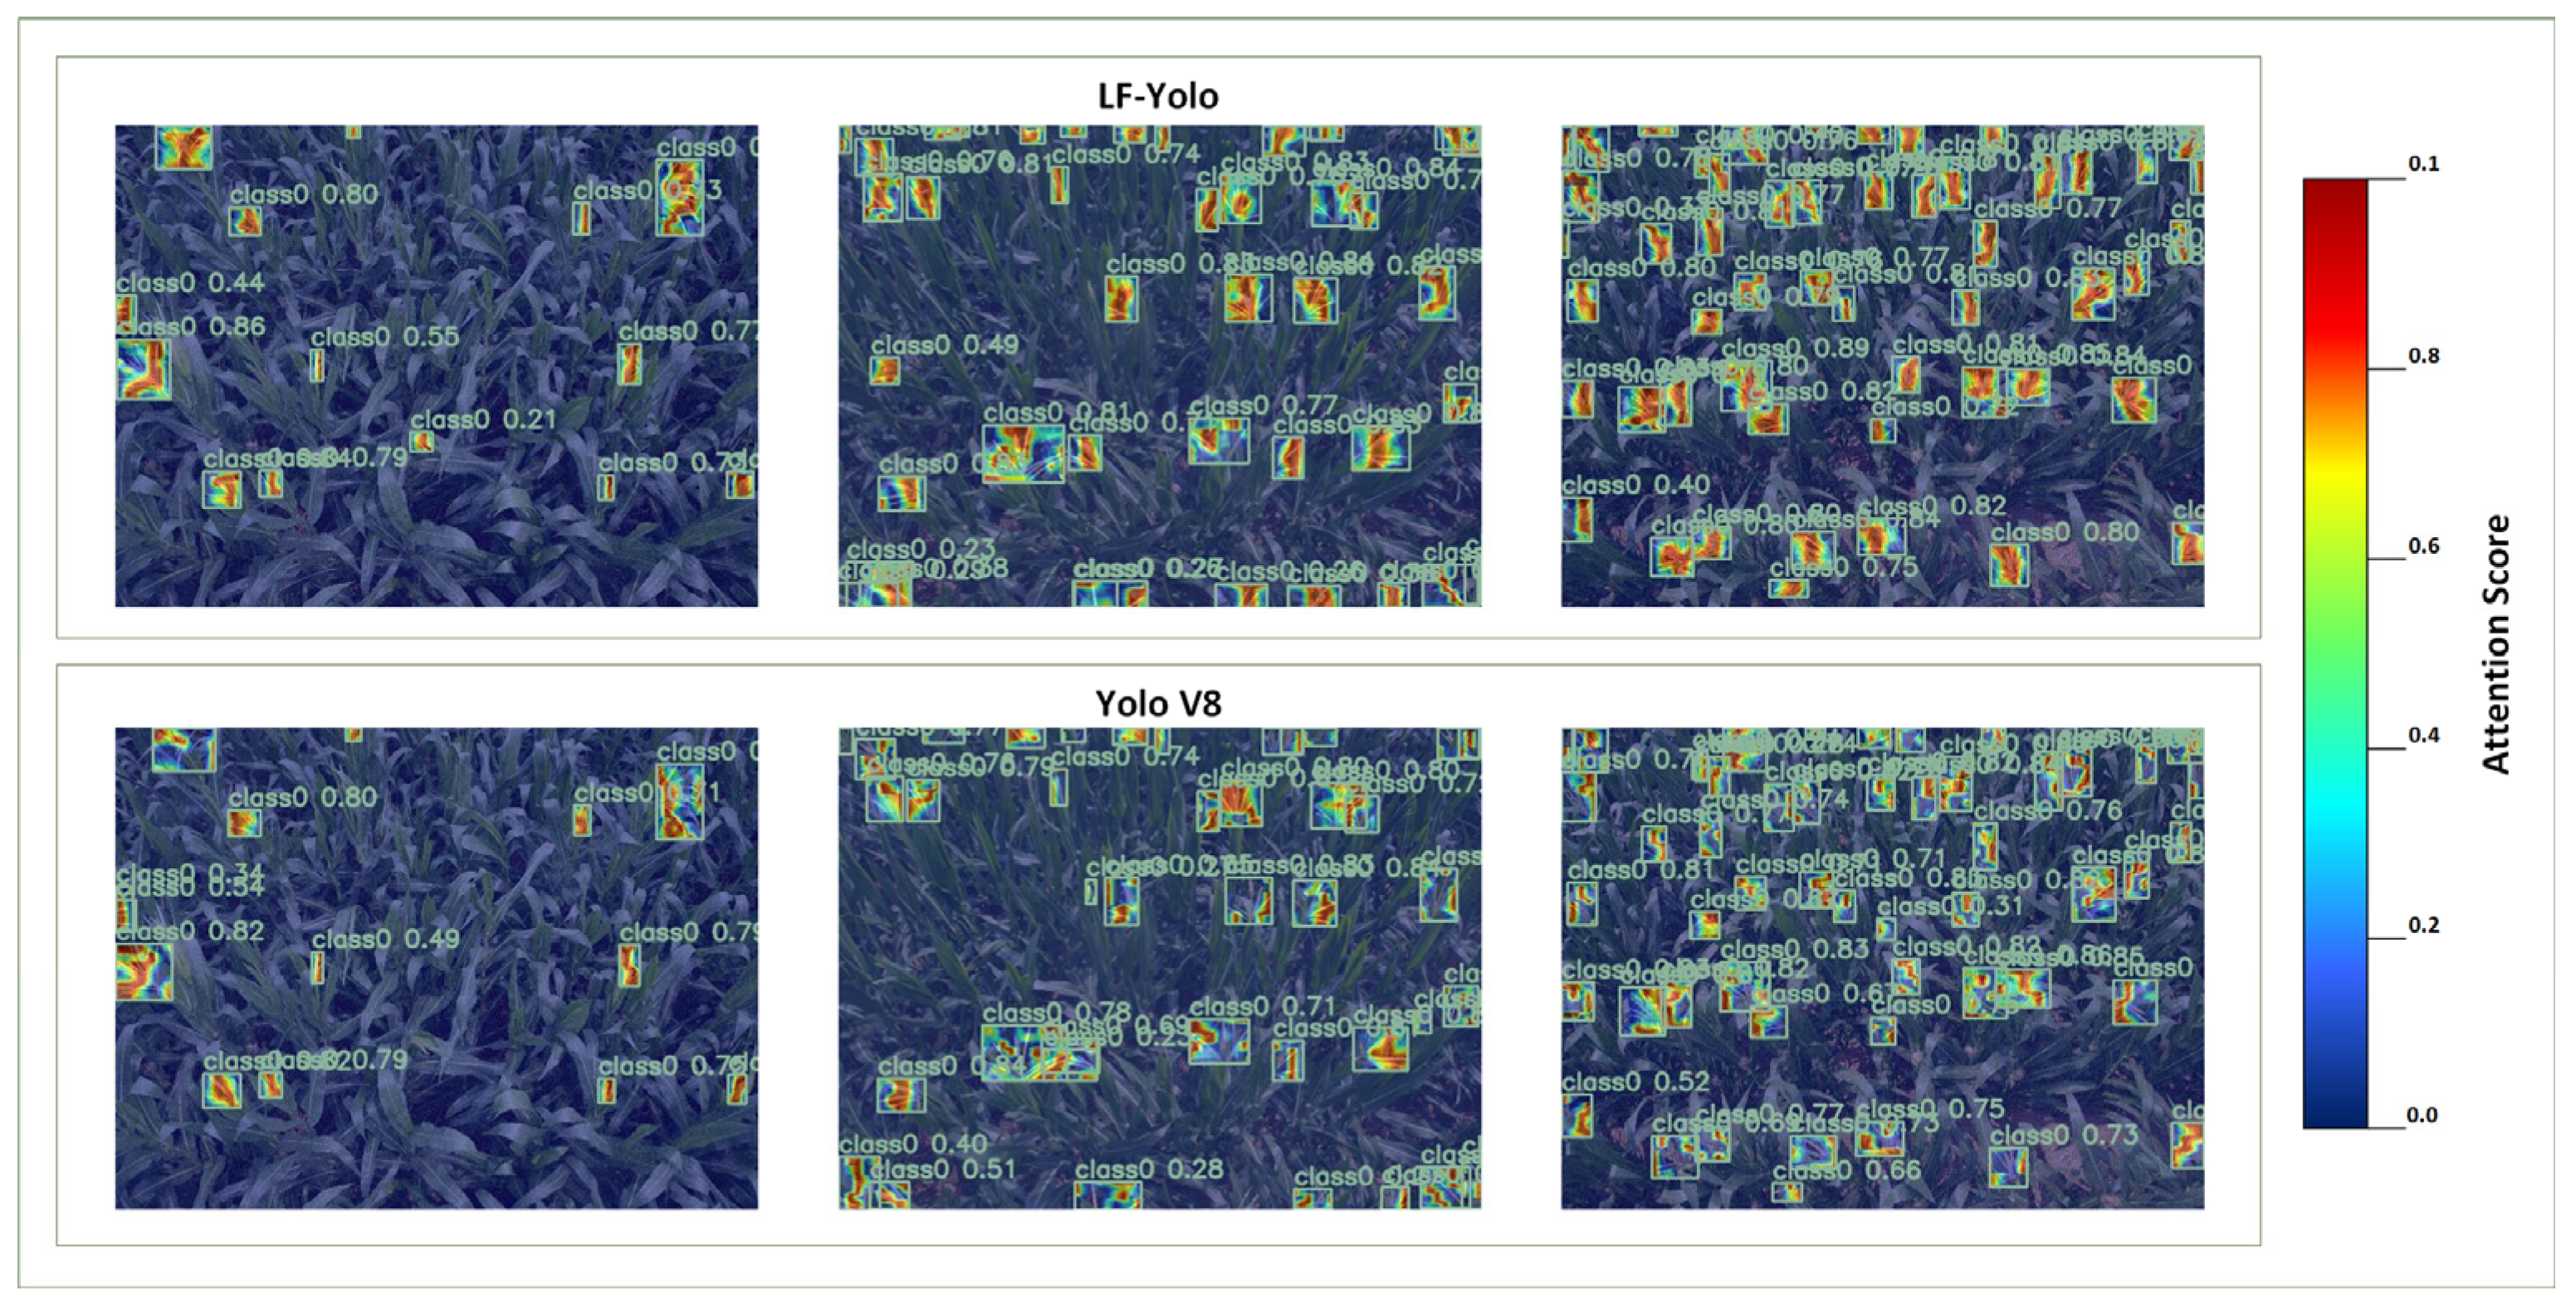
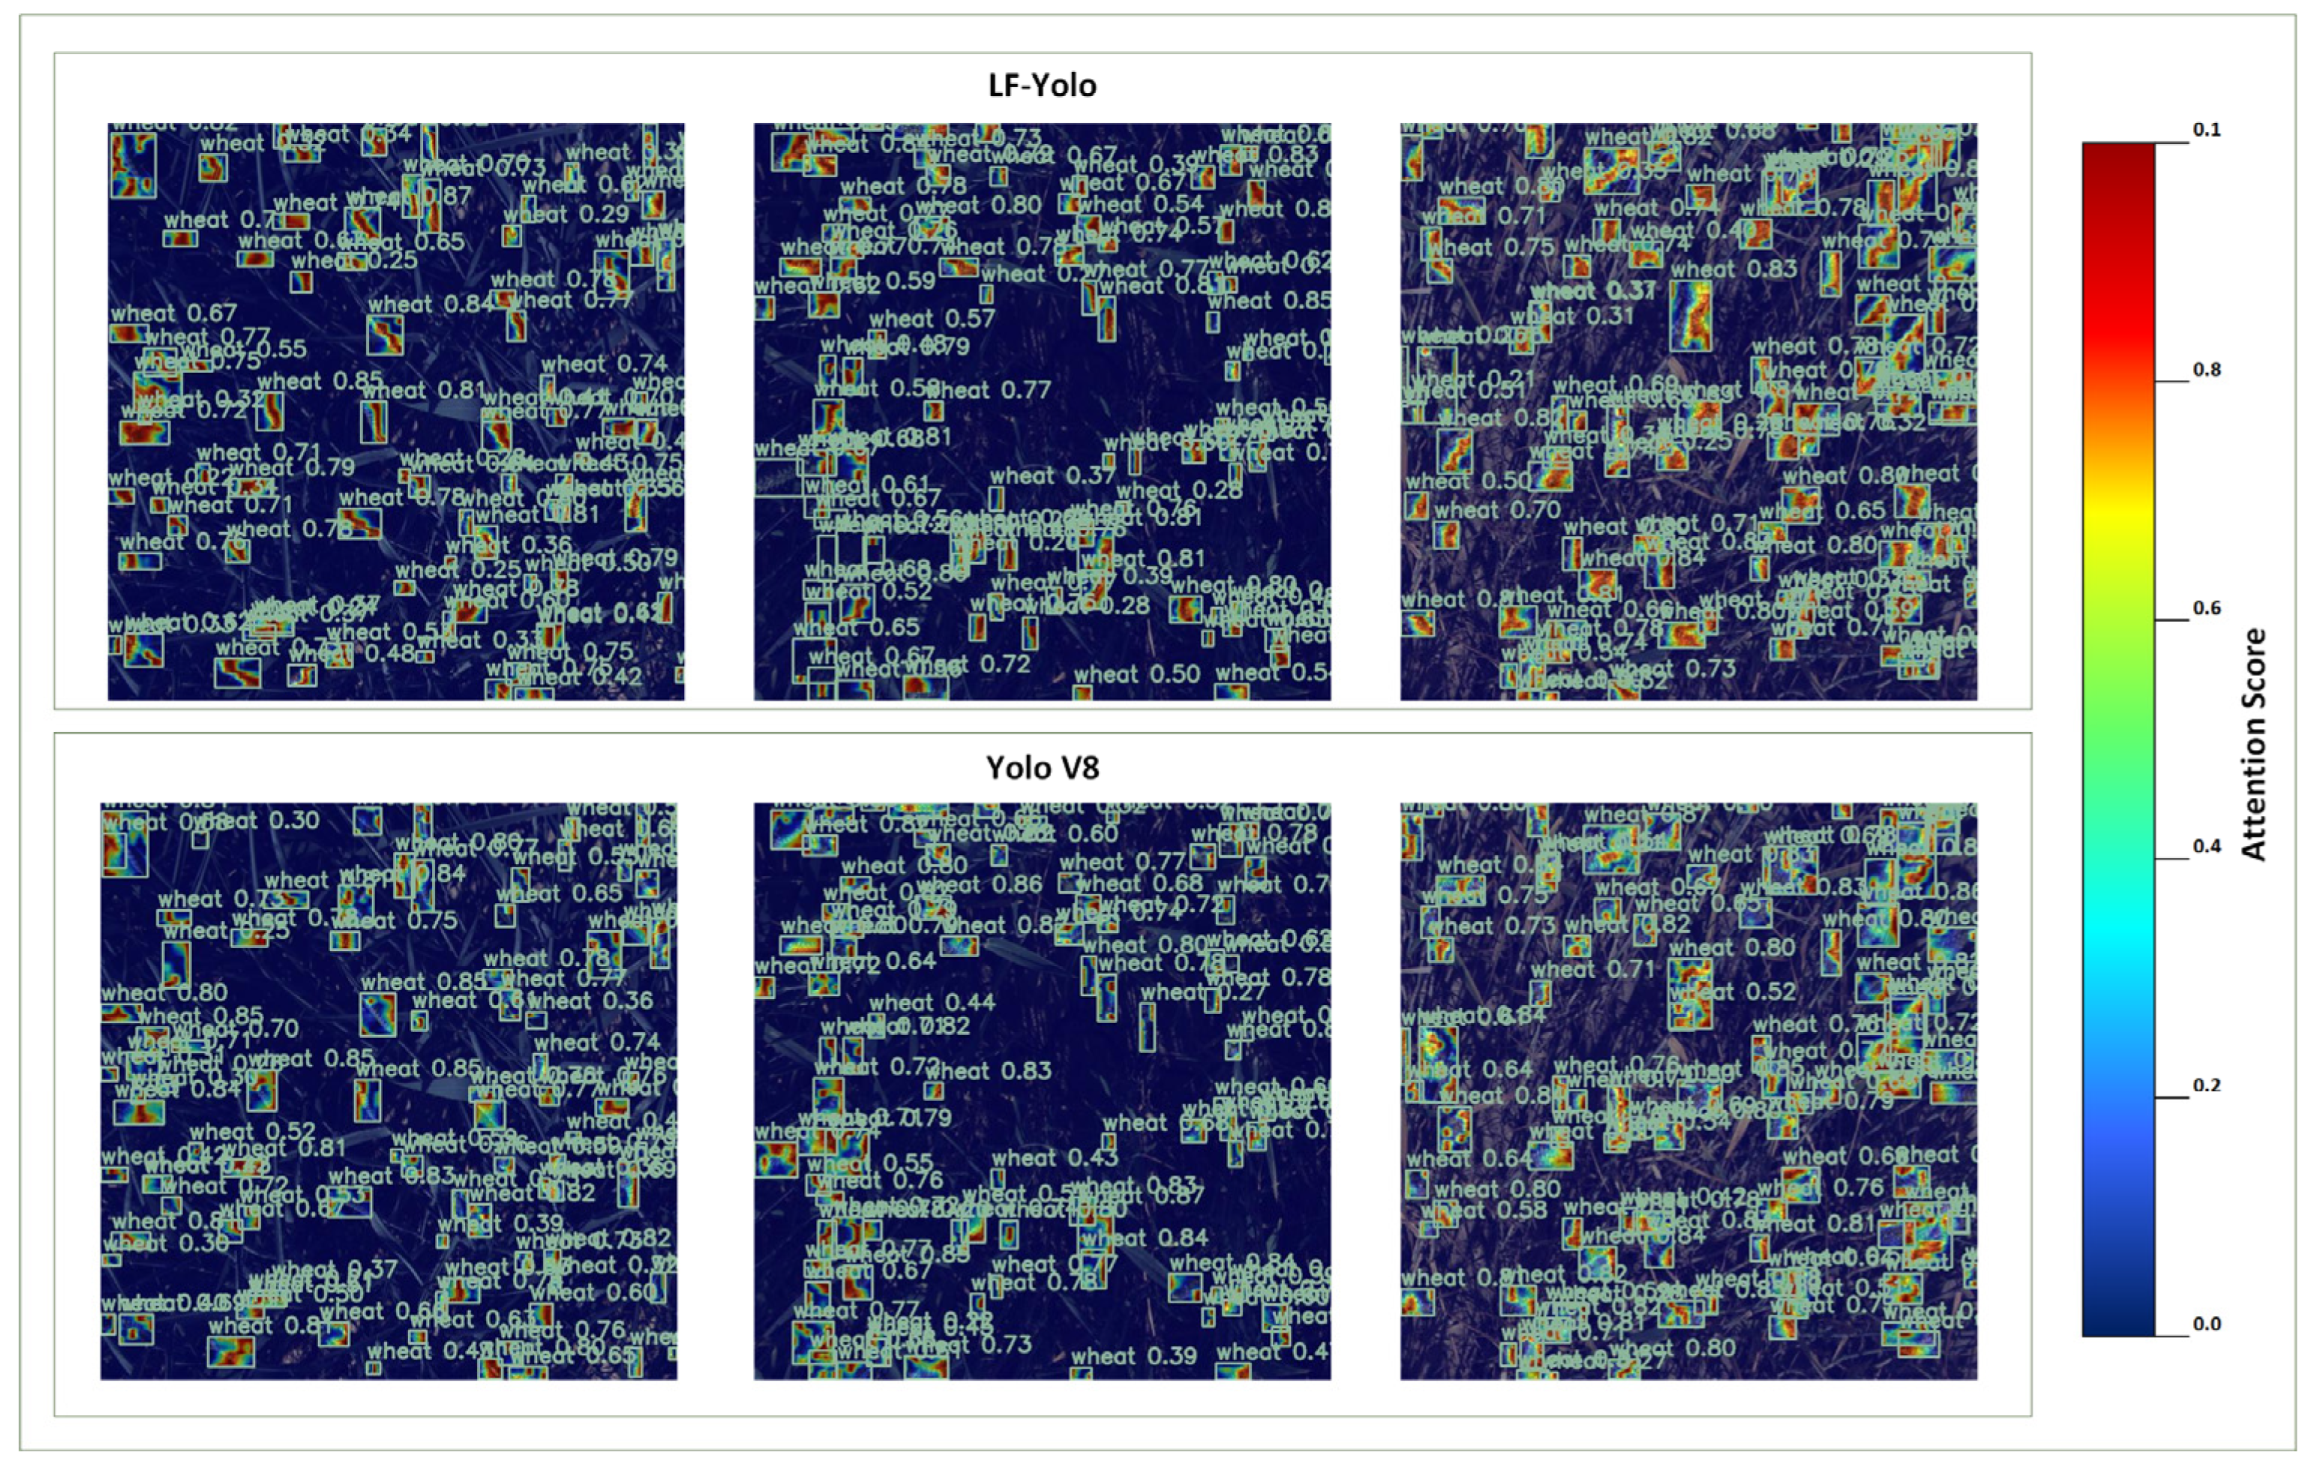
To visually demonstrate the optimization effectiveness of the LF-Yolo model proposed in this study, this section employs Gradient-Weighted Class Activation Mapping [22] to visualize the output layer. For comparison, the widely used YoloV8 object detection model is employed. The results of the heatmap visualization are shown in Figure 18, Figure 19 and Figure 20, where Figure 18 presents the heatmap on the UAVMaize dataset, Figure 19 displays the heatmap on the FusionMaize Dataset, and Figure 20 illustrates the heatmap on the Wheat Ear Dataset. A color gradient is displayed on the right side of each heatmap to quantitatively represent the intensity of attention focus. As shown below, the transition from blue to red indicates progressively deeper levels of attention. Dark blue signifies areas receiving minimal attention, while dark red denotes areas attracting the highest level of focus.
When using the YoloV8 model to detect densely packed small objects in fields, such as wheat ears and corn tassels, the model is susceptible to interference from complex backgrounds and overlapping occlusions by other objects, which can distract the model. As shown in the figure, when detecting crop ears, the YoloV8 model fails to focus its attention on the main body of the ear. Instead, its attention is scattered around the peripheral areas surrounding the target ear, which is the reason for the low detection accuracy. In contrast, the proposed LF-YOLO demonstrates more concentrated and accurate heat response regions under identical conditions. Attention noticeably converges toward the main body of the ears, with significantly reduced false responses in background and peripheral areas. This visualization validates the structural design effectiveness of our model: The DE-C2f module enhances feature expression of small object edges and textures through multi-scale separable convolutions and dual-path enhancement, suppressing interference from redundant background information. The LTAM utilizes channel–spatial attention collaboration and bottleneck enhancement to boost target region saliency while reducing noise responses. The CFFM alleviates semantic loss during feature alignment between deep and shallow layers through dynamic upsampling and multi-domain weight fusion, thereby improving localization accuracy. The synergistic interaction of these modules enhances the model’s ability to focus on crop ears and perceive structural details.
4. Discussion

Although the LF-YOLO model achieves good accuracy in detecting dense ears in the field, its training data primarily originates from the Northeast Plain of China, the North China Plain, and Western Europe. The light patterns and soil background characteristics in these regions cannot fully represent all agricultural areas. Additionally, the data collection lacks samples under other weather conditions and for more crops (such as rice and sorghum), failing to validate the model’s robustness under all-weather conditions and diverse crop backgrounds. Moving forward, we will collect data across multiple crops, diverse weather conditions, and additional agricultural regions.
Although we have demonstrated our model’s strong performance in detecting dense crop tassels in open datasets, its generalization capabilities beyond field conditions remain unverified. Moving forward, we will focus on collecting more diverse datasets—such as fruit detection on trees in orchards and pest detection in field crops—to extend our model’s applicability to a broader range of agricultural scenarios.
The UAVMaize dataset used in this experiment was collected exclusively during the tasseling stage of maize, excluding other growth stages. When structural changes occur in ear morphology due to developmental stages (e.g., ears not fully tasseled), the model may produce false negatives. In future work, we will capture data throughout the entire crop growth cycle to enhance the robustness of the temporal data.
The model was trained using data collected from drones hovering at fixed points. Although data augmentation was employed to simulate device noise, systematic validation was not conducted in scenarios involving drone motion blur or natural interference such as windy conditions. Furthermore, all data collection occurred at a fixed altitude, and robustness verification for dynamic altitude data acquisition was not performed. Future work will incorporate dynamic altitude validation and data augmentation for natural interference scenarios.
The current architecture is specifically designed for RGB imagery and does not utilize vegetation index features from spectral channels such as near-infrared. This model has not yet integrated such information to enhance target separation capabilities in complex backgrounds. In the future, we will make adjustments to improve the model’s adaptability to multispectral data.

5. Conclusions

This study proposes the efficient small-object focusing model LiteFocus-YOLO (LF-YOLO), achieving innovative breakthroughs in addressing three major challenges in dense ear detection in fields: redundant shallow-level features, severe background interference, and loss of semantic information. By constructing an adaptive gated feature fusion module (DE-C2f) and employing a multi-scale deep separation convolutional group with a dual-path enhancement mechanism, it significantly improves small target boundary recognition capabilities, effectively resolving texture blurring issues in densely planted scenarios. To tackle complex background interference, the lightweight target-aware attention module (LTAM) innovatively adopts a dual-branch (channel–spatial) compression architecture paired with a bottleneck feature enhancement pathway. This module enhances noise resistance while substantially reducing computational overhead. To mitigate semantic loss during multi-scale feature fusion, the Cross-Feature Fusion Module (CFFM) introduces a dual-path architecture. Post-upsampling, a deep semantic attention branch generates multi-domain attention weights, which are integrated with a shallow feature enhancement branch to achieve adaptive weighted fusion of deep and shallow features.
Experimental results demonstrate that the LF-Yolo model achieves an mAP50 of 97.9 on the UAVMaize dataset, with mAP50 scores of 94.6% and 95.7% for maize tassel and wheat ear detection tasks, respectively, outperforming mainstream object detection models and exhibiting strong generalization capabilities across diverse datasets. Its relatively lightweight parameter count and computational complexity achieve an efficient balance between accuracy and computational demands, significantly enhancing computational efficiency. This lays the foundation for transfer learning applications in similar scenarios involving dense targets in agricultural environments, advancing the deployment of agricultural object detection technology onto edge computing devices.

Author Contributions

Conceptualization, H.W.; methodology, H.W. and J.H.; software, Y.J. and C.Z.; validation, H.Z. and M.C.; formal analysis, C.P. and Y.M.; investigation, C.Z.; resources, Y.M.; data curation, H.W. and J.H.; writing—original draft preparation, H.W.; writing—review and editing, Y.M. and Y.B.; visualization, H.Z.; supervision, Y.M. and C.P.; project administration, Y.M. and H.G.; funding acquisition, Y.M. and H.G. All authors have read and agreed to the published version of the manuscript.

Funding

This research received no external funding.

Institutional Review Board Statement

Not applicable.

Data Availability Statement

The data presented in this study are available on request from the corresponding author. The data are not publicly available due to ongoing research projects.

Conflicts of Interest

The author declares no conflicts of interest.

References

  1. Ren, S.; He, K.; Girshick, R.; Sun, J. Faster R-CNN: Towards Real-Time Object Detection with Region Proposal Networks. IEEE Trans. Pattern Anal. Mach. Intell. 2016, 39, 1137–1149. [Google Scholar] [CrossRef] [PubMed]
  2. He, K.; Gkioxari, G.; Dollar, P.; Girshick, R. Mask R-CNN. In Proceedings of the 2017 IEEE International Conference on Computer Vision (ICCV), Venice, Italy, 22–29 October 2017; IEEE: Piscataway, NJ, USA, 2017; pp. 2980–2988. [Google Scholar]
  3. Liu, Y.; Cen, C.; Che, Y.; Ke, R.; Ma, Y.; Ma, Y. Detection of Maize Tassels from UAV RGB Imagery with Faster R-CNN. Remote Sens. 2020, 12, 338. [Google Scholar] [CrossRef]
  4. Aijun, G.; Ang, G.; Chunming, Y.; Zhilong, Z.; Ji, Z.; Jinglong, Z. Dropping Ear Detection Method for Corn Harverster Based on Improved Mask-RCNN. INMATEH Agric. Eng. 2022, 66, 31–40. [Google Scholar] [CrossRef]
  5. Li, R.; Wu, Y. Improved YOLO v5 Wheat Ear Detection Algorithm Based on Attention Mechanism. Electronics 2022, 11, 1673. [Google Scholar] [CrossRef]
  6. Ban, X.; Liu, P.; Xu, L.; Zhao, J. A Lightweight Model Based on YOLOv8n in Wheat Spike Detection. In Proceedings of the 2023 11th International Conference on Agro-Geoinformatics (Agro-Geoinformatics), Wuhan, China, 25–28 July 2023; IEEE: Piscataway, NJ, USA, 2023; pp. 1–6. [Google Scholar]
  7. Qiu, S.; Li, Y.; Zhao, H.; Li, X.; Yuan, X. Foxtail Millet Ear Detection Method Based on Attention Mechanism and Improved YOLOv5. Sensors 2022, 22, 8206. [Google Scholar] [CrossRef] [PubMed]
  8. Chen, J.; Fu, Y.; Guo, Y.; Xu, Y.; Zhang, X.; Hao, F. An Improved Deep Learning Approach for Detection of Maize Tassels Using UAV-Based RGB Images. Int. J. Appl. Earth Obs. Geoinf. 2024, 130, 103922. [Google Scholar] [CrossRef]
  9. Wang, B.; Yang, G.; Yang, H.; Gu, J.; Xu, S.; Zhao, D.; Xu, B. Multiscale Maize Tassel Identification Based on Improved RetinaNet Model and UAV Images. Remote Sens 2023, 15, 2530. [Google Scholar] [CrossRef]
  10. Liu, W.; Lu, H.; Fu, H.; Cao, Z. Learning to Upsample by Learning to Sample. In Proceedings of the 2023 IEEE/CVF International Conference on Computer Vision (ICCV), Paris, France, 1–6 October 2023. [Google Scholar]
  11. Varghese, R.; M., S. YOLOv8: A Novel Object Detection Algorithm with Enhanced Performance and Robustness. In Proceedings of the 2024 International Conference on Advances in Data Engineering and Intelligent Computing Systems (ADICS), Chennai, India, 18–19 April 2024; IEEE: Piscataway, NJ, USA, 2024; pp. 1–6. [Google Scholar]
  12. Wang, C.-Y.; Yeh, I.-H.; Mark Liao, H.-Y. YOLOv9: Learning What You Want to Learn Using Programmable Gradient Information. In Proceedings of the Computer Vision—ECCV 2024 18th European Conference, Milan, Italy, 29 September–4 October 2025; pp. 1–21. [Google Scholar]
  13. Wang, A.; Chen, H.; Liu, L.; Chen, K.; Lin, Z.; Han, J.; Ding, G. YOLOv10: Real-Time End-to-End Object Detection. In Proceedings of the NIPS ‘24: Proceedings of the 38th International Conference on Neural Information Processing Systems, Vancouver, BC, Canada, 10–15 December 2024. [Google Scholar]
  14. Liu, W.; Anguelov, D.; Erhan, D.; Szegedy, C.; Reed, S.; Fu, C.-Y.; Berg, A.C. SSD: Single Shot MultiBox Detector. In Proceedings of the Computer Vision—ECCV 2016, 14th European Conference, Amsterdam, The Netherlands, 11–14 October 2016. [Google Scholar] [CrossRef]
  15. Li, C.; Li, L.; Jiang, H.; Weng, K.; Geng, Y.; Li, L.; Ke, Z.; Li, Q.; Cheng, M.; Nie, W.; et al. YOLOv6: A Single-Stage Object Detection Framework for Industrial Applications. arXiv 2022, arXiv:2209.02976. [Google Scholar] [CrossRef]
  16. Khanam, R.; Hussain, M. YOLOv11: An Overview of the Key Architectural Enhancements. arXiv 2024, arXiv:2410.17725. [Google Scholar] [CrossRef]
  17. Tian, Y.; Ye, Q.; Doermann, D. YOLOv12: Attention-Centric Real-Time Object Detectors. arXiv 2025, arXiv:2502.12524v1. [Google Scholar] [CrossRef]
  18. Dandrifosse, S.; Ennadifi, E.; Carlier, A.; Gosselin, B.; Dumont, B.; Mercatoris, B. Deep Learning for Wheat Ear Segmentation and Ear Density Measurement: From Heading to Maturity. Comput Electron. Agric. 2022, 199, 107161. [Google Scholar] [CrossRef]
  19. Zou, H.; Lu, H.; Li, Y.; Liu, L.; Cao, Z. Maize Tassels Detection: A Benchmark of the State of the Art. Plant Methods 2020, 16, 108. [Google Scholar] [CrossRef] [PubMed]
  20. Yu, Z.; Ye, J.; Li, C.; Zhou, H.; Li, X. TasselLFANet: A Novel Lightweight Multi-Branch Feature Aggregation Neural Network for High-Throughput Image-Based Maize Tassels Detection and Counting. Front. Plant Sci. 2023, 14, 1158940. [Google Scholar] [CrossRef] [PubMed]
  21. Lu, H.; Cao, Z.; Xiao, Y.; Zhuang, B.; Shen, C. TasselNet: Counting Maize Tassels in the Wild via Local Counts Regression Network. Plant Methods 2017, 13, 79. [Google Scholar] [CrossRef] [PubMed]
  22. Selvaraju, R.R.; Cogswell, M.; Das, A.; Vedantam, R.; Parikh, D.; Batra, D. Grad-CAM: Visual Explanations from Deep Networks via Gradient-Based Localization. In Proceedings of the 2017 IEEE International Conference on Computer Vision (ICCV), Venice, Italy, 22–29 October 2017; IEEE: Piscataway, NJ, USA, 2017; pp. 618–626. [Google Scholar]
Figure 1. Study Area Overview (a) Map of China; (b) Map of Heilongjiang Province; (c) Topographic Map of Shuangcheng District; (d) Panorama of the study area.
Agriculture 15 02036 g001
Figure 2. UAVMaize Dataset Sample Image.
Agriculture 15 02036 g002
Figure 3. Overall structure of LF-Yolo.
Agriculture 15 02036 g003
Figure 4. (a) Overall structure of DE-C2f; (b) Structure of the Adaptive Bottleneck; (c) Structure of the Small Target Enhancer.
Agriculture 15 02036 g004
Figure 5. Overall structure of LTAM.
Agriculture 15 02036 g005
Figure 6. Overall structure of CFFM.
Agriculture 15 02036 g006
Figure 7. Experimental result curve graph.
Agriculture 15 02036 g007
Figure 8. Bar chart of precision, recall, mAP50, and mAP50:95 metrics for comparative experiments.
Agriculture 15 02036 g008
Figure 9. Bar Chart Comparing FLOPS and Parameters in Experimental Tests.
Agriculture 15 02036 g009
Figure 10. Visualization result graph of the comparative experiment.
Agriculture 15 02036 g010
Figure 11. FusionMaize Dataset Sample Image.
Agriculture 15 02036 g011
Figure 12. Wheat Ear Dataset Sample Image.
Agriculture 15 02036 g012
Figure 13. The visualization result graph of the experiment conducted on the FusionMaize Dataset.
Agriculture 15 02036 g013
Figure 14. The visualization result graph of the experiment conducted on the Wheat Ear Dataset.
Agriculture 15 02036 g014
Figure 15. PR curve diagram of ablation experiment. (a) On the UAVMaize Dataset; (b) On the FusionMaize Dataset; (c) On the Wheat Ear Dataset.
Agriculture 15 02036 g015
Figure 16. mAP50 curve diagram of ablation experiment. (a) On the UAVMaize Dataset; (b) On the FusionMaize Dataset; (c) On the Wheat Ear Dataset.
Agriculture 15 02036 g016
Figure 17. training loss curve diagram of ablation experiment. (a) On the UAVMaize Dataset; (b) On the FusionMaize Dataset; (c) On the Wheat Ear Dataset.
Agriculture 15 02036 g017
Figure 18. Heatmap illustration of the UAVMaize dataset.
Agriculture 15 02036 g018
Figure 19. Heatmap illustration of the FusionMaize Dataset.
Agriculture 15 02036 g019
Figure 20. Heatmap illustration of the Wheat Ear Dataset.
Agriculture 15 02036 g020
Table 1. UAV Flight Parameters.
OptionParameters
Flight altitude8 m
Heading overlap rate75%
Lateral overlap rate75%
Flight speed5 m/s
Number of control points1125
Resolution0.512 cm/px
Table 2. Experimental Details Table.
ConfigurationParameters
CPUIntel(R)Xeon(R)Gold 6148 CPU @2.40 GHz
GPUA100 (40 G)
Development environmentPyCharm 2023.2.5
LanguagePython 3.8.10
FrameworkPyTorch 2.0.1
Operating platformCUDA 11.8
Operating systemLinux
Epochs400
Table 3. The results of the comparative experiment.
ModelsPrecision (%)Recall (%)mAP50(%)mAP50-95(%)FLOPs/GParameters (M)
Faster R-CNN87.336.234.518.10470.4628.3
SSD [14]90.437.436.1219.4730.4323.7
Yolo V594.593.596.445.57.22.51
Yolo V6 [15]95.493.996.947.011.94.23
Yolo V895.393.996.846.78.23.61
Yolo V9c95.994.097.248.0103.725.5
Yolo V9m95.895.097.548.177.520.2
Yolo V9s95.194.997.347.627.47.29
Yolo V10b93.492.596.246.798.720.5
Yolo V10m94.893.597.047.964.016.5
Yolo V10s93.592.296.247.624.88.07
Yolo V11 [16]95.494.197.147.26.42.59
Yolo V12 [17]95.294.397.247.06.52.57
LF-Yolo96.295.597.949.627.47.9
Table 4. The Generalization Experimen results of the FusionMaize Dataset.
ModelsPrecision (%)Recall (%)mAP50 (%)mAP50-95 (%)FLOPs/GParameters (M)
Faster R-CNN69.1489.1282.6533.93470.4628.3
SSD90.3537.4474.019.4730.4323.7
Yolo V591.488.593.153.17.22.51
Yolo V691.988.392.551.911.94.23
Yolo V891.587.992.351.98.23.61
Yolo V9c91.089.092.655.3103.725.5
Yolo V9m91.688.892.954.377.520.2
Yolo V9s91.387.692.653.427.47.29
Yolo V10b90.687.892.754.498.720.5
Yolo V10m90.588.292.753.764.016.5
Yolo V10s90.487.292.252.524.88.07
Yolo V1191.887.992.652.76.42.59
Yolo V1291.688.792.952.26.52.57
LF-Yolo92.590.294.655.627.47.9
Table 5. The Generalization Experimen results of the Wheat Ear Dataset.
ModelsPrecision (%)Recall (%)mAP50 (%)mAP50-95 (%)FLOPs/GParameters (M)
Faster R-CNN80.5270.9867.3921.67470.4628.3
SSD85.8924.7141.6511.4330.4323.75
Yolo V592.386.493.556.87.22.51
Yolo V691.586.593.356.611.94.23
Yolo V891.386.993.356.58.23.01
Yolo V9c92.689.094.558.4103.725.5
Yolo V9m92.589.294.658.477.520.2
Yolo V9s92.489.094.658.627.47.29
Yolo V10b92.089.094.158.698.720.5
Yolo V10m92.188.394.258.764.016.5
Yolo V10s92.288.494.258.524.88.07
Yolo V1191.986.593.457.06.42.59
Yolo V1291.686.493.256.86.52.57
LF-Yolo93.190.395.759.727.47.9
Table 6. The results of the UAVMaize Dataset Experimental Results.
NUMModule NameResult
DE-C2fLTAMCFFMPrecision (%)Recall (%)mAP50 (%)mAP50:95 (%)
1 95.393.996.846.7
2 95.394.497.147.4
3 95.595.197.248.2
4 95.594.296.947.4
5 95.795.197.547.6
6 95.794.997.448.1
7 95.895.297.148.5
896.295.597.949.6
Table 7. The results of the FusionMaize Dataset Experimental Results.
NUMModule NameResult
DE-C2fLTAMCFFMPrecision (%)Recall (%)mAP50 (%)mAP50:95 (%)
1 91.587.992.351.9
2 91.588.492.652.8
3 90.888.692.552.9
4 91.789.193.254.2
5 91.587.391.852.3
6 91.086.693.354.5
7 92.188.693.554.3
892.590.294.655.6
Table 8. The results of the Wheat Ear Dataset Experimental Results.
NUMModule NameResult
DE-C2fLTAMCFFMPrecision (%)Recall (%)mAP50 (%)mAP50:95 (%)
1 91.386.993.356.5
2 92.388.394.358.4
3 92.186.793.457.2
4 92.489.494.858.9
5 92.288.994.759.0
6 91.789.394.858.9
7 92.788.994.958.9
893.190.395.759.7
Disclaimer/Publisher’s Note: The statements, opinions and data contained in all publications are solely those of the individual author(s) and contributor(s) and not of MDPI and/or the editor(s). MDPI and/or the editor(s) disclaim responsibility for any injury to people or property resulting from any ideas, methods, instructions or products referred to in the content.