Abstract
Genome-wide association studies (GWAS) have been a successful tool for identifying quantitative trait loci (QTL) for economically important traits in dairy cows. However, the availability of QTLs linked to phenotypic traits is limited in the literature. In this study, we used GWAS, haplotype association, and fine-mapping analyses to identify candidate variants associated with milk production, health, and reproductive traits in 380 Chinese Holstein cattle from Southern China using whole-genome sequence data. GWAS identified 91 genome-wide significant signals that were annotated to 63 genes associated with milk production, health, and reproductive traits in dairy cattle. Haplotype association analysis further revealed that eight GWAS signals within three QTLs were associated with milk production and health traits of cows. Fine-mapping analysis revealed that 3 GWAS signals (6_92530313_G_A, 10_17185230_G_A, and 10_17209112_T_G) were the potential causal variants. Several candidate genes, including ANKS1B, IL17RD, CNOT6L, AOC1, and TLE3, have been confirmed to be associated with milk production, health, and reproductive traits in dairy cows. These findings significantly contribute to unraveling the genetic basis of economically important traits in Holstein cattle.
1. Introduction
Chinese Holstein cattle are the foremost dairy breed propelling high-quality advancements in the dairy industry in China. They have become the predominant breed within the country’s dairy cattle population, comprising over 85% of the national herd [1]. According to our knowledge, Chinese Holstein cows are predominantly found in the northern regions of China, with comparatively fewer numbers present in the southern areas. High humidity and high temperature are the most prominent climatic features in southern China. High temperature and humidity are known to be the main cause of heat stress [2]. Heat stress in dairy cows is a serious issue that can negatively impact milk production [3], health [4], and reproduction [5]. For example, Rejeb et al. (2016) observed a decrease of 5.6 kg per day in cows during the spring and summer seasons [6]. Becker et al. (2020) emphasize that heat stress heightens the risk of mastitis in dairy cows by suppressing their immune response [7]. According to Bernabucci et al. (2010), conception rates typically decrease by approximately 24% during the summer months [8]. Obviously, the high humidity and elevated temperatures in southern China are not favorable for breeding Chinese Holstein cows. In this regard, there is a need to breed dairy cattle populations for improved heat tolerance. To address this issue, a deeper understanding of the genetic architecture of these traits related to these issues is crucial. This is because it can not only comprehensively improve the production performance of dairy cattle but also optimize breeding strategies, accelerating the genetic progress of these traits at the population level.
Genome-wide association studies (GWASs) have identified thousands of genetic variants linked to complex traits in cattle [9,10,11] and innovative traits, such as heat tolerance [12], methane emissions [13], and feed efficiency [14]. This approach has facilitated the understanding of the genetic mechanisms underlying complex traits and accelerated their genetic improvement [15]. To date, this approach has also been widely applied in the field of genetic analysis of economically important traits in livestock and poultry, with numerous published GWASs on dairy cattle [16,17,18], buffalo [19,20,21], horses [22,23,24], sheep [25,26,27], goats [28,29,30], pigs [31,32,33], and chickens [34,35], which has promoted the progress of genetic research in these species. Nonetheless, the genetic variants identified in existing GWASs have poor reproducibility and lack validation, and the fact that these loci are located in non-coding regions leads to small genetic effects, thereby affecting the further application of these loci in genetic breeding programs.
Numerous genetic variants identified by GWAS are not causal and are simply in linkage disequilibrium (LD) with the true causal variants. In general, genetic variants can be divided into three main groups [36]: the first group is the causal variants, which are responsible for the association signal and have a biological effect on the phenotype; the second group is the variants that are statistically associated with the phenotype due to LD with a causal variant; and the third group is the variants that are not statistically associated with the phenotype and are not causal. Undoubtedly, it is crucial to further precisely identify the causal loci within the GWAS signals. To address this issue, a method known as “fine-mapping” has been developed, which seeks to prioritize potential causal variants for subsequent functional studies. Currently, fine-mapping is a prevalent post-GWAS analysis technique in which the posterior probabilities of causality (PPC) are assigned to the candidate variants and genes. Importantly, the application of this approach to complex traits for single-variant resolution has begun in human studies [37,38]. Meanwhile, a large number of fine-mapping analysis software [39,40,41] have emerged one after another, accelerating the application of this method in causal loci. For example, FINEMAP implements GWAS summary statistics to explore a set of the most important causal configurations of regions using a shotgun stochastic search algorithm [42]. However, these fine-mapping methods are not easily applicable to large-scale GWAS and fine-mapping studies in cattle populations, because the data availability and high LD levels in livestock populations have restricted the utility of fine-mapping in GWAS loci. Fortunately, Jiang et al. developed a fast Bayesian fine-mapping method that efficiently integrates functional annotations with fine mapping [43]. Importantly, functional enrichment estimated by this approach enriches causal effects, whereas traditional stratified LD score regression estimates the enrichment of heritability [44].
In this study, therefore, we performed the GWAS analysis to identify candidate variants associated with milk production, health, and reproductive traits in Chinese Holstein cattle from Southern China. Subsequently, we integrate the haplotype association and fine-mapping approaches to identify the key candidate genes within GWAS signals. Our research enhances the understanding of the genetic framework underlying economically important traits in dairy cattle.
2. Materials and Methods
2.1. Animals and Phenotypes
A total of 380 Chinese Holstein cattle with 1038 lactation records were obtained from two farms (Hubei Jinxu Agriculture Development Co., Ltd. and Wuhan Guangmin Ecological Demonstration Dairy Cow Farm Co., Ltd., Wuhan, China) in Hubei Province, Southern China. Geographical coordinates of the two farms ranged from 29°01′53″ N to 33°6′47″ N and 108°21′42″ E to 116°07′50″ E. Blood samples were collected from the jugular vein using sterilized vacutainer tubes coated with EDTA as an anticoagulant. Phenotypic records of all dairy cows were collected between 2015 and 2023. Phenotypic records included five milk production traits: 305-day milk yield (MY305), fat percentage (FP), protein percentage (PP), peak milk yield (PM), and days to peak milk yield (PD); one reproductive trait: calving interval (CI), and one health trait: somatic cell score (SCS). SCS = log base 2 (SCC/100,000) + 3, where SCC is somatic cells per milliliter. PD refers to the lactation day when milk production is highest in lactation stage determination, with units in days. The pedigree data comprised 568 animals across three generations.
2.2. Deregressed Estimated Breeding Values
The deregressed estimated breeding value (dEBV) for each cow was calculated using a single-trait animal model implemented in the “blupADC (v1.0.7)” R package [45]. First, a linear model was used to evaluate all available components for significant impacts, and only significant factors were retained for inclusion in the single-trait animal models. The fixed effects of the milk production and health traits included herd–year–season (HYS; 55 classes) and parity (4 levels). The fixed effects of the reproductive traits included parity (4 levels), calving year (CY; 8 levels), and calving season (CS). The calving season was divided into four levels (spring: 3–5, summer: 6–8, autumn: 9–11, and winter: 12–2). In addition, individual additive genetics and permanent environment were included in the model as random effects. The analyzed model of the phenotypic traits was as follows:
where y is the phenotypic record of milk production, health or reproductive traits; X is a matrix associated with fixed effects; b is a fixed vector including HYS, CY, CS, and/or parity; is a matrix associated with the individual additive genetic effects; a is an additive genetic effect and A is the pedigree-based relationships; is a matrix related to the animals’ permanent environmental effects of individual animal ; and e is the residual error and I is the identity matrices. The , , and represent the additive genetic, permanent environmental, and residual error variances, respectively. Heritability calculations for each trait were performed using the following formula: . The reliability of EBV for each trait was calculated using the following formula: . EBV reliabilities were used to calculate dEBVs using the method described by Garrick et al. [46]. The dEBVs were used as pseudo-phenotypes for genome-wide association analysis.
2.3. Genotyping and Quality Control
Genomic DNA was isolated from whole blood samples using the TIANamp Blood Genomic DNA Kit (TIANGEN, Beijing, China) following the manufacturer’s instructions. All cows were genotyped using whole-genome sequencing at the 10× depth on the Illumina HiSeq 2500 platform. SNP calling was performed using the Genome Analysis Toolkit v4.2 (GATK) [47] with the default parameters. The Hereford cattle genome (assembly version: ARS-UCD2.0) was used as the reference genome. Next, SNP imputation was performed using Beagle ver5.4 [48] software, with a multi-breed cattle reference panel with 61.8 million SNPs as the reference [49]. The Beagle R-squared value was more than 0.8. Subsequently, all imputed SNPs for quality control (QC) were performed using PLINK v1.9 [50] with the following criteria: (1) individuals with a call rate ≥ 97%; (2) SNP call rate ≥ 95%; (3) minor allele frequency (MAF) ≥ 0.05; (4) Hardy–Weinberg equilibrium (HWE) p-value ≥ 10−6; and (5) SNP with unknown Bos taurus chromosomes (BTA) were excluded. After QC, 380 dairy cows and 1,030,098 SNPs successfully passed QC and were used for further analyses.
2.4. Estimation of Population Structure and Linkage Disequilibrium
To explore the population structure of the Chinese Holstein cattle used in this study, principal component analysis (PCA) and LD analyses were performed. PLINK v1.9 [50] was used to conduct PCA in the studied populations. PopLDdecay ver3.43 [51] was used to investigate the LD decay distance across the cattle genomes.
2.5. GWAS Analysis
The GWAS for each trait was performed using the fixed and random model circulating probability unification (FarmCPU) method implemented in the rMVP package [52]. The kinship matrix (K) was included in the model to control for confounding effects due to the shared ancestry. In addition to the kinship matrix, the first four principal components were included in the model to minimize the potential for spurious associations due to population stratification. The fixed-effects model is as follows:
where y is the individual’s dEBVs; X is the matrix of fixed effect for the four PCs; is the genotyped matrix of t pseudo quantitative traits nucleotides (QTNs), initiated as an empty set; and are the corresponding effects of X and , respectively; is the genotype of the j marker; is the corresponding effect; e is the residual effect . The random-effects model is as follows:
where y and e stay the same as in the fixed effect model; u is the genetic effect of the individual and u~N (0, K), in which K is the kinship matrix derived from the pseudo-QTNs. The Bonferroni correction was used to control for false positives resulting from multiple comparisons. The significance threshold was defined as 0.05/N, where N is the number of SNPs tested (n = 1,030,098). The genomic inflation factor λ was calculated by using the GWAS results.
2.6. Functional Annotation for GWAS Signals
SNP position information from the WGS data was based on Bos taurus UCD version 2.0. The ARS-UCD2.0 bovine reference genome was downloaded from the NCBI Genome website (https://www.ncbi.nlm.nih.gov/datasets/genome/ (accessed on 1 June 2025)). Considering that 50 Kb is the decay distance of LD analysis, a window size of 50 Kb was used to define the boundary range upstream and downstream of the GWAS signals. Candidate genes associated with GWAS signals were extracted from the genome gff3 files using bedtools ver.2.31.0 software [53]. KOBAS [54] was used for Gene Ontology (GO) and Kyoto Encyclopedia of Genes and Genomes (KEGG) enrichment analyses of candidate genes identified by GWAS.
2.7. Haplotype Association Analysis
This study employed haplotype association analysis to identify QTLs associated with specific phenotypic traits. These GWAS signals were chosen from a 50 Kb window around potential genomic hotspots and were used to construct haplotype blocks. The geneHapR [55] package was used for haplotype identification, statistics, phenotype association, and result visualization analysis. Genomic regions containing haplotype blocks related to phenotypic traits (p < 0.05) were identified as candidate QTLs.
2.8. Fine-Mapping Analysis
A fine-mapping procedure using a Bayesian approach was used to identify potential candidate genes and their causal loci. This method was performed by using the BFMAP v.1 software [43], which included three steps: forward selection to add independent signals in the additive Bayesian model, repositioning signals, and generating credible variant sets for each signal. The causality of SNP loci was assessed by computing the p-value of causality for independent association signals within candidate QTL regions and the posterior probability of causality (PPC) for each variant. More information about the BFMAP algorithm and its procedure can be found on the GitHub website (https://github.com/jiang18/bfmap (accessed on 1 June 2025)). The p-value < 0.0001 and PPC > 0.5 were defined as the threshold for selecting the causal loci.
3. Results
3.1. Descriptive Statistics
In this study, Table 1 presents the descriptive statistical results for the milk production, health, and reproductive traits in Chinese Holstein cattle. Overall, the phenotypic values of each trait were normally distributed (Figure S1). The cows in the present study had a higher 305-day milk yield (9754.66 ± 2733.97 kg) than that reported for German Holstein cattle (9690 ± 1580.00 kg) [56] and Xinjiang Brown cattle (4126.49 ± 1405.71 kg) [57]. The fat and protein percentages in the present study were 4.31% and 3.33%, respectively, which are similar to those of Brazilian Holstein [58], New Zealand cows [59], and Thai dairy cattle [60] breeds. The peak milk yield during the total lactation period was 45.02 ± 14.33 kg. The mean PD was 88.38 days, with a standard deviation of 55.90 days. Heritabilities were moderate for most milk production traits, except for FP, ranging from 0.12 to 0.52, which is similar to the findings of other studies on dairy and beef cattle [61,62,63].

Table 1.
Statistical description of study traits in Chinese Holstein cattle population.
SCS is known to be an indicator for predicting udder health, and a smaller SCS value indicates a lower risk of mastitis [64]. In our population, the mean SCS value was 2.92, with a standard deviation of 0.01 and heritability of 0.14.
Because most reproductive traits are difficult to measure and vary across environmental conditions, only CI was selected in this study. The average value for this trait was 413.86 days, with a standard deviation of 99.43 days, indicating moderate variability. A low heritability (0.07) for CI was found, which is consistent with the findings of other studies on dairy cattle [65,66,67].
3.2. Population Stratification and LD Decay Analysis
Principal component analysis was used to explore the population structure of the dairy cattle population. The results showed that our population could be divided into four groups. The plot of the eigenvalues demonstrated that the first two PCs explained 28.3% of the total variability (Figure 1A). Furthermore, the square of the correlation coefficient between markers at the two loci (r2) was used to estimate the LD. As expected, the r2 value in LD tended to decrease with increasing marker distance between pairwise SNPs, with a rapidly declining trend observed over the first 50 Kb. In the Holstein cattle population under investigation, LD decayed to an r2 value of 0.2 at approximately 50 Kb in the studied population (Figure 1B).
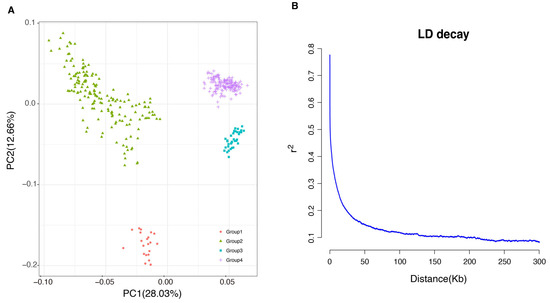
Figure 1.
Analysis of population structure in Chinese Holstein cattle. (A) Principal component analysis (PCA) plot of the samples. (B) Linkage disequilibrium (LD) decay plot.
3.3. GWAS for Milk Production Traits
The GWAS of milk production traits revealed 71 significant SNPs distributed across 20 chromosomes (Table 2; Figure S2). Among them, 9, 12, 8, 32, and 11 GWAS signals were detected for MY305, FP, PP, PM, and PD traits, respectively. These GWAS signals were mainly located on BTA6, BTA21, and BTA22. In total, 49 candidate genes were annotated with these signals based on the bovine reference genome (version: ARS-UCD2.0) gff3. In total, 36 significant SNPs were identified in 27 candidate genes. GO enrichment analysis revealed that the majority of candidate genes were enriched in the integral component of the membrane, nucleoplasm, and plasma membranes (Figure S3). KEGG enrichment analysis showed that two genes, LMAN1L and UBE2D1, were enriched in the protein processing in the endoplasmic reticulum pathway.
Table 2.
GWAS signals for milk production traits in the Chinese Holstein cattle.
To further detect QTLs associated with milk production traits, we used a 50 Kb window around the potential genomic hotspot to determine the LD relationships (Figure 2). Two identified SNPs (5_63598729_G_A and 5_63599285_G_T) for FP traits were located on BTA5 at 63 Mb in the ANKS1B gene, and within the detected window from 63.579 to 63.623 Mb, three blocks (Table S1) were recognized (Figure 2A). We noted that the two identified SNPs (5_63598729_G_A and 5_63599285_G_T) were located on FP_QTL3 block, which harbors 18 SNPs, but no significant haplotypes were observed (Figure 2B). For PM traits, we identified five blocks (Table S2). Importantly, four identified SNPs, including 22_43984285_G_T, 22_43988976_G_A, 22_43989144_G_A, and 22_43990890_G_A, were located on the PM_QTL4 block in the IL17RD gene. This block spanned 14.102 Kb and involved eight SNP loci (Figure 2C). Interestingly, the haplotype association analysis revealed that the H001 (TTGGGTGA) genotype in PM_QTL4 was significantly (p < 0.001) associated with PM traits in cows (Figure 2D), indicating that this haplotype was the dominant genotype affecting PM in dairy cows. Furthermore, four blocks (Table S3) were found for the PD traits, and two identified SNPs (6_92530313_G_A and 6_92534492_G_A) were harbored in PD_QTL2 block (Figure 2E). This region, spanning 4.18 Kb, consisted of only two SNPs and was significantly (p < 0.05) associated with PD traits (Figure 2F). Notably, cows with the H001 (GG) haplotype had a lower EBV value of PD than those with the H002 (AA) haplotype, indicating that the H001 haplotype is the dominant genotype for selecting PD in dairy cows. These results suggest that the six SNP loci, including 22_43984285_G_T, 22_43988976_G_A, 22_43989144_G_A, 22_43990890_G_A, 6_92530313_G_A and 6_92534492_G_A, can be candidate markers associated with milk production traits in cattle.
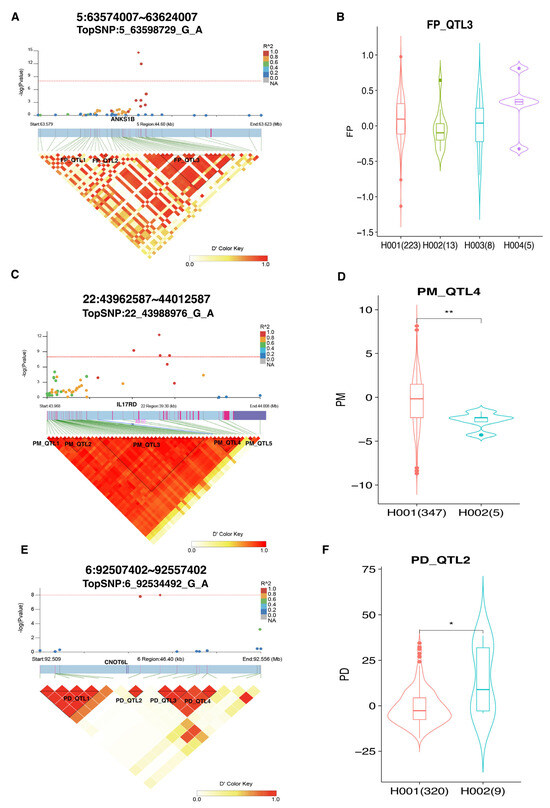
Figure 2.
LD analysis of TopSNP in GWAS loci related to milk production traits. (A) LD and GWAS analyses displaying the relationship between TopSNP 5_63598729_G_A and FP traits. (B) Boxplot showing the difference in FP EBV between different haplotypes in FP-QTL3. (C) LD and GWAS analyses displaying the relationship between TopSNP 22_43988976_G_A and PM traits. (D) Boxplot showing the difference in PM EBV between different haplotypes in PM-QTL4. (E) LD and GWAS analyses displaying the relationship between TopSNP 6_92534492_G_A and PD traits. (F) Boxplot showing the difference in PD EBV between different haplotypes in PD-QTL2. * indicates p < 0.05; ** indicates p < 0.01.
3.4. GWAS for Health Traits
A single-trait GWAS was conducted for SCS traits, which led to the identification of 10 significant SNPs across eight chromosomes (Table 3; Figure S4). Eight candidate genes were annotated for these significant SNPs, including AOC1, GK2, LINGO2, EPHA7, C15H11orf87, ZNF330, PACS2, and BRSK2. Furthermore, the majority of identified SNPs were found to be clustered into BTA4, and we observed that 13 blocks (Table S4) were found in the detected window from 113.465 to 113.511 Mb (Figure 3A). Two identified SNPs (4_113489752_G_A and 4_113489803_G_A) were located in the SCS_QTL5 block. This region, spanning 3.075 Kb, consisted of 20 SNPs and was significantly (p < 0.05) associated with SCS (Figure 3B). Notably, cows with H002 (AGGGCGGGATGGAACGTTGC) in SCS_QTL5 exhibited a significantly (p < 0.05) higher SCS EBV than those with other haplotypes, indicating that this haplotype may have influenced mastitis in cows. These results suggest that both 4_113489752_G_A and 4_113489803_G_A are candidate markers that affect the health traits in cattle.
Table 3.
GWAS signals for health trait in the Chinese Holstein cattle.
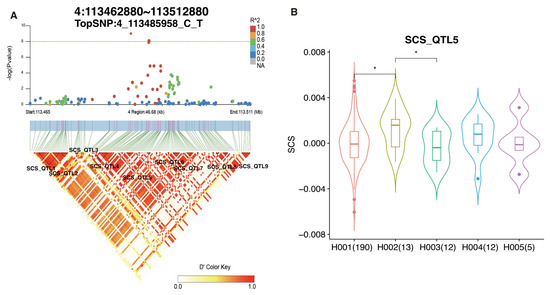
Figure 3.
LD analysis of TopSNP in GWAS loci related to health traits. (A) LD and GWAS analyses displaying the relationship between TopSNP 4_113485958_C_T and SCS traits. (B) Boxplot showing the difference in SCS EBV between different haplotypes in SCS_QTL5. * indicates p < 0.05.
3.5. GWAS for Reproductive Traits
The GWAS of CI revealed 10 significant SNPs distributed across seven chromosomes (Table 4; Figure S5). Seven candidate genes were annotated: EFNA3, MAML1, TLE3, SFMBT2, ADCY8, CDH13, and PHKA1. We observed that the majority of identified SNPs were clustered into BTA10 and that five blocks (Table S5) were found in the detected window from 17.158 to 17.197 Mb (Figure 4A). Notably, the four identified SNPs were located in two distinct blocks (Figure 4A). Two identified SNPs (10_17178126_G_A and 10_17181283_C_T) were harbored in the CI_QTL4 block, which spanned 6.408 Kb and involved 33 SNPs. The other two identified SNPs (10_17185002_G_A and 10_17185230_G_A) were located in the CI_QTL5 block, spanning 13.319 Kb and covering 35 SNPs. The haplotype association analysis revealed that cows with H001 and H002 haplotypes had a higher CI EBV than those with H003; however, no significant difference (p > 0.05) was observed (Figure 4B).
Table 4.
GWAS signals for reproductive trait in the Chinese Holstein cattle.
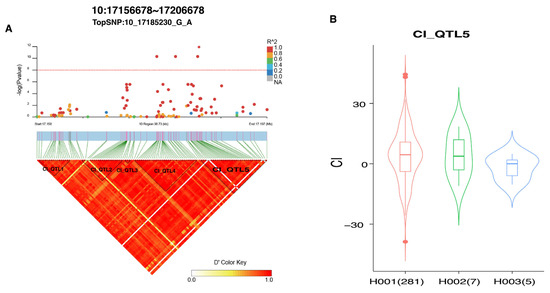
Figure 4.
LD analysis of TopSNP in GWAS loci related to reproductive traits. (A) LD and GWAS analyses displaying the relationship between TopSNP 10_17185230_G_A and CI traits. (B) Boxplot showing the difference in CI EBV between different haplotypes in CI_QTL5.
3.6. Fine-Mapping Analyses
To detect the causal loci associated with phenotypic traits, loci from topSNP and its surrounding 1 Mb were selected and used for fine-mapping analysis. The PPC values for individual variants and genes were calculated and used to identify potential causal loci (Table 5). The results showed that three SNPs, including 6_92530313_G_A (PPC = 0.885), 10_17185230_G_A (PPC = 0.979), and 10_17209112_T_G (PPC = 0.963), were successfully fine-mapped for PD and CI traits, respectively. Among them, the SNP 10_17185230_G_A was the topSNP and had the highest PPC value. The regional association plot with the LD heatmap for CNOT6L and LOC132346336 genes is shown in Figure S6A,B, respectively. These results suggest that three SNPs were causal loci affecting PD or CI traits.
Table 5.
List of potential causal loci associated with milk production, health, and reproductive traits in Chinese Holstein cattle.
4. Discussion
In the present study, we performed a powerful GWAS analysis of milk production, health, and reproductive traits in Chinese Holstein cattle. Both haplotype association and Bayesian fine-mapping approaches were used to further examine the GWAS signals to identify potential candidate genes and causal loci. Finally, we present a list of candidate genes or loci involved in cattle health and production that can be readily explored in future functional-validation studies.
4.1. Milk Production Traits
In our GWAS, 71 SNPs were associated with the milk production traits. A total of 49 genes were annotated in these signals. Several genes, including ANKS1B [68], TSPAN32 [69], IL1RAPL2 [70], and TBC1D1 [71], have been associated with milk production traits in dairy cows. In addition, the SIM1 gene is known to be associated with human obesity and obesity-related traits [72], suggesting that SIM1 may be a candidate gene affecting the FP trait. The ARAP2 gene has been associated with fatty acid composition in sheep [73].
We also focused on several QTLs related to FP, PM, and PD, which were mapped to BTA5, BTA22, and BTA6, respectively. For the FP trait, we observed one QTL consisting of two identified SNPs located within the ANKS1B gene, spanning 44.60 Kb. Evidence has demonstrated that ANKS1B is a candidate gene affecting milk composition traits [68], emphasizing the presence of six QTLs that play a role in the milk C14 index trait. Importantly, our result also supports ANKS1B as a candidate gene affecting FP.
We identified one noteworthy QTL on BTA22 that was associated with PM in this study. This QTL contained four identified SNPs (22_43984285_G_T, 22_43988976_G_A, 22_43989144_G_A, and 22_43990890_G_A) and spanned 14.102 Kb, involving 8 SNP loci. Haplotype association analysis also supported the association of these identified SNPs with PM traits. Notably, this QTL was mapped to the IL17RD gene, which encodes a component of the interleukin-17 receptor signaling complex. The IL17RD is a single-pass transmembrane protein that has been implicated in the regulation of various signaling pathways, receptor tyrosine kinase signaling cascades, and proinflammatory signaling pathways including Interleukin-17A (IL17A), Toll-like receptors (TLR) and Interleukin-1α (IL1α) in vertebrate species [74]. Several studies have demonstrated that IL17A is associated with milk production traits and somatic cell scores in dairy cows [75,76]. Investigation revealed that IL-17A, known for its essential role in mucosal immunity against a variety of extracellular and some intracellular pathogens, also plays a part in protecting the mammary gland, which is a non-mucosal tissue with a secretory epithelium [77,78]. The results outlined in the preceding hypothesis indicate that IL17RD is crucial in the generation of peak milk yield.
Furthermore, we found that one QTL region consisting of two identified SNPs (6_92530313_G_A and 6_92534492_G_A) was associated with PD in dairy cows. More importantly, haplotype association analysis also supported this point, while fine-mapping analysis confirmed that the SNP 6_92530313_G_A could be defined as causal loci affecting PD traits. For this QTL, we observed that CNOT6L was a neighboring gene. Evidence has shown that CNOT6L plays a vital role in the positive regulation of cell proliferation [79]. It is well known that days to peak milk yield (PD) refers to the day when the peak milk yield occurs after calving [80]. Mammary epithelial cells are responsible for milk production in the bovine mammary glands. In other words, the arrival of the lactation peak day indicated a significant increase in the number of mammary epithelial cells. In this regard, we speculate that CNOT6L may be involved in the regulation of mammary epithelial cell proliferation in dairy cows, thereby affecting milk performance in dairy cows. Further functional validation is required to confirm this hypothesis. In summary, these results suggest that CNOT6L could be a candidate gene affecting PD traits in dairy cattle.
4.2. Health Trait
By annotating gene functions, eight candidate genes were annotated within the GWAS signals, including AOC1, GK2, LINGO2, EPHA7, C15H11orf87, ZNF330, PACS2, and BRSK2. Among these, the GK2 gene was reported to be associated with bovine tuberculosis susceptibility [81], and the EPHA7 gene was associated with the calf sucking reflex trait [82]. Moreover, we observed a genomic region on BTA4 consisting of three significant GWAS signals (4_113485958_C_T, 4_113489752_G_A, and 4_113489803_G_A). Haplotype association analysis further demonstrated that two identified SNPs (4_113489752_G_A and 4_113489803_G_A) were harbored in the SCS_QTL5 block and were significantly (p < 0.05) associated with SCS. The AOC1 is the neighboring gene in the QTL region. Evidence has shown that AOC1 is a copper-containing amine oxidase that plays a crucial role in immune response [83]. It is well known that the immune response is involved in the entire process of mastitis onset [84]. Therefore, identifying genes related to the immune response will help in understanding mastitis pathogenesis. Therefore, we inferred that AOC1 may play an important role in mastitis development. The detailed functions of this gene require further experimental verification.
4.3. Reproductive Trait
We identified one noteworthy candidate gene, LOC132346336, which is associated with CI traits on BTA10. This region spanned 13.319 Kb and harbored 35 SNPs in total. Two identified SNPs (10_17185002_G_A and 10_17185230_G_A) were located in this region of the genome. Notably, TopSNP 10_17185230_G_A and neighboring SNP 10_17209112_T_G were confirmed as a causal locus affecting CI traits using fine-mapping analysis. However, the potential role of this causal locus still needs further functional validation. Furthermore, LOC132346336 is an lncRNA gene, and its function remains unknown at this time. Therefore, the potential link between LOC132346336 and the calving interval still requires further verification. Nonetheless, our findings indicate that this gene is a candidate gene influencing the calving interval.
Overall, this study also has limitations, primarily due to a relatively small sample size. The reason for this is that there are only three large-scale Chinese Holstein dairy farms (herds > 100) in Hubei Province, one of which is a newly built farm, and the group’s production performance testing has only just been incorporated into the Dairy Herds Improvement project, resulting in fewer valid phenotypic data. Next, we will continue to increase the size of the study population to improve the statistical power of the population GWAS study. Nevertheless, our results are reliable because we strictly followed the GWAS analysis pipeline, and the analysis results also corroborate this. Furthermore, we believe that the validation of results for fine-mapping and haplotype analysis remains a priority, as this is necessary for the further use of these candidate variants in breeding practices.
5. Conclusions
In summary, we performed a GWAS analysis of milk production, health, and reproductive traits in dairy cows and identified some candidate variants related to these phenotypic traits. Using haplotype association analysis, we observed that some GWAS signals were affected by strong linkage disequilibrium and identified several dominant haplotypes affecting milk production and health traits of the cows. Furthermore, we identified several GWAS signals belonging to the causal variants. Our findings significantly contribute to unraveling the genetic basis of milk production, health, and reproductive traits in Holstein cattle.
Supplementary Materials
The following supporting information can be downloaded at: https://www.mdpi.com/article/10.3390/agriculture15192019/s1, Figure S1: Normal distribution analysis of phenotypic traits in dairy cows, Figure S2. GWAS analysis of milk production traits in cattle, Figure S3. GO and KEGG enrichment analysis of candidate genes, Figure S4. GWAS analysis of health traits in cattle, Figure S5. GWAS analysis of reproductive traits in cattle; Figure S6. LD and GWAS analyses displaying the relationship between TopSNP loci and PD or CI traits; Table S1: Haplotype block information on topSNP 5_63598729_G_A with 50 Kb window, Table S2. Haplotype block information on topSNP 22_43988976_G_A with 50 Kb window, Table S3. Haplotype block information on topSNP 6_92534492_G_A with 50 Kb window, Table S4. Haplotype block information on topSNP 4_113485958_C_T with 50 Kb window, Table S5. Haplotype block information on topSNP 4_113485958_C_T with 50 Kb window.
Author Contributions
Conceptualization, T.D. and H.C.; methodology, T.D., C.L. and L.C.; software, T.D. and C.L.; validation, M.X.; formal analysis, L.C.; investigation, T.D., L.C., C.L. and M.X.; resources, L.C., C.L. and M.X.; data curation, T.D., Q.L. and B.Y.; writing—original draft preparation, T.D. and L.C.; writing—review and editing, T.D. and H.C.; visualization, T.D. and Q.L.; supervision, H.C.; project administration, H.C.; funding acquisition, B.Y. and H.C. All authors have read and agreed to the published version of the manuscript.
Funding
This study was funded by the Key R&D Project of the Department of Science and Technology of Hubei Province (2023BBB058).
Institutional Review Board Statement
The animals and experimental procedures used in this study followed the guidelines of Hubei Provincial Regulation on Administration of Laboratory Animals (1 October 2005). The animal study protocol was approved by the Ethics Committee of Wuhan Polytechnic University (accession number: WPU202301004; date of approval: 18 January 2023).
Data Availability Statement
Data supporting the findings of this study are available from the corresponding author upon request. Due to confidentiality agreements with the industry partner, raw datasets are not publicly available.
Conflicts of Interest
The authors declare no conflicts of interest.
Abbreviations
| GWAS | Genome-wide association studies |
| QTL | quantitative trait loci |
| LD | linkage disequilibrium |
| PPC | posterior probabilities of causality |
| MY305 | 305-day milk yield |
| FP | fat percentage |
| PP | protein percentage |
| PM | peak milk yield |
| PD | days to peak milk yield |
| CI | calving interval |
| SCS | somatic cell score |
| EBV | estimated breeding value |
| dEBV | deregressed estimated breeding value |
| HYS | herd–year–season |
| CY | calving year |
| CS | calving season |
| GO | Gene Ontology |
| KEGG | Kyoto Encyclopedia of Genes and Genomes |
| GATK | Genome Analysis Toolkit |
| QC | quality control |
| MAF | minor allele frequency |
| HWE | Hardy–Weinberg equilibrium |
| BTA | Bos taurus chromosomes |
| PCA | principal component analysis |
References
- Li, S.; Ge, F.; Chen, L.; Liu, Y.; Chen, Y.; Ma, Y. Genome-Wide Association Analysis of Body Conformation Traits in Chinese Holstein Cattle. BMC Genom. 2024, 25, 1174. [Google Scholar] [CrossRef] [PubMed]
- Oliveira, C.P.; de Sousa, F.C.; da Silva, A.L.; Schultz, É.B.; Valderrama Londoño, R.I.; de Souza, P.A.R. Heat Stress in Dairy Cows: Impacts, Identification, and Mitigation Strategies-A Review. Animals 2025, 15, 249. [Google Scholar] [CrossRef] [PubMed]
- Summer, A.; Lora, I.; Formaggioni, P.; Gottardo, F. Impact of Heat Stress on Milk and Meat Production. Anim. Front. 2019, 9, 39–46. [Google Scholar] [CrossRef] [PubMed]
- Lemal, P.; Schroyen, M.; Gengler, N. Genetic Parameters and Relevance for Heat Stress Assessment in Dairy Cattle of 2 Udder Health Traits: Somatic Cell Score and Differential Somatic Cell Count. J. Dairy Sci. 2025, 108, 9930–9945. [Google Scholar] [CrossRef]
- Wolfenson, D.; Roth, Z. Impact of Heat Stress on Cow Reproduction and Fertility. Anim. Front. 2019, 9, 32–38. [Google Scholar] [CrossRef]
- Rejeb, M.; Sadraoui, R.; Najar, T.; M’rad, M.B. A Complex Interrelationship between Rectal Temperature and Dairy Cows’ Performance under Heat Stress Conditions. Open J. Anim. Sci. 2016, 6, 24–30. [Google Scholar] [CrossRef]
- Becker, C.A.; Collier, R.J.; Stone, A.E. Invited Review: Physiological and Behavioral Effects of Heat Stress in Dairy Cows. J. Dairy Sci. 2020, 103, 6751–6770. [Google Scholar] [CrossRef]
- Bernabucci, U.; Lacetera, N.; Baumgard, L.H.; Rhoads, R.P.; Ronchi, B.; Nardone, A. Metabolic and Hormonal Acclimation to Heat Stress in Domesticated Ruminants. Anim. Int. J. Anim. Biosci. 2010, 4, 1167–1183. [Google Scholar] [CrossRef]
- Schneider, H.; Segelke, D.; Tetens, J.; Thaller, G.; Bennewitz, J. A Genomic Assessment of the Correlation Between Milk Production Traits and Claw and Udder Health Traits in Holstein Dairy Cattle. J. Dairy Sci. 2023, 106, 1190–1205. [Google Scholar] [CrossRef]
- Teng, J.; Wang, D.; Zhao, C.; Zhang, X.; Chen, Z.; Liu, J.; Sun, D.; Tang, H.; Wang, W.; Li, J.; et al. Longitudinal Genome-Wide Association Studies of Milk Production Traits in Holstein Cattle Using Whole-Genome Sequence Data Imputed from Medium-Density Chip Data. J. Dairy Sci. 2023, 106, 2535–2550. [Google Scholar] [CrossRef]
- Križanac, A.-M.; Reimer, C.; Heise, J.; Liu, Z.; Pryce, J.E.; Bennewitz, J.; Thaller, G.; Falker-Gieske, C.; Tetens, J. Sequence-Based GWAS in 180,000 German Holstein Cattle Reveals New Candidate Variants for Milk Production Traits. Genet. Sel. Evol. GSE 2025, 57, 3. [Google Scholar] [CrossRef]
- Nguyen, T.T.T.; Bowman, P.J.; Haile-Mariam, M.; Nieuwhof, G.J.; Hayes, B.J.; Pryce, J.E. Short Communication: Implementation of a Breeding Value for Heat Tolerance in Australian Dairy Cattle. J. Dairy Sci. 2017, 100, 7362–7367. [Google Scholar] [CrossRef] [PubMed]
- Manzanilla-Pech, C.I.V.; L Vendahl, P.; Mansan Gordo, D.; Difford, G.F.; Pryce, J.E.; Schenkel, F.; Wegmann, S.; Miglior, F.; Chud, T.C.; Moate, P.J.; et al. Breeding for Reduced Methane Emission and Feed-Efficient Holstein Cows: An International Response. J. Dairy Sci. 2021, 104, 8983–9001. [Google Scholar] [CrossRef] [PubMed]
- Ribeiro, G.; Baldi, F.; Cesar, A.S.M.; Alexandre, P.A.; Peripolli, E.; Ferraz, J.B.S.; Fukumasu, H. Detection of Potential Functional Variants Based on Systems-Biology: The Case of Feed Efficiency in Beef Cattle. BMC Genom. 2022, 23, 774. [Google Scholar] [CrossRef] [PubMed]
- Civelek, M.; Lusis, A.J. Systems Genetics Approaches to Understand Complex Traits. Nat. Rev. Genet. 2014, 15, 34–48. [Google Scholar] [CrossRef]
- van den Berg, I.; Ho, P.N.; Nguyen, T.V.; Haile-Mariam, M.; MacLeod, I.M.; Beatson, P.R.; O’Connor, E.; Pryce, J.E. GWAS and Genomic Prediction of Milk Urea Nitrogen in Australian and New Zealand Dairy Cattle. Genet. Sel. Evol. GSE 2022, 54, 15. [Google Scholar] [CrossRef]
- Buss, C.E.; Afonso, J.; de Oliveira, P.S.N.; Petrini, J.; Tizioto, P.C.; Cesar, A.S.M.; Gustani-Buss, E.C.; Cardoso, T.F.; Rovadoski, G.A.; da Silva Diniz, W.J.; et al. Bivariate GWAS Reveals Pleiotropic Regions Among Feed Efficiency and Beef Quality-Related Traits in Nelore Cattle. Mamm. Genome 2023, 34, 90–103. [Google Scholar] [CrossRef]
- Tang, L.; Swedlund, B.; Dupont, S.; Harland, C.; Costa Monteiro Moreira, G.; Durkin, K.; Artesi, M.; Mullaart, E.; Sartelet, A.; Karim, L.; et al. GWAS Reveals Determinants of Mobilization Rate and Dynamics of an Active Endogenous Retrovirus of Cattle. Nat. Commun. 2024, 15, 2154. [Google Scholar] [CrossRef]
- Liu, J.J.; Liang, A.X.; Campanile, G.; Plastow, G.; Zhang, C.; Wang, Z.; Salzano, A.; Gasparrini, B.; Cassandro, M.; Yang, L.G. Genome-Wide Association Studies to Identify Quantitative Trait Loci Affecting Milk Production Traits in Water Buffalo. J. Dairy Sci. 2018, 101, 433–444. [Google Scholar] [CrossRef]
- El Nagar, A.G.; Salem, M.M.I.; Amin, A.M.S.; Khalil, M.H.; Ashour, A.F.; Hegazy, M.M.; Abdel-Shafy, H. A Single-Step Genome-Wide Association Study for Semen Traits of Egyptian Buffalo Bulls. Animals 2023, 13, 3758. [Google Scholar] [CrossRef]
- Deng, T.; Ma, X.; Duan, A.; Lu, X.; Abdel-Shafy, H. Genome-Wide Copy Number Variant Analysis Reveals Candidate Genes Associated with Milk Production Traits in Water Buffalo (Bubalus bubalis). J. Dairy Sci. 2024, 107, 7022–7037. [Google Scholar] [CrossRef]
- Hammons, V.; Ribeiro, L.; Munyard, K.; Sadeghi, R.; Miller, D.; Antczak, D.; Brooks, S.A. GWAS Identifies a Region Containing the SALL1 Gene in Variation of Pigmentation Intensity Within the Chestnut Coat Color of Horses. J. Hered. 2021, 112, 443–446. [Google Scholar] [CrossRef]
- Dias De Castro, L.L.; Oliveira Júnior, G.A.; Perez, B.C.; Carvalho, M.E.; De Souza Ramos, E.A.; Ferraz, J.B.S.; Molento, M.B. Genome-Wide Association Study in Thoroughbred Horses Naturally Infected with Cyathostomins. Anim. Biotechnol. 2023, 34, 2467–2479. [Google Scholar] [CrossRef] [PubMed]
- Pozharskiy, A.; Abdrakhmanova, A.; Beishova, I.; Shamshidin, A.; Nametov, A.; Ulyanova, T.; Bekova, G.; Kikebayev, N.; Kovalchuk, A.; Ulyanov, V.; et al. Genetic Structure and Genome-Wide Association Study of the Traditional Kazakh Horses. Anim. Int. J. Anim. Biosci. 2023, 17, 100926. [Google Scholar] [CrossRef] [PubMed]
- Jiang, J.; Cao, Y.; Shan, H.; Wu, J.; Song, X.; Jiang, Y. The GWAS Analysis of Body Size and Population Verification of Related SNPs in Hu Sheep. Front. Genet. 2021, 12, 642552. [Google Scholar] [CrossRef] [PubMed]
- Li, C.; Li, J.; Wang, H.; Zhang, R.; An, X.; Yuan, C.; Guo, T.; Yue, Y. Genomic Selection for Live Weight in the 14th Month in Alpine Merino Sheep Combining GWAS Information. Animals 2023, 13, 3516. [Google Scholar] [CrossRef]
- Liu, D.; Li, X.; Wang, L.; Pei, Q.; Zhao, J.; Sun, D.; Ren, Q.; Tian, D.; Han, B.; Jiang, H.; et al. Genome-Wide Association Studies of Body Size Traits in Tibetan Sheep. BMC Genom. 2024, 25, 739. [Google Scholar] [CrossRef]
- Mahmoudi, P.; Rashidi, A.; Nazari-Ghadikolaei, A.; Rostamzadeh, J.; Razmkabir, M.; Huson, H.J. Genome-Wide Association Study Reveals Novel Candidate Genes for Litter Size in Markhoz Goats. Front. Vet. Sci. 2022, 9, 1045589. [Google Scholar] [CrossRef]
- Selionova, M.; Aibazov, M.; Sermyagin, A.; Belous, A.; Deniskova, T.; Mamontova, T.; Zharkova, E.; Zinovieva, N. Genome-Wide Association and Pathway Analysis of Carcass and Meat Quality Traits in Karachai Young Goats. Animals 2023, 13, 3237. [Google Scholar] [CrossRef]
- Selionova, M.; Trukhachev, V.; Aibazov, M.; Sermyagin, A.; Belous, A.; Gladkikh, M.; Zinovieva, N. Genome-Wide Association Study of Milk Composition in Karachai Goats. Animals 2024, 14, 327. [Google Scholar] [CrossRef]
- Ruan, D.; Zhuang, Z.; Ding, R.; Qiu, Y.; Zhou, S.; Wu, J.; Xu, C.; Hong, L.; Huang, S.; Zheng, E.; et al. Weighted Single-Step GWAS Identified Candidate Genes Associated with Growth Traits in a Duroc Pig Population. Genes 2021, 12, 117. [Google Scholar] [CrossRef]
- Wang, H.; Wang, X.; Li, M.; Sun, H.; Chen, Q.; Yan, D.; Dong, X.; Pan, Y.; Lu, S. Genome-Wide Association Study of Growth Traits in a Four-Way Crossbred Pig Population. Genes 2022, 13, 1990. [Google Scholar] [CrossRef] [PubMed]
- Roth, K.; Pröll-Cornelissen, M.J.; Henne, H.; Appel, A.K.; Schellander, K.; Tholen, E.; Große-Brinkhaus, C. Multivariate Genome-Wide Associations for Immune Traits in Two Maternal Pig Lines. BMC Genom. 2023, 24, 492. [Google Scholar] [CrossRef] [PubMed]
- Wu, C.; Dong, L.; Gan, X.; Gan, F.; Xu, W.; Lu, L. Genome-Wide Association Studies and Haplotype Sharing Analysis Targeting the Growth Traits in Yandang Partridge Chickens. Anim. Biotechnol. 2023, 34, 1943–1949. [Google Scholar] [CrossRef] [PubMed]
- Cai, K.; Liu, R.; Wei, L.; Wang, X.; Cui, H.; Luo, N.; Wen, J.; Chang, Y.; Zhao, G. Genome-Wide Association Analysis Identify Candidate Genes for Feed Efficiency and Growth Traits in Wenchang Chickens. BMC Genom. 2024, 25, 645. [Google Scholar] [CrossRef]
- Hormozdiari, F.; Kichaev, G.; Yang, W.-Y.; Pasaniuc, B.; Eskin, E. Identification of Causal Genes for Complex Traits. Bioinformatics 2015, 31, i206–i213. [Google Scholar] [CrossRef]
- Farh, K.K.-H.; Marson, A.; Zhu, J.; Kleinewietfeld, M.; Housley, W.J.; Beik, S.; Shoresh, N.; Whitton, H.; Ryan, R.J.H.; Shishkin, A.A.; et al. Genetic and Epigenetic Fine Mapping of Causal Autoimmune Disease Variants. Nature 2015, 518, 337–343. [Google Scholar] [CrossRef]
- Huang, H.; Fang, M.; Jostins, L.; Umićević Mirkov, M.; Boucher, G.; Anderson, C.A.; Andersen, V.; Cleynen, I.; Cortes, A.; Crins, F.; et al. Fine-Mapping Inflammatory Bowel Disease Loci to Single-Variant Resolution. Nature 2017, 547, 173–178. [Google Scholar] [CrossRef]
- Kichaev, G.; Yang, W.-Y.; Lindstrom, S.; Hormozdiari, F.; Eskin, E.; Price, A.L.; Kraft, P.; Pasaniuc, B. Integrating Functional Data to Prioritize Causal Variants in Statistical Fine-Mapping Studies. PLoS Genet. 2014, 10, e1004722. [Google Scholar] [CrossRef]
- Chen, W.; McDonnell, S.K.; Thibodeau, S.N.; Tillmans, L.S.; Schaid, D.J. Incorporating Functional Annotations for Fine-Mapping Causal Variants in a Bayesian Framework Using Summary Statistics. Genetics 2016, 204, 933–958. [Google Scholar] [CrossRef]
- Yang, Z.; Wang, C.; Liu, L.; Khan, A.; Lee, A.; Vardarajan, B.; Mayeux, R.; Kiryluk, K.; Ionita-Laza, I. CARMA is a New Bayesian Model for Fine-Mapping in Genome-Wide Association Meta-Analyses. Nat. Genet. 2023, 55, 1057–1065. [Google Scholar] [CrossRef] [PubMed]
- Benner, C.; Spencer, C.C.A.; Havulinna, A.S.; Salomaa, V.; Ripatti, S.; Pirinen, M. FINEMAP: Efficient Variable Selection Using Summary Data from Genome-Wide Association Studies. Bioinformatics 2016, 32, 1493–1501. [Google Scholar] [CrossRef]
- Jiang, J.; Cole, J.B.; Freebern, E.; Da, Y.; VanRaden, P.M.; Ma, L. Functional Annotation and Bayesian Fine-Mapping Reveals Candidate Genes for Important Agronomic Traits in Holstein Bulls. Commun. Biol. 2019, 2, 212. [Google Scholar] [CrossRef]
- Finucane, H.K.; Bulik-Sullivan, B.; Gusev, A.; Trynka, G.; Reshef, Y.; Loh, P.-R.; Anttila, V.; Xu, H.; Zang, C.; Farh, K.; et al. Partitioning Heritability by Functional Annotation Using Genome-Wide Association Summary Statistics. Nat. Genet. 2015, 47, 1228–1235. [Google Scholar] [CrossRef] [PubMed]
- Mei, Q.; Fu, C.; Li, J.; Zhao, S.; Xiang, T. blupADC: An R Package and Shiny Toolkit for Comprehensive Genetic Data Analysis in Animal and Plant Breeding. bioRxiv 2021. [Google Scholar] [CrossRef]
- Garrick, D.J.; Taylor, J.F.; Fernando, R.L. Deregressing Estimated Breeding Values and Weighting Information for Genomic Regression Analyses. Genet. Sel. Evol. GSE 2009, 41, 55. [Google Scholar] [CrossRef]
- McKenna, A.; Hanna, M.; Banks, E.; Sivachenko, A.; Cibulskis, K.; Kernytsky, A.; Garimella, K.; Altshuler, D.; Gabriel, S.; Daly, M.; et al. The Genome Analysis Toolkit: A MapReduce Framework for Analyzing Next-Generation DNA Sequencing Data. Genome Res. 2010, 20, 1297–1303. [Google Scholar] [CrossRef]
- Browning, B.L.; Tian, X.; Zhou, Y.; Browning, S.R. Fast Two-Stage Phasing of Large-Scale Sequence Data. Am. J. Hum. Genet. 2021, 108, 1880–1890. [Google Scholar] [CrossRef]
- Zhang, Z.; Wang, A.; Hu, H.; Wang, L.; Gong, M.; Yang, Q.; Liu, A.; Li, R.; Zhang, H.; Zhang, Q.; et al. The Efficient Phasing and Imputation Pipeline of low-Coverage Whole Genome Sequencing Data Using a High-Quality and Publicly Available Reference Panel in Cattle. Anim. Res. One Health 2023, 1, 4–16. [Google Scholar] [CrossRef]
- Purcell, S.; Neale, B.; Todd-Brown, K.; Thomas, L.; Ferreira, M.A.R.; Bender, D.; Maller, J.; Sklar, P.; de Bakker, P.I.W.; Daly, M.J.; et al. PLINK: A Tool Set for Whole-Genome Association and Population-Based Linkage Analyses. Am. J. Hum. Genet. 2007, 81, 559–575. [Google Scholar] [CrossRef]
- Zhang, C.; Dong, S.-S.; Xu, J.-Y.; He, W.-M.; Yang, T.-L. PopLDdecay: A Fast and Effective Tool for Linkage Disequilibrium Decay Analysis Based on Variant Call Format Files. Bioinformatics 2018, 35, 1786–1788. [Google Scholar] [CrossRef]
- Yin, L.; Zhang, H.; Tang, Z.; Xu, J.; Yin, D.; Zhang, Z.; Yuan, X.; Zhu, M.; Zhao, S.; Li, X.; et al. rMVP: A Memory-Efficient, Visualization-Enhanced, and Parallel-Accelerated Tool for Genome-Wide Association Study. Genom. Proteom. Bioinform. 2021, 19, 619–628. [Google Scholar] [CrossRef] [PubMed]
- Quinlan, A.R.; Hall, I.M. BEDTools: A Flexible Suite of Utilities for Comparing Genomic Features. Bioinformatics 2010, 26, 841–842. [Google Scholar] [CrossRef] [PubMed]
- Xie, C.; Mao, X.; Huang, J.; Ding, Y.; Wu, J.; Dong, S.; Kong, L.; Gao, G.; Li, C.Y.; Wei, L. KOBAS 2.0: A Web Server for Annotation and Identification of Enriched Pathways and Diseases. Nucleic Acids Res. 2011, 39, W316–W322. [Google Scholar] [CrossRef] [PubMed]
- Zhang, R.; Jia, G.; Diao, X. geneHapR: An R Package for Gene Haplotypic Statistics and Visualization. BMC Bioinform. 2023, 24, 199. [Google Scholar] [CrossRef]
- Mugambe, J.; Ahmed, R.H.; Thaller, G.; Schmidtmann, C. Impact of Inbreeding on Production, Fertility, and Health Traits in German Holstein Dairy Cattle Utilizing Various Inbreeding Estimators. J. Dairy Sci. 2024, 107, 4714–4725. [Google Scholar] [CrossRef]
- Zhou, J.; Liu, L.; Chen, C.J.; Zhang, M.; Lu, X.; Zhang, Z.; Huang, X.; Shi, Y. Genome-Wide Association Study of Milk and Reproductive Traits in Dual-Purpose Xinjiang Brown Cattle. BMC Genom. 2019, 20, 827. [Google Scholar] [CrossRef]
- Iung, L.H.S.; Petrini, J.; Ramírez-Díaz, J.; Salvian, M.; Rovadoscki, G.A.; Pilonetto, F.; Dauria, B.D.; Machado, P.F.; Coutinho, L.L.; Wiggans, G.R.; et al. Genome-Wide Association Study for Milk Production Traits in a Brazilian Holstein Population. J. Dairy Sci. 2019, 102, 5305–5314. [Google Scholar] [CrossRef]
- Jayawardana, J.M.D.R.; Lopez-Villalobos, N.; McNaughton, L.R.; Hickson, R.E. Genomic Regions Associated with Milk Composition and Fertility Traits in Spring-Calved Dairy Cows in New Zealand. Genes 2023, 14, 860. [Google Scholar] [CrossRef]
- Buaban, S.; Lengnudum, K.; Boonkum, W.; Phakdeedindan, P. Genome-Wide Association Study on Milk Production and Somatic Cell Score for Thai Dairy Cattle Using Weighted Single-Step Approach with Random Regression Test-Day Model. J. Dairy Sci. 2022, 105, 468–494. [Google Scholar] [CrossRef]
- Jayawardana, J.M.D.R.; Lopez-Villalobos, N.; McNaughton, L.R.; Hickson, R.E. Heritabilities and Genetic and Phenotypic Correlations for Milk Production and Fertility Traits of Spring-Calved Once-Daily or Twice-Daily Milking Cows in New Zealand. J. Dairy Sci. 2023, 106, 1910–1924. [Google Scholar] [CrossRef]
- Liu, D.; Xu, Z.; Zhao, W.; Wang, S.; Li, T.; Zhu, K.; Liu, G.; Zhao, X.; Wang, Q.; Pan, Y.; et al. Genetic Parameters and Genome-Wide Association for Milk Production Traits and Somatic Cell Score in Different Lactation Stages of Shanghai Holstein Population. Front. Genet. 2022, 13, 940650. [Google Scholar] [CrossRef]
- Charton, C.; Guinard-Flament, J.; Lefebvre, R.; Barbey, S.; Gallard, Y.; Boichard, D.; Larroque, H. Genetic Parameters of Milk Production Traits in Response to a Short Once-Daily Milking Period in crossbred Holstein × Normande Dairy Cows. J. Dairy Sci. 2018, 101, 2235–2247. [Google Scholar] [CrossRef]
- Fonseca, M.; Kurban, D.; Roy, J.-P.; Santschi, D.E.; Molgat, E.; Yang, D.A.; Dufour, S. Usefulness of Differential Somatic Cell Count for Udder Health Monitoring: Identifying Referential Values for Differential Somatic Cell Count in Healthy Quarters and Quarters with Subclinical Mastitis. J. Dairy Sci. 2025, 108, 3917–3928. [Google Scholar] [CrossRef] [PubMed]
- Olori, V.E.; Meuwissen, T.H.E.; Veerkamp, R.F. Calving Interval and Survival Breeding Values as Measure of Cow Fertility in a Pasture-Based Production System with Seasonal Calving. J. Dairy Sci. 2002, 85, 689–696. [Google Scholar] [CrossRef] [PubMed]
- Ali, I.; Muhammad Suhail, S.; Shafiq, M. Heritability Estimates and Genetic Correlations of Various Production and Reproductive Traits of Different Grades of Dairy Cattle Reared Under Subtropical Condition. Reprod. Domest. Anim. 2019, 54, 1026–1033. [Google Scholar] [CrossRef] [PubMed]
- Roy, I.; Rahman, M.; Karunakaran, M.; Gayari, I.; Baneh, H.; Mandal, A. Genetic Relationships Between Reproductive and Production Traits in Jersey Crossbred Cattle. Gene 2024, 894, 147982. [Google Scholar] [CrossRef]
- Buitenhuis, B.; Janss, L.L.G.; Poulsen, N.A.; Larsen, L.B.; Larsen, M.K.; Sørensen, P. Genome-Wide Association and Biological Pathway Analysis for Milk-Fat Composition in Danish Holstein and Danish Jersey Cattle. BMC Genom. 2014, 15, 1112. [Google Scholar] [CrossRef]
- Magee, D.A.; Sikora, K.M.; Berkowicz, E.W.; Berry, D.P.; Howard, D.J.; Mullen, M.P.; Evans, R.D.; Spillane, C.; MacHugh, D.E. DNA Sequence Polymorphisms in a Panel of Eight Candidate Bovine Imprinted Genes and Their Association with Performance Traits in Irish Holstein-Friesian Cattle. BMC Genet. 2010, 11, 93. [Google Scholar] [CrossRef]
- Cole, J.B.; Wiggans, G.R.; Ma, L.; Sonstegard, T.S.; Lawlor, T.J.; Crooker, B.A.; Van Tassell, C.P.; Yang, J.; Wang, S.; Matukumalli, L.K.; et al. Genome-Wide Association Analysis of Thirty One Production, Health, Reproduction and Body Conformation Traits in Contemporary U.S. Holstein Cows. BMC Genom. 2011, 12, 408. [Google Scholar] [CrossRef]
- Jiang, J.; Liu, L.; Gao, Y.; Shi, L.; Li, Y.; Liang, W.; Sun, D. Determination of Genetic Associations Between Indels in 11 Candidate Genes and Milk Composition Traits in Chinese Holstein Population. BMC Genet. 2019, 20, 48. [Google Scholar] [CrossRef]
- Hung, C.-C.C.; Luan, J.; Sims, M.; Keogh, J.M.; Hall, C.; Wareham, N.J.; O’Rahilly, S.; Farooqi, I.S. Studies of the SIM1 Gene in Relation to Human Obesity and Obesity-Related Traits. Int. J. Obes. 2007, 31, 429–434. [Google Scholar] [CrossRef]
- Revelo, H.A.; López-Alvarez, D.; Palacios, Y.A.; Vergara, O.D.; Yánez, M.B.; Ariza, M.F.; Molina, S.L.C.; Sanchez, Y.O.; Alvarez, L.Á. Genome-Wide Association Study Reveals Candidate Genes for Traits Related to Meat Quality in Colombian Creole Hair Sheep. Trop. Anim. Health Prod. 2023, 55, 357. [Google Scholar] [CrossRef]
- Pande, S.; Yang, X.; Friesel, R. Interleukin-17 receptor D (Sef) is a Multi-Functional Regulator of Cell Signaling. Cell Commun. Signal. 2021, 19, 6. [Google Scholar] [CrossRef] [PubMed]
- Usman, T.; Wang, Y.; Liu, C.; He, Y.; Wang, X.; Dong, Y.; Wu, H.; Liu, A.; Yu, Y. Novel SNPs in IL-17F and IL-17A Genes Associated with Somatic Cell Count in Chinese Holstein and Inner-Mongolia Sanhe Cattle. J. Anim. Sci. Biotechnol. 2017, 8, 5. [Google Scholar] [CrossRef] [PubMed]
- Ghulam Mohyuddin, S.; Liang, Y.; Ni, W.; Adam Idriss Arbab, A.; Zhang, H.; Li, M.; Yang, Z.; Karrow, N.A.; Mao, Y. Polymorphisms of the IL-17A Gene Influence Milk Production Traits and Somatic Cell Score in Chinese Holstein Cows. Bioengineering 2022, 9, 448. [Google Scholar] [CrossRef] [PubMed]
- Gaffen, S.L.; Moutsopoulos, N.M. Regulation of Host-Microbe Interactions at Oral Mucosal Barriers by Type 17 Immunity. Sci. Immunol. 2020, 5, eaau4594. [Google Scholar] [CrossRef]
- Porcherie, A.; Gilbert, F.B.; Germon, P.; Cunha, P.; Trotereau, A.; Rossignol, C.; Winter, N.; Berthon, P.; Rainard, P. IL-17A Is an Important Effector of the Immune Response of the Mammary Gland to Escherichia coli Infection. J. Immunol. 2016, 196, 803–812. [Google Scholar] [CrossRef]
- Mittal, S.; Aslam, A.; Doidge, R.; Medica, R.; Winkler, G.S. The Ccr4a (CNOT6) and Ccr4b (CNOT6L) Deadenylase Subunits of the Human Ccr4-Not Complex Contribute to the Prevention of Cell Death and Senescence. Mol. Biol. Cell 2011, 22, 748–758. [Google Scholar] [CrossRef]
- Pangmao, S.; Thomson, P.C.; Khatkar, M.S. Genetic Parameters of Milk and Lactation Curve Traits of Dairy Cattle from Research Farms in Thailand. Anim. Biosci. 2022, 35, 1499–1511. [Google Scholar] [CrossRef]
- Ring, S.C.; Purfield, D.C.; Good, M.; Breslin, P.; Ryan, E.; Blom, A.; Evans, R.D.; Doherty, M.L.; Bradley, D.G.; Berry, D.P. Variance Components for Bovine Tuberculosis Infection and Multi-Breed Genome-Wide Association Analysis Using Imputed Whole Genome Sequence Data. PLoS ONE 2019, 14, e0212067. [Google Scholar] [CrossRef] [PubMed]
- Dreher, C.; Wellmann, R.; Stratz, P.; Schmid, M.; Preuß, S.; Hamann, H.; Bennewitz, J. Genomic Analysis of Perinatal Sucking Reflex in German Brown Swiss Calves. J. Dairy Sci. 2019, 102, 6296–6305. [Google Scholar] [CrossRef]
- Ding, Y.; Feng, Y.; Huang, Z.; Zhang, Y.; Li, X.; Liu, R.; Li, H.; Wang, T.; Ding, Y.; Jia, Z.; et al. SOX15 Transcriptionally Increases the Function of AOC1 to Modulate Ferroptosis and Progression in Prostate Cancer. Cell Death Dis. 2022, 13, 673. [Google Scholar] [CrossRef] [PubMed]
- Zemanova, M.; Langova, L.; Novotná, I.; Dvorakova, P.; Vrtkova, I.; Havlicek, Z. Immune Mechanisms, Resistance Genes, and Their Roles in the Prevention of Mastitis in Dairy Cows. Arch. Anim. Breed. 2022, 65, 371–384. [Google Scholar] [CrossRef] [PubMed]
Disclaimer/Publisher’s Note: The statements, opinions and data contained in all publications are solely those of the individual author(s) and contributor(s) and not of MDPI and/or the editor(s). MDPI and/or the editor(s) disclaim responsibility for any injury to people or property resulting from any ideas, methods, instructions or products referred to in the content. |
© 2025 by the authors. Licensee MDPI, Basel, Switzerland. This article is an open access article distributed under the terms and conditions of the Creative Commons Attribution (CC BY) license (https://creativecommons.org/licenses/by/4.0/).