Article

Development and Properties of Starches in Vitreous and Floury Endosperm of Maize

1
Key Laboratory of Crop Genetics and Physiology of Jiangsu Province/Joint International Research Laboratory of Agriculture & Agri-Product Safety of the Ministry of Education, Yangzhou University, Yangzhou 225009, China
2
Co-Innovation Center for Modern Production Technology of Grain Crops of Jiangsu Province/Jiangsu Key Laboratory of Crop Genomics and Molecular Breeding, Yangzhou University, Yangzhou 225009, China
*
Author to whom correspondence should be addressed.
Agriculture 2025, 15(18), 1978; https://doi.org/10.3390/agriculture15181978
Submission received: 13 August 2025 / Revised: 17 September 2025 / Accepted: 18 September 2025 / Published: 19 September 2025

Abstract

Starches from vitreous and floury endosperm in mature maize kernels exhibit significantly different properties, yet the developmental basis for the differences remains unclear. In this research, inner endosperm (IE) and outer endosperm (OE) regions, which develop into floury and vitreous endosperm, respectively, were separated from developing maize kernels. Their starch development and properties were investigated using morphological observation, physicochemical characterization, transcriptome analysis, and biochemical assays. The IE contained small, spherical starch granules with loose arrangement, ultimately forming floury endosperm, whereas the OE displayed large, polygonal starch granules packed tightly, contributing to vitreous endosperm formation. The OE exhibited a higher starch filling degree compared to the IE. Throughout endosperm development, amylose content progressively increased in both regions, but was consistently higher in OE starch than in IE starch. The relative crystallinity and lamellar peak intensity of starch decreased gradually during endosperm development; however, at later stages, both parameters were higher in IE starch than in OE starch. Transcriptome analysis revealed that processes such as anaerobic respiration, glycolysis, and response to hypoxia were more enriched in IE compared to OE. Nearly all genes associated with glycolysis and ethanol fermentation pathways were upregulated in IE. Although no significant difference was observed in the activity of granule-bound starch synthase I between IE and OE, the activity of pyruvate orthophosphate dikinase was higher in OE than in IE. These findings suggest that the insufficient nutrient supply and pronounced hypoxic conditions in the IE reduced the availability of carbon substrates for starch synthesis, thereby impairing starch development and accumulation. In contrast, the larger granule size of OE starch facilitates higher amylose accumulation, leading to distinct physicochemical properties between IE and OE starches.

1. Introduction

Maize, a widely cultivated crop, has numerous applications in feed, food, and industrial chemical products [1,2]. The maize kernel is primarily composed of the pericarp, embryo, and endosperm. The economic and nutritional value of the kernel is largely derived from the endosperm, which accounts for 80~85% of the kernel’s dry weight [3]. The main storage materials in endosperm include 70~75% starch, 8~12% protein, and 0.7~1.1% lipid [4]. Based on light transmission properties, the endosperm is commonly classified as vitreous and floury, exhibiting translucent and opaque appearances, respectively. The transparency of the endosperm is determined by the development and packing of amyloplasts and protein bodies, which influence the presence of air spaces within the cells [5]. The vitreous endosperm is typically located in the outer region of the kernel and is characterized by a hard, glasslike texture, while the floury endosperm, found in the interior, is softer in consistency [6]. In the vitreous endosperm, starch granules and protein matrix are densely arranged and well developed, whereas in the floury endosperm, starch granules are less developed and the protein matrix is discontinuous. Maize kernels with a high proportion of vitreous endosperm are suitable for producing popcorn, corn chips, corn flakes, and grits, whereas those enriched in floury endosperm are more advantageous for ethanol and flour production, as well as feed applications [7,8,9,10,11].
Both vitreous and floury endosperms are rich in starch, which is embedded within a protein matrix. The interaction between storage proteins and starch contributes to the distinct textures of vitreous and floury endosperm, with the composition and distribution of proteins being the primary factors influencing endosperm texture [2,12,13,14]. Gayral et al. [15] analyzed the transcriptome, amino acid profiles, and carbohydrate metabolites in the peripheral endosperm, which develops into vitreous endosperm, and the central endosperm, which forms floury endosperm, in developing maize kernels. Their study revealed that the formation of vitreous and floury endosperm is associated with hypoxia and endoplasmic reticulum stress, mediated through the synergistic regulation of energy metabolism and storage protein biosynthesis. Although protein plays a major role in determining endosperm texture, starch constitutes over 70% of the endosperm and ultimately governs the applications of maize. Therefore, it is essential to investigate the development and properties of starch in both vitreous and floury endosperm.
Previous studies have demonstrated that starches from vitreous and floury endosperm within the same mature maize kernel exhibit significant differences in morphological, structural, and functional properties [3,4,14,16,17,18]. Vitreous endosperm contains both large polygonal and small spherical starch granules, whereas floury endosperm consists predominantly of spherical granules, regardless of size. Additionally, starch granules in vitreous endosperm are generally larger than those in floury endosperm [3,14,18]. Vitreous starch has been shown to possess higher amylose and damaged starch contents, while floury starch exhibits higher relative crystallinity and stronger lamellar peak intensity [3,16,17,18]. Furthermore, floury starch displays higher gelatinization temperatures and greater gelatinization enthalpy compared to vitreous starch [3,18]. However, it remains unclear how the morphological and structural properties of developing starches differ between vitreous and floury endosperm in maize, and what underlying mechanisms lead to these differences.
To address the questions above, the outer endosperm (OE) and inner endosperm (IE), which are destined to become vitreous and floury endosperm, respectively, were isolated from developing maize kernels in this study. The tissues were subjected to morphology observation, starch property measurements, transcriptomic profiling, gene expression analysis, and enzyme activity assays to elucidate the developmental mechanisms underlying the distinct characteristics of vitreous and floury starches. The findings would enhance our understanding of starch development and properties, and provide a theoretical foundation for breeding and utilizing maize varieties with different endosperm textures.

2. Materials and Methods

2.1. Plant Materials

The conventional maize inbred line Zheng 58 (Z58) and Mo17 were selected as plant materials, representing dent-type and flint-type kernels, respectively. Z58 kernels consist of approximately 34.6% vitreous endosperm and 48.6% floury endosperm, while Mo17 kernels contain 39.4% vitreous endosperm and 43.2% floury endosperm [14]. Both lines were planted in the experiment field (32°39′46″ N, 119°42′62″ E) of Yangzhou University in 2019. Field management followed standard practices, and cobs were strictly self-pollinated. Developing kernels were randomly collected from the middle section of fresh cobs at 15, 20, and 25 days after pollination (DAP). The pericarps were removed to isolate the endosperms. The inner endosperm (IE) and outer endosperm (OE) were dissected from the same kernel, as illustrated in Figure S1. Briefly, the crown endosperm (approximately 0.5 mm thick) was removed, and the endosperm above the embryo was retained for further separation. The harvested endosperm tissue was placed horizontally on a glass slide, and both sides were trimmed by approximately 0.5 mm. The remaining tissue was divided equally into 6 segments. The inner two segments (I) and the outer two segments (III) were designated as IE and OE, respectively. The OE and IE are destined to develop into vitreous and floury endosperm, respectively. To avoid cross-contamination between IE and OE, the middle endosperm (II) was discarded (Figure S1). A subset of the separated endosperm samples was immediately frozen in liquid nitrogen and stored at −80 °C for subsequent RNA-Seq, qRT-PCR, and enzyme activity assays. The remaining samples were stored at −20 °C for starch structural analysis. All endosperm sampling procedures were performed on ice. For mature kernels, IE and OE separation was conducted after soaking the kernels in water at 4 °C for 24 h.

2.2. Investigation of Starch Granules in Developing Endosperm

Transverse sections of developing whole kernels were prepared following the exact method described by Xu et al. [18]. The sections were stained with an iodine solution and photographed using a BX53 light microscope (Olympus, Tokyo, Japan). Morphological parameters of the starch granules were analyzed using Photoshop CS6 and Image-Pro Plus 6.0 software, as outlined in the same reference [18]. Briefly, starch granules were color-labeled using the “Lasso Tool” in Photoshop, and then analyzed in Image-Pro to obtain morphological parameters. Over 300 starch granules from 3 sections were measured for each sample. The filling degree of starch was calculated as the area percentage occupied by all starch granules within the target region, and repeated three times.

2.3. Investigation of Starch Structural Properties

Starch was extracted from the separated IE and OE following exactly the method described by Xu et al. [14]. Amylose content was determined using an Amylose/Amylopectin Assay Kit (K-AMYL) (Megazyme, Bray, Ireland). Crystalline structure was investigated using a D8 X-ray diffractometer (XRD) (Bruker, Karlsruhe, Germany) according to the procedure outlined by Xu et al. [18], while the lamellar structure was analyzed with a NanoStar small-angle X-ray scattering (SAXS) (Bruker, Karlsruhe, Germany) instrument, as described by Cai et al. [19].

2.4. Analysis of RNA-Seq

Total RNA was extracted from IE and OE samples collected at 15 and 20 DAP using TRIzol® Reagent (Invitrogen, Carlsbad, CA, USA), followed by genomic DNA removal with DNase I (TaKara, Kusatsu, Japan). RNA integrity number (RIN) was assessed using Agilent 2100 Bioanalyser (Agilent Technologies, Santa Clara, CA, USA), and concentration was measured with a NanoDrop ND-2000 (NanoDrop Technologies, Wilmington, DE, USA). High-quality RNA samples (OD260/280 = 1.8~2.2, OD260/230 ≥ 2.0, RIN ≥ 6.5, 28S: 18S ≥ 1.0, amounts > 10 μg) were used to construct RNA-Seq libraries with the TruSeqTM RNA Sample Preparation Kit (Illumina, San Diego, CA, USA). Library construction and sequencing were performed by Shanghai Majorbio Biopharm Technology Co., Ltd., Shanghai, China. Raw reads were processed and quality-controlled using SeqPrep (https://github.com/jstjohn/SeqPrep, accessed on 1 August 2019) and Sickle (https://github.com/najoshi/sickle, accessed on 1 August 2019) with default parameters. Clean reads from each sample were aligned to the maize reference genome (http://plants.ensembl.org/Zea_mays/Info/Index, accessed on 1 August 2019) in orientation-aware mode using TopHat (version 2.0.0, http://tophat.cbcb.umd.edu/, accessed on 1 August 2019). Gene expression levels were quantified using the TPM (transcripts per kilobase million) method. Differential gene expression analysis between samples was carried out with EdgeR (http://www.bioconductor.org/packages/2.12/bioc/html/edgeR.html, accessed on 1 August 2019). Functional enrichment analyses of differentially expressed genes (DEGs) for Gene Ontology (GO) and Kyoto Encyclopedia of Genes and Genomes (KEGG) pathways were conducted using Goatools (https://github.com/tanghaibao/Goatools, accessed on 1 August 2019) and KOBAS (http://bioinfo.org/kobas/, accessed on 1 August 2019), respectively.

2.5. Analysis of qRT-PCR

Total RNA was extracted from IE and OE samples collected at 15 and 20 DAP using an RNAprep Pure Plant Kit (Tiangen Biotech, Beijing, China). One microgram of total RNA was reverse-transcribed into cDNA using the HiScript® III 1st Strand cDNA Synthesis Kit (+gDNA Wiper) (Vazyme, Nanjing, China). Quantitative real-time PCR (qRT-PCR) was performed using ChamQ™ Universal SYBR® qPCR Master Mix (Vazyme, Nanjing, China) on a BIO-RAD CFX96 real-time PCR system. The reaction mixture consisted of 5 μL of ChamQ Universal SYBR qPCR Master Mix, 0.2 μL of each forward and reverse primer (10 μM), 1 μL of cDNA template, and 3.6 μL of ddH2O, making a total volume of 10 μL. The Actin gene was used as an internal reference, and the relative expression levels of target genes were calculated using the 2(−ΔΔCt) method. All primers are provided in Table S1 [20,21].

2.6. Activity Analysis of Granule-Bound Starch Synthase I

The activity of granule-bound starch synthase I (GBSSI) in starch isolated from IE and OE was assayed according to the methods of Hunt et al. [22] and Fujita et al. [23].

2.7. Determination of Pyruvate Orthophosphate Dikinase Activity in Developing Endosperm

The activity of pyruvate orthophosphate dikinase (PPDK) in the IE and OE at 15, 20, and 25 DAP was determined using a commercial PPDK Assay Kit (PPDK-1-Y, Suzhou Comin Biotechnology Co., Ltd., Suzhou, China).

2.8. Statistical Analysis

Statistical analyses, including the calculation of means and standard deviations as well as the performance of t-tests, were conducted using Microsoft Excel.

3. Results

3.1. Morphology and Accumulation of Developing Starch in IE and OE

To investigate the morphological changes and spatiotemporal accumulation of starch granules in the IE and OE during kernel development, transverse sections of whole kernels at 15, 20, and 25 DAP were prepared and stained with iodine solution (Figure 1). Morphological parameters of starch granules and the starch filling degree within the endosperm were quantitatively analyzed (Table 1). At 15 DAP, starch granules in both IE and OE were predominantly spherical, with roundness values ranging between 1.13 and 1.18; values close to 1 indicate a near-spherical shape. By 20 and 25 DAP, starch granules in the IE remained spherical, whereas those in the OE became polygonal (Figure 1 and Table 1). Starch granule size increased significantly from 15 to 20 DAP but remained relatively constant from 20 to 25 DAP. Throughout development, granules were larger in the OE than in the IE, particularly at 20 and 25 DAP (Table 1). The starch filling degree, reflecting the extent of starch accumulation within endosperm cells, could not be accurately determined in the IE at 15 DAP due to the uneven distribution of starch granules. At 20 and 25 DAP, the filling degree was significantly higher in the OE compared to the IE (Table 1).

3.2. Structural Properties of Developing Starch

The amylose contents of starches from the IE and OE of both Z58 and Mo17 were determined during kernel development (Table 2). From 15 DAP to maturity, the amylose content in Z58 IE starch increased from 17.6% to 18.3%, while that in Mo17 IE starch rose from 16.5% to 18.4%. In contrast, the amylose content in OE starch increased from 18.8% to 20.6% in Z58 and from 17.0% to 20.8% in Mo17. Starting from 20 DAP, the OE starch exhibited significantly higher amylose content than the IE starch in both cultivars.
The XRD patterns of both IE and OE starches from developing kernels of Z58 and Mo17 exhibited distinct diffraction peaks at 2θ approximately 15° and 23°, along with an unresolved doublet at 2θ approximately 17° and 18°, consistent with the characteristic profile of A-type starch (Figure 2A,B) [24]. Throughout kernel development, the relative crystallinity of both IE and OE starches remained relatively stable. However, by 25 DAP, OE starch exhibited significantly lower relative crystallinity compared to IE starch (Table 2).
The SAXS patterns of IE and OE starches from developing kernels of both Z58 and Mo17 are presented in Figure 2C,D. At 15 and 20 DAP, the SAXS patterns of IE and OE starches were similar. However, distinct differences emerged by 25 DAP and became especially pronounced at maturity. Lamellar structural parameters were derived from the scattering data. Throughout kernel development, the scattering peak position and lamellar repeat distance remained relatively consistent for both IE and OE starches. The peak position fell within the range of 0.060 and 0.064 Å−1, corresponding to a lamellar repeat distance of 9.9 and 10.5 nm, which aligns with previously reported results [14]. In contrast, the peak intensity was significantly higher in IE starch compared to OE starch at 25 DAP and maturity (Table 2).

3.3. Statistical Analysis of Expressed Genes in IE and OE

Transcriptome and metabolome analyses have been widely used to reveal regulatory networks associated with endosperm storage compounds synthesis and accumulation [25,26,27]. To further investigate transcriptomic differences between IE and OE, RNA-Seq analysis was performed with two biological repeats per sample group. Approximately 5 × 10⁷ clean reads were obtained per sample, of which over 85% were mapped to the maize B73 reference genome. Among these, more than 70% were uniquely mapped reads (Table S2). Correlation analysis revealed high reproducibility between biological replicates, as evidenced by high correlation coefficients and clear clustering of replicates within the same group (Figure S2). Expression profiling identified over 14,000 expression genes in each sample group of Z58 and approximately 12,000 in each group of Mo17 (Figure S3A). Differentially expressed genes (DEGs) were identified using the thresholds |log2FC| ≥ 1 and p-adjusted < 0.05. At 15 DAP, 6546 and 5092 DEGs were detected between IE and OE in Z58 and Mo17, respectively, with 3067 and 2134 genes upregulated in IE. At 20 DAP, 4576 and 3392 DEGs were identified in Z58 and Mo17, respectively, including 2324 and 1567 upregulated genes in IE (Figure S3C). Furthermore, 2777 and 2337 DEGs were common to both time points in Z58 and Mo17, respectively (Figure S3B). KEGG enrichment analysis of the common DEGs between IE and OE revealed significant enrichment in pathways related to protein synthesis and amino acid metabolism, glycolysis, starch and sucrose metabolism, indicating their potential roles in protein and starch biosynthesis and metabolism within the endosperm (Figure S4).

3.4. Differential Regulation of Energy Metabolism in IE and OE

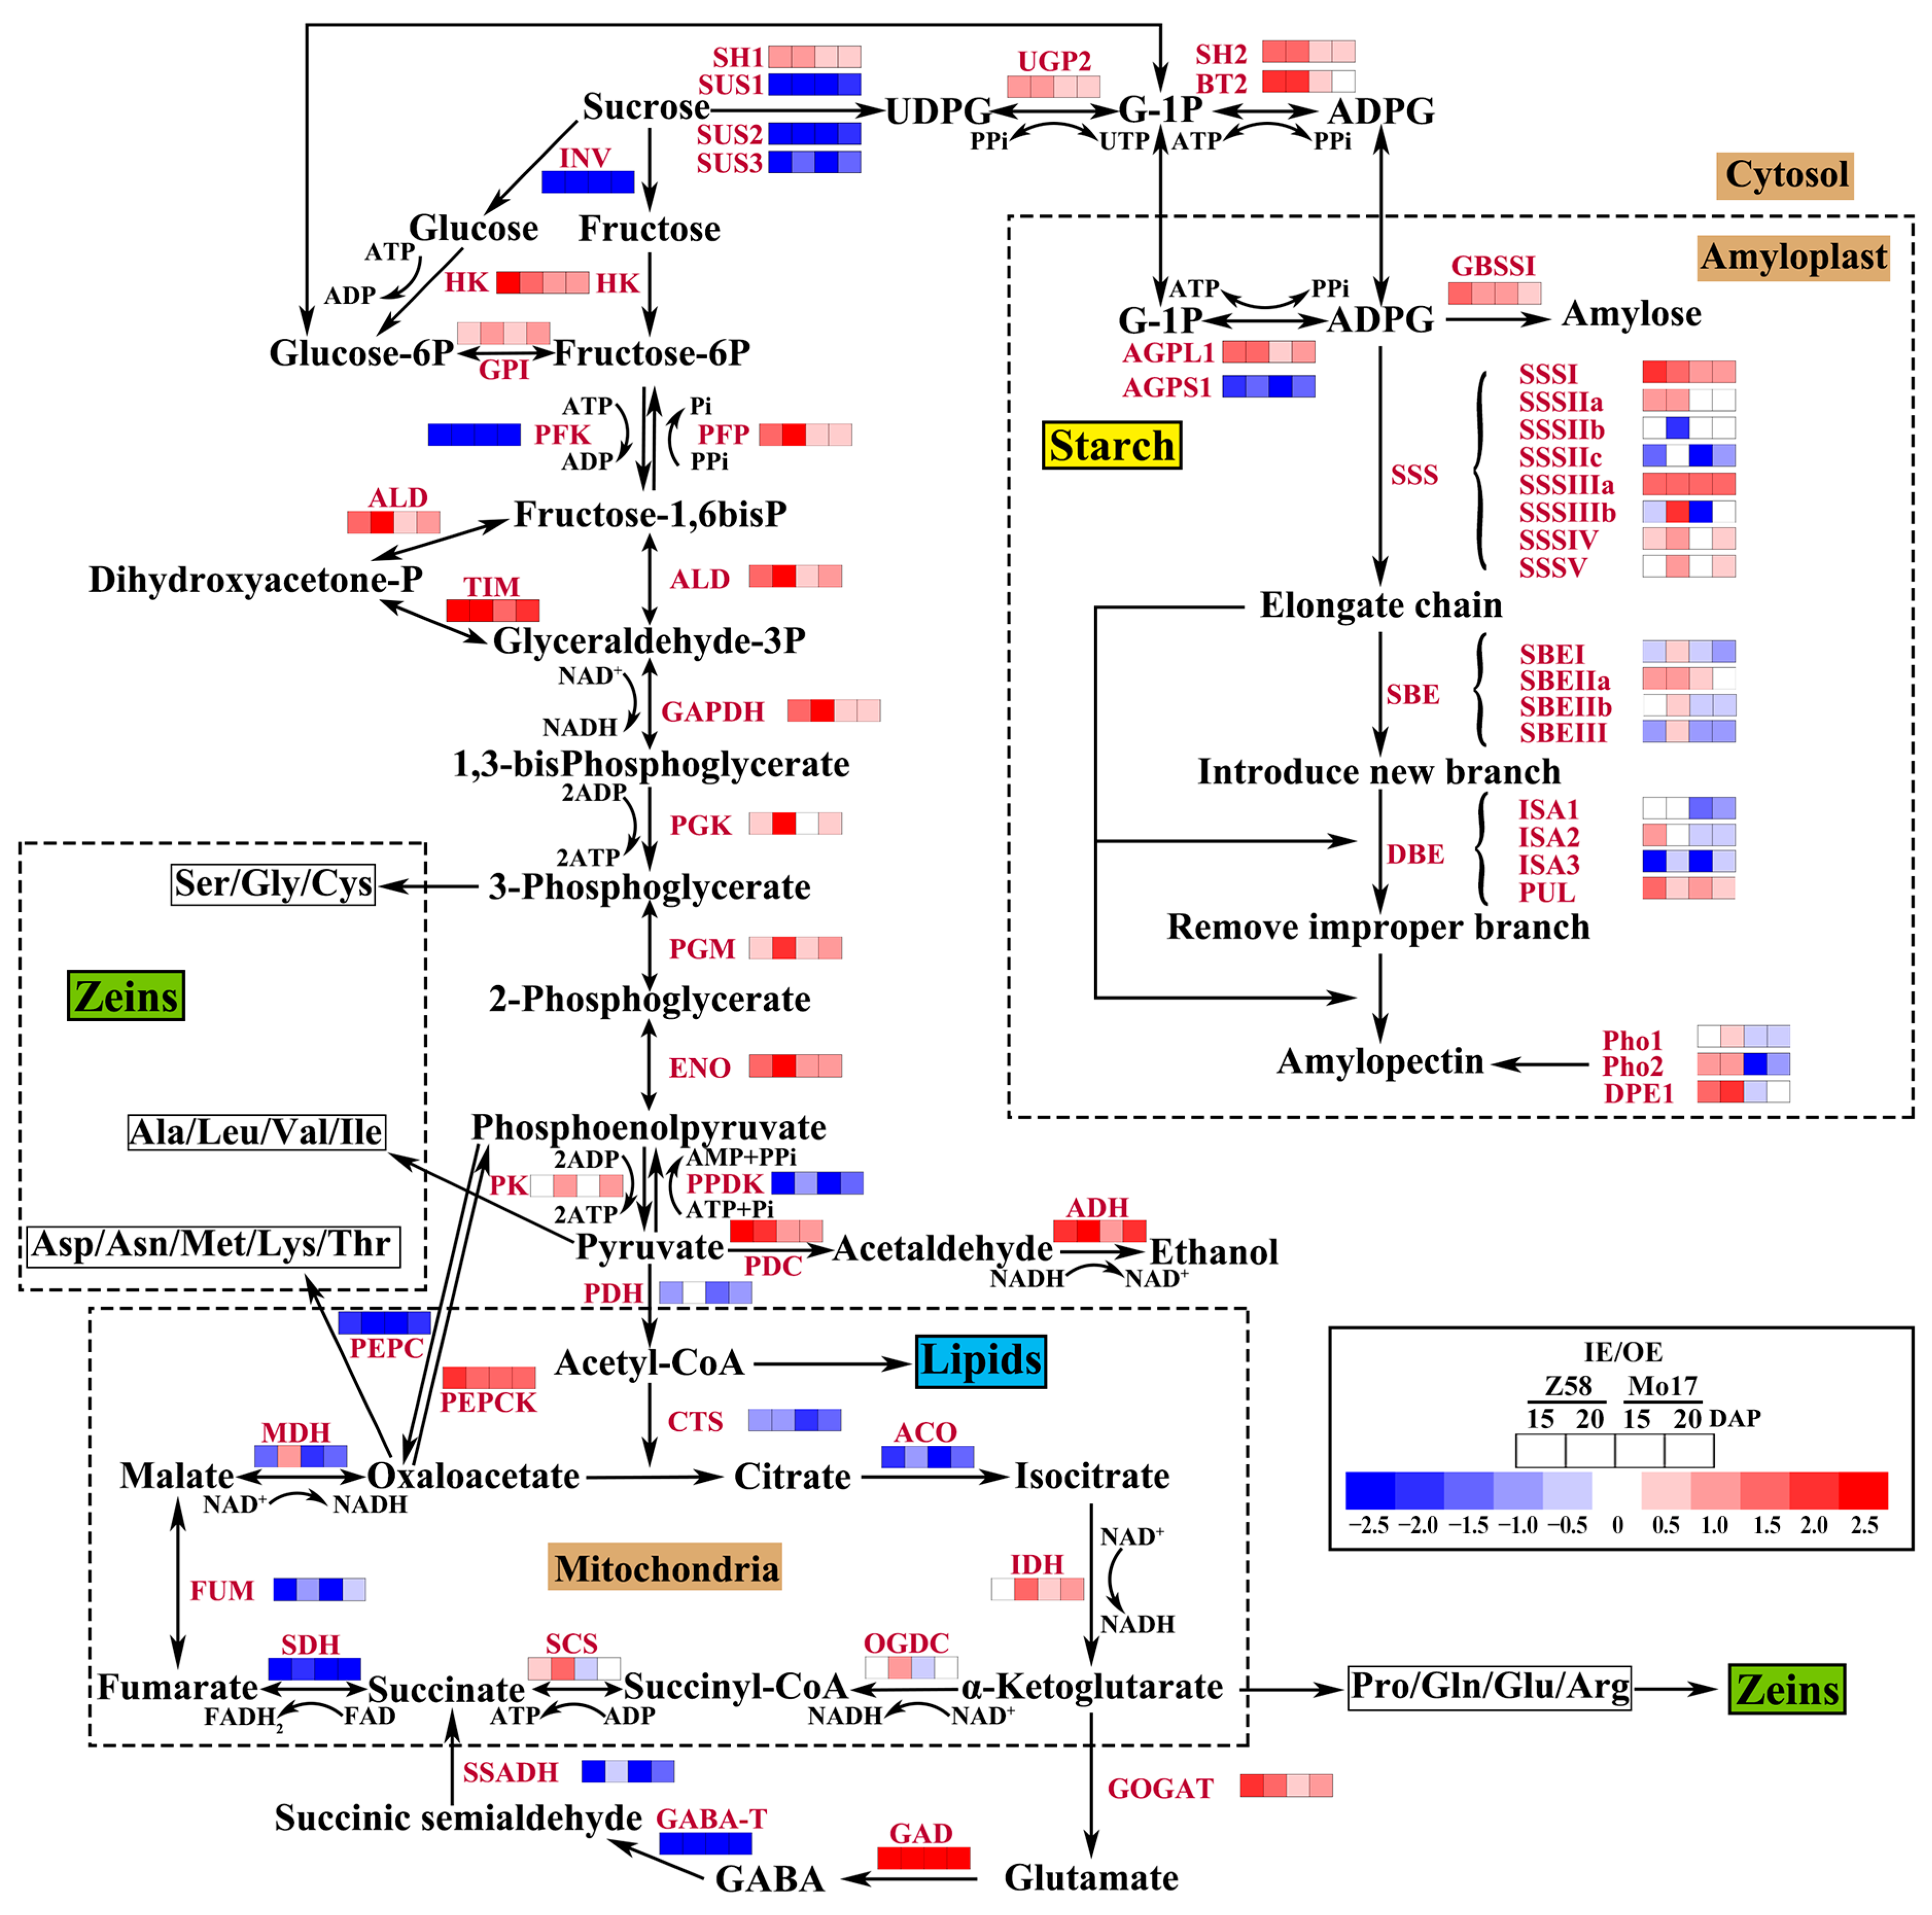
In this study, GO analysis was performed on the upregulated DEGs in the IE at both 15 and 20 DAP. The results indicated significant enrichment in terms related to anaerobic respiration, glycolytic process, and response to hypoxia, suggesting that the IE experiences hypoxia stress during development (Figure S5). Furthermore, nearly all genes involved in the glycolytic pathway were upregulated in the IE of both Z58 and Mo17. Although the phosphorylation of fructose-6-phosphate by phosphofructokinase (PFK) to form fructose-1,6-diphosphate typically consumes ATP, PFK was downregulated in the IE, thereby conserving ATP for the synthesis of storage compounds under anaerobic conditions. At the end of glycolysis, pyruvate is diverted into two pathways: ethanol fermentation under anaerobic conditions and the TCA cycle under aerobic conditions. In ethanol fermentation, pyruvate decarboxylase (PDC) and alcohol dehydrogenase (ADH) catalyze the decarboxylation of pyruvate to produce ethanol. Both PDC and ADH were upregulated in the IE of Z58 and Mo17 at 15 and 20 DAP, indicating enhanced anaerobic fermentation in the IE (Figure 3). In contrast, within the TCA cycle, most genes, except those encoding isocitrate dehydrogenase (IDH), α-ketoglutarate dehydrogenase complex (OGDC), and succinyl-CoA synthetase (SCS), were significantly upregulated in the OE of both Z58 and Mo17 at 15 and 20 DAP. This not only reflects a greater tendency toward respiratory metabolism in the OE but also supports the hypothesis that the TCA cycle may play a key role in OE formation [15]. The NADH and FADH2 produced in the OE subsequently enter the electron respiratory chain, generating more ATP than in the IE, which in turn supports the biosynthesis of protein and lipid (Figure 3).

3.5. Relative Expression of Starch Synthesis Related Genes in IE and OE

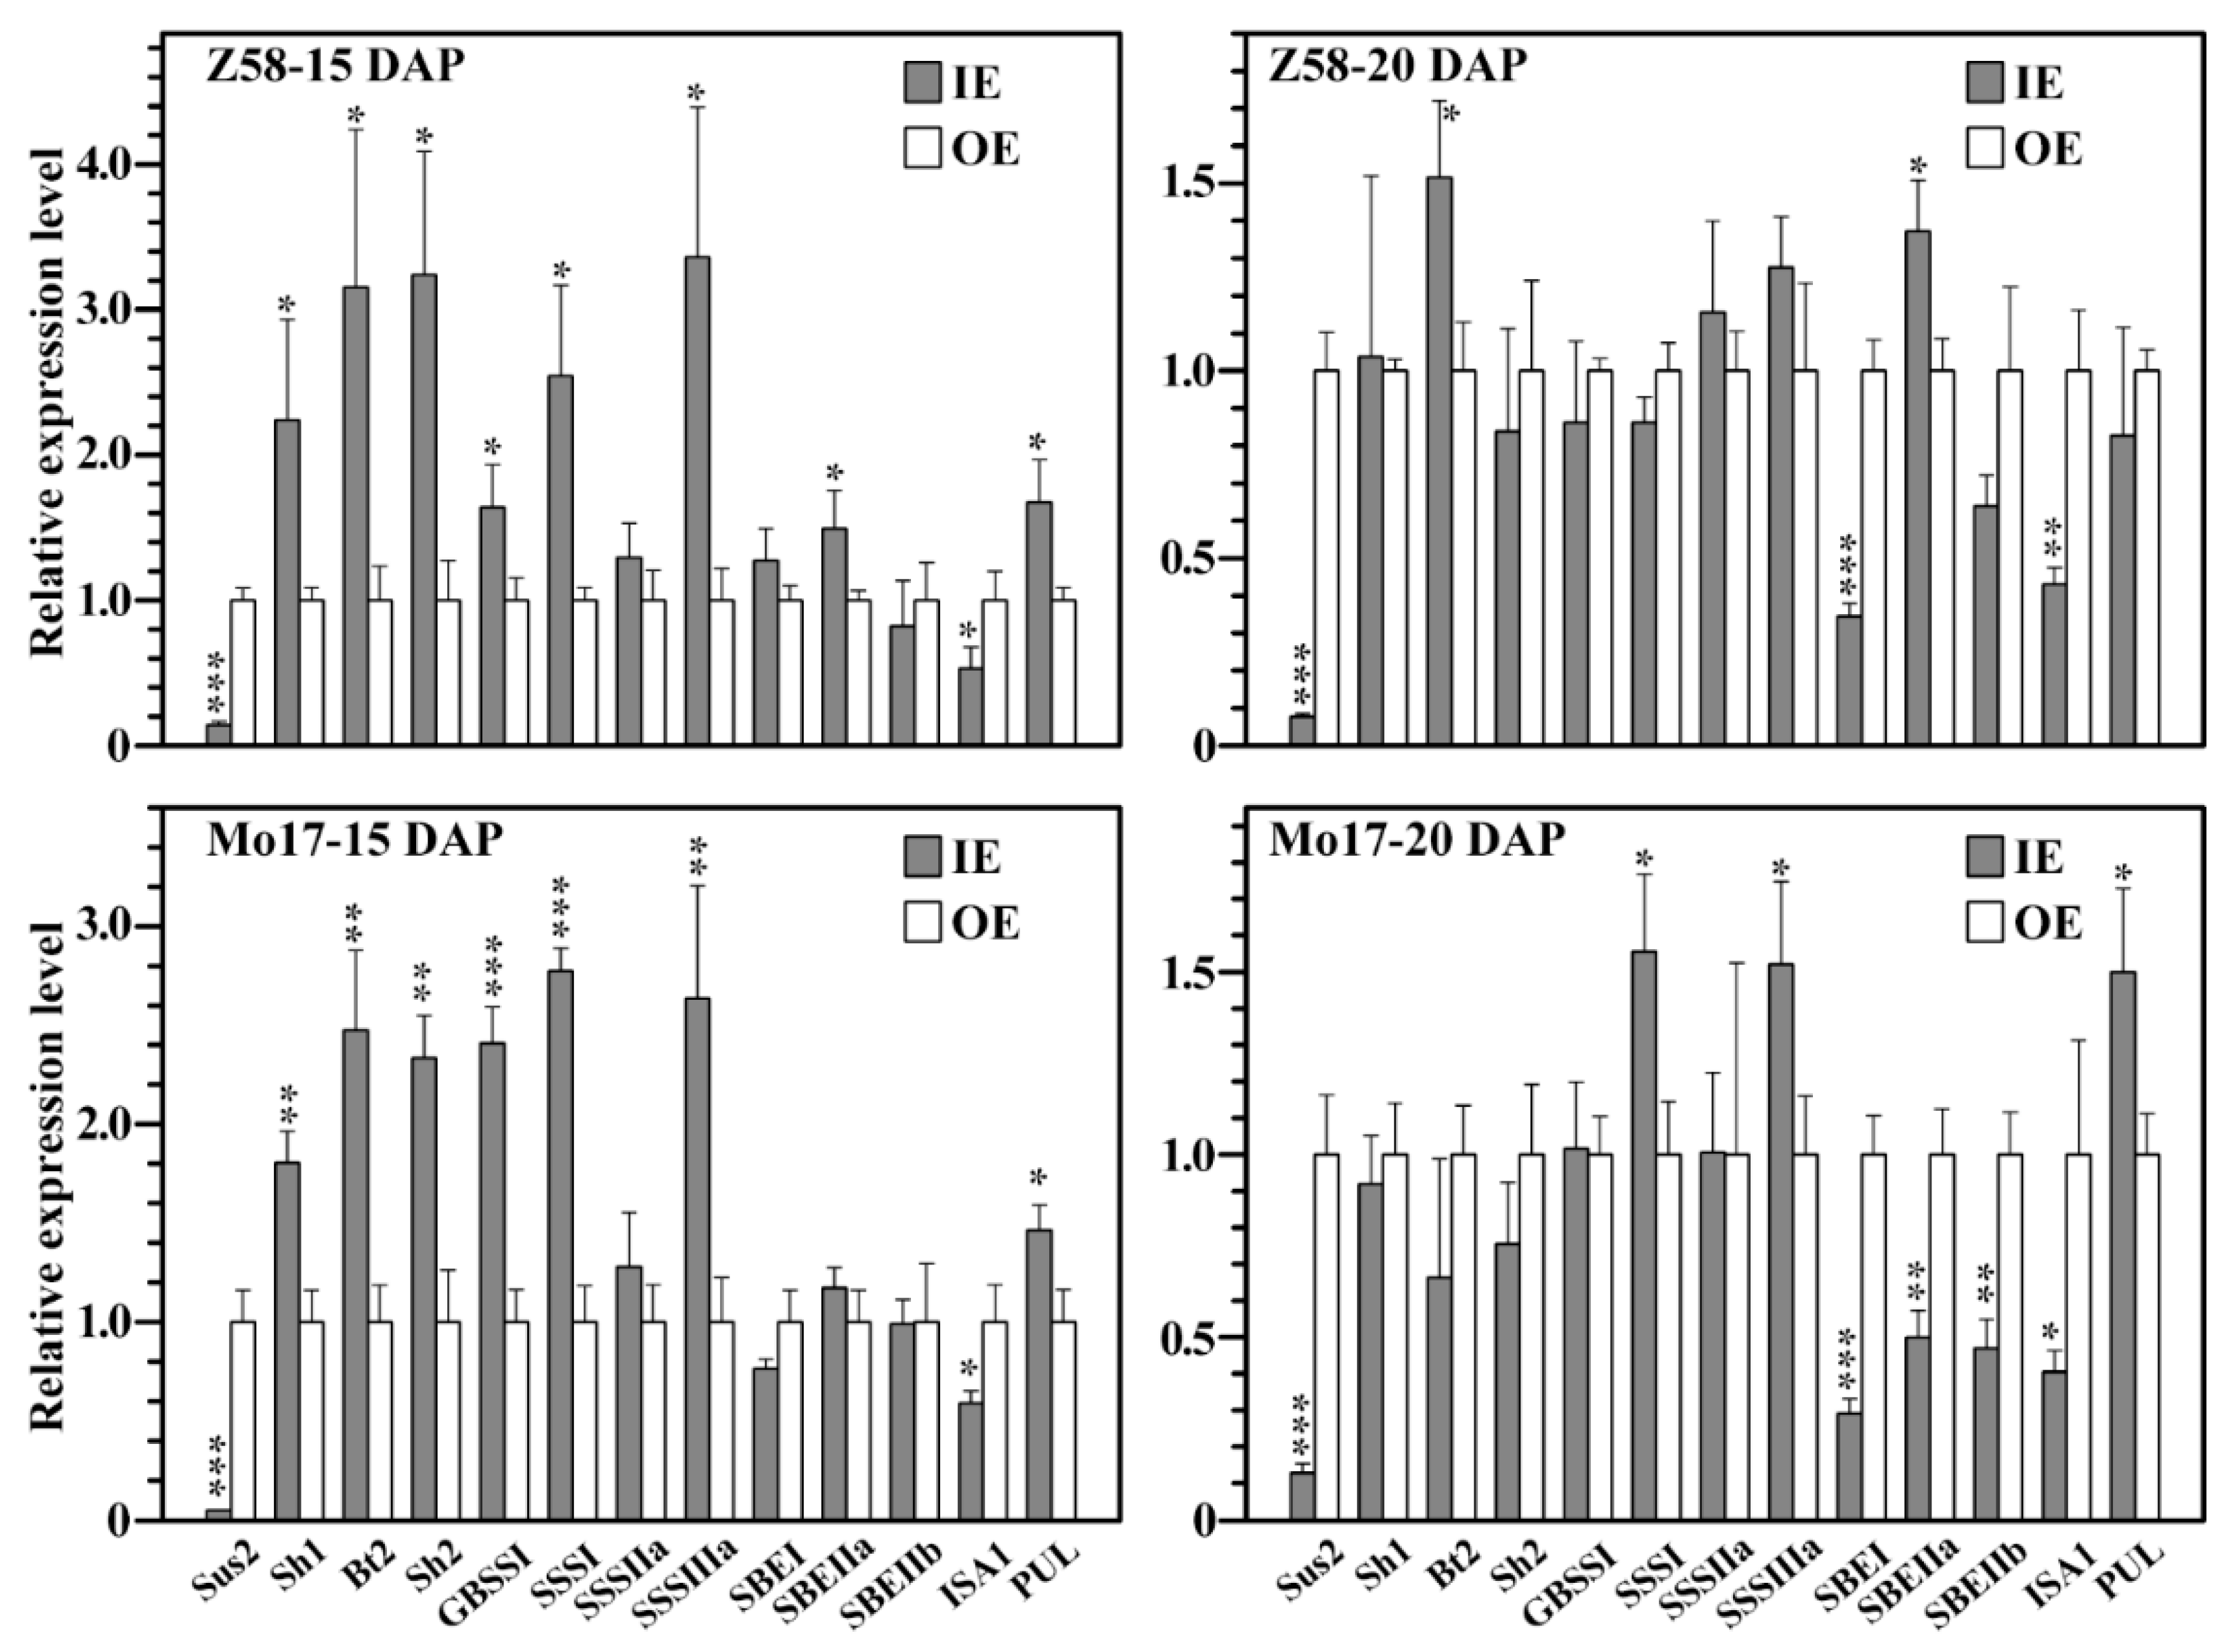
In maize endosperm, starch biosynthesis occurs at two distinct sites: the cytoplasm and the plastid (amyloplast). In the cytoplasm, glucose-1-phosphate (G-1P) is converted to ADP-glucose (ADPG) by ADPG pyrophosphorylase (AGPase), primarily mediated by the BT2 and SH2 subunits. Within the amyloplast, G-1P is similarly converted to ADPG through the action of AGPase, involving the AGPL and AGPS subunits. Cytosolic ADPG is transported into the amyloplast via the ADP-glucose transporter (BT1), where it serves, along with plastidial ADPG, as the direct substrate for starch synthesis. During this process, both GBSSI and soluble starch synthase (SSS) utilize ADPG to synthesize amylose and amylopectin, respectively (Figure 3). In this study, expression differences of genes related to starch synthesis were analyzed in IE and OE using RNA-Seq data (Figure S6) and qRT-PCR (Figure 4). The results revealed that at 15 DAP, genes including Sh1, Bt2, GBSSI, SSSI, SSSIIa, SSSIIIa, and starch branching enzyme IIa (SBEIIa) were significantly upregulated in the IE of both Z58 and Mo17, whereas Sus2 and isoamylase 1 (ISA1) were significantly downregulated. Additionally, Ugp2 exhibited an upregulated trend, while AGPL2 showed a downregulated trend. By 20 DAP, genes such as Bt2, Sh2, SSSI, and SSSIIIa continued to show significant upregulation in the IE of both Z58 and Mo17, whereas Sus2, AGPL2, SBEI, and ISA1 were significantly downregulated. The findings demonstrate substantial differences in the starch biosynthesis pathways between IE and OE, which may contribute to the observed variations in starch components.

3.6. GBSSI Activity Within Developing Starch

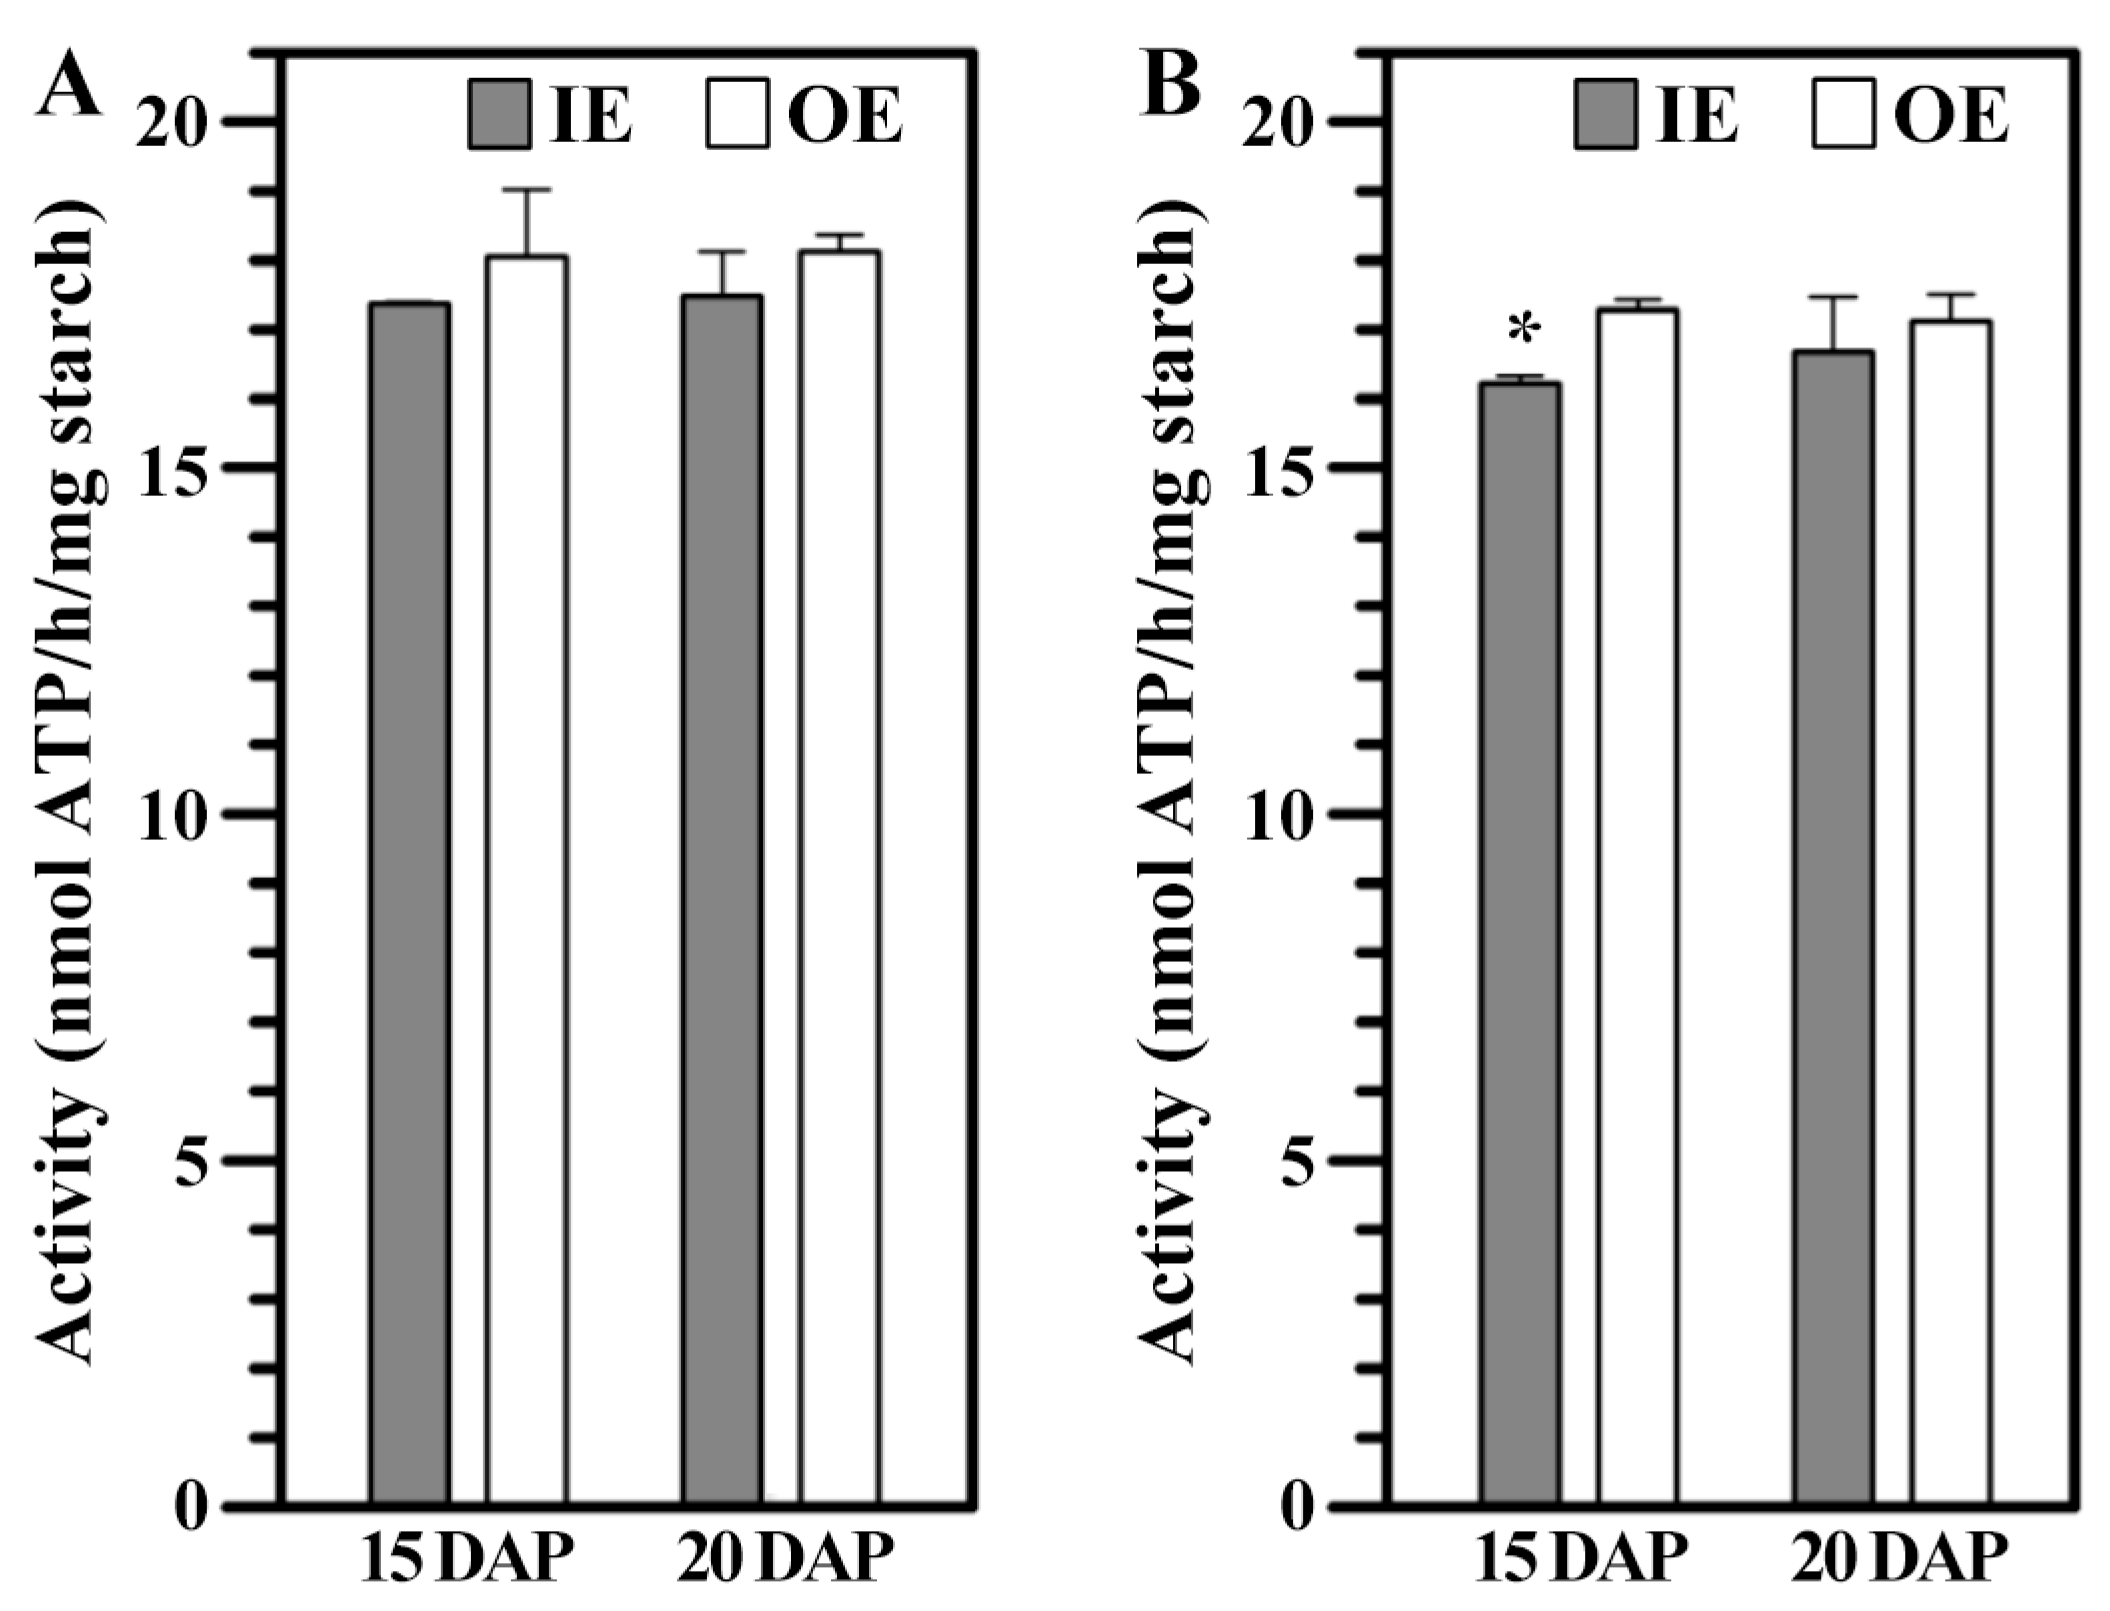
Starch properties, such as crystalline structure, lamellar organization, thermal behavior, and hydrolysis characteristics, are strongly influenced by amylose content [18]. In maize endosperm, amylose is exclusively synthesized by GBSSI. A marked difference in amylose content was observed between starches from IE and OE (Table 2). To explore the underlying cause, GBSSI was actively measured in IE and OE starches at 15 and 20 DAP (Figure 5). The results showed no significant differences in GBSSI activity between IE and OE at 15 and 20 DAP.

3.7. PPDK in IE and OE

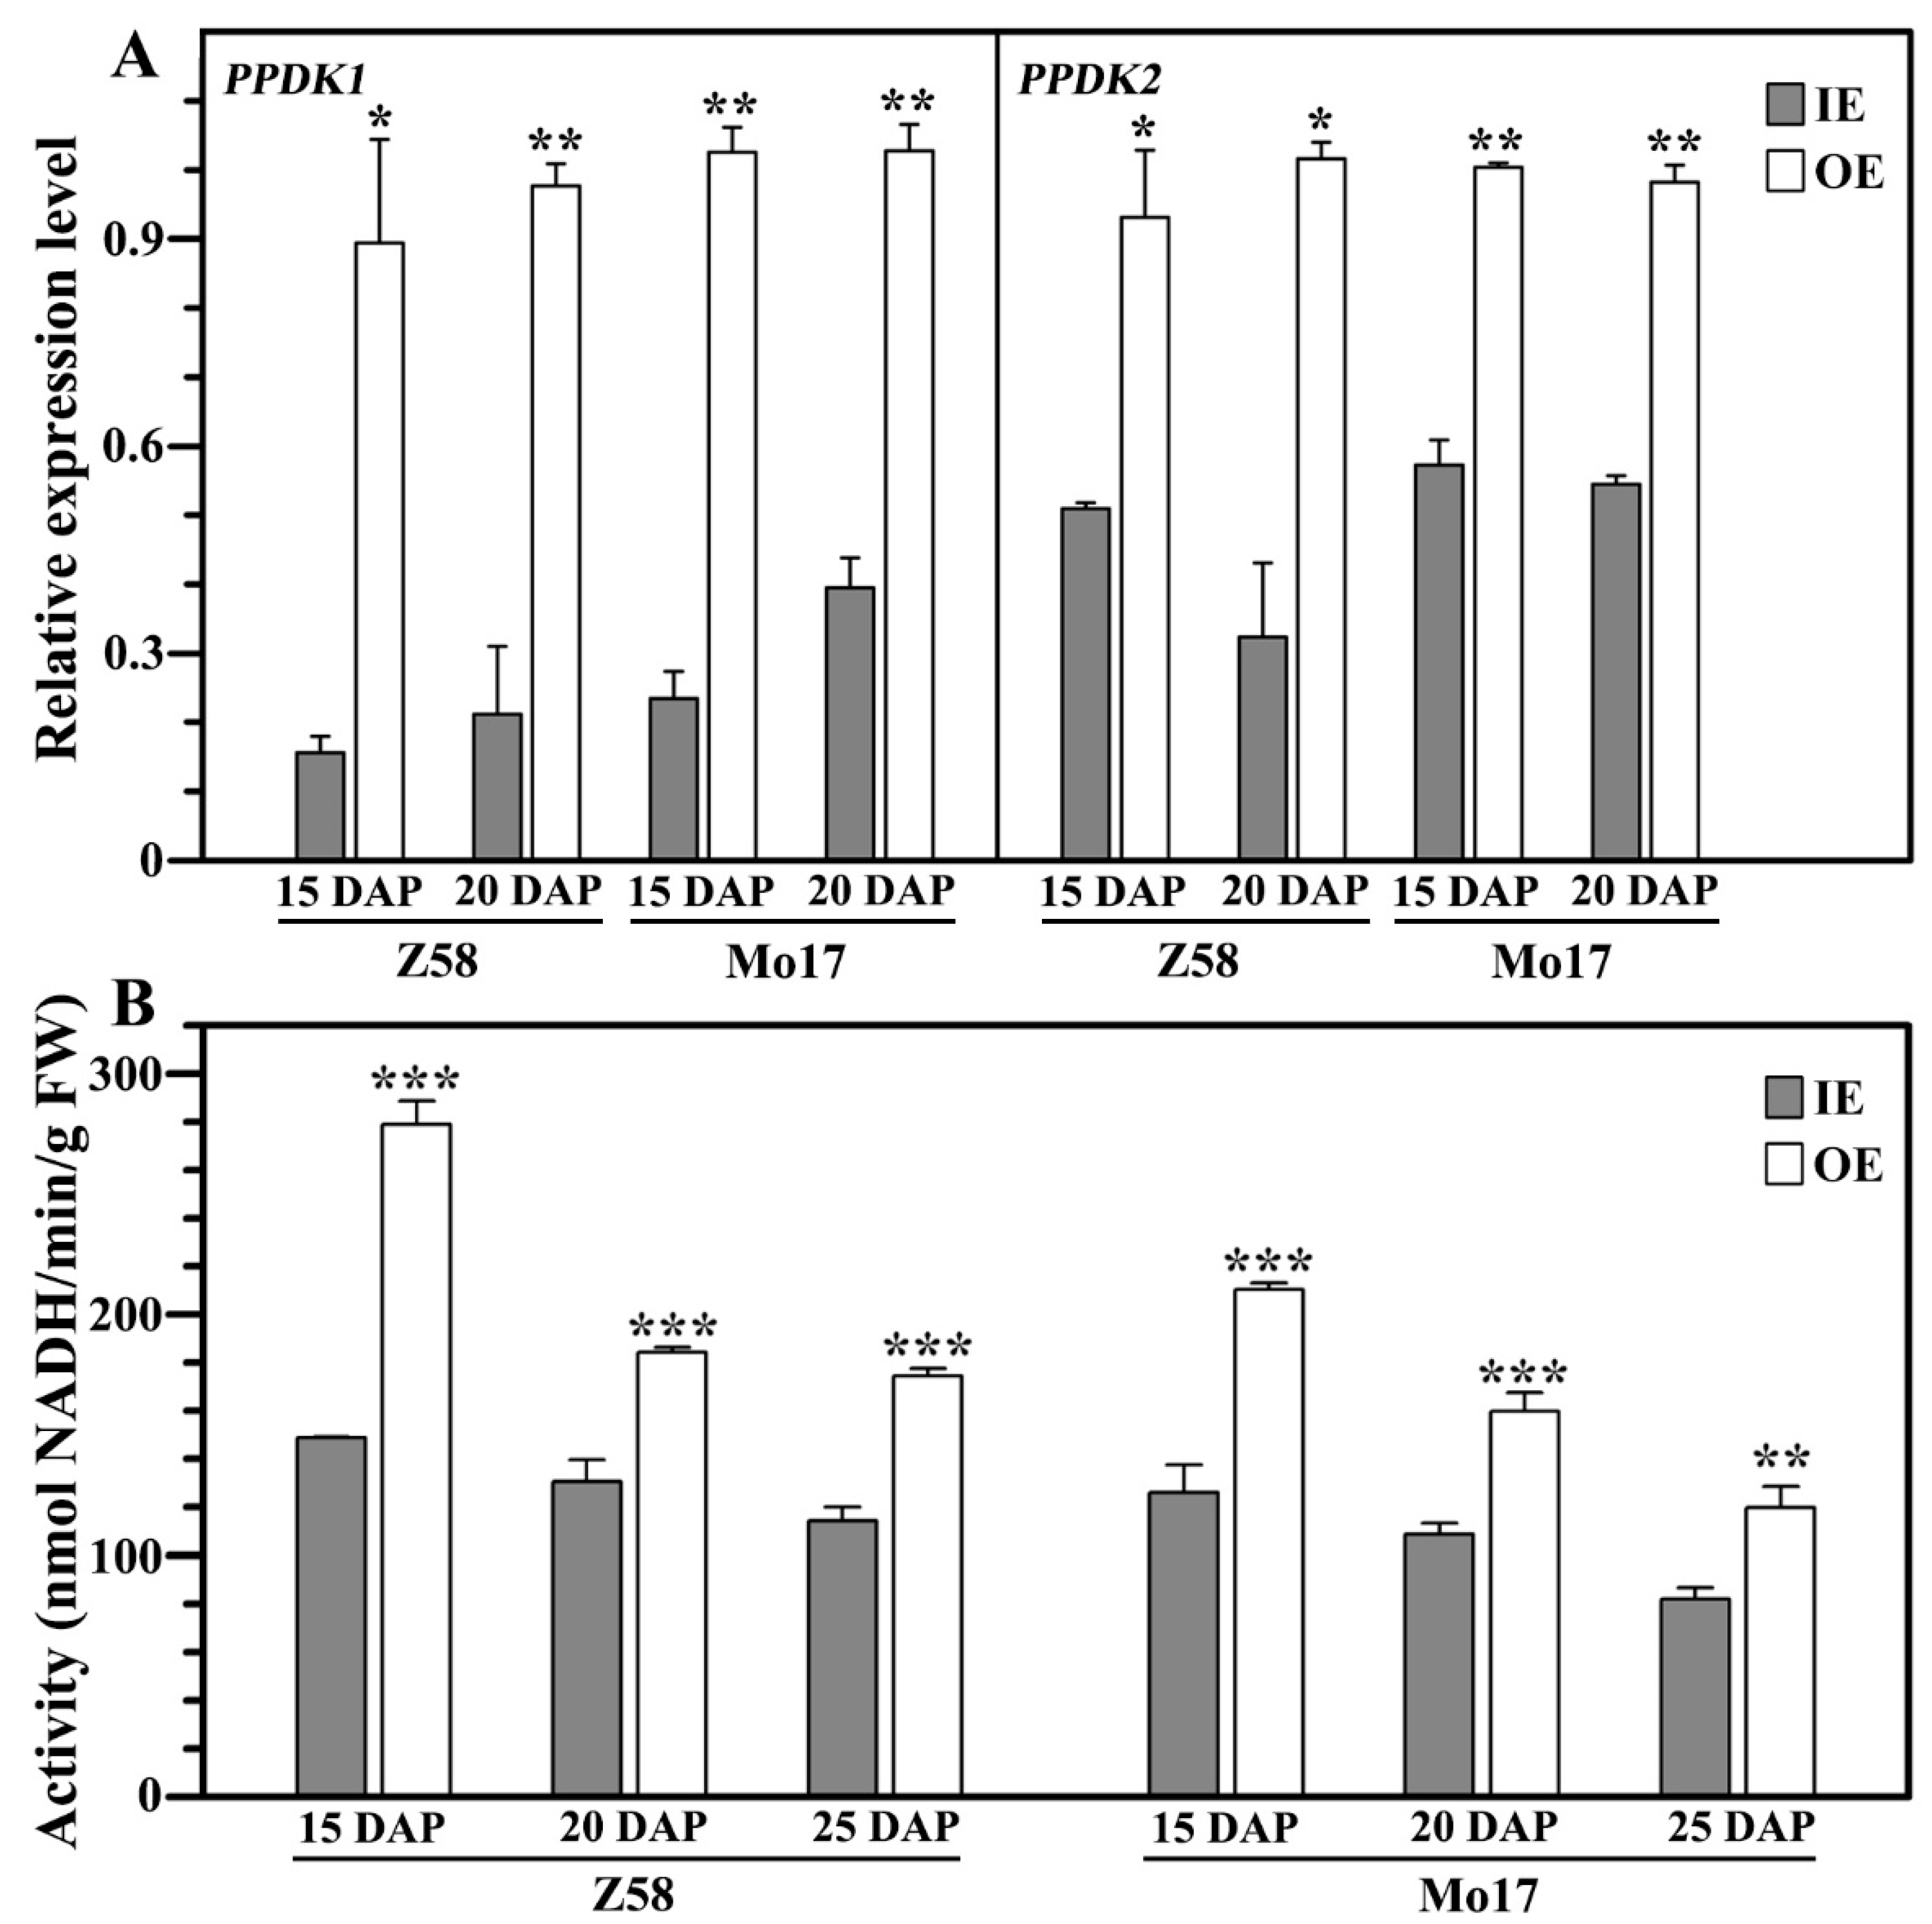
PPDK is a key enzyme in the glycolytic pathway, catalyzing the reversible conversion of pyruvate, ATP, and inorganic phosphate (Pi) to phosphoenolpyruvate (PEP), AMP, and pyrophosphate (PPi). In addition, PPDK plays an important role in starch synthesis, starch-protein/lipid balance, and other biological processes [28]. The maize genome contains three genes encoding PPDK: C4PPDK1, CyPPDK1, and CyPPDK2. Among these, C4PPDK1 is a C4-type isoform primarily expressed in mesophyll cells, while CyPPDK1 and CyPPDK2 are cytosolic isoforms mainly expressed in seeds, fruits, and other non-photosynthetic tissues [29]. In this study, the relative expression levels of CyPPDK1 and CyPPDK2 in IE and OE were analyzed using RNA-Seq data (Figure 6A). Both Z58 and Mo17 exhibited a similar expression trend: the transcript levels of PPDK1 and PPDK2 were significantly higher in OE than in IE. PPDK enzyme activity was further assayed in IE and OE (Figure 6B). Activity decreased gradually from 15 to 25 DAP in both IE and OE. Notably, PPDK activity was significantly higher in OE than in IE at the same developmental stage in both Z58 and Mo17, consistent with the observed gene expression patterns.

4. Discussion

4.1. Nutrient Transportation and Oxygen Concentration Affect Starch Development and Accumulation in IE and OE

In mature maize kernels, the vitreous endosperm contains both small spherical and large polygonal starch granules. The spherical granules are typically located in the aleurone layer cells, whereas the polygonal granules occur in starchy endosperm cells adjacent to the aleurone. In contrast, the IE consists of spherical granules that decrease in size towards the central endosperm [14]. This study focused on the morphological development and accumulation patterns of polygonal granules in the OE and smaller spherical granules in the IE. At 15 DAP, starch granules in both IE and OE were predominantly spherical. By 20 DAP, however, granules in the OE developed a polygonal morphology, while those in the IE maintained a spherical shape (Figure 1). Moreover, both granule size and starch filling degree were significantly higher in the OE compared to the IE from 20 DAP onward (Table 1). The starch filling degree serves as an indicator of starch accumulation within the endosperm. Zhao et al. [30] reported that although starch accumulation initiates earlier in the IE, the accumulation rate becomes higher in the OE, ultimately leading to larger granule size and tighter packing in this region. Thus, the polygonal morphology, larger size, compact arrangement, and higher filling degree observed in OE starch suggest more efficient starch development and accumulation compared to the IE.
Nutrient transport during maize endosperm development occurs primarily from surface cells, including endosperm transfer cells and aleurone cells, to the starchy endosperm. Owing to the large volume of the maize kernel, the IE receives fewer nutrients than the OE, contributing to inferior starch development, smaller granules, and reduced accumulation in the IE [31]. Furthermore, oxygen availability plays a critical role in endosperm metabolism. Since the maize kernel lacks photosynthetic activity, oxygen must diffuse from the external environment. This diffusion is influenced by tissue structure, oxygen concentration gradients, and atmospheric oxygen level [10]. Although previous studies suggested uniform hypoxia across the endosperm [10], our transcriptomic analysis revealed significant enrichment of anaerobic respiration, glycolytic processes, and hypoxia response pathways in the IE. Additionally, nearly all genes involved in glycolysis and ethanol fermentation were upregulated in the IE (Figure 3 and Figure S5), indicating that hypoxia was more severe in the IE than in the OE. The intensified hypoxic conditions in the IE likely lead to increased consumption of glucose, fructose, and G-1-P for energy maintenance, thereby reducing the carbon availability for starch synthesis. This metabolic shift may underlie the slower development and lower accumulation rate of starch observed in the IE [32]. In summary, we propose that spatial differences in nutrient supply and oxygen concentration within the maize kernel significantly influence starch development and accumulation, contributing to the distinct morphological and compositional characteristics of IE and OE starch.

4.2. Large Starch Granule Size in OE Promotes Amylose Accumulation

Amylose content significantly influences the physicochemical properties and applications of starch. In cereal endosperm, GBSSI is the key enzyme responsible for amylose synthesis. Although amylose content differed significantly between IE and OE starches in this study, no corresponding difference in GBSSI activity was observed (Table 2 and Figure 5). Notably, however, both the expression and activity of PPDK were significantly higher in the OE than in the IE (Figure 6). Previous studies have proposed several roles of PPDK in endosperm metabolism, including (1) participating in gluconeogenesis to provide hexose precursors for starch synthesis, (2) providing pyruvate for lipid synthesis, and (3) modulating sucrose synthase activity by regulating PPi homeostasis [29,33,34]. In rice, loss-of-function mutation in PPDK leads to reduced starch synthesis, lower amylose content, and a floury endosperm, suggesting a regulatory role for PPDK in amylose accumulation, although the precise mechanism remains unclear [29,35]. Furthermore, numerous studies have reported a positive correlation between starch granule size and amylose content [36,37,38,39,40,41,42], with amylose known to be more concentrated in the peripheral regions of granules [43]. In the present study, starch granules in the OE were significantly larger than those in the IE from 20 DAP onward, and concurrently, OE starch also contained higher amylose content (Table 1 and Table 2). Thus, we propose that the larger granule size in the OE may facilitate greater amylose deposition, and that elevated PPDK expression and activity may contribute indirectly to amylose accumulation by promoting granule growth.

4.3. Starch Granule Size and Amylose Content Influence Starch Properties

In mature kernels across different crop varieties, both amylose content and granule size have been negatively correlated with starch relative crystallinity and lamellar peak intensity [44,45]. Similarly, in maize kernels, vitreous starch exhibits larger granules, higher amylose content, lower relative crystallinity, and reduced lamellar peak intensity compared to floury starch [3,14]. Consistent with these reports, the present study observed a gradual increase in granule size and amylose content in both IE and OE starches during kernel development, accompanied by a concurrent decrease in relative crystallinities and lamellar peak intensity. Notably, within the same developing kernel, OE starch displayed larger granules, higher amylose content, lower relative crystallinity, and weaker lamellar peak intensity compared to IE starch (Table 1 and Table 2). These findings underscore the important roles of granule size and amylose content in shaping starch functional properties during development. Furthermore, previous studies indicate that starch relative crystallinity is negatively influenced by lipid content and positively associated with the proportion of short branchchains in amylopectin [4,17,46]. Therefore, the structural differences observed between IE and OE starches may also arise from variations in starch lipid composition and amylopectin fine structure.
In conclusion, during the middle and late stages of endosperm development, starch in the IE consisted of small, spherical granules with loose arrangement, while starch in the OE formed large, polygonal granules packed tightly. Compared to OE starch, IE starch exhibited lower amylose content but higher relative crystallinity and lamellar peak intensity. Insufficient nutrient supply and more severe hypoxic conditions in the IE limited the availability of carbon substrates for starch synthesis, thereby impairing starch development and accumulation. Although no significant difference was observed in GBSSI activity between IE and OE, the activity of PPDK was significantly higher in the OE. The larger granule size in OE starch likely facilitated the accumulation of amylose. These findings provide a theoretical foundation for breeding and utilizing maize varieties with tailored endosperm textures.

Supplementary Materials

The following supporting information can be downloaded at: https://www.mdpi.com/article/10.3390/agriculture15181978/s1, Figure S1: The separation diagram of endosperm tissues in different regions; Figure S2: Hierarchical cluster analysis between samples; Figure S3: Quantitative analysis of gene expression in IE and OE from developing kernels; Figure S4: KEGG enrichment analysis of common DEGs at 15 and 20 DAP between IE and OE; Figure S5: GO analysis of upregulated DEGs in IE at both 15 and 20 DAP; Figure S6: Relative expression levels of starch synthesis related genes by RNA-Seq. Table S1: The primers for qRT-PCR analysis of starch biosynthesis-related genes; Table S2: The high-quality clean reads and mapping results.

Author Contributions

C.W. conceived and designed the experiments. Y.H., S.W., and A.X. conducted the experiments. Y.H., S.W., and A.X. prepared all Figures and Tables. Y.H. wrote the original draft of the manuscript. C.W. reviewed and edited the manuscript. All authors have read and agreed to the published version of the manuscript.

Funding

This study was financially supported by grants from the Priority Academic Program Development of Jiangsu Higher Education Institutions (PAPD).

Institutional Review Board Statement

Not applicable.

Informed Consent Statement

Not applicable.

Data Availability Statement

The raw RNA-sequencing data reported in this article have been publicly available under Genome Sequence Archive in the National Center for Bioinformation, China (https://bigd.big.ac.cn/gsa/browse/CRA017512, accessed on 1 July 2024 and https://bigd.big.ac.cn/gsa/browse/CRA017513, accessed on 1 July 2024). The other data presented in this study are included in the article and/or Supplementary Materials; further inquiries can be directed to the corresponding author.

Conflicts of Interest

The authors declare no conflicts of interest.

References

  1. Pereira, R.C.; Davide, L.C.; Pedrozo, C.A.; Carneiro, N.P.; Souza, I.R.P.; Paiva, E. Relationship between structural and biochemical characteristics and texture of corn grains. Genet. Mol. Res. 2008, 7, 498–508. [Google Scholar] [CrossRef]
  2. Kljak, K.; Duvnjak, M.; Grbeša, D. Contribution of zein content and starch characteristics to vitreousness of commercial maize hybrids. J. Cereal Sci. 2018, 80, 57–62. [Google Scholar] [CrossRef]
  3. Zhang, H.; Xu, G. Physicochemical properties of vitreous and floury endosperm flours in maize. Food Sci. Nutr. 2019, 7, 2605–2612. [Google Scholar] [CrossRef]
  4. Gayral, M.; Bénédicte, B.; Dalgalarrondo, M.; Elmorjani, K.; Delluc, C.; Brunet, S.; Linossier, L.; Morel, M.H.; Marion, D. Lipid partitioning in maize (Zea mays L.) endosperm highlights relationships among starch lipids, amylose, and vitreousness. J. Agric. Food Chem. 2015, 63, 3551–3558. [Google Scholar] [CrossRef]
  5. Eckhoff, S.R.; Watson, S.A. Corn and sorghum starches: Production. In Starch: Chemistry and Technology, 3rd ed.; BeMiller, J., Whistler, R., Eds.; Academic Press: Cambridge, MA, USA, 2009; pp. 373–440. [Google Scholar]
  6. Baasandorj, T.; Ohm, J.B.; Simsek, S. Effects of kernel vitreousness and protein level on protein molecular weight distribution, milling quality, and bread making quality in hard red spring wheat. Cereal Chem. 2016, 93, 426–434. [Google Scholar] [CrossRef]
  7. Gerde, J.A.; Spinozzi, J.I.; Borrás, L. Maize kernel hardness, endosperm zein profiles, and ethanol production. Bioenergy Res. 2017, 10, 760–771. [Google Scholar] [CrossRef]
  8. Juárez-García, E.; Agama-Acevedo, E.; Gómez-Montiel, N.O.; Pando-Robles, V.; Bello-Pérez, L.A. Proteomic analysis of the enzymes involved in the starch biosynthesis of maize with different endosperm type and characterization of the starch. J. Sci. Food Agric. 2013, 93, 2660–2668. [Google Scholar] [CrossRef] [PubMed]
  9. Larkins, B.A. Proteins of the kernel. In Corn: Chemistry and Technology; Serna-Saldivar, S.O., Ed.; Elsevier Inc.: Amsterdam, The Netherlands, 2019; pp. 319–336. [Google Scholar]
  10. Rolletschek, H.; Koch, K.; Wobus, U.; Borisjuk, L. Positional cues for the starch/lipid balance in maize kernels and resource partitioning to the embryo. Plant J. 2005, 42, 69–83. [Google Scholar] [CrossRef] [PubMed]
  11. Zhang, H.Y.; Gao, R.Q.; Dong, S.T. Anatomical and physiological characteristics associated with corn endosperm texture. Agron. J. 2011, 103, 1258–1264. [Google Scholar] [CrossRef]
  12. Dombrink-Kurtzman, M.A.; Bietz, J.A. Zein composition in hard and soft endosperm of maize. Cereal Chem. 1993, 70, 105–108. [Google Scholar]
  13. Fox, G.; Manley, M. Hardness methods for testing maize kernels. J. Agric. Food Chem. 2009, 57, 5647–5657. [Google Scholar] [CrossRef]
  14. Xu, A.; Lin, L.; Guo, K.; Liu, T.; Yin, Z.; Wei, C. Physicochemical properties of starches from vitreous and floury endosperms from the same maize kernels. Food Chem. 2019, 291, 149–156. [Google Scholar] [CrossRef]
  15. Gayral, M.; Elmorjani, K.; Dalgalarrondo, M.; Balzergue, S.M.; Pateyron, S.; Morel, M.H.; Brunet, S.; Linossier, L.; Delluc, C.; Bénédicte, B.; et al. Responses to hypoxia and endoplasmic reticulum stress discriminate the development of vitreous and floury endosperms of conventional maize (Zea mays) inbred lines. Front. Plant Sci. 2017, 8, 557. [Google Scholar] [CrossRef]
  16. Dombrink-Kurtzman, M.A.; Knutson, C.A. A study of maize endosperm hardness in relation to amylose content and susceptibility to damage. Cereal Chem. 1997, 74, 776–780. [Google Scholar] [CrossRef]
  17. Gayral, M.; Gaillard, C.; Bakan, B.; Dalgalarrondo, M.; Elmorjani, K.; Delluc, C.; Brunet, S.; Linossier, L.; Morel, M.H.; Marion, D. Transition from vitreous to floury endosperm in maize (Zea mays L.) kernels is related to protein and starch gradients. J. Cereal Sci. 2016, 68, 148–154. [Google Scholar] [CrossRef]
  18. Xu, A.; Qiu, J.; Yin, Z.; Wei, C. Morphological characteristics of endosperm in different regions of maize kernels with different vitreousness. J. Cereal Sci. 2019, 87, 273–279. [Google Scholar] [CrossRef]
  19. Cai, C.; Cai, J.; Man, J.; Yang, Y.; Wang, Z.; Wei, C. Allomorph distribution and granule structure of lotus rhizome C-type starch during gelatinization. Food Chem. 2014, 142, 408–415. [Google Scholar] [CrossRef]
  20. Prioul, J.L.; Méchin, V.; Lessard, P.; Thévenot, C.; Grimmer, M.; Chateau-Joubert, S.; Coates, S.; Hartings, H.; Kloiber-Maitz, M.; Murigneux, A.; et al. A joint transcriptomic, proteomic and metabolic analysis of maize endosperm development and starch filling. Plant Biotechnol. J. 2008, 6, 855–869. [Google Scholar] [CrossRef] [PubMed]
  21. Zhang, Z.; Zheng, X.; Yang, J.; Messing, J.; Wu, J. Maize endosperm-specific transcription factors O2 and PBF network the regulation of protein and starch synthesis. Proc. Natl Acad. Sci. USA 2016, 113, 10842–10847. [Google Scholar] [CrossRef] [PubMed]
  22. Hunt, H.V.; Denyer, K.; Packman, L.C.; Jones, M.K.; Howe, C.J. Molecular basis of the waxy endosperm starch phenotype in broomcorn millet (Panicum miliaceum L.). Mol. Biol. Evol. 2010, 27, 1478–1494. [Google Scholar] [CrossRef]
  23. Fujita, N.; Hasegawa, H.; Taira, T. The isolation and characterization of a waxy mutant of diploid wheat (Triticum monococcum L.). Plant Sci. 2001, 160, 595–602. [Google Scholar] [CrossRef] [PubMed]
  24. Cheetham, N.W.H.; Tao, L. Variation in crystalline type with amylose content in maize starch granules: An X-ray powder diffraction study. Carbohydr. Polym. 1998, 36, 277–284. [Google Scholar] [CrossRef]
  25. Dong, X.; Luo, H.; Bi, W.; Chen, H.; Yu, S.; Zhang, X.; Dai, Y.; Cheng, X.; Xing, Y.; Fan, X.; et al. Transcriptome-wide identification and characterization of genes exhibit allele-specific imprinting in maize embryo and endosperm. BMC Plant Biol. 2023, 23, 470. [Google Scholar] [CrossRef]
  26. Wang, J.; Wang, H.; Li, K.; Liu, X.; Cao, X.; Zhou, Y.; Huang, C.; Peng, Y.; Hu, X. Characterization and transcriptome analysis of maize small-kernel mutant smk7a in different development stages. Plants 2023, 12, 354. [Google Scholar] [CrossRef] [PubMed]
  27. Khan, A.; Tian, R.; Bean, S.R.; Yerka, M.; Jiao, Y. Transcriptome and metabolome analyses reveal regulatory networks associated with nutrition synthesis in sorghum seeds. Commun. Biol. 2024, 7, 841. [Google Scholar] [CrossRef]
  28. Hennen-Bierwagen, T.A.; Lin, Q.H.; Grimaud, F.; Planchot, V.; Keeling, P.L.; James, M.G.; Myers, A.M. Proteins from multiple metabolic pathways associate with starch biosynthetic enzymes in high molecular weight complexes: A model for regulation of carbon allocation in maize amyloplasts. Plant Physiol. 2009, 149, 1541–1559. [Google Scholar] [CrossRef] [PubMed]
  29. Kang, H.G.; Park, S.; Matsuoka, M.; An, G. White-core endosperm flour endosperm-4 in rice is generated by knockout mutations in the C4-type pyruvate orthophosphate dikinase gene (OsPPDKB). Plant J. 2005, 42, 901–911. [Google Scholar] [CrossRef]
  30. Zhao, L.; Xu, A.; Zhang, L.; Yin, Z.; Wei, C. Spatiotemporal accumulation and characteristics of starch in developing maize caryopses. Plant Physiol. Biochem. 2018, 130, 493–500. [Google Scholar] [CrossRef]
  31. Wang, Z.; Gu, Y.; Li, W.; Dong, M.; Bian, A. The development of endosperm in maize and its nutrients transporting way. J. Jiangsu Agric. Coll. 1997, 18, 1–7. (In Chinese) [Google Scholar]
  32. He, W.; Liu, X.; Lin, L.; Xu, A.; Wei, C. The defective effect of starch branching enzyme IIb from weak to strong induces the formation of biphasic starch granules in amylose-extender maize endosperm. Plant Mol. Biol. 2020, 103, 355–371. [Google Scholar] [CrossRef]
  33. Chastain, C.J.; Heck, J.W.; Colquhoun, T.A.; Voge, D.G.; Gu, X.Y. Posttranslational regulation of pyruvate, orthophosphate dikinase in developing rice (Oryza sativa) seeds. Planta 2006, 224, 924–934. [Google Scholar] [CrossRef] [PubMed]
  34. Lappe, R.R.; Baier, J.W.; Boehlein, S.K.; Huffman, R.; Myers, A.M. Functions of maize genes encoding pyruvate phosphate dikinase in developing endosperm. Proc. Natl. Acad. Sci. USA 2018, 115, E24–E33. [Google Scholar] [CrossRef] [PubMed]
  35. Zhang, L.; Zhao, L.; Lin, L.; Zhao, L.; Liu, Q.; Wei, C. A novel mutation of OsPPDKB, encoding pyruvate orthophosphate dikinase, affects metabolism and structure of starch in the rice endosperm. Int. J. Mol. Sci. 2018, 19, 2268. [Google Scholar] [CrossRef]
  36. Dhital, S.; Shrestha, A.K.; Hasjim, J.; Gidley, M.J. Physicochemical and structural properties of maize and potato starches as a function of granule size. J. Agric. Food Chem. 2011, 59, 10151–10161. [Google Scholar] [CrossRef]
  37. Li, L.; Blanco, M.; Jane, J.L. Physicochemical properties of endosperm and pericarp starches during maize development. Carbohydr. Polym. 2007, 67, 630–639. [Google Scholar] [CrossRef]
  38. Naguleswaran, S.; Li, J.; Vasanthan, T.; Bressler, D.; Hoover, R. Amylolysis of large and small granules of native triticale, wheat and corn starches using a mixture of α-amylase and glucoamylase. Carbohydr. Polym. 2012, 88, 864–874. [Google Scholar] [CrossRef]
  39. Naguleswaran, S.; Vasanthan, T.; Hoover, R.; Bressler, D. The susceptibility of large and small granules of waxy, normal and high-amylose genotypes of barley and corn starches toward amylolysis at sub-gelatinization temperatures. Food Res. Int. 2013, 51, 771–782. [Google Scholar] [CrossRef]
  40. Takeda, Y.; Takeda, C.; Mizukami, H.; Hanashiro, I. Structures of large, medium and small starch granules of barley grain. Carbohydr. Polym. 1999, 38, 109–114. [Google Scholar] [CrossRef]
  41. Tang, H.; Ando, H.; Watanabe, K.; Takeda, Y.; Mitsunaga, T. Physicochemical properties and structure of large, medium and small granule starches in fractions of normal barley endosperm. Carbohydr. Res. 2001, 330, 241–248. [Google Scholar] [CrossRef]
  42. Utrilla-Coello, R.G.; Agama-Acevedo, E.; de la Rosa, A.P.B.; Rodríguez-Ambriz, S.L.; Bello-Pérez, L.A. Physicochemical and enzyme characterization of small and large starch granules isolated from two maize cultivars. Cereal Chem. 2010, 87, 50–56. [Google Scholar] [CrossRef]
  43. Pan, D.D.; Jane, J.L. Internal structure of normal maize starch granules revealed by chemical surface gelatinization. Biomacromolecules 2000, 1, 126–132. [Google Scholar] [CrossRef] [PubMed]
  44. Cai, C.; Lin, L.; Man, J.; Zhao, L.; Wei, C. Different structural properties of high-amylose maize starch fractions varying in granule size. J. Agric. Food Chem. 2014, 62, 11711–11721. [Google Scholar] [CrossRef] [PubMed]
  45. Lin, L.; Huang, J.; Zhao, L.; Wang, J.; Wei, C. Effect of granule size on the properties of lotus rhizome C-type starch. Carbohydr. Polym. 2015, 134, 448–457. [Google Scholar] [CrossRef] [PubMed]
  46. Lin, L.; Guo, D.; Huang, J.; Zhang, X.; Zhang, L.; Wei, C. Molecular structure and enzymatic hydrolysis properties of starches from high-amylose maize inbred lines and their hybrids. Food Hydrocoll. 2016, 58, 246–254. [Google Scholar] [CrossRef]
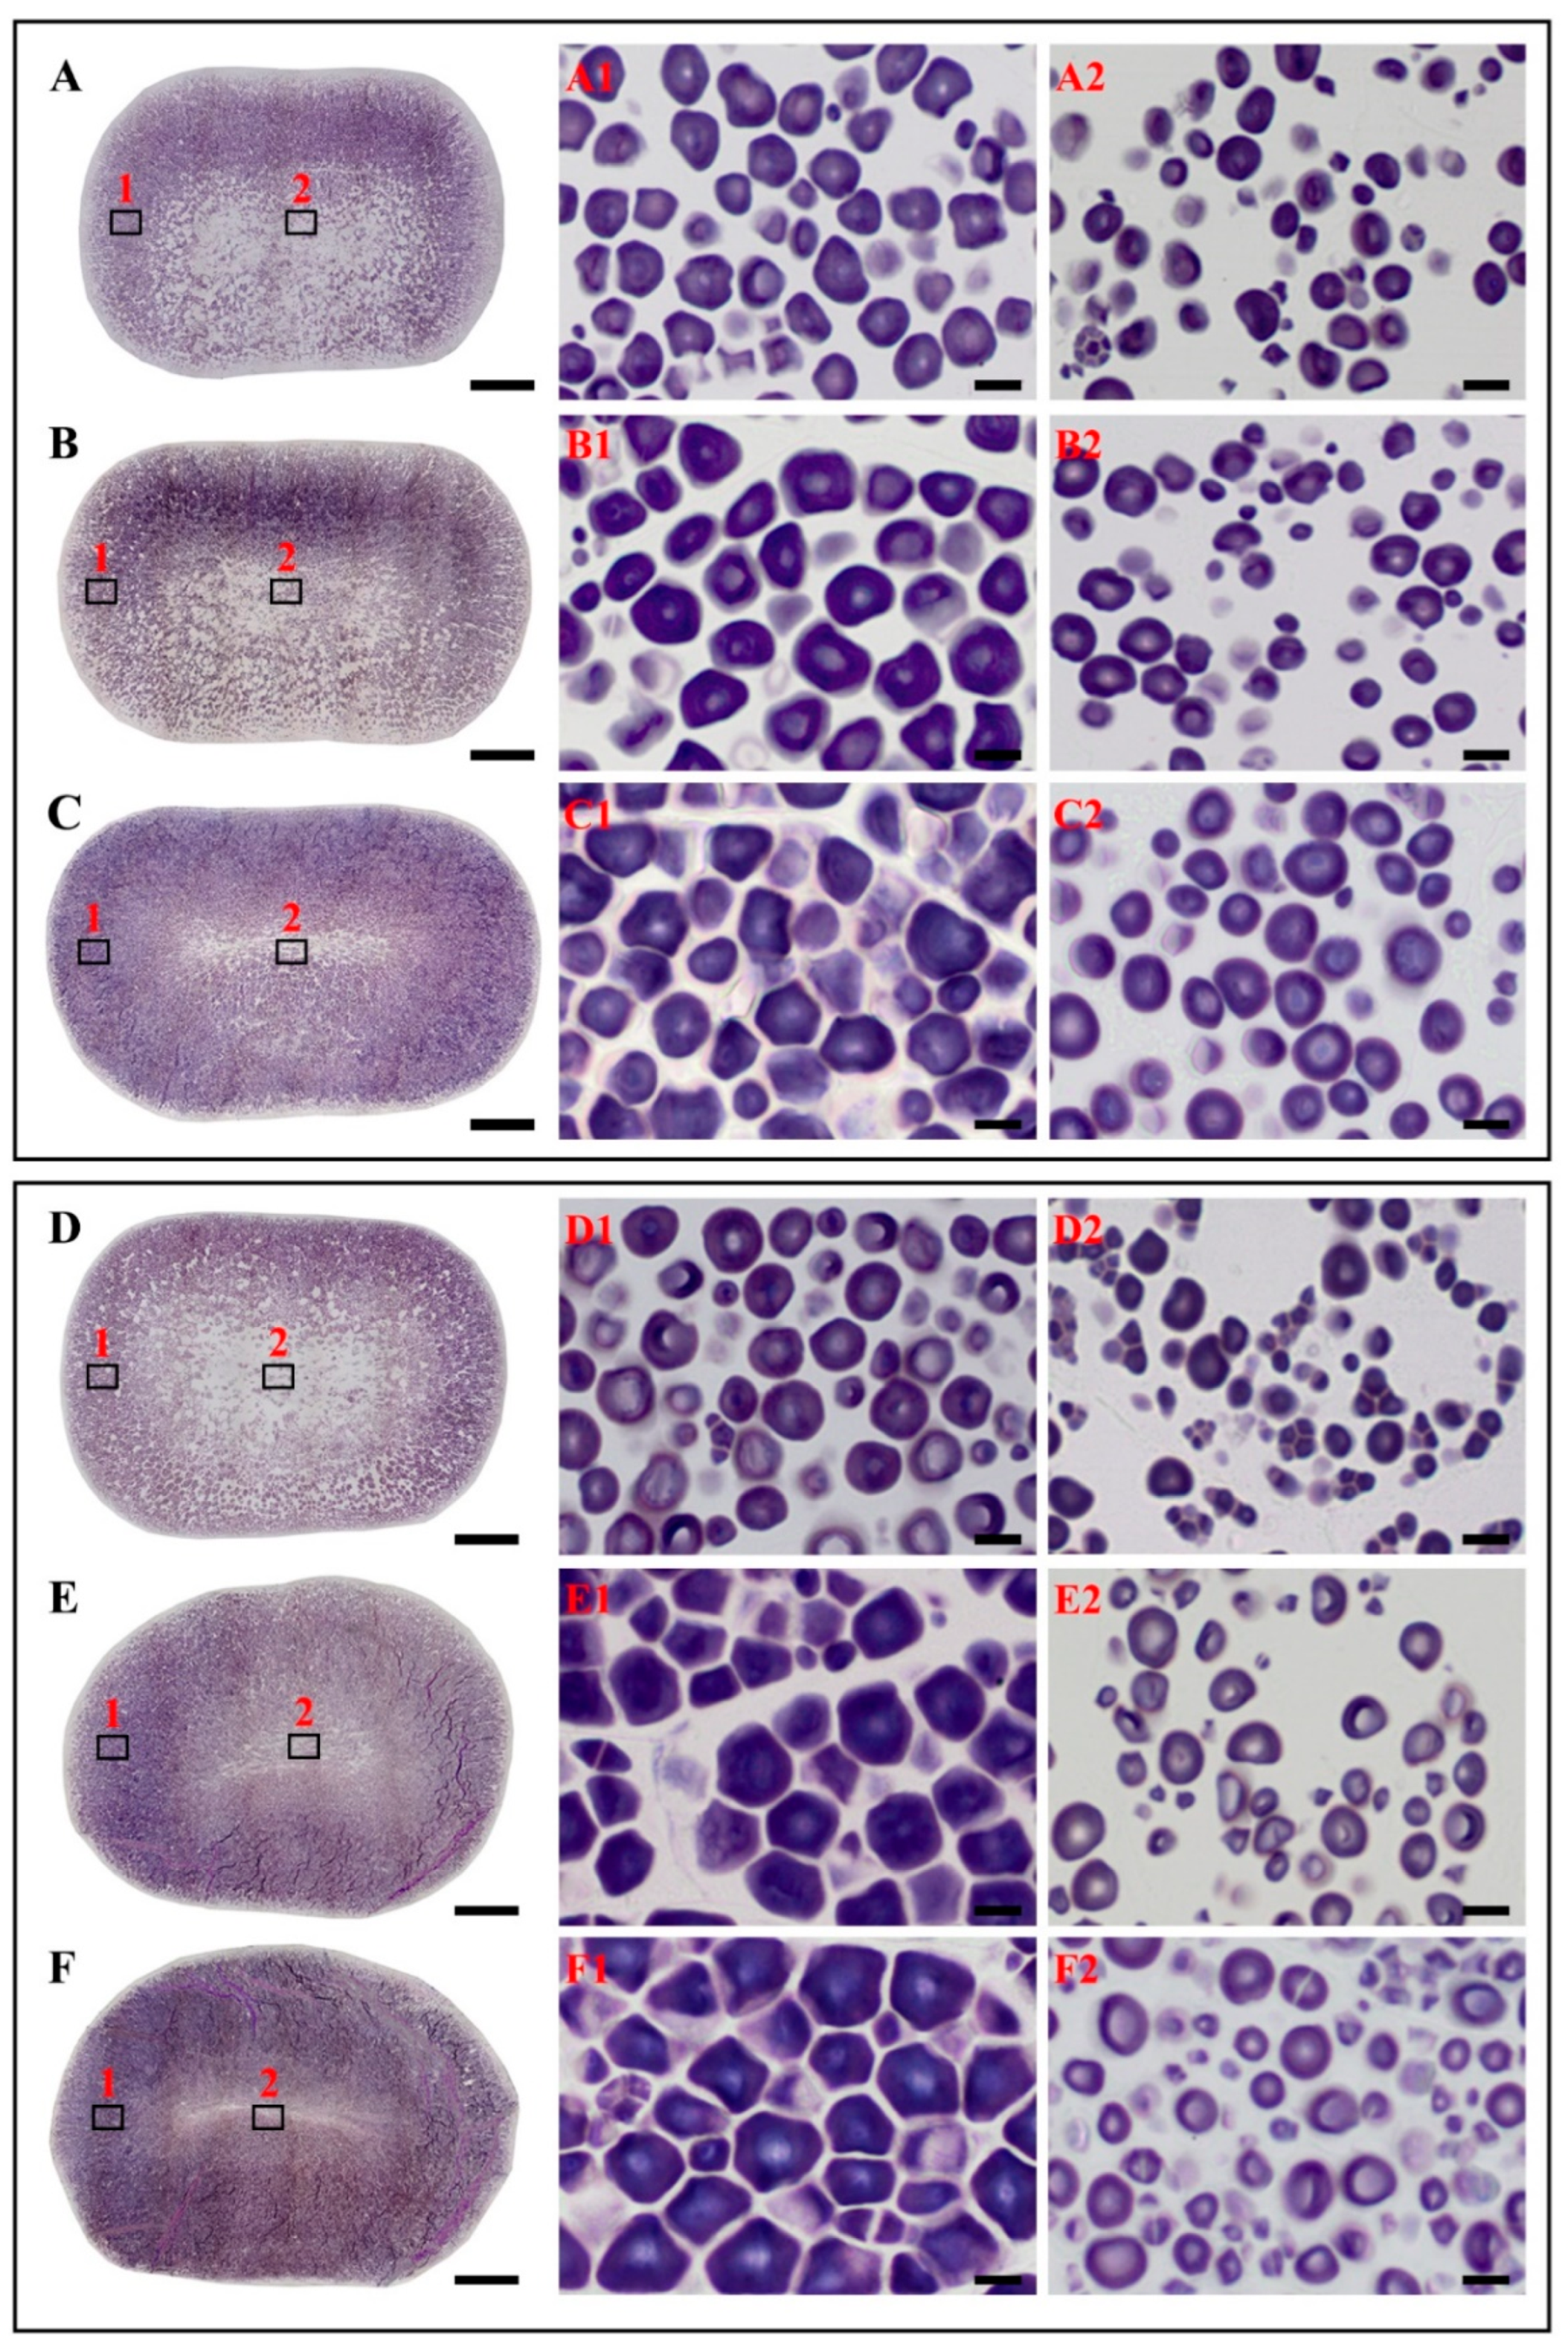
Figure 1. The morphology and accumulation of starch granules in Z58 (AC) and Mo17 (DF) at 15 (A,D), 20 (B,E), and 25 DAP (C,F). The whole kernel was transversely sectioned at the crown region (AF), and its regions 1 and 2 were amplified in (A1F2) and represent OE and IE, respectively. Scale bar = 1 mm for (AF) and 10 μm for (A1F2).
Agriculture 15 01978 g001
Figure 2. XRD (A,B) and SAXS (C,D) spectra of starches from IE and OE of Z58 (A,C) and Mo17 (B,D).
Agriculture 15 01978 g002
Figure 3. Analysis of energy metabolism and starch synthesis between IE and OE. The box colors represent the mean of the Log2 conversion of the TPM ratio of all genes between IE and OE. ACO: aconitase; ADH: alcohol dehydrogenase; AGPase: ADP-glucose pyrophosphorylase; ALD: aldolase; BT2, SH2: glucose-1-phosphoadenosyltransferase; CTS: citrate synthase; DBE: starch debranching enzyme; DPE: plastidial disproportionating enzyme; ENO: enolase; FUM: fumarate hydratase; GABA-T: γ-aminobutyric acid trans-aminase; GAD: glutamate decarboxylase; GAPDH: glyceraldehyde-3-phosphate dehydrogenase; GBSSI: granule-bound starch synthase I; GOGAT: glutamate synthase; GPI: glucose-6-phosphate isomerase; HK: hexokinase; IDH: isocitrate dehydrogenase; INV: invertase; ISA: isoamylase; MDH: malate dehydrogenase; OGDC: oxoglutarate dehydrogenase complex; PDC: pyruvate decarboxylase; PDH: pyruvate dehydrogenase; PEPC: phosphoenolpyruvate carboxylase; PEPCK: phosphoenolpyruvate carboxykinase; PFK: phosphofructokinase; PFP: pyrophosphate-fructose-6-phosphate-1-phosphotransferase; PGK: phosphoglycerate kinase; PGM: phosphoglycerate mutase; Pho: starch phosphorylase; PK: pyruvate kinase; PPDK: pyruvate orthophosphate dikinase; PUL: pullulanase; SBE: starch branching enzyme; SCS: succinyl-CoA synthetase; SDH: succinate dehydrogenase; SH1, SUS: sucrose synthetase; SSADH: succinate-semialdehyde dehydrogenase; SSS: soluble starch synthase; TIM: triose phosphate isomerase; UGPase: UDP-glucose pyrophosphorylase.
Agriculture 15 01978 g003
Figure 4. Relative expression levels of starch synthesis-related genes. The asterisk indicates the significant difference between IE and OE determined by Student’s t-test (n = 3, * p < 0.05, ** p < 0.01, *** p < 0.001). The abbreviation is shown in Figure 3.
Agriculture 15 01978 g004
Figure 5. The GBSSI activity in Z58 (A) and Mo17 (B). The asterisk indicates the significant difference between IE and OE determined by Student’s t-test (n = 3, * p < 0.05).
Agriculture 15 01978 g005
Figure 6. The relative expression level of PPDK (A) and the activity of PPDK (B). The asterisk indicates the significant difference between IE and OE determined by Student’s t-test (n = 2 for (A) and 3 for (B), * p < 0.05, ** p < 0.01, *** p < 0.001).
Agriculture 15 01978 g006
Table 1. Morphology parameters and filling degree of starches in developing kernels.
CultivarDeveloping StageRegionArea (μm2)RoundnessFD (%)
Z5815 DAPIE31.7 ± 17.11.16 ± 0.07UD
OE52.6 ± 26.9 ***1.18 ± 0.09 ***47.8 ± 2.2
20 DAPIE46.5 ± 26.61.15 ± 0.0421.7 ± 1.9
OE92.1 ± 46.9 ***1.28 ± 0.09 ***56.8 ± 1.9 ***
25 DAPIE45.7 ± 26.91.13 ± 0.0334.2 ± 3.4
OE106.4 ± 60.3 ***1.21 ± 0.07 ***65.8 ± 2.3 ***
Mo1715 DAPIE23.6 ± 18.41.14 ± 0.06UD
OE54.9 ± 37.8 ***1.13 ± 0.04 *46.0 ± 2.5
20 DAPIE38.2 ± 22.21.18 ± 0.0728.5 ± 3.0
OE103.2 ± 73.5 ***1.27 ± 0.12 ***65.9 ± 5.8 ***
25 DAPIE35.2 ± 21.41.16 ± 0.0536.4 ± 4.6
OE111.6 ± 70.7 ***1.32 ± 0.17 ***74.0 ± 4.4 ***
Data are means ± standard deviations (n > 300 for area and roundness and = 3 for FD). Values with asterisk indicate significant difference between IE and OE determined by Welch’s t-test for area and roundness and Student’s t-test for FD (* p < 0.05, *** p < 0.001). The FD is expressed as an area percentage of all starch granules in the target region. Roundness: (perimeter2)/(4 × π × area); FD: filling degree; UD: undetected.
Table 2. Amylose content, relative crystallinity, and lamellar structure parameters of starches.
CultivarDeveloping StageRegionAC (%)RC (%)PI (counts)Smax (Å−1)D (nm)
Z5815 DAPIE17.6 ± 0.423.9 ± 1.3432.6 ± 2.60.062 ± 0.00010.1 ± 0.0
OE18.8 ± 0.424.5 ± 0.0408.6 ± 34.50.064 ± 0.0019.9 ± 0.1
20 DAPIE18.1 ± 0.123.9 ± 0.1421.2 ± 26.70.062 ± 0.00010.1 ± 0.0
OE20.0 ± 0.5 *23.7 ± 0.2410.5 ± 3.50.062 ± 0.00010.1 ± 0.0
25 DAPIE17.8 ± 0.524.7 ± 0.4425.2 ± 2.60.062 ± 0.00010.1 ± 0.0
OE20.1 ± 0.4 *22.0 ± 0.2 *353.7 ± 3.0 **0.062 ± 0.00110.2 ± 0.1
MatureIE18.3 ± 0.221.4 ± 0.1282.1 ± 6.20.061 ± 0.00110.4 ± 0.1
OE20.6 ± 0.7 *19.9 ± 0.2 *148.4 ± 2.6 **0.060 ± 0.00010.5 ± 0.0
Mo1715 DAPIE16.5 ± 0.624.2 ± 0.4434.0 ± 46.00.063 ± 0.00110.1 ± 0.1
OE17.0 ± 0.024.7 ± 0.5440.3 ± 6.30.063 ± 0.00010.0 ± 0.0
20 DAPIE17.5 ± 0.224.9 ± 0.1443.3 ± 0.60.062 ± 0.00010.1 ± 0.0
OE19.5 ± 0.3 *24.8 ± 1.1409.6 ± 5.6 *0.062 ± 0.00010.1 ± 0.0
25 DAPIE18.1 ± 0.523.2 ± 0.3381.2 ± 5.60.064 ± 0.0019.9 ± 0.1
OE20.0 ± 0.3 *21.0 ± 0.2 *260.5 ± 2.6 **0.063 ± 0.00110.1 ± 0.1
MatureIE18.4 ± 0.122.8 ± 0.0417.6 ± 7.10.062 ± 0.00010.1 ± 0.0
OE20.8 ± 0.5 *21.8 ± 0.3 *234.5 ± 39.8 *0.061 ± 0.00110.4 ± 0.1
Data are means ± standard deviations (n = 2). Values with asterisk indicate significant difference between IE and OE determined by Student’s t-test (* p < 0.05, ** p < 0.01). AC: amylose content; RC: relative crystallinity; PI: lamellar peak intensity; Smax: lamellar peak position; D: lamellar repeat distance (Bragg spacing).
Disclaimer/Publisher’s Note: The statements, opinions and data contained in all publications are solely those of the individual author(s) and contributor(s) and not of MDPI and/or the editor(s). MDPI and/or the editor(s) disclaim responsibility for any injury to people or property resulting from any ideas, methods, instructions or products referred to in the content.